


Abstract
Thermally activated four-dimensional printing allows additively manufactured structures to change shape with temperature, providing potential for adaptive polymeric systems. In soft thermoplastic polyurethane (TPU) composites, this is hindered by inadequate thermal transitions, reliance in conductive fillers, solvent-based processing, and the poor printability of very soft TPUs. Here, a thermally reversible switching transition, Joule-heating capability, and pellet-extrusion printability were incorporated into a soft TPU through scalable, solvent-free melt compounding with a commercial masterbatch (MB) of single-walled carbon nanotubes (SWCNTs) in a polyol-ester blend. MB dilution produced composites containing approximately 1 to 3 wt.% SWCNTs and 9 to 27 wt.% polyol-ester blend. All composites were thermally stable with a polyol-ester-related melting transition near 54 °C identified by differential scanning calorimetry.ncreasing the MB content enhanced the complex viscosity and viscoelastic moduli while preserving shear-thinning behavior. Conductive atomic force microscopy showed heterogeneous surface-connected current pathways. And mean bulk electrical conductivity increased from 1.09 s/m to 18.15 s/m as MB content increased from the lowest to the highest loading. The most conductive formulation exhibited voltage-dependent Joule heating, reaching an initial heating rate of 61.8 °C/min at 22 V. The cycle-averaged shape-fixity ratios for vacuum-molded samples were 87.2% to 90.7% over three cycles, whereas cycle-averaged shape-recovery ratios were 82.6% to 85.2% over the two reported recovery cycles. A deformable lattice was produced by fused granulate fabrication (FGF) and exhibited temporary-shape retention and recovery toward its original geometry during external reheating. Collectively, the results demonstrate a melt-processable route to conductive TPU composites, combining electrothermal heating capability with thermally activated shape-memory functionality for future 4D-printing applications.
1. Introduction
Smart polymer systems capable of responding to external stimuli are increasingly important for soft robotics, wearable devices, adaptive interfaces, biomedical devices, and thermally responsive structures [1,2,3]. Related developments have also been reported for electrically and thermally responsive polymer systems [4,5]. Among the various activation methods, electrical activation is especially appealing because voltage and current can be precisely controlled, spatially targeted, and easily integrated with sensing and control electronics [2,5]. In thermoresponsive polymers, electrical activation typically occurs via Joule heating. In this process, a conductive phase transforms electrical energy into localized heat, which then triggers a material transition, deformation, or recovery [3,5,6]. Jia et al. [7] further demonstrated the use of carbon-based conductive networks for electrothermal activation. In such systems, performance depends not only on electrical conductivity but also on attainable temperature, heating rate, voltage requirements, thermal uniformity, mechanical compliance, and durability under repeated activation [3,5].
4D printing enhances conventional 3D printing by using stimuli-responsive materials that allow structures to change shape or properties after fabrication. While 3D printing focuses on creating a static geometry, the “fourth dimension” in 4D printing involves the time-dependent responses of the structure to external stimuli like temperature, light, or moisture. This flexibility makes polymer-based 4D-printed materials ideal for applications in soft robotics, biomedical devices, and tissue engineering [8,9]. Soft thermoplastic polyurethanes (TPUs) are promising for electrically activated 4D printing due to their high elasticity and toughness. However, challenges include their electrical insulation, the lack of suitable thermal transitions above room temperature for shape-memory behavior, and the low stiffness that complicates extrusion-based manufacturing. Finding feedstocks that integrate electrical conductivity, appropriate thermal switching transitions, and printability remains a significant challenge.
A key avenue for electrically activated soft materials involves conductive polymer composites based on carbon nanofillers. These composites are important for electrothermal actuation as the conductive network acts as both an electrical pathway and an internal heat source [6,7,10]. In TPU/single-walled carbon nanotube (SWCNT) systems, melt processing [11], solution casting [12], and ionic-liquid-assisted dispersion [13] have all been used to establish conductive nanotube networks. Other studies have explored SWCNT-rich nonwoven architectures [14], hybrid SWCNT/graphite networks [15], and coagulation-precipitation routes [16]. Carbon nanotubes, especially SWCNTs, are attractive due to their high aspect ratio, low percolation threshold, mechanical flexibility and the ability to create conductive pathways at relatively low filler loadings [6,7,11]. Very low percolation thresholds have also been reported in appropriately processed TPU/SWCNT systems [16]. However, applying these advantages to soft elastomeric matrices remains challenging. The formation of conductive networks strongly depends on nanotube dispersion, interparticle contact, filler–polymer interactions, and processing history [11,16,17]. In TPU, these challenges are intensified by the melt’s high viscosity, the matrix’s segmented hard and soft domains, and the requirement to maintain elastomeric deformability while achieving sufficient conductivity for Joule heating. These processing–structure relationships have been highlighted in melt-processed and solution-processed TPU/SWCNT systems [11,13,16].
The implications of these challenges extend further when considering material extrusion and 4D-printing applications. Electrically responsive 4D-printed structures need a material that is conductive, printable, compliant, and can undergo a thermally triggered transition within an accessible temperature range [18,19,20]. Huang et al. [21] further demonstrated a thermoresponsive printed system incorporating CNTs in a TPU-containing material architecture. Previous studies have demonstrated several routes toward electrothermally active printed systems, including conductive inks and CNT-containing thermoplastic composites [6,10,21]. Other approaches include segregated conductive TPU structures [9], hybrid conductive-filler architectures [22,23], and printed external heater concepts [24]. These approaches have shown that filler architecture, printing-induced orientation, conductive-network distribution, and sample geometry can strongly influence both electrical and actuation performance [10,17]. Nevertheless, many reported systems rely on solvent-assisted dispersion, solution casting, or related non-melt processing routes [12,13,14]. Others employ specialized conductive architectures or external heating elements [9,22,24]. Additional approaches use material systems or activation strategies different from the soft, pellet-processable TPU system considered here [6,23,25]. Comparatively, there has been less focus on soft-TPU composite feedstocks made via solvent-free melt compounding and processed as pellets for fused granular fabrication (FGF).
This gap is significant because FGF enables the processing of soft, highly filled thermoplastic elastomers not suitable for filament printing. However, the range of suitable formulations for conductive TPU/SWCNT composites is limited. Increasing SWCNT content can enhance electrical connectivity, but the resulting response depends strongly on nanotube dispersion, network morphology, and processing route [11,13,16]. At the same time, increasing the nanotube content can alter melt rheology and mechanical compliance, creating additional constraints for extrusion-based processing [11,17]. Therefore, developing electrothermally responsive TPU composites for 4D printing requires a comprehensive understanding of how formulation, melt rheology, conductive network formation, thermal transitions, electrical conductivity, Joule heating, and macroscopic shape recovery are interrelated.
In this work, a commercially available SWCNT masterbatch (MB) containing 10 wt.% SWCNTs dispersed in a polyol-ester blend was diluted into a low-hardness TPU matrix using solvent-free melt blending. This approach produced composites containing approximately 1 to 3 wt.% SWCNTs and 9 to 27 wt.% polyol-ester blend. Therefore, the materials were identified as multiphase TPU/polyol-ester/SWCNT composites, where SWCNTs were intended to create conductive pathways, and the semicrystalline polymer blend influenced the TPU matrix’s thermal transitions, melt rheology, morphology, and mechanical properties. The main hypothesis was that the commercial MB could introduce an electrically conductive SWCNT phase and a thermally reversible semicrystalline phase for temporary shape fixation as a multifunctional additive. The study evaluated formulation-property relationships based on total MB loading, rather than separately analyzing the effects of SWCNTs and the proprietary carrier. To test this hypothesis, the composites were evaluated for thermal stability, phase-transition behavior, melt rheology, hardness, nanoscale morphology, local and bulk electrical conductivity, Joule heating, FGF printability, and thermally activated shape recovery.
2. Materials and Methods
2.1. Formulation Development
TPU, Elastollan® BCF 35 A 12 P (BASF, Lemförde, Germany), was used as the primary matrix material in this study. Conductive composites were prepared using a commercially available MB, TUBALL™ MATRIX 808 (OCSiAl Group, Leudelange, Luxembourg), containing SWCNTs dispersed in a thermoplastic semicrystalline matrix (polyol-ester blend). According to the supplier’s technical data sheet, the MB contains 10 wt.% SWCNTs. The nanotubes have an average outer diameter of 1.6 ± 0.4 nm, a length greater than 5 μm, and a specific surface area ≥ 300 m2/g.
Figure 1 illustrates the workflow used for formulation preparation and specimen fabrication. The following sections provide detailed descriptions of the corresponding processing and characterization protocols.
Figure 1.
Schematic workflow for the preparation and processing of TPU/SWCNT masterbatch composites.
2.1.1. Melt Blending
TPU/MB composites were prepared by melt blending using a micro-compounder (Xplore 15 CC, Xplore Instruments, Sittard, The Netherlands). Before processing, the TPU and MB pellets were dried under a reduced pressure of 100 mbar at 50 °C for 4 to reduce residual moisture and limit hydrolytic degradation during melt processing.
The micro-compounder barrel was preheated to 180 °C. The TPU pellets were introduced into the barrel and allowed to melt at a screw speed of 50 . The required amount of MB was then gradually added, after which the screw speed was increased to 100 and the melt blending was continued for 5 . MB loadings of 10 wt.%, 20 wt.% and 30 wt.% were used. Following compounding, the materials were extruded, cooled on aluminum foil, and pelletized for subsequent specimen preparation and characterization. These processing conditions were chosen based on initial compounding trials validated through thermal analysis to avoid material degradation.
The MB contained 10 SWCNTs, while the remaining fraction consisted of a proprietary polyol-ester semicrystalline blend. Consequently, increasing the MB loading simultaneously increased both the SWCNT and polyol-ester blend contents of the final composites. As summarized in Table 1, TPU-1-SWCNT, TPU-2-SWCNT, and TPU-3-SWCNT contained nominal SWCNT contents of approximately 1 wt.%, 2 wt.% and 3 wt.%, respectively, together with corresponding polyol-ester-blend contents of approximately 9 wt.%, 18 wt.% and 27 wt.%. The prepared materials were therefore treated as multiphase TPU/polyol-ester/SWCNT composites rather than binary TPU/SWCNT systems. The formulation nomenclature refers to the nominal SWCNT content introduced through the MB. The MB-loading range was selected to provide both sufficient SWCNT content for conductive pathways suitable for Joule heating and a sufficient semicrystalline polyol-ester fraction for thermal switching and shape fixation.
Table 1.
Nominal compositions of neat TPU, MB, and the TPU/MB formulations. The polyol-ester-blend and SWCNT contents were calculated from the supplier-reported MB composition of 10 wt.% SWCNTs and 90 wt.% carrier.
The MB was treated as a single formulation variable in this study. Due to the undisclosed chemical composition and processing history of the proprietary polyol-ester carrier, a matched carrier-only control could not be created. As a result, the findings reflect the overall effect of MB loading on the TPU/MB system, without allowing for a quantitative separation of the contributions from the SWCNTs and the polyol-ester carrier.
2.1.2. Sample Preparation
Samples for rheological, Shore hardness, electrical-conductivity, Joule-heating, and shape-memory characterization were prepared by vacuum compression molding [26] using a MeltPrep® system (MeltPrep GmbH, Graz, Austria). Before molding, all materials were dried under a reduced pressure of 100 mbar at 50 °C for 4 h to minimize moisture-related defects during processing. Disk-shaped specimens with a diameter of 25 mm and a thickness of 2 mm were prepared for rheological analysis and electrical-conductivity testing. For the electrical-conductivity measurements, the molded disks were cut into square specimens with a side length of 15 mm. Rectangular specimens measuring 20 mm × 5 mm × 5 mm were prepared for Joule-heating characterization, whereas specimens measuring 20 mm × 10 mm × 1 mm were used for shape-memory testing. All samples were molded at 180 °C and held for 15 min under a high vacuum of 0.1 mbar to ensure complete melting, consolidation, and shaping within the mold cavity.
Lattice structures were additively manufactured only from the TPU-3-SWCNT formulation using a Piocreat G5 FGF 3D printer (Shenzhen Piocreat 3D Technology Co., Ltd., Shenzhen, China) with a nozzle diameter of 1.0 mm. The extruder and build-plate temperatures were set to 200 °C and 60 °C, respectively. The layer height and printing speed were fixed at 0.6 mm and 15 mm/s, respectively. The lattice G-code was generated using Piocreate Slicer 1.1.4 (Shenzhen Piocreat 3D Technology Co., Ltd., Shenzhen, China). The slicing parameters comprised two external perimeters, no top or bottom shells, and a grid infill pattern with a density of 20%. Before printing, the extruded TPU-3-SWCNT composite was pelletized and fed directly into the printer extruder. The 3D-printing parameters were selected based on preliminary trials using the neat TPU to identify a suitable extrusion temperature and printing speed that provided continuous material flow and stable strand deposition. These parameters were then adjusted as needed for the composite formulation. However, no optimization was performed.
2.2. Formulation Characterization
2.2.1. Thermogravimetric Analysis
A thermogravimetric analysis (TGA) was conducted to assess the thermal degradation behavior. Approximately 10 mg of each sample was placed in crucibles for measurements. The analysis utilized a Mettler Toledo TGA 1 (Greifensee, Switzerland). Samples were tested separately under nitrogen and air atmospheres; each maintained at a flow rate of 40 mL/min. Each sample was heated from room temperature to 600 °C at a heating rate of 10 °C/min.
The degradation-onset temperature () was calculated using a custom Python (version 3.14) script based on the extrapolated-tangent method. It was defined as the intersection between the initial mass baseline and the tangent drawn at the maximum mass-loss rate of the main degradation step.
2.2.2. Differential Scanning Calorimetry
Differential scanning calorimetry (DSC) was used to examine the thermal properties and phase transitions of neat TPU and its composites. The analysis was conducted using a DSC 300 Caliris instrument (Netzsch, Selb, Germany). Samples weighing approximately 5 mg to 10 mg were analyzed under a nitrogen atmosphere. The thermal protocol comprised an initial heating cycle from −100 °C to 200 °C, followed by cooling from 200 °C to −100 °C and a second heating cycle over the same temperature range. Heating and cooling were performed at a rate of 10 °C/min, with a 2 min isothermal hold between consecutive cycles to stabilize the sample. Nitrogen was continuously purged at a flow rate of 40 mL/min.
The melting and crystallization enthalpies were adjusted based on the nominal MB content and then reported as relative enthalpy retention according to the following equation [27,28,29]:
where represents the mass fraction of MB in the composite, and denotes the corresponding melting (m) or crystallization (c) enthalpy measured for the MB under the same thermal protocol.
Normalizing DSC enthalpies to the mass fraction of the crystallizable constituent is a standard approach in studies of multiphase polymers, block copolymers, and polymer nanocomposites. This method helps distinguish between the effects of compositional dilution and actual changes in crystallization behavior [27,28,29]. DSC measurements were conducted in triplicate (), and the results are reported as the mean ± standard deviation.
2.2.3. Melt Rheology
To investigate the rheological properties of the neat TPU and its composites, frequency sweep measurements were performed at 150 °C using a rotational rheometer (ARES G2, TA Instruments, New Castle, DE, USA). Frequency-sweep stability tests conducted at 150 °C confirmed that the TPU remained stable over the duration of the rheological measurements. Samples were placed between parallel plates and equilibrated at the testing temperature before analysis. The gap height was set to 2 . To determine the linear viscoelastic region (LVER), amplitude-sweep measurements were first conducted over a strain range of 0.01–1%. Subsequently, frequency-sweep measurements were carried out at a constant strain amplitude of 0.1% within the LVER. All tests were conducted under a nitrogen atmosphere. Before testing, all materials were dried under reduced pressure of 100 mbar at 50 °C for 4 h.
2.2.4. Electrical Conductivity
Electrical conductivity was determined using an Ecopia HMS-3000 Hall effect measurement system based on the van der Pauw method (Ecopia, Anyang-si, Gyeonggi-do, Republic of Korea). The thickness of each specimen was measured prior to testing. Four electrical contacts were positioned on the corners of each sample, and the resistivity was measured within the instrument range of 1 × 10⁻⁴ Ω · cm to 1 × 10⁷ Ω · cm. Three samples from each formulation were characterized. For each specimen, four rotational measurements were averaged to obtain one representative conductivity value. The formulation-level mean and standard deviation were subsequently calculated from the three independent specimen values (n = 3), to assess measurement repeatability and possible orientation-dependent variability. The initial configuration was measured first, followed by measurements after rotating the specimen by 90°, 180°, and 270° relative to its initial orientation. The applied current was adjusted according to the conductivity of each formulation, with lower currents used for highly resistive specimens and higher currents used for more conductive specimens. Electrical conductivity was calculated as the reciprocal of the measured resistivity and reported in .
2.2.5. Joule Heating
Joule-heating experiments were conducted by applying a voltage across the specimen. Insulated alligator clips were attached to each end of the specimen and connected to a power supply (QPX1200S, Aim & Thurlby Thandar Instruments, Huntingdon, UK). The temperature changes during electrical stimulation were monitored with an infrared thermal camera (Optris PI 640i, Optris GmbH, Berlin, Germany). Thermal images and temperature data were analyzed using the Optris PIX Connect software (Optris GmbH, Berlin, Germany).
2.2.6. Shore A Hardness Test
Shore A hardness measurements were performed using a Bareiss BS 61 II (Bareiss Prüfgerätebau GmbH, Oberdischingen, Germany) testing stand with a Shore A hardness tester. Specimens with a thickness of 3 mm were analyzed. For each specimen, seven measurements were taken at different locations on the sample surface to capture local hardness variations. The results are reported as the average value ± standard deviation.
2.2.7. Scanning Transmission Electron Microscopy
High-resolution scanning transmission electron microscopy (STEM) images were acquired using a Helios NanoLab 650 microscope (FEI, Eindhoven, The Netherlands) operated at an accelerating voltage of 30 kV and a beam current of 25 pA. The STEM observations were performed in bright-field mode.
Samples were prepared as trapezoidal blocks and sectioned with a LEICA cryo-ultramicrotome fitted with a diamond knife (LEICA Microsystems, Vienna, Austria). Prior to sectioning, both the specimen and the knife were stabilized at temperatures between −80 °C and −120 °C. Thin sections less than 100 nm thick were collected using a Perfect Loop and transferred onto nickel grids coated with a holey carbon support film. The grids were dried at room temperature before STEM analysis.
2.2.8. Atomic Force Microscopy
Topography and phase-shift images were collected in air using tapping mode on an MFP-3D Infinity atomic force microscope (Oxford Instruments, Abingdon, UK). Scans were performed at rates ranging from 1 Hz to 3 Hz, with a resolution of pixels. Semi-contact silicon AC160TS cantilevers (Olympus Corporation, Tokyo, Japan), with a nominal spring constant of 26 N/m, were employed. Surface topography was recorded by keeping the amplitude of the cantilever’s first resonance mode constant via the AFM feedback loop, which regulated the piezoelectric scanner in the z-direction. The phase-shift signal was recorded simultaneously.
Prior to AFM analysis, neat TPU and TPU/MB composite specimens were cryo-ultramicrotomed at approximately −80 °C using a UC6 cryo-ultramicrotome (Leica, Germany) equipped with a diamond knife (DiATOME, Nidau, Switzerland). This process exposed the internal cross-sectional morphology of the specimens while minimizing surface-skin effects. Images were processed and analyzed with the MountainsSPIP® (version 11) software (Digital Surf, Besançon, France).
Conductive mapping of the TPU/MB composite was carried out using an MFP-3D atomic force microscope (Oxford Instruments, UK) operating in Fast Force Mapping mode with an ASYELEC-R2 iridium-coated conductive probe. While collecting the force–distance curves, the electrical current was measured using a DLPCA-200 transimpedance amplifier (FEMTO Messtechnik GmbH, Berlin, Germany). A bias voltage of 1 V was applied between the specimen and the grounded AFM probe.
The specimen was kept mounted in the anvil used for cryo-ultramicrotomy, which was electrically connected to the adjustable bias output of the AFM. For each force–distance curve, the maximum current recorded was extracted and used to create the corresponding conductive current map.
2.2.9. Shape-Memory Behavior
Shape-memory behavior of the samples was evaluated using a DMA 850 dynamic mechanical analyzer (TA Instruments, New Castle, DE, USA).
To evaluate the shape-memory behavior of the specimens under tensile loading, a single-screw film clamp was used. Prior to testing, a preload force of 0.05 N was applied with force tracking set to 110%. The specimens were first heated to 60 °C and allowed to equilibrate for 10 min. They were then stretched to a strain of 20% at a rate of 10%/min, and this strain was maintained for 10 min to program the temporary shape.
While maintaining the imposed strain, the specimens were cooled from 60 °C to 20 °C at a rate of 2 °C/min. They were then held at 20 °C for 10 min to fix the temporary shape. Afterward, the applied force was reduced to a minimum of 0.01 N, and the specimens were allowed to stabilize at 20°C for 20 min.
To evaluate shape recovery, the specimens were reheated from 20 °C to 60 °C at a rate of 2 °C/min, while a minimum force of 0.01 N was maintained. Three consecutive thermomechanical cycles were conducted to assess the repeatability of the shape-memory response. The shape-fixity ratio, , which measures the material’s ability to retain its temporary programmed shape after unloading, was calculated as follows [30]:
whereas the shape-recovery ratio, , which quantifies the ability of the material to recover its original shape during reheating, was calculated as [30]
In these equations, N denotes the thermomechanical cycle number; is the shape-fixity ratio in cycle N; is the shape-recovery ratio in cycle N; is the maximum strain imposed during the deformation stage of cycle N; is the strain retained after cooling and unloading in cycle N; is the residual strain measured after the recovery stage of cycle N; and is the residual strain remaining from the preceding cycle. Both ratios are expressed as percentages.
The thermally activated shape-memory behavior of the TPU-3-SWCNT composite was qualitatively evaluated using a 3D-printed lattice structure. First, the printed lattice was placed in an oven at 70 °C, a temperature above the melting-transition region of the semicrystalline phase in the MB. At this temperature, the softened lattice was manually deformed into a curved temporary shape and held in place with an external constraint. The constrained structure was then cooled to room temperature to set the programmed shape. Once cooled, the constraint was removed, and the lattice’s ability to retain the temporary configuration was visually assessed. Shape recovery was then triggered by reheating the unconstrained lattice to 70 °C, and its return towards the original as-printed geometry was documented with photographs.
3. Results and Discussion
3.1. Thermal Stability and Phase-Transition Behavior of TPU/MB Composites
Figure 2 shows the TGA analysis of TPU, MB, and their composites. Under a nitrogen atmosphere (Figure 2A,B), the neat components showed distinct degradation-onset temperatures: neat TPU exhibited a of 360.4 °C, while MB had a higher of 381.3 °C. In contrast, the TPU/MB composites displayed a progressive decrease in as MB content increased, with values of 344.9 °C for TPU-1-SWCNT, 331.7 °C for TPU-2-SWCNT, and 315.8 °C for TPU-3-SWCNT. Although the neat MB exhibited a higher degradation-onset temperature than neat TPU, incorporation of the MB progressively reduced the of the composites. This indicates that the degradation behavior of the multiphase system cannot be interpreted as a simple weighted combination of the thermal stabilities of the neat constituents. Melt compounding introduces new TPU/polyol-ester/SWCNT interfaces and modifies the phase morphology, polymer-chain environment, and processing history, all of which can influence the kinetics of the initial degradation reactions. The presence and distribution of SWCNT-rich regions may additionally modify local heat transfer and interfacial degradation processes. Consequently, the observed reduction in is most reasonably interpreted as a collective formulation-dependent effect rather than being attributed to the intrinsic thermal stability of either neat component.
Figure 2.
TGA and DTG analysis of TPU/MB composites. Weight percent and derivative weight percent curves of neat MB, neat TPU, and TPU/MB composites under nitrogen (A,B) and air (C,D) atmospheres.
Under an air atmosphere, a similar formulation-dependent trend was observed (Figure 2C,D), but the onset temperatures were lower than those measured under nitrogen. Neat TPU had a of 340.3 °C, while MB exhibited a slightly higher of 349.0 °C. TPU-1-SWCNT maintained a comparable onset temperature of 340.2 °C, indicating that the lowest MB loading did not markedly affect the initial oxidative stability of the TPU matrix. However, further increasing the MB content reduced to 328.4 °C for TPU-2-SWCNT and 313.9 °C for TPU-3-SWCNT. The corresponding decrease in under air further indicates that the oxidative degradation response is governed by the multiphase composite structure rather than by the thermal stability of the neat constituents alone. Changes in interfacial area, phase morphology, oxygen transport, and the local polymer environment may all contribute to the earlier onset of mass loss at higher MB loadings. However, TGA alone does not allow the individual contributions of these mechanisms to be distinguished and a more in-depth analysis can be performed in future studies.
The DSC analysis further clarified the thermal transitions of the neat components and TPU/MB composites. The thermograms obtained during the first cooling and the second heating cycles are presented in Figure 3, while the corresponding transition temperatures, enthalpies, and relative enthalpy-retention values are summarized in Table 2. All reported values represent the mean ± standard deviation obtained from three samples ().
Figure 3.
DSC thermograms obtained during the first cooling cycle for neat TPU and TPU/MB composites (A) and MB (B), and during the second heating cycle for neat TPU and TPU/MB composites (C) and MB (D).
Table 2.
DSC-derived thermal-transition parameters and relative melting- and crystallization-enthalpy retention of neat TPU, MB, and TPU/MB composites. Values are reported as mean ± standard deviation (n = 3).
Neat TPU exhibited a glass-transition temperature () of −50.1 ± 0.1 °C, whereas no clearly resolved melting or crystallization peak was detected under the applied thermal program (Figure 3A,C). In contrast, MB displayed a pronounced endothermic transition at 63.8 ± 3.4 °C, with a melting-enthalpy magnitude of 113.2 ± 2.4 J/g (Figure 3D). This transition was accompanied by an exothermic crystallization event during cooling, with an enthalpy magnitude 113.4 ± 1.7 J/g (Figure 3B). The close agreement between the melting and crystallization enthalpies indicates a largely reversible thermal transition under the applied heating and cooling conditions. Because MB contains SWCNTs dispersed in a polyol-ester blend, these paired transitions are most reasonably attributed to the melting and crystallization of the crystalline phases of the blend components (Figure 3D). This interpretation is consistent with DSC studies of saturated fatty-acid polyol esters, which have reported pronounced solid–liquid transitions from approximately 31 °C to 65 °C and comparatively high transition enthalpies [31,32,33]. However, because the precise chemical composition of the proprietary blend is not disclosed, the transition cannot be assigned to a specific ester species.
The glass-transition temperature of the TPU-rich phase changed only moderately following MB incorporation. The measured values were −49.1 ± 0.2 °C, −47.4 ± 1.2 °C, and −47.7 ± 0.4 °C for TPU-1-SWCNT, TPU-2-SWCNT, and TPU-3-SWCNT, respectively (Figure 3C). Thus, even at the highest MB loading, the glass transition remained below −47°C, indicating that the composites retained the low-temperature flexibility associated with the TPU matrix. The small increase in relative to neat TPU may reflect restricted mobility of the TPU chains in the presence of the carrier-rich phase and SWCNTs [34].
A distinct MB matrix-derived melting transition was observed in all the composite formulations. The corresponding melting temperatures were 53.9 ± 0.2 °C, 54.1 ± 0.4 °C, and 53.8 ± 0.1 °C for TPU-1-SWCNT, TPU-2-SWCNT, and TPU-3-SWCNT, respectively (Figure 3C). The overlapping values and small standard deviations demonstrate that the melting temperature was reproducible and essentially independent of the MB content within the investigated composition range. A similarly limited dependence of melting temperature on composition has been reported for melt-blended TPU/PCL systems, in which the crystallizable PCL phase retained a melting temperature of approximately 56 °C to 57 °C over a broad composition range [35]. The presence of these thermal transitions in the TPU/MB composites is important for imparting thermally induced shape-memory behavior to the TPU used in this study.
The melting temperature of the MB phase in the composites was approximately 10 °C lower than that measured for neat MB. This depression indicates that dispersing the MB within the TPU matrix altered the thermal or morphological environment of the crystallizable polymer phase in MB. Possible contributions include the formation of smaller or less perfect crystals, partial miscibility between the carrier and TPU phases, spatial confinement of carrier-rich domains, or interfacial interactions that restrict crystal growth. Previous studies have shown that the compatibility and soft-segment chemistry of crystallizable polyester phases can influence their crystallization and melting behavior [36], while nanoscale confinement can alter both melting temperature and crystalline organization [37]. However, because neither the exact chemical composition of the polyol-ester blend nor the dimensions of the polyol-ester-rich domains were independently determined, the relative contributions of these mechanisms cannot be resolved from the DSC results alone.
The measured melting-enthalpy magnitudes were 4.9 ± 0.5 J/g, 4.9 ± 1.2 J/g, and 5.5 ± 0.2 J/g for TPU-1-SWCNT, TPU-2-SWCNT, and TPU-3-SWCNT, respectively. The corresponding crystallization-enthalpy magnitudes were 5.0 ± 0.6 J/g, 5.1 ± 1.4 J/g, and 5.4 ± 0.7 J/g. Within the experimental variability, the raw melting and crystallization enthalpies therefore remained nearly constant despite the increase in nominal MB content from 10% to 30%. Because these values are expressed per unit mass of the complete composite, however, direct comparison of the raw enthalpies does not account for the different MB fractions.
After normalization by the nominal MB content, the relative melting-enthalpy retention decreased progressively from 43.5 ± 4.5% for TPU-1-SWCNT to 21.6 ± 5.2% for TPU-2-SWCNT and 16.3 ± 0.5% for TPU-3-SWCNT. A closely corresponding trend was obtained from the cooling cycle, for which the relative crystallization-enthalpy retention decreased from 44.3 ± 5.3% to 22.4 ± 6.3% and 15.9 ± 2.1%, respectively. The close agreement between the melting- and crystallization-based retention values for each formulation indicates that the reduction was consistently observed during both cooling and subsequent heating.
The progressive decrease in relative enthalpy retention demonstrates that the nearly constant raw transition enthalpies cannot be explained by compositional dilution alone. If the carrier-derived phase retained the same crystallization behavior after blending, the measured composite enthalpy would be expected to increase approximately in proportion to the MB content. Instead, the effective transition enthalpy per unit mass of nominal MB decreased substantially as the MB loading increased. This response suggests that a progressively smaller fraction of the polyol-ester phase contributed to the resolved melting and crystallization transitions, or that the crystalline structures formed at higher MB loadings exhibited a lower degree of organization and consequently a lower effective transition enthalpy.
The nearly unchanged melting temperature, together with the pronounced decrease in normalized transition enthalpy, indicates that the crystals that formed retained similar thermal stability, whereas their relative amount and/or degree of organization decreased with increasing MB content. This behavior may result from composition-dependent changes in phase separation, spatial confinement of the polyol-ester-rich domains, or reduced crystal organization [38,39]. These interpretations are consistent with the DSC response, but their relative contributions cannot be resolved without direct structural characterization of the crystalline phase.
Please note that the calculated retention values do not indicate absolute crystallinity, as determining it requires a validated equilibrium melting enthalpy for a fully crystalline polyol-ester blend, which is unavailable due to proprietary composition and unknown initial crystallinity of neat MB. The values quantify the fraction of the neat-MB transition enthalpy retained after correcting for nominal MB content, using neat MB measured under the same DSC conditions as the reference.
Overall, the DSC results indicate that the TPU/MB composites combine the low-temperature flexibility of the TPU matrix with a weak but reproducible carrier-derived transition at approximately 54 °C. This transition defines a thermally accessible switching region that may contribute to temporary-shape fixation, while the elastomeric TPU matrix remains available to provide the restoring force required for subsequent shape recovery.
3.2. Effect of Masterbatch Loading on Melt Rheology
The melt rheological behavior of neat TPU and TPU/MB composites was examined to assess the impact of MB incorporation on melt processability and network formation. The overall MB composition must be considered to interpret the rheological response. Increasing MB loading enhanced the concentration of high-aspect-ratio SWCNTs and the molten polyol-ester blend fraction. These components may have competing effects: SWCNTs can limit polymer-chain relaxation and promote filler-mediated melt structuring, while the polyol-ester blend may act as a plasticizing phase above its melting temperature. Therefore, the measured rheological response reflects the combined influence of both constituents rather than being solely attributed to SWCNT concentration.
As shown in Figure 4A, all formulations exhibited a pronounced decrease in complex viscosity, ||, with increasing angular frequency, indicating shear-thinning behavior. In CNT-containing polymer melts, this response can arise from a combination of polymer-chain orientation and progressive alignment, rearrangement, or partial disruption of nanotube-mediated structures under increasing deformation rates [40,41]. From a material-extrusion perspective, shear thinning is advantageous because it reduces resistance to flow under the relatively high shear conditions encountered inside the extruder and nozzle, while allowing the material to recover a higher apparent viscosity under the lower-shear conditions prevailing after deposition.
Figure 4.
Melt rheology of TPU/MB composites at 150 °C. Complex viscosity as a function of angular frequency (A) and storage and loss moduli as a function of angular frequency (B) for neat TPU and TPU/MB composites.
Compared with neat TPU, incorporation of MB increased the complex viscosity over the entire investigated frequency range, and the increase became more pronounced with increasing MB content. Interpretation of this trend requires consideration of the dual composition of the MB. It contains 10 wt.% SWCNTs dispersed in a polyol-ester blend; consequently, TPU-1-SWCNT, TPU-2-SWCNT, and TPU-3-SWCNT contain approximately 1 wt.%, 2 wt.%, and 3 wt.% SWCNTs by mass, together with approximately 9 wt.%, 18 wt.%, and 27 wt.% polyol-ester blend, respectively. At the rheological measurement temperature of 150 °C, the polyol-ester blend was above its melting transition and could potentially act as a plasticizing phase, provided that it is sufficiently compatible with the TPU. Plasticizer addition is generally expected to increase chain mobility and reduce the melt viscosity of TPU. Indeed, Zhu et al. [42] reported that, in a TPU/SWCNT system prepared using a polyol-ester-based liquid masterbatch, the complex viscosity remained nearly unchanged at low SWCNT loadings but decreased as the SWCNT content increased from 0.6 wt.% to 1.0 wt.%, despite a concurrent increase in the storage modulus.
The different trend observed in the present composites indicates that their rheological response cannot be predicted from the expected plasticizing effect of the molten carrier alone. The increase in complex viscosity is consistent with SWCNT-mediated structuring, but carrier-induced changes in phase morphology, compatibility, and polymer-chain relaxation may also contribute. These mechanisms cannot be separated quantitatively without a chemically matched carrier-only control. Instead, the increase in || is consistent with restriction of TPU-chain mobility by the high-aspect-ratio SWCNTs and the development of nanotube–nanotube and nanotube–polymer interactions. Melt-mixed TPU/CNT composites containing comparable nanotube concentrations have similarly been reported to exhibit increased complex viscosity, particularly at low angular frequencies, as a result of filler–filler and polymer–filler interactions [40,43]. The magnitude and frequency dependence of this effect are also sensitive to the state of CNT dispersion and to the processing route used to distribute the nanotubes within the TPU matrix [41]. The viscosity increase is consistent with SWCNT-mediated structuring, although carrier-induced changes may also contribute.
The effect of MB loading was also evident in the dynamic moduli (Figure 4B). Neat TPU displayed the lowest storage modulus, , and loss modulus, , consistent with a comparatively weakly structured melt. Incorporation of MB systematically increased both moduli, with TPU-3-SWCNT exhibiting the highest values over the investigated frequency range. The enhancement of , particularly at low angular frequencies, is consistent with the progressive formation of a filler-mediated viscoelastic structure that constrains long-range polymer-chain relaxation. Comparable low-frequency increases in and ||, including the development of an apparent elastic plateau at sufficiently high SWCNT content, have been reported for melt-mixed TPU/SWCNT nanocomposites and attributed to interconnected nanotube structures and strong polymer–filler interactions [40].
The rheological results therefore demonstrate that the MB acted as a strong modifier of the TPU melt. The progressive increases in complex viscosity and dynamic moduli are consistent with the development of an increasingly structured multiphase system. Nanotube-mediated filler–filler and filler–polymer interactions provide one plausible contribution, while the polyol-ester carrier may also alter TPU-chain mobility, phase organization, and interfacial interactions. Because these two constituents increased simultaneously, the present measurements establish a net MB-loading effect but do not identify which constituent dominates the rheological response.
3.3. Effect of Masterbatch Loading on Shore A Hardness
Shore A hardness measurements were used to assess the resistance of the TPU-based materials to localized indentation following incorporation of the MB. According to the supplier’s data sheet [44], the selected TPU grade has a nominal hardness of 37 Shore A, measured in accordance with DIN ISO 48-4 [45]. In the present study, neat TPU exhibited a slightly lower value of 31.3 Shore A (Figure 5). This difference may arise from variations in processing history, specimen preparation, thickness, conditioning, or measurement configuration relative to the conditions used for the supplier-reported value. A comparable reduction in hardness after extrusion and compression molding has previously been reported for TPU, highlighting the sensitivity of Shore hardness to both manufacturing and testing conditions [46]. Nevertheless, the measured value remains consistent with the highly compliant elastomeric character of the selected low-hardness TPU grade.
Figure 5.
Shore A hardness of neat TPU and TPU/MB composites. Values are presented as mean ± standard (n = 7) deviation.
Incorporating the MB significantly increased hardness, resulting in values of 63.8 Shore A, 71.6 Shore A, and 73.2 Shore A for TPU-1-SWCNT, TPU-2-SWCNT, and TPU-3-SWCNT, respectively. However, these values remain lower than those of TPU filaments commonly used for 3D printing (typically 80 Shore A to 95 Shore A [47,48]). The observed increase in hardness is similar to that reported for other melt-processed TPU/CNT nanocomposites. Muñoz-Chilito et al. [46] observed an increase from approximately 58 Shore A at 1 wt.% MWCNT to 68 Shore A at 5 wt.%, followed by a tendency toward stabilization at higher filler contents. Lee et al. [49] likewise reported an increase from 65 Shore A to 81 Shore A upon incorporation of up to 2 wt.% MWCNT into TPU, together with a reduction in melt-flow index and an increase in glass-transition temperature. These observations are consistent with the ability of CNTs to restrict local polymer-chain mobility and increase resistance to indentation.
The magnitude of the hardness increase in the present materials should, however, be interpreted by considering the complete MB composition rather than the nominal SWCNT content alone. TPU-1-SWCNT contained approximately 1 wt.% SWCNTs and 9 wt.% polyol-ester blend, whereas TPU-2-SWCNT and TPU-3-SWCNT contained approximately 2 wt.% and 3 wt.% SWCNTs together with 18 wt.% and 27 wt.% polyol-ester blend, respectively. Previous work on TPU/SWCNT composites prepared using a polyol-ester-based MB reported increases in tensile and storage moduli, which were attributed primarily to SWCNT reinforcement, while the carrier facilitated nanotube incorporation into the TPU matrix [42]. In the present system, the DSC results further indicate that the polyol-ester phase remains below its melting transition at the hardness-testing temperature and may therefore behave as a solid or partially crystalline dispersed phase during indentation. The observed increase in hardness should therefore be interpreted as an overall MB-loading effect. Plausible contributions include SWCNT-mediated reinforcement and restriction of chain mobility, incorporation of a solid or partially crystalline carrier-derived phase at the testing temperature, and composition-dependent changes in the multiphase morphology. The relative importance of these contributions cannot be determined from the present formulation series.
The smaller increase in hardness between TPU-2-SWCNT and TPU-3-SWCNT indicates that the incremental effect of additional MB becomes less pronounced at higher loadings. A comparable tendency toward hardness stabilization has been reported in TPU/MWCNT composites as the nanotube content increased [46]. This behavior may indicate that the indentation response approaches a composition-dependent plateau once a sufficiently constrained or reinforced multiphase microstructure has developed.
3.4. Electrical Conductivity and Voltage-Controlled Joule Heating
Figure 6A compares the bulk electrical conductivity of the TPU/MB composites with literature-reported TPU/SWCNT systems. The mean electrical conductivities were 1.09 ± 0.63 s/m, 5.24 ± 1.39 s/m, and 18.15 ± 3.40 s/m for TPU-1-SWCNT, TPU-2-SWCNT, and TPU-3-SWCNT, respectively. The corresponding coefficients of variation were 57.4%, 26.5%, and 18.7%. Thus, increasing MB loading increased the mean conductivity and reduced its relative specimen-to-specimen variability.
Figure 6.
Electrical conductivity and Joule-heating behavior of TPU/SWCNT composites. (A) Electrical conductivity of TPU/MB composites in comparison with literature-reported TPU/SWCNT systems. (B) Joule-heating response of TPU-3-SWCNT, including temperature–time curves at different applied voltages and representative thermal images of the sample at 22 V, where I, II, and III correspond to different stages of heating. (C) Expanded view of the initial temperature-time response in panel (B), with linear fits (Dashed lines). References in panel (A): Da Silva et al. [11], Bautista-Quijano et al. [12], Hota et al. [13], Novikov et al. [16], Paleo et al. [14], and Shen et al. [15].
TPU-1-SWCNT retained appreciable conductivity variability. This is consistent with less reliably established conductive pathways at the lowest MB loading, where local differences in domain spacing, nanotube orientation, and interdomain contacts may strongly affect electrical transport. Proximity to the electrical percolation region is one possible explanation, but the investigated concentrations do not permit determination of a percolation threshold. The lower relative variability at higher MB loadings is consistent with more consistently connected macroscopic conductive pathways. It does not establish homogeneous SWCNT dispersion, as the microscopy results show that TPU-3-SWCNT retains a locally heterogeneous morphology and conductivity distribution.
As the MB loading increased, the coefficient of variation progressively decreased, indicating that macroscopic electrical connectivity became more consistently established. The greater number density of SWCNT-rich domains at higher loadings likely increased the probability of contact between conductive regions and generated multiple, partially redundant electrical pathways. Consequently, the bulk conductivity became less sensitive to local compositional and microstructural fluctuations. This improved reproducibility should not be interpreted as evidence of homogeneous SWCNT dispersion because STEM, AFM, and C-AFM still revealed a heterogeneous multiphase morphology and spatially localized conductive regions in TPU-3-SWCNT. Instead, the results indicate progressive stabilization and improved continuity of the macroscopic conductive network with increasing MB loading.
The comparison with the literature highlights the strong dependence of electrical conductivity on both the formulation strategy and processing history. Da Silva et al. [11] prepared TPU/SWCNT composites by first pre-dispersing SWCNTs in polypropylene glycol, coating the TPU pellets, and subsequently melt mixing the coated pellets using a small-scale co-rotating twin-screw extruder. Despite this elaborate melt-processing route, the melt-extruded filaments reached conductivities of only 1.3 × 10⁻⁴ s/m and 1.6 × 10⁻⁴ s/m at SWCNT contents of 0.6 wt.% and 0.8 wt.%, respectively. In contrast, the micro-compounder-processed samples showed only limited improvement in conductivity, even when the SWCNT content was increased to 2 wt.%. The authors also reported that Joule heating was not observed in the micro-compounder-processed samples at applied voltages of 60 V or 90 V. This comparison suggests that the commercial SWCNT MB used in the present study may generate more effective conductive pathways than direct powder dispersion under short melt-mixing conditions, possibly because the nanotubes are already partially individualized or distributed within the MB before dilution into TPU. However, differences in TPU grade, specimen geometry, electrode configuration, and conductivity measurement method can also strongly influence the measured conductivity [50].
The electrical conductivities obtained in the present study are also higher than those reported for several solution-cast TPU/SWCNT systems shown in Figure 6A, despite the common expectation that solvent-based processing can facilitate improved nanotube dispersion. For example, Bautista-Quijano et al. [12] prepared SWCNT/polyurethane films by solution casting and reported electrical conductivities on the order of 10−4 s/m at an SWCNT content of 8 wt.%. In that study, the comparatively low conductivity of the SWCNT-containing composites was attributed partly to the electronic characteristics of the SWCNTs and to less effective nanotube–polymer electrical contacts compared with MWCNT-based composites. This finding demonstrates that increasing the SWCNT content alone does not necessarily ensure high electrical conductivity, because the conductive response also depends on nanotube type, bundle structure, electronic characteristics, dispersion state, and interparticle contact resistance. Hota et al. [13] similarly demonstrated that SWCNT dispersion in TPU is strongly influenced by the incorporation of an ionic liquid. High-resolution transmission electron microscopy and field-emission scanning electron microscopy revealed a more homogeneous SWCNT distribution in the ionic-liquid-containing systems. Their study further indicated that the increase in conductivity was associated with the formation of interconnected nanotube pathways and with hopping and tunneling transport mechanisms. Collectively, these studies support the interpretation that the relatively high conductivity of the present TPU/MB composites is governed not only by the SWCNT content but also by the effectiveness of the MB-assisted dispersion route in establishing electrical connectivity between conductive domains.
Other systems reported in the literature reached much higher conductivities, but through architectures that are fundamentally different from the present melt-processable composites. Paleo et al. [14] fabricated nonwoven SWCNT–TPU composite sheets by one-step filtration using a TPU solvent/nonsolvent system and reported conductivities increasing from 120 s/m to 15.7 × 10² s/m as the SWCNT content increased from 5 wt.% to 90 wt.%. These values are much higher than those of conventional melt-blended elastomer composites because the material contains a highly connected, SWCNT-rich nonwoven network rather than a dilute filler network dispersed within a continuous TPU matrix. Similarly, Shen et al. [15] produced SWCNT/graphite-flake/TPU conductive films using solution processing, sonication, and homogenization and showed that the graphite flakes reduced SWCNT aggregation while maintaining high film conductivity.
The conductivity comparison also needs to be interpreted in light of the measurement methodology. The literature values presented in Figure 6A include DC resistivity measurements on filaments or films, impedance-derived conductivities, AC conductivity measurements, and in-plane measurements on highly conductive sheets. For example, Novikov et al. [16] used impedance spectroscopy to evaluate percolation in compression-molded TPU/SWCNT samples prepared by coagulation precipitation, reporting an exceptionally low percolation threshold of 0.006 wt.%. This low threshold was attributed to the homogeneous SWCNT distribution achieved through the combined dispersion and precipitation route. In contrast, Hota et al. [13] reported frequency-dependent AC conductivity, which is influenced by dielectric relaxation and hopping or tunneling transport, making direct comparison with DC bulk conductivity less straightforward. Therefore, Figure 6A should be interpreted as a comparative conductivity landscape rather than as a strict ranking of materials. Within this context, the present TPU/MB composites achieve conductive behavior through a solvent-free, MB-assisted melt-processing approach that is compatible with subsequent material extrusion 3D printing, making the process scalable beyond the laboratory.
The electrothermal functionality of the most conductive formulation, TPU-3-SWCNT, was then evaluated by applying different voltages and monitoring the temperature evolution using infrared thermography, as shown in Figure 6B. At 10 V, the temperature increase was limited, indicating that the generated Joule heat was largely balanced by heat losses to the surroundings and electrical contacts. Increasing the voltage to 14 V produced a moderate temperature rise, whereas 18 V, and particularly 22 V, resulted in rapid heating. At 22 V, the vacuum-molded TPU-3-SWCNT specimen reached temperatures above the thermal-transition range identified by DSC, demonstrating that Joule heating could access the temperature window associated with activation of the switching phase under the investigated specimen geometry and electrical-contact conditions. However, shape recovery was not evaluated during this electrothermal experiment. The representative thermal images acquired at 22 V show the progressive heating of the sample during electrical stimulation. The temperature field was not perfectly uniform, which is expected for resistive polymer composites because variations in local current density, contact resistance, sample geometry, and convective and radiative heat losses can generate temperature gradients during Joule heating.
The initial heating regime was further quantified by fitting the early temperature–time response, as shown in Figure 6C. Based on Figure 6C and Table 3, the heating rate increased strongly with applied voltage, from 1.92 °C/min at 10 V to 12.28 °C/ at 14 , 33.70 °C/ at 18 , and 61.78 °C/ at 22 . The high coefficients of determination, = 0.93 to 0.98, indicate that the initial heating response can be reasonably approximated by a linear fit over the analyzed time window. The nonlinear shape of the longer temperature–time curves in Figure 6B is consistent with the progressive increase in heat losses as the sample temperature rises and approaches a voltage-dependent thermal equilibrium.
Table 3.
Linear fitting parameters for the Joule-heating response of TPU-3-SWCNT. Slope, intercept, and coefficient of determination () obtained from the linear fits of the initial temperature–time profiles at each applied voltage.
3.5. Microstructural Organization of TPU/Polyol-Ester/SWCNT Composites Revealed by STEM and AFM
Figure 7 shows bright-field STEM images of neat TPU and TPU-3-SWCNT samples. The STEM image of neat TPU shows a relatively uniform and featureless morphology, consistent with a homogeneous polymer matrix. In contrast, the TPU-3-SWCNT samples exhibit two distinct gray-level intensities, indicating the presence of two material phases with different electron-scattering characteristics. The contrast is consistent with a heterogeneous multiphase morphology, although the chemical identities of the contrasting regions were not independently established. In addition, localized dark, dot-like features are observed and are attributed to SWCNT-rich regions or nanotube bundles dispersed within the matrix. The ultra-thin sections were cut perpendicular to the extrusion direction. Therefore, the predominantly dot-like appearance of the SWCNT-rich features suggests that the nanotubes were preferentially aligned along the extrusion direction and were consequently observed mainly in cross-section.
Figure 7.
Bright-field STEM images of neat TPU and TPU-3-SWCNT at different magnifications. Neat TPU exhibits a relatively uniform morphology, whereas TPU-3-SWCNT shows dispersed SWCNT-containing features within the polymer matrix. Red arrows indicate representative SWCNT-rich regions. Note: The grid-like pattern indicated by the red X marks corresponds to the underlying specimen-mounting grid and is not a morphological feature of the TPU or composite films.
AFM topography and phase imaging were used to compare the nanoscale surface morphology of neat TPU and TPU-3-SWCNT after ultramicrotoming (Figure 8). Neat TPU exhibited a comparatively homogeneous topographical response, with limited height variation and relatively uniform phase contrast across the investigated scan sizes. The weak contrast observed at the larger scan sizes is consistent with the intrinsic microphase-separated structure of segmented TPU, in which mechanically distinct hard- and soft-segment domains can produce local differences in stiffness, adhesion, viscoelasticity, and energy dissipation. Tapping-mode AFM has previously been used to resolve such nanophase-separated structures in segmented polyurethanes, with the phase contrast associated with differences in the local mechanical response of hard- and soft-segment-rich regions [51,52]. No pronounced elongated or directionally organized features were observed in neat TPU under the applied imaging conditions.
Figure 8.
AFM topography and phase images of ultramicrotomed composite surfaces at different scan sizes. The upper panels show neat TPU, and the lower panels show TPU-3-SWCNT. For each sample, topography images are presented in the top row and phase images in the bottom row. The red arrows indicate the cutting direction, which is parallel to the extrusion direction.
In contrast, TPU-3-SWCNT displayed substantially greater morphological heterogeneity. The phase images revealed elongated, fiber-like features that were preferentially oriented along the direction indicated by the red arrow, corresponding to both the cutting and extrusion directions. The absence of comparable structures in neat TPU indicates that their formation or enhanced visibility was associated with incorporation of the MB. Previous AFM investigations of melt-compounded TPU/carbon-nanofiller composites have similarly shown that carbon nanofillers can modify the phase-separated morphology of TPU and increase the contrast between mechanically distinct regions [53].
The observed heterogeneity should, however, be interpreted in view of the complete TPU-3-SWCNT composition. In addition to approximately 3 SWCNTs, TPU-3-SWCNT contained approximately 27 of the polyol-ester blend. The elongated phase-contrast features therefore cannot be attributed exclusively to the nanotubes and should not be interpreted as direct images of individual SWCNTs. Their dimensions and collective morphology are more consistent with larger composite-specific structures, which may include SWCNT-rich bundles or interconnected domains, polyol-ester-blend-rich regions, interfaces between the polyol-ester blend and TPU phases, or TPU domains whose organization was modified by the combined presence of the polyol-ester blend and SWCNTs.
Furthermore, AFM phase contrast is not chemically specific. The measured phase shift can depend on several tip–sample interactions, including adhesion, viscoelastic deformation, local stiffness, and energy dissipation, as well as on the selected imaging parameters [54]. Consequently, the phase images alone cannot distinguish between the SWCNTs, the polyol-ester blend, and the intrinsic hard- and soft-segment morphology of TPU. The AFM results therefore support the formation of a heterogeneous multiphase morphology following MB incorporation but do not independently identify the chemical composition of the individual domains.
The apparent directionality of the TPU-3-SWCNT features must also be interpreted in view of the ultramicrotoming procedure. Microtoming has been shown to introduce surface anisotropy and promote the appearance or growth of oriented hard domains in segmented polyurethane surfaces [55]. In the present specimens, the cutting and extrusion directions were parallel; therefore, their individual contributions to the observed orientation cannot be separated. The apparent alignment may reflect orientation or redistribution of MB-containing domains during melt processing and extrusion, but it may also have been enhanced or partially generated by cutting-induced deformation, smearing, or preferential exposure of mechanically distinct regions.
3.6. Local Conductive-Network Formation Revealed by C-AFM
Conductive-AFM (C-AFM) was used to further examine whether the heterogeneous microstructure observed in TPU-3-SWCNT was associated with local electrical pathways. As shown in Figure 9, the C-AFM current maps revealed a spatially non-uniform conductive response across the ultramicrotomed TPU-3-SWCNT surface. The current signal was not distributed homogeneously over the scanned areas; instead, localized regions with higher current were observed within a predominantly lower-current matrix. Such behavior is consistent with previous C-AFM and current-sensing AFM studies of conductive polymer nanocomposites, in which local current maps were used to identify discrete conducting domains and connected surface regions associated with the underlying percolative filler network [56,57,58]. The present maps therefore indicate that the conductive phase in TPU-3-SWCNT is heterogeneously distributed at the nanoscale and that electrical transport is localized within selected conductive domains or interconnected SWCNT-rich regions rather than occurring through a uniformly conductive TPU matrix.
Figure 9.
Conductive AFM analysis of TPU-3-SWCNT. AFM topography images, corresponding C-AFM current maps, and current-distribution histograms acquired at different scan sizes.
The current-distribution histograms further support this interpretation. The distributions were dominated by low-current pixels, while only a smaller fraction of pixels extended toward higher current values. This asymmetric distribution is consistent with a heterogeneous conductive network in which only selected regions contribute substantially to charge transport, while the surrounding matrix remains weakly conductive or electrically inactive under the applied measurement conditions. Similar low/high-current-domain behavior has been reported in C-AFM studies of CNT/polymer nanocomposites and interpreted as evidence of percolative conduction through spatially discrete conductive pathways [56]. In the context of the AFM phase images discussed in the previous section, the higher-current regions in TPU-3-SWCNT are most reasonably attributed to SWCNT-rich or MB-derived domains that were exposed at the microtomed surface and that were electrically connected to the underlying conductive network.
Nevertheless, the C-AFM results provide local, surface-sensitive information rather than a direct image of the full three-dimensional bulk network. The measured current depends not only on the local presence of a conductive phase but also on the continuity of that phase to the surface, tip–sample contact conditions, local contact resistance, and the applied bias [56]. Consequently, regions showing low current are not necessarily free of SWCNTs; they may instead correspond to domains in which the conductive phase is poorly connected to the surface or separated by higher-resistance tunneling barriers. Overall, the C-AFM observations provide direct nanoscale evidence that electrical conduction in TPU-3-SWCNT proceeds through a heterogeneous percolative network rather than through a homogeneous conductive continuum.
3.7. Thermally Activated Shape Recovery of TPU/MB Composites
The shape-memory performance of the TPU/MB composites was first quantified under controlled thermomechanical cycling, as summarized in Table 4. The corresponding three-dimensional temperature–strain–stress plots are provided in Figures S1–S3. All formulations exhibited relatively high , ranging from 85.4% to 91.4% over the three consecutive cycles. During the first cycle, increased from 85.4% for TPU-1-SWCNT to 88.4% for TPU-2-SWCNT and 89.9% for TPU-3-SWCNT. This loading-dependent trend was maintained during the subsequent cycles, with TPU-3-SWCNT consistently exhibiting the highest shape fixity, reaching 91.4% in the third cycle. These results indicate that increasing the MB content enhanced the ability of the composites to retain the programmed deformation after cooling and unloading.
Table 4.
Shape-fixity ratio () and shape-recovery ratio () of the TPU/MB composites over three consecutive shape-memory cycles.
A modest cycle-dependent improvement in shape fixation was also observed. From the first to the third cycle, increased by 3.3 percentage points for TPU-1-SWCNT and by 1.5 percentage points for both TPU-2-SWCNT and TPU-3-SWCNT. The smaller cycle-to-cycle changes observed at the higher MB contents suggest that these formulations approached a relatively stable fixation response more rapidly. Temporary-shape stabilization is expected to be supported by the crystallization or solidification of the polyol-ester phase during cooling. However, the monotonic increase in , despite the previously observed decrease in normalized DSC enthalpy retention with increasing MB content, indicates that fixation was not governed exclusively by the relative amount of carrier-derived crystallinity. The increased stiffness and restricted chain mobility associated with the polyol-ester-rich domains and SWCNT network may also suppress elastic recoil following unloading, thereby contributing to temporary-shape retention. Because the polyol-ester blend and SWCNT contents increased simultaneously, their individual contributions cannot be separated from the present results.
The shape-recovery ratio, , was reported for the second and third cycles in the present dataset. During the second cycle, the formulations exhibited comparable recovery ratios, ranging from 77.5% to 79.8%. The recovery response improved considerably during the third cycle, reaching 87.5%, 92.5%, and 90.5% for TPU-1-SWCNT, TPU-2-SWCNT, and TPU-3-SWCNT, respectively. These values correspond to increases of 9.9, 15.0, and 10.7 percentage points relative to the second cycle. This improvement may indicate a thermomechanical conditioning effect, during which the initial cycles promote rearrangement of the reversible domains, release processing-induced residual stresses, or stabilize the deformation–recovery pathway.
The functional applicability of TPU-3-SWCNT was further demonstrated qualitatively using a 3D-printed lattice subjected to a thermally activated shape-memory cycle (Figure 10). Both the programming and recovery steps were performed using external oven heating; no electrical voltage was applied to the printed lattice. TPU-3-SWCNT was selected because it combined the highest electrical conductivity among the investigated formulations, the most effective Joule-heating response, high shape fixity, and a distinct carrier-derived thermal transition. The printed lattice was heated to 70 °C, above the carrier-derived melting peak measured at 53.8 ± 0.1 °C, deformed under an external constraint, and subsequently cooled to room temperature while the constraint was maintained. Following removal of the constraint, the lattice retained a substantial part of its programmed configuration, indicating stabilization of the temporary shape. Upon reheating, the lattice recovered toward its original printed geometry. This programming–fixation–recovery sequence provides qualitative evidence of a thermally activated shape-memory response in the printed TPU-3-SWCNT composite.
Figure 10.
Qualitative thermally activated shape-memory cycle of the 4D-printed TPU-3-SWCNT lattice. The sequence shows the initial printed geometry, oven heating to 70 °C, deformation and fixation under external constraint, cooling to room temperature, release of the temporary shape, and recovery during a second oven-heating step at 70 °C. No electrical voltage was applied during this demonstration. Scale bar: 1 .
The observed response can be interpreted based on the thermal transitions and multiphase structure discussed in the preceding sections. Thermally activated shape-memory polymers generally require a reversible switching phase that fixes the temporary configuration and a permanent network that stores the elastic energy required for recovery. In semicrystalline TPU/polyester systems, crystallization of the switching phase can immobilize the deformed polymer chains during cooling, whereas melting of this phase during reheating releases the stored deformation and allows recovery toward the permanent shape [30,36]. A comparable mechanism has been demonstrated in 4D-printed PCL/TPU structures, in which PCL acts as the crystallizable switching phase, its melting temperature defines the thermal activation region, and the TPU phase provides the physical network points responsible for recovery [59].
In the present composite, TPU-3-SWCNT exhibits a polyol-ester-derived melting transition at 53.8 ± 0.1 °C. The crystallizable polyol-ester phase introduced by MB acts as the thermally reversible switching component. Heating to 70 °C promotes melting of the polyol-ester-derived crystalline domains and increases molecular mobility, thereby allowing deformation and programming of the lattice. Subsequent cooling under constraint permits crystallization or solidification of this phase, which can immobilize the deformed configuration and stabilize the temporary shape. Upon reheating above the transition region, melting of the switching domains releases this constraint, while elastic strain stored within the TPU chains, entanglements, and physical hard-segment domains provides the restoring force for recovery toward the original printed geometry.
The lattice geometry also contributed to the observable macroscopic response. Compared with a dense specimen, the open cellular structure accommodates substantial overall deformation through bending, rotation, and possible local buckling of the printed struts, thereby limiting the strain that must be sustained uniformly by the bulk material. Previous investigations of 4D-printed shape-memory lattices have similarly demonstrated that unit-cell geometry and structural length scale influence deformation, recovery, and recovery-stress behavior [60]. The present lattice therefore demonstrates the coupled contributions of material functionality and structural design. However, the and values reported in Table 4 were obtained from separate specimens under controlled uniaxial DMA conditions and should not be interpreted as quantitative measurements of the printed lattice. Because the lattice response was evaluated visually, its shape fixity, shape recovery, recovery rate, spatial uniformity, and cyclic durability remain to be quantified.
The externally heated recovery experiment and the Joule-heating measurements establish two complementary prerequisites for future electrically activated shape recovery. The printed lattice demonstrated thermally activated shape-memory behavior, whereas the vacuum-molded specimen demonstrated that the conductive composite could generate temperatures above the switching region under an applied voltage. These functions were evaluated independently and therefore do not constitute a direct demonstration of Joule-heating-induced recovery of the printed lattice. Their integration will require further evaluation because the electrical resistance, contact configuration, current distribution, and temperature uniformity of a printed cellular structure may differ substantially from those of the vacuum-molded specimen.
4. Conclusions
Developing soft, electrically responsive feedstocks that simultaneously combine printability, electrical conductivity, and thermally activated shape-memory behavior remains a major challenge for extrusion-based 4D printing. This study demonstrates that these functionalities can be introduced simultaneously through a simple, solvent-free melt-compounding strategy using a commercial SWCNT masterbatch for producing conductive TPU composites suitable for FGF 3D printing and potential applications in 4D-printing technologies. Diluting the commercial TUBALL™ MB with TPU yielded multiphase TPU/polyol-ester/SWCNT composites containing approximately 1 wt.% to 3 wt.% SWCNTs and 9 wt.% to 27 wt.% of the proprietary polyol-ester blend. All formulations maintained degradation-onset temperatures well above the compounding, molding, and printing temperatures used, confirming that the selected processing window was appropriate.
The MB produced simultaneous changes in the thermal, rheological, mechanical, and morphological behavior of TPU. A polyol-ester melting transition was retained at approximately 53.8 °C to 54.1 °C, providing a thermally accessible switching region enabling controlled programming, while the low glass-transition temperature of TPU preserved elastomeric behavior at room temperature. Increasing MB content increased the complex viscosity, dynamic moduli, and Shore A hardness while maintaining pronounced shear-thinning behavior. These effects reflect the combined influence of the SWCNT network, the polyol-ester phase, and the resulting multiphase morphology rather than an isolated SWCNT-loading effect.
STEM, AFM, and c-AFM observations of TPU-3-SWCNT revealed a heterogeneous multiphase morphology, with localized STEM features attributed to SWCNT-rich regions or nanotube bundles. C-AFM further showed that electrical conduction was spatially non-uniform within the examined areas. The mean bulk electrical conductivity increased from 1.09 ± 0.63 s/m for TPU-1-SWCNT to 18.15 ± 3.40 s/m for TPU-3-SWCNT, while the coefficient of variation decreased from 57.4% to 18.7%, indicating improved reproducibility of macroscopic electrical transport with increasing MB loading. TPU-3-SWCNT exhibited voltage-dependent Joule heating, with an initial heating rate of 61.78 °C/min at 22 V, and reached temperatures above the polyol-ester melting transition.
Cyclic thermomechanical testing using DMA further confirmed the shape-memory response. Moreover, TPU-3-SWCNT was successfully processed by FGF printing into an open lattice that retained a programmed temporary deformation and recovered toward its original geometry upon reheating to 70 °C. The observed response is consistent with a mechanism in which the crystallizable carrier-derived phase contributes to temporary-shape fixation, while the elastomeric TPU network provides the restoring force for recovery. Beyond the present proof of concept, this strategy demonstrates that commercial multifunctional masterbatches can simultaneously act as conductive-filler carriers and shape-memory switching phases. The results therefore establish a scalable route to printable conductive TPU composites containing a single multifunctional additive to enable a simultaneous electrothermal heating capability and thermally activated shape-memory behavior. Future work should integrate these functions by quantifying direct Joule-heating-induced recovery, temperature uniformity, shape fixity, recovery kinetics, and cyclic durability in printed structures.
Supplementary Materials
The following supporting information can be downloaded at https://www.mdpi.com/article/10.3390/app16199632/s1.
Author Contributions
Conceptualization, B.S., V.B. and J.G.-G.; methodology, B.S., V.B. and J.G.-G.; investigation, B.S.; writing—original draft preparation, B.S.; review and editing, B.S., V.B. and J.G.-G.; visualization, B.S.; supervision, V.B. and J.G.-G.; funding acquisition, J.G.-G. All authors have read and agreed to the published version of the manuscript.
Funding
This work was supported by the Luxembourg National Research Fund (FNR) through the Improving Rheological Behavior of Functional Thermoplastic Elastomers for Material Extrusion Additive Manufacturing—RHEBEL project [INTER/ANR/24/18955251/RHEBEL].
Institutional Review Board Statement
Not applicable.
Informed Consent Statement
Not applicable.
Data Availability Statement
The data presented in this study are available from the corresponding author upon reasonable request.
Acknowledgments
The authors gratefully acknowledge Fanny Lotthammer and Benoit Marcolini for their assistance with thermogravimetric analysis, differential scanning calorimetry, and dynamic mechanical analysis; Mariapaola Staropoli for her support in establishing the rheological testing protocol; Doriane Delfrari for her assistance with the electrical conductivity measurements; Asmaa El Moul for preparing the specimens for scanning transmission electron microscopy; Apostolos Karanastasis and Vincent Roge for performing the STEM analysis; and Patrick Grysan for conducting the atomic force microscopy and conductive atomic force microscopy analyses. During the preparation of this manuscript, the authors used ChatGPT version 5.5 (OpenAI) to assist with language editing, improving the clarity and organization of the text, and the preparation of a schematic illustration. All AI-assisted content was critically reviewed and edited by the authors, who take full responsibility for the scientific content and accuracy of the publication.
Conflicts of Interest
The authors declare no conflicts of interest.
References
- Wang, D.; Dong, J.; Ge, H.; Tang, M.; Xie, Q.; Liu, J.; Si, Y.; Wang, Y.; Sun, R. Electrically Heated Flexible Heaters in Wearable Technology: A Review of Research Progress and Challenges. ACS Appl. Mater. Interfaces 2025, 17, 66151–66179. [Google Scholar] [CrossRef] [Scilit] [PubMed]
- Apsite, I.; Salehi, S.; Ionov, L. Materials for Smart Soft Actuator Systems. Chem. Rev. 2022, 122, 1349–1415. [Google Scholar] [CrossRef] [Scilit] [PubMed]
- Wang, Z.; Yu, W.; Gao, C.; Zhu, Z.; Zhang, J. Multifunctional and high-performance electrothermal films based on carbon black/Ag nanowires/graphene composites. npj Flex. Electron. 2024, 8, 52. [Google Scholar] [CrossRef] [Scilit]
- Wang, F.; Liu, Y.; Yu, J.; Li, Z.; Ding, B. Recent progress on general wearable electrical heating textiles enabled by functional fibers. Nano Energy 2024, 124, 109497. [Google Scholar] [CrossRef] [Scilit]
- Long, C.; Wang, R.; Wang, Y.; Lan, H.; Zhu, X.; Zhang, Y.F. Electrothermally activated soft materials: Mechanisms, methods and applications. Prog. Mater. Sci. 2025, 150, 101406. [Google Scholar] [CrossRef] [Scilit]
- Zhou, G.; Zhang, H.; Xu, S.; Gui, X.; Wei, H.; Leng, J.; Koratkar, N.; Zhong, J. Fast Triggering of Shape Memory Polymers using an Embedded Carbon Nanotube Sponge Network. Sci. Rep. 2016, 6, 24148. [Google Scholar] [CrossRef] [Scilit] [PubMed]
- Jia, S.L.; Geng, H.Z.; Wang, L.; Tian, Y.; Xu, C.X.; Shi, P.P.; Gu, Z.Z.; Yuan, X.S.; Jing, L.C.; Guo, Z.Y.; et al. Carbon nanotube-based flexible electrothermal film heaters with a high heating rate. R. Soc. Open Sci. 2018, 5, 172072. [Google Scholar] [CrossRef] [Scilit] [PubMed]
- Kashyap, D.; Kumar, P.K.; Kanagaraj, S. 4D printed porous radiopaque shape memory polyurethane for endovascular embolization. Addit. Manuf. 2018, 24, 687–695. [Google Scholar] [CrossRef] [Scilit]
- Krassas, M.; Porfyrakis, E.; Simopoulos, F.; Kampourakis, G.; Nikolaos, P.C.; Katsiaounis, S.; Papagelis, K.; Karalis, G.; Kechagias, J.D.; Evangelou, E.K.; et al. High-Performance 4D Printed ABS/Conductive TPU Electrothermal Actuator Devices with SWCNT Segregated Structures: A Gripper Demonstrator toward Soft Robotics Applications. ACS Appl. Mater. Interfaces 2025, 17, 42331–42347. [Google Scholar] [CrossRef] [Scilit] [PubMed]
- Owens, C.E.; Headrick, R.J.; Williams, S.M.; Fike, A.J.; Pasquali, M.; McKinley, G.H.; Hart, A.J. Substrate-Versatile Direct-Write Printing of Carbon Nanotube-Based Flexible Conductors, Circuits, and Sensors. Adv. Funct. Mater. 2021, 31, 2100245. [Google Scholar] [CrossRef] [Scilit]
- Martins da Silva, M.; Ribeiro, R.; Oliveira, A.S.; Paiva Proença, M.; Paiva, M.C.; Covas, J.A. Enhancing the electrical conductivity of TPU-TPU/SWCNT multilayered composites using melt multipliers. Compos. Commun. 2025, 57, 102448. [Google Scholar] [CrossRef] [Scilit]
- Bautista-Quijano, J.R.; Avilés, F.; Cauich-Rodriguez, J.V.; Schönfelder, R.; Bachmatiuk, A.; Gemming, T.; Rümmeli, M.H. Tensile piezoresistivity and disruption of percolation in singlewall and multiwall carbon nanotube/polyurethane composites. Synth. Met. 2013, 185–186, 96–102. [Google Scholar] [CrossRef] [Scilit]
- Hota, N.K.; Sahoo, B.P. Single-walled carbon nanotube filled thermoplastic polyurethane nanocomposites: Influence of ionic liquid on dielectric properties. Mater. Today Proc. 2021, 41, 216–222. [Google Scholar] [CrossRef] [Scilit]
- Paleo, A.J.; Martinez-Rubi, Y.; Krause, B.; Pötschke, P.; Jakubinek, M.B.; Ashrafi, B.; Kingston, C. Carbon Nanotube—Polyurethane Composite Sheets for Flexible Thermoelectric Materials. ACS Appl. Nano Mater. 2023, 6, 17986–17995. [Google Scholar] [CrossRef] [Scilit] [PubMed]
- Shen, Y.; Wang, Y.; Luo, Z.; Wang, B. Durable, Sensitive, and Wide-Range Wearable Pressure Sensors Based on Wavy-Structured Flexible Conductive Composite Film. Macromol. Mater. Eng. 2020, 305, 2000206. [Google Scholar] [CrossRef] [Scilit]
- Novikov, I.V.; Krasnikov, D.V.; Vorobei, A.M.; Zuev, Y.I.; Butt, H.A.; Fedorov, F.S.; Gusev, S.A.; Safonov, A.A.; Shulga, E.V.; Konev, S.D.; et al. Multifunctional Elastic Nanocomposites with Extremely Low Concentrations of Single-Walled Carbon Nanotubes. ACS Appl. Mater. Interfaces 2022, 14, 18866–18876. [Google Scholar] [CrossRef] [Scilit] [PubMed]
- Khater, A.Z.; Saadi, M.A.S.R.; Bhattacharyya, S.; Kutana, A.; Tripathi, M.; Kamble, M.; Song, S.; Lou, M.; Barnes, M.; Meyer, M.D.; et al. Processing dynamics of carbon nanotube-epoxy nanocomposites during 3D printing. Cell Rep. Phys. Sci. 2023, 4, 101617. [Google Scholar] [CrossRef] [Scilit]
- Mao, Y.; Yu, K.; Isakov, M.S.; Wu, J.; Dunn, M.L.; Jerry Qi, H. Sequential Self-Folding Structures by 3D Printed Digital Shape Memory Polymers. Sci. Rep. 2015, 5, 13616. [Google Scholar] [CrossRef] [Scilit] [PubMed]
- Ge, Q.; Sakhaei, A.H.; Lee, H.; Dunn, C.K.; Fang, N.X.; Dunn, M.L. Multimaterial 4D Printing with Tailorable Shape Memory Polymers. Sci. Rep. 2016, 6, 31110. [Google Scholar] [CrossRef] [Scilit] [PubMed]
- Wu, J.; Yuan, C.; Ding, Z.; Isakov, M.; Mao, Y.; Wang, T.; Dunn, M.L.; Qi, H.J. Multi-shape active composites by 3D printing of digital shape memory polymers. Sci. Rep. 2016, 6, 24224. [Google Scholar] [CrossRef] [Scilit] [PubMed]
- Huang, X.; Panahi-Sarmad, M.; Dong, K.; Cui, Z.; Zhang, K.; Gelis Gonzalez, O.; Xiao, X. 4D printed TPU/PLA/CNT wave structural composite with intelligent thermal-induced shape memory effect and synergistically enhanced mechanical properties. Compos. Part A Appl. Sci. Manuf. 2022, 158, 106946. [Google Scholar] [CrossRef] [Scilit]
- Yang, F.; Jia, J.; Feng, P. 4D Printed CNT-Ag/PLLA/TPU Bone Scaffold Having Enhanced Electro-Responsive Shape Memory Properties. In Proceedings of the Social Robotics + BioMed; Ge, S.S., Yuan, W., Chang, H., Wang, Y., Samani, H., He, H., Eds.; Springer: Singapore, 2026; pp. 308–317. [Google Scholar] [CrossRef] [Scilit]
- Alawy, A.; Sudak, L.J.; Park, S.S. Multifunctional 3D-printed auxetic nanocomposites with tunable mechanical and piezoresistive properties via Joule heating. Sens. Actuators A Phys. 2025, 392, 116750. [Google Scholar] [CrossRef] [Scilit]
- Yousuf, M.H.; Abuzaid, W.; Alkhader, M. 4D printing of electroactive shape memory polymer composite activated via printed conductive and flexible heating elements. Arch. Civ. Mech. Eng. 2026, 26, 51. [Google Scholar] [CrossRef] [Scilit]
- Razzaq, M.Y.; Gonzalez-Gutierrez, J.; Farhan, M.; Das, R.; Ruch, D.; Westermann, S.; Schmidt, D.F. 4D Printing of Electroactive Triple-Shape Composites. Polymers 2023, 15, 832. [Google Scholar] [CrossRef] [Scilit] [PubMed]
- Treffer, D.; Troiss, A.; Khinast, J. A novel tool to standardize rheology testing of molten polymers for pharmaceutical applications. Int. J. Pharm. 2015, 495, 474–481. [Google Scholar] [CrossRef] [Scilit] [PubMed]
- Khan, J.; Harton, S.E.; Akcora, P.; Benicewicz, B.C.; Kumar, S.K. Polymer crystallization in nanocomposites: Spatial reorganization of nanoparticles. Macromolecules 2009, 42, 5741–5744. [Google Scholar] [CrossRef] [Scilit]
- Krauskopf, A.A.; Jimenez, A.M.; Altorbaq, A.S.; Muller, A.J.; Kumar, S.K. Quantifying Nanoparticle Ordering Induced by Polymer Crystallization. ACS Nano 2021, 15, 14430–14443. [Google Scholar] [CrossRef] [Scilit] [PubMed]
- Oguz, O.; Koutsoumpis, S.A.; Simsek, E.; Yilgor, E.; Yilgor, I.; Pissis, P.; Menceloglu, Y.Z. Effect of soft segment molecular weight on the glass transition, crystallinity, molecular mobility and segmental dynamics of poly (ethylene oxide) based poly (urethane–urea) copolymers. RSC Adv. 2017, 7, 40745–40754. [Google Scholar] [CrossRef] [Scilit]
- Ping, P.; Wang, W.; Chen, X.; Jing, X. Poly (ε-caprolactone) polyurethane and its shape-memory property. Biomacromolecules 2005, 6, 587–592. [Google Scholar] [CrossRef] [Scilit] [PubMed]
- Sarı, A.; Biçer, A.; Karaipekli, A.; Alkan, C.; Karadag, A. Synthesis, thermal energy storage properties and thermal reliability of some fatty acid esters with glycerol as novel solid–liquid phase change materials. Sol. Energy Mater. Sol. Cells 2010, 94, 1711–1715. [Google Scholar] [CrossRef] [Scilit]
- Sari, A. Thermal energy storage properties of mannitol–fatty acid esters as novel organic solid–liquid phase change materials. Energy Convers. Manag. 2012, 64, 68–78. [Google Scholar] [CrossRef] [Scilit]
- Li, W.D.; Ding, E.Y. Preparation and characterization of a series of diol di-stearates as phase change heat storage materials. Mater. Lett. 2007, 61, 4325–4328. [Google Scholar] [CrossRef] [Scilit]
- Grady, B.P. Effects of carbon nanotubes on polymer physics. J. Polym. Sci. Part B Polym. Phys. 2012, 50, 591–623. [Google Scholar] [CrossRef] [Scilit]
- Pinto, L.A.; Backes, E.H.; Harb, S.V.; Pinto, G.M.; da Cunha, D.A.L.V.; Andrade, R.J.E.; Fechine, G.J.M.; Selistre-de Araújo, H.S.; Costa, L.C.; Pessan, L.A. Shape memory thermoplastic polyurethane/polycaprolactone blend and composite with hydroxyapatite for biomedical application. J. Mater. Res. 2024, 39, 90–106. [Google Scholar] [CrossRef] [Scilit]
- Sabahi, N.; Roohani, I.; Wang, C.H.; Farajzadeh, E.; Li, X. Thermoplastic polyurethane-based shape memory polymers with potential biomedical application: The effect of TPU soft-segment on shape memory effect and cytocompatibility. Polymer 2023, 283, 126189. [Google Scholar] [CrossRef] [Scilit]
- Nakagawa, S.; Kadena, K.I.; Ishizone, T.; Nojima, S.; Shimizu, T.; Yamaguchi, K.; Nakahama, S. Crystallization behavior and crystal orientation of poly (ε-caprolactone) homopolymers confined in nanocylinders: Effects of nanocylinder dimension. Macromolecules 2012, 45, 1892–1900. [Google Scholar] [CrossRef] [Scilit]
- Yuan, J.; Zhang, X.; Xu, J.; Ding, J.; Li, W.; Guo, B. Effect of glycerol stearates on the thermal and barrier properties of biodegradable poly (butylene adipate-co-terephthalate). Materials 2024, 17, 5732. [Google Scholar] [CrossRef] [Scilit] [PubMed]
- Sakellari, G.I.; Zafeiri, I.; Batchelor, H.; Spyropoulos, F. Formulation design, production and characterisation of solid lipid nanoparticles (SLN) and nanostructured lipid carriers (NLC) for the encapsulation of a model hydrophobic active. Food Hydrocoll. Health 2021, 1, 100024. [Google Scholar] [CrossRef] [Scilit] [PubMed]
- Yu, L.M.; Huang, H.X. Temperature and shear dependence of rheological behavior for thermoplastic polyurethane nanocomposites with carbon nanofillers. Polymer 2022, 247, 124791. [Google Scholar] [CrossRef] [Scilit]
- Sui, G.; Liu, D.; Liu, Y.; Ji, W.; Zhang, Q.; Fu, Q. The dispersion of CNT in TPU matrix with different preparation methods: Solution mixing vs melt mixing. Polymer 2019, 182, 121838. [Google Scholar] [CrossRef] [Scilit]
- Zhu, P.; Chow, W.S.; Rusli, A. Stretchable thermoplastic polyurethane/single-walled carbon nanotube masterbatch nanocomposites with enhanced electrical conductivity and thermal properties. J. Elastomers Plast. 2025, 57, 215–233. [Google Scholar] [CrossRef] [Scilit]
- Ramôa, S.D.; Barra, G.M.; Oliveira, R.V.; de Oliveira, M.G.; Cossa, M.; Soares, B.G. Electrical, rheological and electromagnetic interference shielding properties of thermoplastic polyurethane/carbon nanotube composites. Polym. Int. 2013, 62, 1477–1484. [Google Scholar] [CrossRef] [Scilit]
- BASF. Elastollan® Soft 35 A 12P000. Available online: https://my.basf.com/en-US/pdp/30498525 (accessed on 2 July 2026).
- DIN ISO 48-4:2021-02; Rubber, Vulcanized or Thermoplastic—Determination of Hardness—Part 4: Indentation Hardness by Durometer Method (Shore Hardness) (ISO 48-4:2018). Beuth Verlag: Berlin, Germany, 2021. [CrossRef] [Scilit] [PubMed]
- Muñoz-Chilito, J.; Lara-Ramos, J.A.; Marín, L.; Machuca-Martínez, F.; Correa-Aguirre, J.P.; Hidalgo-Salazar, M.A.; García-Navarro, S.; Roca-Blay, L.; Rodríguez, L.A.; Mosquera-Vargas, E.; et al. Morphological electrical and hardness characterization of carbon nanotube-reinforced thermoplastic polyurethane (TPU) nanocomposite plates. Molecules 2023, 28, 3598. [Google Scholar] [CrossRef] [Scilit] [PubMed]
- Lin, X.; Gao, J.; Wang, J.; Wang, R.; Gong, M.; Zhang, L.; Lu, Y.; Wang, D.; Zhang, L. Desktop printing of 3D thermoplastic polyurethane parts with enhanced mechanical performance using filaments with varying stiffness. Addit. Manuf. 2021, 47, 102267. [Google Scholar] [CrossRef] [Scilit]
- Saadaldin, A.; Shaqour, B.; Assaf, R.; Abuabiah, M.; Badran, I.; Sabbah, M.; Odeh, M.; Amer, S.; Sabra, M.; Gonzalez-Gutierrez, J. Process–porosity relationships and predictive modeling for foamed thermoplastic polyurethane 3D printing. Prog. Addit. Manuf. 2026. [Google Scholar] [CrossRef] [Scilit]
- Lee, C.F.; Chen, C.W.; Chuang, F.S.; Rwei, S.P. Thermoplastic polyurethane/CNT nanocomposites with low electromagnetic resistance property. J. Compos. Mater. 2021, 55, 4321–4331. [Google Scholar] [CrossRef] [Scilit]
- Mironov, V.; Kim, J.; Park, M.; Lim, S.; Cho, W. Comparison of electrical conductivity data obtained by four-electrode and four-point probe methods for graphite-based polymer composites. Polym. Test. 2007, 26, 547–555. [Google Scholar] [CrossRef] [Scilit]
- McLean, R.S.; Sauer, B.B. Tapping-mode AFM studies using phase detection for resolution of nanophases in segmented polyurethanes and other block copolymers. Macromolecules 1997, 30, 8314–8317. [Google Scholar] [CrossRef] [Scilit]
- Tocha, E.; Janik, H.; Debowski, M.; Vancso, G.J. Morphology of polyurethanes revisited by complementary AFM and TEM. J. Macromol. Sci. Part B 2002, 41, 1291–1304. [Google Scholar] [CrossRef] [Scilit]
- Yuan, D.; Pedrazzoli, D.; Pircheraghi, G.; Manas-Zloczower, I. Melt compounding of thermoplastic polyurethanes incorporating 1D and 2D carbon nanofillers. Polym.-Plast. Technol. Eng. 2017, 56, 732–743. [Google Scholar] [CrossRef] [Scilit]
- Bar, G.; Thomann, Y.; Brandsch, R.; Cantow, H.J.; Whangbo, M.H. Factors affecting the height and phase images in tapping mode atomic force microscopy. Study of phase-separated polymer blends of poly (ethene-co-styrene) and poly (2, 6-dimethyl-1, 4-phenylene oxide). Langmuir 1997, 13, 3807–3812. [Google Scholar] [CrossRef] [Scilit]
- Gojzewski, H.; van Drongelen, M.; Imre, B.; Hempenius, M.A.; Check, C.; Chartoff, R.; Wurm, F.R.; Vancso, G.J. AFM monitoring of the cut surface of a segmented polyurethane unveils a microtome-engraving induced growth process of oriented hard domains. Polym. Test. 2023, 120, 107961. [Google Scholar] [CrossRef] [Scilit]
- Ozhukil Kollath, V.; Arjmand, M.; Egberts, P.; Sundararaj, U.; Karan, K. Quantitative analysis of nanoscale electrical properties of CNT/PVDF nanocomposites by current sensing AFM. RSC Adv. 2017, 7, 32564–32573. [Google Scholar] [CrossRef] [Scilit]
- Alekseev, A.; Wu, T.; Van der Ven, L.; Van Benthem, R.; de With, G. Global and local conductivity in percolating crosslinked carbon black/epoxy–amine composites. J. Mater. Sci. 2020, 55, 8930–8939. [Google Scholar] [CrossRef] [Scilit]
- Raimondo, M.; Guadagno, L.; Vertuccio, L.; Naddeo, C.; Barra, G.; Spinelli, G.; Lamberti, P.; Tucci, V.; Lafdi, K. Electrical conductivity of carbon nanofiber reinforced resins: Potentiality of Tunneling Atomic Force Microscopy (TUNA) technique. Compos. Part B Eng. 2018, 143, 148–160. [Google Scholar] [CrossRef] [Scilit]
- Rahmatabadi, D.; Aberoumand, M.; Soltanmohammadi, K.; Soleyman, E.; Ghasemi, I.; Baniassadi, M.; Abrinia, K.; Bodaghi, M.; Baghani, M. 4D Printing-Encapsulated Polycaprolactone–Thermoplastic Polyurethane with High Shape Memory Performances. Adv. Eng. Mater. 2023, 25, 2201309. [Google Scholar] [CrossRef] [Scilit]
- Li, A.; Challapalli, A.; Li, G. 4D printing of recyclable lightweight architectures using high recovery stress shape memory polymer. Sci. Rep. 2019, 9, 7621. [Google Scholar] [CrossRef] [Scilit] [PubMed]
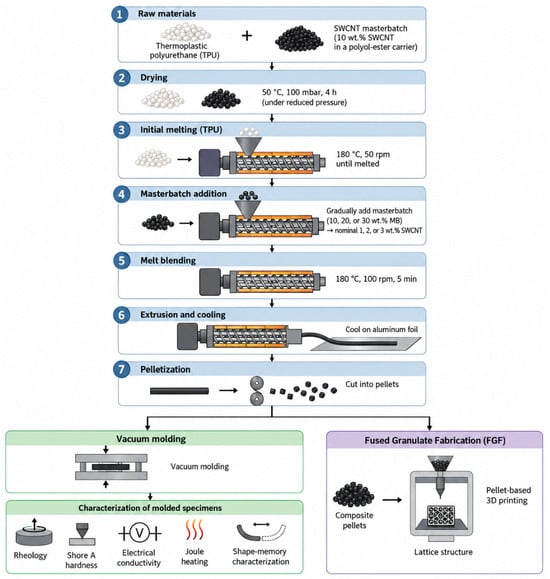
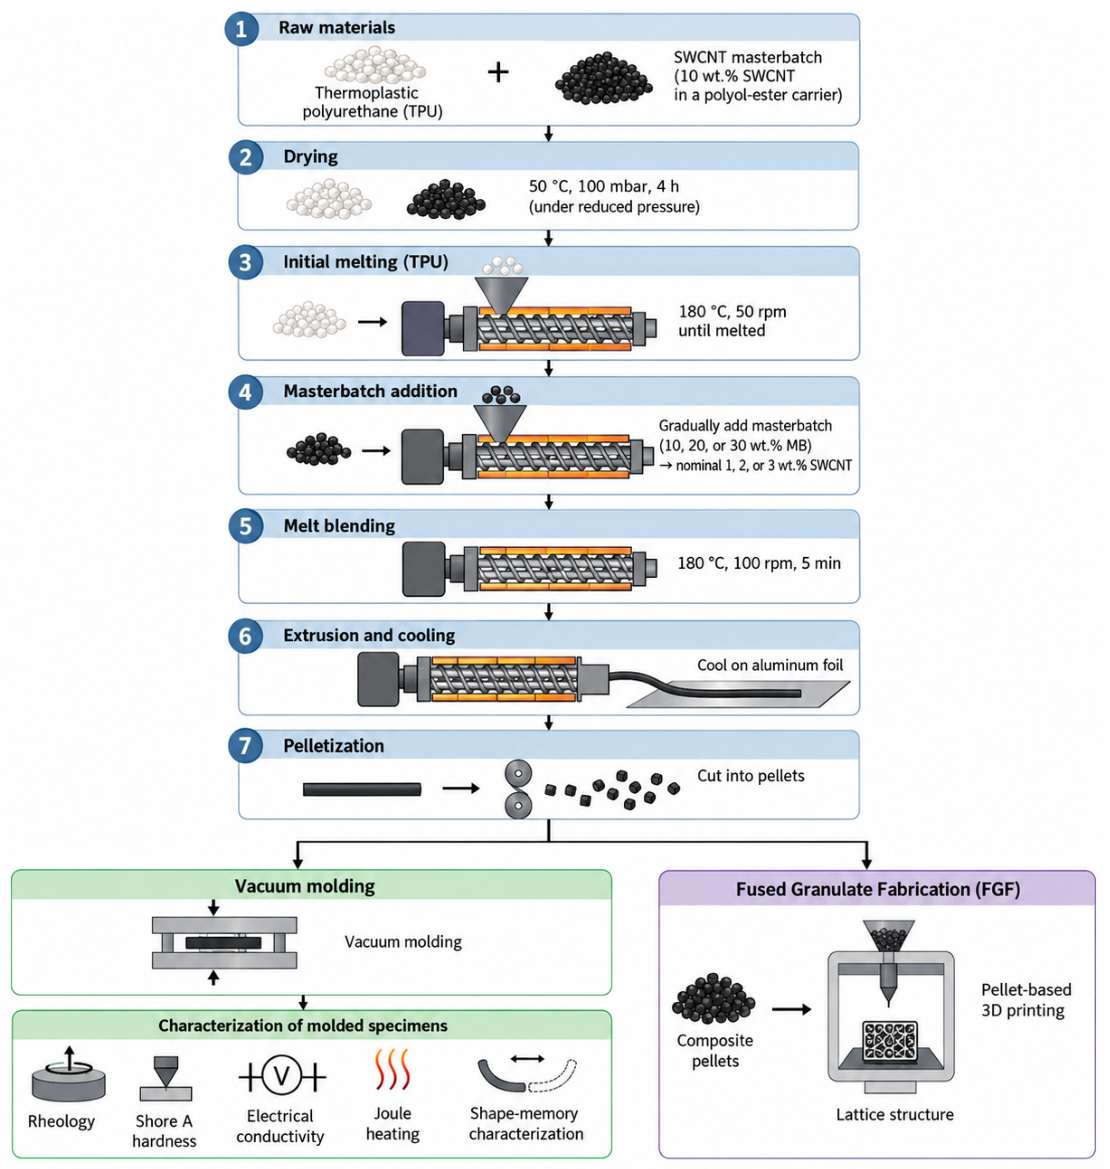
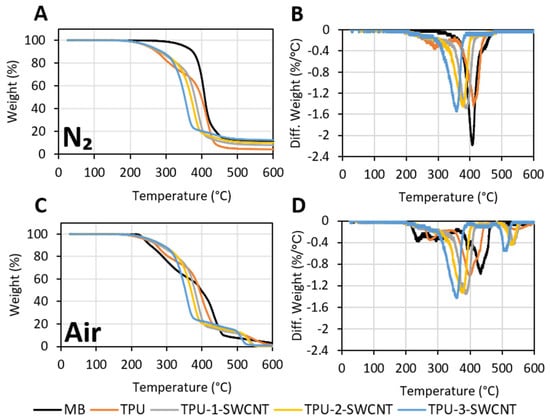
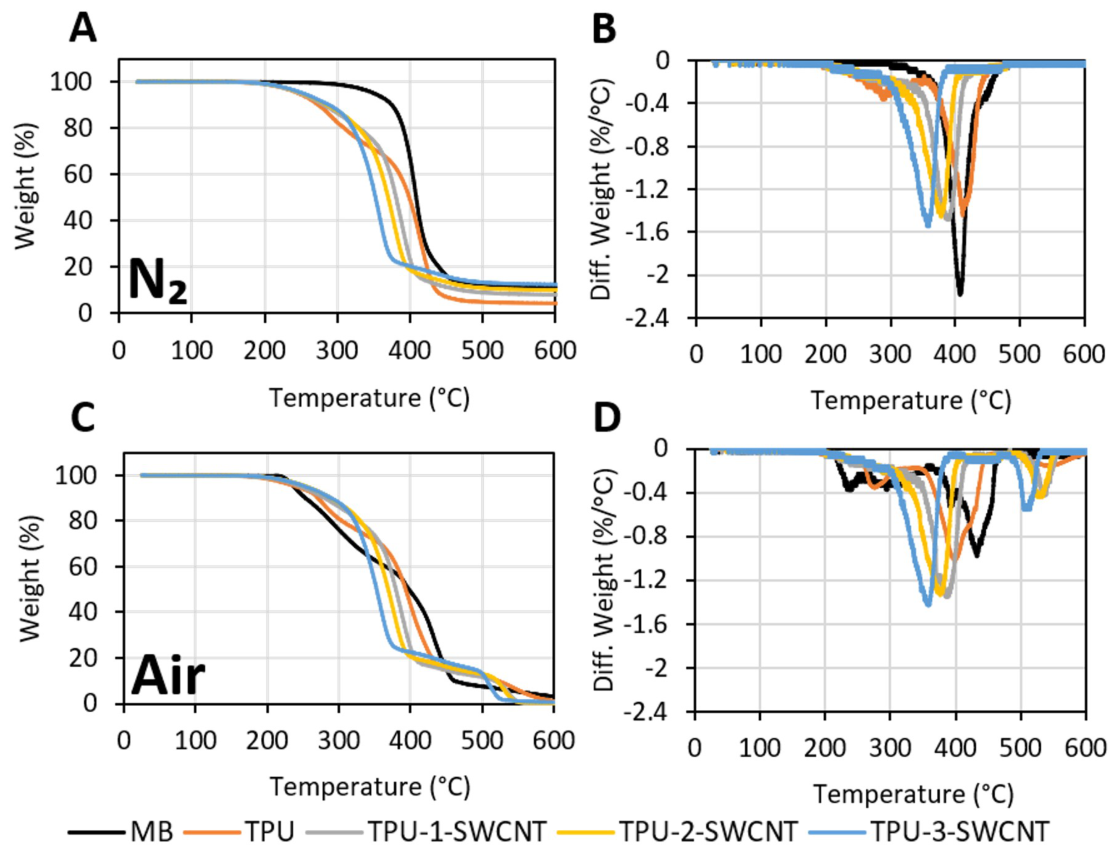
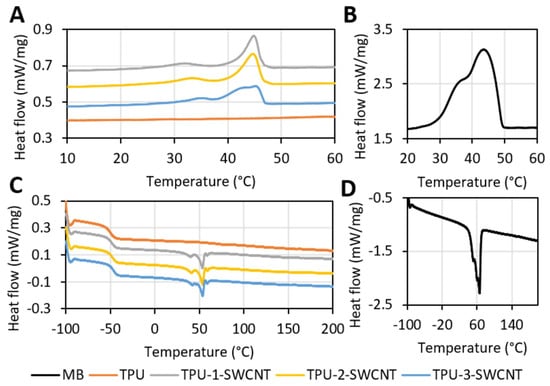
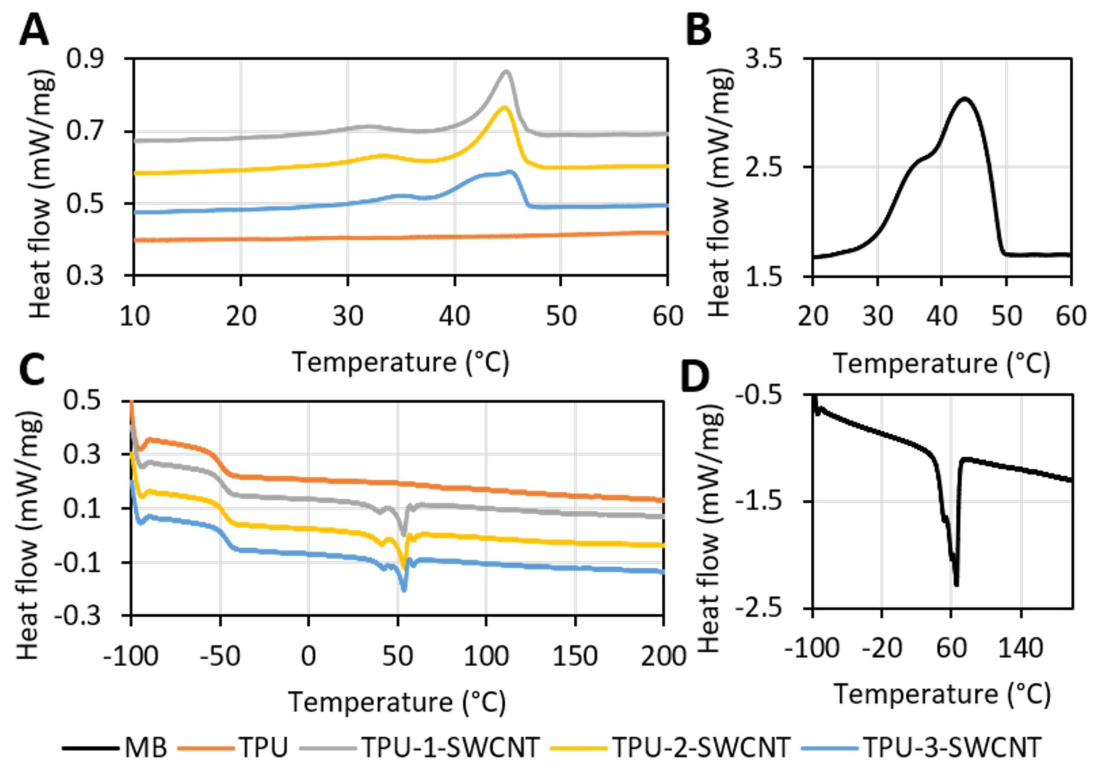
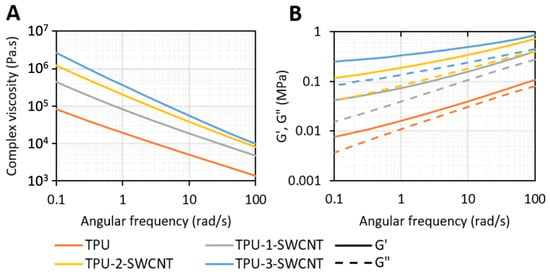
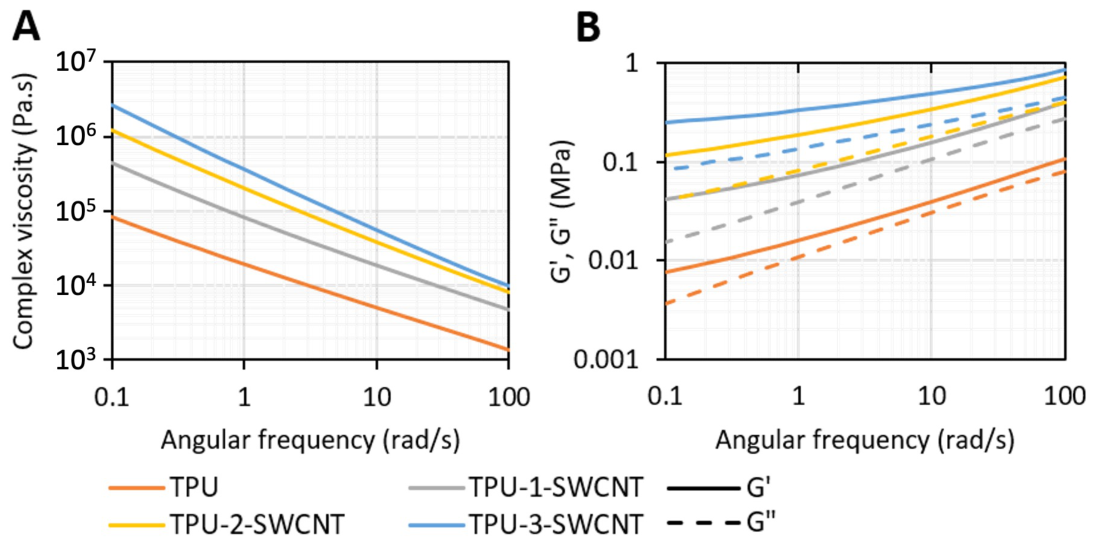
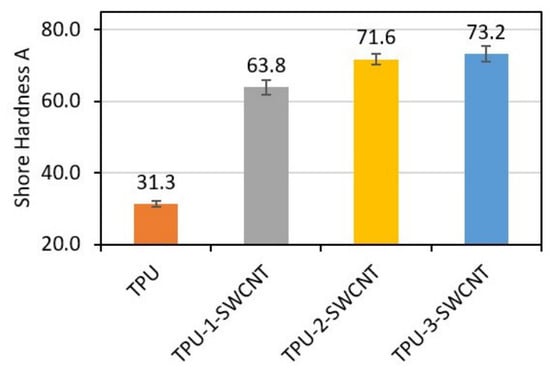
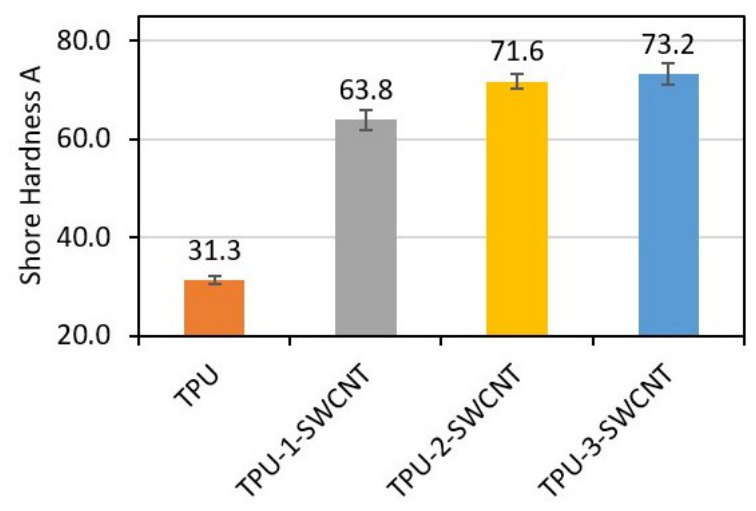
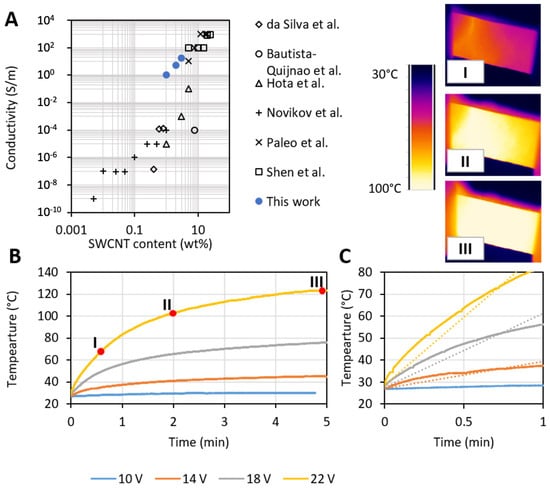
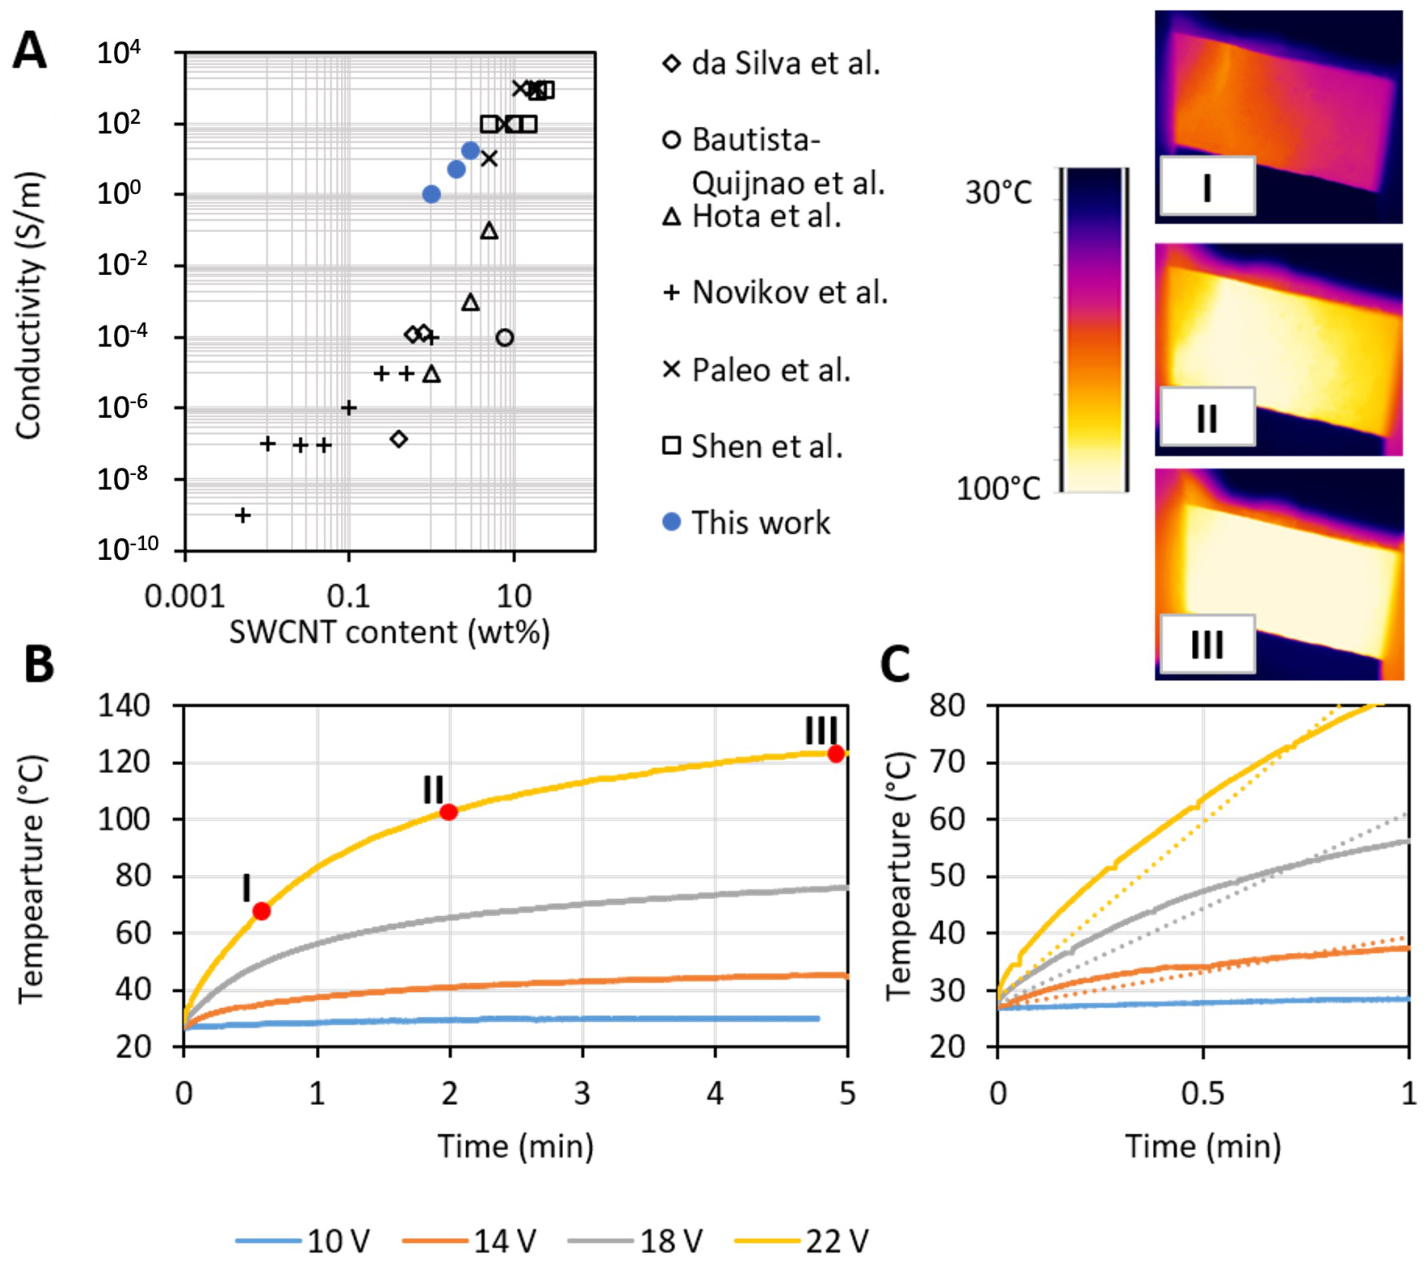
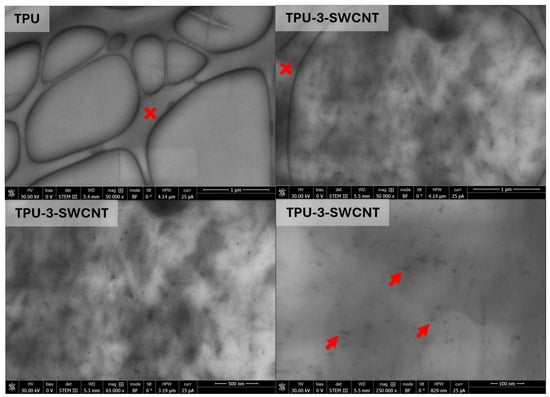
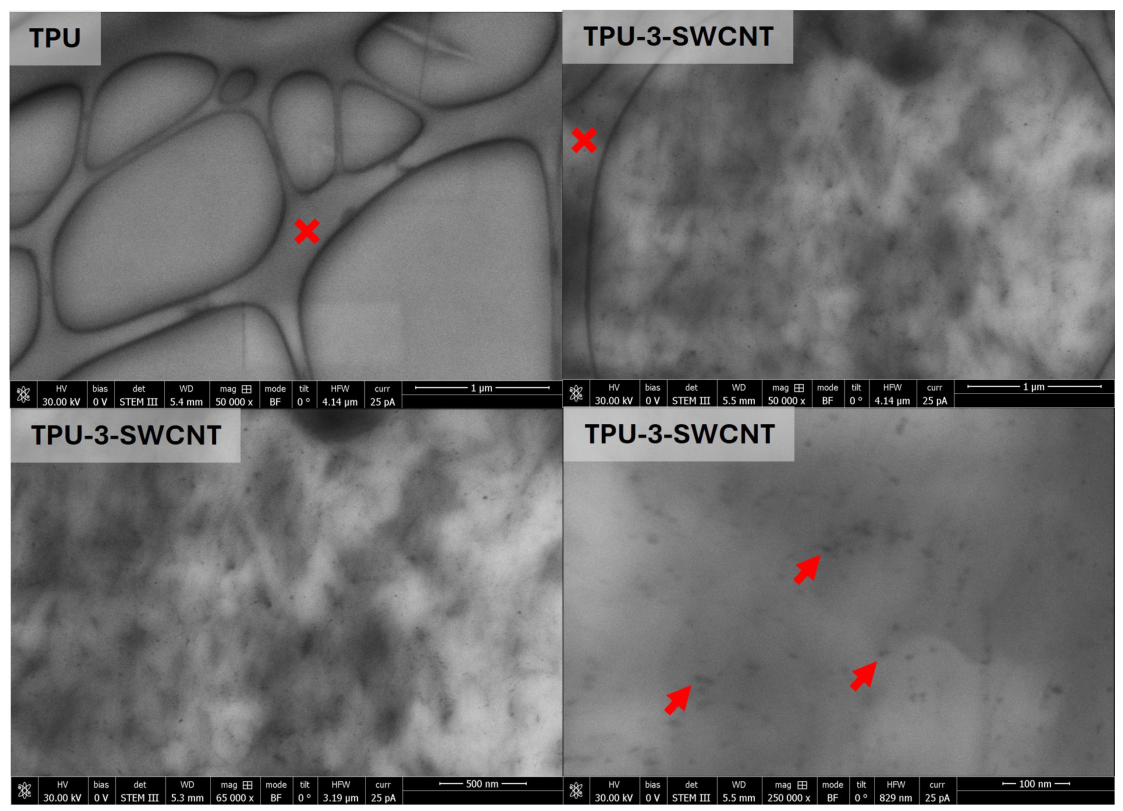
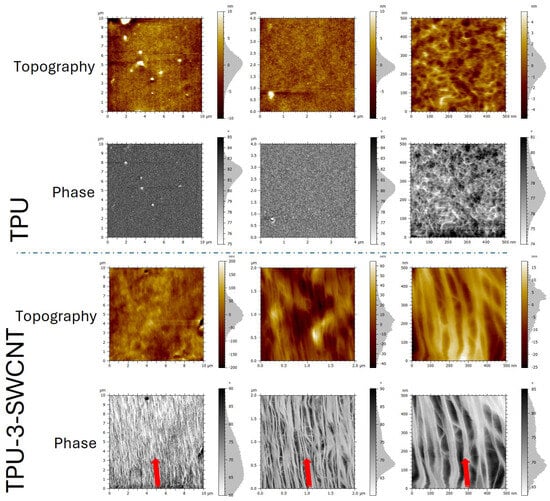
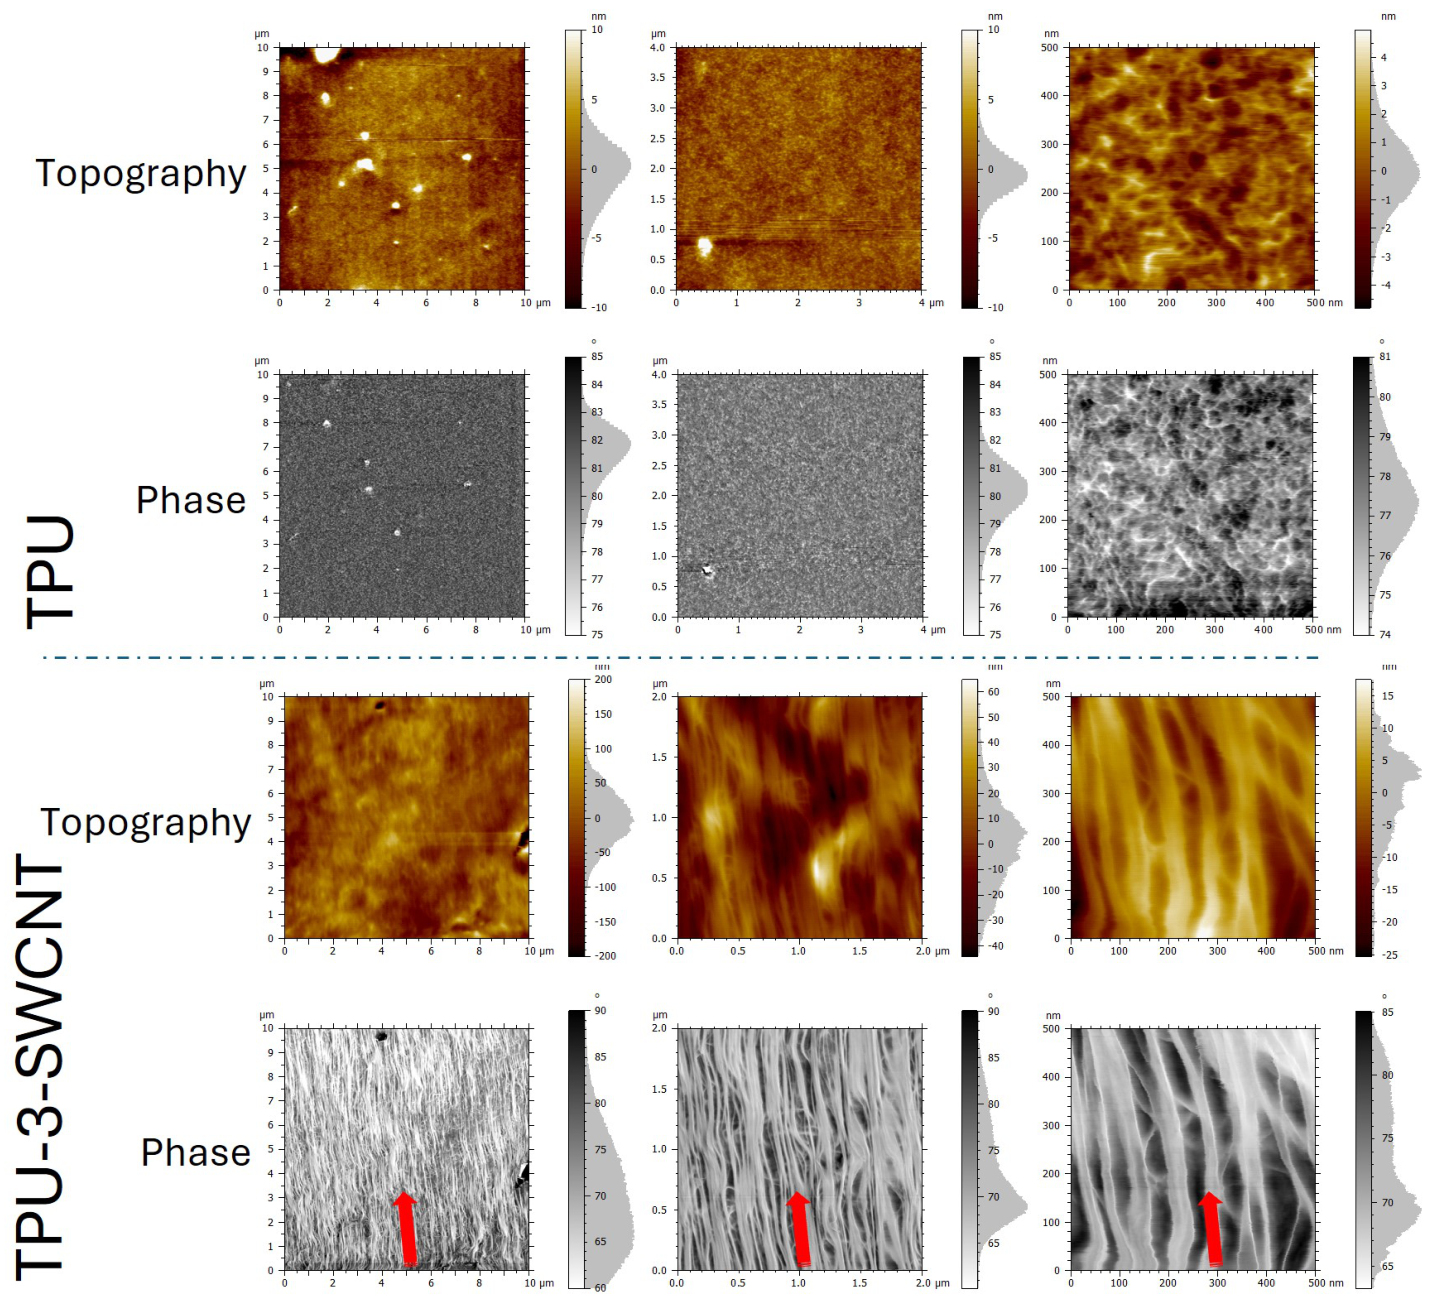
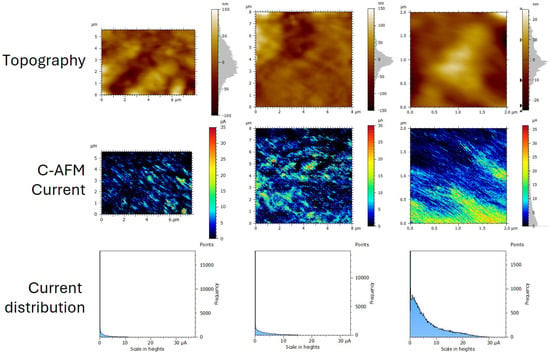
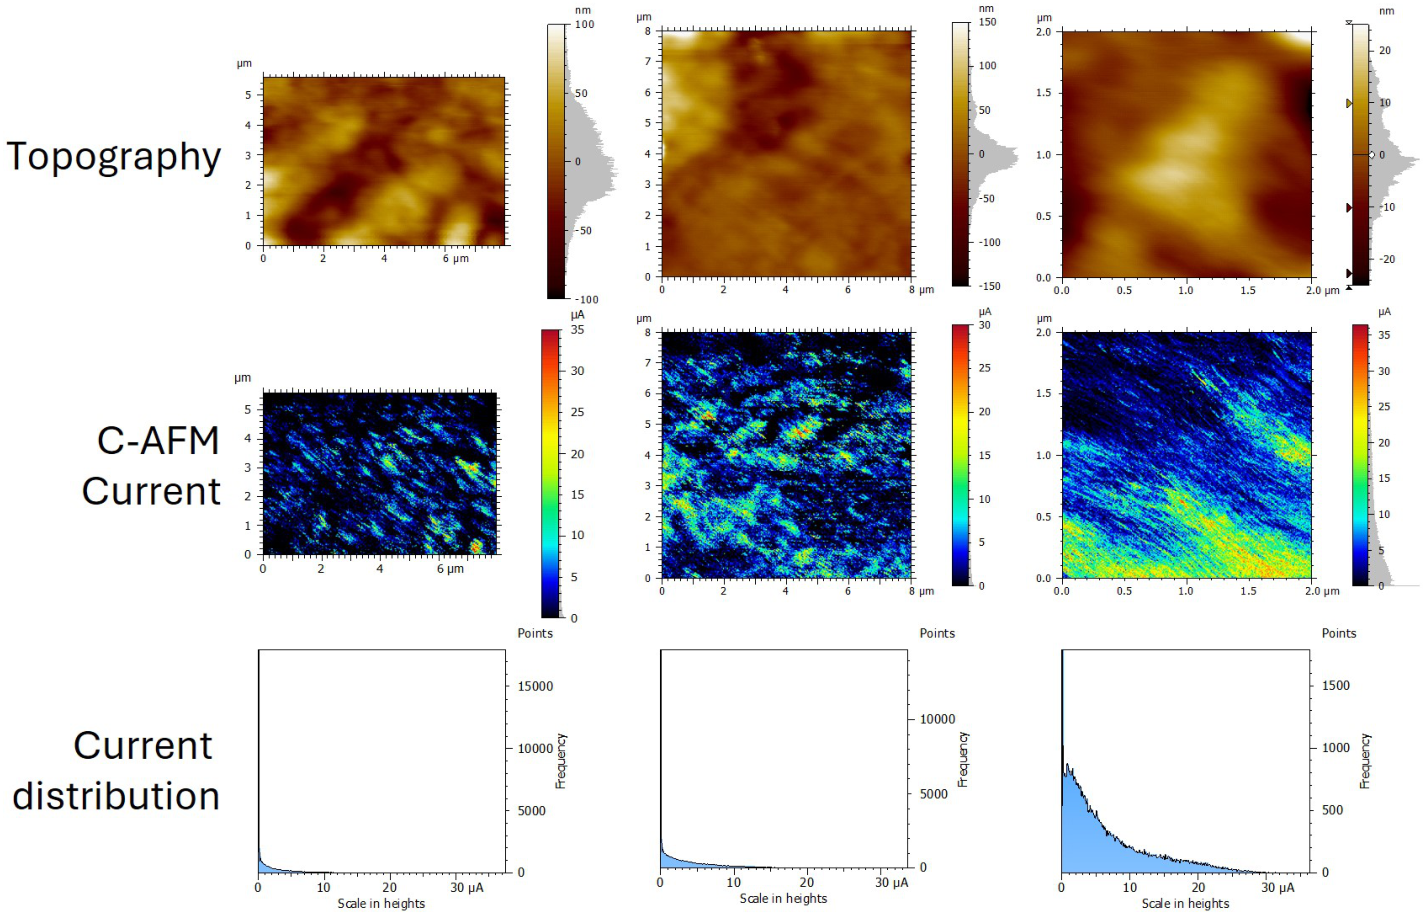
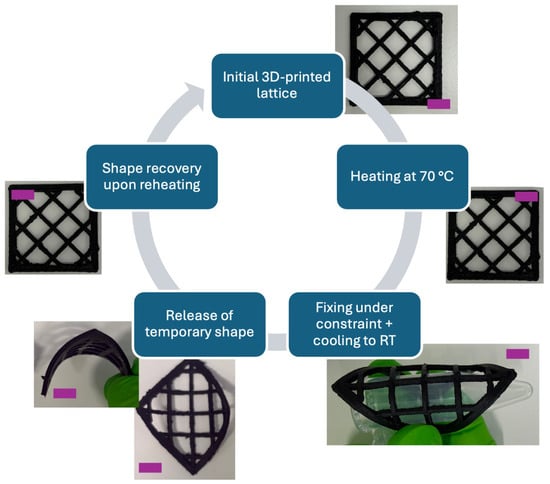
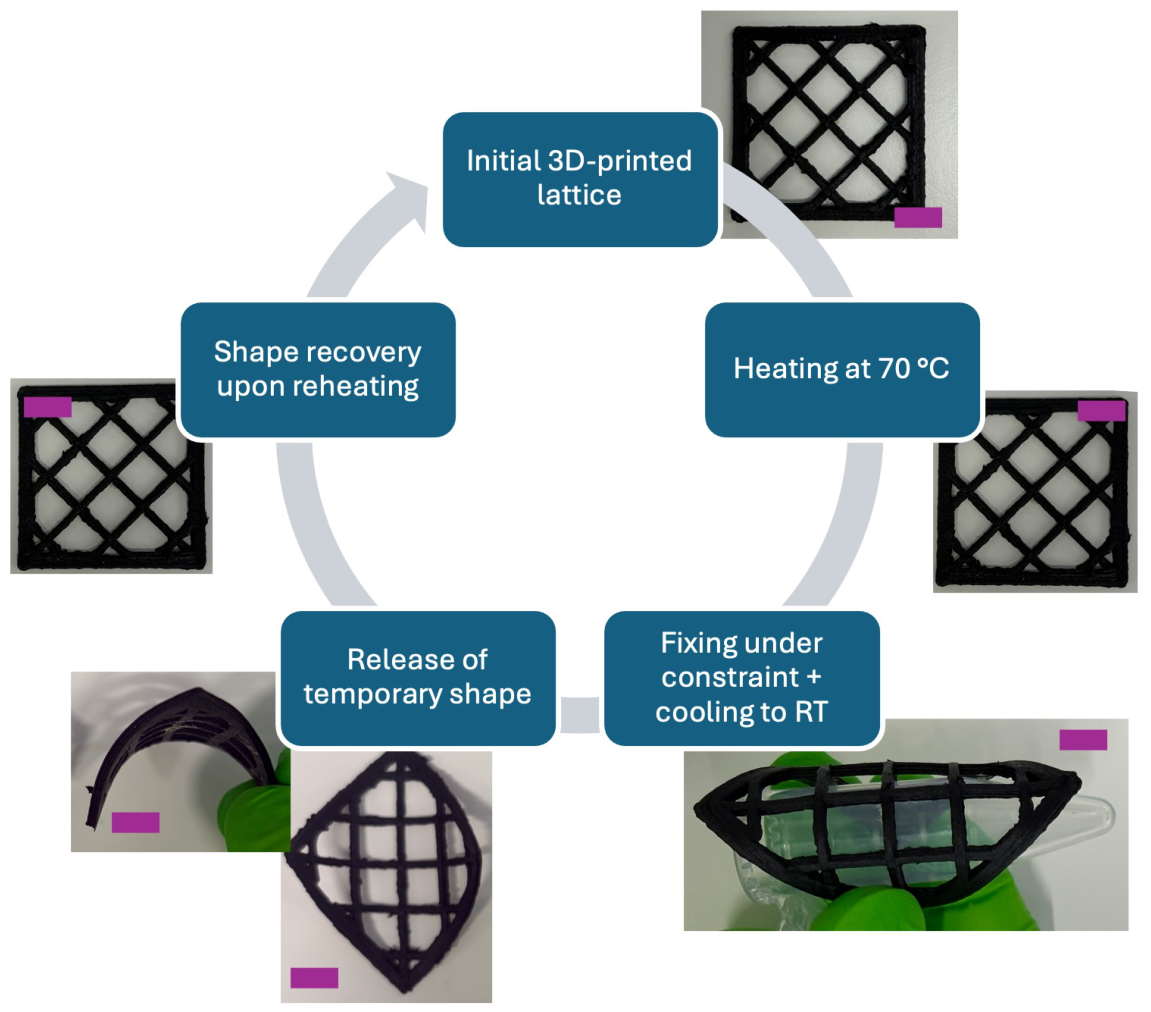

Disclaimer/Publisher’s Note: The statements, opinions and data contained in all publications are solely those of the individual author(s) and contributor(s) and not of MDPI and/or the editor(s). MDPI and/or the editor(s) disclaim responsibility for any injury to people or property resulting from any ideas, methods, instructions or products referred to in the content. |
© 2026 by the authors. Licensee MDPI, Basel, Switzerland. This article is an open access article distributed under the terms and conditions of the Creative Commons Attribution (CC BY) license.