


Abstract
To address the joint optimization problem of mesh partition and direction decision in complex surface spray trajectory planning, a partition and direction planning method using a dual-layer ant colony optimization (ACO) is proposed. The inner layer over-segments with a minimal dihedral angle threshold to ensure boundary closure, performs hierarchical merging using multi-feature distance, and then employs ACO to detect missed boundaries in smooth-transition regions. The outer layer pre-determines trajectory patterns based on partition geometric features, searches for the optimal direction combination via ACO, and feeds back the objective function to adjust the inner-layer merging parameters, achieving two-layer collaborative optimization. Experiments demonstrate that the method achieves favorable results on meshes from different sources. ACO boundary optimization adds 920 new partitions on the scanned mesh, reliably identifying smooth-transition boundaries. The direction deviation of 88.5% of partitions does not exceed 24 degrees. Ablation experiments verify the irreplaceability of each module.
1. Introduction
1.1. Research Background and Problem
Automated trajectory planning on complex surfaces is a key link in the digital transformation of manufacturing, encompassing spray painting, machining, additive manufacturing, and surface inspection [1,2,3,4,5,6]. These tasks typically decompose trajectory planning into region partitioning, direction decision, and path generation as three progressive stages, where direction decision determines the dominant travel direction and trajectory pattern for each sub-region, serving as the key link between region partitioning and path generation—if the direction decision mismatches the surface geometric features, the generated paths will still produce distortion in high-curvature regions and excessive idle travel between partitions regardless of path generation sophistication. In spray painting and other typical surface operations, automated direction planning offers significant advantages over manual planning, including high direction consistency and good repeatability [2,3,4,5], and has been widely applied to complex surface components such as automotive bodies, aircraft skins, and volute casings, imposing higher requirements on the accuracy and geometric adaptability of direction decision.
The core difficulty in complex surface spray direction planning lies in the deep coupling between region partitioning and direction decision, while existing methods treat them as independent sequential stages [7]. Once partitioning results are determined, they cannot be adjusted; however, the numbers of partitions and boundary positions directly determine the feasible region structure of candidate directions for each patch, and the global evaluation of direction combinations in turn affects the rationality of the partitioning scheme. This unidirectional sequential processing prevents the partitioning stage from anticipating the requirements of direction optimization, while the direction optimization stage cannot rectify unreasonable partitions, constituting a theoretical joint optimization dilemma.
This dilemma is further exacerbated at the geometric level. Region growing and similar methods employ dihedral angle thresholds to determine adjacency between neighboring facets [8], performing well on high-quality meshes. However, on three-dimensionally scanned meshes, surface transitions are often smooth, and a single threshold cannot accurately distinguish true boundaries from intra-surface transitions, leading to incomplete boundary closure and partition distortion. The boundary detection distortion propagates directly to the direction decision stage, causing subsequent optimization to proceed on incorrect partition structures, making it difficult to achieve globally optimal direction combinations. Meanwhile, direction decision itself exhibits a disconnect: existing methods only output direction vectors without simultaneously determining the trajectory pattern suited to each patch, leaving the compatibility between direction and pattern entirely ignored during optimization.
The above analysis indicates that the boundary detection quality of partitions, the geometric adaptability of directions, and the collaborative relationship between the two layers are mutually constraining and cannot be solved independently in a stepwise manner. This paper models the composite problem as a weighted optimization problem with coverage , achievement , and idle stroke as objectives: min F(T) = + + , where coverage measures the global conformance between directions and surface geometric features, achievement measures the matchability between directions and trajectory patterns, and idle stroke measures the overall operation efficiency. This model treats the partition result P, direction set Θ, and trajectory pattern labels M* as joint decision variables, establishing a feedback relationship between the two layers through the objective function F(T), enabling partition granularity to adaptively serve the global objectives of direction planning. Figure 1 illustrates this comparison between the serial and collaborative modes.
Figure 1.
Comparison between serial mode and collaborative mode.
1.2. Proposed Method and Contributions
To address the above problems, this paper proposes a complex surface spray partition and direction planning method using dual-layer ant colony optimization. The inner layer is a hybrid partitioning method combining region growing with ACO, and the outer layer is trajectory direction optimization driven by ACO. The two layers collaborate through unidirectional transfer of partition results and quality feedback. The main contributions include four aspects.
(1) An ACO boundary-optimized region growing partitioning method is proposed. ACO is introduced into mesh boundary detection: ants walk along mesh edges, pheromone accumulates on true boundary edges, and boundaries are extracted via percentile thresholding. This method introduces ACO into mesh boundary detection within the context of trajectory planning on complex surfaces, rather than traditional clustering, reliably identifying smooth-transition boundaries missed by single thresholds.
(2) A hybrid partition framework with region growing and ACO boundary optimization is constructed, along with a dual-layer collaborative mechanism. A two-stage strategy of over-segmentation and iterative merging reduces redundant partitions using multi-feature distance. ACO serves as a boundary detector in the inner layer and a combinatorial optimizer in the outer layer, with inner-layer partitions driving outer-layer optimization and outer-layer quality feedback adjusting inner-layer parameters.
(3) The method is validated on 61 partitions of a high-quality mesh and a scanned mesh containing 2.83 million facets. Ablation experiments show that ACO boundary optimization increases scanned mesh partitions by 58%, with an average direction deviation of 12.3 degrees.
2. Related Work
2.1. Complex Surface Trajectory Planning
Research on complex surface trajectory planning is typically organized around region partitioning, direction decision, and path generation. Li et al. [9] proposed a five-axis scanning inspection path planning method. Wang et al. [10] constructed a digital twin-driven 3D path planning framework. Chen et al. [11] generated robotic flank milling tool paths through smoothness and stiffness optimization. In region partitioning, Zhang et al. [12] proposed a curvature-analysis-based spray patching method for large-curvature surfaces, but the patch boundaries exhibit jaggedness that affects path continuity. Shi et al. [13] performed region segmentation based on point cloud slicing, which improved trajectory continuity but did not incorporate geometric features into the segmentation criteria. In direction decision, Jiang et al. [14] generated spray paths based on visual recognition, determining traversal directions using surface geometric features, but lacking global direction-change cost optimization. Zhu et al. [7] introduced a multi-scale genetic algorithm for comprehensive optimization of spray trajectories; however, their partitioning and direction decision remain in a serial mode, limiting the reachable space of globally optimal solutions.
In path generation, Yang et al. [8] proposed a surface segmentation optimization method based on region growing and secondary aggregation, combining NURBS surface fitting to generate spray paths. Gleeson et al. [15] generated optimized spray trajectories based on CAD models. Chen et al. [16] achieved free-surface spray gun trajectory planning using CAD guidance. Nieto et al. [17] and Khan et al. [18] achieved autonomous trajectory planning on complex surfaces based on point cloud models [19,20]. All of the above studies output specific path point coordinate sequences, belonging to the path generation level rather than the direction decision level. Recent studies have further explored direction optimization on complex surfaces. Verduyn et al. [21] proposed a shape-based path adaptation method for robotic spray painting, computing occlusion-free spray directions on triangular surface representations by minimizing the maximum impact angle across facet sets. Nieto and Lin [17] developed an autonomous trajectory planning framework for spray painting on point-cloud-based complex surfaces, incorporating a paint deposition model and geometric feature-guided direction selection. More recently, learning-based approaches such as MaskPlanner [22] have demonstrated object-centric motion generation for robotic spray painting, generating full 6-DoF paths from point cloud inputs in milliseconds. Despite these advances, most existing methods treat direction determination as embedded within the path generation pipeline rather than as an independent optimization level, leaving the coupling between region partitioning and direction decision largely unaddressed. Existing research rarely treats direction decision as an independent optimization problem separated from path generation, and this research gap is precisely the entry point of this paper.
2.2. Triangular Mesh Segmentation Methods
Triangular mesh segmentation is a fundamental problem in computer graphics. Among existing methods, region growing starts from seed facets and gradually expands using geometric similarity of adjacent facets, which is simple to implement but highly dependent on the choice of threshold, and prone to incomplete boundary closure on meshes with smooth transitions at surface junctions [8]. Jiao et al. [23] proposed a self-supervised clustering-based 3D mesh segmentation network. Mu et al. [24] proposed a multi-stage clustering-based mesh segmentation method for mechanical models. Yang et al. [25] achieved surface segmentation and weld extraction on noisy point clouds containing multiple quadrics. Graph-based segmentation methods convert meshes into graph structures and use spectral clustering or graph cut algorithms to optimize segmentation boundaries, yielding good boundary quality but with high computational complexity, making them difficult to apply to large-scale meshes. Deep learning-based methods such as MeshCNN learn facet features through convolutional networks, achieving high segmentation accuracy but requiring large amounts of annotated data with limited generalization capability. In recent boundary detection studies, Moon et al. [26] proposed an interactive mesh segmentation method based on a concavity-aware harmonic field and anisotropic geodesics, enabling precise feature region boundary extraction. Tsiapkolis and Bénard [27] introduced a patch decomposition approach using normal cones and bounding spheres for efficient mesh contour extraction, improving the speed of boundary identification on large models. For CAD meshes, Shen et al. [28] combined region growing with surface primitive fitting, using fitting error to guide boundary placement and improving the geometric consistency of segmentation results. These advances show that boundary detection remains an active research direction, but most methods are designed for general graphics applications and do not consider the specific requirements of spray trajectory planning scenarios.
In the context of spray painting applications, region growing is favored for its high computational efficiency and clear physical interpretation, but the limitations of single-threshold approaches are prominent in practical engineering. This paper introduces ACO for boundary optimization on the basis of region growing and adopts a hierarchical multi-feature merging strategy, thereby overcoming the deficiencies of single thresholds.
2.3. ACO Applications and Positioning of This Work
The ant colony optimization algorithm, proposed by Dorigo et al. [29] in 1996, exhibits characteristics such as positive feedback, distributed computation, and strong robustness and has been widely applied in the traveling salesman problem, job-shop scheduling, and path planning. However, standard ACO suffers from slow convergence and premature convergence in high-dimensional solution spaces. Researchers have made improvements in three directions: heuristic information enhancement, pheromone update mechanism improvement, and multi-objective extension. Mutti et al. [30] nested ACO with the whale optimization algorithm for multi-robot task pose optimization. Yang et al. [31] proposed a dynamic evaporation coefficient strategy to enhance optimization capability. Xie et al. [32] proposed an uneven pheromone allocation strategy to improve search efficiency. Xue et al. [33] proposed a multi-objective ACO using multiple pheromone matrices to solve the Pareto frontier.
Although the above improvements have achieved significant progress, most existing ACO improvement research focuses on a single optimization level and rarely targets customized improvements for complex surface spray scenarios. In broader ACO applications, multi-level or two-layer frameworks have recently gained attention for addressing complex coupled optimization problems. Ashour et al. [34] proposed a hybrid multi-level ACO framework for integrated production scheduling and vehicle routing, decomposing the problem into two collaborative stages where upper-level scheduling decisions guide lower-level route optimization. Chang et al. [35] introduced an ICBBA-ACO bi-layer framework for multi-robot task allocation, where the upper layer performs task clustering and the lower layer refines route sequences, with quality feedback flowing between layers. These studies demonstrate that layered ACO architectures can effectively handle problems with coupled decision variables, which aligns with the motivation of the present work. This paper innovatively applies ACO to mesh boundary detection, which is fundamentally different from traditional ACO clustering or path planning.
The core distinctions between the proposed method and existing research can be summarized as follows. Regarding research level, this paper focuses on the direction decision level, outputting direction vectors and trajectory pattern labels as priors for downstream path generation, rather than directly generating path point coordinate sequences. For segmentation method, a hybrid strategy of region growing and ACO boundary optimization is adopted, rather than pure geometric thresholds or pure ACO clustering. Regarding the collaboration mechanism, two-layer collaboration is achieved through unidirectional transfer of partition results and quality feedback, rather than serial independent processing. For pattern matching, trajectory pattern geometric matching is embedded in the direction optimization process rather than as a post-processing step.
3. Problem Modeling
3.1. Problem Description
The complex surface trajectory direction planning problem studied in this paper takes as input a triangular mesh model M = (V, F), where V is the vertex set and F is the triangular facet set. Each facet is associated with a unit outward normal , principal curvatures and , the maximum principal curvature direction , and the geometric center coordinate . The above differential geometric operators follow those defined by Meyer et al. [36]. Additionally, the user pre-specifies the trajectory pattern label set = {, , …, } per task requirements, serving as pattern constraints for direction optimization.
Under the above input conditions, the goal of direction planning is to determine the dominant direction and adapted pattern for each sub-region of the triangular mesh. The algorithm outputs the partition result P = {, , …, }, satisfying ∪ = M and ∩ = ∅ (i ≠ j); the dominant direction angle set Θ = {, , …, θ_K} in the tangent plane for each patch; and the recommended trajectory pattern set M* = {, , …, }, where ∈ .
This paper focuses on the direction decision level, outputting direction vectors and trajectory pattern labels to provide high-level semantic constraints for downstream path generation, without generating specific spray path points or involving path point generation and kinematics. The complexity of this problem stems from the deep coupling between geometric characteristics and direction constraints. The local curvature distribution of a surface determines the feasible region of candidate directions and the adaptation tendency of trajectory patterns, while the direction-change cost and idle stroke length of the global direction combination depend on the topological structure of partition boundaries. These two aspects constitute an inseparable joint optimization problem.
3.2. Multi-Objective Optimization Model
Let the decision variable be the joint partition–direction–trajectory pattern scheme T = (P, Θ, M*), and the optimization objective is to minimize the weighted objective function:
where is the coverage objective, is the achievement objective, is the idle stroke objective, and , , are weight coefficients.
Coverage measures the global conformance between the spray direction and the local maximum principal curvature direction within each patch:
where is the unit direction vector corresponding to direction angle , and is the maximum principal curvature direction of facet . A smaller indicates higher coverage, better conformance between directions and principal curvature directions, and better global consistency of the direction field on the surface.
Achievement measures the matchability between directions and trajectory patterns:
where M′ is the non-Mixed pattern subset of the input pattern set, Mixed denotes regions that cannot match any preset pattern, match(, m) is the geometric matching degree between patch and trajectory pattern m, λ is the Mixed pattern penalty coefficient, and 1(·) is the indicator function. A smaller indicates higher matchability between directions and trajectory patterns.
For patterns requiring direction consistency, such as parallel-line patterns, the matching degree is defined as
where is the patch circularity, = 4π/2, is the area, is the perimeter, and is the metric that measures the average cosine of the angle between each facet’s maximum principal curvature direction and the patch’s average principal direction. Regions with lower circularity and better principal direction consistency are more suitable for this pattern type.
For patterns requiring circumferential coverage, the matching degree is defined as
where is the average Gaussian curvature of the patch and is the average maximum principal curvature of the surface. Regions with higher circularity and smaller absolute Gaussian curvature are more suitable for this pattern type.
The idle stroke objective measures the length ratio of non-spray segments in the global spray path:
where is the total length of transfer paths between patches and is the spray path length within the k-th patch. A smaller indicates a lower non-spray idle stroke ratio and higher overall operation efficiency.
This paper employs the Analytic Hierarchy Process (AHP) to calibrate the weights of the three objectives. In constructing the judgment matrix, according to the priority relationship among objectives in trajectory planning, coverage directly determines the conformance between directions and surfaces and is the most important indicator; achievement affects the executability of trajectory patterns and is of secondary importance; idle stroke mainly affects efficiency and is of relatively minor importance under the premise of quality assurance. The consistency check yields the calibrated weights , , , with specific values given in Section 5.1.
3.3. Constraint Conditions
In the direction planning problem, the direction planning scheme must satisfy the following constraints.
The angle between the dominant spray direction of each patch and the average maximum principal curvature direction within the patch must not exceed threshold :
where _k^maj is the area-weighted average of the maximum principal curvature directions of all facets in patch , and is the principal curvature adaptation angle threshold. When the spray direction deviates excessively from the principal curvature direction, the direction field produces significant distortions in locally undulating regions of the surface, leading to loss of path geometric consistency.
The recommended trajectory pattern for each patch must be geometrically compatible. Specifically, the candidate direction must be compatible with at least one non-Mixed trajectory pattern, with compatibility jointly determined by patch circularity, Gaussian curvature, and principal direction consistency:
where is the trajectory pattern feasibility threshold. When the matching degree of a patch with all non-Mixed trajectory patterns falls below this threshold, the region should be labeled as Mixed pattern. This constraint ensures that the algorithm’s output trajectory pattern scheme is geometrically feasible, preventing the assignment of geometrically incompatible patterns to unsuitable patches.
The characteristics of the proposed model are reflected in three aspects. At the objective level, a three-objective system is constructed with AHP-calibrated weights. At the constraint level, two geometric constraints, namely principal curvature adaptation and trajectory pattern feasibility, are focused upon, without including kinematic constraints such as turning angle and path avoidance that belong to the path generation level. At the coupling level, the partition result P, direction set Θ, and trajectory pattern labels M* are treated as joint decision variables rather than being solved in a stepwise serial manner. The partition result P directly determines the feasible region structure of candidate directions for each patch and the adaptation tendency of trajectory patterns, while the objective function value F(T) of the global direction combination in turn acts on the partitioning scheme. When F(T) is high, it indicates that the current partition granularity is unsuitable for the global objectives of direction planning, requiring adjustment of the merging parameters to change the partition granularity. This coupling relationship is the theoretical foundation of two-layer collaborative optimization.
4. Partition and Direction Planning Method Based on Dual-Layer ACO
4.1. Overall Architecture
Section 3 formulated partitioning and direction as a joint optimization problem, but the high-dimensional coupling characteristics of this model make traditional alternating optimization methods prone to local optima. The dual-layer ACO architecture proposed in this paper is shown in Figure 2. The inner layer is responsible for mesh partitioning: first, region growing over-segmentation is performed with a minimal dihedral angle threshold to achieve complete boundary closure; then, over-segmented small regions are iteratively merged using multi-feature distance; finally, ACO is introduced to walk along mesh edges for boundary detection, compensating for missed boundaries in smooth-transition regions. The outer layer is responsible for direction planning: candidate directions are generated and filtered based on partition geometric features, trajectory patterns are pre-determined for each partition, and ACO is used to search for the optimal direction combination.
Figure 2.
Overall architecture of the dual-layer ACO.
The two layers collaborate through unidirectional transfer of partition results and quality feedback. The partition result P output by the inner layer drives the outer-layer direction optimization, and the objective function value F(T) from the outer-layer optimization is fed back to the inner layer to adjust the distance threshold of hierarchical merging. This feedback loop enables partition results to adaptively serve the global objectives of direction planning.
4.2. Region Growing Over-Segmentation
Region growing over-segmentation is the first stage of inner-layer partitioning, designed to guarantee that all true boundaries are fully identified using a minimal dihedral angle threshold, producing a large number of closed initial small regions.
where φ(i, j) is the dihedral angle between adjacent facets i and j, and and are the unit outward normals of the corresponding facets.
4.3. Hierarchical Multi-Feature Merging
The initial regions produced by over-segmentation typically far exceed the target partition count, and iterative merging is needed to reduce the number of regions to a reasonable range. This paper designs a multi-feature distance-driven hierarchical merging strategy, fusing three features: normal difference, curvature difference, and boundary strength.
where |EAB| is the set of shared edges between regions A and B, and and are the representative normals of the regions on either side of shared edge e. The normal difference measures the deviation in normal direction between two regions. The curvature difference is the normalized difference in average curvature of boundary vertices between regions A and B:
where is the average curvature of boundary vertices of region A and is the maximum vertex curvature of the mesh. The curvature difference measures the variation in curvature distribution between two regions. The boundary strength measures the significance of feature changes at the shared boundary between two regions:
The iterative merging strategy is divided into two phases. In the first rounds, the merging distance of all adjacent region pairs is computed each round, and the pair with the smallest distance is merged into a new region, with adjacency relations and region features updated. The features of the merged region are the area-weighted average of the two sub-regions. In the subsequent rounds of small-region post-processing, regions with area below the threshold are merged into the adjacent region with the smallest multi-feature distance. Convergence is determined when the region count stabilizes or reaches the target range [, ].
4.4. ACO Boundary Optimization
4.4.1. Motivation and Approach
After hierarchical merging, most partition boundaries have been correctly identified, but at surface junctions on three-dimensionally scanned meshes, due to smooth surface transitions, the dihedral angle gradient is small, and some true boundaries remain missed, leading to incomplete boundary closure or region mis-merging. This paper models boundary detection as a swarm intelligence problem: ants walk along mesh edges, edges with high curvature and large dihedral angles have greater heuristic attraction, pheromone gradually accumulates on these potential boundary edges, and boundaries are ultimately extracted via percentile thresholding. This method applies ACO to mesh boundary detection within the context of complex surface trajectory planning, and can reliably identify smooth-transition boundaries missed by single thresholds.
The collective search mechanism of ACO is inherently suited for boundary detection in noisy environments. Unlike single-threshold methods that rely on local geometric features, ants cooperate indirectly through pheromones, enabling boundary topology identification at a global scale. When some boundaries exhibit weak dihedral angle variations due to gradual curvature changes, ants can still accumulate pheromones along true boundaries through the positive feedback effect, thereby detecting transition boundaries missed by threshold-based methods.
4.4.2. Pheromone Initialization and Heuristic Information
An initial uniform pheromone is assigned to all mesh edges. The heuristic information η(e) of each edge e combines dihedral angle and curvature difference:
where (e) is the normalized dihedral angle, κ() and κ() are the curvatures at the two endpoints of edge e, is the maximum vertex curvature of the mesh, and and are weight coefficients. A larger η(e) indicates that edge e is more likely to be a true boundary, with stronger attraction to ants.
The design of heuristic information combines dihedral angle and curvature difference, and their complementarity is key to effective guidance. The dihedral angle reflects normal vector mutations between adjacent facets, providing strong detection capability for sharp boundaries in CAD-exported meshes. However, in the smooth-transition regions of scanned meshes, the dihedral angle gradient is small, and using it alone tends to cause omissions. The curvature difference supplements vertex-level geometric mutation information, capturing gradual boundaries that the dihedral angle cannot distinguish. The weighted combination enables the heuristic information to provide effective boundary guidance across different mesh types.
4.4.3. Ant Path Construction
In each iteration, m ants are deployed, each starting from a random seed vertex and transitioning along mesh edges. The transition probability from vertex v along edge e to adjacent vertex v’ is
where τ(e) is the pheromone concentration on edge e, η(e) is the heuristic information, α and β are the pheromone heuristic factor and expectation heuristic factor respectively, and N(v) is the set of adjacent edges of vertex v. Ants preferentially traverse edges with high pheromone and high heuristic value, i.e., potential true boundaries. The path termination condition is returning to the starting point to form a closed path or reaching the maximum number of steps .
4.4.4. Pheromone Update
After each iteration, all edges first undergo pheromone evaporation, then ants that have completed closed paths deposit pheromones:
where ρ is the pheromone evaporation coefficient, Q is the pheromone intensity constant, and is the path length of the k-th ant. Shorter paths with concentrated boundary features receive more pheromone deposition. After iterations, the pheromone concentration on true boundary edges is significantly higher than on non-boundary edges.
The pheromone update strategy employs an asymmetric deposition mechanism weighted by path quality. Ants that complete closed paths deposit pheromones proportional to Q/, meaning shorter paths with more concentrated boundary features yield higher pheromone increments per unit length. This mechanism enables true boundaries to continuously accumulate pheromones due to frequent ant traversal, while noise edges receive less deposition due to low path quality, and their concentration further decreases through evaporation coefficient rho. After multiple iterations, the pheromone concentration gap between true boundaries and noise edges gradually widens, forming a stable positive feedback separation effect.
4.4.5. Boundary Extraction and Re-Segmentation
The selection of the percentile threshold is from the statistical distribution characteristics of pheromone concentrations. After iteration, the pheromone concentration of true boundary edges concentrates in the high-end region of the distribution, while noise and internal edge concentrations cluster in the low-end region. A higher percentile for means only edges with pheromone concentration significantly above the mean are retained as ACO-detected boundaries. For meshes with varying curvature distributions, can be adjusted according to the sparsity of the pheromone distribution to balance detection rate and false positive rate.
After iteration, the percentile of pheromone concentration on all mesh edges is taken as the global threshold:
Edges with pheromone concentration above are marked as ACO-detected boundaries. The ACO boundaries are merged with boundaries already identified in the hierarchical merging stage to form a complete boundary set. Region growing segmentation is then re-executed based on the merged boundaries, with closed boundaries serving as barriers to prevent growth across them, outputting the final partition result P = {, , …, }. This step effectively compensates for smooth-transition boundaries missed in the hierarchical merging stage, significantly improving boundary closure of partitions.
4.5. ACO Trajectory Direction Optimization
4.5.1. Candidate Direction Generation
For each partition output by the inner layer, the patch reference direction vector is computed as the area-weighted average of the maximum principal curvature directions of all facets in the patch:
Using _k^maj as the center direction, a fan-shaped sampling interval of ± is constructed in the local tangent plane of the partition, with equal-angle discrete sampling at step size Δθ:
After generating candidate directions, they are screened against the constraint conditions in Section 3.3. Directions that deviate from the patch’s average principal curvature direction by more than are eliminated, and the geometric compatibility of candidate directions with pre-determined trajectory patterns is checked. The filtered candidate direction subset is used for subsequent ACO.
4.5.2. Trajectory Pattern Pre-Determination
For each partition , the adaptation degree to each pattern in the input pattern set is computed using geometric features. For direction-consistency pattern , the adaptation degree is defined as
where is the patch circularity and is the principal direction consistency metric. Regions with lower circularity and better principal direction consistency are more suitable for this pattern type. For circumferential coverage pattern , the adaptation degree is defined as
where is the average Gaussian curvature of the patch, and is the average maximum principal curvature of the surface. Regions with higher circularity and smaller absolute Gaussian curvature are more suitable for this pattern type. The pattern with the highest adaptation degree is selected as the pre-determination result ; if the adaptation degrees of all non-Mixed patterns are below , the patch is labeled as Mixed pattern.
4.5.3. ACO Direction Combination Optimization
The outer-layer ACO uses partitions as nodes and inter-patch direction-change costs as edges to construct a state transition graph for direction combination optimization. The transition probability of an ant moving from partition to partition is
where is the inter-patch pheromone concentration, is the direction-change heuristic function, N′(k) is the set of partitions not yet assigned directions, and and are the pheromone heuristic factor and expectation heuristic factor respectively. The direction-change heuristic function simultaneously penalizes large-angle direction changes and long-distance transfers:
where is the difference between direction angles of adjacent patches, d(, ) is the geometric center distance between patches, and is the maximum diagonal length of the mesh.
Pheromone update employs a clamping strategy to prevent any single path from monopolizing selection due to excessive pheromone accumulation:
where clip(·) limits the pheromone concentration to the range [, ]. The time-varying evaporation coefficient ρ(t) maintains higher pheromone residue in the early search phase to reinforce quality paths, and accelerates evaporation in the later phase to enhance exploration capability:
The pheromone increment is determined by the fitness of the current best direction combination scheme:
where is the outer-layer pheromone intensity constant and F() is the weighted objective function value of the current best scheme. A smaller F() indicates a better scheme, resulting in a larger pheromone increment that accelerates convergence of quality paths. After an ant traverses all partitions, it forms a complete direction combination scheme. After iterations, the optimal direction combination * and trajectory pattern labels M* are output.
4.6. Collaborative Mechanism and Feedback Strategy
The collaborative mechanism of the dual-layer ACO includes two mechanisms: forward transfer and reverse feedback.
In forward transfer, the inner-layer partition result P = {, …, } serves as the input for outer-layer direction optimization. The partition count K and geometric features of each partition directly determine the feasible region structure of outer-layer candidate directions and the adaptation tendency of trajectory patterns. Higher partition quality leads to a more well-structured search space for outer-layer optimization.
In reverse feedback, the objective function value F(T) from outer-layer optimization is fed back to the inner layer to adjust the multi-feature distance threshold of hierarchical merging. The feedback strategy is
where γ is the feedback coefficient and is the reference objective value. When F(T) is high, indicating that the current partition scheme yields poor direction planning quality, is increased to tighten merging conditions, producing more and finer partitions that provide more flexible feasible regions for direction planning. When F(T) is low, is decreased to relax merging conditions and reduce redundant partitions. This feedback strategy enables partition granularity to adaptively serve the global objectives of direction planning.
The iteration termination condition is that F(T) shows no improvement for consecutive iterations or the maximum number of dual-layer iterations is reached. This “unidirectional transfer + parameter feedback” mechanism maintains the effectiveness of two-layer collaboration while avoiding the parameter sensitivity issues associated with bidirectional pheromone coupling.
4.7. Parameter Settings and Complexity Analysis
The dual-layer ACO involves approximately 15 core parameters, classified into three functional categories. Partition parameters include over-segmentation threshold , merging weights , , , minimum region area threshold , and boundary strength sub-weights and . ACO boundary optimization parameters include ant count m, iteration count , pheromone weight α, heuristic factor weight β, heuristic information weights and , evaporation coefficient ρ, pheromone intensity Q, and percentile threshold . Direction optimization parameters include pheromone weight , heuristic factor weight , sampling half-angle , sampling step size Δθ, evaporation base and upper limit , clamping bounds and , and feedback coefficient γ.
Let the total number of triangular facets be N, the average adjacency count be d, the initial over-segmentation region count be R (R << N), the partition count be K (K << R), the ACO ant count be m, and the iteration counts be and . The time complexity of each module is as follows.
The complexity of region growing over-segmentation is O(N · d), where each facet accesses its d adjacent facets to determine merging. The complexity of hierarchical multi-feature merging is O(R · log R), where each merging round requires sorting the distances of adjacent region pairs. The complexity of ACO boundary optimization is O( · m · ), where is the average ant path length. The complexity of ACO direction optimization is O( · · K2), where is the outer-layer ant count.
The overall time complexity is O(N · d + R · log R + · m · + · · K2). Since K is typically on the order of 102, the direction optimization complexity is much lower than the first three modules. The space complexity is primarily determined by the mesh adjacency matrix and pheromone matrix, at O(N · d). Since the adjacency matrix is highly sparse, sparse storage can significantly reduce actual memory usage.
5. Experiments and Analysis
5.1. Experimental Setup
The preceding chapters established the joint optimization model and designed the dual-layer ACO. This chapter verifies the solving effectiveness for each sub-problem through experiments. The experiments are conducted on Windows 11 with an Intel Core i7-12700H processor and 16 GB RAM. The core algorithm modules are implemented in C++ (Visual Studio 2022), and visualization uses Python 3.10 with the PyVista 0.43/VTK 9.3 library.
Two groups of triangular mesh models with different sources and complexity are used as test data. The first group is a high-quality mesh with 180,798 triangular facets and 90,577 vertices, featuring high surface quality with normal variations concentrated at surface junctions. The second group is a scanned mesh obtained through three-dimensional scanning, with 2,825,270 triangular facets and 1,412,615 vertices, featuring scanning noise and smooth surface transitions, posing greater challenges for mesh segmentation algorithms.
The input trajectory pattern set is defined as = {Parallel, Spiral}, corresponding to two typical spray trajectory patterns: parallel-line and spiral. Evaluation metrics include partition count, boundary vertex count and ratio, boundary closure rate, direction conformance deviation, pattern matching rate, and computation time.
The core parameters of the dual-layer ACO are listed in Table 1. The partition parameters control the granularity of region growing and hierarchical merging. The ACO boundary optimization parameters control the scale and convergence speed of ant search. The direction optimization parameters control the sampling density and pheromone update strategy of candidate directions.
Table 1.
Algorithm parameter settings.
5.2. Partition Experiments
Partition experiments are designed to verify the partition quality of the proposed “region growing + hierarchical merging + ACO boundary optimization” method. Experiments are conducted on both test models and compared with the STEP surface mapping method. The STEP surface mapping method utilizes parametric surface information to directly map to mesh facets, yielding relatively accurate partition results, but requires original model parameter information as a prerequisite.
5.2.1. High-Quality Mesh Partition Results
The STEP surface mapping method and the proposed method are applied to the high-quality mesh, with partition results shown in Table 2.
Table 2.
Quantitative comparison of partition results on high-quality mesh.
As listed in Table 2, STEP surface mapping produces 61 partitions, corresponding approximately to the number of parametric surfaces, with accurate partition boundaries. the proposed method produces 108 partitions, more than STEP mapping, because ACO detected transition boundaries at surface junctions that were missed by STEP mapping. However, for valid partitions, STEP mapping has 28, while the proposed method has 21, a decrease of seven or 25.0%. Meanwhile, the maximum partition vertex count increases from 13,873 to 19,220, indicating that the hierarchical merging strategy effectively integrated small transition surfaces into adjacent large continuous surfaces. The boundary vertex ratio increases from 12.2% to 14.9%, a small increment, indicating that the proposed method maintains a reasonable boundary density while refining boundary detection.
This result indicates that for the high-quality mesh, the proposed method detects fine transition boundaries while reducing the effective partition count from 28 to 21, with the maximum region area increasing by 38.6%, verifying the effectiveness of the proposed method in integrating transition surfaces. The integration of valid partitions, where the hierarchical merging strategy merges small transition surfaces into adjacent large regions, is beneficial for improving the direction consistency of the coverage objective . The visual comparison is presented in Figure 3.
Figure 3.
Comparison of partition results on high-quality mesh.
5.2.2. Scanned Mesh Partition Results
Since the scanned mesh contains 2.83 million triangular facets with scanning noise, its geometric complexity is significantly higher than that of the high-quality mesh, resulting in a correspondingly larger partition count, which is suitable for testing the method’s processing capability and boundary detection accuracy on high-density scanned meshes. The three stages of pure region growing, hierarchical merging, and ACO boundary optimization are applied sequentially to the scanned mesh to demonstrate the progressive improvement of each stage on partition quality. The results are shown in Table 3.
Table 3.
Comparison of partition results at each stage on scanned mesh.
As presented in Table 3, pure region growing with an automatically determined dihedral angle threshold of 3.06 degrees produces only 633 partitions with a boundary vertex ratio of only 4.2%. Although this threshold can identify major surface boundaries, a large number of true boundaries are missed due to smooth surface transitions on the scanned mesh, resulting in too few partitions and incomplete boundary closure.
The hierarchical merging stage iteratively merges small regions produced by over-segmentation using multi-feature distance, increasing the partition count to 1590 and the boundary vertex ratio to 12.7%. During merging, the normal difference, curvature difference, and boundary strength between adjacent regions are comprehensively evaluated, maintaining geometric consistency within merged regions while exposing more boundaries masked by smooth transitions.
The ACO boundary optimization stage further detects missed boundaries based on hierarchical merging, increasing the partition count to 2510 and the boundary vertex ratio to 16.3%. ACO adds 49,673 new boundary vertices, a 27.6% increase over the hierarchical merging stage. This increment directly demonstrates ACO’s ability to identify boundaries in smooth-transition regions: ants walk along mesh edges, accumulate pheromones on edges with high curvature and large dihedral angles, and ultimately extract boundaries not covered by the hierarchical merging stage via percentile thresholding. The three-stage comparison demonstrates that ACO boundary optimization provides the most significant improvement on the scanned mesh. This increment verifies ACO’s capability in solving the boundary detection sub-problem: the collective search behavior of ants walking along mesh edges can effectively detect smooth-transition boundaries missed by static thresholds. The three-stage partition results are visualized in Figure 4.
Figure 4.
Comparison of three-stage partition results on scanned mesh.
Further analysis indicates that the newly detected ACO boundaries are primarily located in gradual curvature transition zones and smooth-transition regions at surface junctions. In these regions, the dihedral angle variation gradient is small, and the hierarchical merging stage classifies them as intra-regional because the multi-feature distance fails to exceed the merging threshold. However, ACO ants can continuously accumulate pheromones along these weak feature edges, ultimately extracting them as boundaries through the percentile threshold. In contrast, fewer new ACO boundaries are detected on the high-quality mesh because the normal vector mutations at surface junctions are pronounced, and the hierarchical merging stage has essentially completed boundary identification. The ACO gain is primarily manifested in the noisy environment of scanned meshes.
5.3. Trajectory Direction Optimization Experiments
Based on the 61 partition results from STEP surface mapping of the high-quality mesh in Section 5.2, the outer-layer ACO is applied for trajectory direction and pattern optimization. The 61 partitions are divided into 13 groups, processed sequentially, with 5 partitions per group and 1 in the last group. For each partition, ACO performs combinatorial optimization on candidate directions, outputting the optimal direction angle and trajectory pattern label.
5.3.1. Trajectory Pattern Distribution
The trajectory pattern determination results for 61 partitions are shown in Table 4. The Spiral pattern is assigned to 41 partitions (67.2%), mainly distributed on rotational surface regions. The Parallel pattern is assigned to 20 partitions (32.8%), mainly distributed on planar and non-rotational surface regions.
Table 4.
Statistics of trajectory pattern distribution.
As given in Table 4, the average circularity of Spiral pattern partitions is 0.242, lower than that of Parallel pattern at 0.316, as expected: elongated rotational surfaces with low circularity are more suitable for circumferential spiral traversal. The average area of Spiral pattern partitions is 40,843 mm2, approximately 4.4 times that of Parallel pattern at 9374 mm2, indicating that rotational surface regions typically have larger areas. Among Spiral pattern partitions, 97.6% are identified as rotational surfaces, while in the Parallel pattern, only 5.0% are rotational surfaces, verifying the consistency between pattern pre-determination and geometric features.
5.3.2. Direction Optimization Results
Table 5 lists the direction optimization results for six representative partitions, covering different patterns, direction angles, and geometric features.
Table 5.
Direction optimization results of representative partitions.
As listed in Table 5, the optimal direction angles of Spiral pattern partitions are concentrated in the range [−12 degrees, 12 degrees], indicating that the spiral traversal direction of rotational surfaces deviates little from the geometric reference direction. For the Parallel pattern, partitions 38 and 41 have direction angles close to 0 degrees, indicating that their principal curvature direction is itself a favorable traversal direction. Partition 35 has a direction angle of −60 degrees; ACO significantly deviates from the reference direction to reduce the direction-change cost with adjacent partitions, reflecting the optimization role of the outer-layer ACO in global direction coordination.
5.3.3. Direction Deviation Analysis
The distribution of optimal direction angle deviations for all 61 partitions is shown in Table 6.
Table 6.
Distribution of optimal direction angle deviations.
As shown in Table 6, 47.5% of partitions (29) have direction deviations not exceeding 12 degrees, and 88.5% of partitions have deviations not exceeding 24 degrees, indicating that ACO-optimized directions are generally consistent with geometric reference directions. The 25 partitions with deviations in the [12 degrees, 24 degrees) range account for 41.0%, comprising mixed Spiral and Parallel regions where ACO made moderate adjustments to balance local direction conformance and global direction consistency. The seven partitions in the [48 degrees, 60 degrees] range account for 11.5%, all being Parallel pattern, where the reference principal curvature direction differs significantly from the direction of adjacent rotational surface regions. ACO made large adjustments to their directions to reduce direction-change costs, reflecting the global optimization strategy.
The summary of direction optimization results is shown in Table 7. As shown in Table 7, after ACO, all 61 partitions are successfully assigned preset trajectory patterns, with an average direction deviation of 12.3 degrees and an average adjacent partition direction-change angle of 16.6 degrees. The average deviation of the Spiral pattern at 7.9 degrees is significantly lower than that of the Parallel pattern at 21.4 degrees, indicating that direction optimization on rotational surfaces is closer to the geometric reference, while optimization on planar regions focuses more on global direction coordination. The average direction deviation of 12.3 degrees corresponds to the quantitative evaluation of the coverage objective , indicating that ACO-optimized directions are generally consistent with geometric reference directions. Figure 5 visualizes these direction optimization results.
Table 7.
Summary of direction optimization results.
Figure 5.
Direction optimization results on high-quality mesh.
The above results are positive at the method level. The reduction in direction deviation means improved conformance between the direction vector and surface geometric features, strengthening direction consistency; the reduction in inter-partition direction switching angle helps reduce geometric discontinuities at direction transitions, improving trajectory continuity. The automatic pattern determination enables regions with different geometric features to adopt the most suitable traversal mode—rotational surfaces use spiral traversal for continuous coverage, planar regions use parallel traversal for straight-line efficiency—globally reducing idle travel distance. The improvement in direction consistency provides a foundational guarantee for enhancing the overall quality of trajectory planning [4,6].
5.4. Ablation Experiments
To verify the contribution of each innovative module, ablation experiments are designed by removing key components individually and comparing with the complete method. Considering that different modules act at different levels, ablation experiments are evaluated at both the partition level and the direction level.
5.4.1. Removal of ACO Boundary Optimization
Variant V1 removes the ACO boundary optimization module, retaining only region growing over-segmentation and hierarchical multi-feature merging. This variant directly corresponds to the contribution of the ACO boundary optimization module, testing whether hierarchical merging alone is sufficient to identify all true boundaries in smooth-transition regions of the scanned mesh. The experiment is conducted on the scanned mesh, with results shown in Table 8.
Table 8.
V1 ablation experiment results.
As shown in Table 8, after removing ACO boundary optimization, the partition count decreases from 2510 to 1590, a reduction of 36.7%, and boundary vertices decrease from 229,556 to 179,883, a reduction of 21.6%. This significant decrease indicates that the hierarchical merging stage missed a large number of boundaries in smooth-transition regions: these boundaries have small dihedral angle change gradients and cannot be effectively identified by static thresholds of normal difference, curvature difference, and boundary strength alone. ACO, through the collective search behavior of ants on mesh edges, dynamically accumulates boundary feature pheromones and can detect boundaries missed by static thresholds, playing an irreplaceable role in partition quality on scanned meshes. This degradation corresponds to the contribution of the boundary strength term in the multi-feature merging distance: without ACO, merging based solely on static thresholds cannot dynamically identify boundary features in smooth-transition regions.
5.4.2. Removal of Hierarchical Multi-Feature Merging
Variant V2 removes the hierarchical multi-feature merging module and directly applies ACO boundary optimization to the region growing over-segmentation results. This variant verifies the role of the multi-feature distance merging strategy in reducing redundant over-segmented partitions and improving geometric consistency within regions. The experiment is conducted on the scanned mesh, with results shown in Table 9.
Table 9.
V2 ablation experiment results.
As shown in Table 9, after removing hierarchical merging, the partition count is 2613, close to the complete method’s 2510, with only a 4.1% increase. However, the region size distribution is severely imbalanced: the largest region contains 875,483 vertices, accounting for 62.0% of total vertices, while the median region size is only 74 vertices. This contrast indicates that without multi-feature distance-driven region merging, ACO can detect boundaries but cannot effectively integrate the 633 initial small regions produced by over-segmentation. A large number of redundant partitions with excessively small areas and poor geometric consistency are propagated to the direction optimization stage, while individual regions expand excessively. Hierarchical merging, by iteratively merging through multi-feature distance fusing normal difference, curvature difference, and boundary strength, reduces the region count to a reasonable scale while maintaining boundary closure.
5.4.3. Removal of Trajectory Pattern Matching
Variant V3 removes the trajectory pattern pre-determination module, uniformly assigning the trajectory pattern of all partitions to Parallel, without distinguishing between Spiral and Parallel using geometric features. This variant directly corresponds to the contribution of the pattern matching mechanism: for rotational surface regions, forcing parallel-line patterns instead of spiral patterns significantly reduces traversal efficiency. The experiment is based on the 61 partitions of the high-quality mesh, with impact assessed by recomputing the objective function. Results are shown in Table 10.
Table 10.
V3 ablation experiment results.
As shown in Table 10, after unifying all patterns to Parallel, the number of successfully matched partitions decreases from 61 to 20, accounting for 32.8%, and the achievement decreases from 1.000 to 0.328, a drop of 67.2%. The 41 partitions originally assigned as Spiral pattern are forced to Parallel, of which 40 are rotational surface regions with a mean circularity of 0.242. For rotational surfaces, parallel-line patterns require frequent direction changes to cover the circumferential surface, with far lower traversal efficiency than spiral patterns: spirals traverse continuously along the circumferential direction with smooth direction changes and fewer idle strokes. This result indicates that the trajectory pattern pre-determination mechanism has a decisive influence on direction planning quality, especially on models with a high proportion of rotational surfaces, where the absence of pattern matching leads to severe degradation of . This result verifies the sensitivity of achievement to trajectory pattern matching; removing the pattern matching module deprives the optimization model of geometric adaptation capability.
5.4.4. Removal of Feedback Mechanism
Variant V4 disables the pheromone feedback mechanism in the inner-layer ACO, eliminating both pheromone evaporation and deposition. Ants still walk along mesh edges using heuristic information, but the pheromone distribution remains at its initial state throughout all iterations. This variant isolates the contribution of the collective learning mechanism: without feedback, ACO cannot accumulate pheromones on true boundary edges, and the final boundary extraction relies solely on the initial boundary assignment from the over-segmentation stage. The experiment is conducted on the high-quality mesh to evaluate the feedback mechanism contribution to boundary discovery, with results shown in Table 11.
Table 11.
V4 ablation experiment results.
As shown in Table 11, after disabling the pheromone feedback mechanism, the partition count decreases by 27.0%, and the ACO new boundary edges drop to zero. This result indicates that without pheromone accumulation and evaporation, the ACO boundary optimization stage cannot modify the initial boundary assignment. This 27.0% decrease is smaller than the 36.7% decrease observed in V1 on the scanned mesh, consistent with the relatively smaller ACO contribution on high-quality meshes where hierarchical merging already identifies most boundaries. This result demonstrates that the pheromone feedback mechanism is the core driver for ACO to discover new boundary edges: the collective learning behavior through pheromone accumulation on frequently traversed edges, combined with evaporation that suppresses noise edges, creates a positive feedback separation between true boundaries and non-boundary edges. Removing this mechanism causes the algorithm to degenerate to the hierarchical merging baseline, verifying the irreplaceability of the feedback strategy in the ACO boundary optimization framework.
5.4.5. Overall Analysis of Ablation Results
V1 verifies the irreplaceability of ACO boundary optimization for partition quality on scanned meshes: after removal, the partition count decreases by 36.7%, and a large number of smooth-transition boundaries are missed. V2 verifies the critical role of hierarchical multi-feature merging for partition geometric consistency: after removal, although the partition count is similar (2613 vs. 2510, only 4.1% difference), the region size distribution is severely imbalanced, with the largest region occupying 62.0% of vertices and the median being only 74, indicating that simple merging based solely on dihedral angles cannot replace intelligent merging driven by multi-feature distance. V3 verifies the decisive influence of trajectory pattern matching on the direction planning objective function: after removal, achievement drops by 67.2%, and the traversal efficiency of rotational surface regions degrades severely. The four ablation variants verify the contributions of each module and key mechanism. V1 through V3 confirm the irreplaceability of boundary detection, geometric consistency, and pattern matching. V4 confirms that the pheromone feedback mechanism is essential for ACO to discover new boundary edges. The comprehensive results demonstrate that the collaborative operation of all modules and mechanisms is crucial for solving the joint optimization problem min F(T). Table 12 summarizes the ablation experiment results across all variants.
Table 12.
Summary of ablation experiments.
The collaborative operation of all modules ensures the method effectiveness of complex surface trajectory planning at the geometric and algorithmic levels, enabling the method to adapt to diverse input scenarios from high-quality CAD models to scanned reconstruction models, meeting the comprehensive requirements for partition rationality, direction accuracy, and pattern adaptability.
5.5. Parameter Sensitivity and Algorithm Stability
To address the concern regarding the robustness of the proposed method to parameter selection, this section presents a comprehensive sensitivity analysis covering the key ACO parameters, the hierarchical merging weights, and the algorithm stability across multiple independent runs. All experiments in this section are conducted on the high-quality mesh with the baseline parameters listed in Table 1.
5.5.1. ACO Multi-Run Stability
The ACO boundary optimization involves stochastic ant path construction, which may produce different results across independent runs. To evaluate the algorithm stability, the complete method is executed 10 times with different random seeds (42, 100, 200, …, 900), and the key metrics are collected for statistical analysis. The results are summarized in Table 13.
Table 13.
ACO multi-run stability statistics (10 runs).
As shown in Table 13, across 10 independent runs, the partition count has a coefficient of variation of only 1.9%, and the boundary vertex ratio has a coefficient of variation of 0.9%. These results demonstrate that the stochastic nature of ACO does not affect the final segmentation outcome: the pheromone positive feedback mechanism drives the algorithm to converge to a stable boundary configuration regardless of the initial random seed, confirming the algorithm reliability for practical applications.
5.5.2. Evaporation Rate and Heuristic Weight Sensitivity
The evaporation rate ρ, pheromone weight α, and heuristic weight β are three key parameters governing the ACO convergence behavior. Each parameter is varied individually while keeping others at baseline values. The results are presented in Table 14.
Table 14.
Sensitivity analysis of ACO parameters.
As shown in Table 14, the evaporation rate ρ exhibits minimal influence on the results across the range 0.01 to 0.30, with partition counts varying within 0.95× to 1.00× of the baseline. This stability indicates that the pheromone update mechanism is robust to different evaporation rates. The pheromone weight α shows a moderate effect: higher α values produce slightly fewer partitions (0.95× at α = 2.0), reflecting stronger convergence toward historically reinforced paths. The heuristic weight β has the most significant impact: at β = 1.0, the partition count increases sharply to 3.12× the baseline with a boundary vertex ratio increase of +8.20 percentage points, indicating that insufficient geometric guidance causes ants to wander without following true boundary features, producing fragmented and spurious boundaries. At β = 3.0 and 5.0, the results stabilize at 1.00× and 0.98× of the baseline respectively, confirming that the geometric heuristic information plays a critical guiding role. The baseline value β = 3.0 is situated at the center of the stable range, balancing geometric guidance and exploration capability.
5.5.3. Pheromone Threshold Sensitivity
The pheromone percentile threshold controls the boundary extraction sensitivity. Existing experiments have tested values from 70 to 99, with results showing that for in the range 70 to 96, the partition count and boundary vertex ratio remain identical to the baseline values. This wide stable plateau indicates that the pheromone distribution after ACO iterations has a clear bimodal separation between boundary and non-boundary edges, making the exact threshold value non-critical. The baseline = 85 is selected as the center of this stable range. When exceeds 96, only edges with the highest pheromone concentrations are retained, leading to boundary loss and reduced partition count.
5.5.4. Hierarchical Merging Weight Sensitivity
The hierarchical merging distance combines three feature weights: boundary weight , normal weight , and curvature weight . Six weight combinations are tested to evaluate the sensitivity to weight selection. The results are shown in Table 15.
Table 15.
Weight combination comparison.
As shown in Table 15, the partition count varies within 0.91× to 1.00× of the baseline across all six weight combinations, and the boundary vertex ratio remains within ±0.17 percentage points of the baseline. This stability indicates that the algorithm is robust to the choice of merging weights. The two-stage architecture explains this robustness: the hierarchical merging weights primarily affect the first-stage region aggregation, while the ACO boundary optimization in the second stage operates independently based on geometric edge features. Consequently, the final boundary configuration is largely determined by the ACO stage, making the overall algorithm insensitive to merging weight variations. The baseline weights (0.30/0.40/0.30) produce a partition count at 1.00× the baseline, situated in the middle of the observed range, confirming that the selected configuration provides a balanced and representative parameter setting.
5.6. Runtime and Scalability Analysis
To evaluate the computational efficiency and scalability of the proposed method, the execution time of each algorithm stage is recorded on both test meshes. The stage-by-stage timing results are presented in Table 16.
Table 16.
Runtime comparison across mesh scales.
As shown in Table 16, the high-quality mesh (180,798 facets) is processed in 13.0 s, while the scanned mesh (2,825,270 facets) requires 36.5 s. Although the scanned mesh has 15.6 times more facets, the total runtime increases by only 2.8 times, demonstrating sub-linear scaling. The mesh-dependent stages (reading, adjacency, curvature, over-segmentation, and hierarchical merging) scale approximately linearly with the mesh size, as expected from their O(N) and O(R log R) complexity. Notably, the ACO stage shows a different pattern: the runtime remains comparable or even slightly decreases on the larger mesh (12.0 s vs. 10.1 s), because the ACO computational cost depends on the ant count and iteration rounds (fixed parameters), not on the mesh size directly. This characteristic makes the ACO boundary optimization particularly efficient for large-scale meshes, as the dominant cost is the mesh preprocessing rather than the optimization itself. The results confirm that the proposed method is applicable to industrial-scale scanned meshes within practical timeframes.
5.7. Comparative Discussion
Compared with traditional single-threshold segmentation methods, the proposed method demonstrates significant advantages in processing scanned reconstructed meshes. Single dihedral angle threshold methods rely on normal discontinuities to identify boundaries, which works well for high-quality CAD-exported meshes but struggles to balance boundary completeness and over-segmentation control in smooth-transition regions of scanned meshes. This paper adopts a hybrid strategy of region growing over-segmentation and hierarchical multi-feature merging, alleviating the limitations of single thresholds through a weighted distance metric integrating normal difference, curvature difference, and boundary strength. In the ablation experiments, variant V1 removed the ACO boundary optimization, resulting in a 36.7% reduction in partition count, indicating that static threshold methods suffer from systematic boundary omissions, while the collective search behavior of ACO can detect these omitted smooth-transition boundaries. Compared with pure ACO clustering segmentation, this paper restricts the ACO scope to the residual ambiguous regions after hierarchical merging, where ants accumulate pheromones only on local edge sets, significantly reducing the search space while maintaining detection capability. The V2 variant results further validate the necessity of the two-stage division of labor: removing hierarchical merging still allows ACO to detect boundaries but produces numerous redundant partitions with poor geometric consistency.
From a methodological perspective, the proposed framework differs from existing approaches in three key dimensions. First, regarding mesh segmentation, conventional region growing methods [8,28] rely on geometric thresholding and perform well on high-quality CAD meshes but struggle with smooth-transition boundaries on scanned surfaces; learning-based methods [23,26] achieve high accuracy but require annotated training data. The proposed ACO-optimized region growing occupies a middle ground: it requires no training data while reliably detecting smooth-transition boundaries through pheromone accumulation along high-curvature edges. Second, regarding direction planning, existing methods [7,17,21] typically determine directions after partitioning is fixed, limiting the reachable solution space. The proposed dual-layer framework addresses this by allowing outer-layer quality feedback to adjust inner-layer partition granularity. Third, regarding optimization architecture, existing multi-level ACO frameworks [34,35] are primarily applied to scheduling and routing problems with discrete decision variables; the present work extends the two-layer ACO paradigm to continuous geometric optimization on triangular meshes, where the inner layer operates on edge-level boundary detection and the outer layer on region-level direction combinations.
At the direction optimization level, the V3 variant removed pattern matching, causing the achievement to decrease by 67.2%, indicating that decoupling direction decision from mode selection loses the adaptability between geometric features and trajectory modes. The joint optimization strategy proposed in this paper can adaptively select trajectory modes matching partition geometric features during the search process, avoiding the disconnection between mode and direction inherent in post-processing approaches.
6. Conclusions and Future Work
6.1. Summary
This paper addresses the region partitioning and direction decision problems in complex surface spray trajectory planning, and proposes a mesh partition and direction planning method based on dual-layer ACO. The method decomposes trajectory planning into two levels, namely partitioning and direction, and achieves collaborative optimization at both levels through ACO, enabling automated partition and direction planning from triangular mesh input. The main work and contributions are as follows.
(1) A mesh partitioning strategy combining region growing over-segmentation and hierarchical multi-feature merging is proposed. Region growing over-segmentation with a minimal dihedral angle threshold ensures boundary closure, followed by iterative merging of redundant small regions through multi-feature distance fusing normal difference, curvature difference, and boundary strength. On a scanned mesh containing 2,825,270 facets, hierarchical merging optimizes 633 over-segmented regions into 1590 geometrically consistent partitions.
(2) ACO is applied to triangular mesh boundary detection in the context of complex surface trajectory planning. Ants walk along mesh edges, accumulate pheromones on edges with high curvature and large dihedral angles, and extract boundaries via percentile thresholding. Ablation experiments show that ACO boundary optimization adds 920 new partitions on the scanned mesh, a 58% increase, reliably identifying smooth-transition boundaries missed by the hierarchical merging stage, playing an irreplaceable role in boundary closure.
(3) An ACO trajectory direction combination optimization method based on geometric feature pre-determination is designed. Through circularity, curvature distribution, and other features, the trajectory pattern suited to each partition (Spiral or Parallel) is automatically determined, followed by ACO search for the optimal direction combination. In experiments on 61 partitions, the trajectory pattern matching rate is satisfactory, and the direction deviation of 88.5% of partitions does not exceed 24 degrees, verifying the effectiveness of direction optimization.
(4) A two-layer collaborative mechanism is constructed, achieving adaptive adjustment of partition granularity through forward partition transfer and reverse objective function feedback. The objective function value F(T) from outer-layer direction optimization is fed back to the inner layer, dynamically adjusting the merging distance threshold, enabling partition results to adaptively serve the global objectives of direction planning.
Experiments on two types of models, high-quality mesh and scanned reconstructed mesh verify the effectiveness of the method. On the high-quality mesh, the proposed method achieves favorable partition results comparable to STEP surface mapping. On the scanned mesh, ACO boundary optimization significantly improves boundary identification in smooth-transition regions. Ablation experiments further confirm the independent contributions of each module. The proposed method framework also provides reference values for trajectory planning of grinding and other complex surface machining operations [21,37].
6.2. Limitations and Future Work
The proposed method has several aspects that warrant further investigation. In terms of method extension, future work will explore joint optimization of partitioning and direction on larger-scale meshes and investigate adaptive threshold selection for the hierarchical merging strategy to reduce manual parameter tuning. Meanwhile, for multi-region collaborative optimization scenarios on complex surfaces, future research will study task allocation and direction coordination at the partition level, combined with parallel computing to improve processing efficiency for large-scale meshes [10].
In terms of algorithm efficiency, the current C++ implementation still has room for optimization in processing time on ultra-large meshes. GPU parallel acceleration can be introduced in the future to further improve the processing efficiency of large-scale meshes.
In terms of partition validation, this paper uses boundary closure rate and partition count as evaluation metrics. Future work can introduce more diverse mesh models and richer geometric feature metrics to further verify the applicability and robustness of the method under different topological structures and complexity levels.
In terms of trajectory patterns, the pattern set can be extended in the future by introducing patterns such as grid or fractal traversal and adapting to a wider range of surface types through the automatic pattern determination mechanism.
In terms of two-layer collaboration, the current feedback mechanism uses unidirectional parameter adjustment, and convergence speed and adjustment accuracy need improvement. Methods such as reinforcement learning could be explored to achieve more intelligent parameter adaptive strategies, further enhancing the efficiency of two-layer collaboration.
Author Contributions
Conceptualization, C.S.; methodology, Z.Z. (Zeyu Zhao) and C.S.; software, Z.Z. (Zeyu Zhao); validation, Z.Z. (Zeyu Zhao), X.W. and Z.Y.; formal analysis, Z.Z. (Zeyu Zhao); investigation, Z.Z. (Zeyu Zhao), X.W., Z.Y. and Z.Z. (Zihao Zhang); resources, C.S.; data curation, X.W. and Z.Y.; writing—original draft preparation, Z.Z. (Zeyu Zhao); writing—review and editing, C.S.; visualization, Z.Z. (Zeyu Zhao) and Z.Z. (Zihao Zhang); supervision, C.S.; project administration, C.S.; funding acquisition, C.S. All authors have read and agreed to the published version of the manuscript.
Funding
This work was supported by the Jilin Province Science and Technology Achievement Transformation Project (grant number KYC-JC-XM-2025-116).
Data Availability Statement
The data presented in this study are available on request from the corresponding author.
Conflicts of Interest
The authors declare no conflicts of interest.
References
- Zi, B.; Xu, F.; Tang, K.; Wang, Y.; Sha, W. Research review on trajectory planning and coating quality inspection of spray painting robots based on machine vision. Control Decis. 2023, 38, 1–21. [Google Scholar]
- Xu, F.; Zi, B.; Yuan, J.; Wang, Z. Modeling analysis of rectangular spray gun and full-coverage path planning for camouflage pattern of spray painting robot. Robot 2023, 45, 139–155. [Google Scholar]
- Zhao, J.; Zi, B.; Wang, W.; Li, Y.; Xu, F. Mechanism design and workspace analysis of rigid-flexible hybrid driven parallel spray painting robot. J. Mech. Eng. 2023, 59, 28–39. [Google Scholar] [CrossRef] [Scilit]
- Qi, S.; Zheng, Q.; Huang, Z.; Wang, H.; He, X.; Jiang, D.; Zhou, H. Analysis and experimental study of robot spray coating thickness model. Mech. Sci. Technol. 2023, 42, 1423–1429. [Google Scholar]
- Ji, J.; Xu, J. Variable speed coating thickness distribution model for robot spraying on ultra-large flat surfaces. Mach. Tool. Hydraul. 2023, 51, 35–41. [Google Scholar]
- Ke, X.; Yu, Y.; Li, K.; Wang, T. Review on robot-assisted polishing: Status and future trends. Robot. Comput.-Integr. Manuf. 2023, 80, 102482. [Google Scholar] [CrossRef] [Scilit]
- Zhu, Y.; Wang, X.; Liu, L.; Zhuo, X.; Hu, H. Comprehensive optimization of complex curved surface spray trajectory based on multi-factor model and multi-scale genetic algorithm. Comput. Integr. Manuf. Syst. 2023, 29, 264–273. [Google Scholar]
- Yang, H.; Zhang, Z.; Liu, G.; Chen, J.; Tan, F. Complex workpiece surface segmentation optimization and spray path generation. Comb. Mach. Tool Autom. Manuf. Technol. 2026; in press.
- Li, Z.; He, D.; Li, X.; Deng, X.; Hu, P.; Hao, J.; Hou, Y.; Yu, H.; Tang, K. Efficient five-axis scanning-inspection path planning for complex freeform surfaces. Robot. Comput.-Integr. Manuf. 2024, 86, 102687. [Google Scholar] [CrossRef] [Scilit]
- Wang, W.; Ding, W.; Hua, C.; Zhang, H.; Feng, H.; Yao, Y. A digital twin for 3D path planning of large-span curved-arm gantry robot. Robot. Comput.-Integr. Manuf. 2022, 76, 102330. [Google Scholar] [CrossRef] [Scilit]
- Chen, Y.; Lu, Y.; Ding, Y. Toolpath generation for robotic flank milling via smoothness and stiffness optimization. Robot. Comput.-Integr. Manuf. 2024, 85, 102640. [Google Scholar] [CrossRef] [Scilit]
- Zhang, P.; Gong, J.; Zeng, Y.; Li, C. Spray gun trajectory planning of spray painting robot for large curvature surfaces. Mech. Sci. Technol. 2015, 34, 1670–1674. [Google Scholar]
- Shi, X.; Li, H.; Huang, S. Collaborative robot spray painting trajectory planning algorithm based on point cloud slicing technology. J. Shenyang Aerosp. Univ. 2024, 41, 53–60. [Google Scholar]
- Jiang, S.; Song, L.; Chen, X.; Zhang, P.; Liu, K.; Chang, J. Dedicated automatic spraying system for civil aircraft parts based on visual recognition. J. Tsinghua Univ. (Sci. Technol.) 2023, 63, 1650–1657. [Google Scholar]
- Gleeson, D.; Jakobsson, S.; Salman, R.; Ekstedt, F.; Sandgren, N.; Edelvik, F.; Carlson, J.S.; Lennartson, B. Generating optimized trajectories for robotic spray painting. IEEE Trans. Autom. Sci. Eng. 2022, 19, 1380–1391. [Google Scholar] [CrossRef] [Scilit]
- Chen, H.; Xi, N.; Dahl, J. CAD-guided spray gun trajectory planning of free-form surfaces in manufacturing. J. Adv. Manuf. Syst. 2003, 2, 47–69. [Google Scholar] [CrossRef] [Scilit]
- Nieto Bastida, S.; Lin, C.Y. Autonomous trajectory planning for spray painting on complex surfaces based on a point cloud model. Sensors 2023, 23, 9634. [Google Scholar] [CrossRef] [Scilit]
- Chen, W.; Li, X.; Ge, H.; Wang, L.; Zhang, Y. Trajectory planning for spray painting robot based on point cloud slicing technique. Electronics 2020, 9, 908. [Google Scholar] [CrossRef] [Scilit]
- Li, X.; Zhao, H.; He, X.; Ding, H. A novel cartesian trajectory planning method by using triple NURBS curves for industrial robots. Robot. Comput.-Integr. Manuf. 2023, 83, 102576. [Google Scholar] [CrossRef] [Scilit]
- Zhao, T.; Yan, Z.; Wang, L.; Pan, R.; Wang, X.; Liu, K.; Guo, K.; Hu, Q.; Chen, S. Hybrid path planning method based on skeleton contour partitioning for robotic additive manufacturing. Robot. Comput.-Integr. Manuf. 2024, 85, 102633. [Google Scholar] [CrossRef] [Scilit]
- Verduyn, A.; De Schutter, J.; Decré, W.; Vochten, M. Shape-based path adaptation and simulation-based velocity optimization of initial tool trajectories for robotic spray painting. In Proceedings of the IEEE International Conference on Automation Science and Engineering (CASE), Auckland, New Zealand, 26–30 August 2023; pp. 1–7. [Google Scholar]
- Tiboni, G.; Camoriano, R.; Tommasi, T. MaskPlanner: A framework for 3D learning-based object-centric motion generation and applications to robotic spray painting. IEEE Trans. Robot. 2026; in press.
- Jiao, X.; Chen, Y.; Yang, X. SCMS-Net: Self-supervised clustering-based 3D meshes segmentation network. Comput.-Aided Des. 2023, 160, 103512. [Google Scholar] [CrossRef] [Scilit]
- Mu, A.; Liu, Z.; Duan, G.; Tan, J. Part-to-surface mesh segmentation for mechanical models based on multi-stage clustering. Comput.-Aided Des. 2023, 162, 103545. [Google Scholar] [CrossRef] [Scilit]
- Yang, B.; Wang, Z.; Xu, Y.; Hu, S.; Xu, G.; Fu, J. Surface segmentation and weld extraction on noisy point clouds consisting of multiple quadrics. Robot. Comput.-Integr. Manuf. 2026, 97, 103100. [Google Scholar] [CrossRef] [Scilit]
- Moon, J.-H.; Ha, Y.; Park, S.; Kim, M.-S.; Yoon, S.-H. ROI Scissor: Interactive segmentation of feature region of interest in a triangular mesh. Comput. Graph. Forum 2023, 42, e14803. [Google Scholar] [CrossRef] [Scilit]
- Tsiapkolis, P.; Bénard, P. Patch decomposition for efficient mesh contours extraction. Comput. Graph. Forum 2024, 43, e15154. [Google Scholar] [CrossRef] [Scilit]
- Shen, Z.; Wang, W.; Hou, F.; Quan, W. Mesh segmentation with enhanced shape perception for CAD models. J. Comput.-Aided Des. Comput. Graph. 2025, 37, 1898–1908. [Google Scholar] [CrossRef] [Scilit]
- Dorigo, M.; Maniezzo, V.; Colorni, A. Ant system: Optimization by a colony of cooperating agents. IEEE Trans. Syst. Man. Cybern. B 1996, 26, 29–41. [Google Scholar] [CrossRef] [Scilit]
- Mutti, S.; Nicola, G.; Beschi, M.; Pedrocchi, N.; Molinari Tosatti, L. Towards optimal task positioning in multi-robot cells, using nested meta-heuristic swarm algorithms. Robot. Comput.-Integr. Manuf. 2021, 71, 102131. [Google Scholar] [CrossRef] [Scilit]
- Yang, Y.; Lu, H.; Zhang, B.; Sang, D.; Liu, S. Route planning of aviation cable based on improved ant colony algorithm. J. Aerosp. Power 2023, 38, 1715–1722. [Google Scholar]
- Xie, G.; He, W.; Hu, W.; Su, Y.; Shi, B. Improved ant colony algorithm with uneven pheromone allocation and multi-objective optimization for unmanned surface vehicle path planning. Chin. J. Ship Res. 2025, 20, 115–124. [Google Scholar]
- Xue, Q.; Qu, M.; Peng, H.; Yao, Y.; Guo, W.; Tan, J.; Wang, Y. Shared bicycle scheduling optimization method based on multi-objective ant colony algorithm. Transp. Inf. Saf. 2024, 42, 124–135. [Google Scholar]
- Ashour, M.; Elsaeed, A.; Mesalam, Y.; Elshaer, R. A hybrid multi-level ant colony optimization framework for integrated production scheduling and vehicle routing. Sci. Rep. 2025, 15, 41453. [Google Scholar] [CrossRef] [Scilit]
- Chang, M.; Ku, Z.; Xing, X.; Wang, T.; Dong, H. ICBBA-ACO-based multi-robot task allocation for smart charging stations. Machines 2026, 14, 953. [Google Scholar] [CrossRef] [Scilit]
- Meyer, M.; Desbrun, M.; Schroder, P.; Barr, A.H. Discrete differential-geometry operators for triangulated 2-manifolds. In Visualization and Mathematics III; Springer: Berlin, Germany, 2003; pp. 35–57. [Google Scholar]
- Lv, C.; Zou, L.; Li, H.; Ren, L.; Jiao, F.; Wang, X. 3D residual optimization-based trajectory planning for robotic grinding of complex curved blades. Robot. Comput.-Integr. Manuf. 2026, 101, 103275. [Google Scholar] [CrossRef] [Scilit]
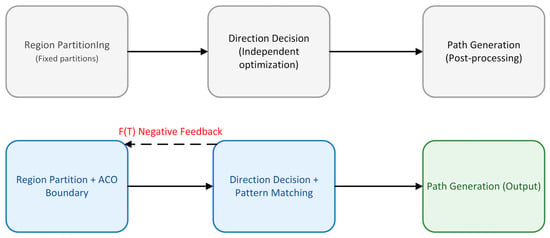
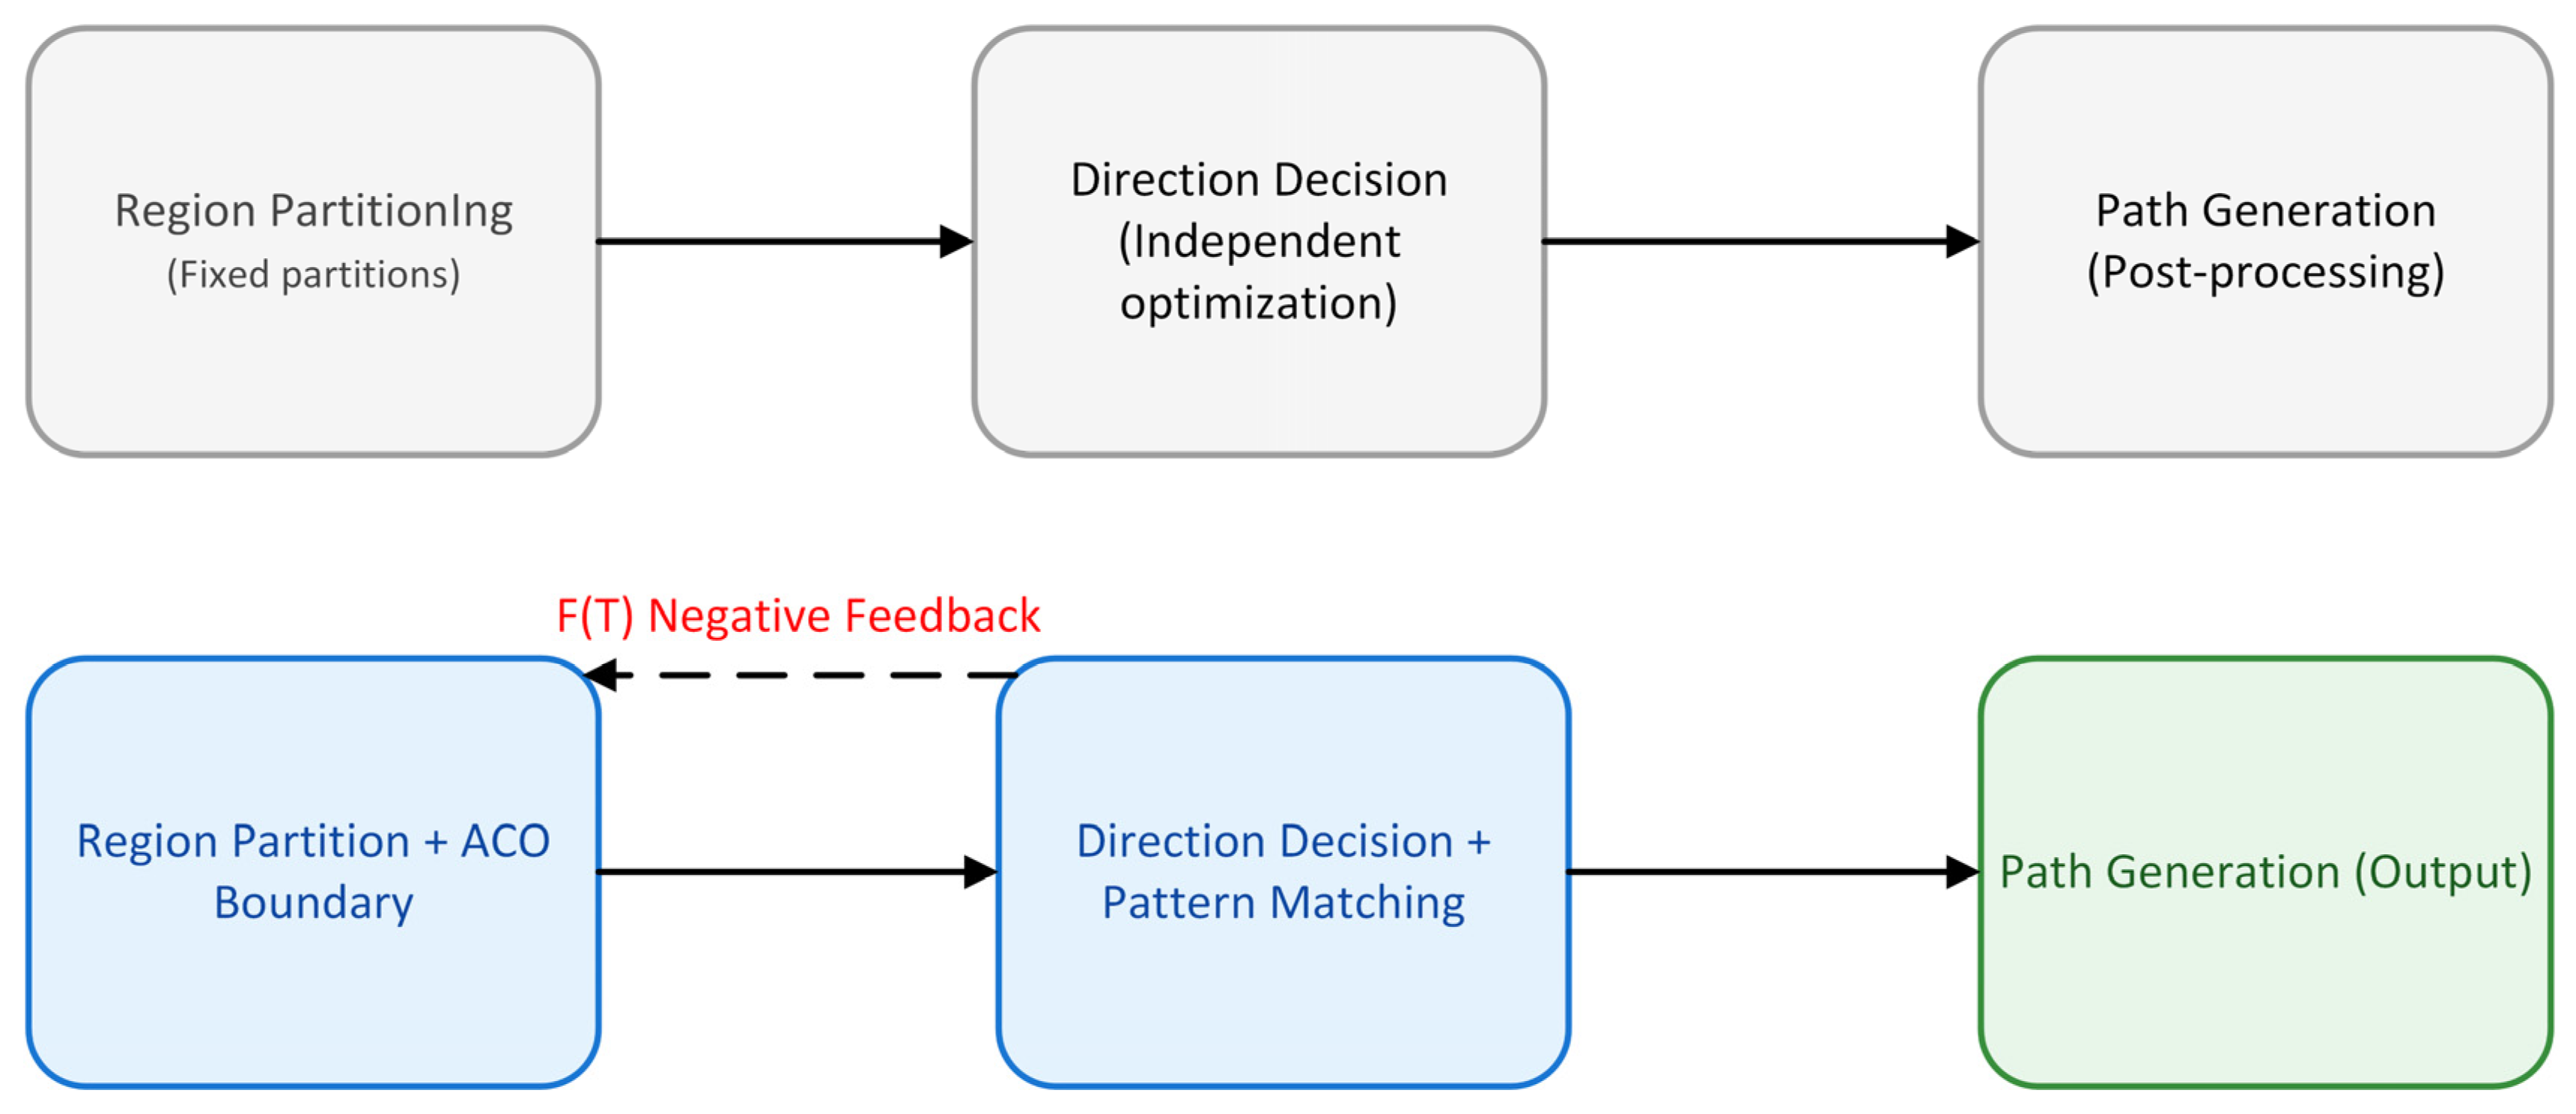
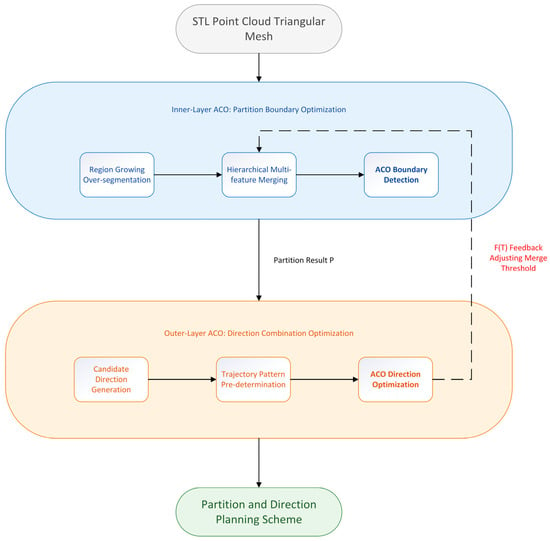
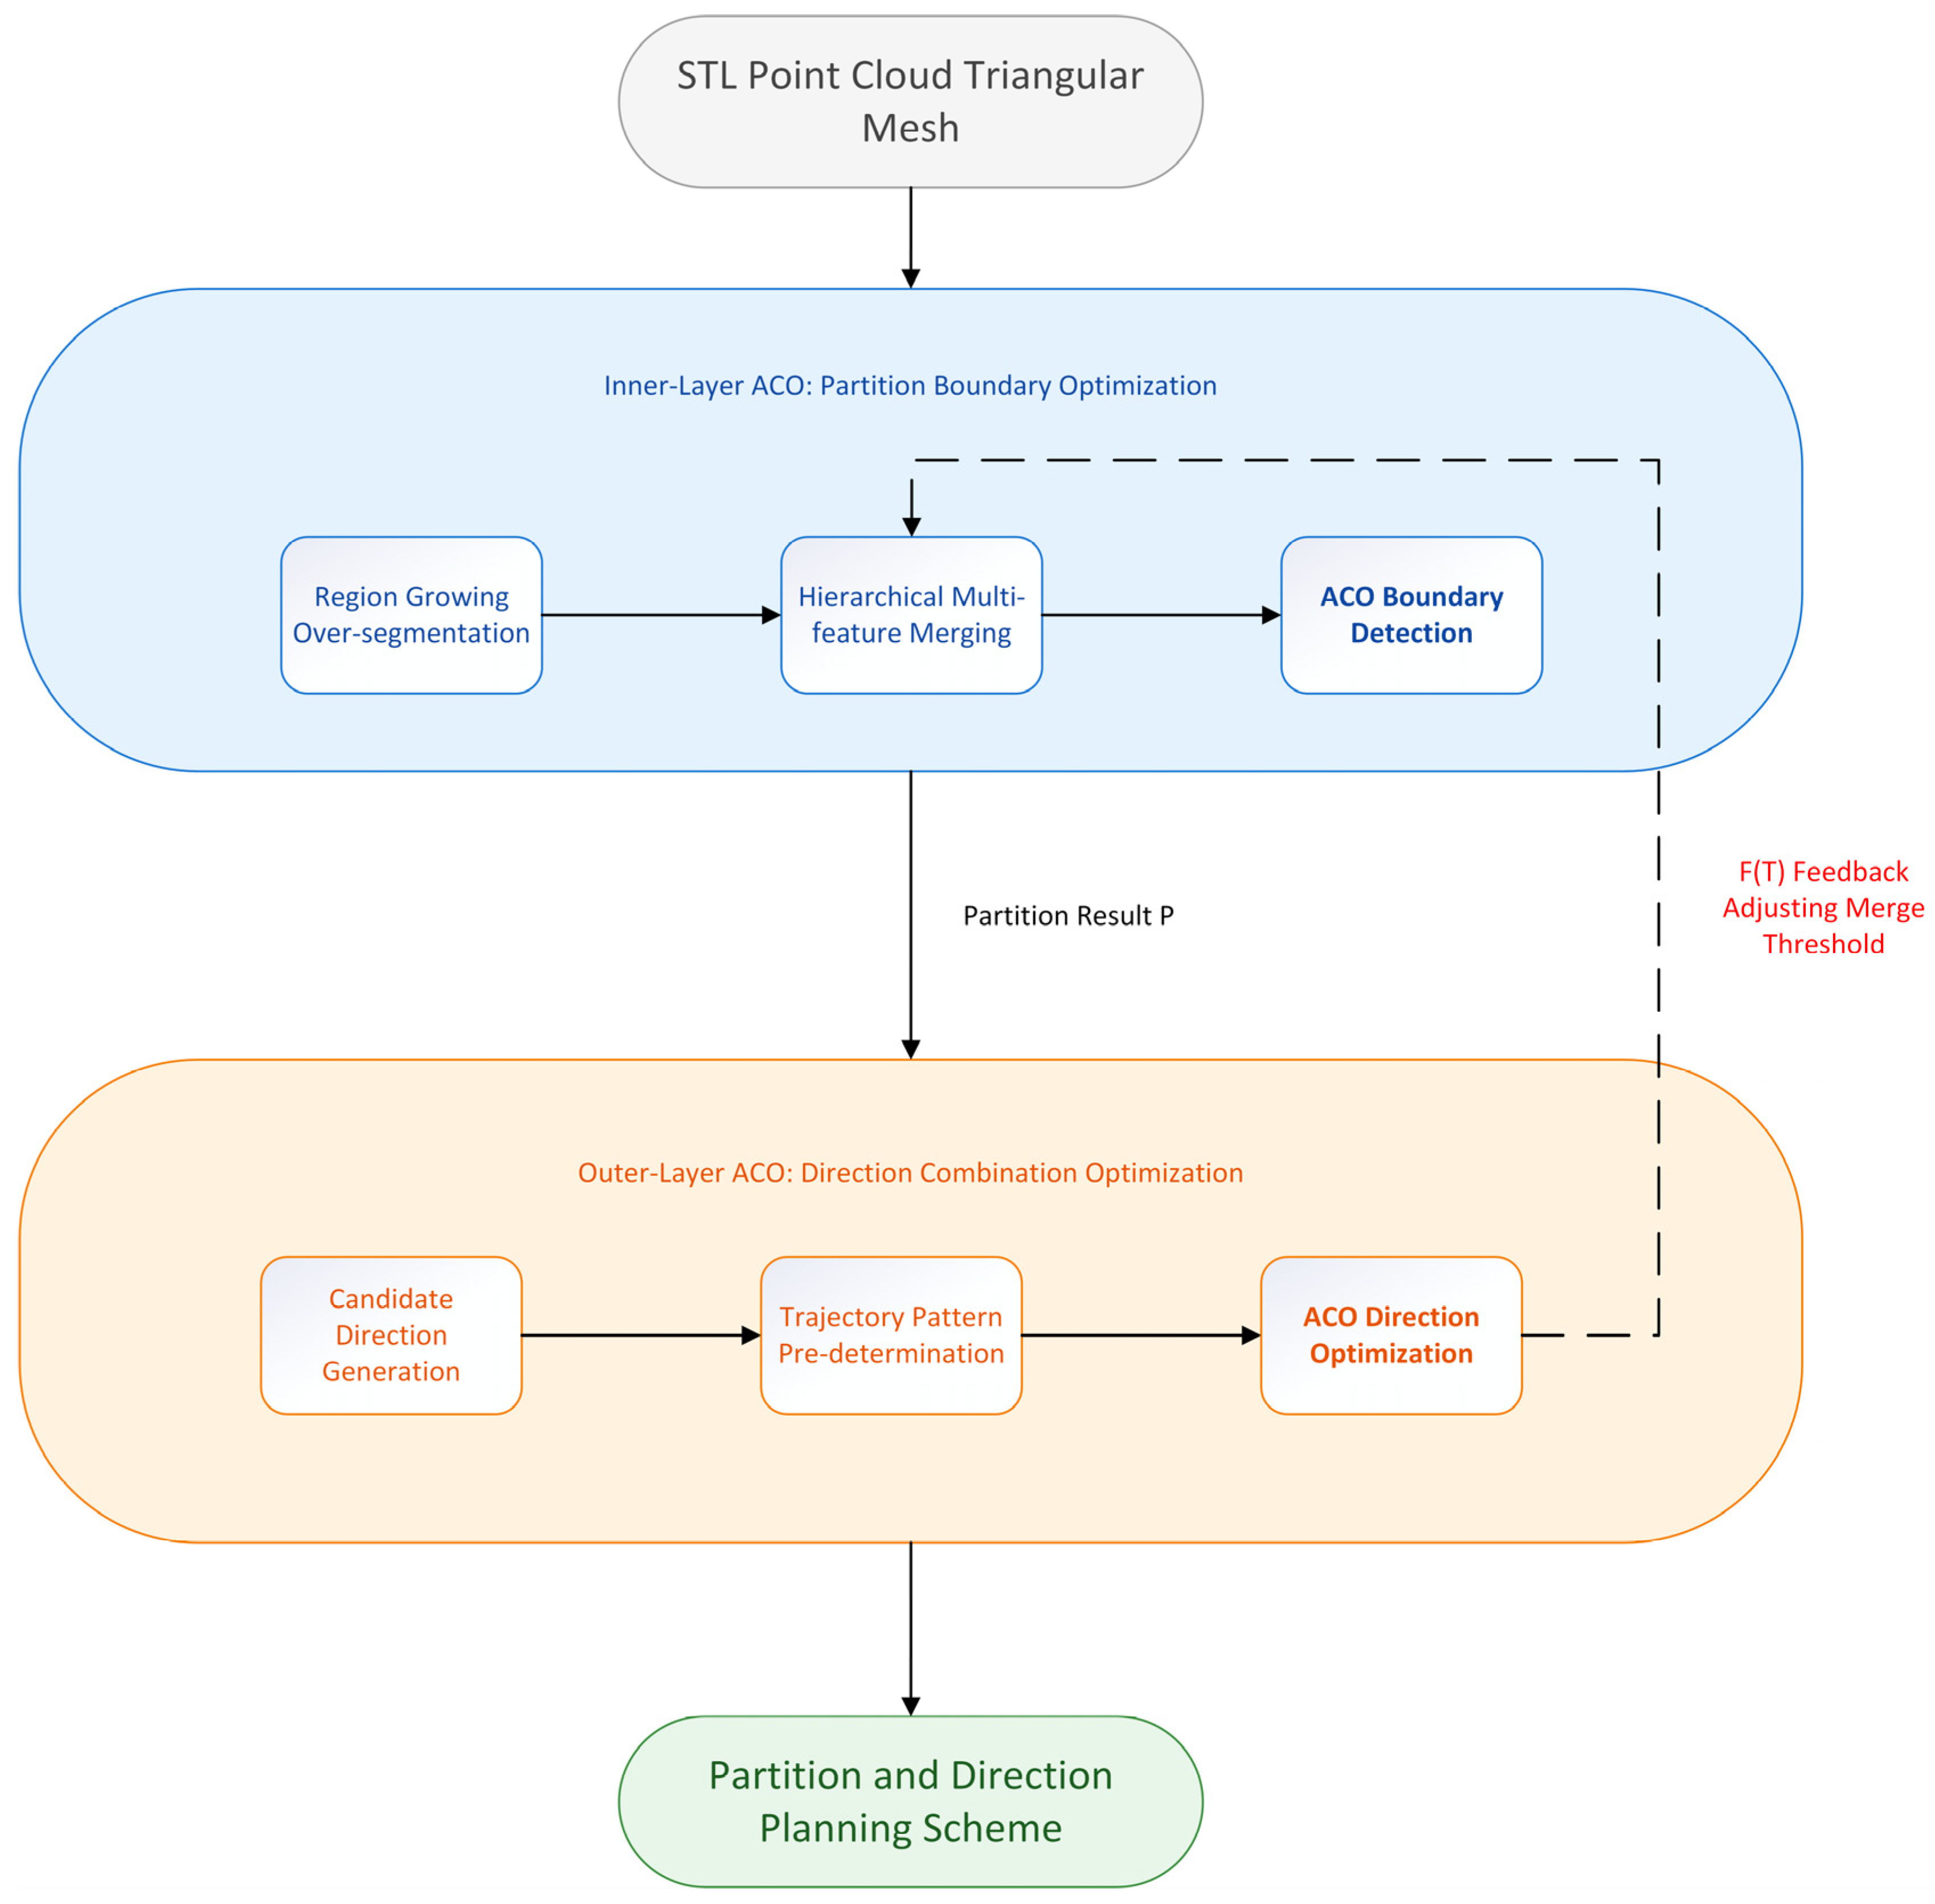
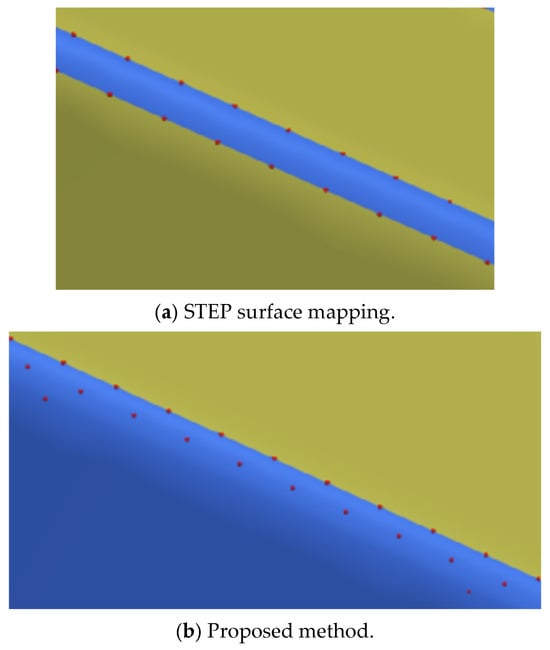
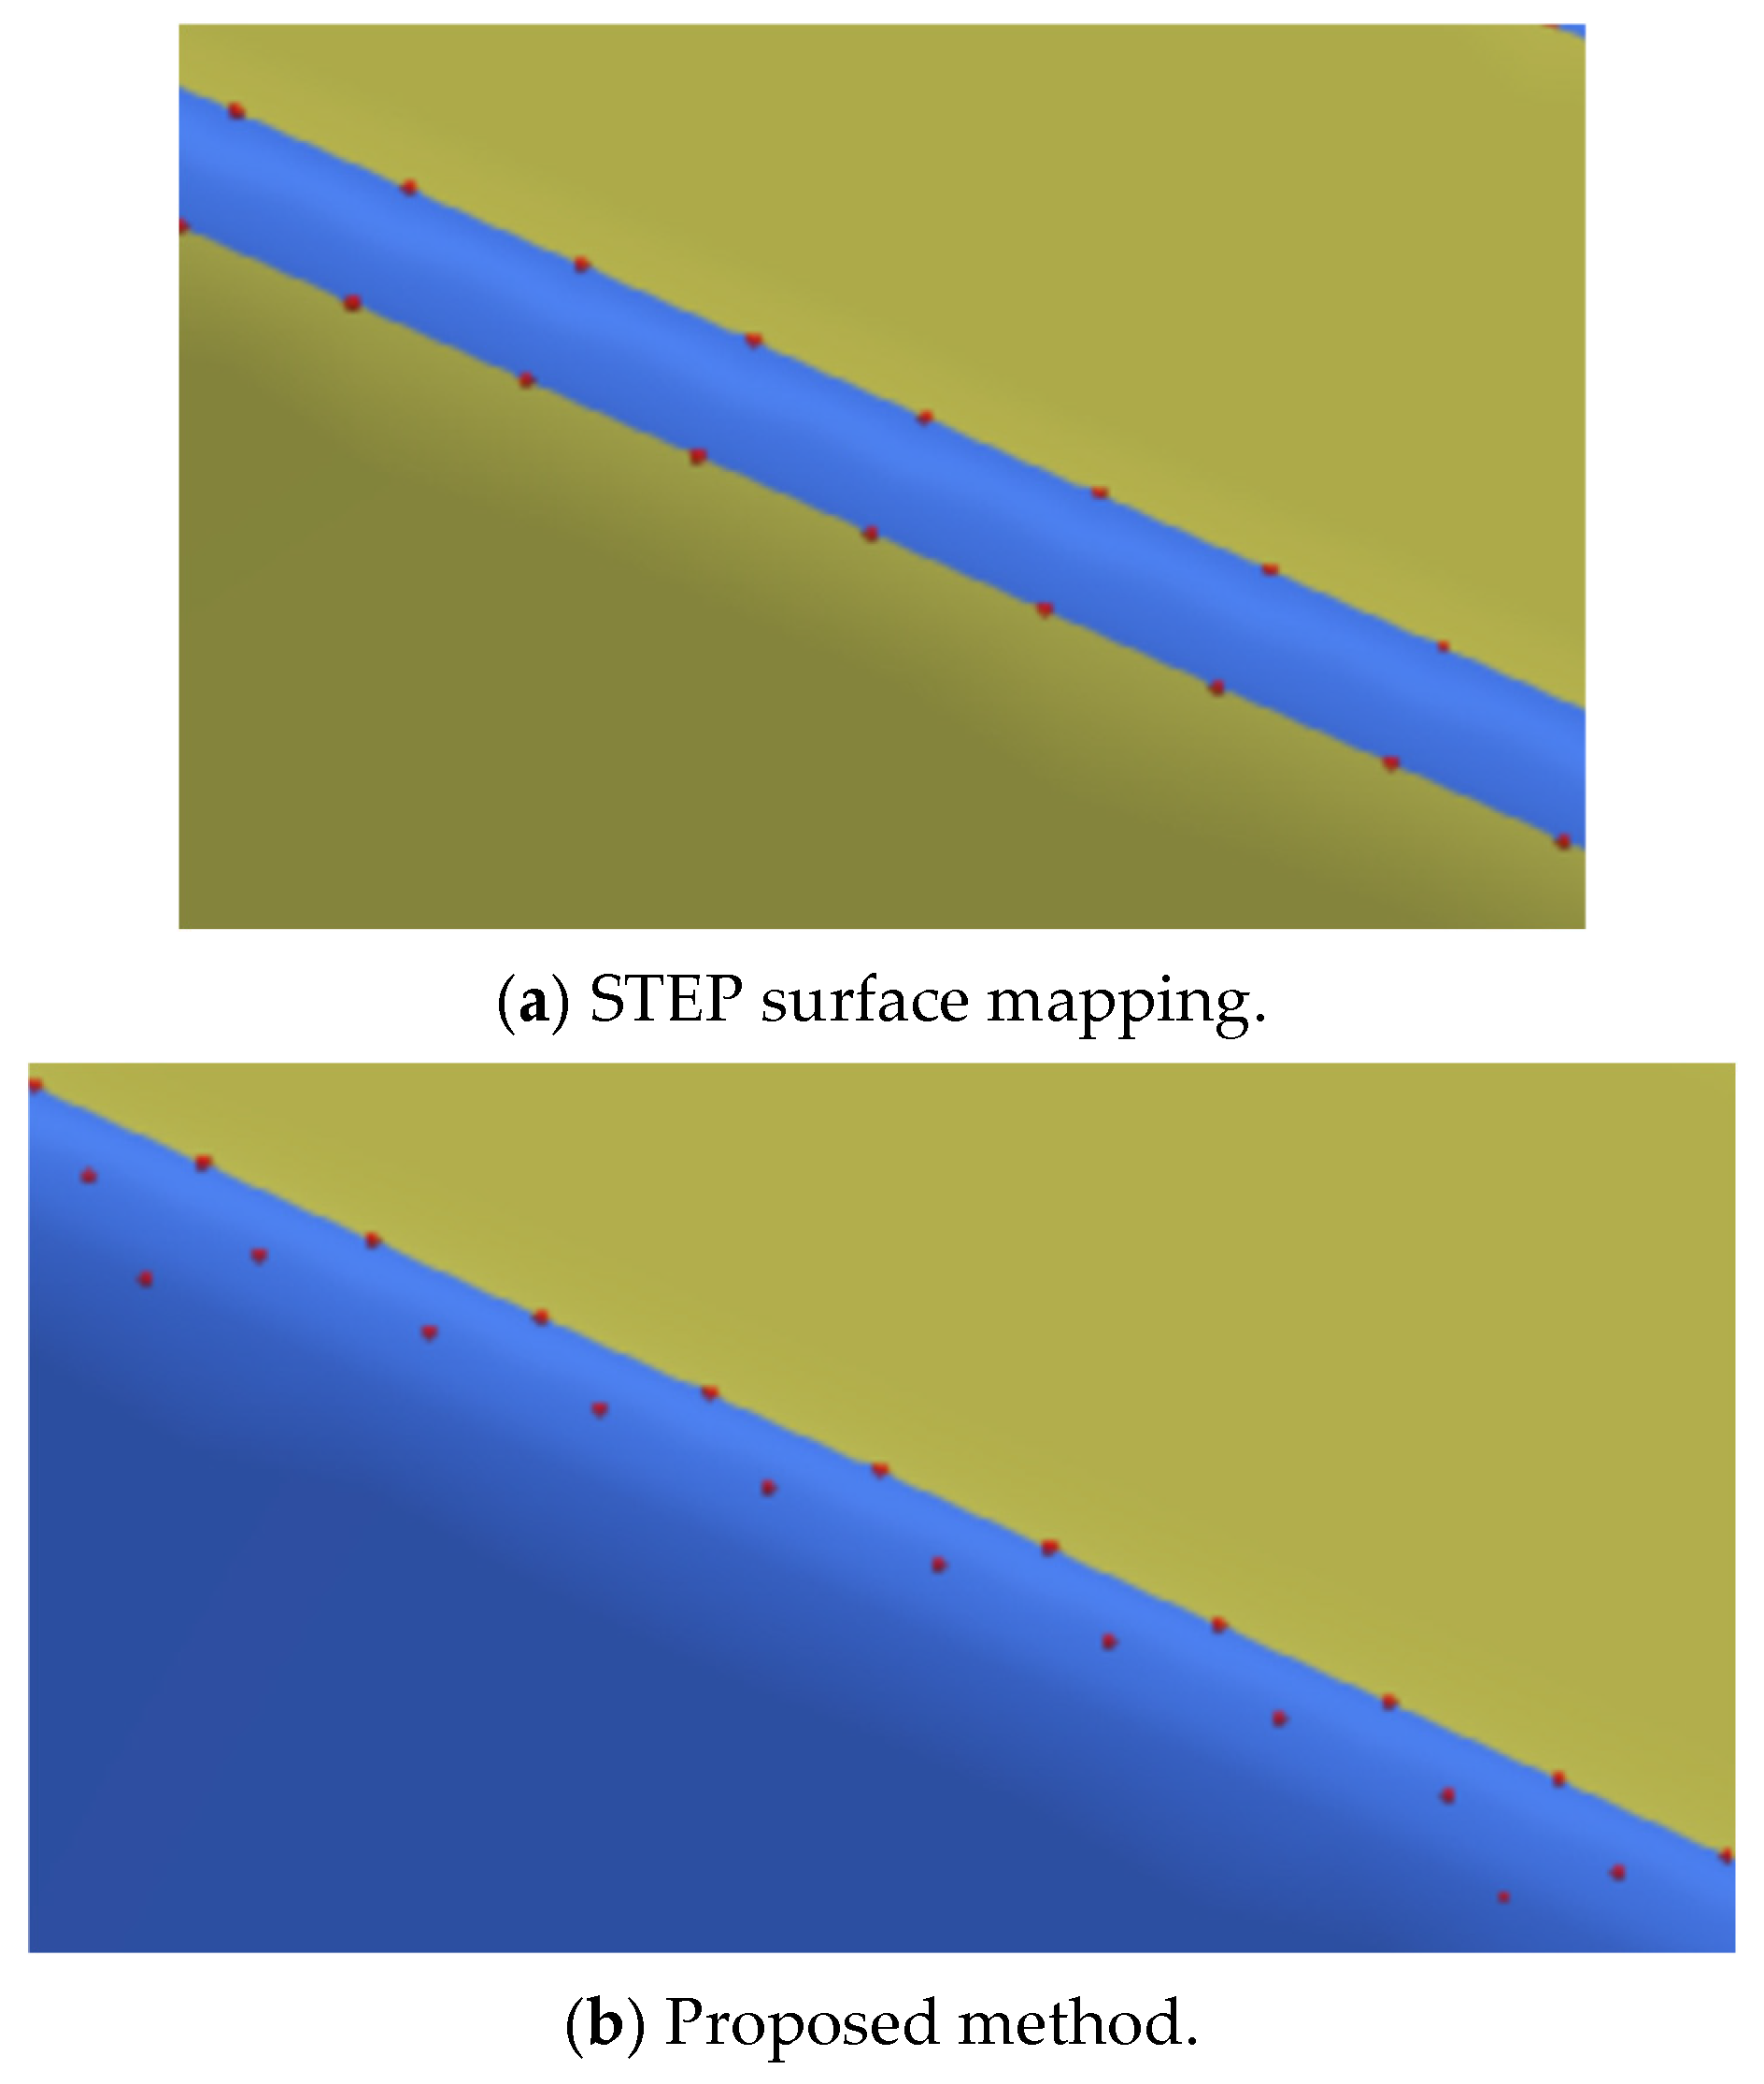
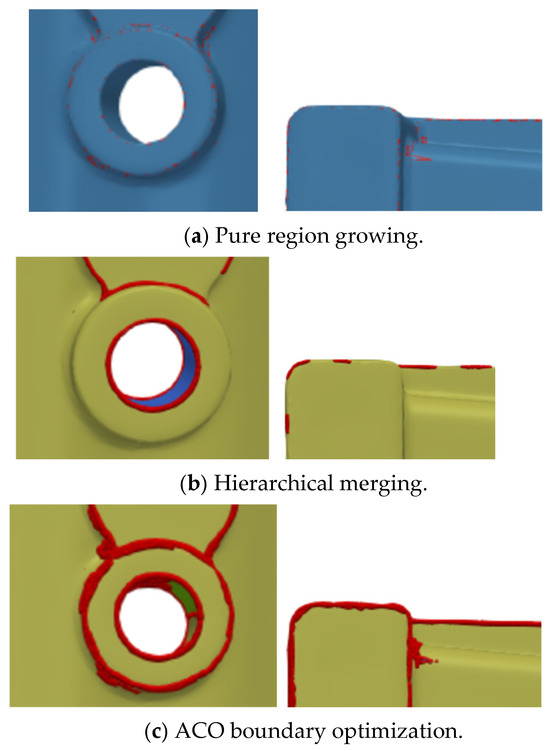
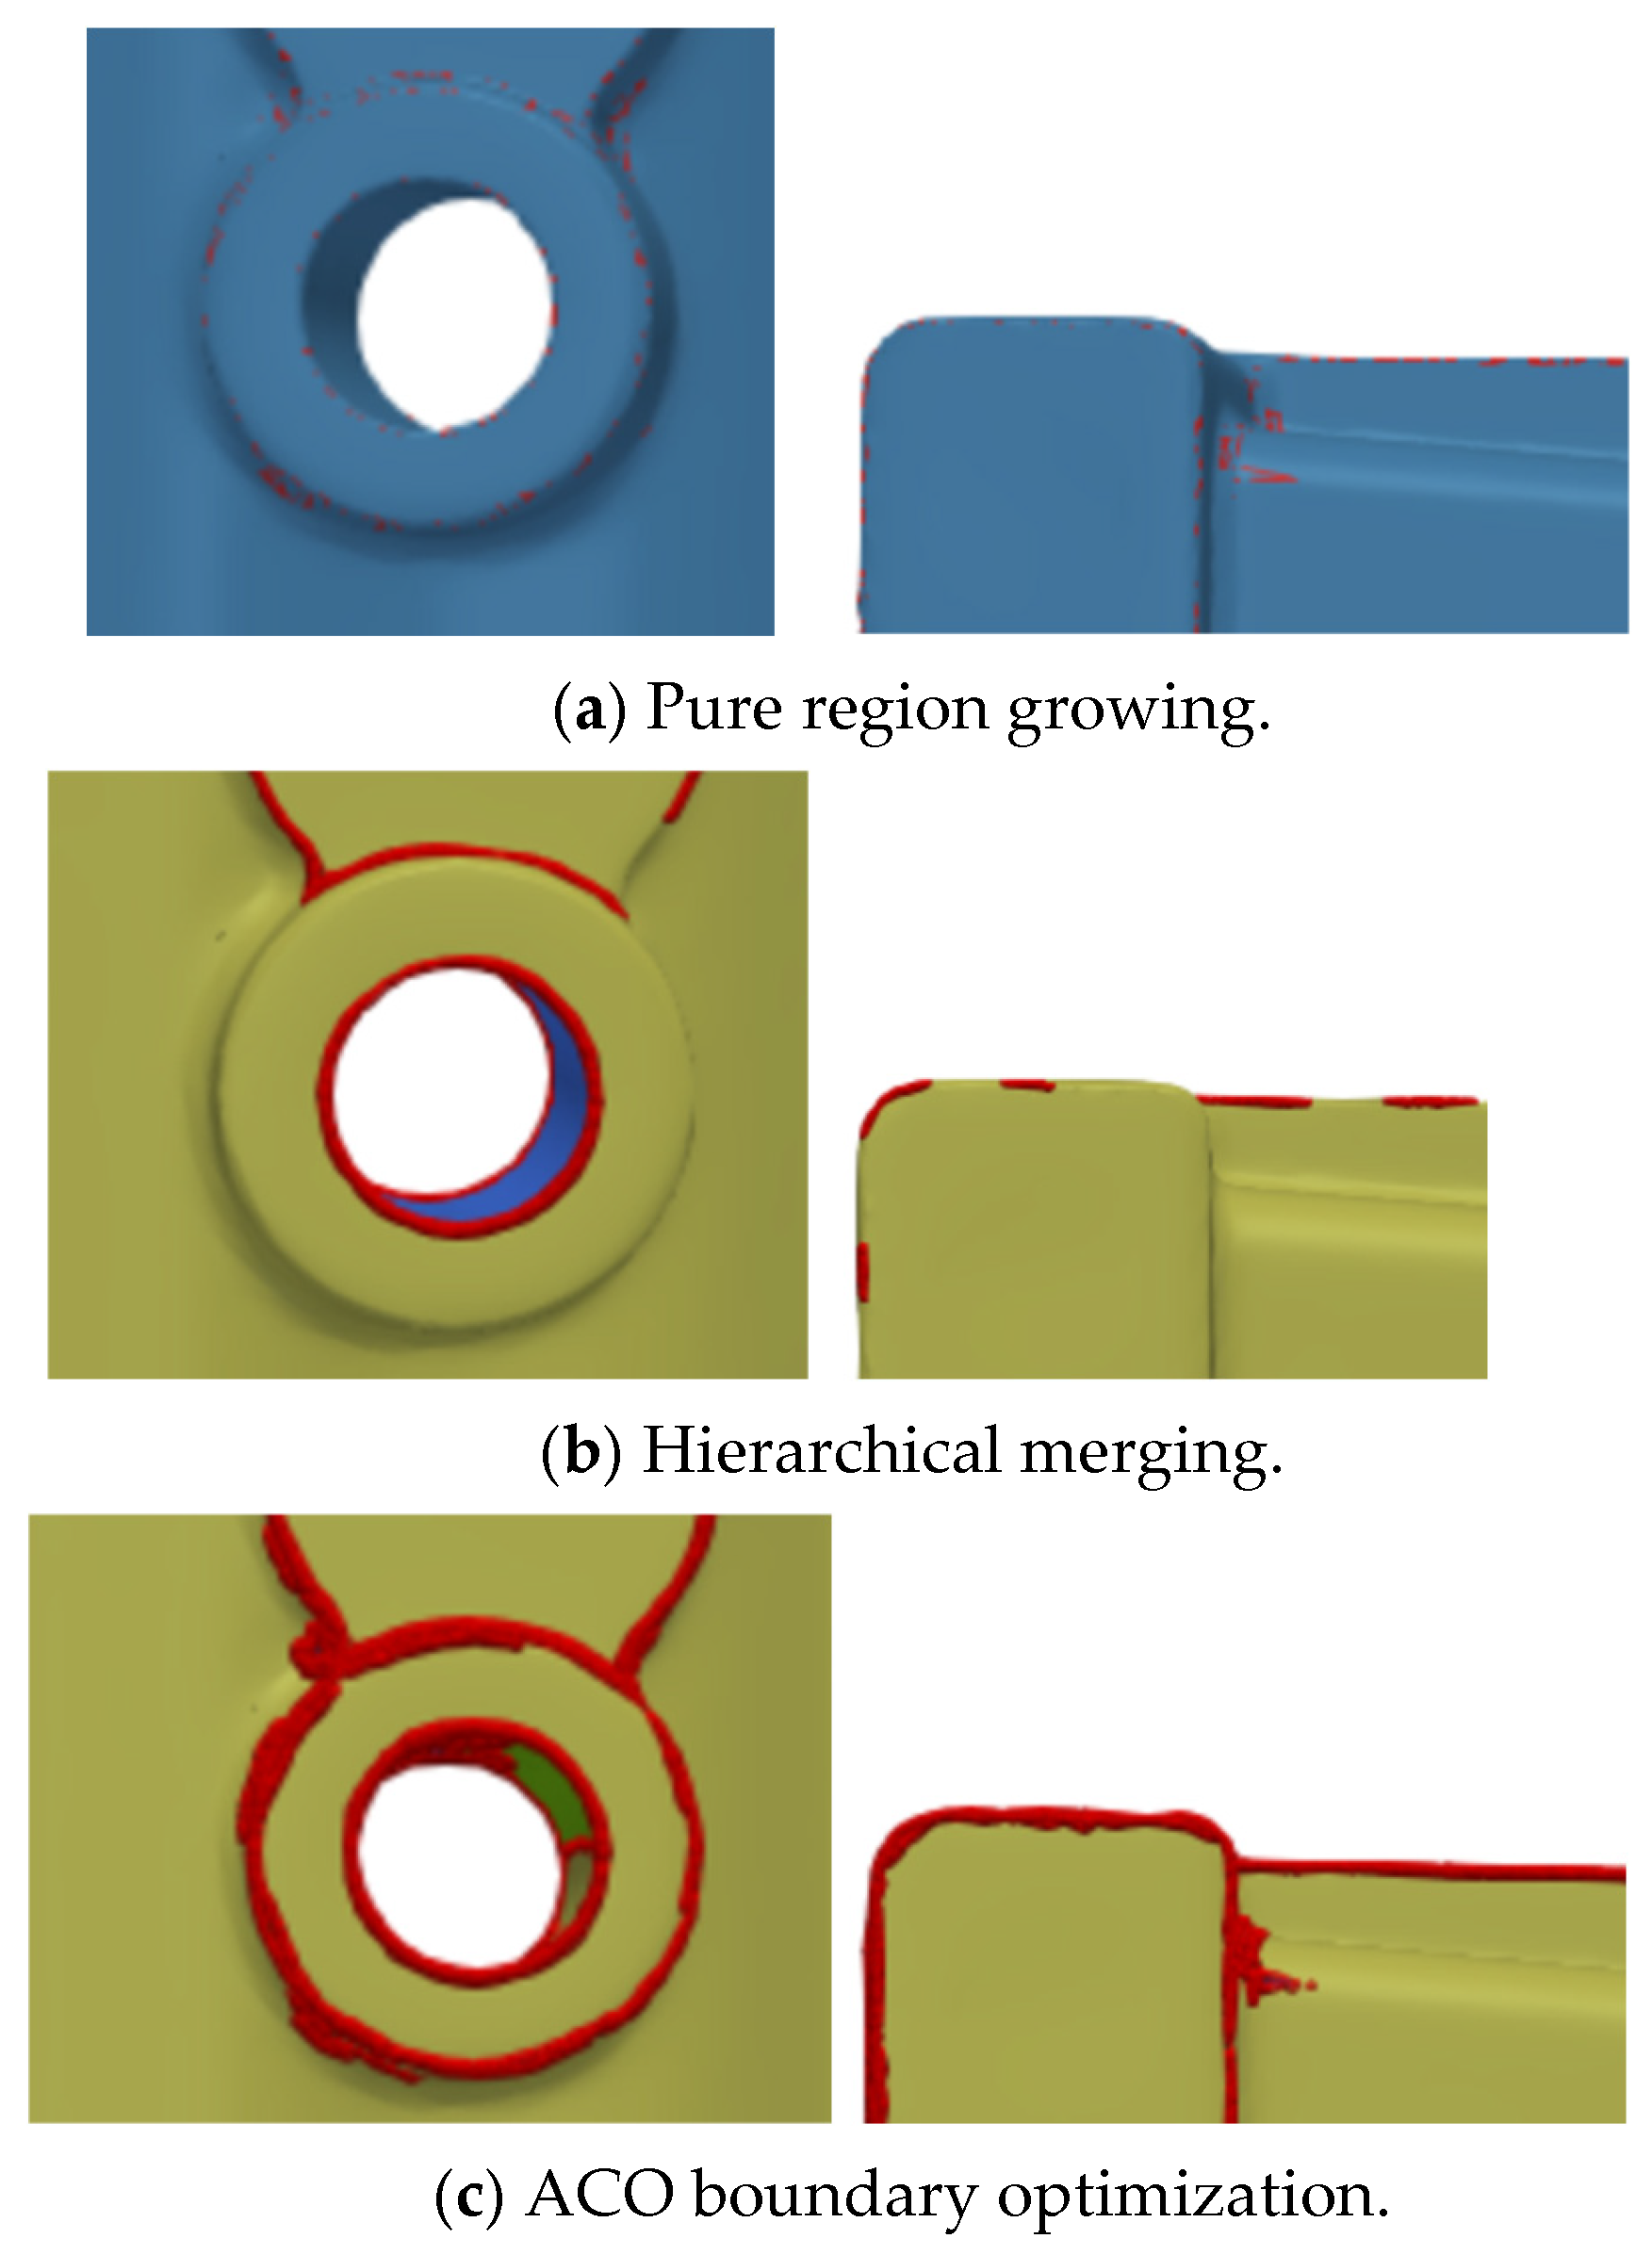
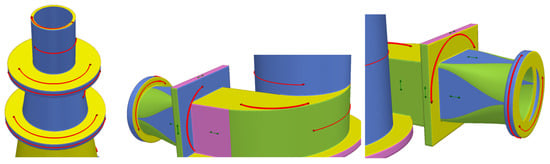
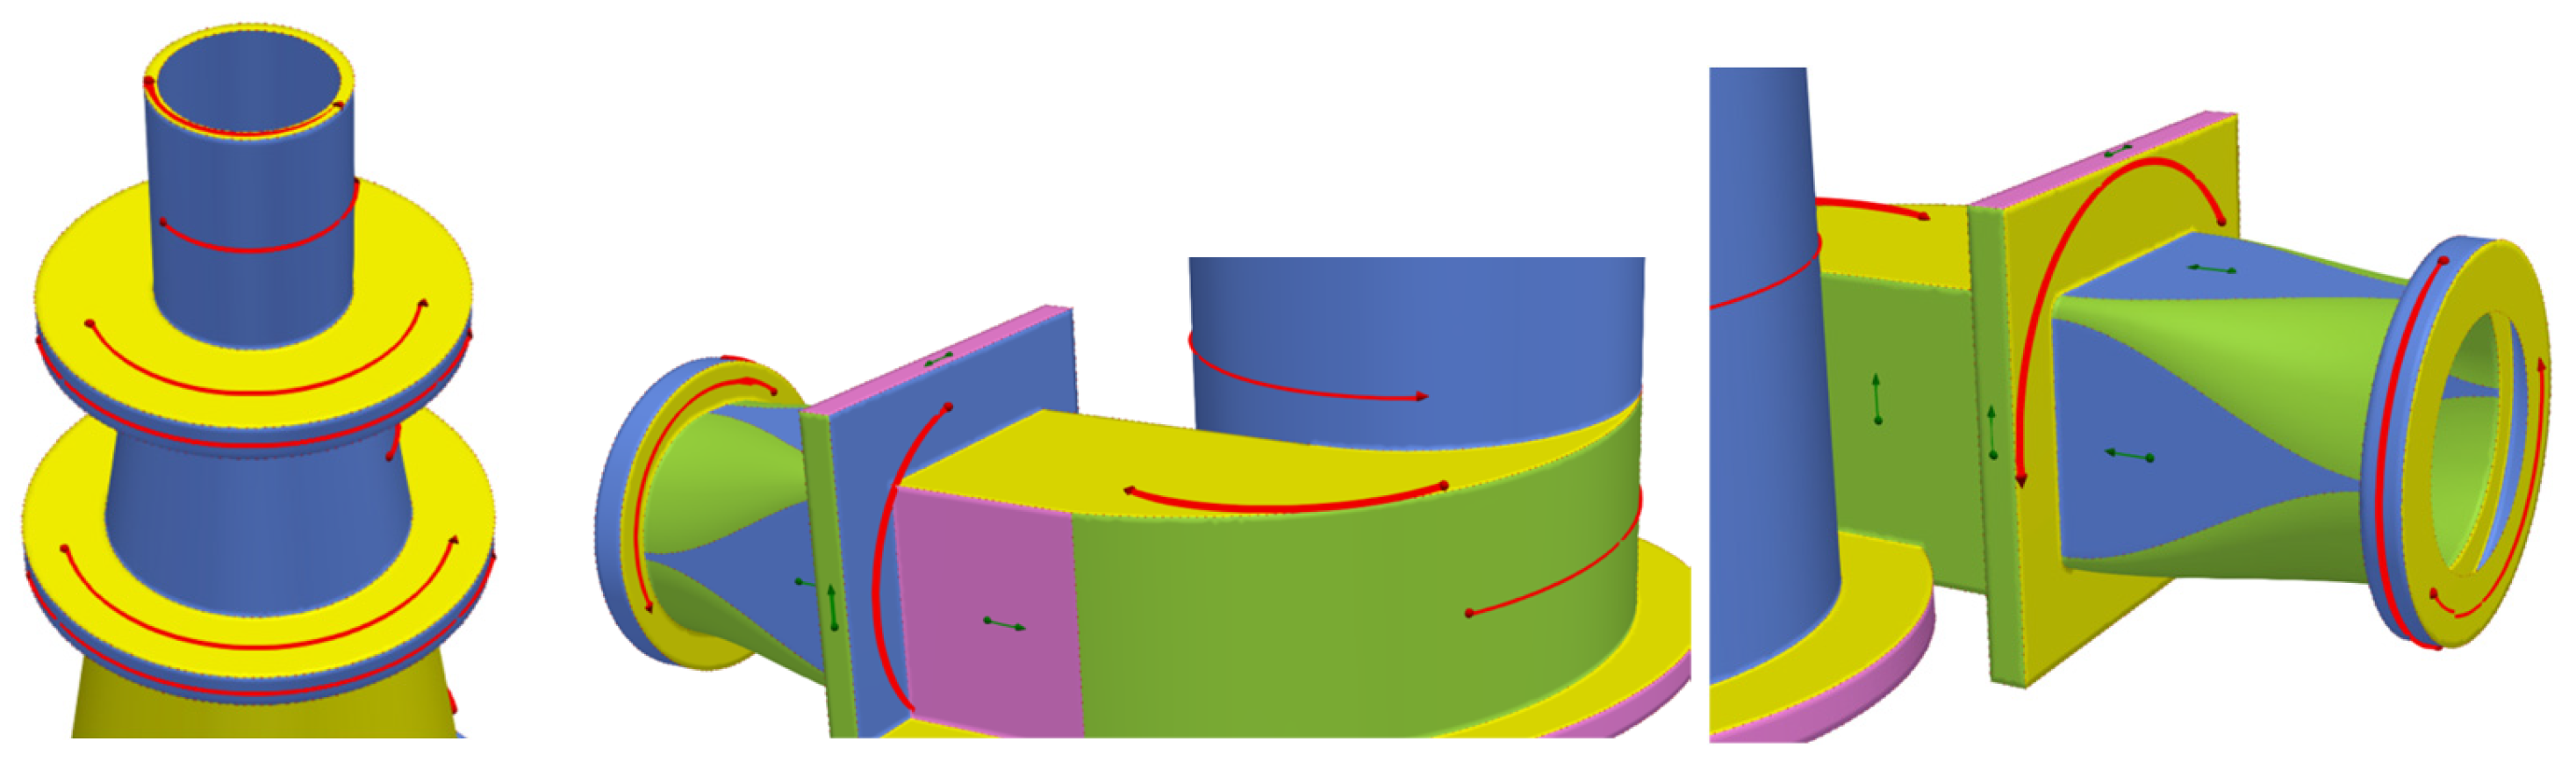

Disclaimer/Publisher’s Note: The statements, opinions and data contained in all publications are solely those of the individual author(s) and contributor(s) and not of MDPI and/or the editor(s). MDPI and/or the editor(s) disclaim responsibility for any injury to people or property resulting from any ideas, methods, instructions or products referred to in the content. |
© 2026 by the authors. Licensee MDPI, Basel, Switzerland. This article is an open access article distributed under the terms and conditions of the Creative Commons Attribution (CC BY) license.