


Abstract
Traditional garment accessory design often relies on designers’ subjective experience and emphasizes basic functionality while insufficiently addressing consumers’ affective needs. As emotional and aesthetic expectations for apparel continue to rise, accessory evaluation increasingly requires integrating function, aesthetics, and emotional experience. This study proposes a systematic framework for the design and optimization of garment accessory textures based on consumer affective needs, using zipper design as a case study. First, affective descriptors were collected using the affinity diagram method, and the semantic differential method evaluated the affective perceptions elicited by representative parametric samples. The G1 method determined descriptor weights, while quality function deployment identified four best-matched texture schemes for 3D modeling and physical prototyping. Subsequently, a multi-criteria evaluation system was established. Objective indicator weights were calculated using the CRITIC method, and the optimal design was determined through the TOPSIS framework. Finally, the eye-tracking experiment provides behavioral evidence from visual attention analysis supporting the proposed framework. The results reveal that functional-aesthetic integration dominates affective evaluation, alongside visual unity, proportional coordination and grip stability. Among the alternatives, the radial dotted texture achieved the highest affective compatibility. The proposed model effectively translates consumer affective needs into design decisions and provides a practical optimization approach for innovative garment accessory design.
1. Introduction
Garment accessories refer to all auxiliary materials and components used in garments, excluding the main fabric. They are essential components ensuring structural and functional integrity while directly influencing functionality, aesthetics, perceived quality, and overall wearing experience. In recent years, driven by evolving consumer demand, industrial transformation, technological development, and socio-cultural changes, clothing consumption has increasingly shifted from primarily functional considerations toward affective and experiential concerns [1]. Consequently, consumers now place higher demands on clothing products. Product appearance and design elements, as the primary cues perceived by consumers, can significantly influence purchase decisions by evoking affective resonance [2]. Ge et al. [3] investigated the aesthetic needs associated with men’s solid-color shirts. They identified key consumer aesthetic preferences and quantified the relationships between these preferences, style elements, and color schemes. Based on these findings, they developed design recommendation guidelines and validated their effectiveness through questionnaires and interviews. Zhao et al. [4] integrated consumers’ affective needs into product form design and introduced optimization algorithms to achieve emotion-driven shape optimization. Existing studies have mainly focused on clothing or product appearance design based on consumers’ affective needs, while relatively little attention has been paid to garment accessories. More importantly, the connection between affective need identification, parametric texture generation, and systematic design evaluation remains insufficiently explored in this context.
Within clothing products, accessories serve as important touchpoints through which consumers perceive product quality and affective experience. However, garment accessories have often been treated primarily as cost-control components rather than value-added design elements, weakening the connection between accessory design and consumers’ affective needs. Therefore, systematically incorporating affective needs into accessory design warrants further investigation.
This study uses garment zippers as a case study because of their essential functionality, perceptual visibility, and frequent consumer interaction. Current zipper research mainly focuses on tooth structure and functional innovation, while systematic studies of surface texture aesthetics and their relationship with consumers’ affective needs remain limited. Existing approaches also lack an integrated process for translating affective needs into parametric texture schemes and subsequently evaluating these schemes through multi-criteria decision-making. To address the above research gaps, this study aims to achieve the following objectives: (i) to identify affective descriptors based on consumers’ affective needs parametric texture samples and optimize the samples according to descriptor weights; (ii) to construct a zipper design evaluation system with clearly defined weights and to select the optimal scheme through multi-criteria decision-making; and (iii) to examine the consistency between the design decision-making results and consumers’ visual attention responses through eye-tracking experiments. Accordingly, the novelty of this study lies in integrating affective need identification, parametric texture translation, and multi-criteria scheme evaluation within a unified framework, with eye-tracking used as supplementary behavioral evidence.
To implement the proposed framework, this study was conducted through the following sequential stages. First, consumers’ affective descriptors of zippers were collected through offline interviews, online reviews, and research reports. The affinity diagram method was then used for preliminary screening and the construction of bipolar adjective pairs. Based on 48 parametric texture samples selected by experts, the final affective descriptors were determined. Next, the Order Relation Analysis (G1) method was applied to calculate the relative weights of these descriptors, and Quality Function Deployment (QFD) was used to map them onto parametric texture samples, from which four representative samples were selected. The selected textures were then incorporated into zipper designs through Grasshopper modeling and produced as physical prototypes. Subsequently, a zipper evaluation system was established, the CRITIC method was used to determine objective indicator weights, and TOPSIS was used to rank the four design schemes. Finally, an eye-tracking experiment was conducted to evaluate consumers’ visual attention responses, and the results were compared with the TOPSIS ranking to examine their consistency.
The remainder of this paper is organized as follows: Section 2 reviews the relevant studies and theoretical foundations. Section 3 presents the research methodology and overall research process. Section 4 presents the design study using zippers as a case example. Section 5 presents the eye-tracking and subjective evaluation results and discusses the findings in relation to the proposed framework and existing methods. Section 6 summarizes the main conclusions of this study and proposes directions for future research.
2. Literature Review
2.1. Consumer Affective Needs and Affective Design
In recent years, consumers’ affective needs have become increasingly prominent across multiple design fields, including jewelry, textiles, and packaging [5,6,7], and have become an important driver of design innovation. Affective design captures consumers’ affective preferences and translates abstract experiences into concrete design elements, thereby enhancing consumer experience and market competitiveness. Jiang et al. [8] applied Kansei Engineering to incorporate necklace elements inspired by bodhisattva imagery from the Yungang Grottoes into modern qipao design. Through sensory evaluation and fuzzy logic analysis, they examined the compatibility of these elements with three qipao styles and their associated sensory characteristics, providing a reference for the modern reinterpretation of traditional elements. Ren et al. [9] combined the analytic hierarchy process and the coefficient of variation method to develop a neural network model optimized by a genetic algorithm. This model quantified the mapping relationship between consumers’ perceptions of air purifiers and their morphological features, thereby offering scientific support for affective design prediction and decision-making. Wang et al. [10] accurately mapped the cultural symbols of the Marquis of Haihun to consumers’ affective needs and employed multi-criteria decision-making to optimize the design of Chinese-style furniture. Their approach enhanced consumer perception through affective design and facilitated the modern transformation of traditional aesthetics in design. Sunstrum et al. [11], based on Gestalt theory, explored the relationship between the visual form of kettles and consumer perception. Their findings revealed the effects of height, shape, and curvature on aesthetic appeal, personality, and symbolic meaning, thus providing a basis for improving product aesthetics and emotional expression.
In summary, contemporary design is shifting to integrate affective and functional considerations. However, two limitations remain. First, affective research on intricate features like parametric textures is underexplored, limiting design optimization at the detail level. Second, unlike overall garment design, affective design of accessories lacks systematic investigation. Therefore, further investigation of consumers’ affective needs in parametric garment accessory design is needed to improve product expressiveness and consumer experience.
Accordingly, this study focuses on garment accessories and employs parametric design tools to develop texture schemes. It establishes a mapping between affective descriptors and design features, combines multi-criteria decision-making methods for scheme evaluation, and uses eye-tracking as supplementary behavioral evidence.
2.2. The Application of Parametric Design in Industrial Products
With the advancement and widespread application of parametric modeling technology in the design field, its technical advantages have been fully demonstrated in design practice. Kang and Wang [12] utilized generative adversarial networks to generate bamboo-weaving patterns. After screening the generated patterns, they employed Grasshopper for parametric modeling, established a model library, and applied it to the design of bamboo-weaving products. Pérez-Arribas [13] used Rhino and Grasshopper to conduct parametric modeling by combining ship geometric parameters with B-spline curves, and proposed a design method for small hulls. By adjusting key parameters to optimize hull forms, this study simplified the design process and improved both efficiency and accuracy. Tian and Ball [14] integrated consumers’ 3D facial data and developed parametric algorithms with Rhino and Grasshopper to achieve the personalized customization of eyeglass frames, thereby improving wearing comfort and visual performance. Wu et al. [15], based on shape grammar, developed a plugin using the QT framework and Grasshopper to enable the rapid transformation of cement tile patterns into 3D models, thereby accelerating innovative design in cultural and creative products.
Overall, in the field of industrial products, parametric design is currently used mainly to generate diverse product form schemes and to transform two-dimensional patterns into three-dimensional models. However, research integrating parametric design with consumer experience and affective evaluation remains limited. At the same time, existing studies have shown that parametric modeling can improve design efficiency by enabling rapid iteration and optimization through parameter adjustment.
Therefore, this study introduces parametric design into the field of garment accessories. This not only extends the application boundaries of parametric design, but also explores a new design path for garment accessories. Through parametric mechanisms, complex texture forms can be generated efficiently, bringing innovative textures and distinctive visual effects to key accessory products such as zippers and buttons. In this way, the possibilities of accessory design are greatly expanded, and strong technical support is provided for improving product differentiation and affective design.
2.3. Garment Accessory Design and Multi-Criteria Decision-Making
Garment accessories have evolved from secondary functional components into important contributors to product value and competitiveness. Driven by technological advancement and the upgrading of consumer demand, their importance has become increasingly prominent. Ku et al. [16] explored the interactive potential of zippers through user research and designed an interactive zipper prototype capable of sensing both slider movement and user status. They further validated its feasibility for enabling active and passive interaction in everyday objects through real-world application scenarios. Yan and Vandenbosch [17] designed a wearable button antenna based on characteristic mode theory and improved radiation efficiency and impedance bandwidth by optimizing button placement. Both the simulation and the experimental results showed that the antenna performed well in free space and when worn on the human body. Cheung and Girouard [18] investigated the preferred size, placement, and gestures for deformable interactive buttons through surveys and experiments. They found that users tended to prefer smaller buttons positioned at the cuff and considered them to have potential for application in multiple scenarios. Zhao et al. [19] examined the feasibility of using bamboo buttons as a substitute for plastic buttons. By optimizing their properties through heat treatment, they analyzed the buttons’ color, structure, and mechanical characteristics. The results indicated that bamboo buttons have potential for lightweight applications, thereby providing both theoretical support and practical reference for replacing plastic with bamboo.
In recent years, multi-criteria decision-making has been widely applied across various design research fields, including public facilities, smart home appliances, design platforms, and public space design [20,21,22,23]. In the clothing industry, tasks related to fabric and garment accessory selection, product design, and development generally require the integration of multiple indicators to compare and select optimal schemes. Acar et al. [24] investigated denim fabrics containing recycled cotton, established a system of fifteen performance and sustainability indicators, and applied a multi-criteria decision-making method to rank candidate fabrics, ultimately selecting the optimal fabric solution for denim jackets and jeans. Li and Shi [25], aiming to improve the wearing experience of medical protective clothing and reduce subjectivity in design, transformed consumer needs into design elements and proposed multiple conceptual schemes. After multi-indicator screening through a decision matrix, the results showed that the selected scheme achieved higher consumer satisfaction than traditional designs. Lian et al. [26] developed an integrated multi-criteria decision-making approach for evaluating design schemes under heterogeneous fuzzy information. Taken together, multi-criteria decision-making methods provide a systematic framework for comparing and ranking design alternatives and supporting design decisions.
In garment accessory research, existing studies have mainly focused on functional enhancement, material innovation, and intelligent interaction, while research that incorporates consumers’ affective needs into accessory design remains insufficient. Although some studies have attempted to evaluate consumer acceptance, their evaluation dimensions have often emphasized functionality, with relatively limited consideration of aesthetics and affective experience. A more integrated approach is therefore needed to balance functional, aesthetic, and affective considerations. Although multi-criteria decision-making methods have been widely used in fabric selection, functional clothing, and fashion design, their application to garment accessories remains relatively underexplored.
To address these gaps, this study constructs an integrated evaluation system for garment zippers based on literature analysis and expert interviews. Furthermore, a garment accessory optimization framework is established through the integrated use of the G1 method, QFD, CRITIC, and TOPSIS. The framework incorporates consumers’ affective needs to support more systematic and objective design decision-making.
3. Methods
3.1. Proposed Framework
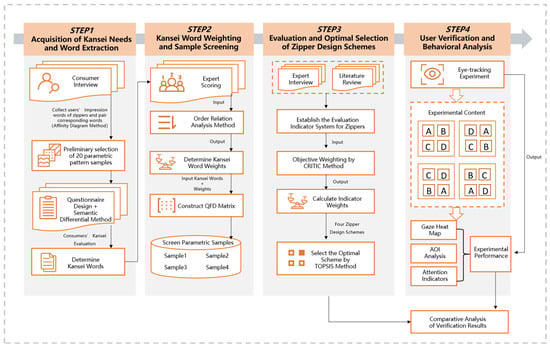
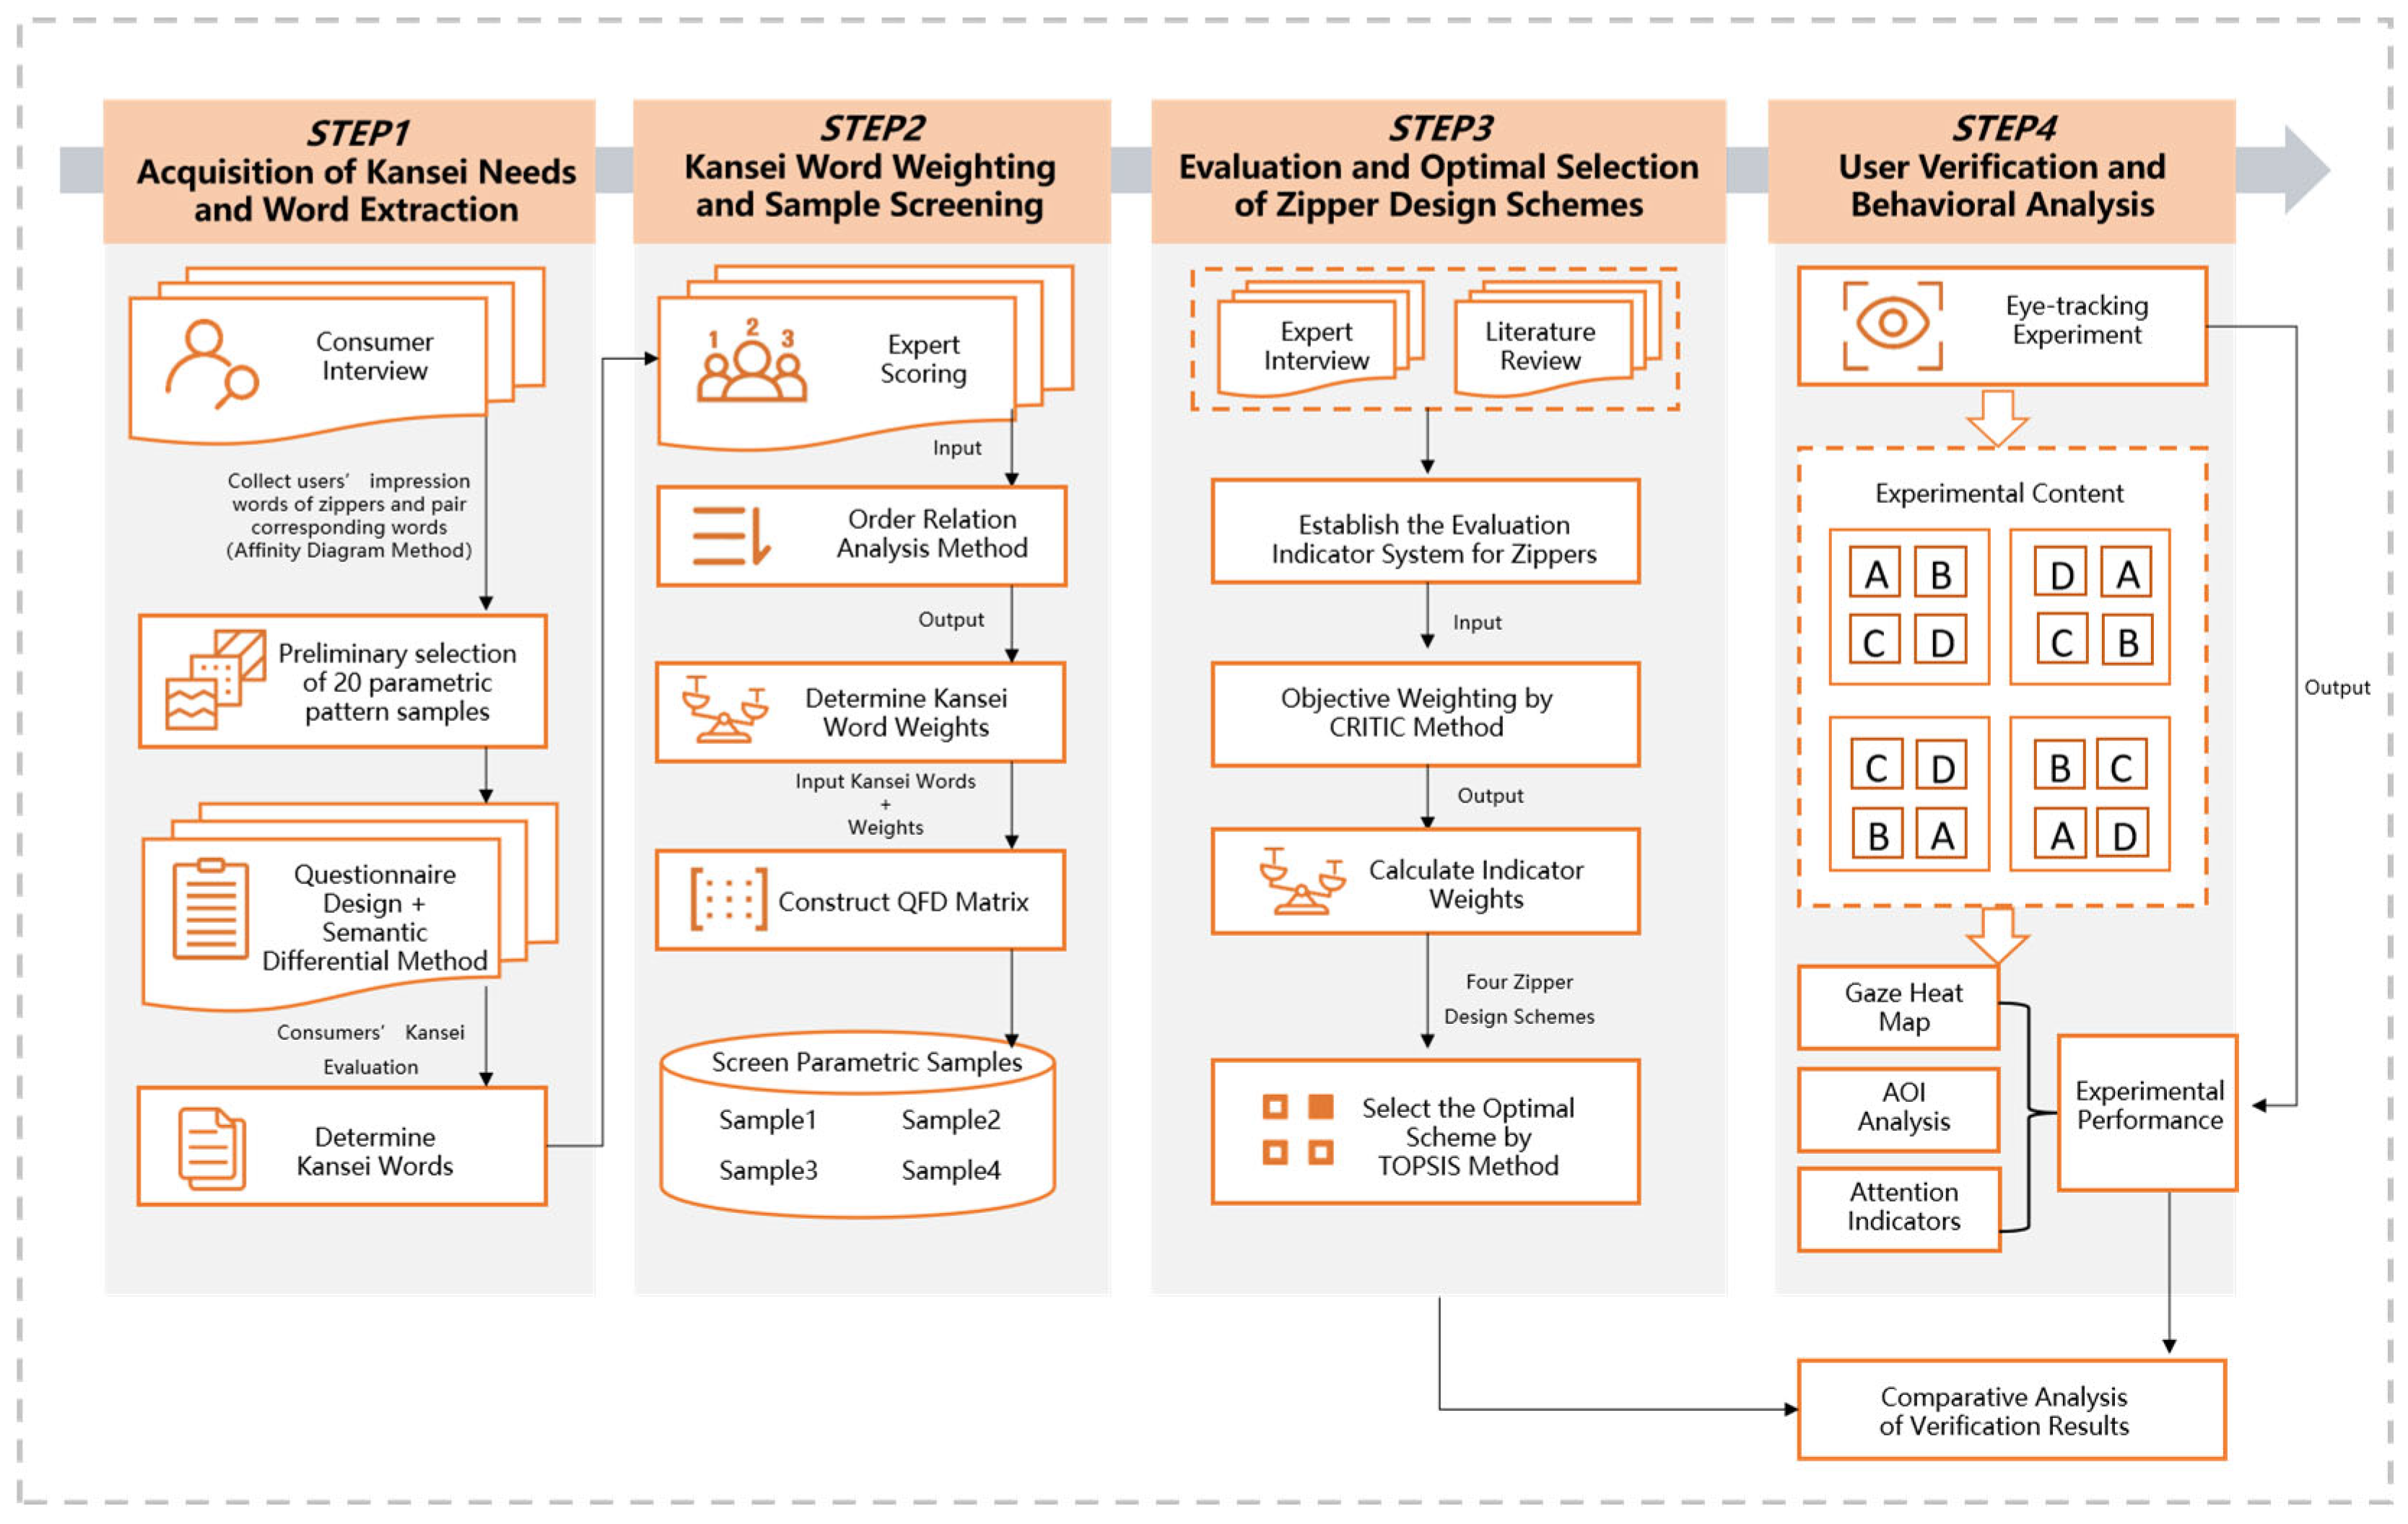
At present, research on garment accessories remains relatively limited, and their design optimization involves multiple evaluation dimensions, requiring the establishment of a systematic decision-making model. As one of the most important functional components among garment accessories, zippers are both functional and perceptually salient, directly influencing the aesthetics and wearing experience of clothing products. Therefore, to examine the applicability of the proposed framework, this study uses zippers as a case study. Based on consumers’ affective needs, this research integrates parametric design methods to construct a systematic framework for garment accessory design and optimization. The research framework is divided into four stages, as shown in Figure 1.
Figure 1.
Proposed framework process. The letters A–D represent the four zipper design schemes evaluated in the user verification experiment.
- First, the affinity diagram method was used to collect and organize consumers’ affective descriptions of zippers and construct bipolar adjective pairs. Subsequently, 48 parametric texture samples were selected, and the semantic differential method was used to evaluate consumers’ affective perceptions and determine the final affective descriptors.
- Next, the weights of each affective dimension were determined using the G1 method. Combined with the QFD matrix, a weighted evaluation was conducted to identify the four highest-ranked parametric texture samples. These textures were then integrated into zipper designs to generate four design schemes.
- Subsequently, a comprehensive evaluation index system for zippers was determined based on interviews with consumers and experts. The CRITIC method was used to identify the discriminative power and importance of the indicators through standard deviation and correlation analysis. An evaluation matrix was then constructed, and the TOPSIS method was applied to rank the schemes to select the optimal design solution.
- Finally, an eye-tracking experiment was conducted to evaluate the four zipper design schemes. Total fixation count, total fixation duration, and average fixation duration were analyzed together with fixation heat maps. The eye-tracking results were then descriptively compared with the TOPSIS ranking to examine the consistency between visual attention patterns and the design evaluation results.
In this framework, each method serves a specific role in the design decision-making process. KJ organizes consumers’ affective descriptions, while the semantic differential method quantifies affective perceptions of parametric texture samples. G1 determines the subjective weights of affective descriptors based on expert judgment, and QFD translates these weighted needs into parametric design schemes. CRITIC then determines the objective weights of evaluation criteria based on data variability and inter-criterion relationships, reducing the influence of subjective weighting in the final evaluation. TOPSIS subsequently integrates these weighted criteria to rank the alternative schemes. Together, these methods form a sequential process from affective need identification and evaluation to design translation, criterion weighting, and final scheme ranking, with each stage providing input for the next.
3.2. Affinity Diagram Method (KJ)
The affinity diagram method (KJ) is a qualitative approach for organizing and synthesizing disparate information into coherent groups and underlying themes [27]. To identify consumers’ affective needs for accessories, raw descriptors were collected through interviews. Guided by experts, these were integrated and paired with antonyms to construct representative affective word pairs. The specific steps were as follows: (1) qualitative consumer interviews were conducted in the field of garment accessories; (2) the collected interview information was summarized into affective needs and recorded on cards; (3) all cards were gathered together, and affective descriptors with similar meanings were grouped and integrated; (4) a core label that could accurately capture the meaning of each category of affective descriptors was extracted; and (5) under expert guidance, the collected affective descriptors were organized into a list of consumers’ affective needs, and bipolar affective word pairs were further established.
3.3. Semantic Differential Method (SD)
The semantic differential method (SD) quantifies individuals’ perceived meanings and attitudinal evaluations of concepts through bipolar adjective scales, and it can also be used to compare multidimensional differences among products or concepts [28]. Because affective responses are subjective, the method was used in this study to quantify consumers’ affective perceptions of garment accessory samples and identify representative affective descriptors. The specific steps were as follows: (1) based on expert opinions, 48 representative parametric samples were initially selected; (2) a questionnaire was designed using the bipolar affective word pairs extracted through the affinity diagram method, and participants were invited to evaluate each design sample on a seven-point Likert scale ranging from −3 to 3; and (3) based on the evaluation results, affective descriptors suitable for research on parametric garment accessories were identified.
3.4. Order Relation Analysis Method (G1)
The G1 method is a weighting approach that derives indicator weights from experts’ rankings and relative importance judgments between adjacent indicators, avoiding the complex judgment-matrix construction and consistency testing required by AHP [29]. Its core idea is to calculate weights directly through the rational assignment of values based on experts’ ranking of the relative importance of evaluation indicators. This method emphasizes the use of hierarchical priority and sequential influence relationships among factors within a system to conduct comprehensive evaluation. In this study, the G1 method was used to calculate the weights of affective descriptors to better understand consumers’ affective needs and provide weighted data for subsequent analysis. The specific calculation steps are as follows:
- (1)
- The evaluation index system is established. Assuming that there are n indicators, denoted as C1, C2, …, Cn, the weight order among these indicators is first determined according to expert judgment. The indicators are then ranked from the most important to the least important, yielding the sequence C1 > C2 > … > Cn.
- (2)
- The relative importance ratio between two adjacent indicators, Ck and Ck−1 (k = 2, 3, 4, 5, …), is calculated. The degree of their relative importance can be expressed by Equation (1), and the assignment of rj values is shown in Table 1.
Table 1.
Reference table for the assignment of rj values.
- (3)
- The weight of the last indicator, Cn, denoted as wn, is calculated using Equation (2), and the weights of the preceding indicators are then derived sequentially in reverse order according to Equation (3).
Here, rj represents the importance of the (j − 1)th indicator relative to the jth indicator. denotes the cumulative product of all ratios from the kth term to the nth term. denotes the summation of these cumulative products from j = 2 to n.
3.5. Quality Function Deployment (QFD)
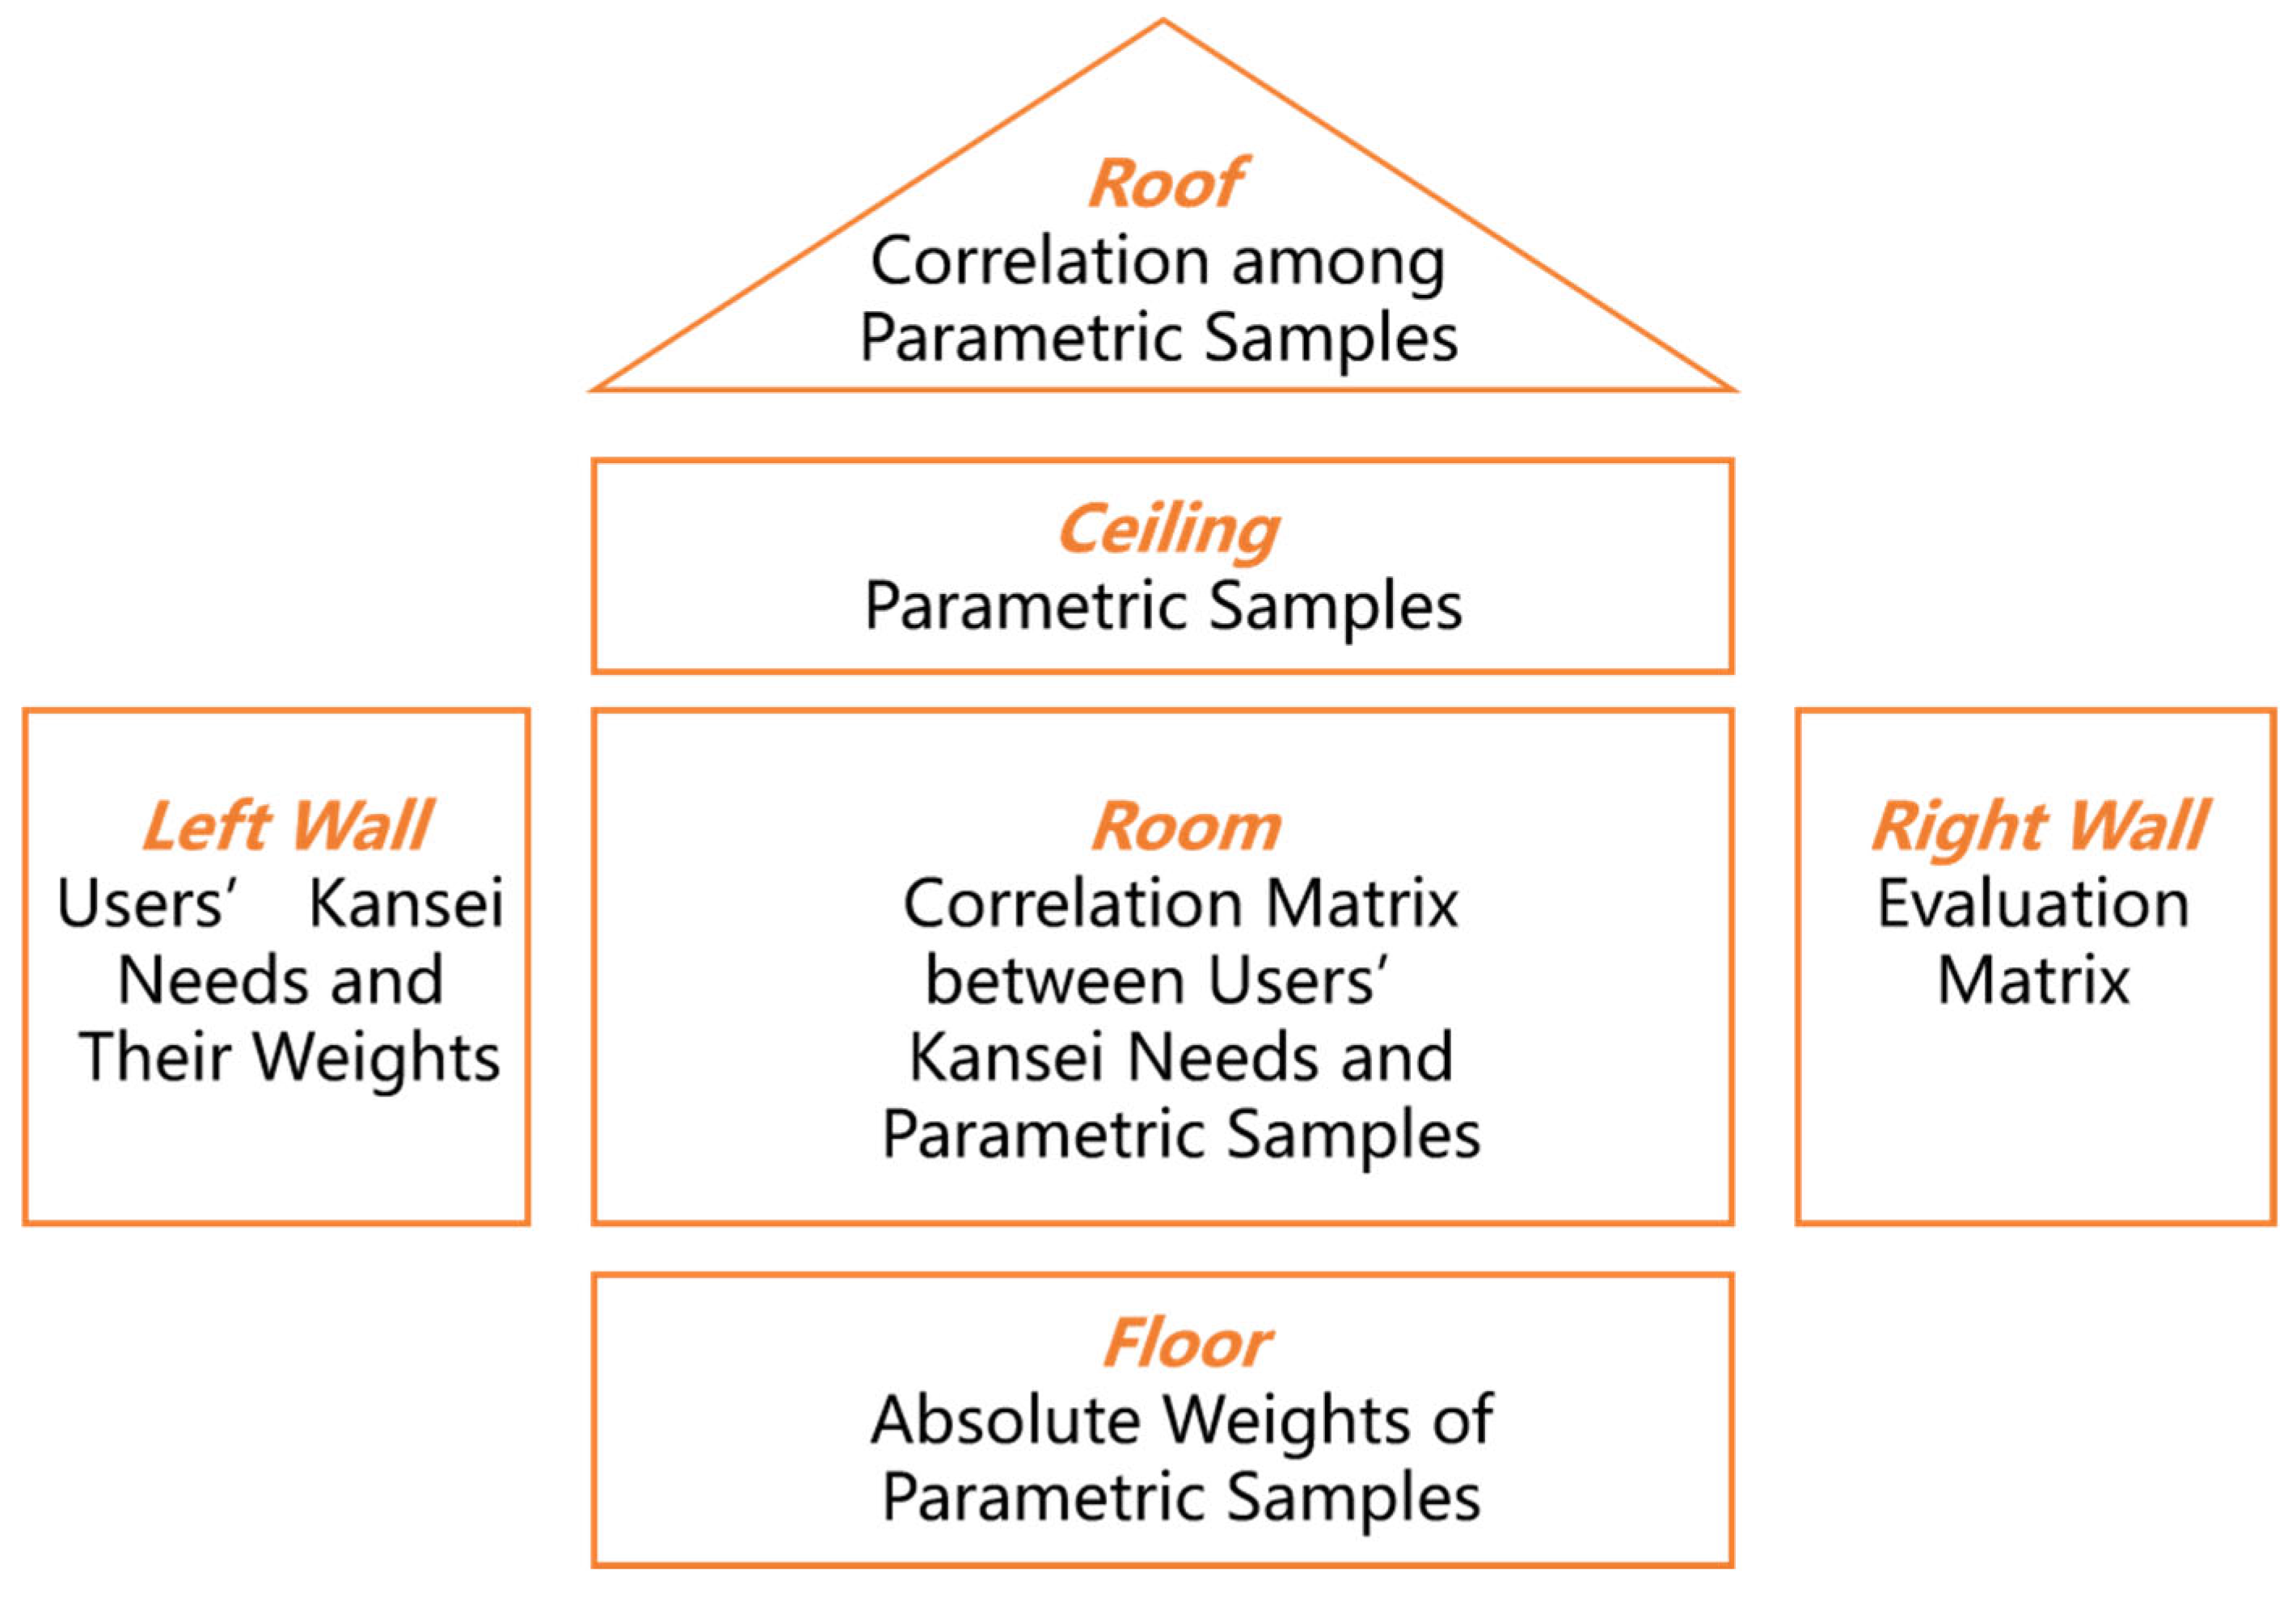
Quality Function Deployment (QFD) is a systematic method for translating consumer needs into product design characteristics [30]. The core tool of this method is the House of Quality, which usually consists of the roof, ceiling, left wall, internal relationship matrix, right wall, and base (see Figure 2). Each part carries different types of information, such as consumer needs, technical characteristics, and the relationships between them [31]. In practical applications, the structure and content of the House of Quality can be appropriately adjusted or simplified according to the specific objectives and complexity of the QFD implementation to improve its operability and practicality. In this study, the QFD method was mainly used to construct the House of Quality so as to transform users’ affective needs into parametric samples. By establishing a weighted matrix, the four parametric samples that best matched consumers’ affective needs were selected for subsequent modeling. The construction and calculation process is as follows:
- (1)
- The consumers’ affective needs and the weight values WPi determined by the G1 method were entered into the left wall of the House of Quality.
- (2)
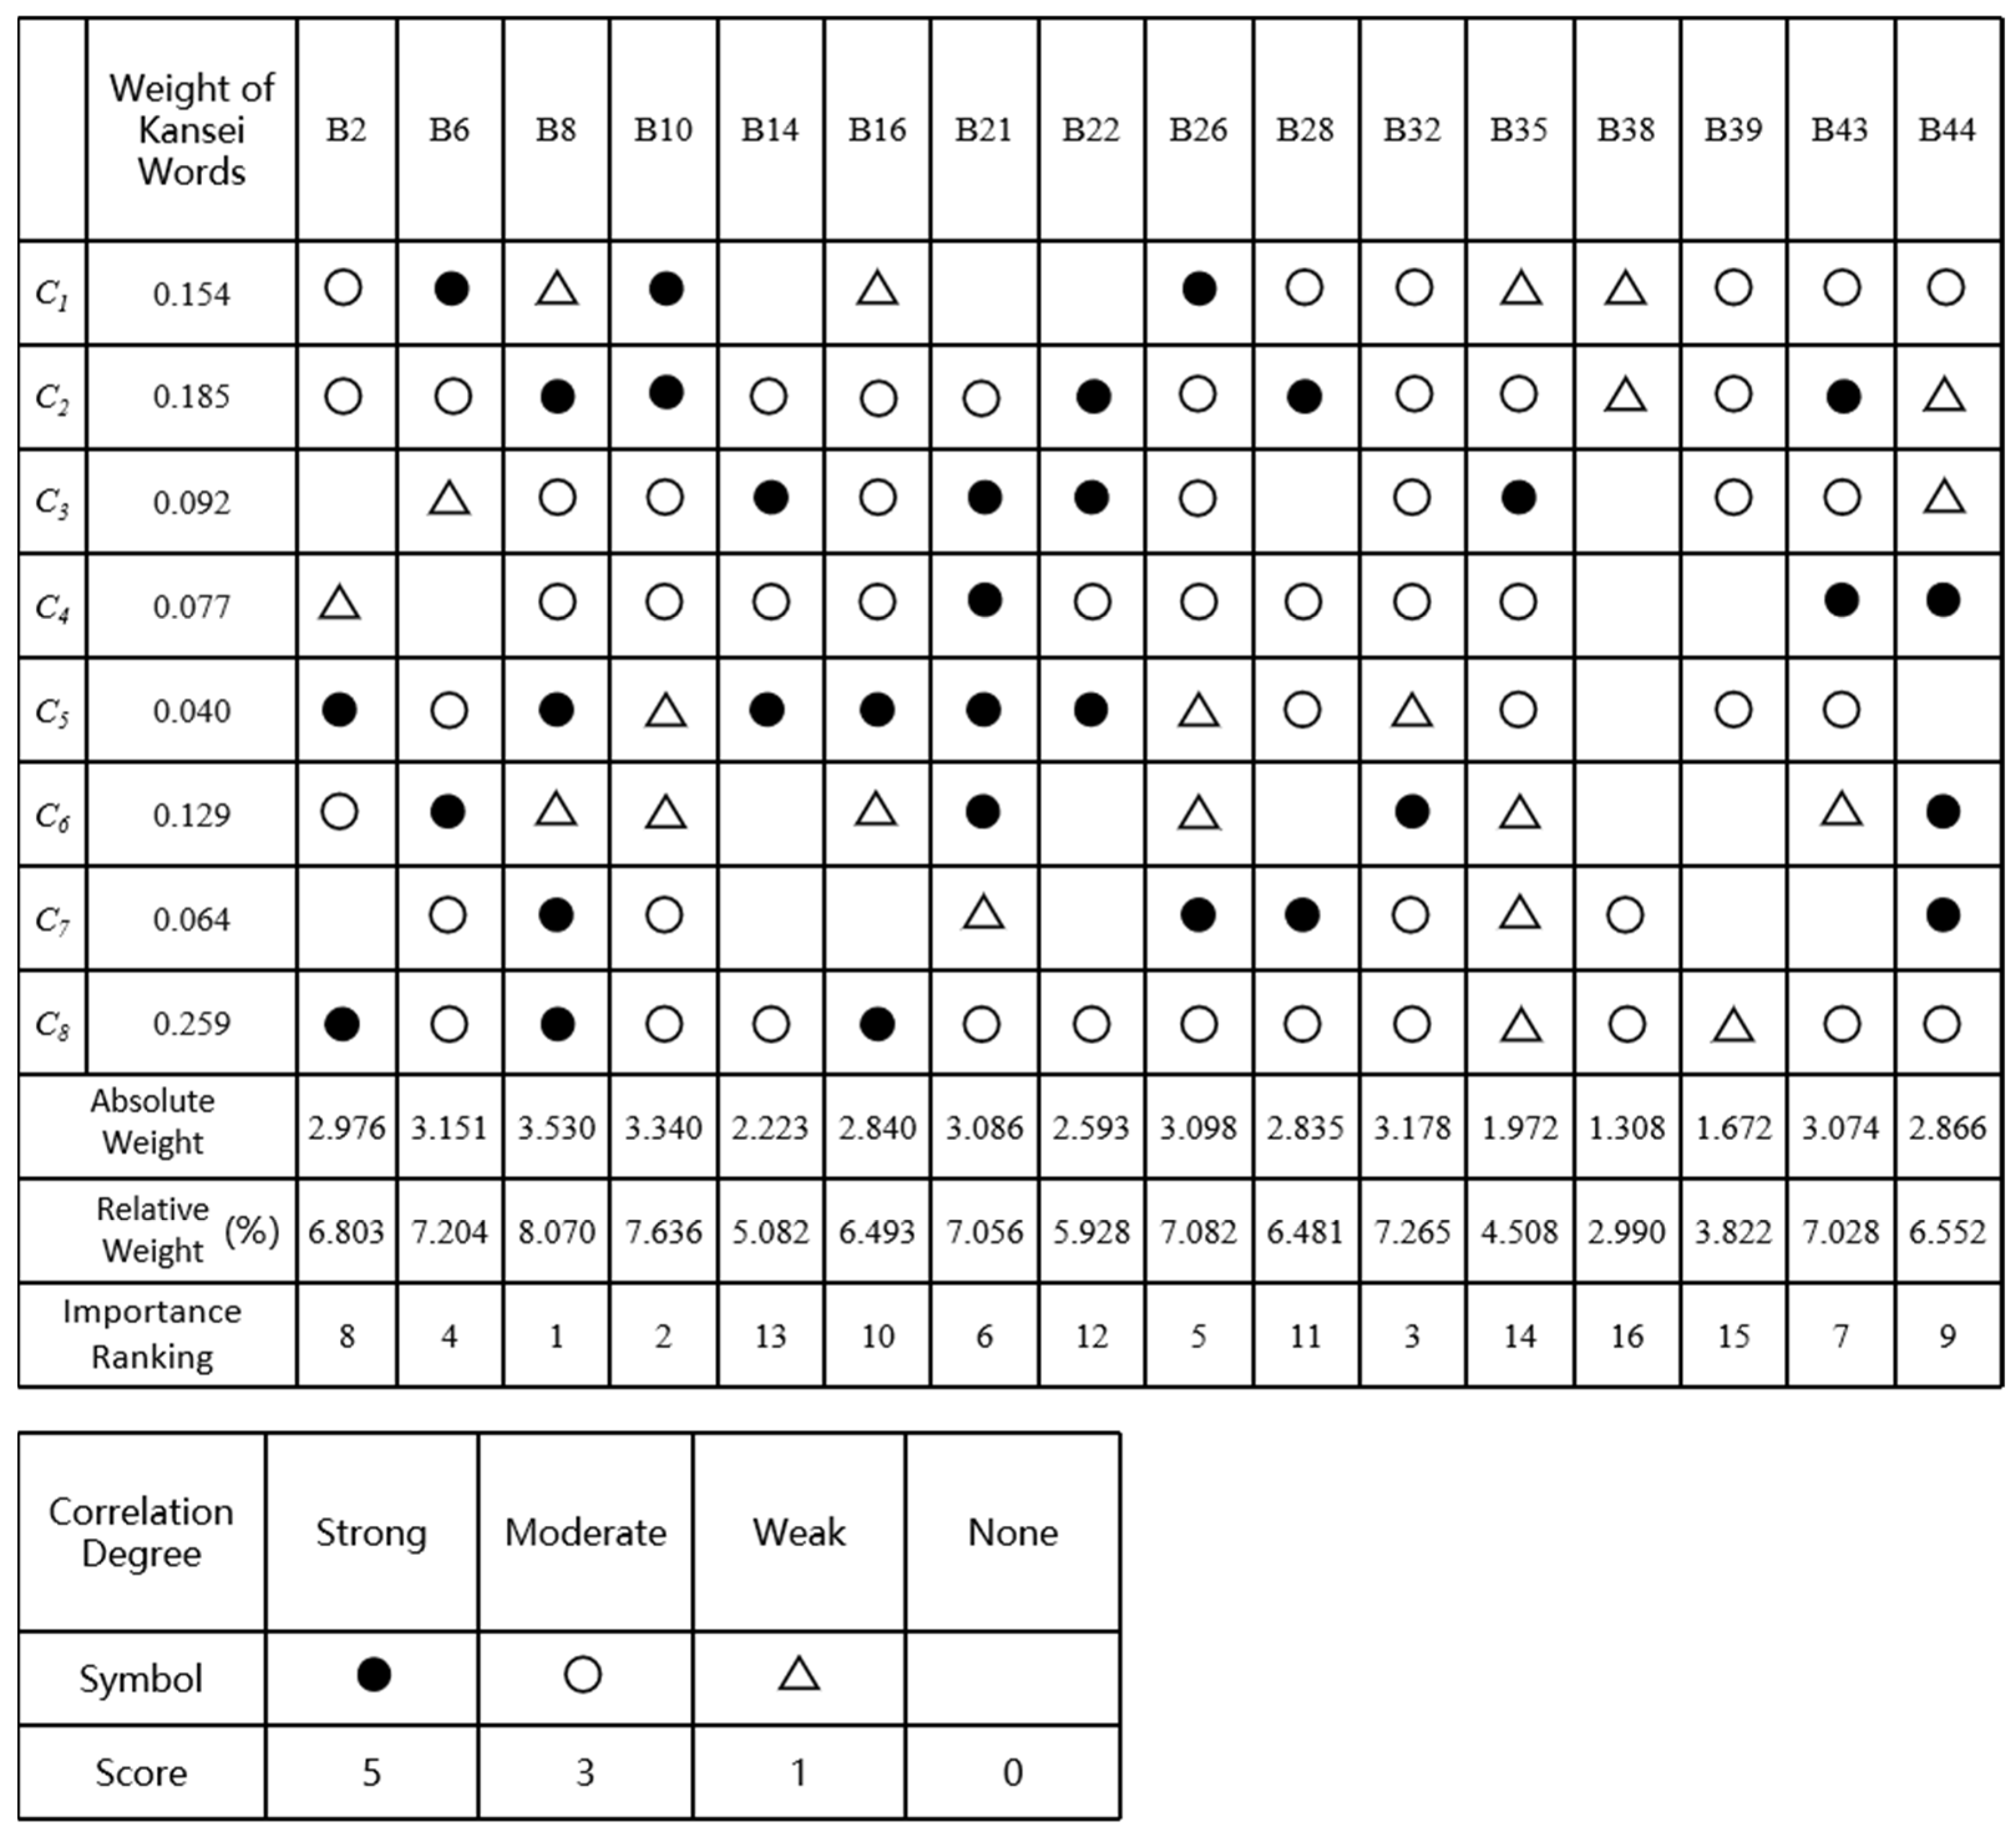
- A matrix correlating consumer affective needs and parametric samples was then constructed. The relationships between consumers’ affective needs and parametric samples were established and quantitatively evaluated according to the rating table for the degree of association. If the set of consumer affective needs is and the set of parametric samples is , then the matrix is shown in Equation (4). The relationships between each affective descriptor and parametric texture sample were evaluated using four levels: strong = 5, moderate = 3, weak = 1, and no relationship = 0. Scores were assigned by experts according to the degree of correspondence between each sample and affective descriptor.
For each candidate sample, the relationship score between each affective descriptor and parametric sample was multiplied by the corresponding G1-derived affective weight, and the weighted values were summed to obtain the absolute score. The absolute scores were then normalized to obtain relative weights, based on which the 16 candidate samples were ranked. The weighted scoring formulas are given in Equations (5) and (6), respectively.
Here, ST represents the weighted score of each sample, WPi denotes the weight of each affective descriptor, WPD denotes the relationship score between affective descriptors and parametric samples, and n is the total number of user needs.
- (3)
- After the weighted scores were calculated, the parametric samples were ranked from high to low according to their weights, and the four highest-ranked parametric samples were subsequently selected for further parametric modeling and prototype fabrication.
Figure 2.
House of Quality model.
3.6. CRITIC Method
As consumers’ demands for garment accessories have shifted from single-function requirements to multidimensional expectations, designers need to comprehensively consider the relationships and weights among multiple evaluation indicators in order to optimize design decision-making. The CRITIC method is an objective weighting method based on data information [32]. It calculates objective weights by quantifying the contrast intensity of each indicator and the conflict information among indicators [33,34], reducing dependence on subjective judgment. This improves the objectivity and accuracy of the accessory evaluation system, helping designers make more scientifically grounded decisions. The specific steps are as follows:
- (1)
- Expert scoring data were first collected, and each evaluation indicator was rated.
- (2)
- The original evaluation matrix was then standardized to eliminate the influence of different dimensions. Equation (7) gives the commonly used standardization formula.
Here, is the value in the original evaluation matrix, is the standardized value, and max() and min() are the maximum and minimum values of the jth indicator, respectively.
- (3)
- Next, the standard deviation of each evaluation indicator was calculated. The standard deviation reflects the degree of dispersion of each indicator. A larger standard deviation indicates that the indicator has stronger discriminative ability. Equation (8) gives the formula for calculating the standard deviation σj.
Here, is the mean value of the jth indicator, and m is the number of samples.
- (4)
- The correlation coefficient rjk between indicator j and each other indicator k was then calculated to measure the relationships among indicators. The formula for calculating the correlation coefficient is given in Equation (9).
- (5)
- The standard deviation and the correlation among indicators were then combined to calculate the information content Cj of each indicator. The formula for information content is shown in Equation (10).
Here, n is the total number of indicators, and rjk is the correlation coefficient between indicator j and indicator k. A larger information content indicates greater importance of the indicator.
- (6)
- Finally, the weight wj of the jth indicator was calculated according to the Cj values of all indicators.
3.7. Technique for Order Preference by Similarity to an Ideal Solution (TOPSIS)
The Technique for Order Preference by Similarity to Ideal Solution (TOPSIS) is a multi-attribute decision analysis method. Its main advantage lies in ranking and comparing alternative schemes by quantifying their distances from the positive ideal solution and the negative ideal solution. It is therefore suitable for multi-attribute decision-making problems involving multiple conflicting indicators [35]. After normalization, the indicator data are weighted using the CRITIC results, and relative closeness to the ideal solution is calculated to rank the schemes. In this study, TOPSIS was used to identify the highest-ranked garment accessory design scheme. The specific steps are as follows:
- (1)
- First, an evaluation matrix is constructed. Assume that there are n candidate schemes to be evaluated according to m evaluation criteria.
Here, i ranges from 1 to n, and j ranges from 1 to m. xij represents the score of scheme i on indicator j.
- (2)
- Next, the decision matrix is normalized by the square-sum method. Equation (13) gives the normalization formula.
This yields the standardized matrix R, which eliminates dimensional differences among indicators and makes them comparable.
- (3)
- Then, a weighted standardized decision matrix is constructed. Let the weight of each indicator be wj, and let the weight vector be W = (w1, w2, …, wm).
- (4)
- The positive ideal solution and the negative ideal solution are then determined.
- (5)
- The distances between each scheme and the positive and negative ideal solutions are then calculated using Euclidean distance.
- (6)
- Next, the relative closeness coefficient Ci is calculated. A larger value of Ci indicates that scheme Ai is closer to the ideal solution and therefore ranks higher.
- (7)
- Finally, all schemes are ranked in descending order according to the value of Ci, and the scheme with the largest Ci is identified as the optimal scheme.
4. Case Study
Because zippers are common garment accessories whose affective attributes can influence consumer perception, this section presents a zipper design case study to examine the applicability of the proposed framework.
4.1. Acquisition of Affective Need Descriptors
To identify consumer affective descriptors, semi-structured interviews were conducted. Participants were selected based on their clothing consumption experience and ability to describe their perceptions and usage experiences of garment zippers. A total of 20 participants, including 10 males and 10 females aged 20–35 years, were recruited. Each interview lasted approximately 15 min and focused on participants’ perceptions, usage experiences, and affective expectations regarding garment zippers. After the interview data were organized and anonymized, initial affective descriptors were extracted. In addition to interview data, affective descriptors applicable to zipper design were gathered from previous research on affective needs and were further supplemented with online consumer reviews. Based on these sources, a relatively comprehensive library of emotion descriptors was established. To further refine these descriptors, a focus group comprising five experienced consumers, three fashion design students, one accessory-industry design director, and one university professor was convened to construct the affinity diagram. This mixed composition was intended to incorporate consumer experience, design training, industry practice, and academic expertise into the descriptor screening process. Because differences in participants’ backgrounds and experience may influence the interpretation and grouping of affective descriptors, several rounds of group discussion were conducted to reconcile different perspectives. The focus group merged and summarized affective descriptors with similar meanings, resulting in 16 core descriptors. After several rounds of group discussion, these descriptors were finally organized into eight pairs of bipolar descriptors, as shown in Table 2.
Table 2.
Preliminary affective descriptors.
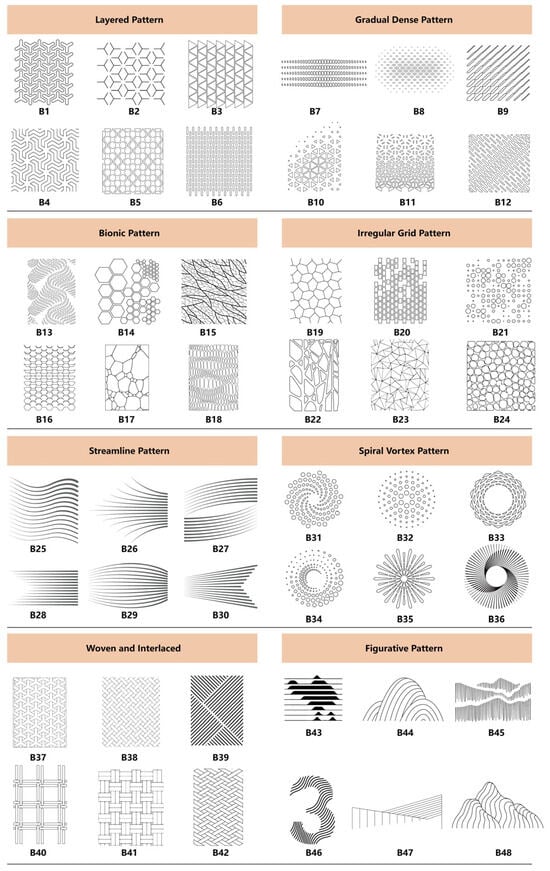
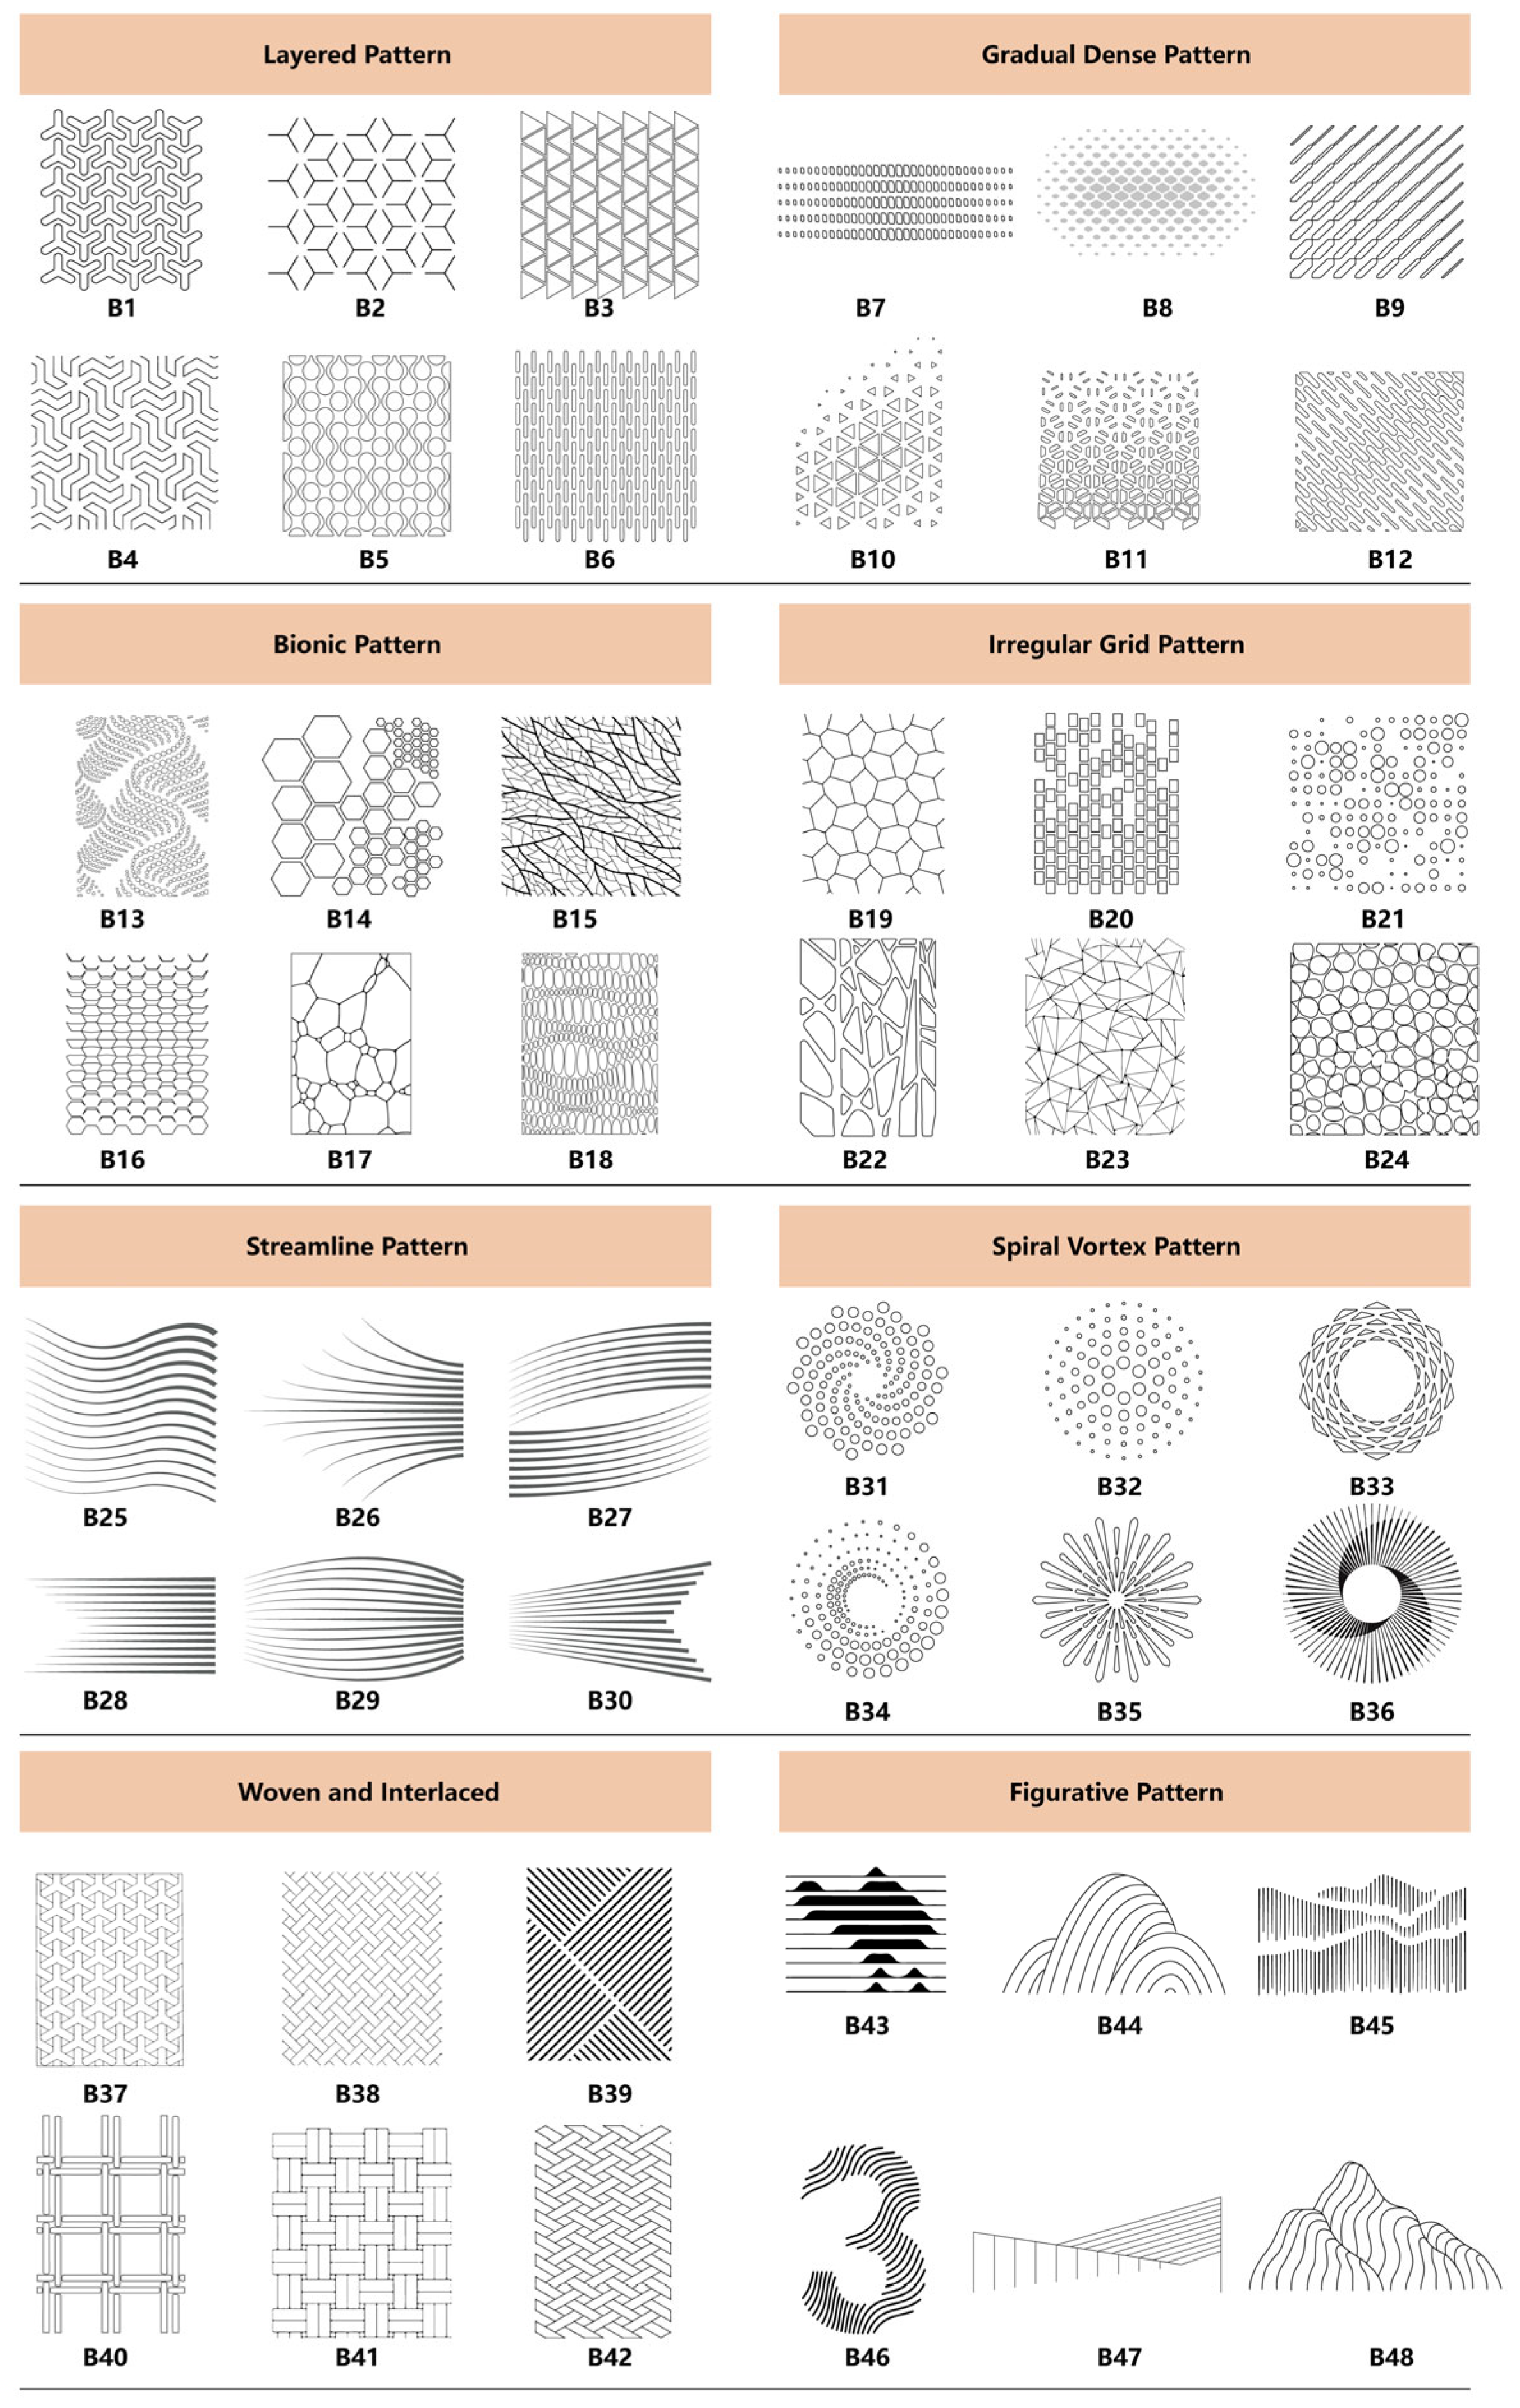
To provide a foundation for subsequent design evaluation, a representative parametric texture sample library was constructed. A total of 194 parametric texture images were collected to form the initial sample library. Based on their compositional forms and visual presentation characteristics, the samples were systematically classified into eight categories: periodic textures, gradient deformation textures, bionic textures, random irregular textures, streamline textures, spiral and vortex textures, woven and interlaced textures, and figurative textures. Subsequently, three experts with experience in parametric design and garment accessory development independently screened representative texture patterns from each category. After discussion and consensus among the experts, 48 representative parametric texture samples were finally identified and coded as B1–B48, as shown in Figure 3. The screening criteria included: (1) representativeness of the corresponding texture category; (2) appropriate visual diversity among samples to avoid excessive redundancy while preserving variations within each category; (3) sufficient visibility of texture characteristics when applied to the relatively small surface area of zipper pullers; and (4) feasibility for subsequent parametric reconstruction and prototype fabrication.
Figure 3.
Parametric texture samples.
In this study, the 48 relevant sample images illustrated in Figure 3 were coded, and a seven-point Likert scale was constructed using eight pairs of affective words. Table 3 presents the questionnaire designed for the parametric samples. The scoring range of the scale was set from −3 to 3, where −3 represented the adjective on the left side of each affective word pair, 3 represented the adjective on the right side, and 0 indicated the neutral point. Participants were asked to rate each word on the scale from −3 to 3 according to their own affective cognition of the attributes of the sample images, reflecting the intensity of their affective perception. A higher absolute score indicated a stronger tendency toward the corresponding adjective pole. Table 3 presents an example of one participant’s ratings.
Table 3.
Example of participant A’s affective ratings of parametric samples.
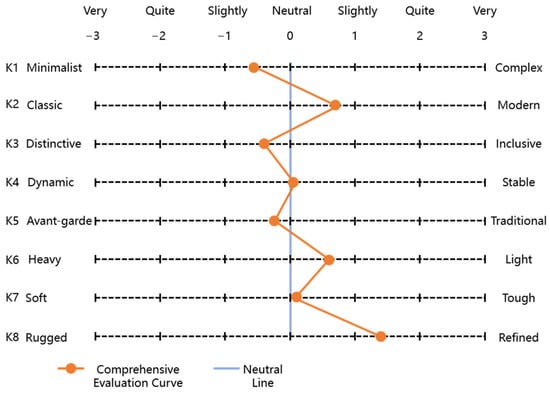
A total of 126 valid questionnaires were collected in this survey, including 80 university student consumers, 30 fashion designers, and 16 accessory procurement personnel. All participants evaluated the 48 parametric texture samples using the semantic differential scale, and the ratings for each texture sample–affective descriptor pair were aggregated for subsequent analysis. The aggregated affective scores of the 48 parametric samples are presented in Table 4. Based on these evaluation results, the semantic differential curve was generated to illustrate participants’ affective perceptions of the samples, as shown in Figure 4. The affective tendency of each adjective pair was further determined according to the positive and negative values, and the eight selected affective descriptors are presented in Table 5.
Table 4.
Affective word matrix of 48 parametric samples.
Figure 4.
Semantic differential curve.
Table 5.
Eight preliminary affective descriptors.
4.2. Affective Descriptor Weighting and Parametric Sample Screening
The G1 method was employed to determine the weights of the eight affective descriptors obtained through preliminary screening. An expert panel comprising accessory-industry specialists and university professors discussed and ranked the descriptors. The final order of importance was determined as C8 > C2 > C1 > C6 > C3 > C4 > C7 > C5. Based on the panel’s overall judgment, the importance ratios rj between adjacent affective descriptors were then assigned. The value assignment criteria are shown in Table 1, and the results are presented in Table 6.
Table 6.
Importance ratios between adjacent affective descriptors.
According to Equation (2), the weight w8 of the last affective descriptor C5 was first obtained. Then, according to Equation (3), the weights of the preceding indicators were derived sequentially in reverse order. The results are shown in Table 7. After normalization, the sum of the weights was approximately equal to 1, confirming the validity of the results.
Table 7.
Weights of the affective descriptors.
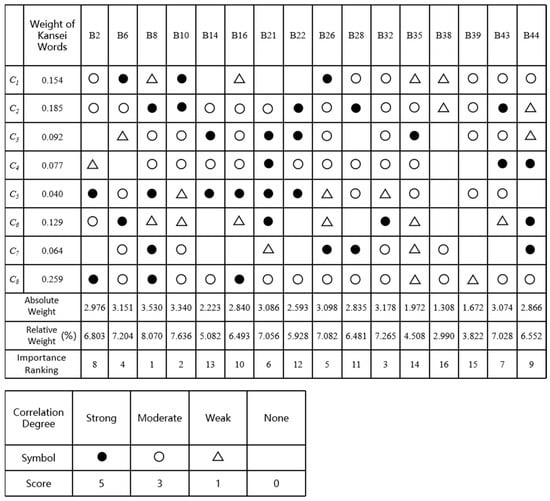
After the affective descriptor weights were determined, two samples were selected from each of the eight parametric texture categories based on expert judgment, yielding 16 candidate samples. The selected samples reflected small-scale decorative features relevant to garment accessories and were suitable for fabrication and visual recognition on compact accessory surfaces. The selected samples were B2, B6, B8, B10, B14, B16, B21, B22, B26, B28, B32, B35, B38, B39, B43, and B44. Subsequently, a House of Quality was constructed based on the QFD method, as shown in Figure 5.
Figure 5.
Relationship between parametric samples and affective descriptor weights.
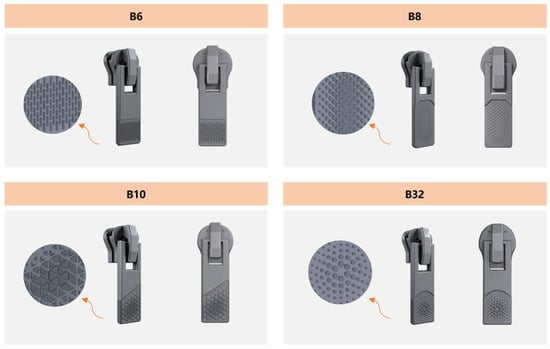
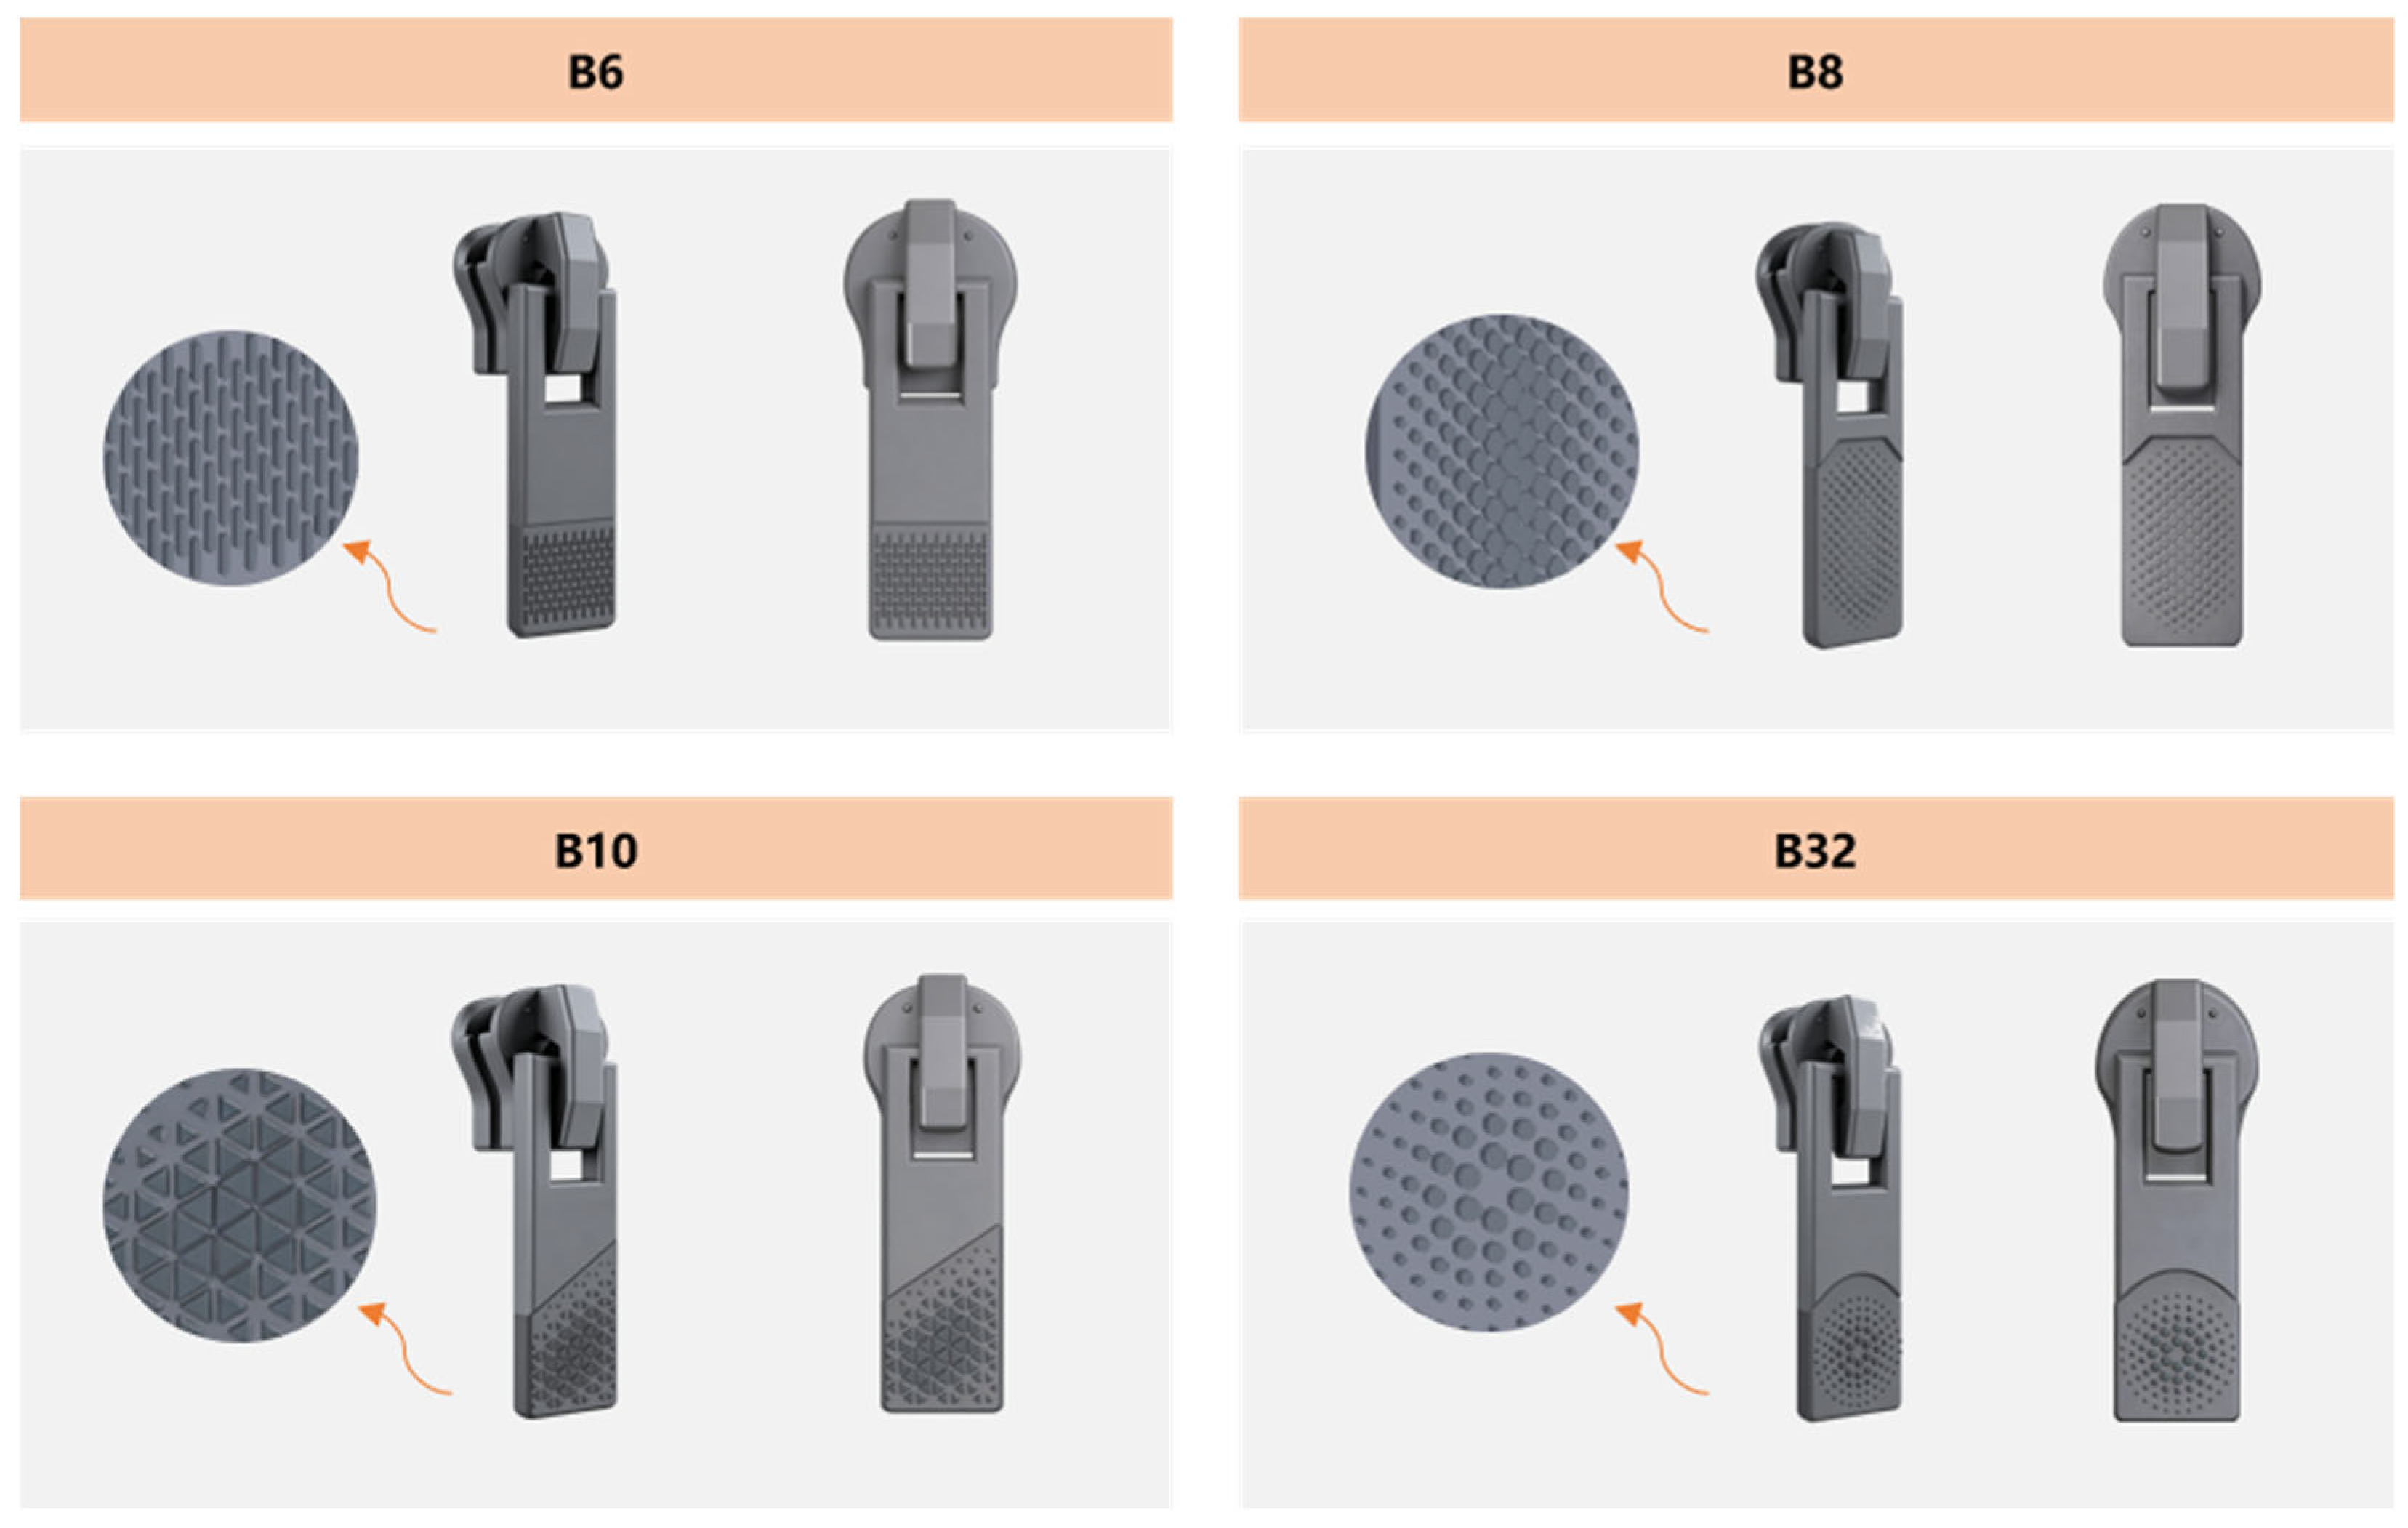
Based on the QFD calculation results obtained from Equations (4)–(6), the 16 candidate parametric texture samples were ranked according to their relative weights, as shown in Figure 5. The four top-ranked samples, B6, B8, B10, and B32, were selected for subsequent parametric modeling and prototype fabrication.
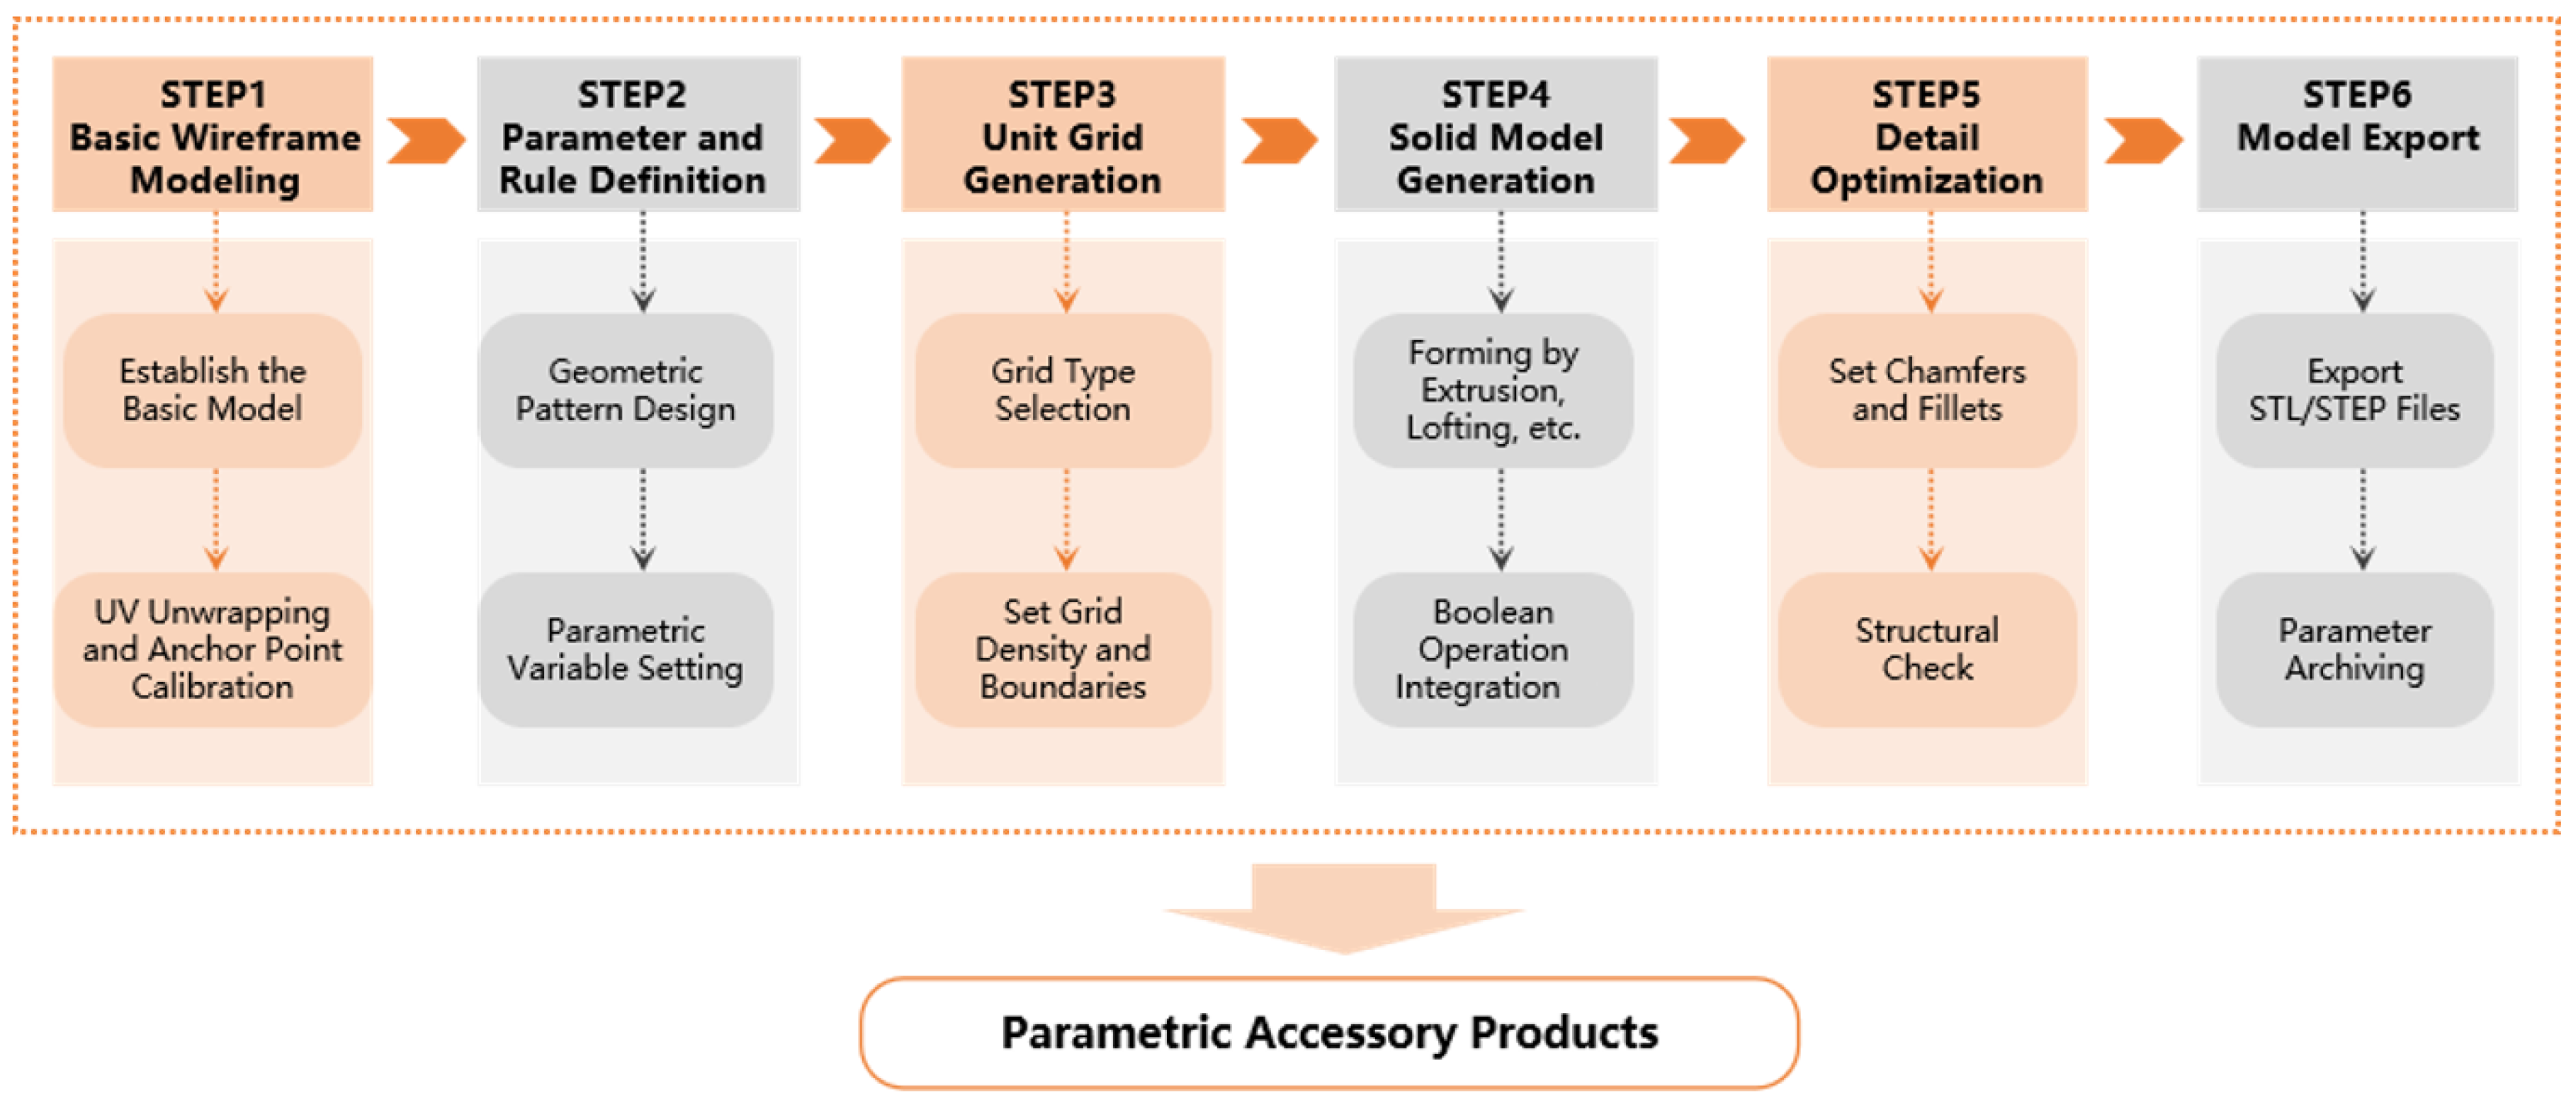
4.3. Parametric Zipper Design
After the four highest-ranked samples were selected, parametric programming and modeling were performed using Grasshopper. Existing zipper products were first investigated to identify widely used zipper types and materials. Based on the survey results, a rectangular pull tab with broad applicability was selected as the base model. Ergonomic considerations focused on the main hand-contact area, generally located in the lower-middle part of the zipper puller. Parametric textures were applied to this area, with the surface slightly recessed and the texture moderately raised. This configuration enhances visual refinement and provides a textured surface that may contribute to improved perceived usability during operation. By defining grid layouts, unit forms, and control parameters in Grasshopper, different parametric textures could be generated and mapped onto the zipper surface. The parameters were further adjusted to meet manufacturing and dimensional requirements, supporting prototype fabrication and subsequent evaluation. Grasshopper also enabled rapid iteration through parameter linkage while improving the reproducibility of the design process. The overall workflow is shown in Figure 6, and the detailed Grasshopper visual programming processes are provided in Appendix A.
Figure 6.
Workflow of parametric design for garment accessories.
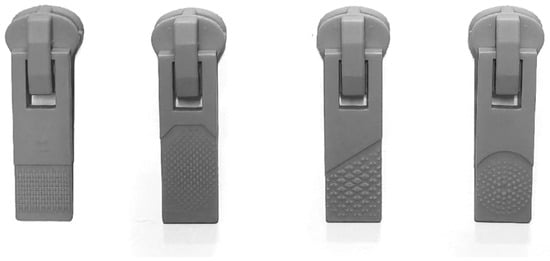
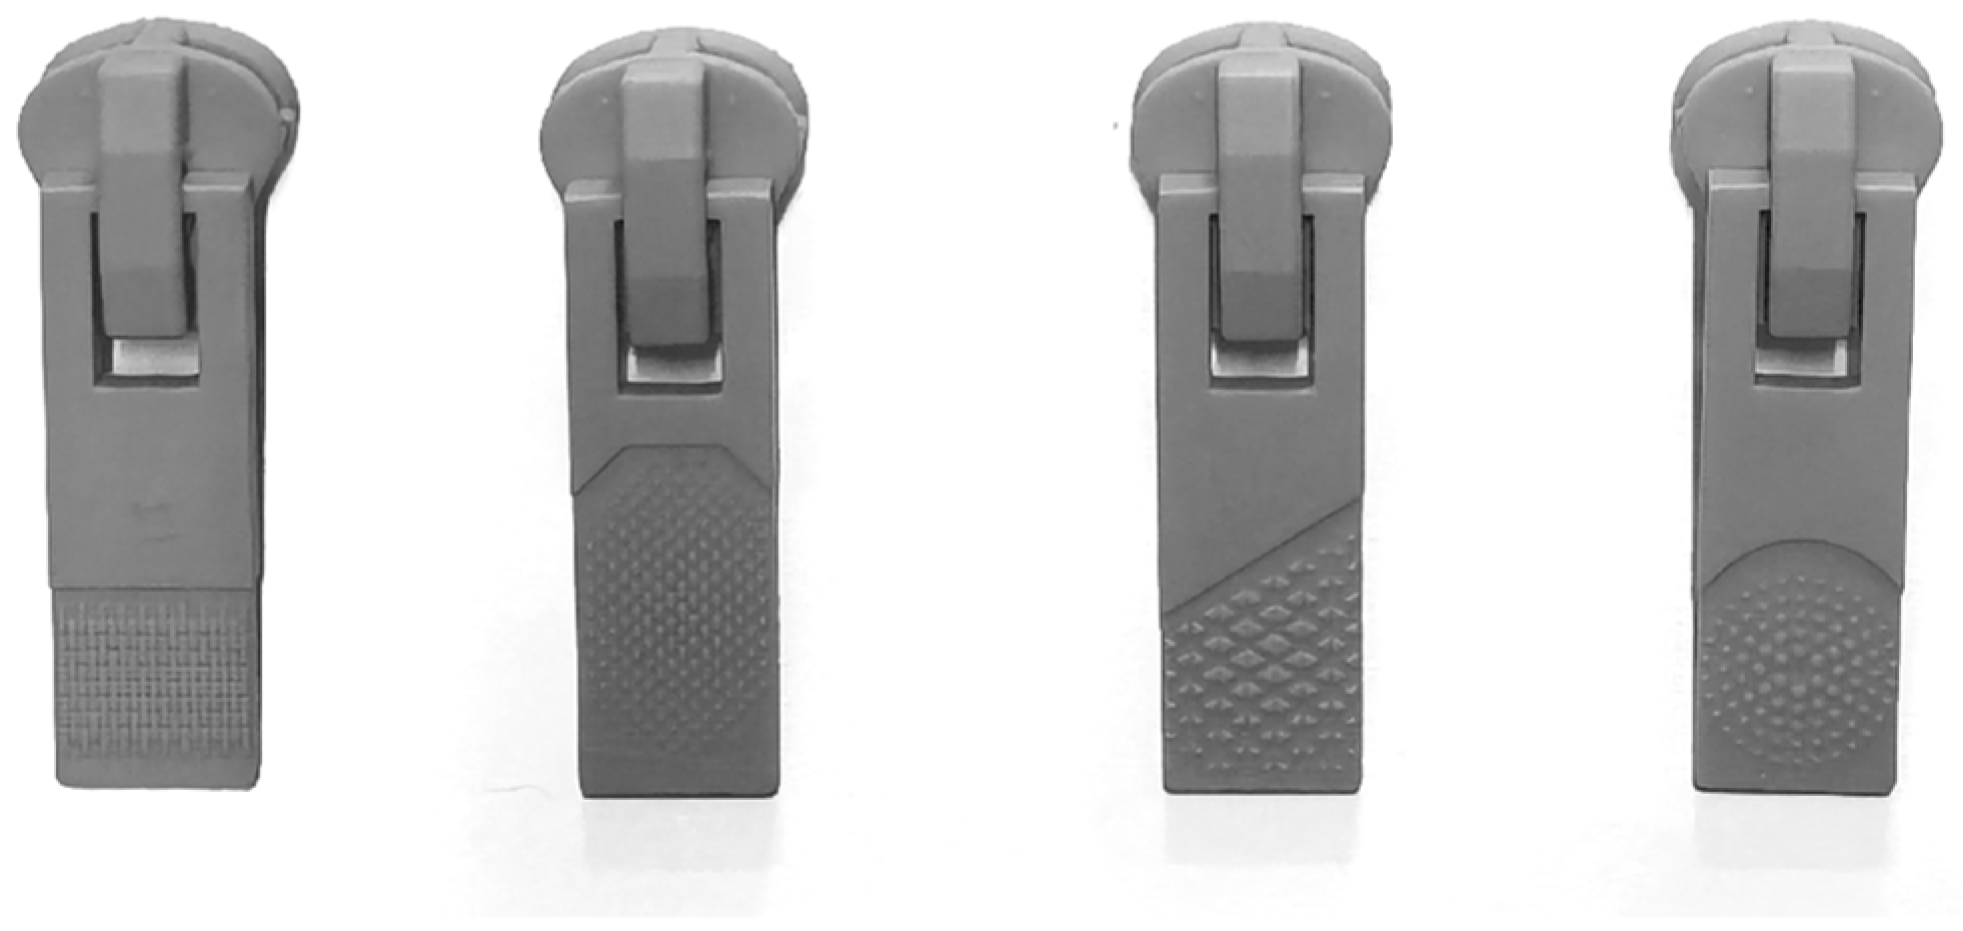
After modeling, the designs were imported into KeyShot 11 for material and lighting rendering, as shown in Figure 7. For physical prototype fabrication, stereolithography-based 3D printing was used to facilitate evaluation and iterative refinement. This method offers relatively high forming accuracy, short production cycles, and controllable cost, making it suitable for rapid prototyping, as shown in Figure 8.
Figure 7.
Renderings of the four parametric zipper designs.
Figure 8.
3D printed sample models.
4.4. Construction of the Evaluation System and Calculation of Indicator Weights
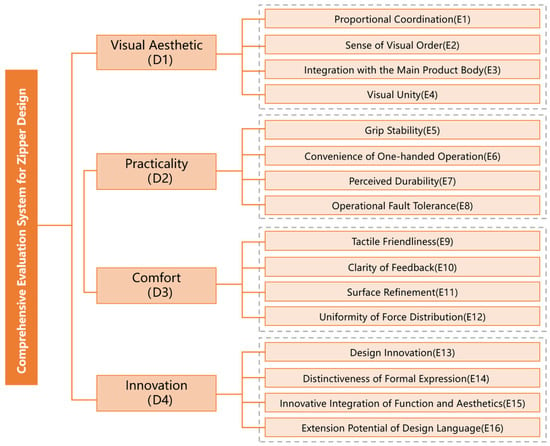
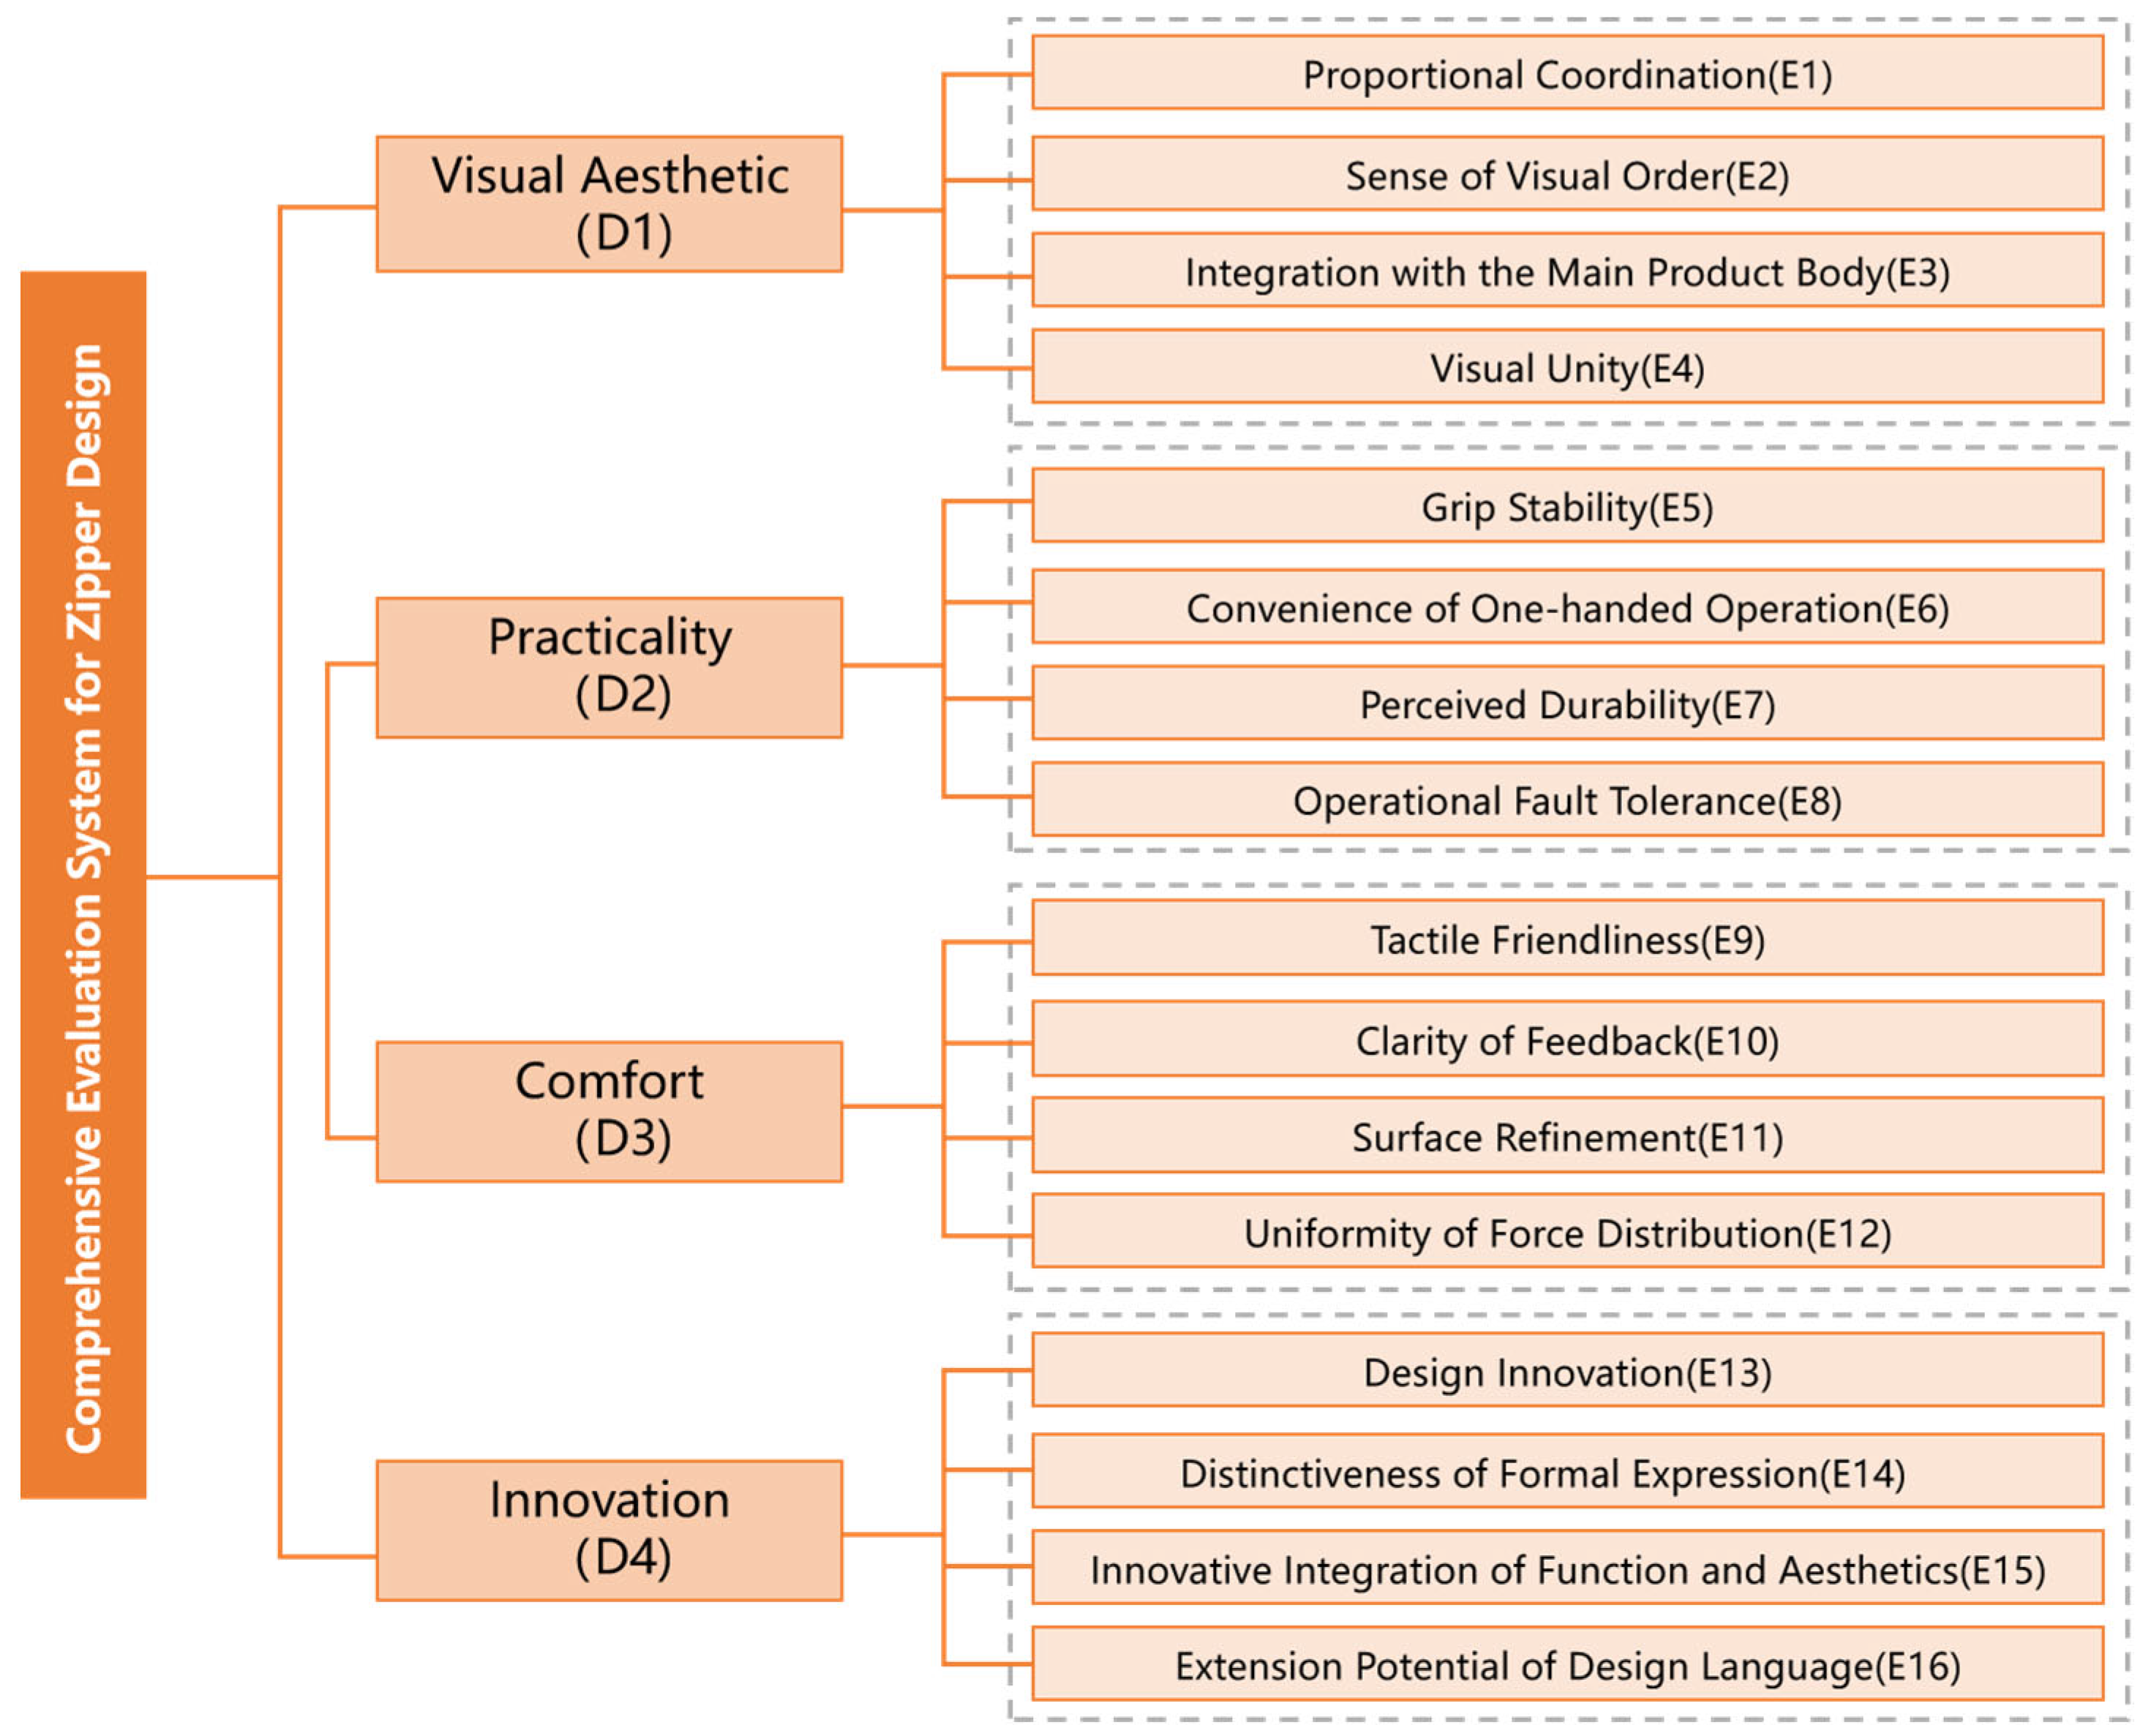
To systematically and scientifically evaluate zipper design, 10 experts were invited to participate in offline interviews in this study. The expert panel consisted of five senior product designers from the garment accessories industry, two university professors, and three designers from the clothing industry. First, the evaluation indicators for zipper design proposed by the experts were preliminarily compiled. Then, an expert group discussion was organized, and four graduate students who had participated in accessory design projects were invited to join the process of classifying and summarizing the preliminary indicators. After multiple rounds of integration and refinement, a comprehensive zipper design evaluation system was established, as shown in Figure 9, consisting of four primary indicators and sixteen secondary indicators.
Figure 9.
Comprehensive evaluation system for zipper design.
4.5. Evaluation of Zipper Design Schemes
This study adopted the CRITIC method to objectively determine indicator weights based on indicator variability and inter-indicator conflict. Compared to traditional methods, CRITIC better handles complex interrelationships, producing more objective weighting results.
To ensure the representativeness of the evaluation data, 10 experts from relevant fields were invited to participate in the assessment, including four university professors engaged in apparel design teaching and research and six accessory and apparel designers with extensive practical experience. The experts evaluated the importance of the 16 secondary indicators on a scale from 1 to 10, and these evaluation results were used as the input for CRITIC weighting. Based on the calculation procedure in Equations (7)–(11), the final weight of each indicator was obtained, as shown in Table 8. Integration of function and aesthetics received the highest weight, followed by visual unity, proportional coordination, and grip stability. These results indicate that the current evaluation system places relatively greater emphasis on balancing functional and aesthetic qualities while maintaining visual coherence and perceived usability.
Table 8.
Final weighting results of the evaluation indicators.
Next, the TOPSIS method was employed to comprehensively evaluate the performance of the four zipper schemes under multiple evaluation indicators to determine the optimal scheme. In this study, 20 evaluators were invited to assess the design schemes, including 10 accessory designers and 10 consumers. The designers were selected based on professional experience in accessory or related product design, and all had more than two years of relevant experience. Consumers were recruited based on clothing consumption experience and familiarity with zipper products. The designer group comprised six males and four females aged 25–35 years, while the consumer group comprised five males and five females aged 22–50 years. Equal numbers of designers and consumers were included to balance professional judgments and user perceptions. The physical prototypes used for this evaluation were fabricated using stereolithography-based 3D printing. After handling and using the prototypes, the evaluators rated the 16 secondary indicators on a scale from 1 to 10. The mean evaluator scores were used to construct the initial evaluation matrix. All indicators were benefit-type indicators, meaning that higher scores represented better scheme performance. Based on the calculation procedure in Equations (12)–(19), a comprehensive evaluation of the four zipper design schemes was conducted. The final ranking result was B32 > B10 > B6 > B8, as shown in Table 9. To further examine the consistency of evaluation results across different evaluator backgrounds, the rankings of the designer and consumer groups were compared separately. Although minor differences existed between the two groups, B32 consistently showed strong overall performance, indicating a relatively stable evaluation tendency. Despite achieving the highest relative closeness value, B32 showed only a relatively small difference from B10, with an absolute difference of 0.015. This indicates that B32 and B10 exhibited comparable overall performance under the selected evaluation criteria. Therefore, the selection of B32 should be understood as a relative advantage based on the integrated evaluation of multiple indicators rather than an absolute superiority over B10.
Table 9.
Evaluation results of zipper design schemes.
5. Discussion
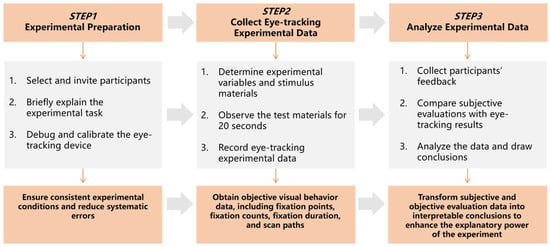
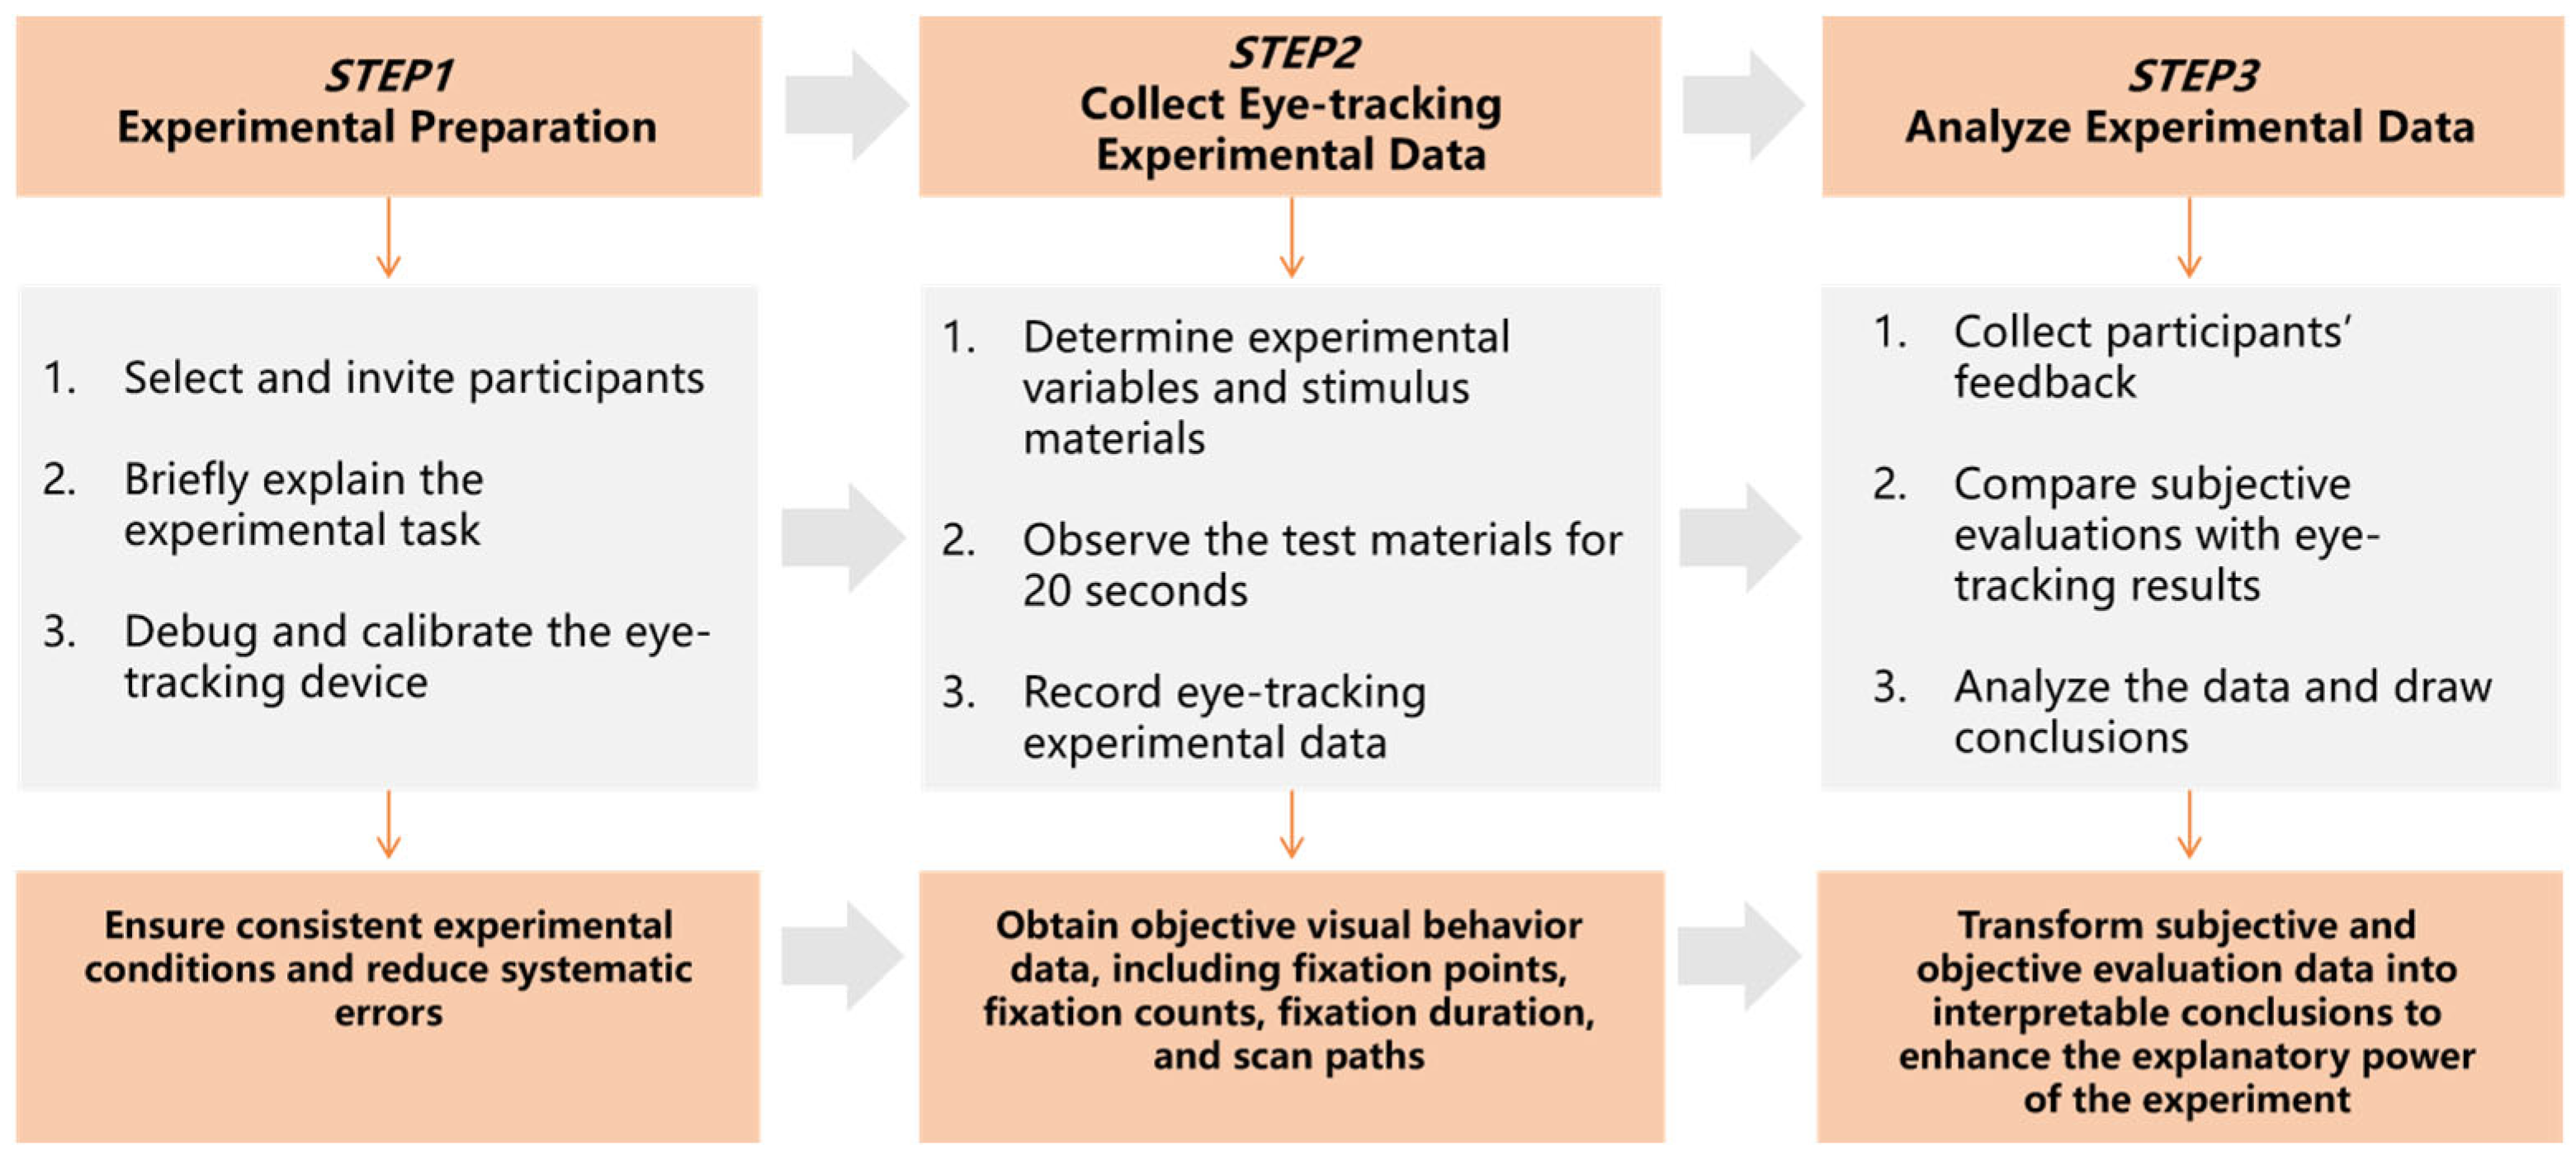
To further investigate the relationship between the TOPSIS ranking and consumers’ visual attention responses, an eye-tracking experiment was conducted as a supplementary behavioral evaluation [36]. For the eye-tracking experiment, the four selected parametric texture samples were labeled as Scheme A to D, corresponding to B6, B8, B10, and B32 in the TOPSIS analysis, respectively. The experimental procedure is shown in Figure 10. A total of 42 participants aged 18–35 years were recruited, with equal proportions of male and female participants. All participants had experience in either the design or consumption of clothing or zipper related products, and all had normal vision or corrected visual acuity of 1.0 or above.
Figure 10.
Flowchart of the eye-tracking experiment.
Before each participant formally entered the experiment, an aSee A6 eye-tracking device (Beijing 7Invensun Technology Co., Ltd., Beijing, China) was used for data acquisition. The researchers adjusted the infrared sensitivity of the device to ensure accurate capture of pupil and corneal reflections, and the calibration procedure was performed before each test. The physical prototypes used for the user evaluation were fabricated using stereolithography-based 3D printing to ensure consistency across the four design schemes. During the formal test, participants observed each design scheme in a relaxed state. The presentation time for each set of materials was uniformly set at 20 s to ensure the comparability of visual attention data, and 42 valid records were ultimately obtained. From the valid samples, this study extracted three key indicators: total fixation count, total fixation duration, and average fixation duration. These indicators were selected because they provide objective measures of visual attention allocation and characterize differences in visual attention patterns among design schemes [37]. Combined with the fixation heat maps of each scheme, the distribution differences in participants’ attention could be visualized. After the experiment, brief interviews were conducted to collect participants’ ratings of the attractiveness of each scheme using a five-point Likert scale, where 1 indicated unattractive and 5 indicated highly attractive. In this study, eye-tracking indicators were interpreted as measures of visual attention rather than direct indicators of consumer preference. The consistency between TOPSIS results and eye-tracking outcomes was evaluated by comparing whether the highly ranked scheme also showed stronger visual attention responses.
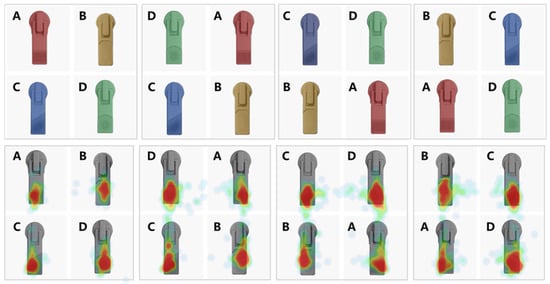
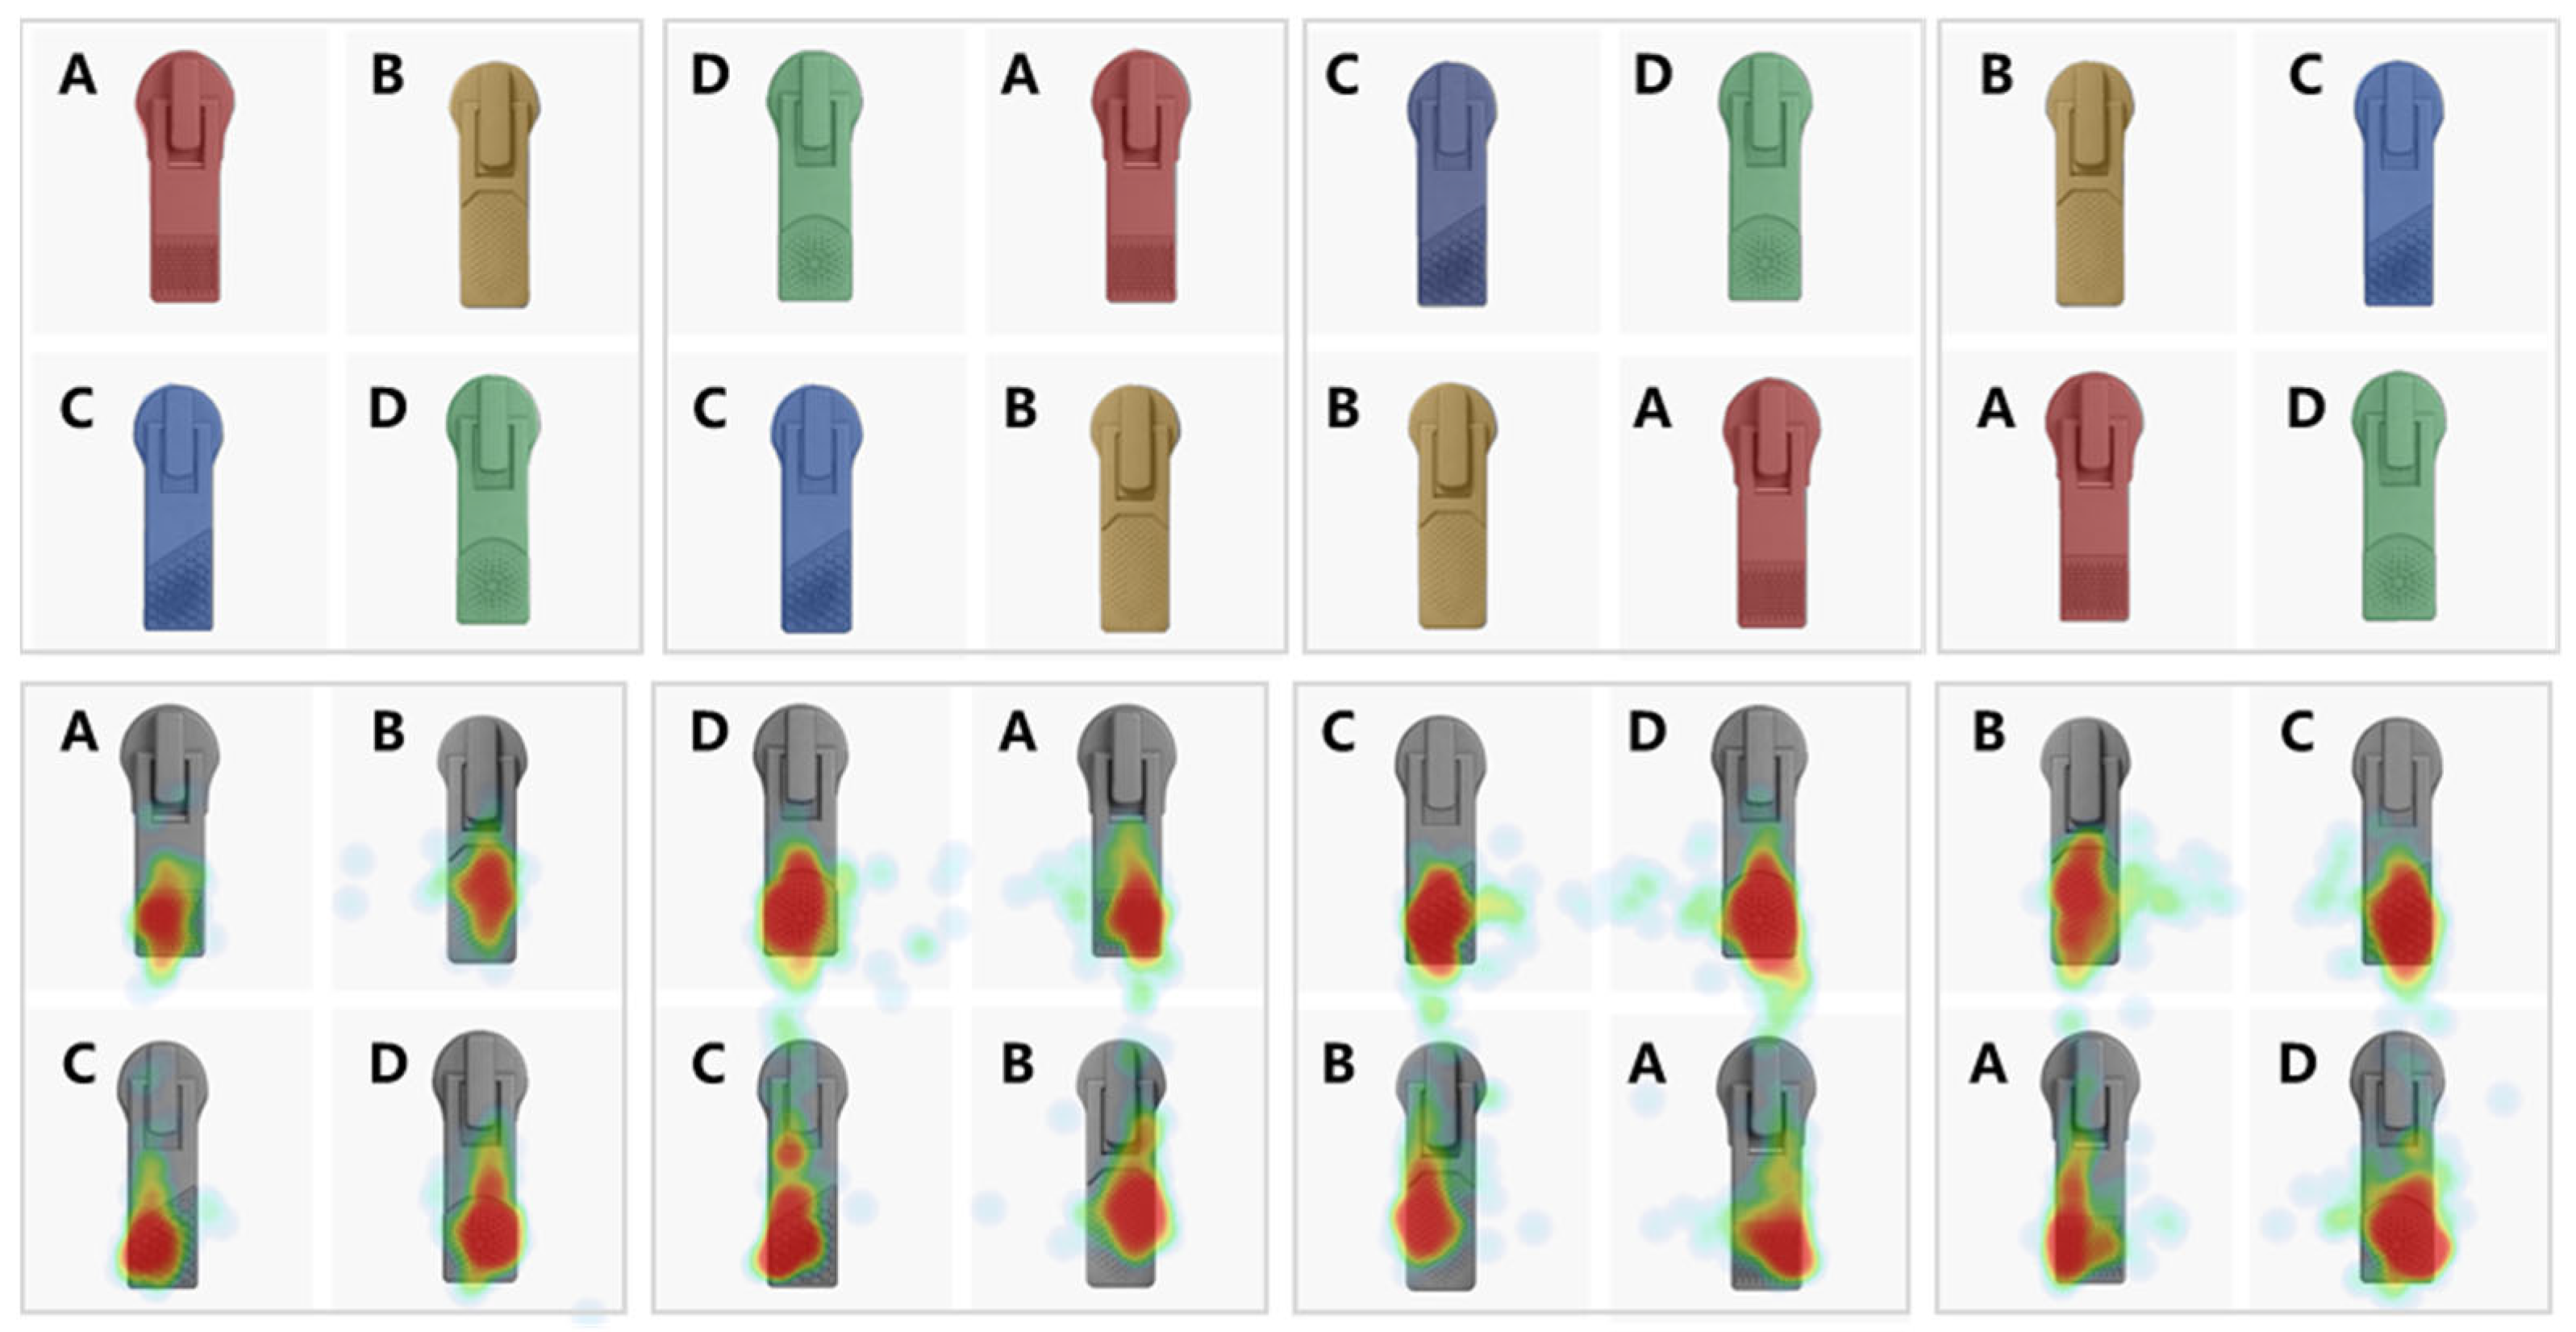
To reduce potential positional bias, the presentation positions of the four design schemes were rotated clockwise across different participants, and polygonal areas of interest (AOIs) were defined for each design for data analysis, as shown in Figure 11.
Figure 11.
Heat maps and areas of interest for the four zipper design schemes. The labels A–D indicate the four zipper design schemes. The upper row presents the corresponding areas of interest, while the lower row shows the eye-tracking heat maps. The colors in the heat maps represent different levels of visual attention intensity.
Based on the eye-tracking data analysis in Table 10, differences could be observed among the schemes in terms of their ability to attract and sustain visual attention. The results indicated that Schemes D and C exhibited stronger visual engagement under multiple test conditions, as their total fixation counts and total fixation durations were generally higher than those of the other schemes. In particular, Scheme D showed higher values than the other schemes in both indicators, suggesting that the radial design was associated with stronger visual attention responses and repeated fixations. Simultaneously, the average fixation durations of these two schemes were generally longer, suggesting stronger overall visual engagement. Average fixation duration varied across schemes and test groups and was therefore not interpreted independently as an indicator of preference. Longer fixation duration may not necessarily indicate stronger preference, as it can also be influenced by factors such as visual complexity or processing difficulty [38]. Therefore, fixation duration was not interpreted as an independent indicator of preference in this study, but was considered together with fixation count, heat-map distribution, and subjective evaluation results to obtain a more comprehensive understanding of consumers’ responses toward different designs. In contrast, Scheme A and Scheme B generally showed lower fixation counts, shorter total fixation durations, and shorter average fixation durations. Participants tended to scan them quickly rather than dwell on them, indicating relatively limited visual engagement. Overall, Scheme D showed the strongest visual engagement, particularly in total fixation count and total fixation duration.
Table 10.
Eye-tracking indicators within the areas of interest.
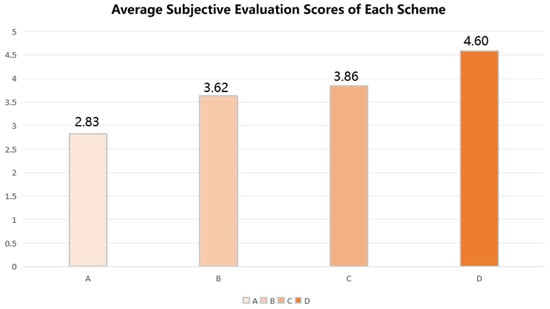
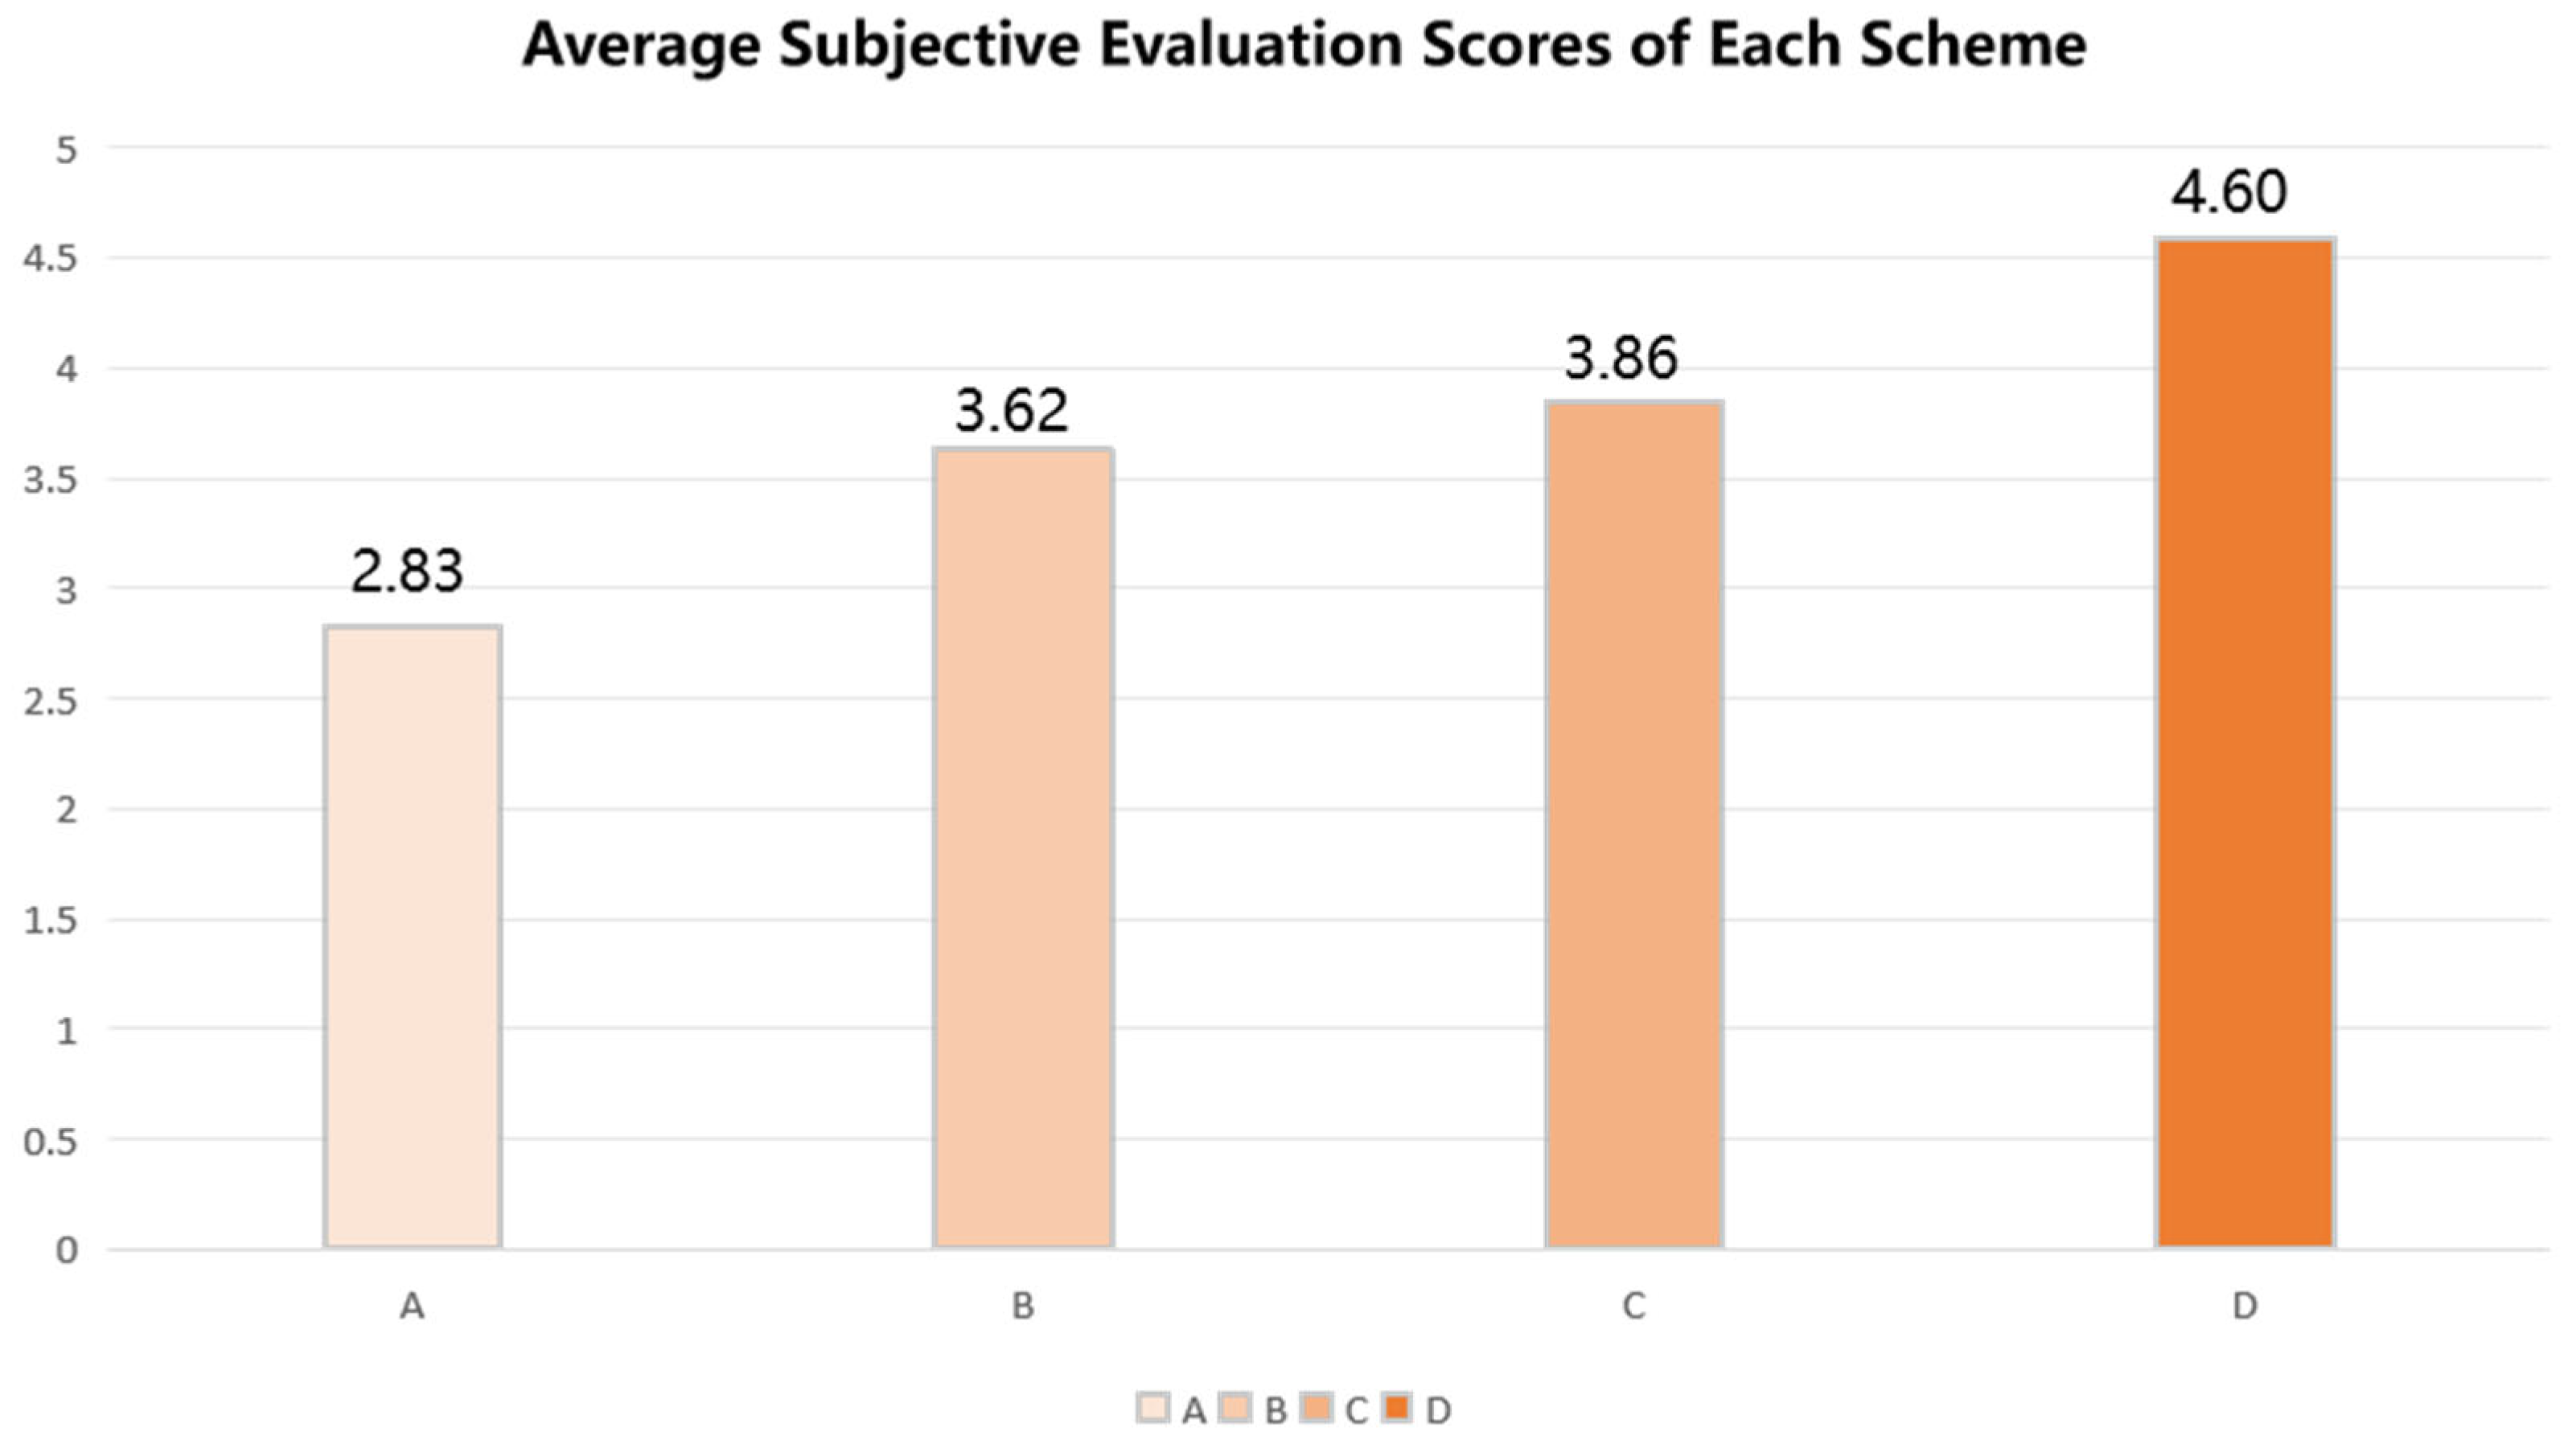
On this basis, participants’ five-point subjective attractiveness ratings were summarized, as shown in Figure 12. The ranking was D > C > B > A, broadly consistent with the overall eye-tracking pattern. Scheme D received the highest attractiveness score. Its radial dotted texture consists of repeated units with a clear radial organization. This orderly structure may contribute to perceptions of refinement, modernity, and minimalism, while the radial arrangement may create a clearer visual focus and attract greater attention. Taken together, the eye-tracking and subjective attractiveness results suggest that Scheme D was both visually engaging and positively perceived by participants. Together with the TOPSIS ranking, these findings provide complementary evidence from decision-making, behavioral, and perceptual perspectives.
Figure 12.
Average subjective attractiveness scores of the four zipper design schemes.
Beyond the evaluation of the selected design scheme, the proposed framework also provides methodological implications for consumer-oriented garment accessory design. Compared with conventional Kansei Engineering approaches, which mainly focus on identifying relationships between affective responses and product characteristics, the proposed framework extends this process by linking affective evaluation with parametric texture generation and design selection. QFD translates weighted affective needs into design alternatives, although expert judgment remains involved in relationship evaluation.
The CRITIC–TOPSIS combination further supports multi-criteria comparison through objective indicator weighting and scheme ranking. However, the ranking remains dependent on the selected indicators and weighting process, as illustrated by the small difference between B32 and B10. Therefore, the main contribution of the proposed framework lies in integrating affective need identification, design translation, and multi-criteria evaluation into a unified decision-making process.
6. Conclusions
This study establishes a systematic parametric design and optimization framework for garment accessories and demonstrates its application through a zipper case study. The framework integrates consumers’ affective needs with the KJ method, semantic differential analysis, G1, QFD, CRITIC, and TOPSIS to support the screening and evaluation of parametric design schemes. A comprehensive zipper evaluation system was constructed, and the radial dotted texture scheme achieved the highest TOPSIS ranking. Among the evaluated alternatives, this scheme showed the strongest overall performance under the selected evaluation indicators. Methodologically, the framework provides a structured process for translating consumer affective needs into parametric design alternatives and multi-criteria design decisions. Practically, it may provide a reference for the systematic design and evaluation of other garment accessories and consumer-oriented products requiring the joint consideration of aesthetic, functional, and affective needs.
Despite certain achievements made in this research, several limitations still exist. Firstly, no alternative multi-criteria decision-making methods are adopted for horizontal comparison, leaving the comprehensiveness of the optimization model to be further verified. Secondly, the effects of specific parametric texture characteristics, such as different degrees of concavity and convexity and texture density, were not systematically examined. Thirdly, although efforts were made to reduce evaluation bias, participants’ ratings inevitably involved a degree of subjectivity. In addition, although TOPSIS provides a systematic approach for ranking candidate schemes, closely ranked alternatives may exhibit similar comprehensive performance. Therefore, the superiority of the selected scheme should be interpreted as a relative advantage based on the integrated evaluation criteria, and further validation with larger-scale user evaluations and practical application scenarios is required. Finally, the framework was demonstrated using a single garment accessory category and specific participant groups. Differences between prototype materials and actual manufacturing materials, as well as variations in product shape and manufacturing processes, may influence practical application.
Future research should compare alternative multi-criteria decision-making methods and systematically examine the effects of key parametric texture variables. Larger and more diverse participant samples should also be included, and the framework should be applied to additional garment accessory categories and application contexts. The optimized zipper design should be compared with commercially available products through objective performance tests. Consumer segmentation may also be incorporated to develop more targeted parametric garment accessory design strategies.
Author Contributions
Conceptualization, J.X. and Y.T.; methodology, J.X. and Y.T.; software, J.X.; validation, J.X.; formal analysis, J.X.; investigation, J.X. and Y.T.; resources, Y.T.; data curation, Y.T.; writing—original draft preparation, J.X. and Y.T.; writing—review and editing, J.X. and Y.T.; visualization, J.X.; supervision, Y.T.; project administration, Y.T. All authors have read and agreed to the published version of the manuscript.
Funding
This research received no external funding.
Institutional Review Board Statement
This study was considered a low-risk and non-clinical study, as it did not involve any sensitive personal data, medical information, or personally identifiable information from participants. According to Article 32 of the Ethical Review Measures for Life Science and Medical Research Involving Human Beings (2023, China), this study was exempt from ethical review.
Informed Consent Statement
Informed consent was obtained from all subjects involved in the study.
Data Availability Statement
The raw data supporting the conclusions of this article will be made available by the authors on request.
Conflicts of Interest
The authors declare no conflicts of interest.
Abbreviations
The following abbreviations are used in this manuscript:
| KJ | Affinity Diagram Method |
| SD | Semantic Differential Method |
| G1 | Order Relation Analysis Method |
| AHP | Analytic Hierarchy Process |
| QFD | Quality Function Deployment |
| CRITIC | Criteria Importance Through Intercriteria Correlation |
| TOPSIS | Technique for Order Preference by Similarity to an Ideal Solution |
Appendix A
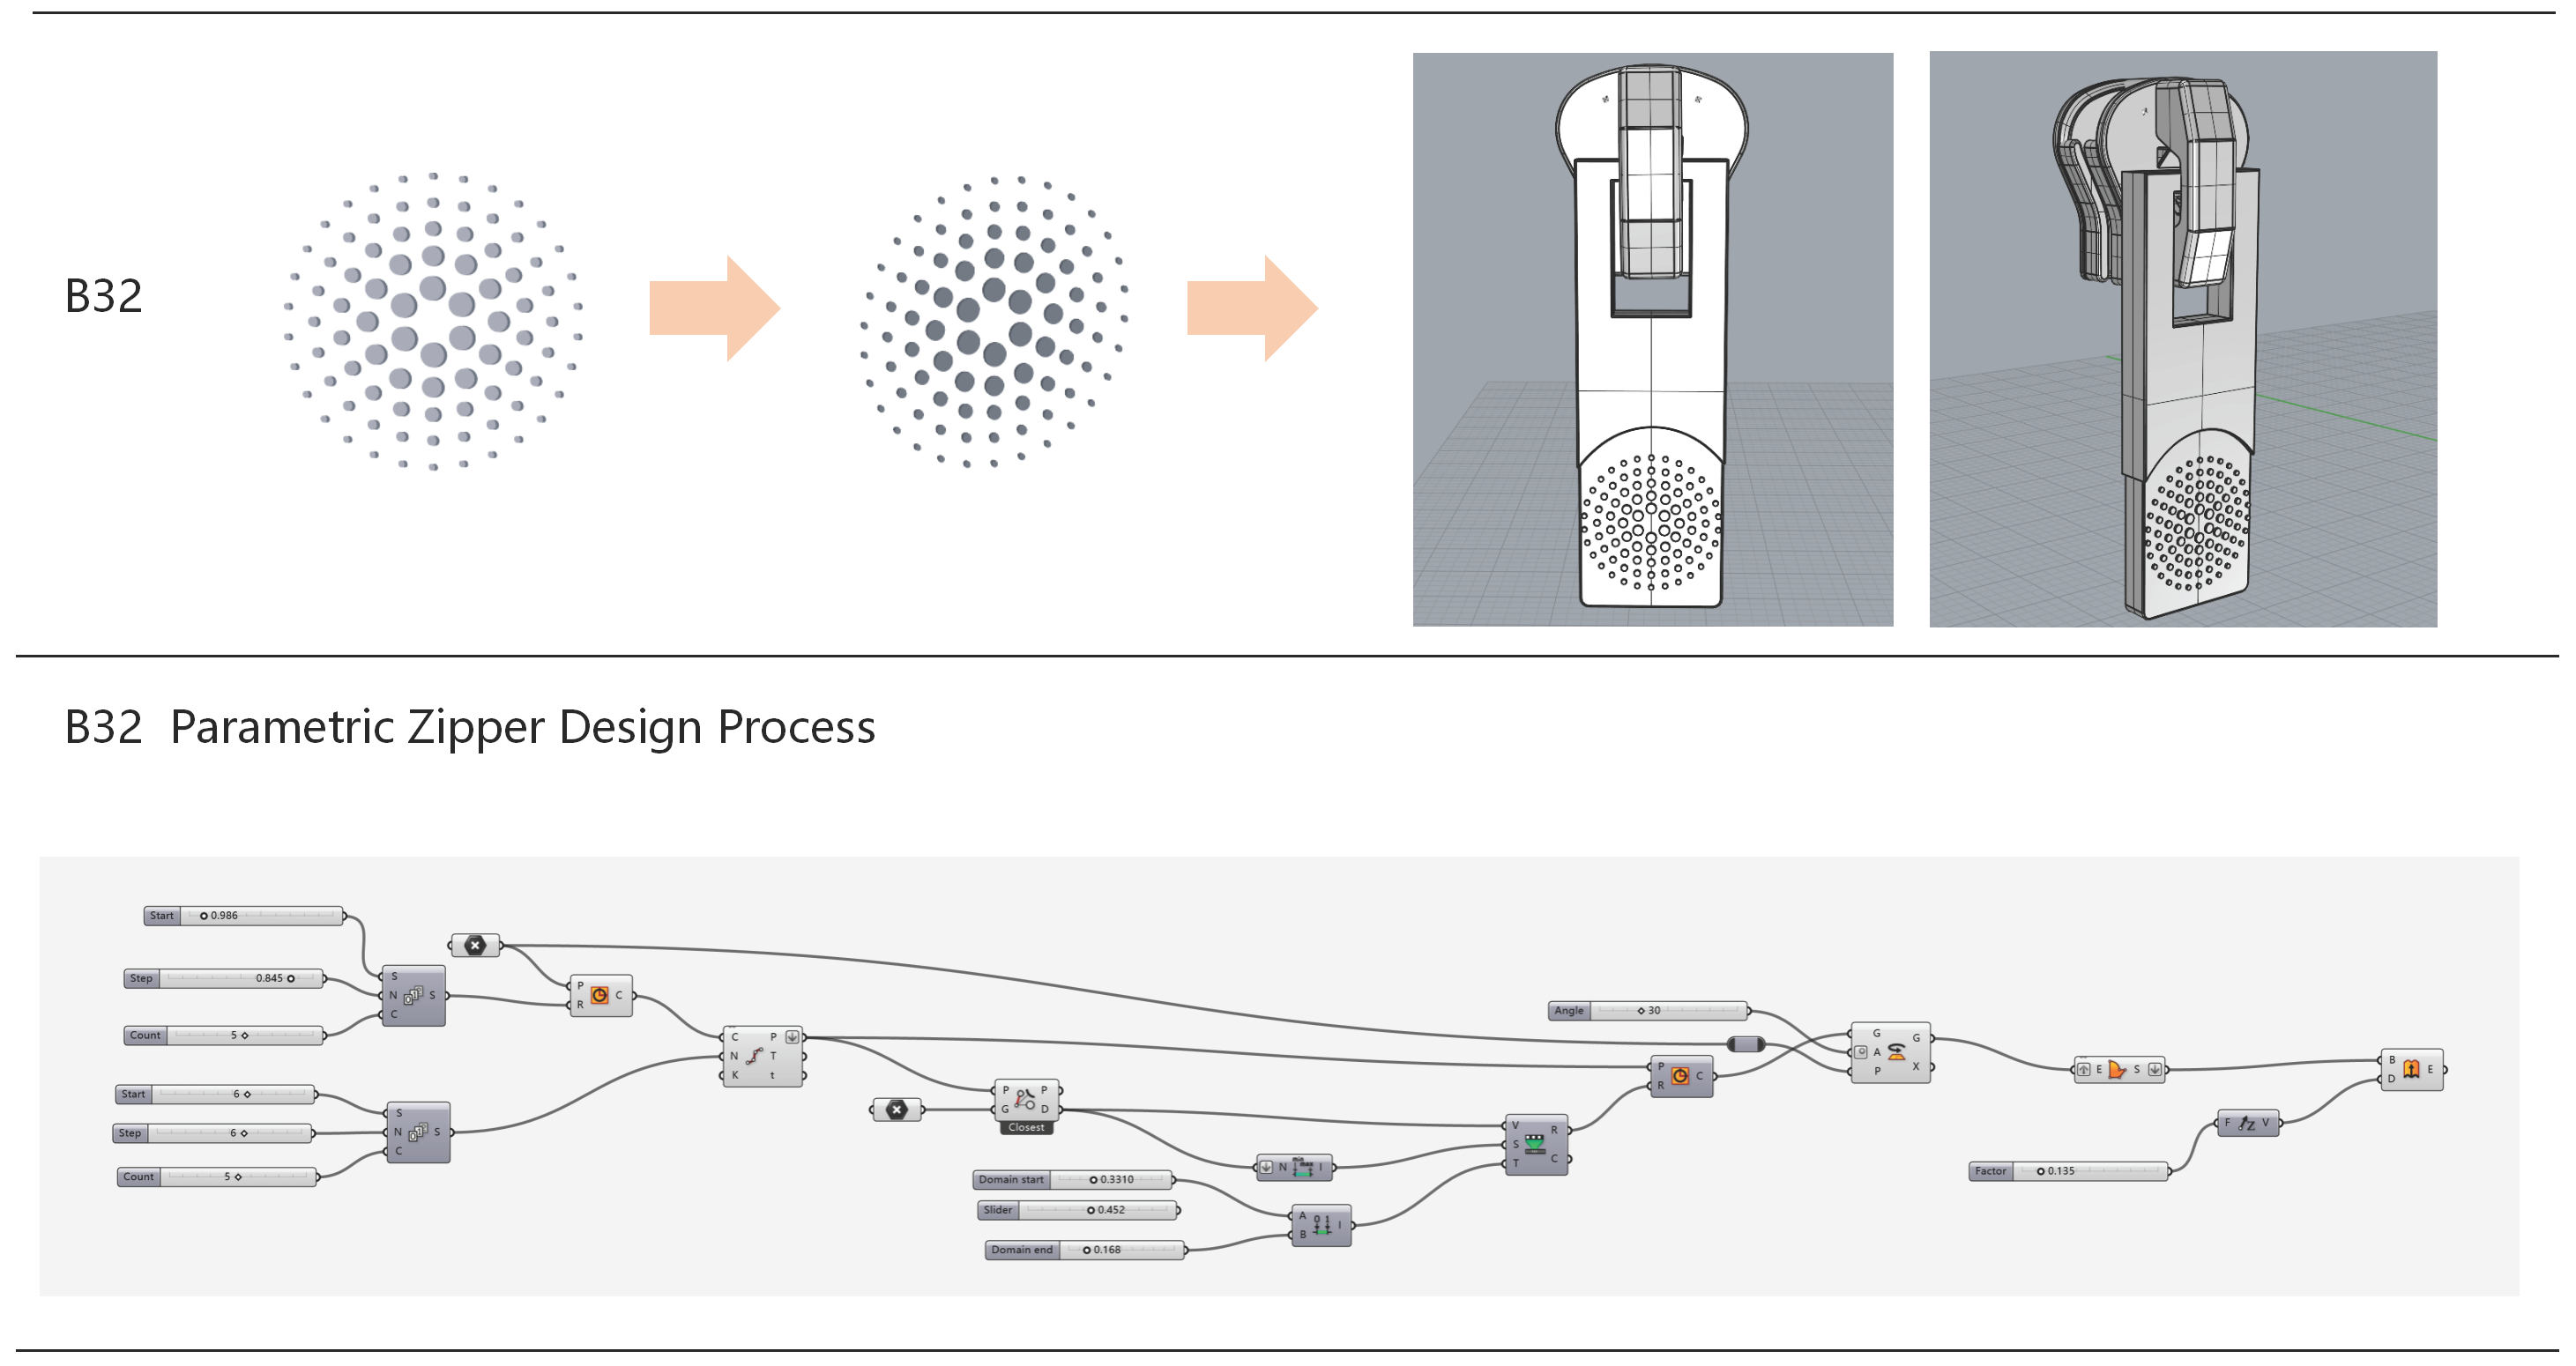
The Grasshopper visual programming processes for schemes B6, B8, B10, and B32 are shown in Figure A1, Figure A2, Figure A3 and Figure A4. Each definition includes three main stages: basic texture generation, parametric adjustment of geometric characteristics and distribution, and texture mapping onto the zipper puller surface. Parameters such as pattern scale, spacing, density, and distribution can be adjusted using Grasshopper components and sliders, enabling efficient generation and modification of different texture schemes.
Figure A1.
Grasshopper-based parametric design process for B6.
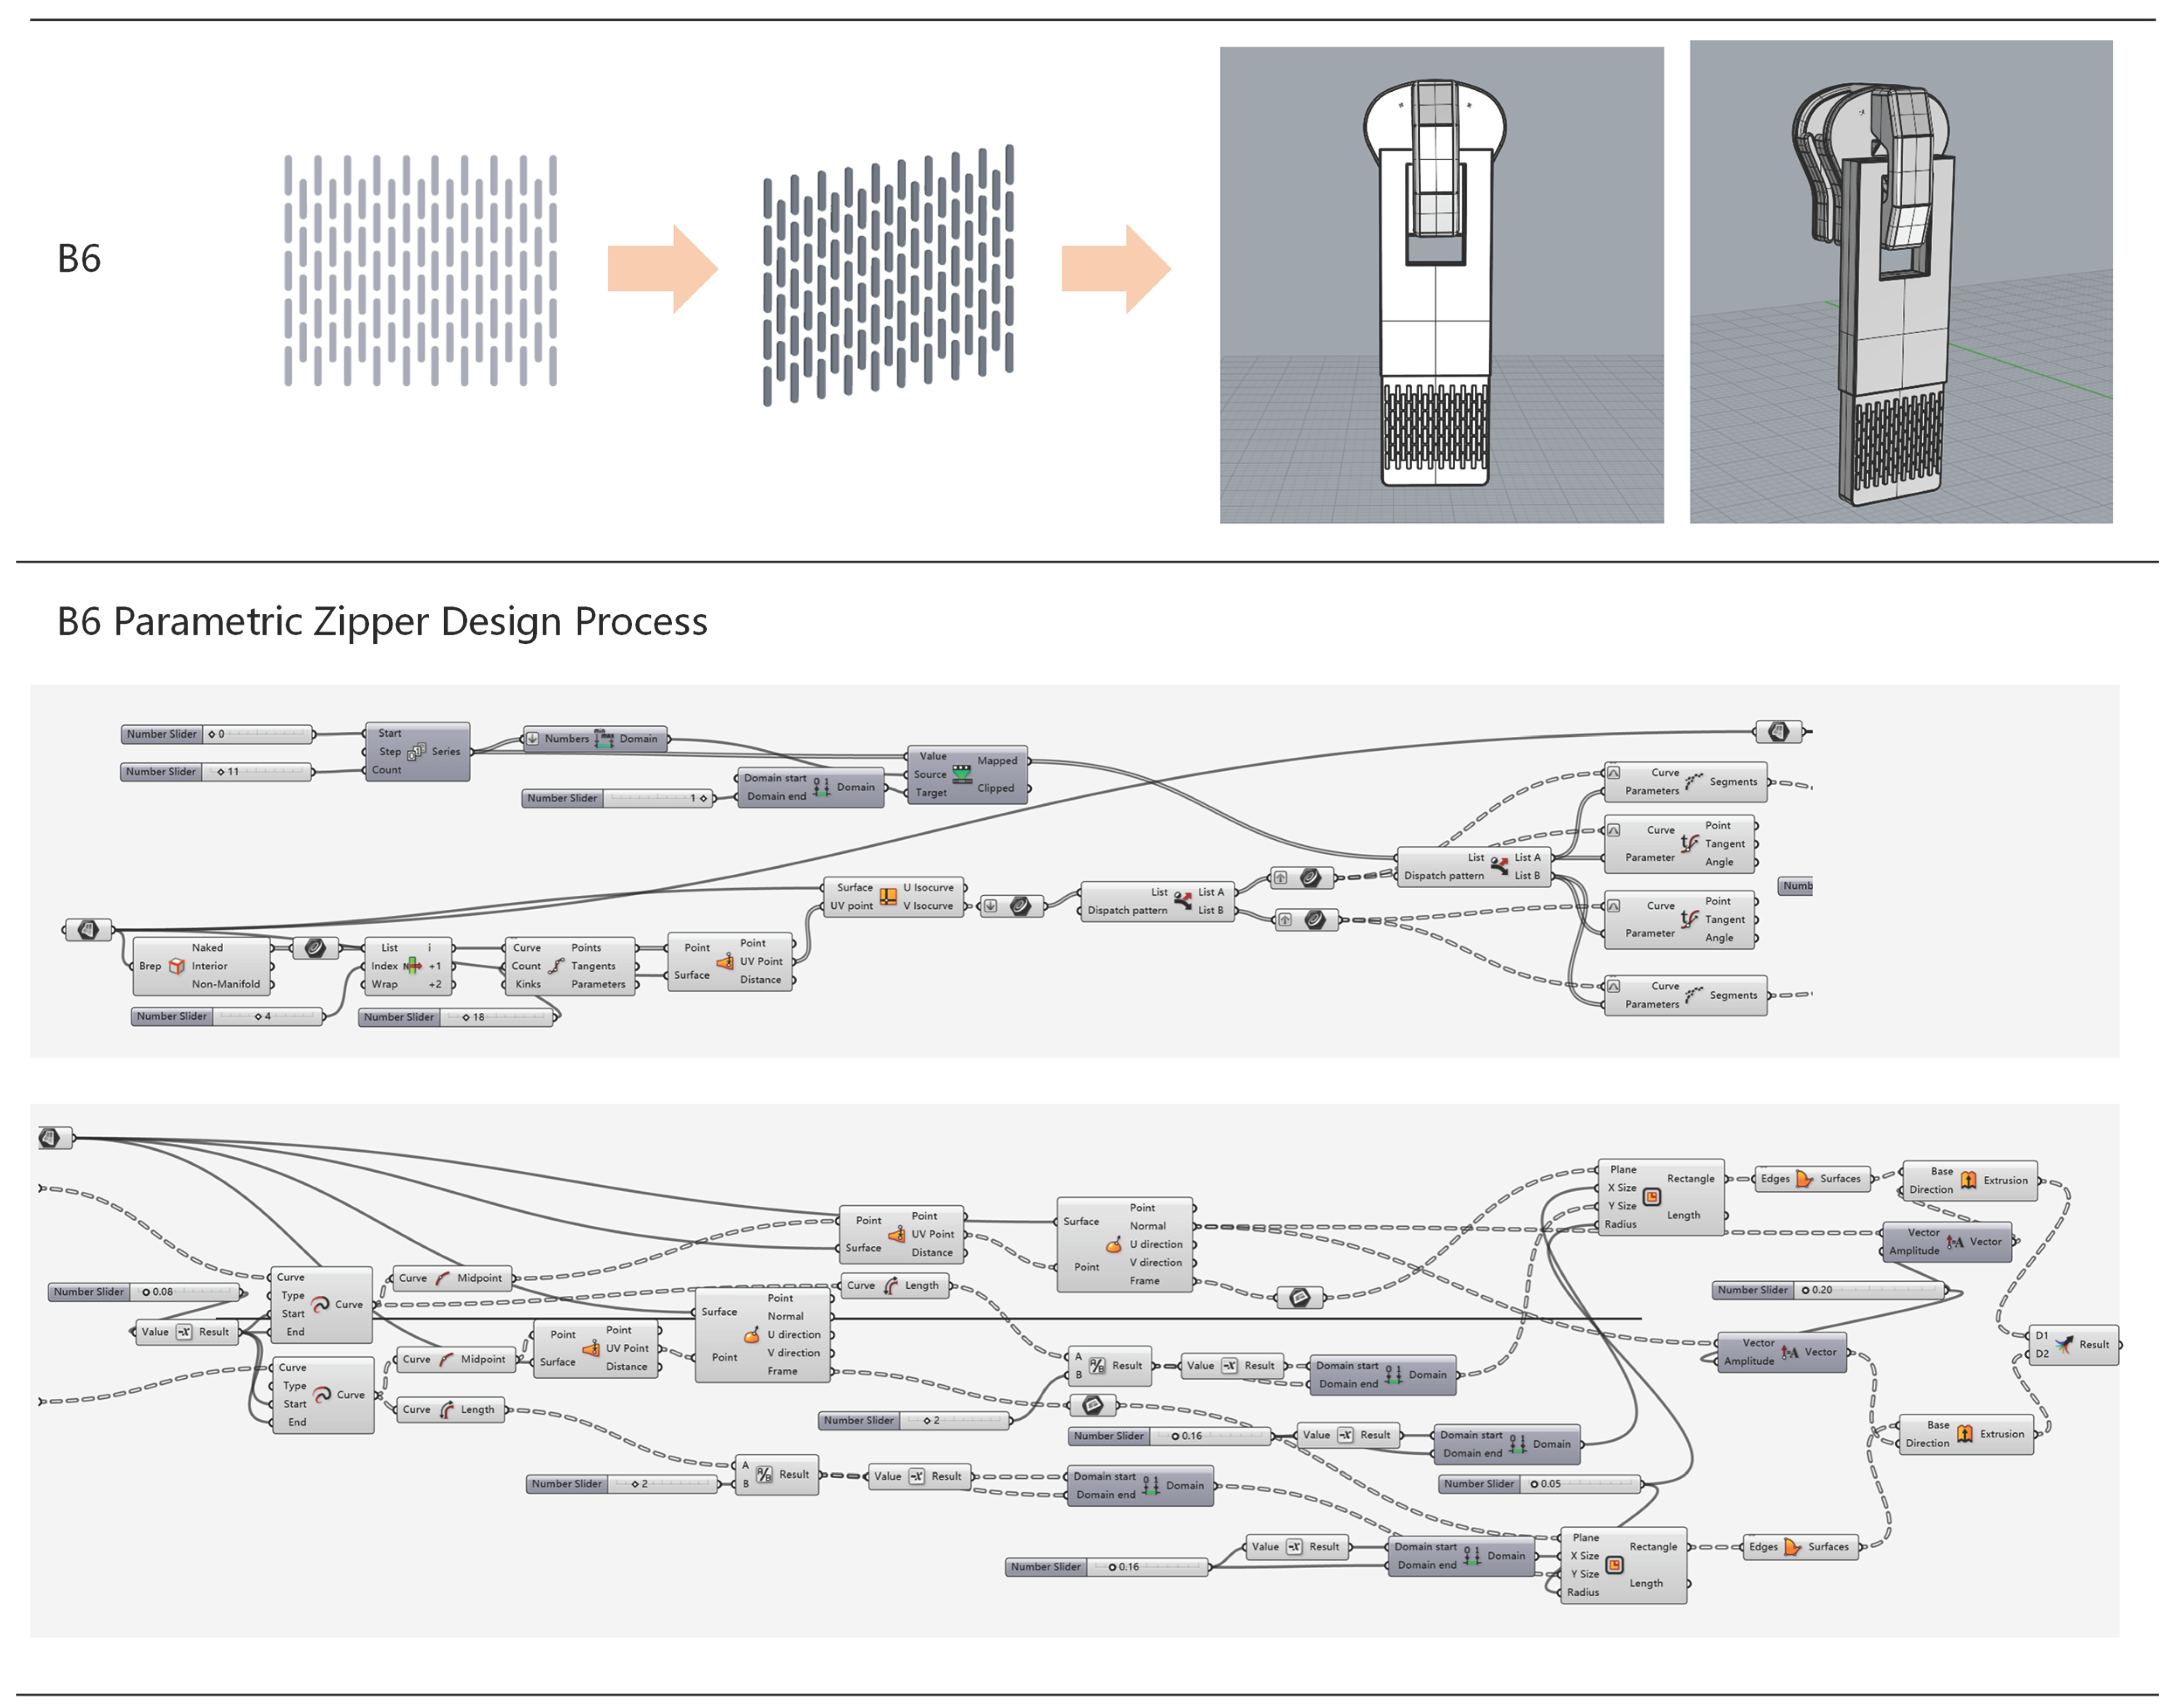
Figure A2.
Grasshopper-based parametric design process for B8.
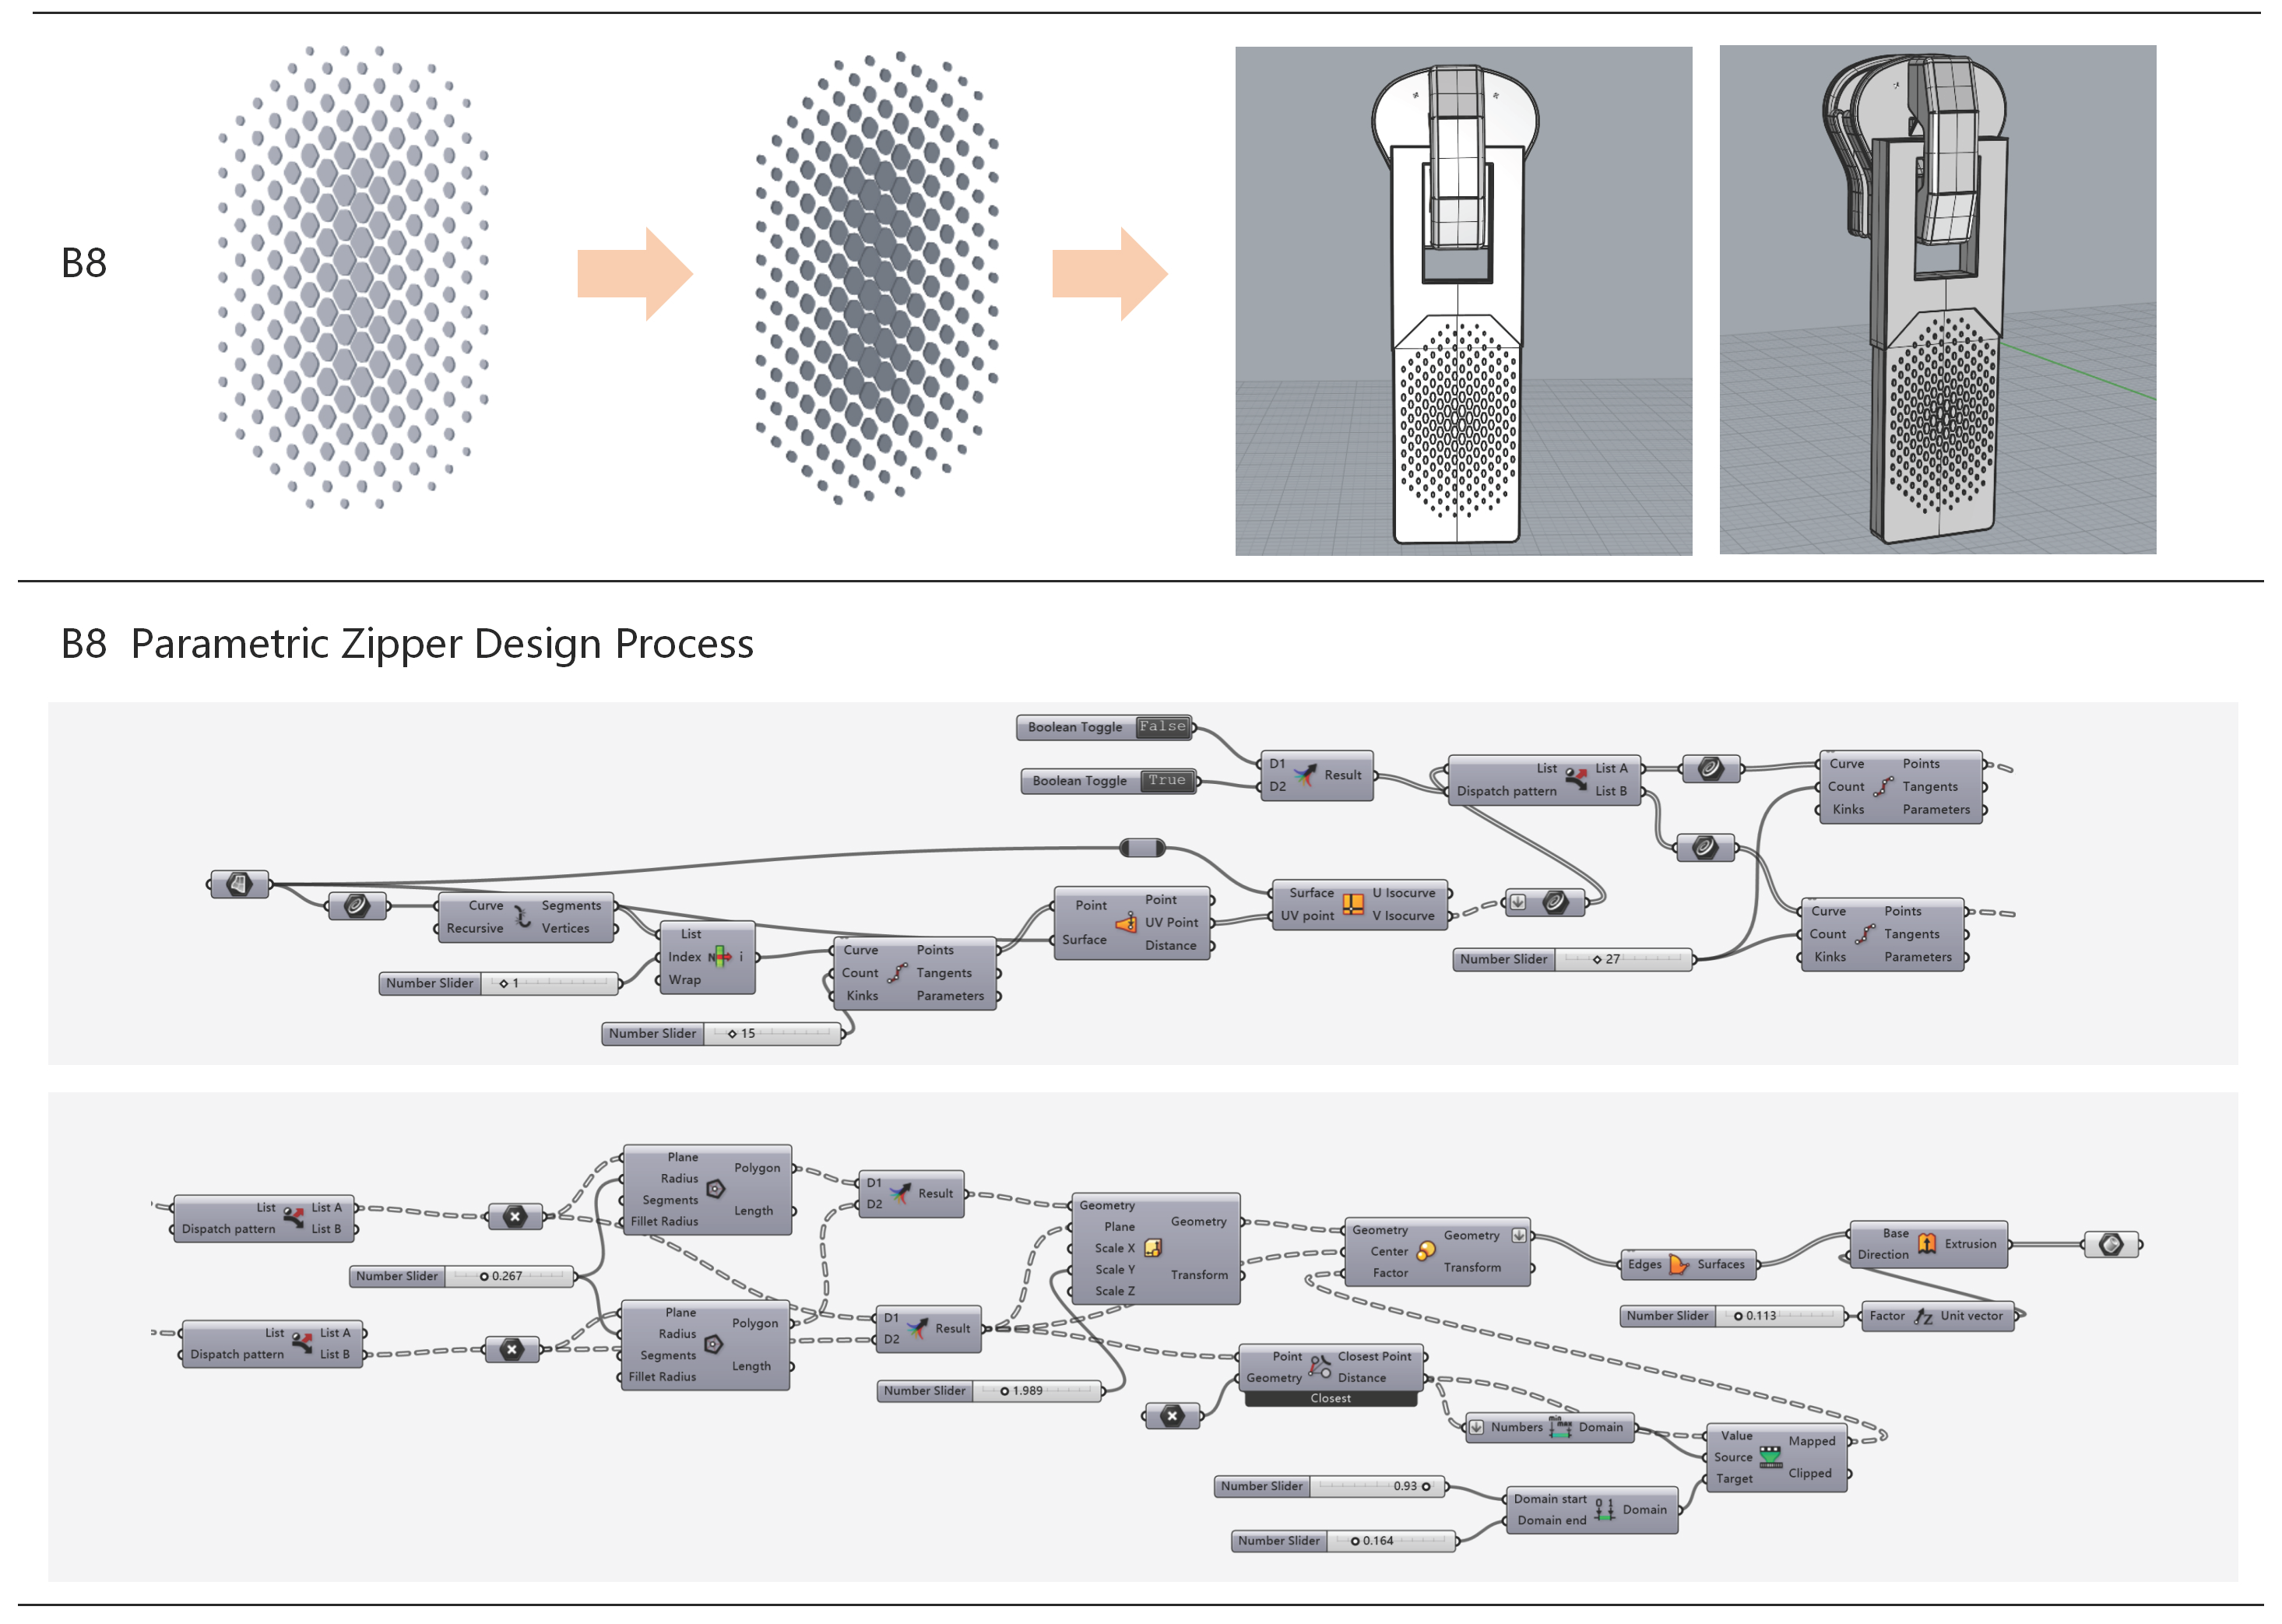
Figure A3.
Grasshopper-based parametric design process for B10.
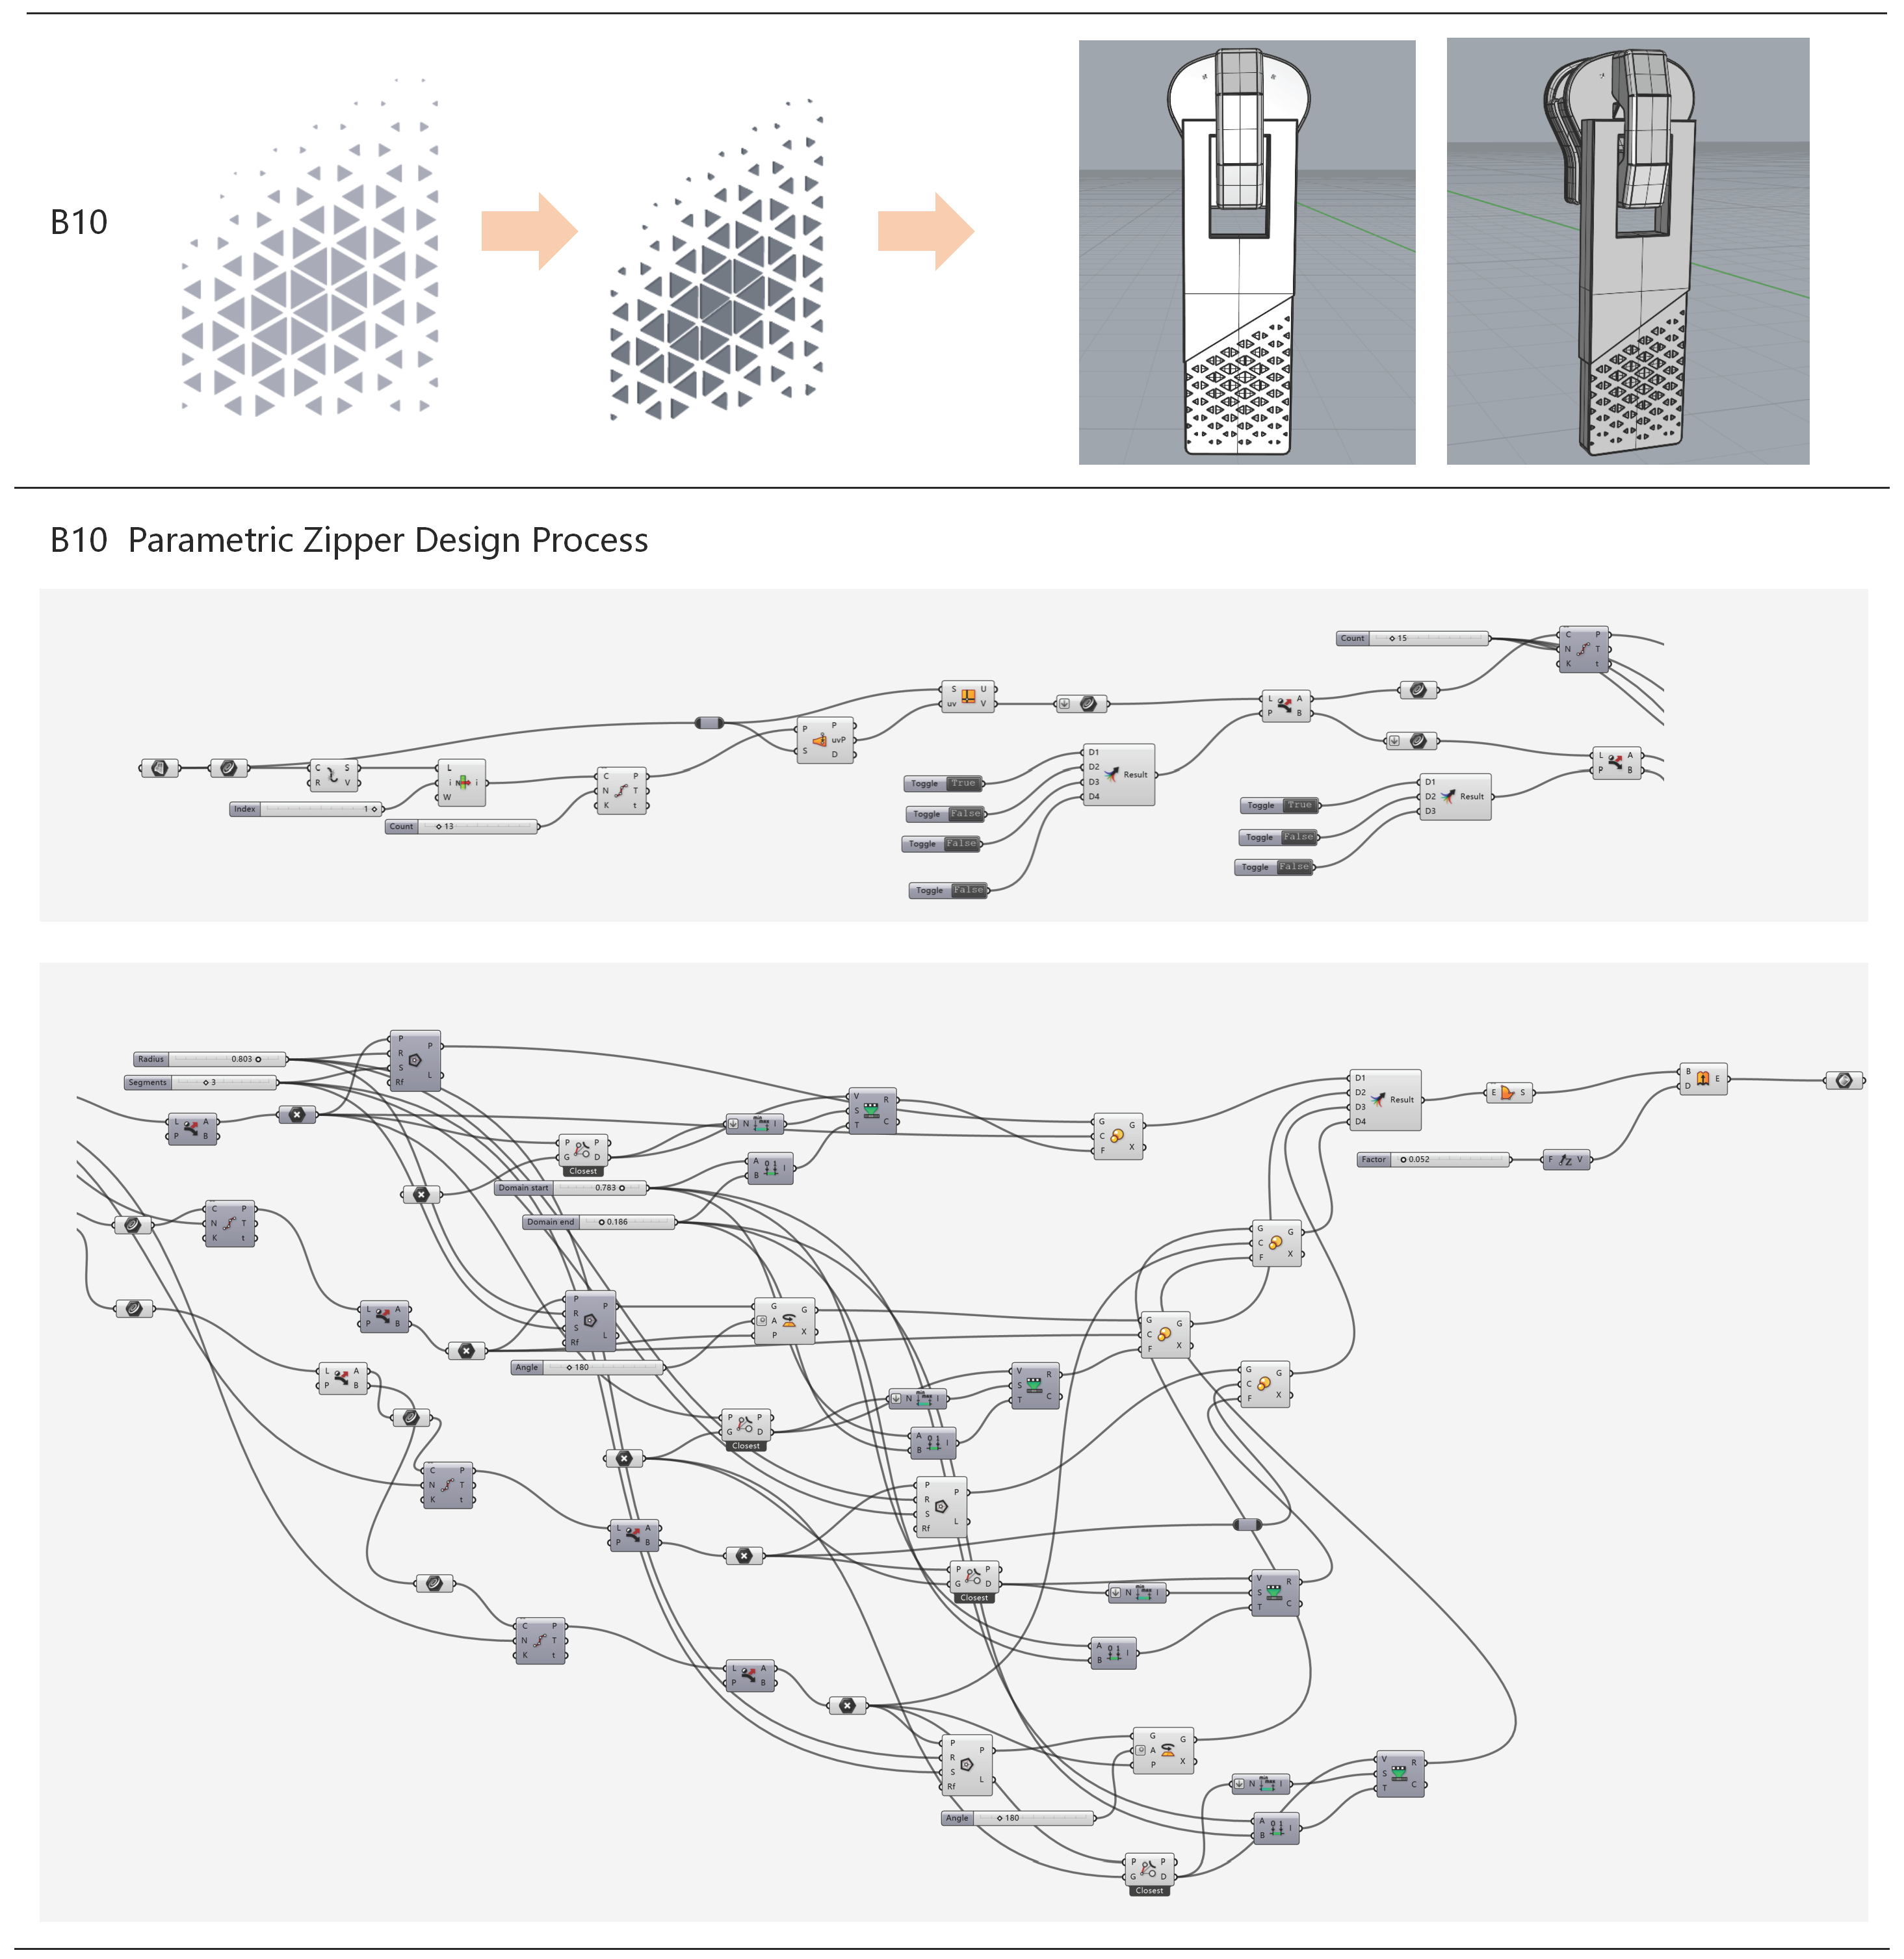
Figure A4.
Grasshopper-based parametric design process for B32.
References
- Bishnoi, S.K.; Singh, S. A study on consumer buying behaviour for fashion and luxury brands under emotional influence. Res. J. Text. Appar. 2022, 26, 405–418. [Google Scholar] [CrossRef] [Scilit]
- Dou, R.; Li, W.; Nan, G.; Wang, X.; Zhou, Y. How can manufacturers make decisions on product appearance design? A research on optimal design based on customers’ emotional satisfaction. J. Manag. Sci. Eng. 2021, 6, 177–196. [Google Scholar] [CrossRef] [Scilit]
- Ge, B.; Zhu, Y.Y.; Cui, C.; Liu, M. Clothing Consumers’ Aesthetic Preferences and Sustainable Marketing Model System Based on Kansei Engineering. Serv. Sci. 2025, 17, 111–126. [Google Scholar] [CrossRef] [Scilit]
- Zhao, X.; Sharudin, S.A.; Lv, H. A novel product shape design method integrating Kansei engineering and whale optimization algorithm. Adv. Eng. Inform. 2024, 62, 102847. [Google Scholar] [CrossRef] [Scilit]
- Qin, M.; Wang, J.; Ding, X.; Zhang, H. Symmetrical Traditional Patterns and User Perception: A Study on Innovation in Home Textile Design. Symmetry 2025, 17, 960. [Google Scholar] [CrossRef] [Scilit]
- Fang, Y.; Qu, Y. Symmetric Alignment Between Affective Semantics and Biomimetic Forms: Sustainable Packaging Design and Decision Support. Symmetry 2026, 18, 19. [Google Scholar] [CrossRef] [Scilit]
- Fan, S.; Wang, N. Wooden jewelry design guided by sustainability assessment: Integrating natural and cultural elements. Bioresources 2025, 21, 439–458. [Google Scholar] [CrossRef] [Scilit]
- Jiang, Z.; Gan, J.; Hong, Y.; Wu, B. Application of Kansei engineering in the innovative design of traditional fashion elements. Ind. Textila 2024, 75, 289–301. [Google Scholar] [CrossRef] [Scilit]
- Ren, Z.; Chen, D.; Gong, Y.; Niu, S.; An, W.; Liu, Z.; Wei, S. Exploring the complex mapping between user perception and product form: A case study of air purifiers. J. Eng. Des. 2026, 37, 1909–1934. [Google Scholar] [CrossRef] [Scilit]
- Wang, L.; Gong, Y.; Niu, S.; Ren, Z. Cultural symbols migration and user perception: Innovation in Chinese-style furniture design. BioResources 2025, 20, 3476–3496. [Google Scholar] [CrossRef] [Scilit]
- Sunstrum, F.N.; Demirbilek, O.; Gardner, N.; Viengkham, C.; Spehar, B. Revealing the synergy between formal aesthetics and product semantics: Exploring the impact of visual form on product perception. Int. J. Ind. Ergon. 2024, 101, 103593. [Google Scholar] [CrossRef] [Scilit]
- Kang, X.; Wang, N. Sustainable design of bamboo weaving products based on style generative adversarial network and Grasshopper technology. J. Eng. Des. 2026, 37, 529–550. [Google Scholar] [CrossRef] [Scilit]
- Pérez-Arribas, F. Parametric Generation of Small Ship Hulls with CAD Software. J. Mar. Sci. Eng. 2023, 11, 976. [Google Scholar] [CrossRef] [Scilit]
- Tian, Y.; Ball, R. Parametric design for custom-fit eyewear frames. Heliyon 2023, 9, e19946. [Google Scholar] [CrossRef] [Scilit] [PubMed]
- Wu, M.; Geng, R.; Guo, Q. Research on the Application of Cement Tile Patterns Based on Shape Grammar. Symmetry 2024, 16, 31. [Google Scholar] [CrossRef] [Scilit]
- Ku, P.; Gong, J.; Wu, T.; Wei, Y.; Tang, Y.; Ens, B.; Yang, X. Zippro: The design and implementation of an interactive zipper. In Proceedings of the 2020 CHI Conference on Human Factors in Computing Systems (CHI ’20), Honolulu, HI, USA, 25–30 April 2020. [Google Scholar] [CrossRef] [Scilit]
- Yan, S.; Vandenbosch, G.A.E. Design of Wideband Button Antenna Based on Characteristic Mode Theory. IEEE Trans. Biomed. Circuits Syst. 2018, 12, 1383–1391. [Google Scholar] [CrossRef] [Scilit] [PubMed]
- Cheung, V.; Girouard, A. Exploring Acceptability and Utility of Deformable Interactive Garment Buttons. In Proceedings of the Extended Abstracts of the 2020 CHI Conference on Human Factors in Computing Systems (CHI EA ’20), Honolulu, HI, USA, 25–30 April 2020. [Google Scholar] [CrossRef] [Scilit]
- Zhao, X.; Ye, H.; Chen, F.; Wang, G. Bamboo as a substitute for plastic: Research on the application performance and influencing mechanism of bamboo buttons. J. Clean. Prod. 2024, 446, 141297. [Google Scholar] [CrossRef] [Scilit]
- Chang, J.; Han, H.; Yuan, K. How can regional cultural symbols be integrated into public seating design? An innovative exploration using marbled porcelain patterns as an example. BioResources 2025, 20, 8420–8438. [Google Scholar] [CrossRef] [Scilit]
- Wen, Z.; Yang, J.; Sun, B.; Liu, Y. Research on Symmetry Optimization of Designer Requirements and Prototyping Platform Functionality in the Context of Agile Development. Symmetry 2025, 17, 502. [Google Scholar] [CrossRef] [Scilit]
- Zhang, Z.; Zhan, Z.; Li, Y. User–Designer Cognitive Synergy: Enhancing Age-Friendly Rural Public Space Design. Buildings 2025, 15, 3078. [Google Scholar] [CrossRef] [Scilit]
- Qu, M.; Ren, Z.-X.; Wu, C.; Li, X. Integrating User Feedback into Air Purifier Innovation: The FKANO-DEMATEL-VIKOR Decision Framework. Eng. Manag. J. 2026, 38, 81–98. [Google Scholar] [CrossRef] [Scilit]
- Acar, E.; Birkocak, D.T.; Özdağoğlu, A.; Ünal, Z.; Özdemir, G.; Abreu, M.J. Prioritizing Sustainable Denim Fabric through Integrated Decision-Making Framework. Materials 2024, 17, 3291. [Google Scholar] [CrossRef] [Scilit] [PubMed]
- Li, H.; Shi, L. Applied research on the design of protective clothing based on the Kano-QFD-PUGH method. PLoS ONE 2024, 19, e0312045. [Google Scholar] [CrossRef] [Scilit] [PubMed]
- Lian, X.; Hou, L.; Yan, H. An integrated decision-making approach to evaluating design schemes under heterogeneous fuzzy environment. J. Eng. Des. 2022, 33, 838–869. [Google Scholar] [CrossRef] [Scilit]
- Mohamedally, D.; Zaphiris, P. Categorization Constructionist Assessment with Software-Based Affinity Diagramming. Int. J. Hum.–Comput. Interact. 2009, 25, 22–48. [Google Scholar] [CrossRef] [Scilit]
- Osgood, C.E. Studies on the generality of affective meaning systems. Am. Psychol. 1962, 17, 10–28. [Google Scholar] [CrossRef] [Scilit]
- Wang, X.J.; Guo, Y.J. Analyzing the Consistency of Comparison Matrix Based on G1 Method. Chin. J. Manag. Sci. 2006, 14, 65–70. (In Chinese) [Google Scholar] [CrossRef]
- Xiao, J.; Wang, X.; Zhang, H. Coping with diversity ratings in prioritizing design requirements in quality function deployment: A consensus-based approach with minimum-maximum adjustments. Comput. Ind. Eng. 2022, 163, 107799. [Google Scholar] [CrossRef] [Scilit]
- Yang, Q.; Chen, Z.-S.; Chan, C.Y.P.; Pedrycz, W.; Martínez, L.; Skibniewski, M.J. Large-scale group decision-making for prioritizing engineering characteristics in quality function deployment under comparative linguistic environment. Appl. Soft Comput. 2022, 127, 109359. [Google Scholar] [CrossRef] [Scilit]
- Diakoulaki, D.; Mavrotas, G.; Papayannakis, L. Determining objective weights in multiple criteria problems: The CRITIC method. Comput. Oper. Res. 1995, 22, 763–770. [Google Scholar] [CrossRef] [Scilit]
- Peng, X.; Zhang, X.; Luo, Z. Pythagorean fuzzy MCDM method based on CoCoSo and CRITIC with score function for 5G industry evaluation. Artif. Intell. Rev. 2020, 53, 3813–3847. [Google Scholar] [CrossRef] [Scilit]
- Krishnan, A.R.; Kasim, M.M.; Hamid, R.; Ghazali, M.F. A Modified CRITIC Method to Estimate the Objective Weights of Decision Criteria. Symmetry 2021, 13, 973. [Google Scholar] [CrossRef] [Scilit]
- Taherdoost, H.; Madanchian, M. A comprehensive survey and literature review on TOPSIS. Int. J. Serv. Sci. Manag. Eng. Technol. 2024, 15, 1–65. [Google Scholar] [CrossRef] [Scilit]
- Zhu, S.; Qi, J.; Hu, J.; Hao, S. A new approach for product evaluation based on integration of EEG and eye-tracking. Adv. Eng. Inform. 2022, 52, 101601. [Google Scholar] [CrossRef] [Scilit]
- Kuo, J.Y.; Chen, C.H.; Koyama, S.; Chang, D. Investigating the relationship between users’ eye movements and perceived product attributes in design concept evaluation. Appl. Ergon. 2021, 94, 103393. [Google Scholar] [CrossRef] [Scilit] [PubMed]
- Godwin, H.J.; Hout, M.C.; Alexdóttir, K.J.; Walenchok, S.C.; Barnhart, A.S. Avoiding potential pitfalls in visual search and eye-movement experiments: A tutorial review. Atten. Percept. Psychophys. 2021, 83, 2753–2783. [Google Scholar] [CrossRef] [Scilit] [PubMed]



Disclaimer/Publisher’s Note: The statements, opinions and data contained in all publications are solely those of the individual author(s) and contributor(s) and not of MDPI and/or the editor(s). MDPI and/or the editor(s) disclaim responsibility for any injury to people or property resulting from any ideas, methods, instructions or products referred to in the content. |
© 2026 by the authors. Licensee MDPI, Basel, Switzerland. This article is an open access article distributed under the terms and conditions of the Creative Commons Attribution (CC BY) license.