


Abstract
Musculoskeletal symptoms may affect a single body region or multiple region groups, representing distinct classification tasks. This cross-sectional secondary analysis evaluated an interpretable two-stage machine-learning framework using data from 30,278 employees across 35 countries in the 2024 European Working Conditions Survey. Stage A distinguished employees with and without musculoskeletal symptoms, whereas Stage B differentiated single-region from multiregional symptoms among 20,593 symptomatic employees. Elastic Net logistic regression, penalised spline logistic regression, and extreme gradient boosting (XGBoost) were evaluated using five repetitions of five-fold outer cross-validation with three-fold inner tuning, while preserving primary sampling units and incorporating survey weights. Model performance was assessed using discrimination, probability accuracy, calibration, and threshold-based measures. Overall, 68.28% of employees were symptomatic. For the selected Elastic Net model, the area under the receiver operating characteristic curve was 0.744 (95% confidence interval: 0.728–0.758) in Stage A and 0.654 (0.634–0.673) in Stage B. Performance differences across models were limited, and Elastic Net was selected based on the prespecified Brier-score parsimony criterion. Tiring or painful positions showed the highest held-out permutation importance in both stages. Predictor patterns remained consistent across sensitivity analyses. Symptom presence was classified with moderate discrimination, whereas classification of regional extent was more limited.
1. Introduction
Musculoskeletal symptoms are frequently reported among working populations across diverse occupations and work environments. Although research predominantly examines symptoms at individual anatomical sites, pain or discomfort occur concurrently in several body regions. This co-occurrence is relevant because symptoms distributed across multiple regions may represent a greater symptom burden and may reflect cumulative or additive contributions from personal and occupational characteristics [1,2]. Consequently, an assessment based solely on the presence or absence of any symptom may not capture potentially meaningful variation among symptomatic workers, particularly the distinction between symptoms affecting one region group and those involving multiple region groups.
Evidence from occupational cohorts and population-based studies indicates that the occurrence and distribution of musculoskeletal symptoms are associated with a combination of biomechanical, psychosocial, and organisational factors. Physically demanding work, tiring or painful postures, repetitive movements, and manual handling have been associated with symptom occurrence and pain affecting multiple anatomical sites [3,4,5]. Psychosocial and organisational characteristics, including work intensity, psychological demands, limited control, inadequate social support, and imbalance between work and family life, may also contribute to the reported symptom burden [6,7,8,9]. Although focused on broader health outcomes, an analysis of the Sixth European Working Conditions Survey found that job demands, physical and psychosocial working conditions, and managerial support were associated with self-assessed health and longstanding health problems [10]. More recently, Riedel et al. [11] reported that physical demands and work intensity were associated with a greater number of musculoskeletal complaints, whereas autonomy and social support were associated with fewer complaints. This evidence supports a multidimensional perspective in which physical, psychosocial, organisational, and contextual characteristics are considered jointly.
The distribution of symptoms across body regions represents an additional consideration. Longitudinal research has shown that pain affecting multiple sites may follow different developmental pathways according to physical and psychosocial working conditions [12]. Data-driven studies have further identified distinct patterns of musculoskeletal symptoms and employee profiles characterised by different combinations of work-related factors and pain perceptions [13,14]. Much epidemiological research has focused on individual anatomical sites or has combined all symptomatic individuals into a single category. A binary comparison between workers with and without symptoms provides information about symptom presence, but it does not establish whether the same characteristics distinguish a localised symptom profile from a more extensive multiregional burden. Evaluating these classification tasks separately may therefore provide a more detailed representation of symptom heterogeneity without assuming that symptom presence and symptom extent reflect identical processes.
Machine-learning methods are increasingly applied in occupational health and ergonomics to classify musculoskeletal outcomes, identify informative predictors, and represent potentially nonlinear relationships and interactions. Previous applications have included Bayesian networks, support vector machines, tree-based algorithms, neural networks, and ensemble models in administrative, healthcare, manufacturing, and mining workforces [15,16,17,18,19]. Silva et al. [20], for example, combined item response theory with several machine learning classifiers to stratify levels of musculoskeletal discomfort. In a comprehensive review, Chan et al. [21] reported that machine learning applications in this field focused predominantly on intervention development, the identification of relevant factors, and the examination of mechanisms related to the prevention of work-related musculoskeletal disorders.
The growing literature also highlights several methodological considerations. Many applications have been developed within specific occupational groups, using relatively modest samples or outcomes defined for particular anatomical regions. Recent reviews have identified occupation-specific samples and inconsistent validation and reporting practices, with external validation absent in several studies [22]. Evaluation may therefore be strengthened by considering calibration, prediction error, and the stability of model interpretations alongside discrimination. Greater algorithmic flexibility may be useful for representing complex relationships, but its practical value is best assessed through comparison with transparent and appropriately regularised statistical models. Complex surveys of working conditions introduce an additional consideration because clustering and unequal selection probabilities may influence both model development and performance evaluation. However, evidence remains limited regarding the separate classification of symptom presence and regional extent within a common analytical framework, particularly in large, occupationally heterogeneous, multicountry samples. It also remains unclear whether the same predictor domains provide comparable discriminatory information for symptom presence and multiregional burden.
Symptom presence and symptom extent constitute related but conditionally distinct classification outcomes. The first stage evaluates the presence of any musculoskeletal symptom in the full workforce, whereas the second focuses on the regional distribution of symptoms among symptomatic employees. This conditional structure avoids combining the absence of symptoms with variation in symptom extent and enables the two outcomes to be evaluated using separate models, decision thresholds, and calibration estimates. In contrast, simultaneous classification into three categories treats symptom status and regional extent as a single outcome and does not directly isolate classification performance within the symptomatic subgroup. The complementary sequential three-class analysis was used to quantify the combined performance of the two stages. Accordingly, the two-stage structure supports separate evaluation of symptom occurrence and multiregional burden without implying a temporal progression between these outcomes.
Accordingly, this study developed and evaluated a two-stage machine learning framework using data from 30,278 employees across 35 countries from the 2024 European Working Conditions Survey [23]. Candidate predictors were organised into four domains: contextual characteristics, physical and biomechanical exposures, work intensity and recovery, and psychosocial working conditions. Elastic net logistic regression, penalised spline logistic regression, and extreme gradient boosting (XGBoost) were selected to represent linear additive, nonlinear additive, and interaction-capable modelling structures, respectively. Model performance was evaluated through repeated nested cross-validation, with observations grouped by primary sampling unit and survey weights incorporated into model fitting and performance estimation. Discrimination was assessed using the areas under the receiver operating characteristic and precision-recall curves, while calibration and prediction error were also assessed. Model interpretation included permutation importance based on held-out observations, assessment of the stability of elastic net coefficients, and sensitivity analyses. The objectives were to classify the presence of musculoskeletal symptoms in the full analytical sample, distinguish single-region from multiregional symptoms among symptomatic employees, and compare the predictive performance of the three modelling approaches. Two research hypotheses were evaluated: the prespecified predictor domains would provide discriminatory information for distinguishing employees with and without musculoskeletal symptoms (H1), and these domains would provide discriminatory information for differentiating multiregional from single-region symptoms among symptomatic employees (H2). Given the cross-sectional design, the results are interpreted in terms of concurrent classification and association rather than prospective prediction or causal effects.
2. Materials and Methods
2.1. Dataset Description
This cross-sectional study involved a secondary analysis of data from the 2024 European Working Conditions Survey (EWCS 2024), obtained from the UK Data Service under Study Number 9511 [23]. The dataset contains 36,644 respondents aged 16–74 years from 35 European countries. Data were collected between February and November 2024 through computer-assisted face-to-face interviews. The EWCS employed country-specific, multistage stratified probability sampling based primarily on geographical region and degree of urbanisation, followed by the selection of primary sampling units, households, and eligible respondents [24].
The analytical sample was restricted to respondents classified as employees. Of the 36,644 respondents, 30,570 met this criterion. A further 292 records were excluded because of insufficient information for constructing the prespecified musculoskeletal symptom outcomes, resulting in a final sample of 30,278 employees from 35 countries and 3582 primary sampling units. The full analytical sample was used for Stage A, which classified the presence of any musculoskeletal symptom. Stage B included the 20,593 symptomatic employees and distinguished between single-region and multiregional symptoms.
The population-calibration weight supplied with the dataset was retained as the primary analysis weight. Primary sampling unit identifiers were incorporated into the cross-validation procedure to account for the clustered survey structure [23,24]. The analysis used de-identified secondary data obtained under the UK Data Service End User Licence. No new data were collected, and there was no direct contact with survey participants.
2.2. Outcome Definition and Predictor Specification
Musculoskeletal symptoms during the preceding 12 months were assessed using three EWCS 2024 items: backache (q85_a), muscular pain in the shoulders, neck, and upper limbs (q85_b), and muscular pain in the hips and lower limbs (q85_c) [23]. Each item was coded as indicating the presence or absence of the corresponding symptom. The three items defined three broad region groups: the back, the upper body, and the lower body. This grouping followed the anatomical structure of the available EWCS items and enabled regional symptom extent to be represented consistently across respondents. Affirmative responses were summed to produce a region count ranging from zero to three; values above three were not possible because the survey contained three relevant region-specific items. Stage A distinguished employees reporting no affected region from those reporting at least one affected region. Among symptomatic employees, Stage B distinguished symptoms confined to one region group from multiregional symptoms involving two or all three region groups. A three-category outcome comprising no symptoms, symptoms in one region group, and symptoms in two or three region groups was additionally examined through sequential classification.
The two-stage structure was adopted because the presence and extent of symptoms constitute distinct classification tasks. Restricting Stage B to symptomatic employees prevents combining employees without symptoms with those experiencing different levels of regional symptom burden. It also permits separate evaluation of the predictor patterns associated with symptom presence and multiregional burden, which may involve a broader combination of occupational and psychosocial factors than symptoms confined to one region [6].
The 24 candidate predictors were specified before model training based on the occupational-health and ergonomics literature [9,11,21] and their availability in the EWCS 2024. No univariable screening or automated data-driven selection was applied. The contextual domain comprised age, sex, organisational seniority, major occupational group based on the one-digit International Standard Classification of Occupations, economic activity section based on the one-letter Statistical Classification of Economic Activities in the European Community, country, and usual weekly working hours. The physical and biomechanical domain included exposure to vibration, tiring or painful positions, lifting or moving people, carrying or moving heavy loads, repetitive hand or arm movements, and prolonged sitting. The work-intensity and recovery domain comprised working at high speed, working to tight deadlines, long working days, insufficient daily rest, constraints on taking breaks, and insufficient time to complete work. The psychosocial domain included work-related stress, low autonomy over work methods, low autonomy over work speed, low manager support, and low colleague support. Country was retained as a contextual adjustment variable and was not interpreted as an actionable occupational exposure. Detailed definitions, source items, response scales, and coding procedures for all 24 predictors are provided in Supplementary Table S1.
2.3. Data Preprocessing and Model Specification
Special EWCS response codes representing refusal, uncertainty, or other nonsubstantive answers were treated as missing before modelling. The primary analysis used fold-specific single imputation rather than multiple imputation, while a complete-case analysis was conducted as a sensitivity analysis. Where applicable, exposure and work resource measures were recoded so that higher scores represented more adverse working conditions. For Elastic Net and XGBoost, numerical predictors were imputed using the median, with additional indicators representing missing values. In the spline model, continuous predictors were median imputed before spline transformation, whereas missing binary predictors were replaced with the most frequent category and accompanied by missingness indicators. Nominal predictors were imputed using the most frequent category and transformed using one-hot encoding, with previously unseen categories ignored during prediction. Numerical predictors were standardised for Elastic Net. In the spline model, spline basis terms and binary predictors were scaled without mean centring, whereas no scaling was applied for XGBoost. All preprocessing operations were incorporated into the model pipelines and estimated exclusively from the relevant training data within each resampling split.
Three supervised classification models were evaluated for each outcome stage. Elastic Net logistic regression combined L1 and L2 regularisation to accommodate correlated predictors while retaining directly interpretable coefficients [25]. Penalised spline logistic regression represented continuous predictors using spline basis functions and L2 regularisation, allowing additive nonlinear associations without prespecifying interaction terms [26]. XGBoost used regularised boosted decision trees to capture nonlinear relationships and higher-order interactions [27]. The model set therefore represented linear, additive nonlinear, and tree-based classification structures.
The EWCS population-calibration weight was normalised to have an overall mean of 1 and incorporated as an observation-level weight throughout model development and evaluation. For Elastic Net and penalised spline logistic regression, the weights determined each observation’s contribution to the penalised logistic loss function. For XGBoost, the same observation-level weights were incorporated into model fitting, thereby weighting each observation’s contribution to the binary logistic objective. Candidate hyperparameter configurations were compared within the inner cross-validation folds using the survey-weighted Brier score. Following tuning, each model was refitted using the eligible observations and corresponding weights within each outer training partition; Stage B fitting was restricted to employees reporting musculoskeletal symptoms. Discrimination, prediction error, calibration, and threshold-based performance measures were subsequently calculated from held-out predictions using the same population-calibration weights.
Hyperparameters were optimised separately for each model, outcome stage, and outer training partition using three-fold stratified group cross-validation. Primary sampling units defined the groups. Within each inner cross-validation split, observation-level survey weights were incorporated into model fitting, and candidate configurations were evaluated using the weighted Brier score in the corresponding validation fold. The mean weighted Brier score across the three inner validation folds was used for hyperparameter selection. The same weighting procedure was applied to all candidate configurations and modelling approaches. Among configurations whose mean Brier score was within one standard error of the minimum, the configuration with the lowest prespecified complexity score was selected. After hyperparameter selection, the classification threshold was determined from the inner out-of-fold predicted probabilities generated by the selected configuration by maximising survey-weighted balanced accuracy. Threshold selection was performed entirely within the corresponding outer training partition, without using information from the outer test partition. Model-specific preprocessing procedures, complete hyperparameter search spaces, selected configurations, and decision threshold summaries are reported in Supplementary Table S2.
2.4. Performance Evaluation
Model performance was evaluated using repeated nested cross-validation. The outer procedure comprised five repetitions of five-fold cross-validation, while hyperparameters were optimised using three-fold cross-validation within each outer training partition. Primary sampling units were kept within the same partition using stratified group splitting. Outer fold assignments were generated once from the full Stage A analytical sample and were applied across all modelling approaches and both outcome stages. For Stage B, model fitting and evaluation within each assigned partition were restricted to symptomatic employees, thereby retaining the same partition structure at the primary sampling unit level across the two stages. Stage B included 6228 employees with symptoms in one region group and 14,365 employees with symptoms in two or three region groups. No oversampling, undersampling, synthetic data generation, or additional class weighting was applied because the population-calibration weights and observed class distribution were retained. Performance was therefore evaluated using the area under the precision-recall curve (AUPRC), sensitivity, specificity, balanced accuracy, and F1 score in addition to the receiver operating characteristic curve (AUROC) and probability-based measures.
Discrimination was evaluated using the area under the AUROC and AUPRC. Probability accuracy was assessed using the Brier score and log loss, while calibration was evaluated using the calibration intercept and calibration slope. An intercept of 0 and a slope of 1 indicate ideal calibration. Sensitivity, specificity, balanced accuracy, and the F1 score were calculated using the thresholds selected within the inner cross-validation procedure [28,29]. Because the outer five-fold cross-validation was repeated five times, each employee eligible for the corresponding outcome stage contributed one held-out predicted probability per repetition. The five predicted probabilities were averaged to obtain a single aggregated out-of-fold probability for each employee. Performance point estimates were calculated from these employee-level aggregated predictions. The corresponding 95% confidence intervals (CIs) were obtained from 1000 bootstrap samples by resampling primary sampling units from the aggregated prediction dataset. Pointwise 95% confidence bands for the receiver operating characteristic, precision–recall, and calibration curves were obtained using 1000 primary-sampling-unit cluster-bootstrap resamples; these bands represent uncertainty at individual curve coordinates rather than simultaneous confidence bands. The calibration intercept and slope were estimated jointly by fitting a survey-weighted logistic calibration model with the observed binary outcome as the dependent variable and the logit of the aggregated out-of-fold predicted probability as the independent variable. No recalibration was applied; the reported estimates therefore describe the calibration of the original out-of-fold predictions. Expected calibration error was not included because its estimate depends on the number and boundaries of the selected probability bins. Calibration was instead assessed using the calibration intercept, calibration slope, Brier score, log loss, and graphical calibration curves.
Model performance was compared using survey-weighted estimates and bootstrap confidence intervals. Pairwise differences between each comparator and Elastic Net were quantified for AUROC, AUPRC, and the Brier score using 1000 paired primary-sampling-unit cluster-bootstrap samples. Primary sampling units were resampled concurrently for all models to preserve the paired evaluation structure and account for survey clustering. Differences were calculated as the comparator estimate minus the Elastic Net estimate, and percentile-based 95% confidence intervals were obtained from the corresponding bootstrap distributions. Two-sided bootstrap p-values were reported as descriptive complements to these intervals.
The primary model was selected separately for each outcome stage using a prespecified parsimony rule based on the weighted Brier score. First, the model with the lowest Brier score was identified. The tolerance was defined as the maximum of 0.001 and half the width of that model’s 95% cluster-bootstrap confidence interval. Models with a Brier score within this tolerance of the minimum were considered competitive. When more than one model satisfied this criterion, selection followed the predefined complexity order of Elastic Net logistic regression, penalised spline logistic regression, and XGBoost.
2.5. Model Explainability and Sensitivity Analyses
Predictor contributions were evaluated using held-out survey-weighted permutation importance. Following the general permutation principle described by Breiman [30], importance was defined in this study as the change in the weighted Brier score after permuting each original predictor in the outer test partition. For the selected Elastic Net model in each outcome stage, every predictor was independently permuted 10 times in the raw outer test data before preprocessing. The resulting changes in the weighted Brier score were averaged across the 10 permutations within each outer test partition and subsequently summarised across the 25 outer test partitions. Categorical predictors represented by multiple one-hot-encoded columns were permuted jointly at the level of the original predictor rather than separately at the level of the encoded columns.
For the selected Elastic Net models, standardised coefficients were examined across the 25 outer training partitions using the hyperparameter configuration selected in each outer training partition for each stage. Numerical and adversely coded ordinal predictors were summarised using the median coefficient, the 2.5th and 97.5th percentiles, and the proportion of positive coefficients. Directions were classified as consistently positive when at least 80% of the coefficients were positive and consistently negative when no more than 20% were positive. Other patterns were considered directionally unstable. Nominal predictors were excluded from the analysis because their interpretation require category specific contrasts. The percentile intervals represent variation across model fits rather than inferential confidence intervals, and the coefficients and permutation importance estimates were not interpreted as causal effects.
Sensitivity analyses were selected to evaluate the main analytical decisions that could influence model performance. Equal-country weighting assessed whether countries with larger weighted contributions disproportionately influenced the pooled estimates. The complete-case analysis examined sensitivity to fold-specific missing-data imputation, while exclusion of work-related stress evaluated dependence on a prominent self-reported psychosocial predictor. Exclusion of country assessed the contribution of country-level contextual information, and restriction to employees from the European Union’s 27 member states evaluated performance within a more institutionally defined country group. Each sensitivity analysis used a single five-fold outer cross-validation cycle with three-fold stratified group cross-validation for hyperparameter tuning within each outer training partition. The same fold-specific preprocessing and primary-sampling-unit-grouped splitting procedures were retained, and the observation weights defined for each scenario were incorporated into model fitting, weighted-Brier-score-based tuning, threshold selection, and performance estimation. Hyperparameters and classification thresholds were re-estimated within each sensitivity analysis. A sequential three-class analysis, combining the Stage A and Stage B probabilities to classify no symptoms, one affected region group, or two or three affected region groups, examined sensitivity to representing symptom burden as a three-category outcome. Its performance was evaluated using survey-weighted accuracy, multiclass log loss, and the ranked probability score. Country-specific performance was additionally evaluated for countries with adequate numbers of observations in both outcome classes.
Analyses were conducted in Python 3.13.15 using pandas 2.2.3, NumPy 2.1.3, scikit-learn 1.6.1, XGBoost 3.4.1, SciPy 1.16.3, PyArrow 23.0.1, OpenPyXL 3.1.5, Matplotlib 3.10.0, and seaborn 0.13.2. A fixed base random seed of 20260827 was used to generate reproducible seeds for the resampling, hyperparameter-tuning, model-fitting, and permutation procedures. The preprocessing specifications, prespecified hyperparameter search spaces, selection procedure, and configurations selected across the outer folds for all three modelling approaches are reported in Supplementary Table S2.
3. Results
3.1. Characterisation of the Sample and Symptom Burden
The final analytical sample comprised 30,278 employees across 35 countries and 3582 primary sampling units. The survey-weighted mean age was 42.34 years (standard deviation: 12.65), the weighted median organisational seniority was 6.0 years (interquartile range: 2.0–15.0), and the survey-weighted mean usual working time was 36.13 h per week (standard deviation: 10.50). Overall, 20,593 employees reported musculoskeletal symptoms in at least one of the three region groups. The survey-weighted proportions were 31.72% for no symptoms, 20.14% for symptoms affecting one region group, and 48.14% for symptoms affecting two or three region groups; accordingly, 68.28% of employees were classified as symptomatic. Complete descriptive results for all candidate predictors, including variable-specific missing-value frequencies, are provided in Supplementary Table S6. Mean age was 39.89 years among employees without symptoms, 42.82 years among those with symptoms in one region group, and 43.76 years among those with symptoms in two or three region groups. Several physical and psychosocial exposure scores were descriptively higher among employees with greater symptom burden. The mean score for tiring or painful positions increased from 1.03 among employees without symptoms to 1.45 among those with one affected region group and 2.42 among those with two or three affected groups. The corresponding values were 0.69, 0.95, and 1.47 for carrying or moving heavy loads; 2.15, 2.67, and 3.32 for repetitive hand or arm movements; and 1.50, 1.74, and 2.02 for work-related stress. Prolonged sitting did not follow the same pattern. Missingness across the candidate predictors was limited, ranging from 0% to 2.8%, and 26,825 employees (88.6%) had complete data for all predictors.
3.2. Model Performance and Calibration
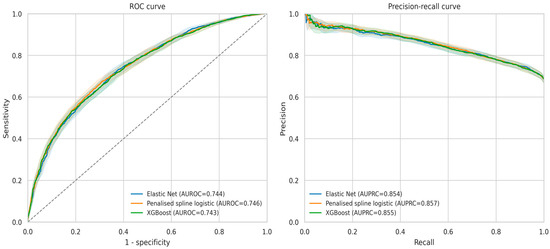
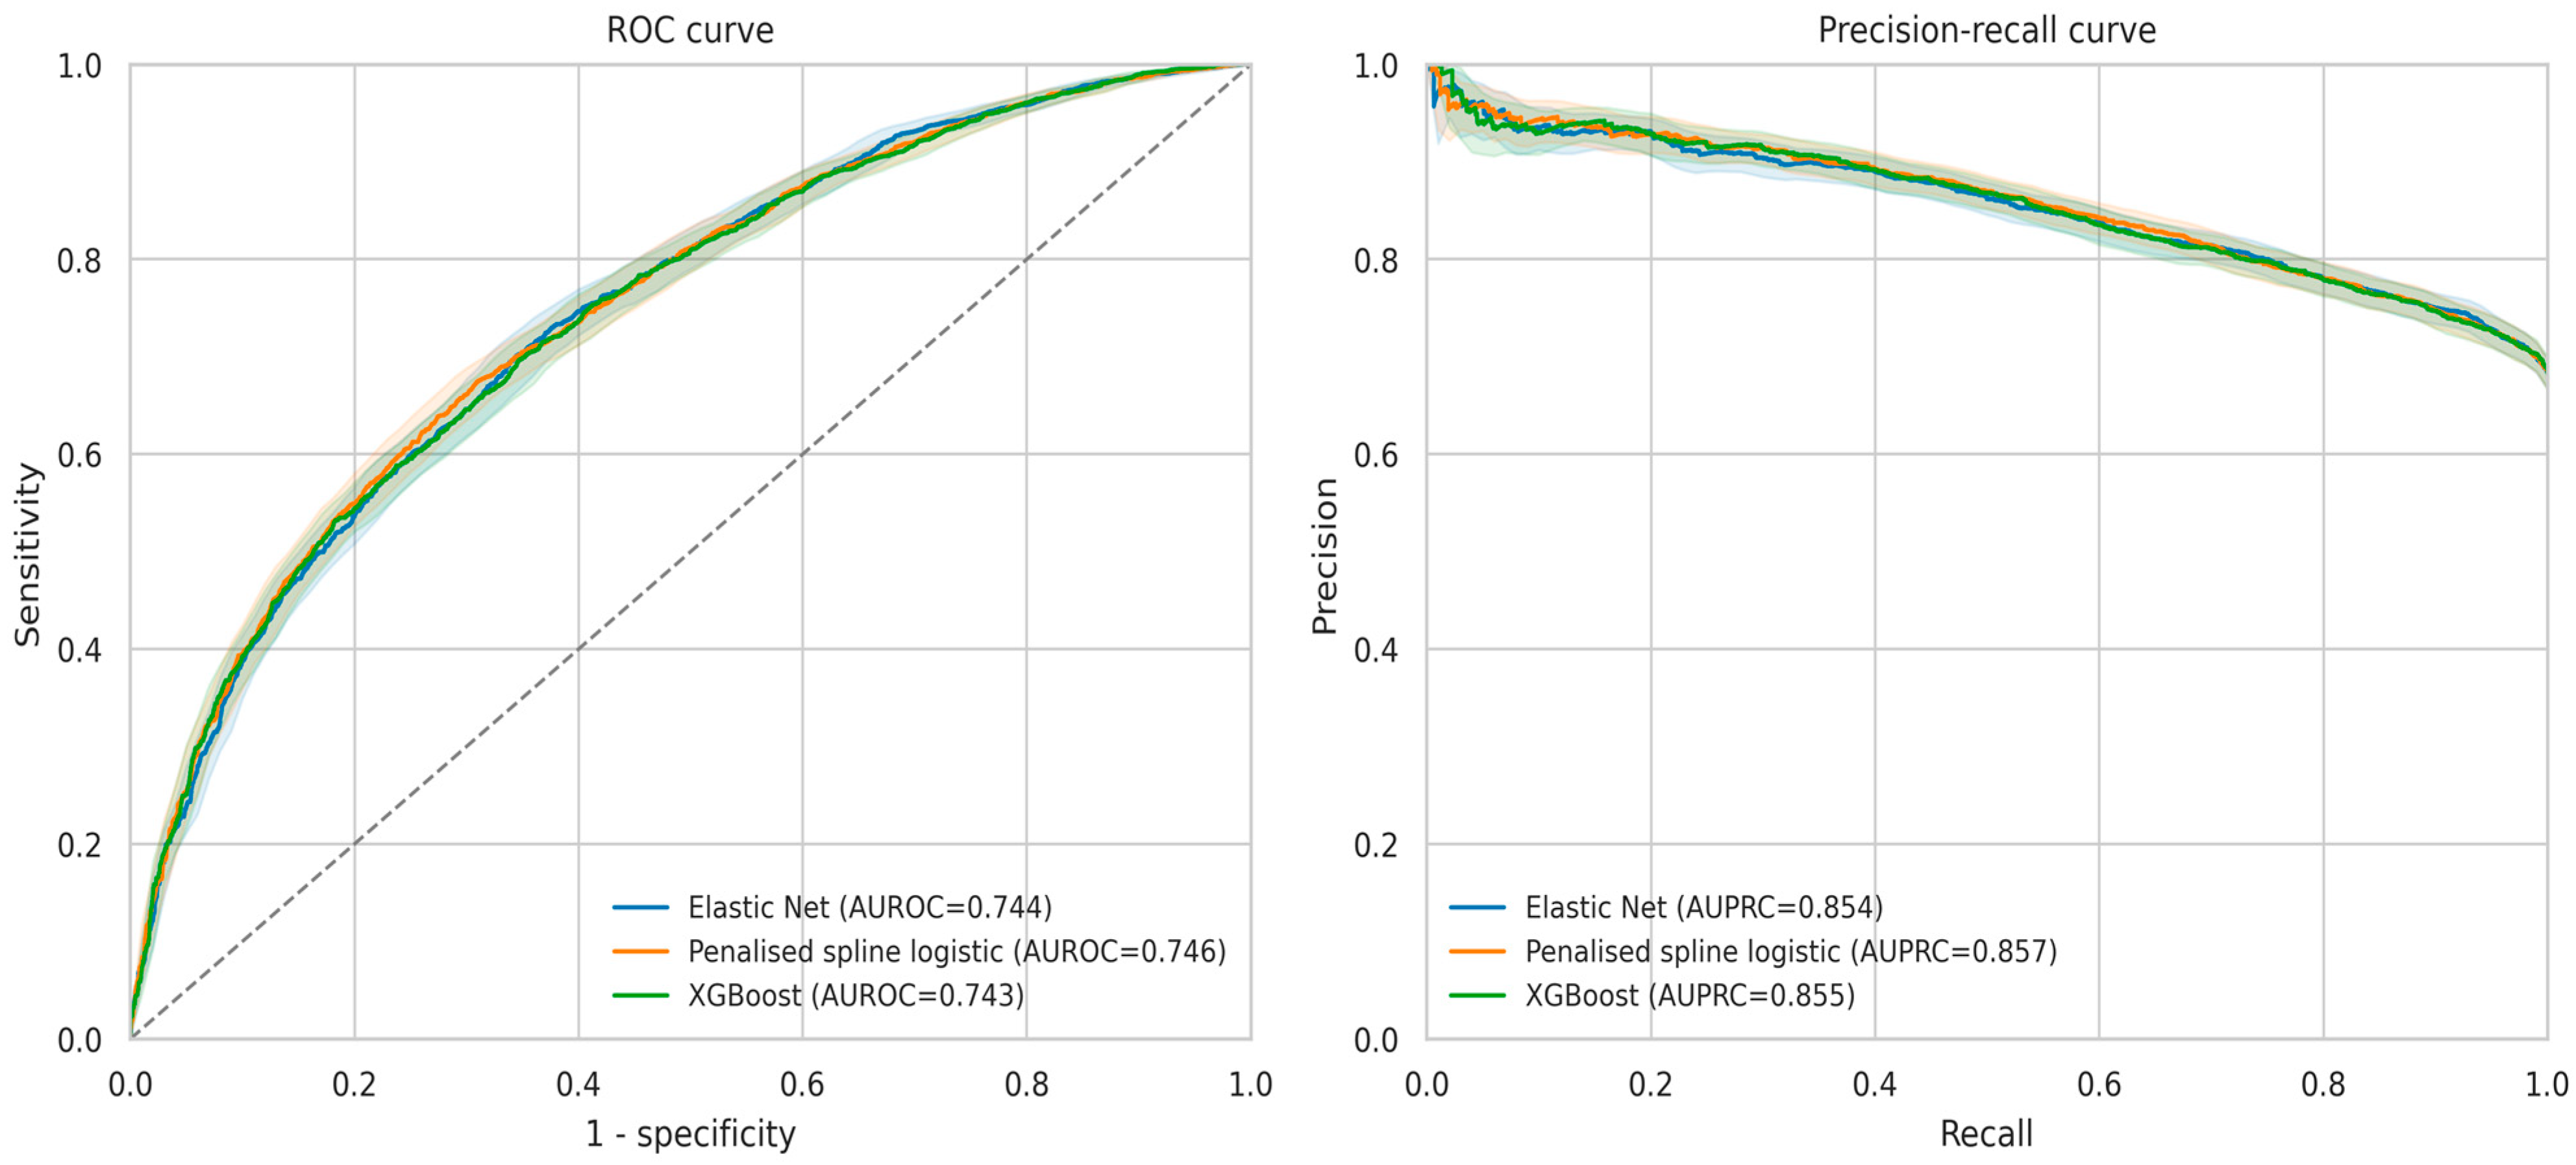
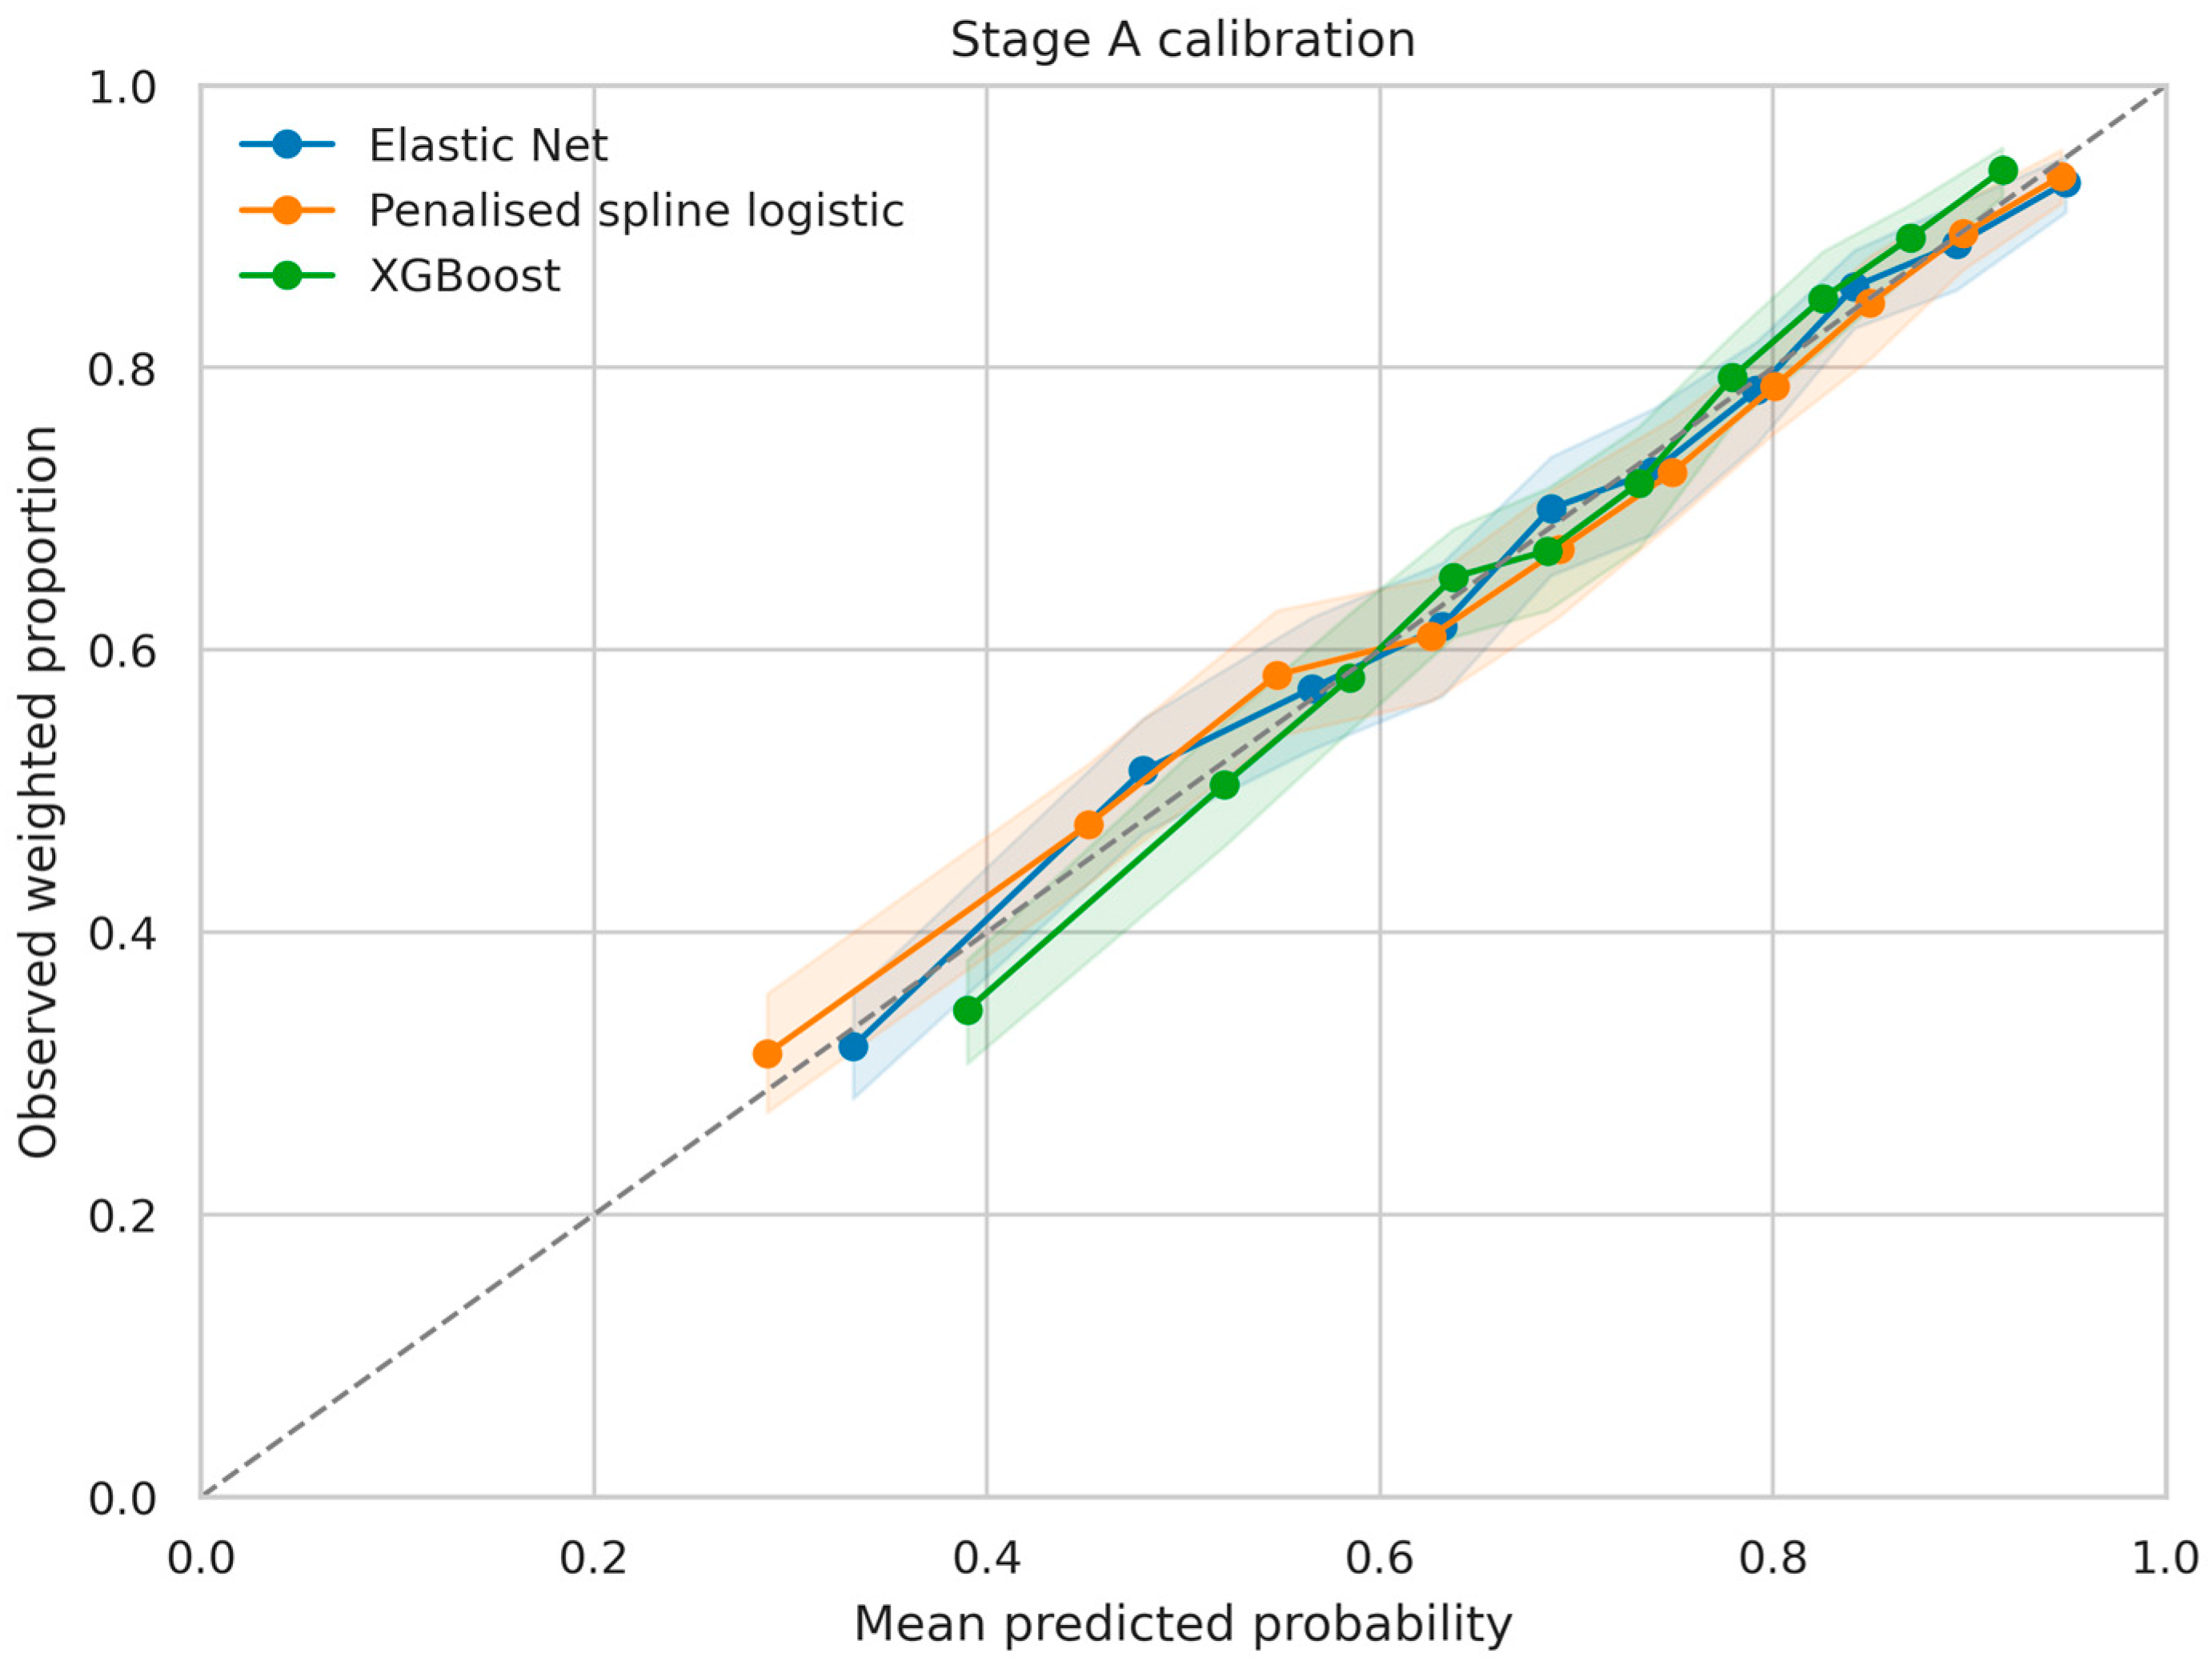
Discrimination, probability accuracy, and calibration estimates based on the aggregated survey-weighted out-of-fold predictions are presented in Table 1. The reported 95% confidence intervals were obtained from 1000 bootstrap samples with resampling at the primary sampling unit level. In Stage A, the three models showed similar performance. The penalised spline logistic model had the highest values for AUROC (0.746, 95% CI 0.732–0.760) and AUPRC (0.857, 95% CI 0.844–0.869). Its Brier score (0.181, 95% CI 0.175–0.187) was very close to that of Elastic Net. Elastic Net achieved an AUROC of 0.744 (95% CI 0.728–0.758), an AUPRC of 0.854 (95% CI 0.840–0.866), and a Brier score of 0.181 (95% CI 0.176–0.187). Its calibration intercept was 0.019 (95% CI −0.066 to 0.108), and its calibration slope was 0.969 (95% CI 0.897–1.040), indicating limited deviation from ideal calibration. XGBoost had similar discrimination and prediction error, although its calibration intercept (−0.119, 95% CI −0.216 to −0.028) and slope (1.175, 95% CI 1.094–1.267) deviated more from the ideal values. The Stage A ROC and precision–recall curves are presented in Figure 1.
Table 1.
Discrimination, prediction error, and calibration of the machine-learning models for Stage A and Stage B.
Figure 1.
Receiver operating characteristic and precision–recall curves with pointwise 95% primary-sampling-unit cluster-bootstrap bands for Stage A classification. Shaded areas indicate pointwise 95% primary-sampling-unit cluster-bootstrap confidence bands. The diagonal dotted line in the ROC panel represents the no-discrimination reference.
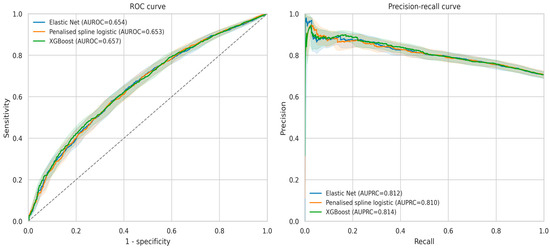
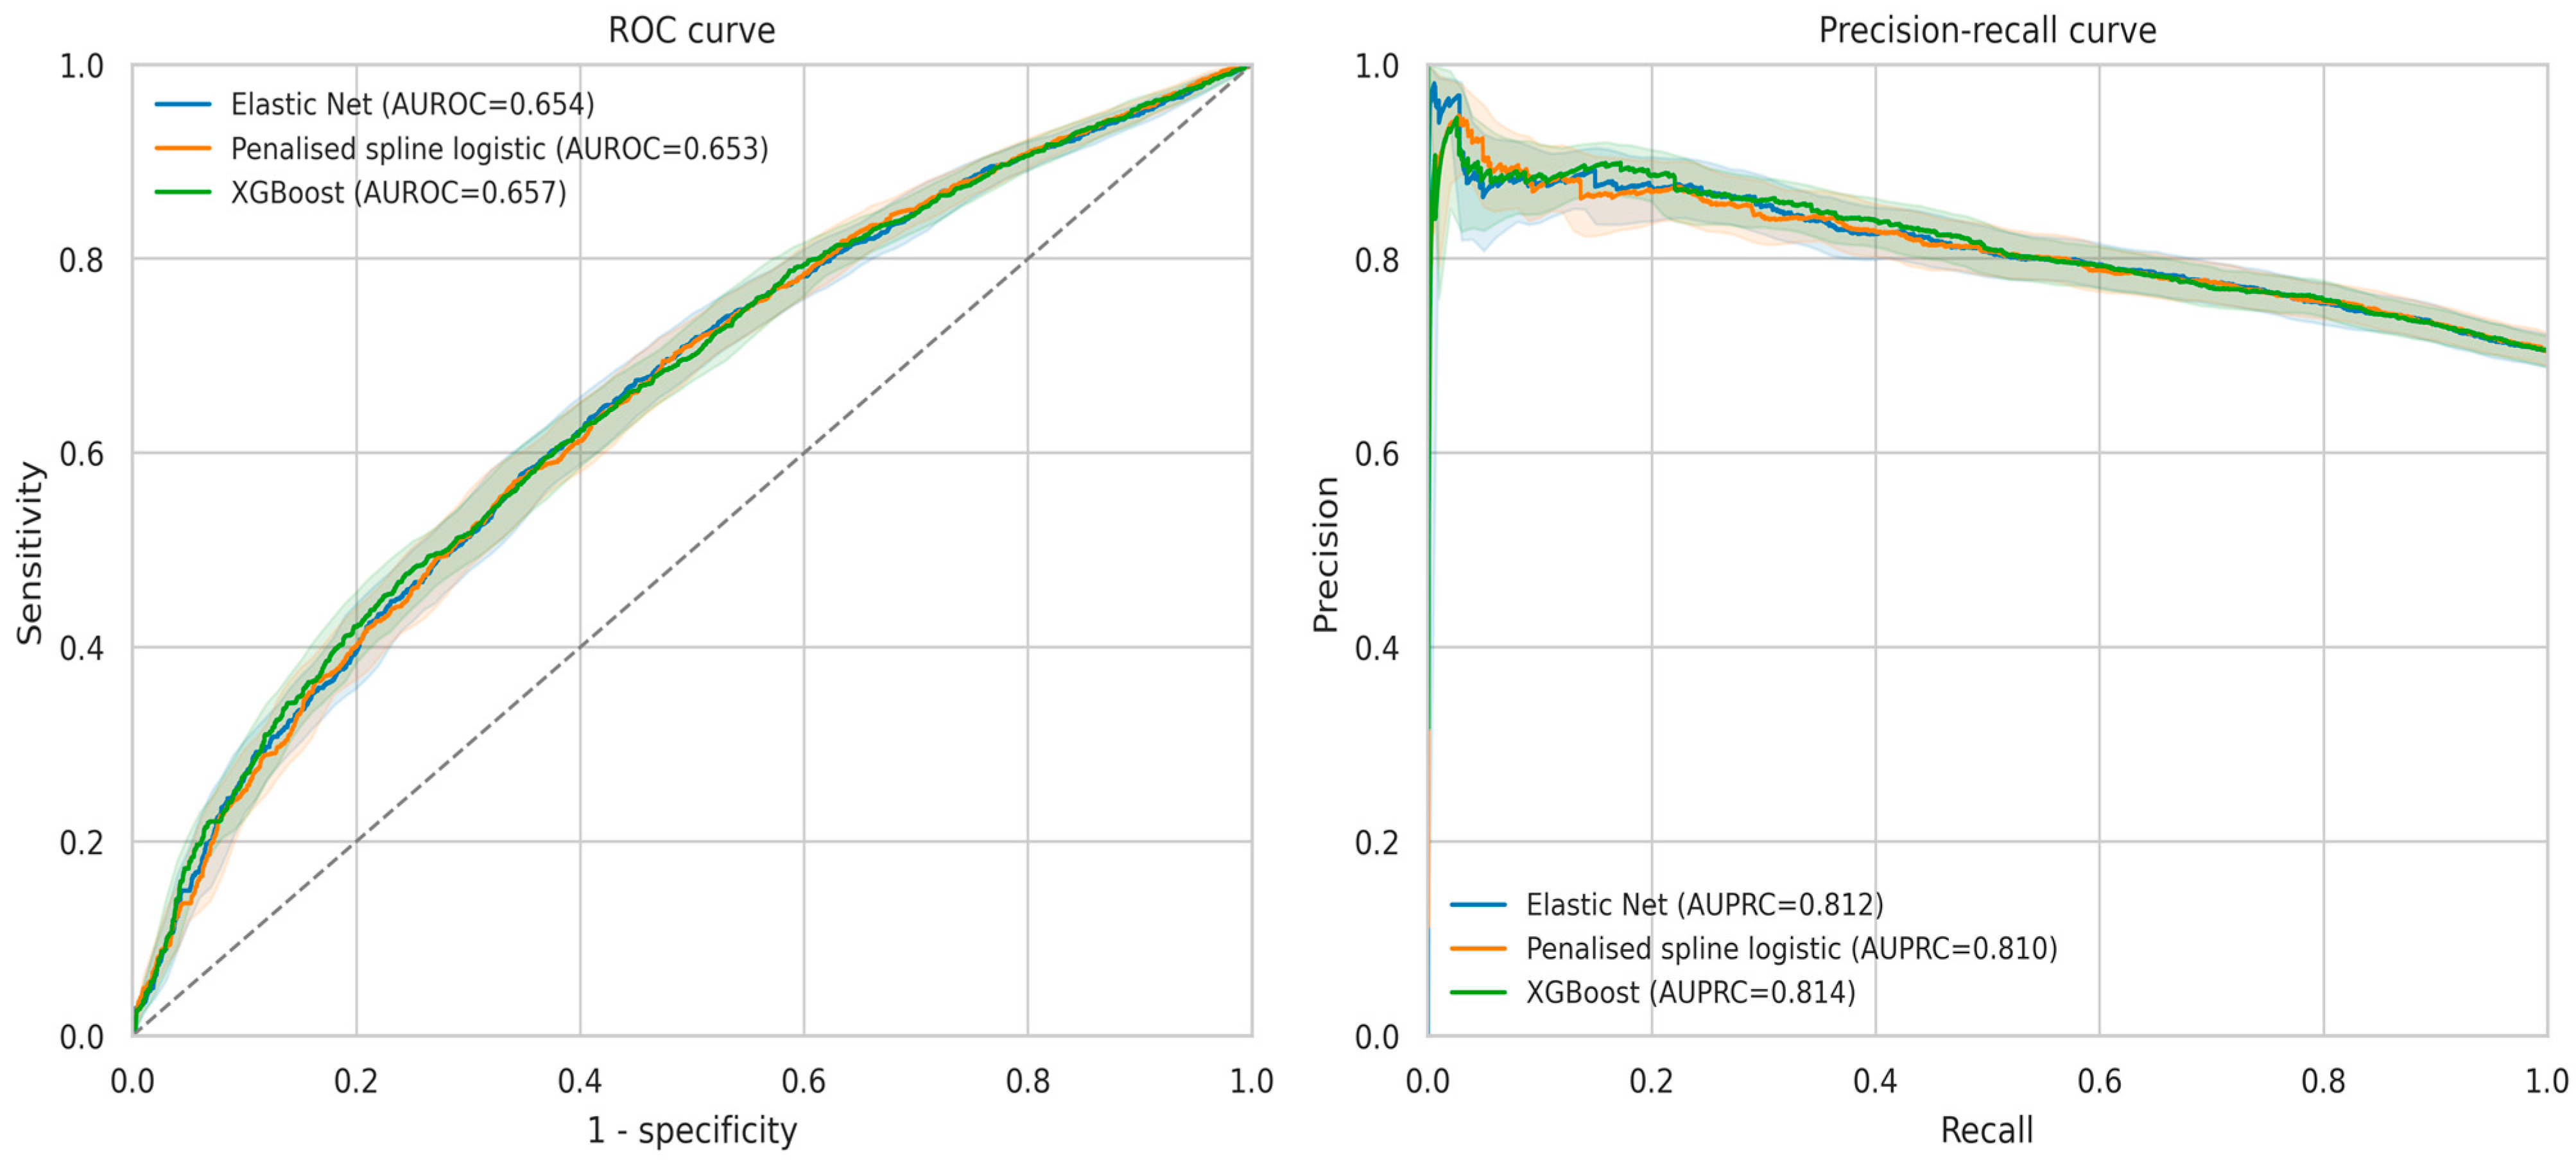
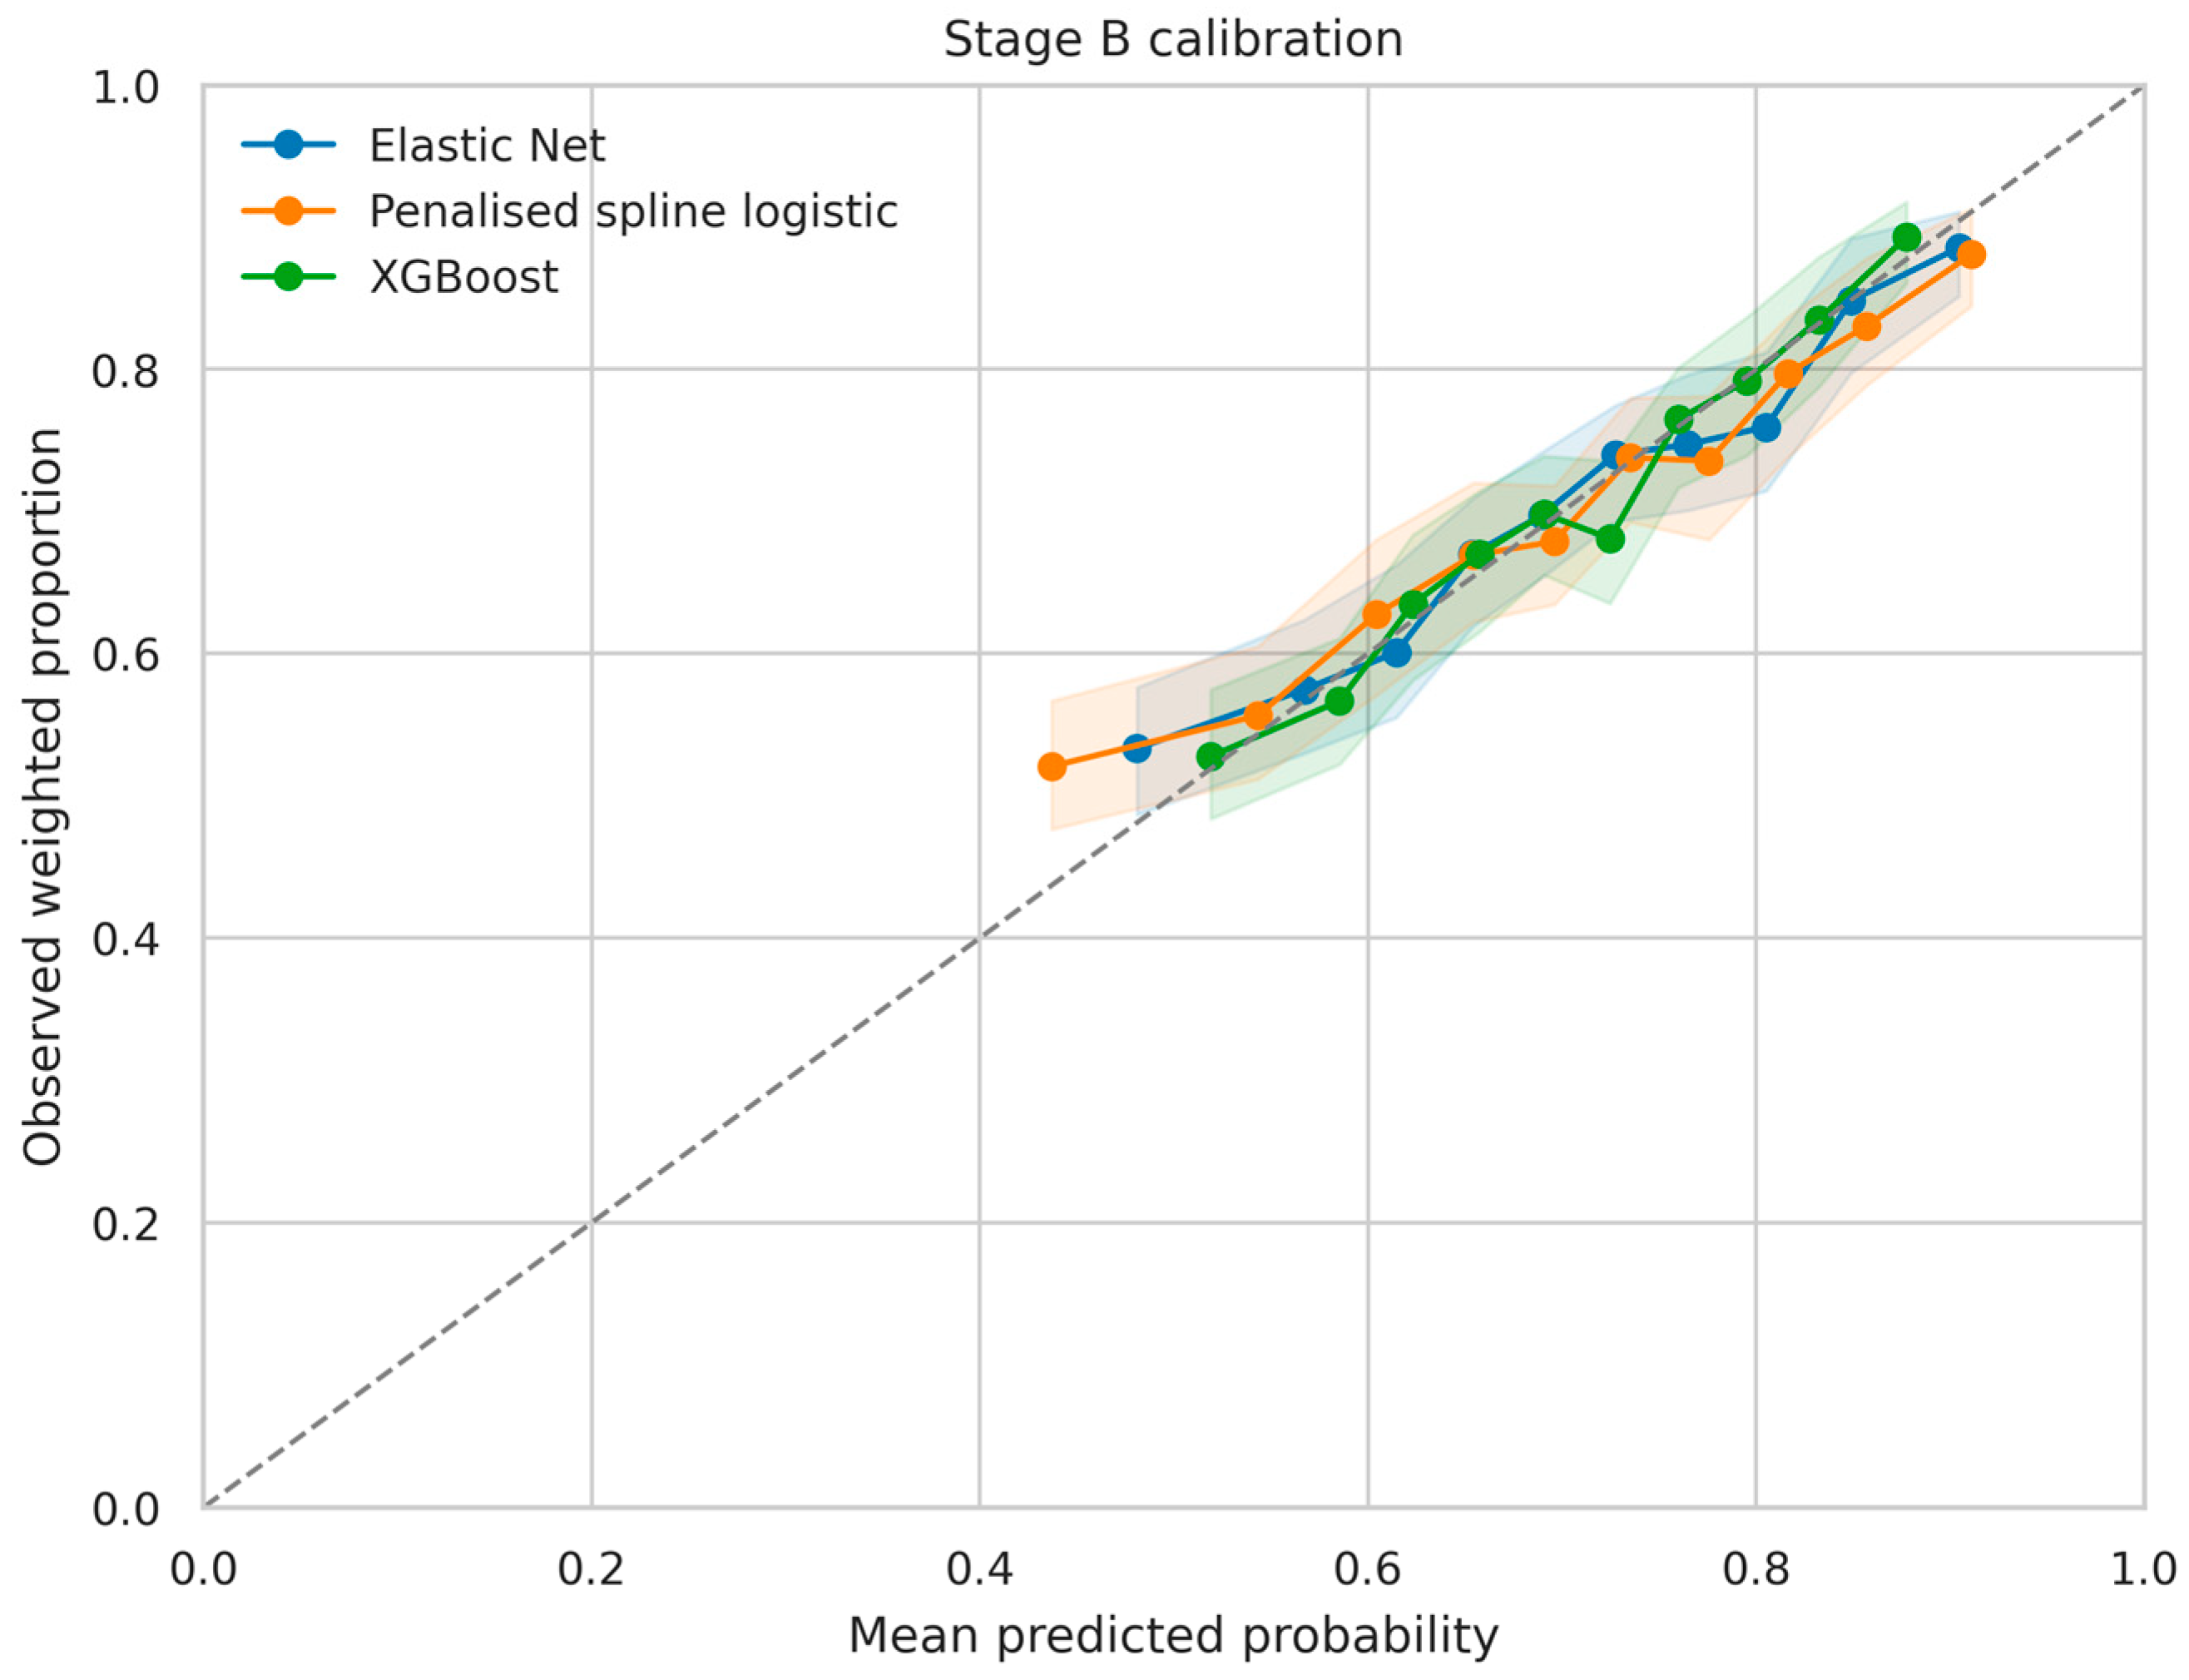
Stage B had lower AUROC estimates than Stage A, while differences among the three models remained limited. XGBoost had the highest AUROC (0.657, 95% CI 0.638–0.677) and AUPRC (0.814, 95% CI 0.795–0.834), together with the lowest Brier score (0.195, 95% CI 0.188–0.203). Its calibration intercept was −0.005 (95% CI −0.128 to 0.117), and its calibration slope was 1.009 (95% CI 0.877–1.153). Elastic Net achieved an AUROC of 0.654 (95% CI 0.634–0.673), an AUPRC of 0.812 (95% CI 0.791–0.831), and a Brier score of 0.196 (95% CI 0.189–0.204). Its calibration intercept and slope were 0.137 (95% CI 0.034–0.249) and 0.830 (95% CI 0.712–0.954), respectively. The penalised spline logistic model showed similar discrimination, with a calibration slope of 0.748 (95% CI 0.644–0.857). The Stage B ROC and precision–recall curves are presented in Figure 2. The corresponding calibration plots for Stages A and B are shown in Figure 3 and Figure 4, respectively.
Figure 2.
Receiver operating characteristic and precision–recall curves with pointwise 95% primary-sampling-unit cluster-bootstrap bands for Stage B classification. Shaded areas indicate pointwise 95% primary-sampling-unit cluster-bootstrap confidence bands. The diagonal dotted line in the ROC panel represents the no-discrimination reference.
Figure 3.
Calibration curves for Stage A classification. Shaded areas indicate pointwise 95% primary-sampling-unit cluster-bootstrap confidence bands. The diagonal dotted line represents perfect calibration, where observed and predicted probabilities are equal.
Figure 4.
Calibration curves for Stage B classification. Shaded areas indicate pointwise 95% primary-sampling-unit cluster-bootstrap confidence bands. The diagonal dotted line represents perfect calibration, where observed and predicted probabilities are equal.
Threshold-based classification results are presented in Table 2. In Stage A, balanced accuracy ranged from 0.672 for Elastic Net and XGBoost to 0.680 for the penalised spline logistic model. Positive-class F1 scores ranged from 0.715 to 0.720, whereas negative-class F1 scores ranged from 0.567 to 0.582. In Stage B, Elastic Net achieved the highest balanced accuracy (0.613) and positive-class F1 score (0.680). Negative-class F1 scores were similar across the models, ranging from 0.487 to 0.492. These results reflect the class distributions and model-specific thresholds selected within the inner cross-validation procedure.
Table 2.
Sensitivity, specificity, balanced accuracy, and class-specific F1 scores of the machine-learning models at the selected classification thresholds.
Pairwise primary-sampling-unit cluster-bootstrap comparisons supported the similarity of model performance within each classification stage. In Stage A, the AUROC difference relative to Elastic Net was 0.0023 (95% CI: −0.0018 to 0.0068) for the penalised spline model and −0.0005 (95% CI: −0.0060 to 0.0053) for XGBoost. In Stage B, the corresponding differences were −0.0004 (95% CI: −0.0076 to 0.0066) and 0.0032 (95% CI: −0.0046 to 0.0105), respectively. The 95% confidence intervals for all paired AUROC, AUPRC, and Brier-score differences included zero (Supplementary Table S7). All three models also satisfied the prespecified Brier-score competitiveness criterion. Elastic Net was therefore retained as the primary model for both stages under the predefined parsimony rule. The ROC and precision–recall curves similarly showed limited differences in discrimination across the models (Figure 1 and Figure 2), whereas the calibration plots indicated somewhat greater variation, particularly in Stage B (Figure 3 and Figure 4).
3.3. Predictor Patterns and Robustness Analyses
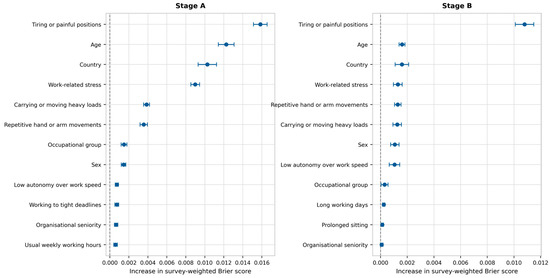
Held-out survey-weighted permutation importance, averaged across 10 independent permutations per predictor within each outer test partition, identified tiring or painful positions as the most informative predictor in both classification stages. For the selected Elastic Net model, permutation of this predictor increased the weighted Brier score by 0.0158 in Stage A and 0.0108 in Stage B. In Stage A, age, country, work-related stress, carrying or moving heavy loads, and repetitive hand or arm movements also showed comparatively high importance. The corresponding values were generally smaller in Stage B, where age, country, work-related stress, repetitive hand or arm movements, carrying or moving heavy loads, sex, and low autonomy over work speed followed tiring or painful positions. Lower-ranked estimates were close to zero and were therefore not interpreted individually (Figure 5). Full results for all candidate predictors are reported in Supplementary Table S3.
Figure 5.
Held-out survey-weighted permutation importance for the selected Elastic Net models, based on 10 permutations per predictor in each outer test partition. Error bars show 95% intervals across the 25 outer partitions.
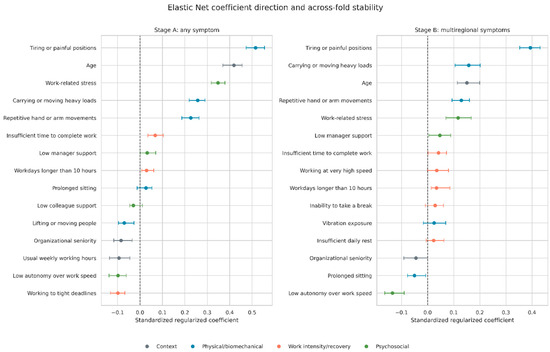
The standardised Elastic Net coefficients provided additional information on the direction and stability of predictor contributions across the 25 outer training partitions. In Stage A, tiring or painful positions had the largest median positive coefficient (β = 0.516), followed by age (β = 0.419), work-related stress (β = 0.348), carrying or moving heavy loads (β = 0.257), and repetitive hand or arm movements (β = 0.226). These coefficients were positive in all outer model fits. Working to tight deadlines, low autonomy over work speed, usual weekly working hours, organisational seniority, and lifting or moving people consistently had negative coefficients, although their absolute magnitudes were smaller.
In Stage B, tiring or painful positions again had the largest median positive coefficient (β = 0.394). Carrying or moving heavy loads (β = 0.158), age (β = 0.150), repetitive hand or arm movements (β = 0.129), and work-related stress (β = 0.117) also had consistently positive coefficients. Low autonomy over work speed had a consistently negative coefficient (β = −0.135), while prolonged sitting had a smaller negative coefficient (β = −0.051). Low manager support had a small positive coefficient and was positive in 96% of the outer fits. Several other predictors had coefficients of smaller magnitude or less stable directions across partitions (Figure 6). Detailed coefficient summaries are reported in Supplementary Table S4. The reported percentile ranges describe variation across fitted models and are not inferential confidence intervals.
Figure 6.
Direction and stability of standardised Elastic Net coefficients across outer training partitions for Stage A and Stage B.
Sensitivity analyses yielded performance estimates that were generally close to those of the primary Elastic Net models, although some variation was observed across scenarios (Table 3). In Stage A, AUROC was 0.755 under equal-country weighting and 0.744 in the complete-case analysis. Excluding work-related stress reduced the AUROC to 0.727, while excluding country resulted in an AUROC of 0.720. The EU27-only analysis yielded an AUROC of 0.738. In Stage B, AUROC ranged from 0.648 in the EU27-only analysis to 0.662 under equal-country weighting. Complete-case analysis yielded an AUROC of 0.657, while exclusion of work-related stress and country resulted in AUROCs of 0.655 and 0.651, respectively. Brier scores and balanced accuracy estimates showed comparatively limited variation across these analyses.
Table 3.
Sensitivity analyses for the selected Elastic Net models.
The sequential three-class analysis combined the Stage A and Stage B predicted probabilities to classify employees into three symptom-burden categories: no symptoms, symptoms in one region group, and symptoms in two or three region groups. Weighted accuracy was 0.575 for Elastic Net and the penalised spline logistic model and 0.576 for XGBoost. Multiclass log loss ranged from 0.933 to 0.934, while the ranked probability score ranged from 0.389 to 0.390 (Table 4). Differences among the three models were small across these performance measures.
Table 4.
Performance of the sequential three-class classification analysis.
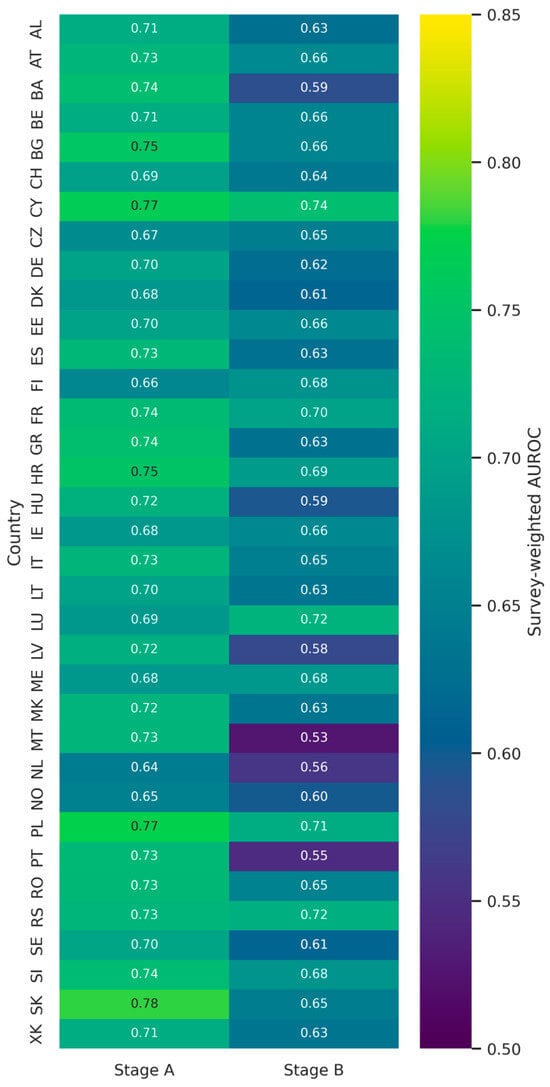
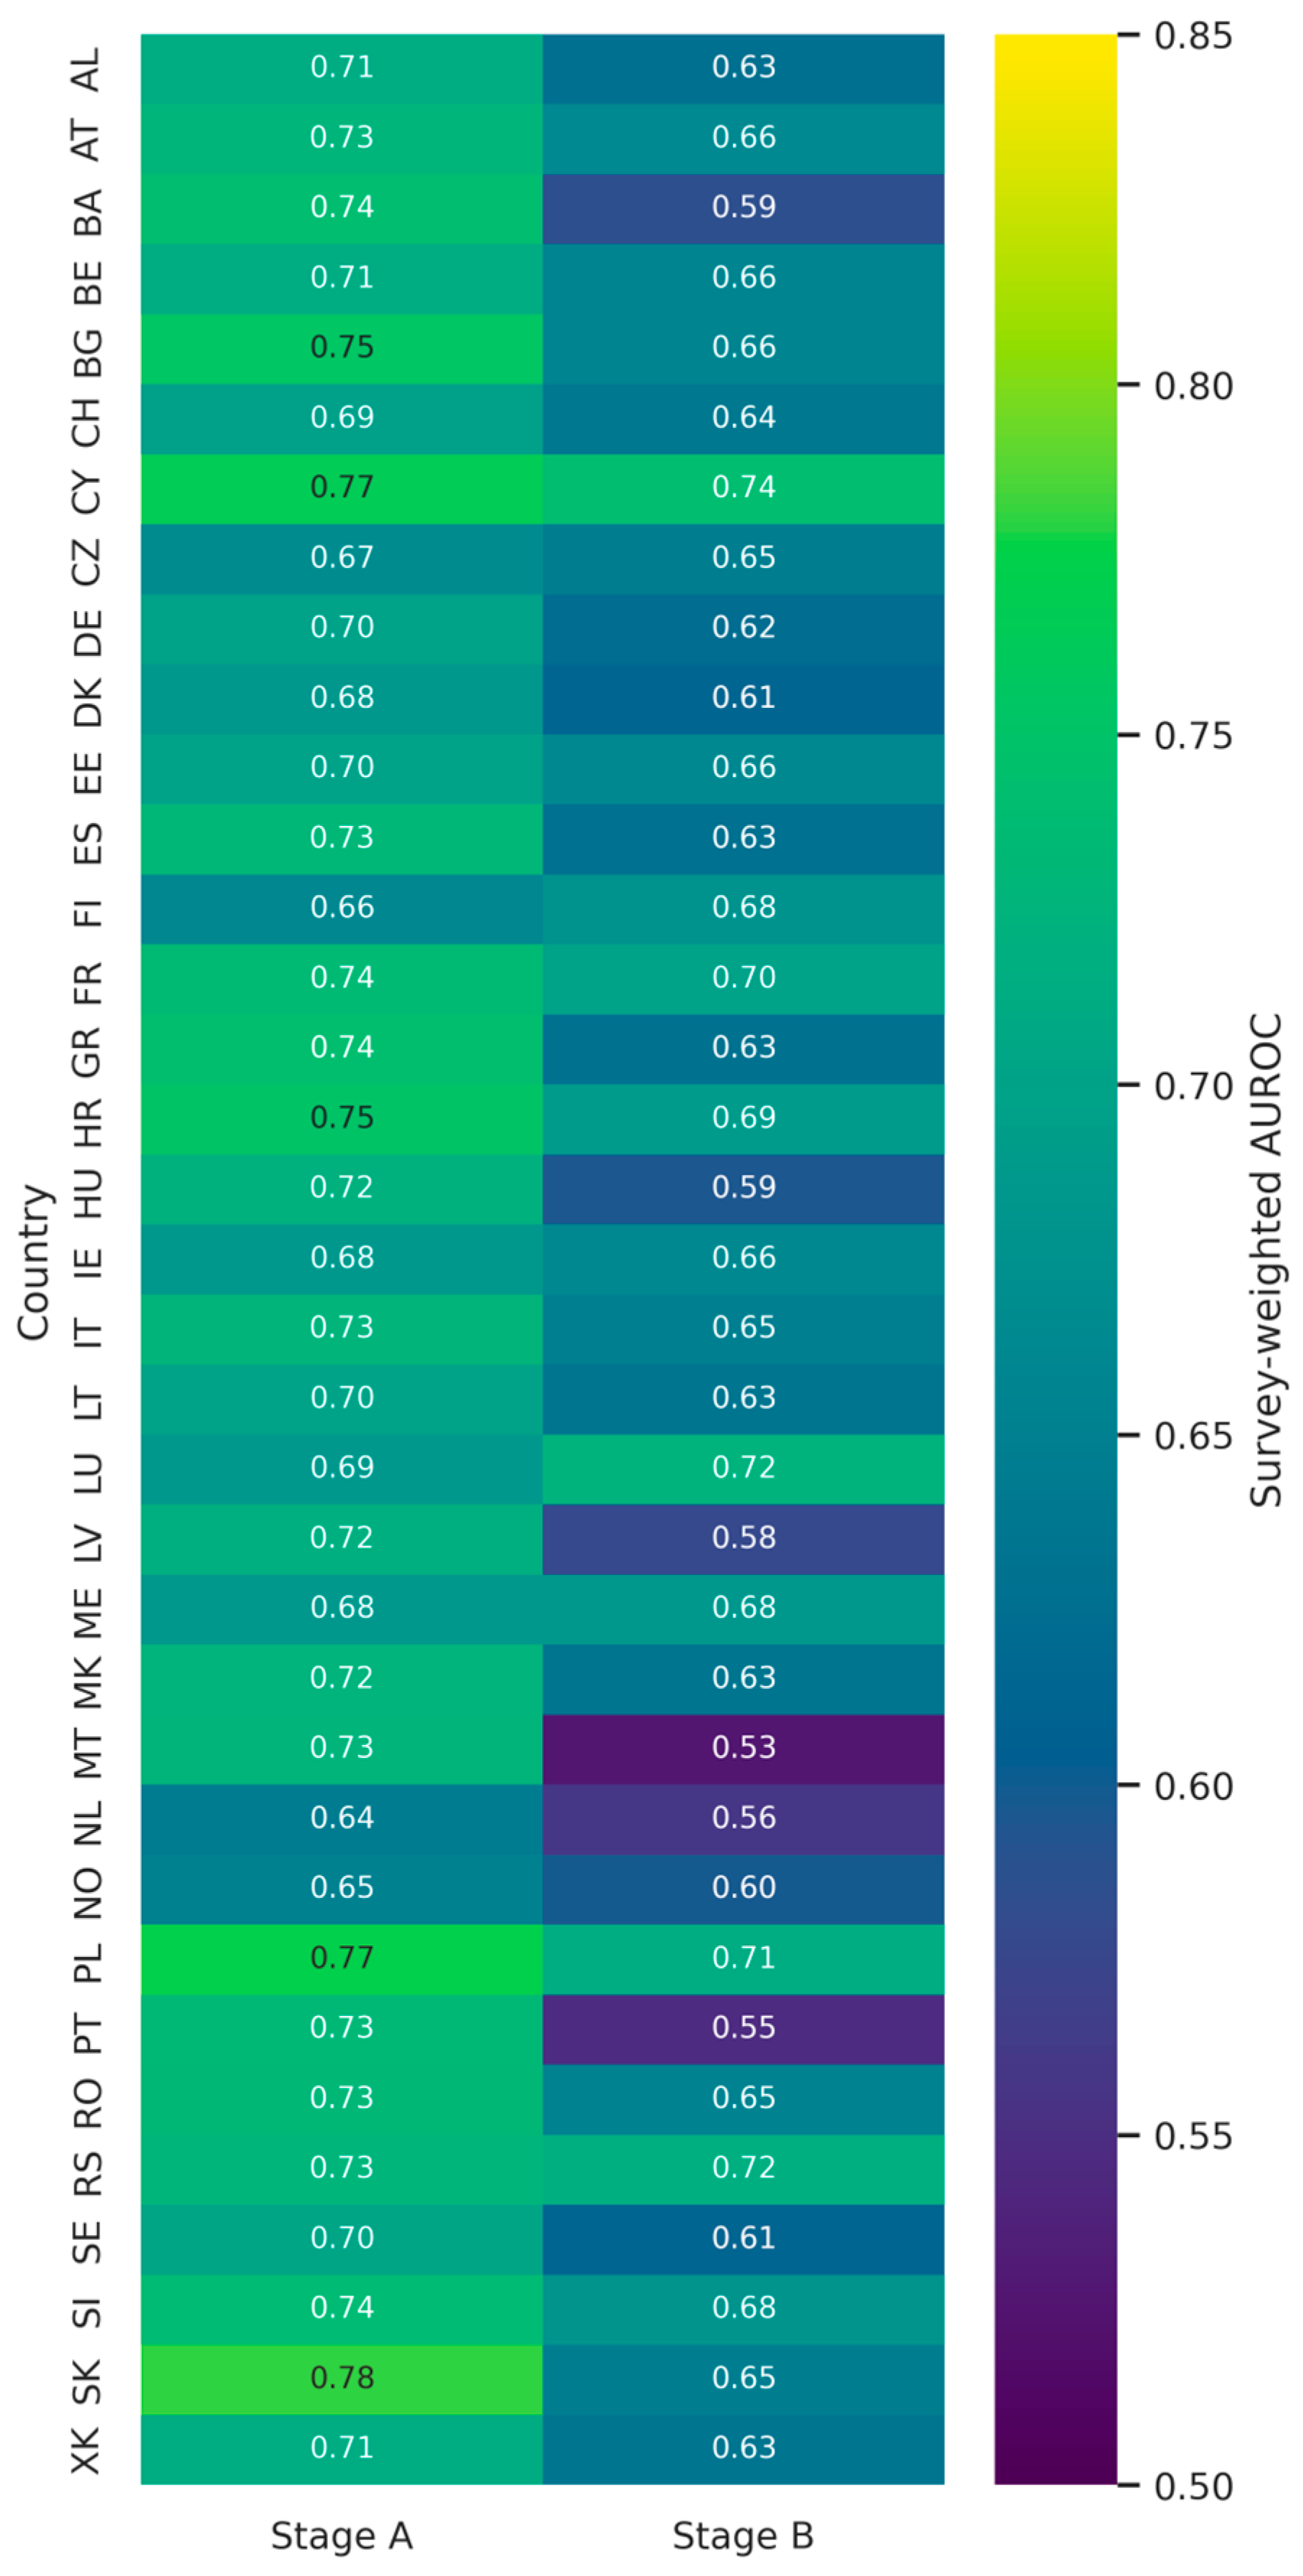
Country-specific AUROC estimates varied across countries and between the two classification stages (Figure 7). This variation was observed across all three modelling approaches. Because the country-specific analyses were intended to describe variation in model performance rather than to compare countries directly, the complete set of country-level performance estimates is provided in Supplementary Table S5.
Figure 7.
Country-specific AUROC estimates for the selected Elastic Net model in Stage A and Stage B.
4. Discussion
This study developed and evaluated an interpretable two-stage machine-learning framework for classifying musculoskeletal symptom patterns among employees participating in the 2024 European Working Conditions Survey. Stage A distinguished employees with and without symptoms, whereas Stage B distinguished one affected region group from two or three affected region groups among symptomatic employees. The main finding was that discrimination was higher for symptom presence than for symptom extent, while the differences between Elastic Net, penalised spline logistic regression, and XGBoost were limited. Elastic Net was therefore retained as the primary model for both stages under the prespecified parsimony rule. The two stages represent complementary classification tasks rather than successive stages of disease progression.
Model performance varied slightly according to the evaluation metric, but the paired primary-sampling-unit cluster-bootstrap comparisons did not indicate systematic differences from Elastic Net in AUROC, AUPRC, or the Brier score. The penalised spline model had the numerically highest discrimination estimates in Stage A, whereas XGBoost produced slightly more favourable discrimination and probability-error estimates in Stage B. Elastic Net also achieved the highest balanced accuracy and positive-class F1 score in Stage B. The sequential three-class analysis yielded a weighted accuracy of approximately 0.575 and a log loss of approximately 0.934, with only small differences across the three models. These values reflect partial separation of the symptom-burden categories and variation in the corresponding class probabilities. The weighted accuracy is not directly comparable with the balanced accuracy of either binary stage because the three-class analysis involves a more granular outcome and combines probability estimates from both stages. Its lower numerical value is therefore consistent with the structure of the three-category classification task rather than indicating inconsistency between the analyses. As greater algorithmic flexibility did not consistently improve performance across the evaluated metrics, Elastic Net was selected to balance predictive performance, model complexity, and coefficient-based interpretation.
Calibration provided information beyond discrimination. Elastic Net showed calibration parameters close to the ideal values in Stage A, whereas greater variation among models was observed in Stage B. XGBoost produced estimates closer to the ideal calibration values in Stage B, although this advantage was not accompanied by consistent improvement across the other performance measures. The slopes below unity for the Stage B Elastic Net and penalised spline models indicate that their predicted probabilities were somewhat more extreme than the observed outcome frequencies. If Stage B probabilities are intended for use beyond relative group-level comparisons, calibration should be reassessed in the target population and, where appropriate, updated using methods such as logistic recalibration or isotonic regression. These findings support the consideration of calibration and prediction error alongside AUROC and AUPRC when evaluating models based on occupational survey data [29]. Accordingly, the primary model was selected using the predefined decision rule rather than a single performance measure.
The lower discrimination observed in Stage B may reflect the substantial overlap in occupational and psychosocial characteristics between employees reporting symptoms in one region group and those reporting symptoms in two or three region groups. These employees share the presence of musculoskeletal symptoms and may differ primarily in the regional distribution of symptom burden, making this distinction more difficult than the classification of symptom presence. Previous studies have shown that multiregional musculoskeletal symptoms can exhibit heterogeneous patterns and may be associated with different combinations of working conditions [1,6,12]. Data-driven studies have similarly identified variation in symptom profiles among workers [13,14]. Within this context, the Stage B AUROC of approximately 0.65 represents partial differentiation of regional symptom extent.
Previous machine-learning studies in occupational health and ergonomics have reported varying levels of classification performance depending on the outcome definition, occupational population, class distribution, and validation design. Byeon [17] reported an AUROC of 0.84 for occupational musculoskeletal disorder classification among South Korean male office workers. Da Silva et al. [20] obtained higher classification measures for multilevel musculoskeletal discomfort, particularly after synthetic class balancing; however, that analysis involved 300 workers and a different outcome structure. The Stage A AUROC of approximately 0.74 should therefore be interpreted in relation to differences in study populations, outcome definitions, class-balancing procedures, and validation approaches [22].
The tiring or painful positions score had the highest information value in both stages. Carrying or moving heavy loads and repetitive hand or arm movements also showed stable positive coefficient directions in the Elastic Net models. These patterns are consistent with previous evidence linking physical workload, demanding postures, and manual activities to multisite musculoskeletal symptoms [3,4,5]. The agreement between held-out permutation importance and coefficient stability indicates that these variables provided consistent predictive information across the resampling partitions. The findings should be interpreted as evidence of concurrent classification value rather than as estimates of independent physical exposure effects.
Psychosocial conditions also provided information for classification. Work-related stress was among the more informative predictors in both stages and showed a stable positive coefficient direction. Model performance after excluding work-related stress declined more clearly in Stage A than in Stage B, showing that stress-related information was more relevant to distinguishing employees with and without symptoms than to differentiating regional extent among symptomatic employees. This pattern is consistent with previous research examining psychosocial job demands, work control, social support, and multisite musculoskeletal pain [6,7,8]. It is also consistent with EWCS-based evidence linking physical and psychosocial working conditions with broader health outcomes [10]. Given the cross-sectional design, these findings describe concurrent classification patterns and do not establish temporal or causal relationships.
Age and country were also informative predictors. The stable positive direction for age may reflect differences in cumulative occupational exposure or workforce composition. Country contributed contextual information to the models, particularly in Stage A, but it should be interpreted as an adjustment variable rather than as an actionable exposure. It may capture differences in symptom prevalence, occupational composition, work organisation, and reporting context. Some lower-magnitude coefficients for work pace, autonomy, and working hours showed negative directions. These estimates are conditional and penalised, and their signs may reflect correlations among predictors rather than direct protective relationships [25].
Model-based interpretation should account for the dependencies among the candidate predictors. Averaging 10 independent permutations within each outer test partition reduced dependence on any single random shuffle; nevertheless, estimates close to zero remain sensitive to resampling variation and were not interpreted individually. Held-out permutation importance measures the deterioration in predictive performance after a predictor is disrupted; when occupational exposures are correlated, predictive information may be distributed across related variables, altering their individual importance estimates. Permutation may also generate predictor combinations that occur infrequently in the observed data. Elastic Net regularisation can reduce, but does not eliminate, coefficient instability arising from multicollinearity, and coefficient magnitudes and directions remain conditional on variable coding, model specification, and the selected penalty. Permutation importance and coefficient-stability summaries should therefore be interpreted as complementary descriptions of the information used by the models rather than as estimates of unique predictor contributions or causal effects.
Country-specific discriminatory performance varied across the survey countries. For Elastic Net, country-specific AUROC values ranged from approximately 0.644 to 0.781 in Stage A and from 0.527 to 0.740 in Stage B. Country-specific variation is consistent with heterogeneity across the national samples in workforce composition, symptom distribution, working conditions, and reporting context. Differences in country-specific sample size may also have contributed to variation in the precision of the estimates. These descriptive findings provide information on the consistency of model performance across national settings and should not be interpreted as formal between-country comparisons or country rankings. Equal-country weighting, complete-case analysis, and restriction to EU27 countries produced results broadly comparable with those of the primary analysis. Excluding country or work-related stress produced a larger reduction in Stage A performance, whereas the changes in Stage B were smaller. This pattern indicates that contextual and psychosocial information was particularly relevant to the classification of symptom presence.
From an occupational-ergonomics perspective, the framework could support the analysis of routinely collected workforce-survey data at the group level. For example, an occupational health service could compare aggregated probabilities of symptom presence and regional extent across departments or occupational groups and examine the corresponding physical and psychosocial exposure profiles. Groups displaying comparatively high symptom-burden probabilities could then be prioritised for observational ergonomic assessment and worker consultation. This application would complement established occupational surveillance procedures, while individual screening or intervention allocation would require prospective and external validation.
The study benefits from a large and occupationally heterogeneous sample covering 35 European countries, the incorporation of survey weights, preservation of primary sampling units during resampling, and repeated nested cross-validation. These features strengthen internal performance evaluation but do not establish transportability beyond the EWCS population. Population-calibration weights account for unequal selection probabilities and align the sample with population distributions, although residual non-response bias may remain in relation to characteristics not captured by the weighting procedure. Because both working conditions and musculoskeletal symptoms were self-reported, the observed patterns may also be affected by recall, reporting, and common-method biases. The three symptom items represent broad anatomical region groups and do not capture symptom intensity, duration, or clinical diagnosis. Generalisability beyond the participating European countries and applicability to other surveys or workplace populations therefore require independent external validation. The cross-sectional design further restricts interpretation to concurrent classification and association rather than temporal prediction or causal effects.
The findings indicate that working-conditions variables provide moderate information for classifying the presence of musculoskeletal symptoms and more limited information for distinguishing their regional extent. Elastic Net offered a suitable balance between predictive performance and interpretability, whereas the more flexible models did not produce consistent improvements across the evaluated measures.
5. Conclusions
This study evaluated a two-stage machine-learning framework for classifying musculoskeletal symptom presence and regional extent among employees participating in the 2024 European Working Conditions Survey. The models demonstrated moderate discrimination for symptom presence in Stage A and more modest discrimination between single-region and multiregional symptoms in Stage B. Performance differences among the three modelling approaches were small. Elastic Net was selected under the prespecified parsimony criterion because it combined comparable predictive performance with a comparatively transparent coefficient-based structure. The two stages therefore provide complementary information: Stage A supports the classification of symptom presence, whereas Stage B offers additional differentiation of regional symptom burden within the symptomatic workforce.
Tiring or painful positions provided the strongest classification information across both stages. Carrying or moving heavy loads, repetitive hand or arm movements, work-related stress, age, and country also contributed to the fitted models. The consistency of the principal predictor patterns across resampling partitions and sensitivity analyses indicates that these characteristics provided reproducible information for the classification tasks examined. Given the cross-sectional design, these patterns represent concurrent model-based associations and should not be interpreted as evidence of temporal or causal relationships.
Future research should evaluate the temporal stability of the framework using longitudinal occupational data and examine its external performance across geographical settings, occupational populations, and data-collection systems. The inclusion of more detailed symptom information, such as intensity, duration, anatomical location, functional consequences, and clinically confirmed diagnoses, could further inform the classification of regional symptom burden. Prospective workplace studies could also assess whether aggregated model outputs add value to established occupational surveillance and ergonomic assessment procedures, particularly for prioritising groups that require more detailed workplace evaluation.
Supplementary Materials
The following supporting information can be downloaded at https://www.mdpi.com/article/10.3390/app16199392/s1, Table S1, Outcome definitions and candidate predictor specifications; Table S2, Preprocessing specifications, hyperparameter search spaces, and selected configurations; Table S3, Full held-out permutation importance estimates; Table S4, Elastic Net coefficient direction and stability; Table S5, Country-specific model performance; Table S6, Complete sample characteristics; Table S7, Paired primary-sampling-unit cluster-bootstrap model-performance comparisons.
Funding
This research received no external funding.
Institutional Review Board Statement
Not applicable.
Informed Consent Statement
Not applicable.
Data Availability Statement
Restrictions apply to the availability of these data. The data were obtained from the UK Data Service and are available at https://doi.org/10.5255/UKDA-SN-9511-1 under the UK Data Service End User Licence (Eurofound, European Working Conditions Survey, 2024, Study Number 9511).
Acknowledgments
The author would like to thank the Project Support Office at Bursa Technical University for their assistance with proofreading this manuscript. During the preparation of this manuscript, the author used ChatGPT (GPT-5.6 Sol, OpenAI) solely for language refinement. The author reviewed and edited the output and takes full responsibility for the content of this publication.
Conflicts of Interest
The author declares no conflicts of interest.
Abbreviations
The following abbreviations are used in this manuscript:
| AUPRC | Area under the precision–recall curve |
| AUROC | Area under the receiver operating characteristic curve |
| CI | Confidence interval |
| EU27 | European Union with 27 Member States |
| EWCS | European Working Conditions Survey |
| ROC | Receiver operating characteristic |
| UK | The United Kingdom |
| XGBoost | Extreme Gradient Boosting |
References
- Coggon, D.; Ntani, G.; Palmer, K.T.; Felli, V.E.; Harari, R.; Barrero, L.H.; Felknor, S.A.; Gimeno, D.; Cattrell, A.; Vargas-Prada, S.; et al. Patterns of multisite pain and associations with risk factors. Pain 2013, 154, 1769–1777. [Google Scholar] [CrossRef] [Scilit] [PubMed]
- de Cássia Pereira Fernandes, R.; da Silva Pataro, S.M.; de Carvalho, R.B.; Burdorf, A. The concurrence of musculoskeletal pain and associated work-related factors: A cross-sectional study. BMC Public Health 2016, 16, 628. [Google Scholar] [CrossRef] [Scilit] [PubMed]
- Haukka, E.; Ojajärvi, A.; Takala, E.P.; Viikari-Juntura, E.; Leino-Arjas, P. Physical workload, leisure-time physical activity, obesity and smoking as predictors of multisite musculoskeletal pain: A 2-year prospective study of kitchen workers. Occup. Environ. Med. 2012, 69, 485–492. [Google Scholar] [CrossRef] [Scilit] [PubMed]
- Neupane, S.; Miranda, H.; Virtanen, P.; Siukola, A.; Nygård, C.H. Do physical or psychosocial factors at work predict multi-site musculoskeletal pain? A 4-year follow-up study in an industrial population. Int. Arch. Occup. Environ. Health 2013, 86, 581–589. [Google Scholar] [CrossRef] [Scilit] [PubMed]
- Oakman, J.; de Wind, A.; van den Heuvel, S.G.; van der Beek, A.J. Work characteristics predict the development of multi-site musculoskeletal pain. Int. Arch. Occup. Environ. Health 2017, 90, 653–661. [Google Scholar] [CrossRef] [Scilit] [PubMed]
- Solidaki, E.; Chatzi, L.; Bitsios, P.; Markatzi, I.; Plana, E.; Castro, F.; Palmer, K.; Coggon, D.; Kogevinas, M. Work-related and psychological determinants of multisite musculoskeletal pain. Scand. J. Work Environ. Health 2010, 36, 54–61. [Google Scholar] [CrossRef] [Scilit] [PubMed]
- Larsen, L.B.; Ramstrand, N.; Fransson, E.I. Psychosocial job demand and control: Multi-site musculoskeletal pain in Swedish police. Scand. J. Public Health 2019, 47, 318–325. [Google Scholar] [CrossRef] [Scilit] [PubMed]
- Bezzina, A.; Austin, E.; Nguyen, H.; James, C. Workplace psychosocial factors and their association with musculoskeletal disorders: A systematic review of longitudinal studies. Workplace Health Saf. 2023, 71, 578–588. [Google Scholar] [CrossRef] [Scilit] [PubMed]
- Yang, H.; Lu, M.L.; Haldeman, S.; Swanson, N. Psychosocial risk factors for low back pain in US workers: Data from the 2002–2018 Quality of Work Life Survey. Am. J. Ind. Med. 2023, 66, 41–53. [Google Scholar] [CrossRef] [Scilit] [PubMed]
- Nappo, N. Is there an association between working conditions and health? An analysis of the Sixth European Working Conditions Survey data. PLoS ONE 2019, 14, e0211294. [Google Scholar] [CrossRef] [Scilit] [PubMed]
- Riedel, N.; Steghaus, S.; Wischniewski, S. Working conditions and state of health of employees working indoor and outdoor with varying levels of physical demand: Insights from the BIBB/BAuA employment survey 2024. BMC Public Health 2026, 26, 1859. [Google Scholar] [CrossRef] [Scilit] [PubMed]
- Neupane, S.; Leino-Arjas, P.; Nygård, C.H.; Oakman, J.; Virtanen, P. Developmental pathways of multisite musculoskeletal pain: What is the influence of physical and psychosocial working conditions? Occup. Environ. Med. 2017, 74, 468–475. [Google Scholar] [CrossRef] [Scilit] [PubMed]
- Dong, Y.; Jiang, P.; Jin, X.; Maimaiti, N.; Wang, S.; Yang, L.; Forsman, M.; He, L. Derived patterns of musculoskeletal symptoms and their relationships with ergonomic factors among electronic assembly workers: A latent class analysis. J. Saf. Res. 2022, 82, 293–300. [Google Scholar] [CrossRef] [Scilit] [PubMed]
- Keyaerts, S.; Godderis, L.; Vanden Abeele, V.; Daenen, L. Identifying pain profiles in employees including work-related factors and pain perceptions: A cross-sectional study in Belgian companies. BMJ Open 2024, 14, e082804. [Google Scholar] [CrossRef] [Scilit] [PubMed]
- Ahn, G.; Hur, S.; Jung, M.C. Bayesian network model to diagnose WMSDs with working characteristics. Int. J. Occup. Saf. Ergon. 2020, 26, 336–347. [Google Scholar] [CrossRef] [Scilit] [PubMed]
- Sasikumar, V.; Binoosh, S.C.A.B. A model for predicting the risk of musculoskeletal disorders among computer professionals. Int. J. Occup. Saf. Ergon. 2020, 26, 384–396. [Google Scholar] [CrossRef] [Scilit] [PubMed]
- Byeon, H. Predicting occupational musculoskeletal disorders in South Korean male office workers using a robust and sparse twin support vector machine. J. Mens. Health 2024, 20, 41–49. [Google Scholar] [CrossRef] [Scilit]
- Luo, N.; Xu, X.; Jiang, B.; Zhang, Z.; Huang, J.; Zhang, X.; Tan, Q.; Wang, X.; Bai, S.; Liu, S.; et al. Explainable machine learning framework to predict the risk of work-related neck and shoulder musculoskeletal disorders among healthcare professionals. Front. Public Health 2024, 12, 1414209. [Google Scholar] [CrossRef] [Scilit] [PubMed]
- Li, J.; Zhang, X.; Li, Y.; Ding, W.; Duan, W.; Lim, D.; Liang, Y.; Feng, Z. Determinants of work-related musculoskeletal disorders among coal miners in Jining, China: Development of a predictive risk model. Front. Public Health 2026, 14, 1729879. [Google Scholar] [CrossRef] [Scilit] [PubMed]
- da Silva, J.M.N.; Santos, A.O.; Tavares, J.F.G.; Vieira, E.M.A.; Leite, W.K.S.; Bispo, L.G.M.; Martins, V.W.B. Prediction of musculoskeletal discomfort through integration of item response theory and machine learning. Int. J. Ind. Ergon. 2026, 112, 103899. [Google Scholar] [CrossRef] [Scilit]
- Chan, V.C.H.; Ross, G.B.; Clouthier, A.L.; Fischer, S.L.; Graham, R.B. The role of machine learning in the primary prevention of work-related musculoskeletal disorders: A scoping review. Appl. Ergon. 2022, 98, 103574. [Google Scholar] [CrossRef] [Scilit] [PubMed]
- Mohd Sallehhudin, M.I.; Yasin, S.M.; Isa, M.R.; Razak, T.R.; Mohamad Asraff, M.S.; Che Rameli, N.A.; Shahriman-Teruna, M.M.; Mohamad Salleh, M.M.; Mohamed Yusoff, M.Z.; Ammar Khebir, M.H. Factors associated with work-related musculoskeletal disorders using machine learning approaches: A systematic review. Ann. Occup. Environ. Med. 2026, 38, e10. [Google Scholar] [CrossRef] [Scilit] [PubMed]
- Eurofound. European Working Conditions Survey, 2024 [Data Collection]; UK Data Service: Colchester, UK, 2026; SN: 9511. [Google Scholar] [CrossRef]
- Kimova, T.; Burnett, J. European Working Conditions Survey 2024: Sampling Report; Eurofound: Dublin, Ireland, 2026; p. 187, Reference No. WPEF25014. Available online: https://eurofound.link/wpef25014 (accessed on 18 September 2026).
- Zou, H.; Hastie, T. Regularization and variable selection via the elastic net. J. R. Stat. Soc. Ser. B Stat. Methodol. 2005, 67, 301–320. [Google Scholar] [CrossRef] [Scilit]
- Eilers, P.H.C.; Marx, B.D. Flexible smoothing with B-splines and penalties. Stat. Sci. 1996, 11, 89–121. [Google Scholar] [CrossRef] [Scilit]
- Chen, T.; Guestrin, C. XGBoost: A scalable tree boosting system. In Proceedings of the 22nd ACM SIGKDD International Conference on Knowledge Discovery and Data Mining, San Francisco, CA, USA, 13–17 August 2016; pp. 785–794. [Google Scholar] [CrossRef] [Scilit]
- Steyerberg, E.W.; Vickers, A.J.; Cook, N.R.; Gerds, T.; Gonen, M.; Obuchowski, N.; Pencina, M.J.; Kattan, M.W. Assessing the performance of prediction models: A framework for traditional and novel measures. Epidemiology 2010, 21, 128–138. [Google Scholar] [CrossRef] [Scilit] [PubMed]
- Van Calster, B.; McLernon, D.J.; van Smeden, M.; Wynants, L.; Steyerberg, E.W. Calibration: The Achilles heel of predictive analytics. BMC Med. 2019, 17, 230. [Google Scholar] [CrossRef] [Scilit] [PubMed]
- Breiman, L. Random forests. Mach. Learn. 2001, 45, 5–32. [Google Scholar] [CrossRef] [Scilit]

Disclaimer/Publisher’s Note: The statements, opinions and data contained in all publications are solely those of the individual author(s) and contributor(s) and not of MDPI and/or the editor(s). MDPI and/or the editor(s) disclaim responsibility for any injury to people or property resulting from any ideas, methods, instructions or products referred to in the content. |
© 2026 by the author. Licensee MDPI, Basel, Switzerland. This article is an open access article distributed under the terms and conditions of the Creative Commons Attribution (CC BY) license.