


Abstract
Dataset selection is one of the most consequential methodological decisions in cybersecurity intrusion detection research. However, it is routinely made based on citation frequency, historical convention, and availability rather than principled evaluation. This allows benchmarks with well-documented limitations to persist, obscuring whether reported performance gains reflect genuine advances or artefacts of data construction. This study addresses that gap by introducing a deterministic, property-based scoring framework. The framework is grounded in a Preferred Reporting Items for Systematic Reviews and Meta-Analyses (PRISMA)-guided systematic literature review of 112 peer-reviewed studies published between 1998 and 2024, identified through scholarly database searches conducted through June 2026. It synthesises recurring dataset characteristics into Essential and General property sets and operationalises them into six auditable evaluation categories. Applied to 27 representative datasets, the framework exposes systematic trade-offs that aggregate rankings can miss. It reveals high provenance fidelity and broad attack coverage are structurally compensatory. It also shows that legacy benchmarks occupy a different suitability tier than their citation dominance implies, and that evaluation readiness, not documentation, has the most room for improvement across the current corpus. The result is a reproducible, model-agnostic infrastructure that converts dataset selection from an implicit habit into an explicit, evidence-driven methodological decision. This establishes dataset evaluation as a step deserving the same rigor as algorithm design and experimental protocol specification.
1. Introduction
Cybersecurity intrusion detection research depends critically on threat datasets for empirical validity. However, dataset selection practices often lack the methodological rigour applied to the studies themselves. Most selections are informed by citation counts, tradition, or convenience rather than by transparent, auditable evaluation criteria. This informal culture perpetuates benchmarks with well-known flaws, outdated traffic, inconsistent labelling, and limited attack coverage, which directly threaten experimental validity. As machine learning becomes central to intrusion detection, the risk intensifies [1]: without robust selection, it becomes impossible to determine genuine methodological progress from results shaped by poor data [2].
The fundamental challenge is the absence of a reproducible, agreed standard for evaluating and comparing intrusion detection datasets. Substantial variation in attack coverage, provenance, feature representation, and documentation [3] directly shapes dataset quality yet is treated as a procedural rather than a methodological issue. Consequently, experimental findings become hard to interpret, cross-study comparisons are unreliable, and flawed datasets are repeatedly cited without justification [4]. The stakes are clear: without rigorous standards, the scientific basis of the field is undermined [5].
Existing evaluation approaches have not enforced rigorous standards. Narrative descriptions flag issues but yield only qualitative judgments. Single-factor metrics capture fragments of dataset quality and miss broader readiness. Structured frameworks outline ideal properties but do not provide measurable, reproducible scoring. The result is inconsistency in justifying dataset choices, understanding trade-offs, and enabling independent verification. This persistent gap demands a principled, rule-based solution usable across the diverse landscape of intrusion detection benchmark datasets.
This study addresses the gap through three steps. First, it synthesises recurring dataset properties from a PRISMA-guided review of 112 studies (1998–2024) [6], identifying which are evaluation prerequisites and which aid usability. Second, it operationalises these into a structured schema and a deterministic six-category scoring framework, with each score based on verifiable evidence. Third, it applies the framework to 27 representative benchmark datasets across network traffic, flow, packet capture, host log, and IoT modalities to reveal strengths, gaps, and trade-offs beyond aggregate rankings. The model evaluates documented property coverage and readiness, not detection performance or realism, advocating for methodological rigour in dataset evaluation.
This study makes five principal contributions to the evaluation of intrusion detection benchmark datasets. Synthesising 112 peer-reviewed studies from 1998 to 2024, it applies a PRISMA-guided approach (Preferred Reporting Items for Systematic Reviews and Meta-Analyses) to construct a literature-grounded taxonomy along with a systematic classification scheme. Essential properties set the minimum requirements for a valid evaluation; general properties, while not strictly necessary, enhance usability and reproducibility. The taxonomy captures all properties in a structured CSV (Comma-Separated Values) descriptor schema, a common, table-like format. This taxonomy provides the evidentiary foundation on which the framework’s primary methodological contribution, a deterministic, evidence-graded, multi-category scoring and ranking mechanism, is built. Throughout, controlled vocabulary (predefined, standardised terms) and clear evidence requirements ensure consistency. All coding decisions are based on documented sources, ensuring verifiability rather than subjective interpretation. The study then operationalises these properties into a deterministic, rule-based, six-category scoring model. Specifically, the model’s categories, Attack Coverage (range of simulated attack types), Provenance Source (collection origins), Feature Diversity (variety of recorded information), Documentation and Metadata (completeness of descriptions), Evaluation Readiness (preparation for use), and Availability (researcher accessibility) cover core dataset characteristics. Applying fixed arithmetic rules eliminates subjective influence and guarantees identical results for identical inputs. On 27 representative datasets, the model outputs category-level profiles, composite rankings, colour-coded heatmaps (matrix visualisations), and profile plots. In contrast to single-score summaries, these visual outputs make structural trade-offs visible. Artefacts, descriptor templates, scoring notebooks, and versioned dataset records are publicly released, ensuring reproducibility. This open approach enables any researcher to verify or extend the evaluation independently, without contacting the authors.
The rest of this paper is organised as follows. Section 2 surveys previous evaluation approaches and identifies a methodological gap. Section 3 details the PRISMA-guided review. Section 4 presents the literature-derived taxonomy of dataset properties. Section 5 defines the deterministic scoring framework. Section 6 reports evaluation results across 27 datasets. Section 7 compares the proposed framework with existing methods. Section 8 discusses findings, implications, and limitations. Finally, the paper is concluded in Section 9.
2. Background: Dataset Evaluation in Cybersecurity Research
2.1. Cybersecurity Threat Dataset Landscape
Cybersecurity datasets span multiple domains. These include malware analysis, phishing detection, and cyber threat intelligence. This study, however, focuses on intrusion detection benchmark datasets. Specifically, it examines network traffic, flow-based, packet-capture, host-log, and IoT datasets used for IDS evaluation. These benchmark datasets are chosen because they represent the domain where dataset quality and selection methodology have the greatest impact on research. Intrusion detection benchmark datasets vary along three primary dimensions that determine their benchmarking utility [7]. First, data modality defines the form in which observational evidence is represented. Packet capture (PCAP) records preserve all packet-level payload and header information. Flow-based representations, such as NetFlow or IPFIX, instead aggregate communications into summarised session-level metadata. Host and system-level log sources record endpoint events, including process execution, authentication transactions, and operating system activity. Each modality restricts the feature space available and shapes the classes of detection methods that can be evaluated. Second, provenance concerns the origin of the data. Sources include operational environments, controlled testbeds, and synthetically generated scenarios. Each has distinct trade-offs between ecological validity [8], label precision, and ethical feasibility. Third, attack coverage refers to the breadth and diversity of malicious behaviours represented. This determines how comprehensively a dataset reflects contemporary threat conditions.
These dimensions interact in ways that resist reduction to a single quality criterion. A dataset may offer operationally realistic traffic yet cover a narrow attack subset; another may provide rich multi-class labels under controlled emulation but lack representativeness of real network behaviour. Sommer and Paxson [2] identified as early as 2010 that the persistent gap between anomaly detection research and operational deployment stems partly from dataset-driven evaluation conditions that do not reflect deployment realities, including the difficulty of obtaining attack-free training data, undefined threat models, and unrealistic false-positive tolerances. Their critique, whilst influential, established requirements without providing a replicable procedure to evaluate whether specific datasets meet them. This gap remains unresolved in the subsequent literature.
2.2. Dataset Evaluation Approaches
Efforts to evaluate intrusion detection benchmark datasets have gone through four methodological generations, each advancing the field but leaving gaps that subsequent generations address. The first generation provided qualitative critiques exposing flaws in entrenched benchmarks. The second introduced structured criteria frameworks that formalised dataset requirements. The third brought quantitative metrics to measure specific dimensions. The fourth expanded to general dataset-quality models, evaluating factors beyond cybersecurity-specific concerns.
Despite this progression, a fundamental gap remains across all four generations. Each approach either identifies which datasets should be used without verifying that they are, captures only one dimension and ignores others, or applies criteria that are too broad for intrusion detection benchmarking. No existing approach can measure partial compliance, compare datasets across multiple dimensions simultaneously, or generate reproducible rankings based solely on documentary evidence. Table 1 summarises the principal approaches across this trajectory, their scope, key limitations, and the specific gap each leaf for the proposed framework to address.
Table 1.
Comparison of Existing Cybersecurity Dataset Evaluation.
The first generation, represented by McHugh’s DARPA critique [9] and the critical analysis of IDS and IPS dataset challenges [10], established that entrenched benchmarks carry structural limitations, methodological bias, weak validation, and insufficient transparency, which directly undermine evaluation validity. These contributions were necessary and influential, discrediting benchmarks that had accumulated authority through citation repetition rather than demonstrated suitability. However, their findings were dataset-specific and non-transferable. Exposing the flaws of KDD’99 or DARPA 1998 provided no general mechanism for evaluating the datasets that followed, and no criteria that independent researchers could apply without repeating the full critical analysis from scratch.
The second generation shifted from critique to criteria. The survey of 34 network-based IDS datasets [3], the evaluation framework for IDS benchmarks [13], and the review of advancements in IDS datasets and ML methods [15] formalised expectations such as metadata completeness, attack diversity, traffic realism, and documentation practices. This was meaningful progress, giving the field a shared vocabulary for describing expectations. However, these frameworks remained qualitative in a critical respect. They defined desirable properties, but did not specify how to measure compliance, address partial compliance, or produce ranked comparisons when datasets met different subsets of criteria. The outcome was a more principled descriptive language, but no operational scoring mechanism to support reproducible cross-dataset comparisons. The third generation introduced quantitative measurement but narrowed its scope sharply in doing so. The ID2T toolkit [8] enabled reproducible synthetic attack injection to improve dataset realism, but its outputs depend on user configuration and cannot fully represent state-changing attack behaviours. The fuzzy Sugeno realism metric [4] quantifies behavioural fidelity through a continuous score, and the R-value overlap metric [11] measures class separability as a proxy for classification difficulty. Both capture genuine dimensions but operate in isolation; realism scoring excludes label validity and evaluation structure, whilst the R-value ignores provenance, documentation, and attack range. The InSDN evaluation [14] further illustrates the limitation of this generation: single-dataset assessments demonstrate that individual dimensions can be measured rigorously but cannot be generalised into reusable frameworks applicable across a heterogeneous benchmark corpus.
The fourth generation expanded the scope beyond cybersecurity-specific concerns. It introduced new limitations. The general machine learning dataset quality framework [12] proposes eight dimensions and 32 metrics. It is the most comprehensive multidimensional approach in prior literature. The dataset retrieval and findability framework [5] addresses whether datasets can be located and matched to research needs using similarity modelling and human evaluation. Both are methodologically sophisticated but intentionally domain-agnostic. However, they omit properties central to the validity of IDS benchmarking. There is no coverage of attack taxonomy, provenance distinctions between operational traffic and emulated traffic, nor evaluation readiness criteria specific to intrusion detection. These four generations share a structural limitation that no single approach resolves: they identify what datasets should provide but supply no mechanism for measuring partial compliance, comparing datasets across multiple dimensions simultaneously, or producing reproducible rankings from demonstrable documentary evidence alone. The proposed framework is specifically designed to address this tripartite gap. Its property taxonomy is derived from a PRISMA-guided synthesis of 112 studies rather than expert selection, ensuring every scored dimension reflects empirical consensus. Every scoring decision requires explicit documentary evidence, eliminating interpretive inference. Deterministic arithmetic rules ensure identical inputs always produce identical outputs with no subjective components. Multi-level outputs, category scores, composite scores, heatmaps, and profile plots, then expose the trade-offs that single-score summaries from prior quantitative approaches inevitably conceal. The relationship between the proposed framework and prior approaches is therefore one of complementarity rather than replacement: each prior method remains appropriate for its intended purpose, whilst the proposed framework fills the role of reproducible cross-dataset comparison that none currently occupies.
2.3. Research Gap
From this review, two persistent gaps emerge. First, there is no consensus on a compact, reproducible property set to enable systematic comparison across modalities and collection settings. Existing criteria are either too broad, leaving scoring subjective, or too narrow, capturing single dimensions without addressing the broader configuration that determines evaluation readiness. Second, no existing approach combines literature-grounded property synthesis with deterministic, evidence-based scoring. As a result, dataset selection remains driven by citation frequency, historical convention, or availability [16], rather than by documented alignment between dataset properties and research objectives. This affects reproducibility: studies using the same dataset name may rely on different preprocessing, splits, or label interpretation. Datasets with known limitations continue to be used without explicit acknowledgement. This paper addresses both gaps through a PRISMA-guided SLR and a deterministic six-category scoring framework based exclusively on verifiable documentary evidence.
3. Methodology: PRISMA-Guided Systematic Literature Review
3.1. Search Strategy and Scope
A systematic literature review (SLR) [17] was conducted following PRISMA 2020 guidelines to synthesise evidence on the properties, documentation, and evaluability of intrusion detection benchmark datasets. The review objective was not to survey detection methods but to identify, across the research literature, which dataset properties recur as benchmarking requirements. PRISMA’s value in this context is transparent, auditable, and reproducible search-and-screening reporting, which is methodology-agnostic, rather than a claim that PRISMA was designed specifically for attribute synthesis. Relevant studies were identified through structured searches of five scholarly databases: IEEE Xplore, Scopus, SpringerLink, ACM Digital Library, and Web of Science. Search strings combined dataset terminology (“threat dataset”, “cybersecurity dataset”, “network security dataset”) with threat-detection contexts (“intrusion detection systems”, “IDS”) and evaluation framing (“dataset evaluation”, “benchmarking”, “quality”). Strings were adapted to scholarly database-specific syntax; full search strings are provided in Supplementary Material S1. Google Scholar supported forward and backward citation verification but did not yield additional eligible records [6].
The review scope covered 1998 to June 2026. The 1998 start date is methodologically grounded: the DARPA 1998–1999 evaluations [18] and McHugh’s [9] subsequent critique established the foundational attack taxonomy and dataset construction conventions that have structured IDS research ever since, and any framework evaluating datasets in that lineage must account for those origins. Although the search window extended through June 2026, all 112 studies meeting the inclusion criteria were published between 1998 and 2024; no study published in 2025 or 2026 met the substantive relevance criteria for the threat-dataset Essential or General properties underlying this framework (Section 3.3, Supplementary Figure S2).
3.2. Inclusion, Exclusion, and Screening
Studies were eligible if they: (i) described, compared, evaluated, or synthesised intrusion detection benchmark datasets, or defined dataset quality properties relevant to benchmarking; (ii) provided primary, auditable dataset descriptions where peer-reviewed documentation was absent; and (iii) were available in full text in English within the defined timeframe. Studies were excluded if they were algorithm-focused papers that used datasets solely as testbeds without examining dataset properties, were wrong-domain publications, or contained non-substantive items such as abstracts and editorials. Analysis of a 10% stratified validation sample (n = 539) indicated that approximately 68% of exclusions were algorithm-centric, aligning with exclusion rates commonly observed in similar systematic literature reviews.
Retrieved records were deduplicated before screening. Selection proceeded through title/abstract screening followed by full-text assessment, with ambiguous records retained to minimise under-inclusion. As shown in Figure 1, scholarly database searches identified 5462 records; after removing 75 duplicates, 5387 were screened, of which 5247 (97.4%) were excluded. This high exclusion rate reflects the structure of the cybersecurity literature, where dataset-related searches predominantly return method-development papers, as confirmed by a stratified 10% validation sample (n = 539), in which approximately 68% of exclusions were algorithm-centric studies that used datasets without property evaluation. Of the 140 full texts assessed, 28 were excluded for irrelevance, unsuitable study design, or absence of extractable dataset properties, yielding a final synthesis corpus of 112 studies. An additional search covering January 2025 to June 2026 across the same five scholarly databases identified 59 records (Web of Science: 4; IEEE Xplore: 1; Scopus: 8; SpringerLink: 3; ACM Digital Library: 43), already incorporated into the totals above; all 59 were excluded at title/abstract screening for lack of relevance to the threat-dataset Essential or General properties, and none proceeded to full-text assessment. The detailed screening flow specific to these 59 records is provided in Supplementary Figure S1, and their temporal distribution is shown in Supplementary Figure S2. The upward trend in Figure 2 confirms that dataset evaluation has emerged as an independent methodological concern, validating the need for the present synthesis.
Figure 1.
PRISMA-guided systematic literature review workflow.
Figure 2.
Distribution of 112 Included Studies by Publication Year (1998–2024).
To validate full-text screening consistency, a second cybersecurity researcher independently screened a stratified random sample of 20% (n ≈ 28) using the same predefined criteria, without access to the primary reviewer’s decisions. Disagreements were resolved through discussion with reference to the original full texts, and final decisions were logged to maintain auditability. This screening validation was distinct from the subsequent validation of property coding. Whereas the 20% full-text re-screening assessed agreement on inclusion and exclusion decisions, a separate 27-study inter-rater assessment evaluated consistency in the assignment of dataset properties, yielding a Cohen’s κ of 0.857.
3.3. Data Extraction, Coding Schema, and Inter-Rater Reliability
Data were extracted using a structured template capturing dataset modality (PCAP, flow-based, host/log), provenance source (real-world, emulated, synthetic), benign traffic presence, attack-vector coverage against the five-category taxonomy (C1–C5), feature-type support (basic, traffic-based, content-based), documentation and metadata indicators, evaluation readiness indicators, and availability status. Evidence was synthesised through thematic coding to derive a consolidated property set, with properties classified as Essential or General based on prevalence (≥60% of studies) and criticality framing (≥50% of mentions), fully detailed in Section 4.
The conservative coding principle applied throughout: a property is confirmed as present only when explicitly supported by documentary evidence from dataset papers, README files, or official documentation. Where evidence was incomplete or absent, properties were left unconfirmed to prevent score inflation. This unconfirmed state may reflect either an explicit statement of absence or the simple absence of discussion in the source material; both are treated identically under the coding rule, a distinction discussed further in Section 5 and Section 8.4. Grey literature sources, GitHub (v1.0) repositories, institutional technical reports, and dataset documentation pages were incorporated as primary evidence for property coding where peer-reviewed descriptions were absent, consistent with the practical reality that critical attributes such as labelling procedures and feature schemas are frequently documented exclusively outside journal publications.
Coding reliability was validated by a second independent cybersecurity researcher who applied the same coding rules to a representative subset of 27 studies. Cohen’s kappa was calculated across all 15 property fields: yielding a macro-average κ = 0.857, indicating almost perfect agreement under the Landis and Koch [19] benchmark, with no individual property falling below the substantial agreement threshold (κ ≥ 0.61). For context, published systematic reviews in cybersecurity and adjacent information systems fields typically report inter-rater agreement in the range κ = 0.70–0.80 [19]; the present result of κ = 0.857 therefore represents unusually high agreement, reflecting the framework’s design principle of restricting coding decisions to explicit documentary evidence rather than interpretive inference. Per-property kappa values are reported in Supplementary Material S2.
4. Literature-Derived Dataset Property Taxonomy
4.1. Taxonomy Derivation
The SLR corpus of 112 studies confirms that intrusion detection benchmark datasets exhibit high heterogeneity across collection contexts, evidential sources, and research use cases. Importantly, the synthesis distinguishes between two key property types: those that are prerequisites for valid evaluation, and those that enhance evaluation quality. This specific distinction motivates the scoring framework proposed in Section 5. Scoring categories are not arbitrary; each corresponds to a property group whose evidential importance is established by how frequently and urgently the research community cites its absence as a problem.
Synthesised properties are organised into two complementary sets: Essential and General. Essential properties are those whose absence would materially compromise the ability to conduct a defensible benchmark evaluation or cross-dataset comparability. General properties, by contrast, primarily improve usability, reproducibility, or contextualisation but are not absolute prerequisites for baseline evaluation. Classification used a three-part decision rule: (i) prevalence—defined as explicit mention in ≥60% of the 112 included studies; (ii) criticality framing—where authors described absence as a limitation or validity threat in ≥50% of mentions; and (iii) functional role—distinguishing evaluation-enabling or comparability-critical properties from context-enhancing ones. Properties meeting all three criteria were classified as Essential: all others as General. The 60% prevalence and 50% criticality thresholds were operationally defined for this study rather than adopted from an established external standard. The 60% prevalence threshold requires that an Essential property be explicitly mentioned by a clear majority of the reviewed corpus, ensuring that classification reflects broad-based recognition rather than a simple plurality. The 50% criticality threshold requires that, among studies mentioning a property, at least half explicitly frame its absence as a limitation or validity threat, distinguishing properties whose omission is merely noted from those whose omission is treated as consequential. Both thresholds are applied jointly with the functional-role criterion, so that a property cannot be classified Essential based on prevalence or criticality alone. To assess whether this classification is sensitive to the specific threshold values chosen, we conducted a threshold sensitivity analysis, recomputing the Essential/General classification of all 11 identified properties under four additional prevalence/criticality threshold pairs, symmetric around the original values in increments of five percentage points: 50%/40%, 55%/45%, 65%/55%, and 70%/60%, alongside the original 60%/50% pair. The functional-role criterion was held fixed at the values reported in Table S3b for all threshold pairs, consistent with the three-part decision rule. Of the 11 properties, 9 (81.8%) retained their classification across all five threshold pairs. Two properties—Benign/Background Traffic (69.6% prevalence) and Provenance (67.9% prevalence)—changed from Essential to General only under the most stringent pair tested (70%/60%), as their prevalence fell below the 70% threshold while remaining above the four more lenient thresholds. No property classified General under the original thresholds became Essential under any tested alternative; the six properties assigned a context-enhancing functional role remain General under every threshold pair tested, because the functional-role criterion excludes them from Essential classification independently of the prevalence and criticality values. Restricting attention to the five properties whose functional role qualifies them for potential Essential classification, three (60%) retained Essential status across all five threshold pairs, and two (40%) were reclassified only under the strictest pair tested. These results indicate that the Essential/General classification is relatively stable under reasonable local variation in both thresholds; they do not establish that 60%/50% is the only defensible threshold pair, and the thresholds should be understood as operational choices rather than universally prescribed values. Full classification results for all threshold pairs are reported in Supplementary Material S3, Table S3d. Full decision rules, prevalence statistics, and validation evidence are provided in Supplementary Material S3.
This classification is not a theoretical convenience; it reflects empirical consensus across 26 years of research on the IDS dataset. It answers a fundamental question that the literature has left implicit: which dataset characteristics must a researcher verify before committing to a benchmark, and which characteristics improve evaluation without serving as gatekeeping conditions. The scoring framework in Section 5 inherits this structure directly: Essential properties map to the categories with the highest discriminative impact on benchmarking validity, whilst General properties map to categories that differentiate datasets by usability and reproducibility.
4.2. Classification Rationale
Essential properties are the minimum requirements for a valid and comparable evaluation. Three property groups meet all classification criteria: Data Collection (the system layer observed and method of acquisition), Dataset Feature Type (the kinds of variables), and Data Labels (the annotation of each record to a security state). The absence of any makes benchmarking infeasible; for example, the lack of ground-truth labels precludes supervised detection evaluation. Documentation alone is not a substitute for defined features or labels. The structure of these three essentials is visualised in Figure 3.
Figure 3.
Essential Dataset Properties: Minimum Conditions for Valid Benchmarking Evaluation.
4.2.1. Data Collection
Data Collection specifies the system layer or viewpoint from which events are observed, as well as the means of capturing data. This property is essential: modality (e.g., packet-level, flow-level) defines the features available for analysis. Without knowing modality, researchers cannot select features, model type, or detection paradigm. The literature identifies three main collection approaches, summarised in Table 2.
Table 2.
Data collection methods and key trade-offs.
Each layer provides different threat visibility whilst constraining the feature space in predictable ways. In this context, the framework treats modality as a compatibility filter rather than a quality indicator; it determines method–dataset alignment rather than evaluation superiority. For this reason, Data Collection is retained as a mandatory descriptor field but excluded from composite scoring in Section 5: it must be known before scoring begins, not scored itself.
4.2.2. Dataset Feature Type
Dataset Feature Type refers to the specific types of data fields present (e.g., headers, payloads, statistical features). This property is essential because modelling approaches depend on available features. For instance, without payload fields, payload-based detection is impossible. The SLR finds that feature type is cited as a validity threat in 85% of mentions, discovering a feature-type mismatch post hoc that undercuts validity. Table 3 summarises the main feature families and their coding.
Table 3.
Feature Families, Captured Evidence, and Classification Criteria.
Datasets may support multiple families. The framework records each independently to enable method dataset alignment in experimental design. The Content-based absent-by-constraint coding preserves accuracy without penalising datasets for architectural encryption. It records a structural reality rather than a documentation deficiency (an instance of the Explicitly Absent evidence state formalised in Section 5).
4.2.3. Ground Truth Labels and Attack Coverage Taxonomy
Data labels are Essential because they define ground truth—the link between observations and specific security states. The SLR identifies labelling as the most frequently cited validity-threat property: 90.8% of the 112 studies that mention labels describe their absence or ambiguity as a direct threat to evaluation validity. Without ground truth, supervised evaluation is impossible and unsupervised evaluation lacks a verification basis.
Two requirements govern label-based evaluation validity. First, explicit identification of benign traffic is required for both supervised baselines and anomaly-detection settings. Without clearly defined benign samples, models cannot establish reliable decision boundaries. Second, attack coverage must be broad enough and consistently classified to support meaningful, comparable threat evaluation across datasets. Together, these requirements shape the evaluation standards throughout this framework. The second requirement exposes a critical weakness in prior evaluation practice: the legacy four-class taxonomy (DoS/DDoS, Probe, U2R, R2L), introduced by the DARPA 1998–1999 evaluations, introduces systematic evaluation bias when applied to post-2010 datasets [9] whose labelling practices no longer correspond to those categories. For example, in modern datasets, U2R and R2L have been substantially subdivided, and entire functional attack stages, particularly persistence mechanisms and command-and-control communication, are not represented in the legacy taxonomy. Consequently, a scoring framework based on the legacy taxonomy undervalues modern datasets covering these stages while overvaluing narrow legacy datasets by rewarding coverage of outdated categories that no longer reflect the threat landscape.
To resolve this, the framework derives a revised five-category functional attack taxonomy directly from the SLR, grounded in how attack behaviours are classified across the 112 included studies. The taxonomy operates at the functional level, independent of specific tools, protocols, or exploit implementations, ensuring consistent binary coding and comparability across datasets collected at different times. Table 4 defines each category with its functional scope and explicit legacy mapping.
Table 4.
Revised Five-Category Attack Taxonomy: Functional Scope and Legacy Class Mapping.
The inclusion of C4 Persistence and Control as a distinct category is a direct empirical finding from the SLR: 61 of the 112 studies identified the absence of persistence and C2 behaviors representation as a limitation in existing evaluation practice [26], yet no equivalent category existed in the legacy taxonomy. C4 captures persistence at a behavioral level rather than enumerating specific APT phases or ransomware subtypes, which are excluded for consistency and comparability across studies. This category is not added speculatively; its inclusion directly reflects a limitation the literature has consistently identified in existing evaluation practice.
Highly specific or inconsistently documented labels, including ransomware subtypes, APT stages, and ICS-specific attacks, are excluded from the baseline taxonomy to preserve coding reliability under conservative evidence rules. Their exclusion reflects inconsistencies in the documentation across the corpus, not a judgment about their importance. The taxonomy supports domain-specific extension through an optional sub-tag mechanism rather than through new top-level categories: a domain-specific descriptor (e.g., ransomware, ics, iot) may be attached beneath the relevant C1–C5 category when the dataset’s own documentation explicitly identifies that domain context. This single-source evidentiary bar is deliberately lower-friction than the corpus-wide prevalence thresholds used for Essential/General classification (Section 4.1), since a sub-tag is an optional descriptive annotation rather than a candidate for promotion to a required evaluation property. Because sub-tags sit beneath, rather than besides, the five stable functional categories, Attack Coverage scoring and cross-dataset comparability are unaffected by their introduction or absence. An illustrative example of this sub-tag structure is provided in Supplementary Table S8.
This taxonomy directly motivates Attack Coverage as a key discriminative category in the scoring framework, with the leave-one-category-out sensitivity analysis indicating that its exclusion produces the largest disruption to dataset rankings. The framework assesses the existence and documentation of ground-truth labels, but does not empirically assess label accuracy, noise, or consistency. This distinction is a deliberate scope boundary consistent with the framework’s documentary-evidence-only design: the scoring evaluates whether relevant label information is explicitly documented and auditable, rather than determining the correctness of individual labels through direct inspection or re-labelling of the underlying data.
4.3. General Properties
General properties capture context, usability, and completeness of reporting across three organisational branches: Common Information, Data Volume, and Evaluation-Related Properties. Unlike Essential properties, a dataset missing General properties can still be evaluated, but with reduced transparency, comparability, or practical usability. For example, a dataset without a specified release year can still be used for benchmarking, but a researcher cannot assess whether its traffic patterns reflect current protocols [8]; a dataset without predefined splits can still be evaluated, but reproducibility requires each research team to document their own partition decisions [27]. These distinctions matter for the scoring framework: General properties map to scoring categories where partial satisfaction is meaningful and where graded scoring reveals real differences in documentation quality rather than binary eligibility.
Eight properties across three branches were identified through the SLR as consistently influencing practical adoption and experimental interpretability, and Figure 4 visualises the structure.
Figure 4.
General Dataset Properties: Contextual and Usability Characteristics.
Two of these properties warrant brief additional justification because their general classification may appear counterintuitive. Predefined Split has a high criticality rate (94.2% of mentions framing its absence as a problem) but is classified as General because researchers can construct valid splits independently; its absence creates additional work but does not prevent evaluation. Availability, by contrast, maps directly to the scoring framework’s Availability category and functions as a near-binary discriminator: datasets that are publicly accessible support full independent replication, whilst restricted datasets introduce institutional barriers that impede reproducibility regardless of their other properties.
Together, the Essential and General property sets provide the complete evidential foundation for the scoring framework in Section 5. Essential properties determine which scoring categories function as gatekeeping conditions; General properties determine which categories produce graded discrimination. The six scoring categories, Attack Coverage, Provenance Source, Feature Diversity, Documentation and Metadata, Evaluation Readiness, and Availability, are not independently derived constructs. Each is a direct operationalisation of one or more properties in this taxonomy, grounded in the literature-based evidence summarised in Table 2, Table 3, Table 4 and Table 5.
Table 5.
Five-Tier Provenance Classification: Realism Levels, Characteristics, and Scores.
5. Deterministic Scoring Framework
The framework operationalises the Essential and General properties derived in Section 4 into a structured, auditable scoring model. Three design principles govern its construction: (i) auditability: every score is traceable to documented dataset artefacts; (ii) comparability: consistent assessment is possible across heterogeneous datasets regardless of modality or collection setting; and (iii) model-agnosticism: no assumptions are tied to specific detection algorithms or analytical paradigms. The framework evaluates documentation completeness and evaluation readiness as evidenced by associated publications; it does not claim to measure intrinsic dataset quality, real-world representativeness, or empirical superiority in detection performance. Each dataset is represented as a single descriptor row, with properties encoded as Boolean or low-cardinality categorical indicators, set to 1 only when explicitly supported by documentary evidence. Attributes for which no such evidence is available receive no positive credit under this rule; this reflects the boundary of publicly available evidence rather than a claim that the underlying attribute is absent from the dataset. The framework distinguishes conceptually between a property that is explicitly documented as absent and one that is simply not reported, though both currently receive identical treatment under the deterministic scoring rule (see Section 8.4).
Two property groups, Data Collection modality and Data Volume, are retained as mandatory descriptor fields but deliberately excluded from composite scoring. Neither admits a universally superior value: packet capture maximises feature richness at high storage cost; flow-based formats scale efficiently but lose payload visibility; larger datasets are not inherently better if labelling is poor. Both serve as compatibility filters that researchers apply before scoring, not as quality indicators during scoring. Conflating compatibility filtering with documentation-quality assessment would produce scores that reflect the researcher’s context rather than the dataset’s documented properties.
Figure 5 illustrates the complete framework pipeline. The systematic literature review produces a literature-derived property taxonomy, partitioned into Essential and General properties, and mapped to six scoring categories. Each category is scored deterministically from documentary evidence, producing both category-level profiles and a composite suitability score that supports ranked comparison across datasets. This end-to-end pipeline is fully reproducible: every step from property coding to final ranking is governed by fixed arithmetic rules with no subjective components.
Figure 5.
Three-phase research pipeline for dataset evaluation and ranking.
5.1. Categorical Scoring Model
The framework evaluates datasets based on documented evidence of structural completeness and evaluation readiness, rather than intrinsic performance or real-world representativeness. Each dataset is encoded as a descriptor vector in which properties are represented as Boolean or categorical variables, with a value of 1 assigned only when explicitly supported by documentary evidence; attributes without such evidence receive no positive credit, consistent with the evidence-boundary principle defined above. Two properties, data collection modality and data volume, are retained as descriptive filters but excluded from scoring due to the absence of a universal ordering of quality. These properties are therefore used only for pre-filtering compatibility rather than contributing to the composite score. Let denote the set of evaluated datasets, where . All scoring functions operate on a normalised interval:
All category scores defined in (4) through (11) are bounded by the interval established in (1). The indicator function is defined as:
The indicator in (2) is applied exclusively to documentary evidence; a property returns 1 only when confirmed by a dataset paper, README, or official documentation. This ensures that only verifiable evidence contributes to scoring, consistent with a conservative coding principle. The framework consists of evaluation categories:
The value K from (3) appears as the denominator of the equal-weight composite score in (15) and as the dimension of the score vector in (12). The framework defines six complementary scoring dimensions, each capturing a distinct dataset property. All scores are normalised to to ensure comparability.
- (a)
- Attack Coverage
Attack Coverage assesses the breadth of threat types represented in a dataset against the five-category functional taxonomy defined in Section 4.2.3. Attack Coverage measures the extent to which a dataset represents the defined multi-stage threat taxonomy.
where denotes the full attack taxonomy where C1 = Reconnaissance, C2 = Initial Compromise, C3 = Privilege Misuse, C4 = Persistence and Control, and C5 = Attack Impact and is the set of documented attack classes. In (4), the normalisation factor ensures each documented category contributes equally, consistent with the scoring scale defined in (1). A score of zero under (4) indicates that no attack category could be credited from the available documentary evidence, which constitutes an Essential property violation under the classification established in Section 4.2; this reflects an absence of verifiable evidence rather than a confirmed absence of attack coverage in the dataset itself. This formulation ensures linear scalability with taxonomy size while maintaining interpretability.
- (b)
- Provenance Source
Provenance Source scores the operational realism of the data collection environment using a five-tier deterministic scale. Each dataset maps to exactly one tier based on its documented collection method, with no expert judgement required; hybrid collection methods are resolved via the explicit tie-breaking rule defined below.
Provenance Source scores the operational practicality of the data collection environment. Let T = {1, 2, 3, 4, 5} be the ordered set of provenance tiers defined in Table 5, where higher values reflect greater ecological validity. Let denote the set of admissible collection method descriptors derivable from documentary evidence. The Provenance Source score is defined by the deterministic tier assignment function τ:
where assigns a deterministic tier value based on documented collection methodology denotes the documented collection method descriptor for dataset (), and denotes the tier value assigned to based deterministically on that documented collection method. The function τ defined in (5) maps every admissible collection method descriptor to exactly one tier, requiring no expert inference. Where dataset documentation describes more than one qualifying collection method, the tier is assigned as follows: (i) if the dataset creators explicitly identify a primary or majority data source (e.g., a stated proportion of real-to-synthetic traffic, or an explicit statement that one method is supplementary to another), the tier corresponding to that documented primary source is assigned; (ii) if no such explicit primary-source statement or proportion is documented, the lower of the qualifying tiers is assigned, consistent with the conservative coding principle applied throughout this framework to prevent score inflation. The scale in (5)–(6) is a constructed cardinal scoring scale: each of the five tiers is assigned a deliberately defined quantitative value (1–5) intended for direct arithmetic aggregation with the other category scores in the composite model (13)/(15). This is a constructed scoring representation rather than a naturally measured empirical scale; the framework does not claim that the numerical difference between adjacent tiers corresponds to an experimentally measured or equal real-world quantity of provenance realism, only that increasing tier values represent a deliberately ordered and quantitatively weighted increase in ecological validity, consistent with the treatment of the other five scoring categories. This treatment is consistent with standard composite-indicator methodology, in which categorical or ordinal constructs are commonly assigned ordered numeric codes to permit aggregation with other component indicators [28]; we adopt this as a modelling simplification rather than as a claim that the five tiers are separated by empirically equal real-world intervals. Section 5.2’s leave-one-category-out and alternative-mapping sensitivity analyses (Table S7) confirm that dataset rankings are not materially sensitive to this scaling assumption (ρ ≥ 0.99 under an alternative rescaled mapping).
- (c)
- Feature Diversity
Feature Diversity assesses representational breadth across the three feature families defined in Section 4.2.2. Let be the set of feature families, where = Basic features (timestamps, IPs, ports, protocol identifiers), = Traffic-based features (flow-level aggregates, inter-arrival statistics), and = Content-based features (payload bytes, application-layer fields). Let |F| = 3. Let denote the subset of feature families present in dataset d:
In (7), the per-family increment ensures proportional contribution, consistent with (1). Where content-based features are architecturally unavailable due to encryption, the indicator in (2) returns 0 and this is coded absent-by-constraint rather than as a documentation deficiency. Absence of content-based features is treated as structurally constrained when encryption or collection design prevents payload visibility, rather than as documentation failure.
- (d)
- Documentation and Metadata
Documentation and Metadata evaluate three verifiable evidence checks that together constitute the minimum documentation standard for reproducible dataset use. Let , and be the number of satisfied criteria. This category measures administrative completeness of dataset metadata and does not itself indicate whether individual substantive properties (e.g., attack coverage, feature composition) are documented to the same degree.
where counts the presence of release year, metadata schema, and data format specification. In (8), the same proportional normalisation structure used in (4) and (7) is applied, with a per-criterion increment of . Each criterion is confirmed through the indicator in (2).
- (e)
- Evaluation Readiness
Evaluation Readiness assesses the extent to which a dataset supports reproducible supervised benchmarking without requiring substantial additional preparation. Four criteria are coded from documentary evidence, summarised in Table 6.
Table 6.
Evaluation Readiness Criteria and Scoring Indicators.
The Ground-Truth Labels criterion assesses the documented presence of a label schema, rather than its empirical accuracy, noise level, or consistency; empirical assessment of label quality is outside the evidentiary scope of the documentary-based framework. Evaluation Readiness assesses the extent to which a dataset supports reproducible supervised benchmarking without requiring substantial additional preparation. Let , be the set of evaluation readiness criteria defined in Table 6, where = ground-truth labels, = predefined train/test split, = traffic class identification, and = class distribution reporting and be the number of satisfied criteria. Evaluation Readiness captures the extent to which a dataset supports supervised benchmarking without additional inference assumptions.
where includes label availability, class structure definition, class distribution reporting, and presence of predefined splits when provided. In (9), the per-criterion increment is . The distinction between documentation transparency and statistical properties is formalised through (2): a dataset satisfies if and only if is explicitly reported in documentation, regardless of the actual class ratio.
- (f)
- Availability
Availability maps the documented access conditions of a dataset to a three-level cardinal score. Let Λ = {_public, _request, _restricted} be the set of access condition classes. Let denote access condition and a mapping function. The Availability score is defined by the deterministic mapping function :
The scores in (10) are arithmetically uniformly spaced, with an equal increment of two between adjacent levels ( − = 2; − = 2). This numerical uniformity is a property of the constructed scoring scale; the three levels nonetheless represent qualitatively distinct reproducibility barriers, ranging from unrestricted public access to formally restricted access, and the manuscript does not claim that the real-world difficulty associated with each access barrier is itself numerically equal.
5.2. Composite Scoring and Sensitivity Analysis
The overall suitability score is defined as a weighted linear combination of the six category scores. This general formulation allows differential emphasis across scoring dimensions through a positive, normalised weight vector. Let
be the vector of category scores for dataset d, where each component . The vector in (12) collects the six scores produced by (4), (6)–(9), and (11) respectively. K is number of evaluation categories which is K = 6. Then is the weight assigned to category K and the composite suitability score is defined as a weighted linear combination:
subject to the constraints:
The constraints in (14) ensure for all , preserving the scale established in (1). Under equal weighting (), which is adopted as the framework defaults, the composite score simplifies to:
All six category scores, including the cardinal Provenance Source scale defined in (5) and (6), are treated as commensurable numeric inputs to the equal-weight composite in (15) by design, consistent with the constructed cardinal scoring representation established in Section 5.1. Ranking stability under alternative weighting schemes was assessed in two stages. First, the equal-weight scheme (Equation (15)) was compared against two emphasis variants using Spearman rank correlation: a Provenance-emphasis scheme (wProvenance = 0.30, remaining categories sharing 0.70 equally) and an Evaluation-Readiness-emphasis scheme (wEvaluation Readiness = 0.30), yielding ρ = 0.9093 and ρ = 0.9804, respectively, against the equal-weight ranking (n = 27). Second, to test robustness across the full feasible weight space rather than only two selected alternatives, 10,000 weight vectors were randomly drawn from a symmetric Dirichlet distribution over the six categories and the composite score recomputed for each draw. The resulting distribution of Spearman rank correlations with the equal-weight baseline had a median of ρ = 0.90, a mean of ρ = 0.86 (SD = 0.12), and a central 90% interval of [0.57, 0.97], indicating that rankings are generally stable across the realistic weight space; the lower tail of the distribution corresponds to extreme weight concentrations on categories with low discriminative power, particularly Documentation and Metadata and Availability. A leave-one-category-out analysis was additionally conducted: each category was excluded in turn and the composite recomputed from the remaining five, with the resulting ranking correlated against the full six-category equal-weight ranking. Excluding Attack Coverage produced the largest rank disruption (ρ = 0.75, mean rank shift = 4.3, maximum = 15 positions), while excluding Availability or Documentation and Metadata produced minimal disruption (ρ = 0.99 and 0.98 respectively), consistent with those categories’ low between-dataset variance. Alternative tier mappings for Provenance Source (linearly rescaled to [1, 3]) and Availability (1/2/3 instead of 1/3/5) produced rank correlations of ρ = 0.99 and ρ ≈ 1.00 respectively, confirming that the specific tier-value assignments do not substantially affect rankings. Under a worst-case remapping to the legacy four-category DARPA attack taxonomy (treating all Attack Coverage scores below the maximum as losing one documented category), rank correlation remained ρ = 0.97 with a maximum rank shift of four positions, indicating that the repositioning of legacy datasets reported in Section 6 is robust to the taxonomy revision. Full weight vectors, per-scheme rankings, and the complete sensitivity matrix are provided in Supplementary Material S7. A sensitivity analysis under alternative missing-evidence coding rule could not be performed from the current descriptor records, which do not distinguish explicitly absent properties from unreported ones; this is identified as a scope boundary in Section 8.4. This also ensures , preserving the interpretability and boundedness of the original category scales. Equation (15) is a special case of (13) under from (3), and inherits the boundedness guarantee of (14), confirming as defined in (1). Equal weighting is adopted as the default non-informative prior, consistent with composite indicator methodology, in the absence of empirical evidence supporting differential category importance [29] and equal weights keep the composite score a neutral summary of documented property coverage rather than a task-specific utility metric. Further sensitivity checks treated Documentation and Metadata as a prerequisite admission gate (requiring the maximum score of 5.0). This excluded one dataset (NSL-KDD) and produced a five-category composite ranking for the remaining 26 datasets identical to their original six-category ranking (ρ = 1.00), reflecting the pronounced ceiling effect in this dimension rather than an independent robustness finding.
Ranking stability under alternative weighting relative to (15) was assessed by comparing the equal-weight scheme against two emphasis variants using Spearman rank correlation. Correlations of and confirm that rankings produced by (15) are highly stable under moderate perturbation, supporting it as the robust default form of (13) [30]. Full weight vectors and per-scheme rankings are provided in Supplementary Material S5.
5.3. Implementation and Reproducibility
The framework defines a deterministic mapping function:
The mapping in (16) is uniquely determined for any input descriptor vector ; it combines the score vector of (12) with the composite score of (15) into a single reproducible output. Identical inputs to (16) always produce identical outputs, with no stochastic or optimisation components. The framework contains no stochastic elements, learning components, or optimisation procedures, distinguishing it from probabilistic or expert-driven scoring systems. All scoring artefacts are publicly available at https://github.com/uweaminur/Dataset_Score (accessed on 30 August 2026). The repository includes a dataset descriptor CSV template with controlled vocabulary, executable scoring and visualisation notebooks, versioned descriptor files for all 27 evaluated datasets with evidence provenance, and all generated outputs including category scores, composite scores, heatmaps, profile plots, and ranking figures. A third-party researcher with no prior knowledge of the framework can reproduce all 27 dataset scores, from raw descriptor inputs to composite rankings and all generated figures, using the repository alone, without contacting the authors. This full end-to-end reproducibility distinguishes the framework from evaluation approaches that share methodology descriptions without the operational artefacts needed to verify or extend them. Full decisions are provided in Supplementary Material S4.
5.4. Worked Example
CICIDS 2017 is an example of the scoring framework in use. It shows how documented dataset properties are systematically made into a reproducible quantitative suitability profile. The dataset fits this purpose because its broad documentation coverage and wide adoption in intrusion detection literature make its property evidence easy to verify against the framework’s coding rules. Applying the indicator function defined in (2) to available evidence, CICIDS 2017 satisfies all five attack taxonomy categories: Reconnaissance, Initial Compromise, Privilege Misuse, Persistence and Control, and Attack Impact. This results in the maximum Attack Coverage score under (4). The emulated testbed collection environment maps directly to Tier 3 in the provenance hierarchy under (5) and (6). This reflects controlled, not operational, traffic generation. All three feature families, basic, traffic-based, and content-based, are explicitly documented. This yields the maximum Feature Diversity score under (7). Documentation and metadata meet three criteria: release year, metadata schema, and data format specification under (8). Evaluation Readiness meets three of four criteria under (9), but there is no officially provided predefined train/test split, so the score is not at the maximum. Availability reaches the highest tier under (11) because the dataset is publicly downloadable without institutional restriction. Table 7 presents the full derivation of the category-level scoring.
Table 7.
Framework Scoring Results for CICIDS 2017.
Substituting the six category scores from (4), (6)–(9), and (11) into the equal-weight composite formula defined in (15):
The composite score is 4.46, which shows strong dataset suitability across almost all evaluation dimensions. There are two constraints at the category level that the composite score alone would hide. First, Ssource = 3.00 from (6) is limited by the emulated collection setting. This is not a documentation issue but a reflection of the provenance reality that tier mapping records. Second, Seval = 3.75 from (9) shows the lack of an official, predefined split. This gap places a burden on researchers, who must document their own partitioning choices for cross-study comparability. This breakdown by category highlights a key feature of the framework: datasets with the same or similar composite scores may have different suitability profiles. These differences become clear only when examining scores by category, not just as a single total.
6. Application of the Framework to 27 Representative Datasets
This section applies the proposed framework to 27 representative intrusion detection benchmark datasets, reporting category-level scores, composite rankings, and visual profiles. The evaluation assesses documented dataset properties exclusively and does not measure detection performance; this decoupling is intentional and consistent with the framework’s model-agnostic scope. The systematic search identified 5462 records, of which 112 met the eligibility criteria for inclusion in the synthesis corpus (Figure 1). This total includes 59 records identified through an additional search covering January 2025 to June 2026, none of which met the relevance criteria for the framework’s threat-dataset properties (Supplementary Figure S1).
6.1. Dataset Selection
Twenty-five publicly accessible datasets were selected to ensure diversity across data modality (packet capture, flow-based, host/system logs), provenance setting (real-world versus emulated), research context (legacy benchmarks, modern IDS datasets, domain-specific collections), and temporal span (1999–2023). Selection was governed by four objective criteria applied before scoring: documented accessibility, modality diversity, provenance diversity, and temporal coverage. These criteria were applied prior to any scoring to avoid circularity. The corpus spans all five provenance tiers and all five attack taxonomy categories, confirming the framework’s applicability across the full heterogeneity of available resources. Table 8 summarises the evaluated datasets.
Table 8.
Evaluated datasets: modality, provenance, and reference.
Applying the framework produces six category scores and an overall composite score for each dataset. Table 9 presents the complete results. Overall scores range from 3.10 to 4.46, revealing clear and interpretable variation in dataset suitability.
Table 9.
Complete Framework Scores: Six Categories and Composite Rankings for 27 Datasets.
Three composite-score tiers emerge. The upper tier (4.25–4.46), comprising CICIDS 2017, UNSW-NB15, NF-UQ-NIDS, Kyoto 2006+, ToN-IoT, CSE-CIC-IDS2018, and CIC-IDS2018, consistently achieve maximum or near-maximum documented scores in Attack Coverage, Feature Diversity, and Documentation and Metadata, indicating strong documented evidentiary completeness across these categories under the framework’s coding rules. As the leave-one-category-out analysis below shows, this reflects documented property coverage rather than confirmed downstream detection performance or reproducibility. The middle tier (3.64–4.08), including KDD’99, DARPA 99, NSL-KDD, UGR’16 and CICIoMT2024, reflects moderate suitability characterised by trade-offs between Attack Coverage and Provenance or Evaluation Readiness. The lower tier (≤3.51), including ISCX2012, DEFCON, AWID, CAIDA DDoS 2007 and CICIoV2024, is primarily constrained by limited Attack Coverage and restricted accessibility or evaluation readiness. Importantly, lower scores reflect intentional scope or specialisation rather than deficiencies. DNS Data and CAIDA DDoS 2007 are designed for protocol-specific and volumetric analysis, respectively, and their scores accurately reflect that focus.
Correlating an individual category score with the full composite is subject to a structural limitation, since each category mechanically contributes to the composite against which it is correlated. A leave-one-category-out (LOO) analysis was conducted to isolate this effect; full results and interpretation are reported in Section 8.1 and Supplementary Material S6. Under the original (full composite) analysis, Attack Coverage showed the strongest association with the composite score (ρ = 0.851, p < 0.001), followed by Feature Diversity (ρ = 0.604, p = 0.001), Evaluation Readiness (ρ = 0.531, p = 0.004), and Availability (ρ = 0.447, p = 0.019). Provenance Source (ρ = −0.030, p = 0.881) and Documentation & Metadata (ρ = 0.051, p = 0.802) showed no meaningful association with the full composite. Under the LOO analysis, Attack Coverage’s association fell to ρ = 0.360 (p = 0.065)—a reduction of 0.491, the largest of any category—and was no longer statistically significant. Under LOO adjustment, the strongest-magnitude association shifted to Provenance Source (ρ = −0.438, p = 0.022), followed by Availability (ρ = 0.356, p = 0.068). No category achieved statistical significance under Bonferroni correction for six comparisons (adjusted α = 0.008). Full results are reported in Supplementary Material S6. These findings indicate that no single category retains a strong, statistically independent association with the remaining framework dimensions once its own mechanical contribution is removed, and the characterisation of Attack Coverage as the “strongest predictor” of the composite score has accordingly been revised throughout the manuscript.
The leave-one-category-out analysis further serves as a ranking-robustness check, complementing the weighting-sensitivity analysis in Section 5.2: the ranking produced by the full six-category equal-weight composite [29] is most sensitive to the inclusion of Attack Coverage (ρ = 0.75 when excluded, with a maximum individual rank shift of 15 positions) and most stable with respect to Availability and Documentation and Metadata (ρ > 0.98 when excluded. These findings are consistent with the score-variance patterns observed in Figure 6 and do not require separate interpretation here.
Figure 6.
Evaluation Heatmap: Six-Category Scores Across 27 intrusion detection benchmark datasets.
6.2. Visual Analysis
Figure 6 presents a heatmap of all category-level scores across the 27 datasets. The visual confirms the three patterns established quantitatively: Attack Coverage is the most discriminative dimension with the widest score range (1.0–5.0); Documentation and Metadata show a ceiling effect with no discriminative value; and Availability introduces a binary separation between fully public datasets (5.0) and the two restricted-access datasets, AWID and CAIDA DDoS 2007 (3.0). Feature Diversity exhibits a bimodal distribution, datasets with all three feature families cluster at 5.0, while those with two cluster at 3.33, and Provenance Source stratifies clearly by collection method.
Figure 7 presents the overall composite ranking. The highest tier, CICIDS 2017, NF-UQ-NIDS, and UNSW-NB15 (4.46), is followed by Kyoto 2006+ (4.35) and a secondary cluster at 4.25. A notable finding is the repositioning of legacy datasets: NSL-KDD, KDD’99, and DARPA 99 appear in the middle tier and no longer dominate evaluation practice as their citation frequency might suggest. Modern datasets consistently rank higher, driven by broader attack coverage, richer feature representations, and stronger evaluation readiness under the updated five-category taxonomy.
Figure 7.
Overall Suitability Rankings: Composite Scores for 27 Evaluated Datasets (0–5 Scale).
Figure 8 compares category-level score profiles for the five highest-ranked datasets. Although CICIDS 2017, NF-UQ-NIDS, and UNSW-NB15 achieve identical composite scores (4.46), their category-level compositions differ: Kyoto 2006+ reaches its score through superior Provenance (4.0), compensating for lower Feature Diversity (3.33), while the top three achieve maximum scores in both Attack Coverage and Feature Diversity but are constrained to emulated provenance (3.0). This demonstrates that equal composite scores can reflect structurally distinct suitability profiles, a trade-off that composite scores alone would obscure, and that category-level decomposition makes explicit.
Figure 8.
Category-Level Score Profiles: Structural Differences Among Highest-Ranked Datasets.
7. Positioning: Comparison with Existing Evaluation Methods
Prior work on intrusion detection benchmark dataset evaluation falls into four methodological categories, each addressing a distinct aspect of dataset assessment, but none provides the combination of properties required for systematic, reproducible, multi-dataset comparison.
7.1. Typology and Limitations of Prior Approaches
The Five existing categories each carry structural limitations that constrain their applicability to systematic cross-dataset comparison. Table 10 documents each approach’s scope, method, and key limitation.
Table 10.
Comparison of threat dataset evaluation approaches.
Checklist-based frameworks [5] formalise benchmark requirements by defining binary compliance criteria for attack diversity, labelling, and traffic realism. Whilst influential, particularly in shaping the CICIDS dataset family, binary compliance cannot capture partial satisfaction or support quantitative ranking across datasets that differ on multiple dimensions simultaneously. Realism-centred scoring [4] quantifies behavioural fidelity through continuous scores using fuzzy inference systems, capturing gradual quality differences but requiring expert-defined membership functions, restricting applicability to a single dimension, and introducing calibration subjectivity. Narrative critiques [10] provide rich contextual understanding of systemic evaluation risks but do not operationalise their insights into reproducible procedures. Single-dataset diagnostics [56] offer rigorous statistical analysis of individual datasets but do not generalise into reusable frameworks applicable across the heterogeneous corpus.
7.2. Positioning and Complementarity
The proposed framework occupies the methodological niche currently underserved: broad scope, high reproducibility, graded partial satisfaction, and an SLR evidence base. Four integrated properties distinguish it from all four prior categories simultaneously: properties are derived from a PRISMA-guided synthesis of 112 studies rather than selected ad hoc; coding requires explicit documentary evidence rather than expert inference; scoring is fully deterministic with identical inputs yielding identical outputs; and outputs are multi-level, category scores, composite scores, and visual profiles, exposing trade-offs rather than collapsing suitability into a single opaque metric. Practical guidance for method selection follows from this complementarity. Checklist frameworks remain appropriate when designing new datasets requiring clear benchmark specifications. Realism scoring is best suited when operational fidelity is the paramount criterion. Narrative critiques are valuable for understanding systemic methodological risks. Single-dataset diagnostics support detailed pre-experiment quality assessment. The proposed framework is most appropriate when systematically screening multiple candidate datasets, producing auditable selection justification, or comparing heterogeneous datasets transparently. This complementarity reflects the framework’s design intent: to provide structured infrastructure for dataset selection decisions rather than to replace the deeper analytical work that diagnostics and realism modelling support.
8. Discussion
The analysis demonstrates that a compact set of literature-derived properties, operationalised into a deterministic scoring framework, exposes meaningful and systematic differences among widely used intrusion detection benchmark datasets. This section interprets the principal findings, discusses practical implications for dataset creators and users, and identifies the framework’s limitations alongside directions for future research.
8.1. Principal Findings
The central finding is that dataset quality is multidimensional: documentation completeness and evaluation readiness emerge from property configurations rather than from strength in any single dimension. The compensatory trade-off between from (6) and from (4) explains why Provenance Source shows essentially no correlation with from (15) (ρ = −0.030). The datasets achieving Tier 4 or 5 in (6) tend to cover a narrower subset of the taxonomy in (4), yielding lower (4) scores that offset higher (6) scores in the composite (15). Conversely, extensive attack coverage does not compensate for a weak evaluation structure. The framework makes these trade-offs explicit and traceable, enabling researchers to match dataset selection to specific evaluation objectives rather than defaulting to historically entrenched choices. This retention decision is further supported by an empirical gate-based sensitivity check: treating Documentation and Metadata as a prerequisite admission gate (requiring the maximum score of 5.0) excludes only one of the 27 evaluated datasets (NSL-KDD) from the corpus and produces a five-category composite ranking for the remaining 26 datasets that is identical to their ranking under the original six-category composite (ρ = 1.00). This confirms that the pronounced ceiling effect in this dimension makes its inclusion low-risk to current rankings—it cannot distort the ordering of datasets that already satisfy it—while the criterion continues to function as a baseline documentation check for the small minority of datasets that do not.
Two findings warrant interpretive attention. First, Documentation and Metadata exhibit a near-ceiling effect across the corpus, with nearly all 27 datasets scoring 5.0. This indicates that the research community has broadly converged on basic documentation standards, reflecting increasing maturity and consistency in dataset reporting practices [10]. This is a positive development, but it also means that documentation quality no longer serves as a meaningful differentiator among datasets in comparative evaluation. The Documentation and Metadata category is nevertheless retained in the composite scoring model for two reasons: first, it functions as a prerequisite gate, since a dataset lacking release year, metadata, or format specification would be unsuitable for benchmarking regardless of strengths in other dimensions; second, it serves a protective role for future datasets that may not maintain current reporting standards, ensuring that the framework remains sensitive to regression as the dataset landscape evolves. The original correlation analysis identified Attack Coverage as most strongly associated with the full composite score (ρ = 0.851). However, because the composite is constructed from the six category scores, this association contains a structural component. A leave-one-category-out analysis—correlating each category against a composite computed from the remaining five categories only—confirms this: Attack Coverage’s association fell to ρ = 0.360 (p = 0.065) once its own contribution was excluded, a reduction of 0.491 and the largest decrease observed across the six categories. Attack Coverage therefore ranked fourth of six in the LOO analysis, with Provenance Source (ρ = −0.438) and Availability (ρ = 0.356) showing larger-magnitude LOO associations, neither surviving Bonferroni correction. The compensatory trade-off between Provenance Source and Attack Coverage—already documented in the tier analysis—is reflected in Provenance Source’s negative LOO association: datasets achieving higher provenance realism tend to cover a narrower portion of the attack taxonomy, yielding lower Attack Coverage scores that the LOO composite makes visible once Attack Coverage’s own weight is removed. The term “strongest predictor” has been removed from the manuscript; the analysis supports only the descriptive finding that Attack Coverage showed the strongest original association with the composite score, an association that was substantially structural in nature.
The class distribution reporting criterion makes an important distinction: it rewards the act of disclosure rather than a particular distributional outcome. As formalised through the indicator of (2) applied in (9), explicit reporting of any class distribution, even a 99:1 ratio, satisfies , because it is the act of disclosure, not the distributional outcome, that the criterion measures and strategically mitigates. However, omitting class distribution fails the criterion regardless of the actual balance, since non-disclosure undermines interpretability and reliability.
8.2. Taxonomy and Score Interpretation
The revised five-category taxonomy reveals a clear pattern in the evaluation results: modern datasets achieve higher rankings primarily because they document broader and more balanced coverage across the full attack lifecycle (C1–C5), capturing not only initial access and exploitation but also persistence, command-and-control communication, and outcome-driven impact. Legacy datasets such as NSL-KDD, KDD’99, and DARPA 99 are repositioned to the middle tier, not because they are unusable but because their documented attack coverage, designed around the 1999 four-class baseline, does not reflect the functional structure of contemporary threat behaviour. This repositioning is an empirical outcome of applying a taxonomy grounded in current literature rather than a normative judgement about dataset quality.
A low Attack Coverage score for DNS Data or CAIDA DDoS 2007 reflects intentional domain-specific design, not a deficiency. When datasets yield similar composite scores, category-level decomposition remains essential, as Figure 8 demonstrates. CICIDS 2017 and Kyoto 2006+ reach comparable overall scores through structurally different combinations of strengths. The scores should be understood as measures of documented property coverage and evaluation readiness as operationalised by the framework’s six categories, not as measures of intrinsic dataset quality, real-world representativeness, or downstream IDS performance. A researcher selecting datasets for a specific evaluation task should treat the composite score as a structured summary of documented characteristics and should consult the category-level profile (Figure 8, Table 9) to identify which specific properties are and are not satisfied. A dataset with a lower composite score may be entirely appropriate for a research question whose requirements are concentrated in the categories where that dataset scores highly.
8.3. Implications for Dataset Creators and Users
For dataset creators, the framework’s scoring criteria translate abstract documentation expectations into explicit, actionable requirements: comprehensive metadata with field definitions and label semantics, clear format specification, predefined evaluation splits, and transparent class distribution reporting. These practices impose modest preparation overhead but substantially increase evaluative clarity and enable meaningful reuse across independent research teams. The framework converts documentation quality from an implicit assumption into a measurable, improvable property, and the evaluation results indicate substantial variability in evaluation readiness across datasets, as reflected in differences in from (9) across the corpus. No dataset in the evaluated corpus achieves in (9), meaning no dataset satisfies all four criteria of simultaneously. The maximum observed is 3.75, corresponding to in (9), which is the observed ceiling of the evaluation readiness dimension across all 27 datasets. This highlights current limitations in dataset design regarding comprehensive evaluation support.
For dataset users, category-level decomposition provides principled, evidence-grounded screening criteria that replace convention-driven or citation-frequency-based selection. A researcher designing a supervised multi-class evaluation can filter first by Attack Coverage, then by Evaluation Readiness and Feature Diversity, before considering provenance constraints, a structured decision process that the framework’s descriptor schema and composite scores directly support. This replaces implicit justification with auditable, pre-specified selection rationale, addressing a documented source of irreproducibility in IDS benchmarking practice [2]. A related consideration applies to researchers who select legacy benchmarks specifically to maintain comparability with prior published results, rather than for their dataset suitability under this framework. The composite score is not intended to discourage this practice: a lower composite score reflects narrower documented alignment with the framework’s Essential and General properties, not unsuitability for every research purpose. Where historical comparability is the primary objective, we recommend reporting the selected dataset’s category-level profile alongside the comparison (e.g., its Attack Coverage and Evaluation Readiness scores relative to the corpus, as shown in Table 9), explicitly acknowledging any dimensions in which it scores lower, and, where feasible, pairing the legacy benchmark with a higher-scoring contemporary dataset to complement the evaluation. This preserves the transparency the framework is designed to support even when a lower-scoring dataset is deliberately and legitimately chosen.
8.4. Limitations, Scope Boundaries, and Future Research
The framework operates within clearly defined boundaries. These boundaries shape how outputs are interpreted and identify where further empirical work is needed. Nine limitations are identified across three categories. Scope boundaries define what the framework measures, documented property coverage, and evaluation readiness. They also clarify what is not measured, including intrinsic dataset quality and empirical detection performance. A further scope boundary concerns the treatment of missing evidence: the framework’s descriptor schema currently encodes each property as a Boolean indicator without distinguishing cases where a source explicitly documents a property’s absence from cases where the source is simply silent on the property. Both receive identical treatment—no positive credit—under the deterministic scoring rule. This is a deliberate evidentiary boundary rather than an oversight, but it means composite scores should be read as measures of evidence-supported characteristics rather than confirmed dataset content, and it is not currently possible to retrospectively separate these two cases within the existing descriptor records without returning to the original source documentation for each property. Methodological constraints arise from the systematic review process. These include single-reviewer screening and inter-rater subset validation. While aligned with SLR norms, they introduce some uncertainty that full dual coding could reduce. Analytical constraints are embedded in the scoring design. These include equal category weighting, static snapshot coding, and a fixed five-category taxonomy. The five-category attack taxonomy, based on 112 studies, deliberately excludes highly specialised threats because their documentation is inconsistent. Table 11 summarises each limitation, category, impact, and the relevant mitigation or research direction.
Table 11.
Framework limitations, scope boundaries, and future research directions.
These limitations reflect deliberate design boundaries, not implementation gaps. A further limitation concerns label quality, noise, and scale, none of which are empirically assessed by the framework: a dataset with well-documented but empirically inaccurate or noisy labels may still receive a high Evaluation Readiness score, because the framework verifies the documented existence of a label schema rather than its empirical accuracy or noise level. The Evaluation Readiness score should therefore not be interpreted as evidence that the underlying labels are empirically valid, accurate, or free of noise. External empirical validation remains an important direction for future research. Specifically, future work should test whether Documentation and Metadata scores are associated with the actual reproducibility of benchmarking, and whether better-documented datasets yield more stable detection performance across independent research teams. The present study does not establish that higher composite scores predict superior IDS detection performance or greater experimental reproducibility; establishing such relationships would require independent controlled cross-dataset IDS experiments, comparing detection accuracy, variance, and stability across teams using datasets from different scoring tiers under standardised evaluation conditions. This constitutes an important and tractable direction for future work rather than a limitation of the framework’s present design. The scholarly database search underlying this framework’s taxonomy was conducted for the period 1998 to June 2026 (Section 3.1); all 112 studies meeting the inclusion criteria were published between 1998 and 2024, and no study from the 2025–2026 portion of the search window provided evidence requiring modification of the property structure. This does not eliminate the underlying limitation that any evidence synthesis reflects a bounded search: future development of the field may in time warrant a further, more extensive update.
9. Conclusions
Dataset selection is a methodological decision, yet it has been treated as a procedural one, driven by citation frequency, historical convention, and availability rather than systematic, auditable assessment. This study addresses that gap by introducing a property-based evaluation framework grounded in a PRISMA-guided systematic literature review of 112 cybersecurity threat-dataset studies published between 1998 and 2024, identified through a scholarly database search conducted through June 2026. Recurring dataset properties were synthesised into Essential and General sets and operationalised into six deterministically scored evaluation categories: Attack Coverage, Provenance Source, Feature Diversity, Documentation and Metadata, Evaluation Readiness, and Availability, each scored 0–5 through fixed arithmetic rules anchored in verifiable documentary evidence.
Application to 27 representative datasets demonstrates that dataset suitability is multidimensional and that composite rankings are generally stable across a wide range of alternative weighting schemes, as confirmed by a Monte Carlo perturbation analysis (median ρ = 0.90 across 10,000 Dirichlet-sampled weight vectors) and a leave-one-category-out ranking-stability analysis. Attack Coverage exhibits the greatest structural influence on the composite ranking, as its exclusion produces the largest rank disruption; however, a leave-one-category-out correlation analysis confirms that this influence is partly attributable to its mechanical contribution to the composite, and the characterisation of Attack Coverage as the “strongest predictor” has been removed accordingly. Datasets achieving the highest composite scores are those with the strongest documented alignment across Attack Coverage, Feature Diversity, and Evaluation Readiness; these scores reflect evidentiary completeness within the framework’s defined properties rather than predicted IDS performance and should be interpreted as such. Documentation and Metadata exhibit a near-ceiling effect, indicating that basic documentation standards are now broadly met across the community, but also that further differentiation must come from evaluation structure and attack breadth rather than documentation alone. The repositioning of legacy datasets such as NSL-KDD and KDD’99 to the middle tier is an empirical outcome of applying a taxonomy grounded in contemporary threat modelling, not a normative judgement, and it provides a principled basis for encouraging the community’s gradual transition toward more comprehensive benchmarks.
The framework also has several unresolved limitations that constrain the scope of its interpretation (Table 11). These include its documentation-based rather than empirical assessment scope, including the boundary that label quality, noise, and scale are not assessed; the assumption of equal weighting across framework dimensions; static or snapshot-based coding that may not capture changes in dataset characteristics over time; the use of a fixed five-category attack taxonomy; and the absence of external validation using downstream intrusion detection system (IDS) performance. Accordingly, the framework is not intended to provide a complete evaluation of every aspect of dataset quality, but rather a structured assessment of the properties that can be evaluated within its defined scope and evidence requirements.
The framework provides value at three levels: for dataset creators, it converts abstract documentation expectations into measurable, improvable requirements; for dataset users, it replaces convention-driven selection with auditable, pre-specified screening criteria; and for the research community, it makes dataset limitations transparent rather than assumed. Its model-agnostic design deliberately separates dataset property assessment from detection performance, establishing dataset evaluation as a methodological step deserving the same rigour as algorithm design and experimental protocol specification, a foundation for more transparent, reproducible, and cumulative cybersecurity research.
Supplementary Materials
The following supporting information can be downloaded at: https://www.mdpi.com/article/10.3390/app16189205/s1, Table S1. Scholarly Database search strings and field restrictions; Table S2. Per-property Cohen’s kappa—inter-rater reliability validation (n = 25 studies); Table S3. (a) Essential vs General classification decision rule, (b) Property prevalence and criticality summary, (c) Validity threats vs usability barriers—evidence from included studies, (d) Threshold sensitivity analysis of Essential/General property classification; Table S4. Dataset descriptor field definitions and coding rules; Table S5. Weight vectors used in sensitivity analysis; Table S6. Original and leave-one-category-out Spearman rank correlations between individual category scores and the composite score (n = 27 datasets); Table S7. Comprehensive sensitivity analysis of ranking robustness under alternative framework configurations; Table S8. Illustrative domain-specific taxonomy extension mechanism (sub-tag structure); Figure S1. Detailed screening flow for the additional literature search; Figure S2. Distribution of publications by publication year, including 59 additional publications from 2025 to June 2026.
Author Contributions
Conceptualization, A.B.U. and Y.F.A.; Methodology, S.M.A.R., A.B.U., M.M. and Y.F.A.; Software, S.M.A.R.; Formal analysis, S.M.A.R.; Investigation, S.M.A.R.; Resources, S.M.A.R.; Writing—original draft, S.M.A.R.; Writing—review & editing, A.B.U., M.M. and Y.F.A.; Visualization, S.M.A.R.; Supervision, A.B.U., M.M. and Y.F.A.; Project administration, A.B.U.; Funding acquisition, A.B.U. All authors have read and agreed to the published version of the manuscript.
Funding
This research was funded by the Australian Government Department of Industry, Science and Resources through the Cooperative Research Centres Projects (CRC-P) program, Grant No. CRCPXV000292.
Institutional Review Board Statement
Not applicable.
Informed Consent Statement
Not applicable.
Data Availability Statement
The data presented in this study are openly available in Dataset_Score at https://github.com/uweaminur/Dataset_Score (accessed on 30 August 2026).
Conflicts of Interest
The authors declare no conflict of interest.
References
- Aleesa, A.; Zaidan, B.; Zaidan, A.; Sahar, N.M. Review of intrusion detection systems based on deep learning techniques: Coherent taxonomy, challenges, motivations, recommendations, substantial analysis and future directions. Neural Comput. Appl. 2020, 32, 9827–9858. [Google Scholar] [CrossRef] [Scilit]
- Sommer, R.; Paxson, V. Outside the closed world: On using machine learning for network intrusion detection. In Proceedings of the 2010 IEEE Symposium on Security and Privacy, Oakland, CA, USA, 16–19 May 2010; pp. 305–316. [Google Scholar]
- Ring, M.; Wunderlich, S.; Scheuring, D.; Landes, D.; Hotho, A. A survey of network-based intrusion detection data sets. Comput. Secur. 2019, 86, 147–167. [Google Scholar] [CrossRef] [Scilit]
- Haider, W.; Hu, J.; Slay, J.; Turnbull, B.P.; Xie, Y. Generating realistic intrusion detection system dataset based on fuzzy qualitative modeling. J. Netw. Comput. Appl. 2017, 87, 185–192. [Google Scholar] [CrossRef] [Scilit]
- Gharib, A.; Sharafaldin, I.; Lashkari, A.H.; Ghorbani, A.A. An evaluation framework for intrusion detection dataset. In Proceedings of the 2016 International Conference on Information Science and Security (ICISS), Jaipur, India, 16–20 December 2016; pp. 1–6. [Google Scholar]
- Page, M.J.; McKenzie, J.E.; Bossuyt, P.M.; Boutron, I.; Hoffmann, T.C.; Mulrow, C.D.; Shamseer, L.; Tetzlaff, J.M.; Akl, E.A.; Brennan, S.E. The PRISMA 2020 statement: An updated guideline for reporting systematic reviews. BMJ 2021, 372, n71. [Google Scholar] [CrossRef] [Scilit]
- Hamid, Y.; Balasaraswathi, V.R.; Journaux, L.; Sugumaran, M. Benchmark Datasets for Network Intrusion Detection: A Review. Int. J. Netw. Secur. 2018, 20, 645–654. [Google Scholar]
- Cordero, C.G.; Vasilomanolakis, E.; Wainakh, A.; Mühlhäuser, M.; Nadjm-Tehrani, S. On generating network traffic datasets with synthetic attacks for intrusion detection. ACM Trans. Priv. Secur. (TOPS) 2021, 24, 1–39. [Google Scholar] [CrossRef] [Scilit]
- McHugh, J. Testing Intrusion detection systems: A critique of the 1998 and 1999 DARPA intrusion detection system evaluations as performed by Lincoln Laboratory. ACM Trans. Inf. Syst. Secur. 2000, 3, 262–294. [Google Scholar] [CrossRef] [Scilit]
- Nehinbe, J.O. A critical evaluation of datasets for investigating IDSs and IPSs researches. In Proceedings of the 2011 IEEE 10th International Conference on Cybernetic Intelligent Systems (CIS), London, UK, 1–2 September 2011; pp. 92–97. [Google Scholar]
- Oh, S. A new dataset evaluation method based on category overlap. Comput. Biol. Med. 2011, 41, 115–122. [Google Scholar] [CrossRef] [Scilit]
- Gong, Y.; Liu, G.; Xue, Y.; Li, R.; Meng, L. A survey on dataset quality in machine learning. Inf. Softw. Technol. 2023, 162, 107268. [Google Scholar] [CrossRef] [Scilit]
- Škoda, P.; Bernhauer, D.; Nečaský, M.; Klímek, J.; Skopal, T. Evaluation framework for search methods focused on dataset findability in open data catalogs. In Proceedings of the 22nd International Conference on Information Integration and Web-based Applications & Services, Chiang Mai, Thailand, 30 November–2 December 2020; pp. 200–209. [Google Scholar]
- Elsayed, M.S.; Le-Khac, N.-A.; Jurcut, A.D. InSDN: A novel SDN intrusion dataset. IEEE Access 2020, 8, 165263–165284. [Google Scholar] [CrossRef] [Scilit]
- Thakkar, A.; Lohiya, R. A review of the advancement in intrusion detection datasets. Procedia Comput. Sci. 2020, 167, 636–645. [Google Scholar] [CrossRef] [Scilit]
- Singh, G.; Khare, N. A survey of intrusion detection from the perspective of intrusion datasets and machine learning techniques. Int. J. Comput. Appl. 2022, 44, 659–669. [Google Scholar] [CrossRef] [Scilit]
- Tranfield, D.; Denyer, D.; Smart, P. Towards a methodology for developing evidence-informed management knowledge by means of systematic review. Br. J. Manag. 2003, 14, 207–222. [Google Scholar] [CrossRef] [Scilit]
- Lippmann, R.; Fried, D.J.; Graf, I.; Haines, J.W.; Kendall, K.R.; McClung, D.; Weber, D.; Webster, S.E.; Wyschogrod, D.; Cunningham, R.K. Evaluating intrusion detection systems: The 1998 DARPA offline intrusion detection evaluation. In Proceedings of the DARPA Information Survivability Conference and Exposition (DISCEX) 2000, Hilton Head, SC, USA, 25–27 January 2000. [Google Scholar]
- Landis, J.R.; Koch, G.G. The measurement of observer agreement for categorical data. Biometrics 1977, 33, 159–174. [Google Scholar] [CrossRef] [Scilit]
- WinPCAP. WinPCAP. Available online: www.winpcap.org (accessed on 23 August 2025).
- Netflow, C. Cisco Netflow. Available online: https://www.cisco.com/c/en/us/products/ios-nx-os-software/ios-netflow/index.html (accessed on 23 August 2025).
- Hwang, R.-H.; Lee, C.-L.; Lin, Y.-D.; Lin, P.-C.; Wu, H.-K.; Lai, Y.-C.; Chen, C.-K. Host-based intrusion detection with multi-datasource and deep learning. J. Inf. Secur. Appl. 2023, 78, 103625. [Google Scholar] [CrossRef] [Scilit]
- Liu, A.; Martin, C.; Hetherington, T.; Matzner, S. A comparison of system call feature representations for insider threat detection. In Proceedings of the Sixth Annual IEEE SMC Information Assurance Workshop, West Point, NY, USA, 15–17 June 2005; pp. 340–347. [Google Scholar]
- Moore, K.L.; Bihl, T.J.; Bauer, K.W., Jr.; Dube, T.E. Feature extraction and feature selection for classifying cyber traffic threats. J. Def. Model. Simul. 2017, 14, 217–231. [Google Scholar] [CrossRef] [Scilit]
- Kocyigit, E.; Korkmaz, M.; Sahingoz, O.K.; Diri, B. Real-time content-based cyber threat detection with machine learning. In Proceedings of the International Conference on Intelligent Systems Design and Applications, Online, 12–15 December 2020; pp. 1394–1403. [Google Scholar]
- Ali, W.A.; Sandhya, P.; Roccotelli, M.; Fanti, M.P. A comparative study of current dataset used to evaluate intrusion detection system. Int. J. Eng. Appl. 2022, 10, 336. [Google Scholar] [CrossRef] [Scilit]
- Jaiswal, A.; Dwivedi, P.; Dewang, R.K. Handling imbalance dataset issue in insider threat detection using machine learning methods. Comput. Electr. Eng. 2024, 120, 109726. [Google Scholar] [CrossRef] [Scilit]
- Maciá-Fernández, G.; Camacho, J.; Magán-Carrión, R.; García-Teodoro, P.; Therón, R. UGR ‘16: A new dataset for the evaluation of cyclostationarity-based network IDSs. Comput. Secur. 2018, 73, 411–424. [Google Scholar] [CrossRef] [Scilit]
- Saisana, M.; Saltelli, A.; Tarantola, S. Uncertainty and sensitivity analysis techniques as tools for the quality assessment of composite indicators. J. R. Stat. Soc. Ser. A Stat. Soc. 2005, 168, 307–323. [Google Scholar] [CrossRef] [Scilit]
- Ali Abd Al-Hameed, K. Spearman’s correlation coefficient in statistical analysis. Int. J. Nonlinear Anal. Appl. 2022, 13, 3249–3255. [Google Scholar]
- Agarwal, M. Detecting flooding, impersonation and injection attacks on AWID dataset using ml based methods. In Proceedings of the 2022 IEEE 4th International Conference on Cybernetics, Cognition and Machine Learning Applications (ICCCMLA), Goa, India, 8–9 October 2022; pp. 221–226. [Google Scholar]
- Peterson, J.M.; Leevy, J.L.; Khoshgoftaar, T.M. A review and analysis of the bot-iot dataset. In Proceedings of the 2021 IEEE International Conference on Service-Oriented System Engineering (SOSE), Virtual, 23–26 August 2021; pp. 20–27. [Google Scholar]
- Sharafaldin, I.; Lashkari, A.H.; Hakak, S.; Ghorbani, A.A. Developing realistic distributed denial of service (DDoS) attack dataset and taxonomy. In Proceedings of the 2019 International Carnahan Conference on Security Technology (ICCST), Chennai, India, 1–3 October 2019; pp. 1–8. [Google Scholar]
- Kim, Y.; Hakak, S.; Ghorbani, A. DDoS attack dataset (CICEV2023) against EV authentication in charging infrastructure. In Proceedings of the 2023 20th Annual international conference on privacy, security and trust (PST), Copenhagen, Denmark, 21–23 August 2023; pp. 1–9. [Google Scholar]
- Kapil, D.; Mittal, V.; Gangodkar, D. Evaluating machine learning approaches for DDoS attack detection using CIC-DDoS2019. In Proceedings of the 2024 Second International Conference on Advanced Computing & Communication Technologies (ICACCTech), Rai, India, 16–17 November 2024; pp. 762–767. [Google Scholar]
- Stiawan, D.; Idris, M.Y.B.; Bamhdi, A.M.; Budiarto, R. CICIDS-2017 dataset feature analysis with information gain for anomaly detection. IEEE Access 2020, 8, 132911–132921. [Google Scholar] [CrossRef] [Scilit]
- Songma, S.; Sathuphan, T.; Pamutha, T. Optimizing intrusion detection systems in three phases on the CSE-CIC-IDS-2018 dataset. Computers 2023, 12, 245. [Google Scholar] [CrossRef] [Scilit]
- Dadkhah, S.; Neto, E.C.P.; Ferreira, R.; Molokwu, R.C.; Sadeghi, S.; Ghorbani, A.A. CICIoMT2024: A benchmark dataset for multi-protocol security assessment in IoMT. Internet Things 2024, 28, 101351. [Google Scholar] [CrossRef] [Scilit]
- Neto, E.C.P.; Taslimasa, H.; Dadkhah, S.; Iqbal, S.; Xiong, P.; Rahman, T.; Ghorbani, A.A. CICIoV2024: Advancing realistic IDS approaches against DoS and spoofing attack in IoV CAN bus. Internet Things 2024, 26, 101209. [Google Scholar] [CrossRef] [Scilit]
- Liu, L.; Engelen, G.; Lynar, T.; Essam, D.; Joosen, W. Error prevalence in nids datasets: A case study on cic-ids-2017 and cse-cic-ids-2018. In Proceedings of the 2022 IEEE Conference on Communications and Network Security (CNS), Austin, TX, USA, 3–5 October 2022; pp. 254–262. [Google Scholar]
- Patil, A.; Deshpande, A. Evaluating ML models on CTU-13 and IOT-23 Datasets. In Proceedings of the 2023 International Conference on Advanced Computing Technologies and Applications (ICACTA), Mumbai, India, 6–7 October 2023; pp. 1–6. [Google Scholar]
- Cowan, C. Defcon capture the flag: Defending vulnerable code from intense attack. In Proceedings of the DARPA Information Survivability Conference and Exposition, Washington, DC, USA, 22–24 April 2003; pp. 71–72. [Google Scholar]
- Marques, C.; Malta, S.; Magalhães, J.P. DNS dataset for malicious domains detection. Data Brief 2021, 38, 107342. [Google Scholar] [CrossRef] [Scilit]
- Rani, S.; Sharma, A.; Zohaib, M. Study for integrating IoT-IDS datasets: Machine and deep learning for secure IoT network system. In Proceedings of the 28th International Conference on Evaluation and Assessment in Software Engineering, Salerno, Italy, 18–21 June 2024; pp. 686–691. [Google Scholar]
- Soheily-Khah, S.; Marteau, P.-F.; Béchet, N. Intrusion Detection in Network Systems Through Hybrid Supervised and Unsupervised Mining Process-a Detailed Case Study on the ISCX Benchmark Dataset; Elsevier: Amsterdam, The Netherlands, 2017. [Google Scholar]
- Shiravi, A.; Shiravi, H.; Tavallaee, M.; Ghorbani, A.A. Intrusion Detection Evaluation Dataset (ISCXIDS2012). 2012. Available online: http://www.unb.ca/cic/datasets/ids.html (accessed on 27 January 2025).
- Özgür, A.; Erdem, H. A review of KDD99 dataset usage in intrusion detection and machine learning between 2010 and 2015. PeerJ Prepr. 2016, 4, e1954v1. [Google Scholar]
- Song, J.; Takakura, H.; Okabe, Y.; Eto, M.; Inoue, D.; Nakao, K. Statistical analysis of honeypot data and building of Kyoto 2006+ dataset for NIDS evaluation. In Proceedings of the first workshop on building analysis datasets and gathering experience returns for security, Salzburg, Austria, 10 April 2011; pp. 29–36. [Google Scholar]
- Damasevicius, R.; Venckauskas, A.; Grigaliunas, S.; Toldinas, J.; Morkevicius, N.; Aleliunas, T.; Smuikys, P. LITNET-2020: An annotated real-world network flow dataset for network intrusion detection. Electronics 2020, 9, 800. [Google Scholar] [CrossRef] [Scilit]
- Hindy, H.; Bayne, E.; Bures, M.; Atkinson, R.; Tachtatzis, C.; Bellekens, X. Machine learning based IoT intrusion detection system: An MQTT case study (MQTT-IoT-IDS2020 dataset). In Proceedings of the International networking conference, Virtual, 21 September 2020; pp. 73–84. [Google Scholar]
- Sarhan, M.; Layeghy, S.; Portmann, M. Towards a standard feature set for network intrusion detection system datasets. Mob. Netw. Appl. 2022, 27, 357–370. [Google Scholar] [CrossRef] [Scilit]
- Su, T.; Sun, H.; Zhu, J.; Wang, S.; Li, Y. BAT: Deep learning methods on network intrusion detection using NSL-KDD dataset. IEEE Access 2020, 8, 29575–29585. [Google Scholar] [CrossRef] [Scilit]
- Cao, Z.; Zhao, Z.; Shang, W.; Ai, S.; Shen, S. Using the ToN-IoT dataset to develop a new intrusion detection system for industrial IoT devices. Multimed. Tools Appl. 2024, 84, 16425–16453. [Google Scholar] [CrossRef] [Scilit]
- Thakkar, A.; Lohiya, R. A survey on intrusion detection system: Feature selection, model, performance measures, application perspective, challenges, and future research directions. Artif. Intell. Rev. 2022, 55, 453–563. [Google Scholar] [CrossRef] [Scilit]
- Tavallaee, M.; Bagheri, E.; Lu, W.; Ghorbani, A.A. A detailed analysis of the KDD CUP 99 data set. In Proceedings of the 2009 IEEE Symposium on Computational Intelligence for Security and Defense Applications, Ottawa, ON, Canada, 8–10 July 2009; pp. 1–6. [Google Scholar]
- Sharafaldin, I.; Lashkari, A.H.; Ghorbani, A.A. Toward generating a new intrusion detection dataset and intrusion traffic characterization. ICISSP 2018, 1, 108–116. [Google Scholar] [CrossRef] [Scilit]
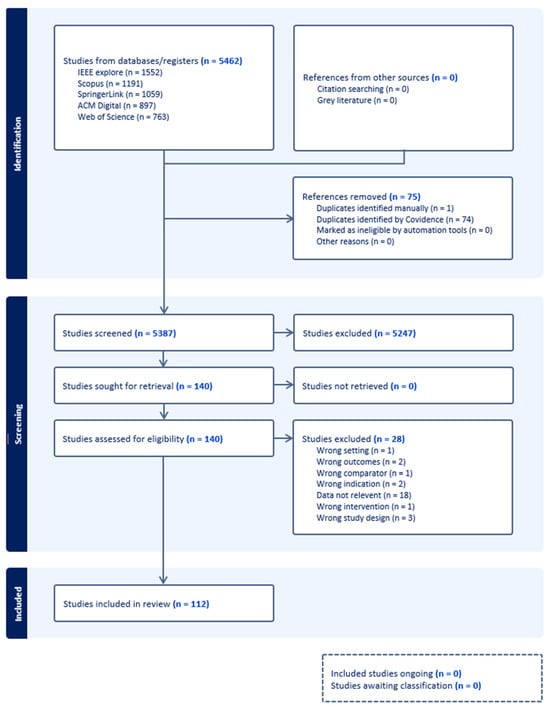
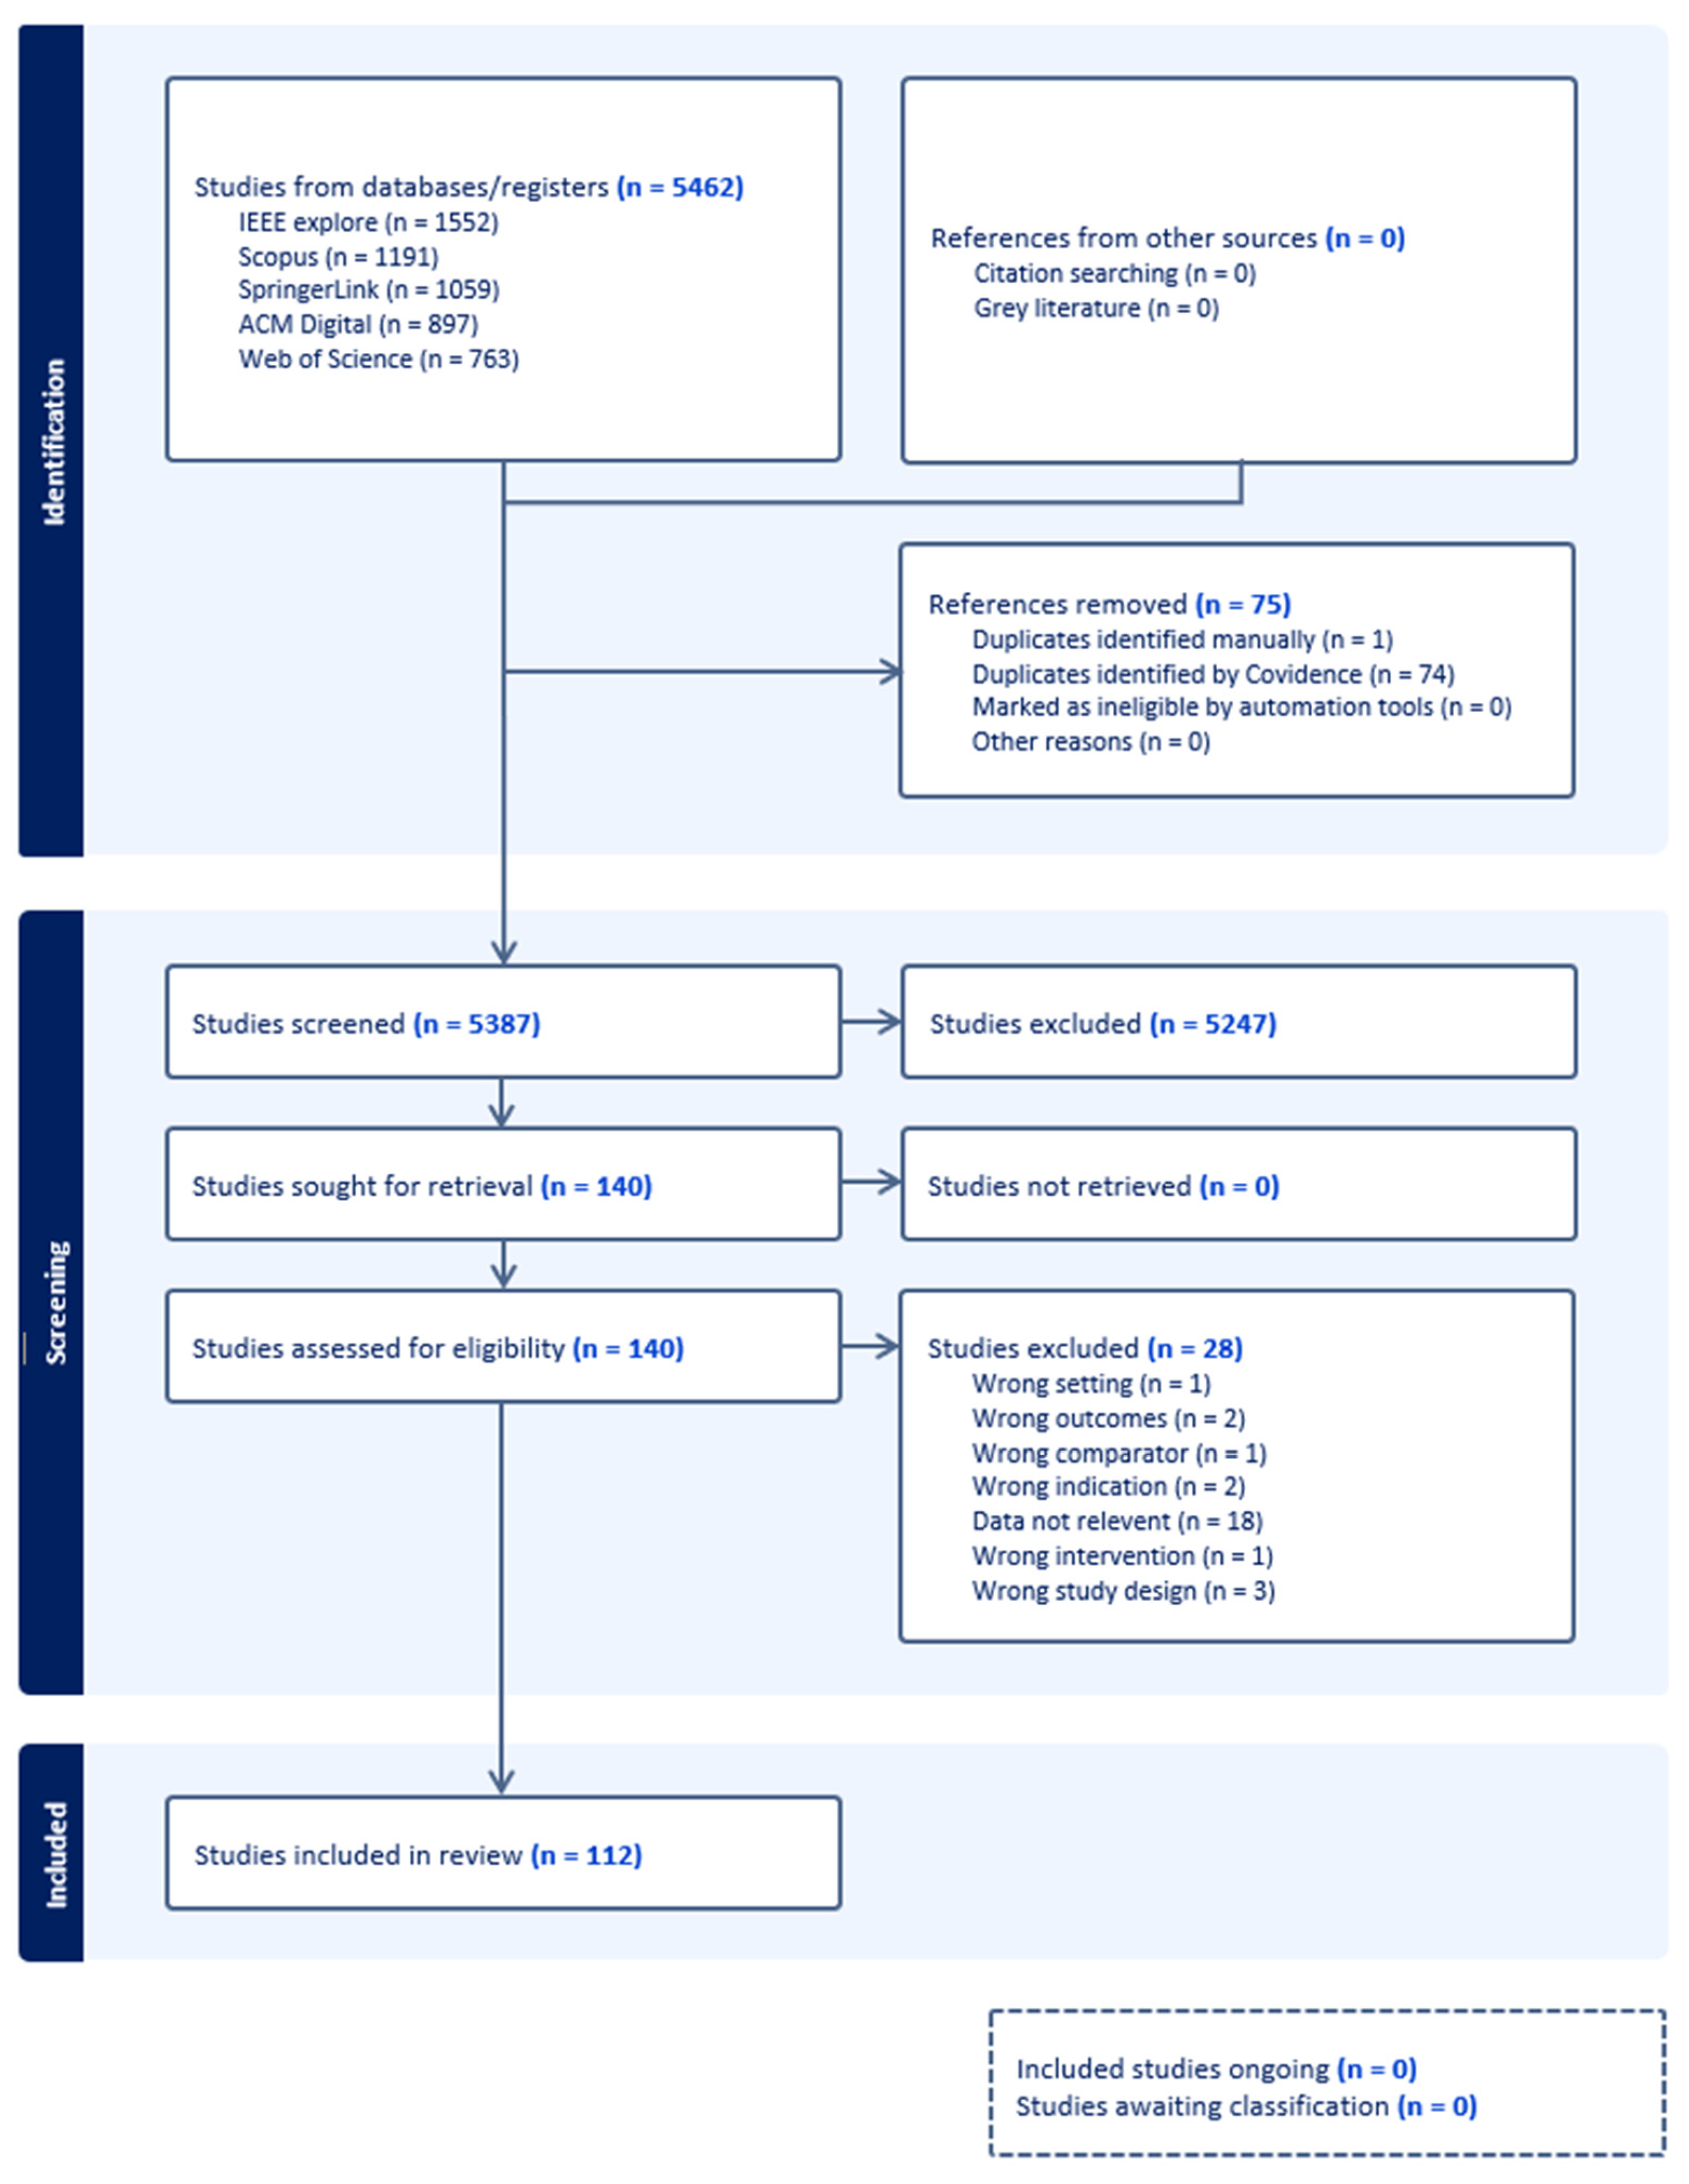
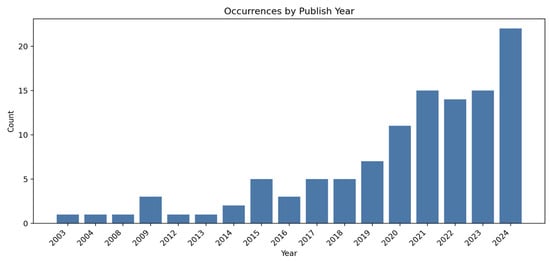
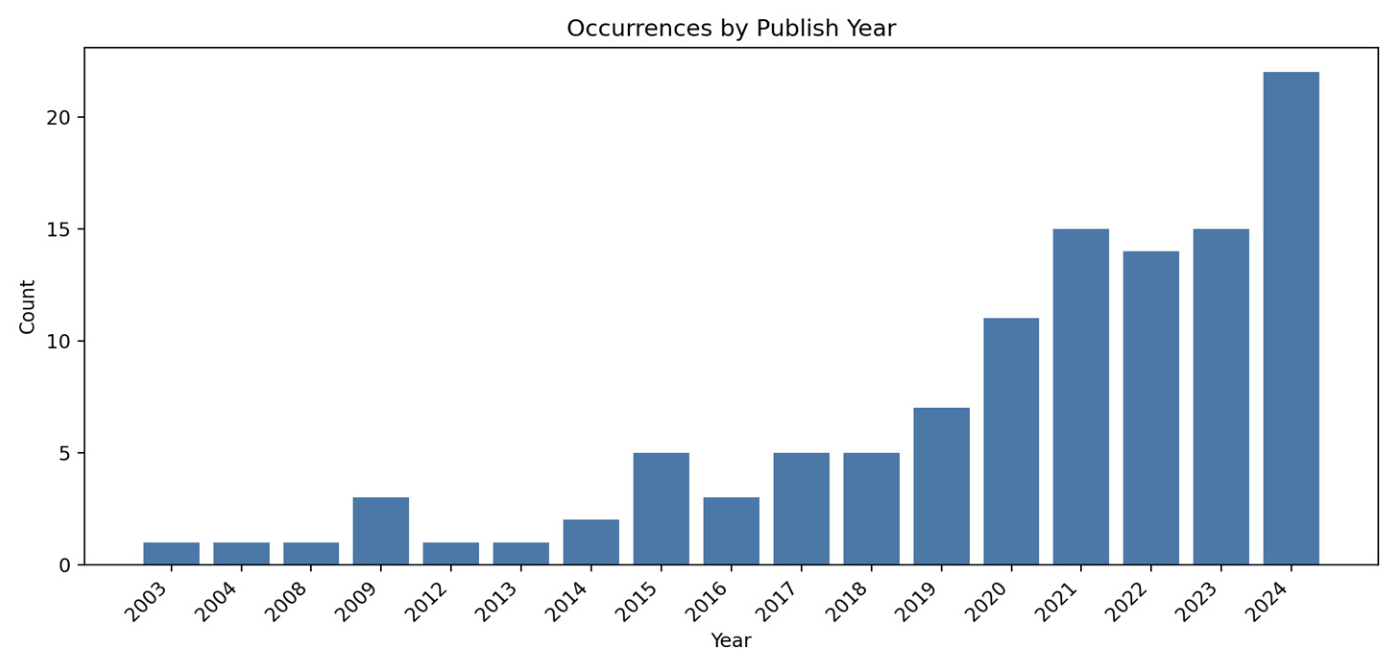
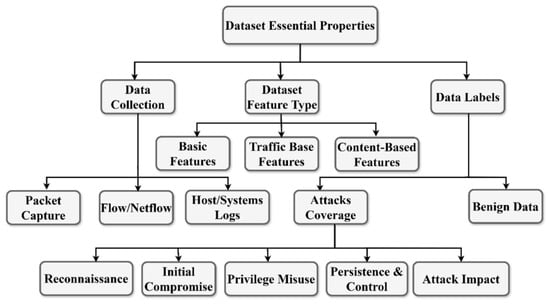
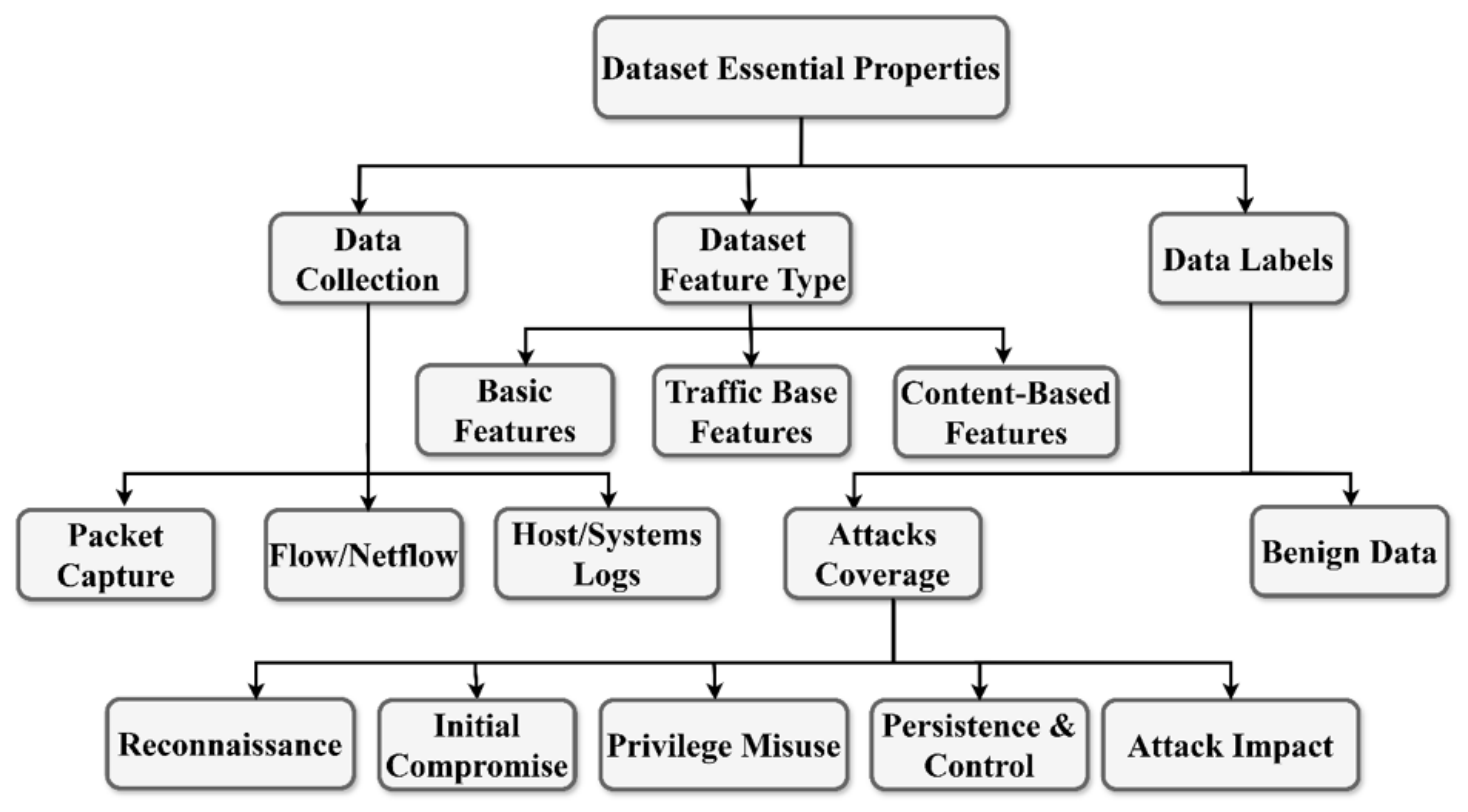
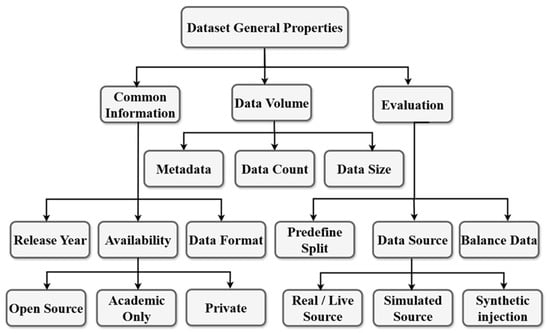
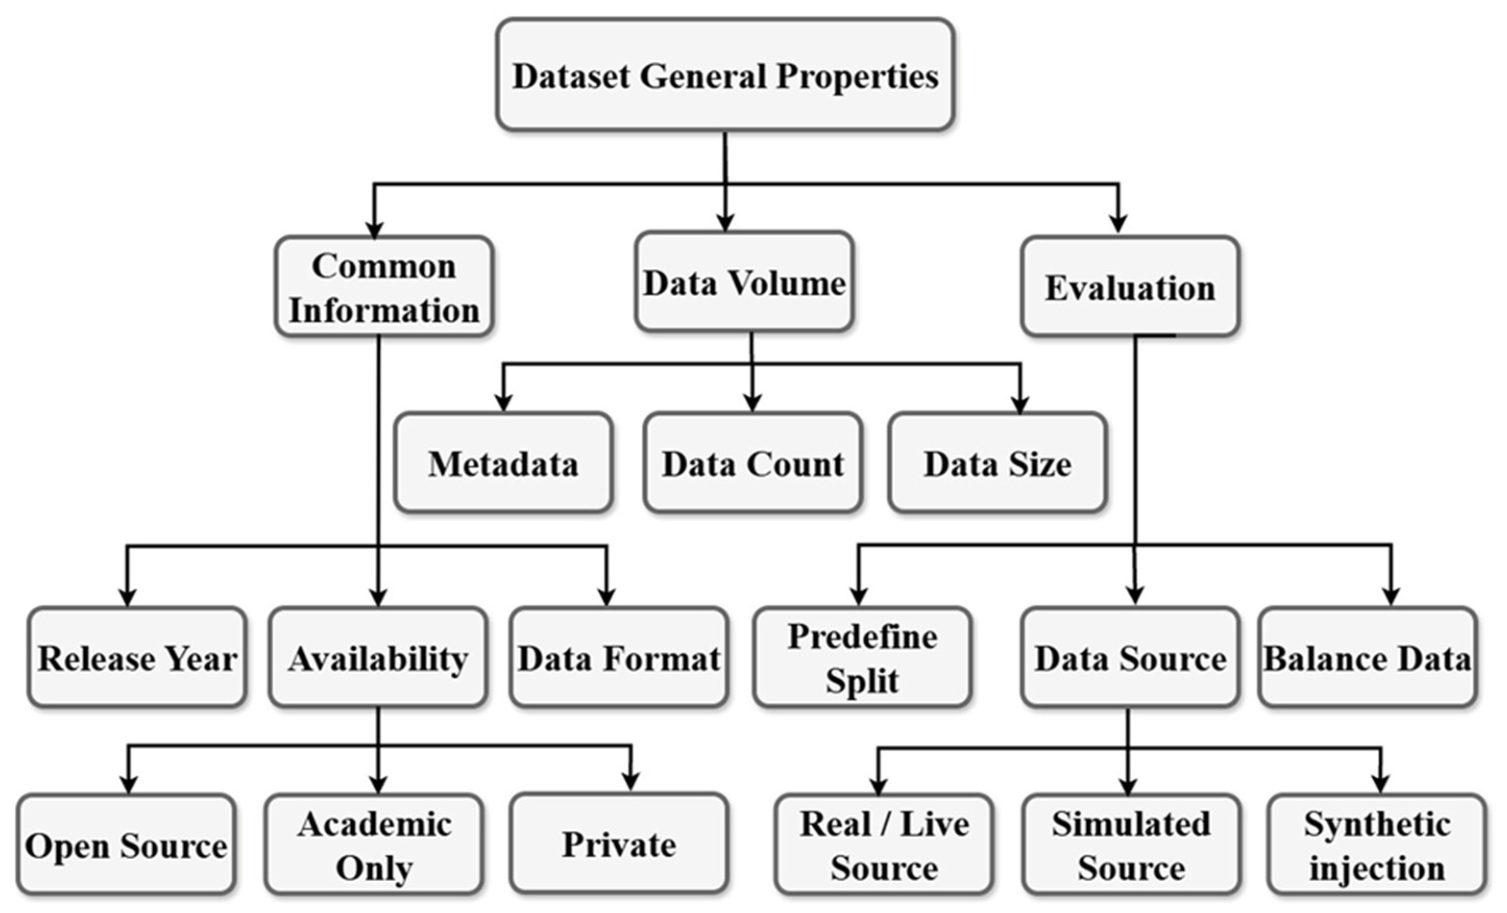
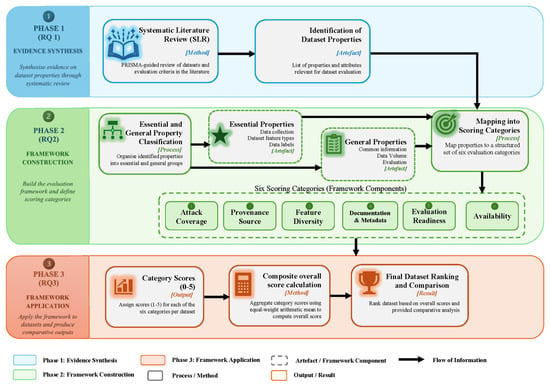
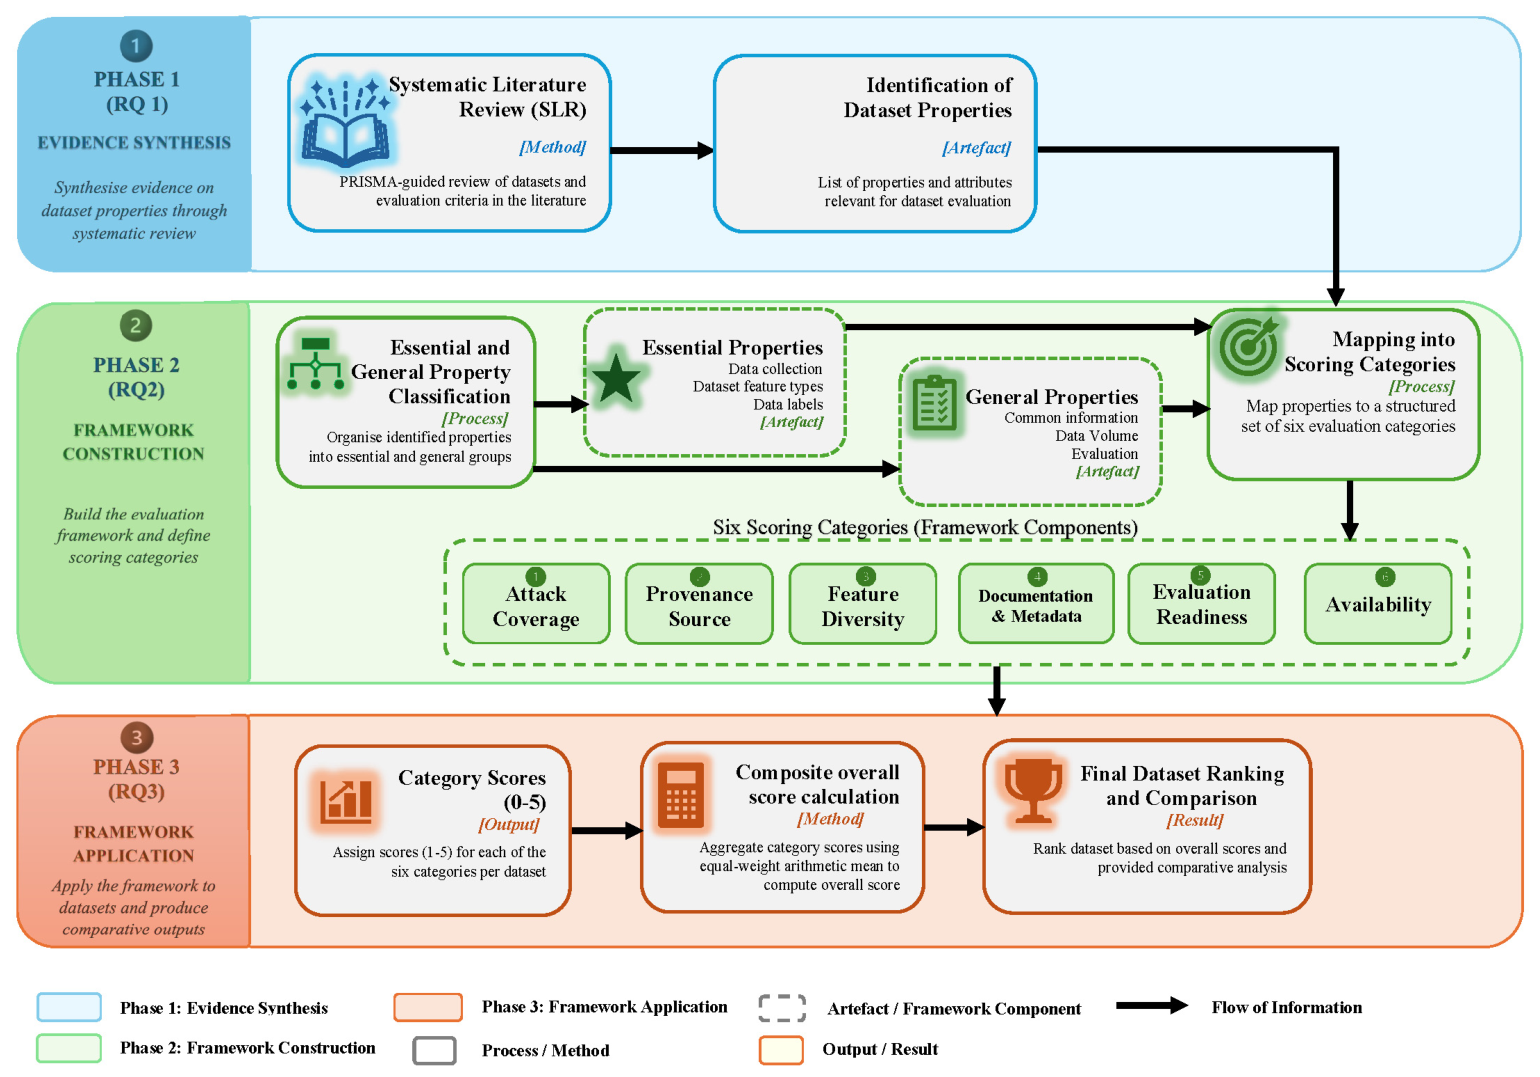
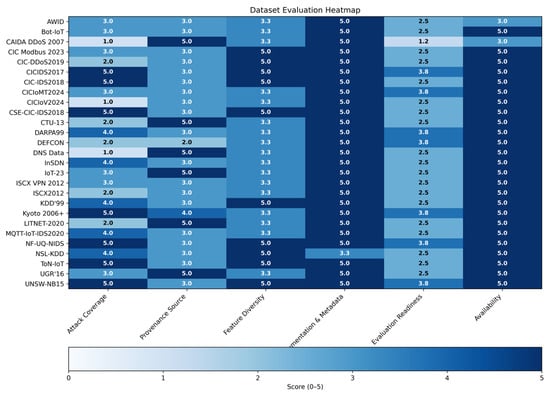
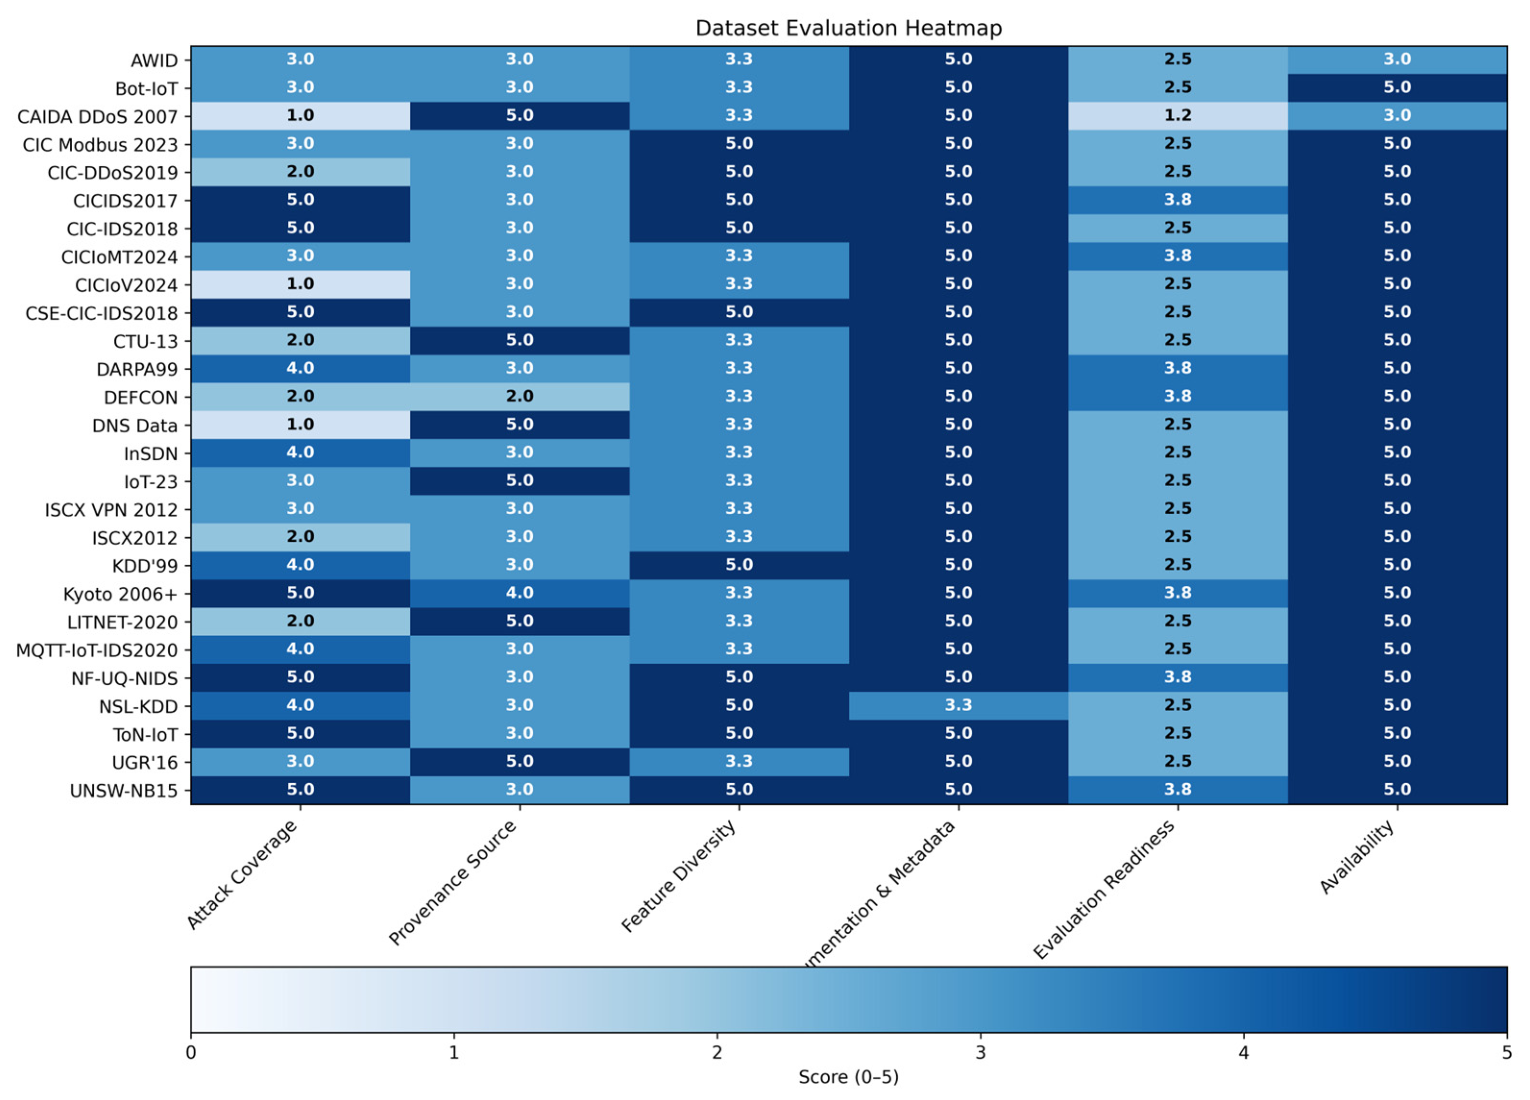
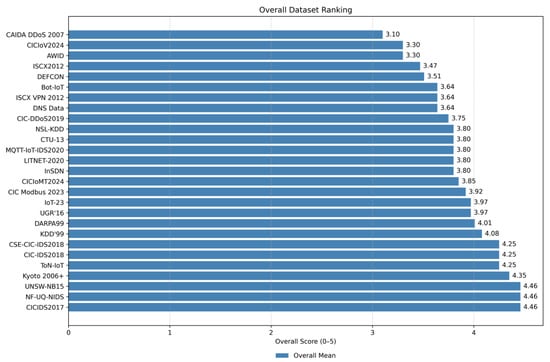
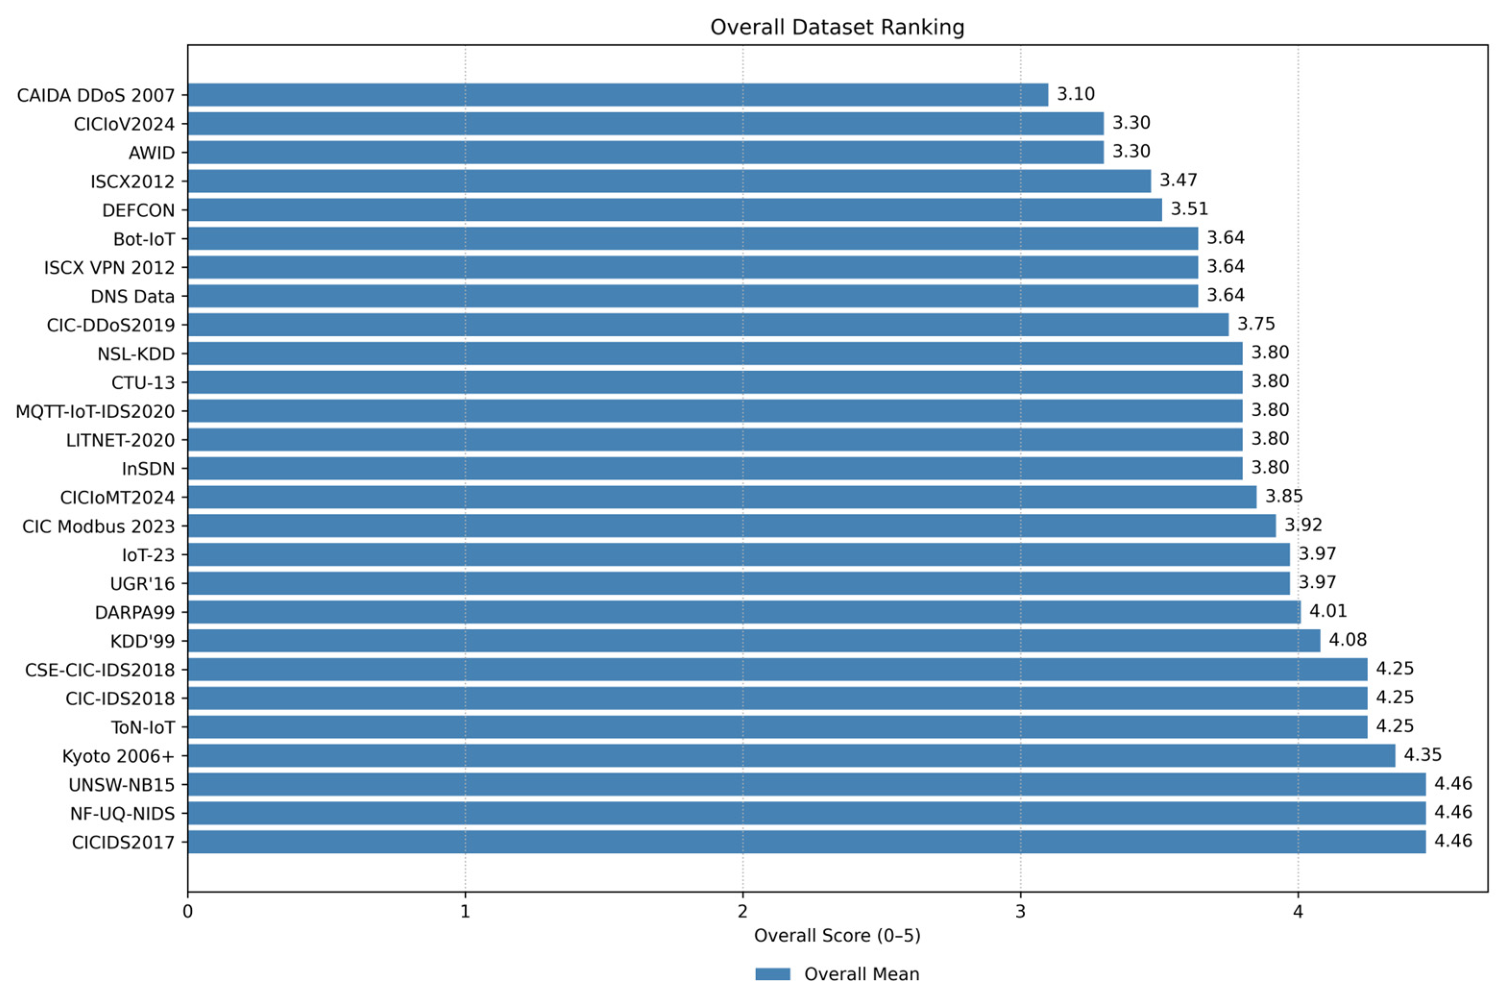
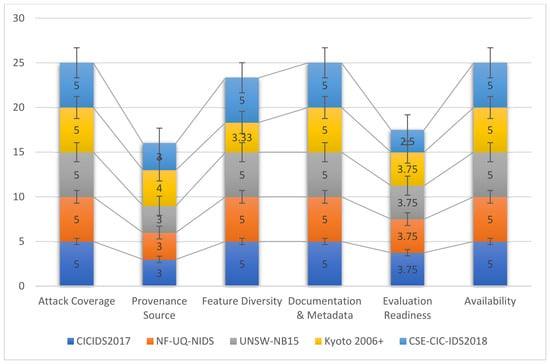
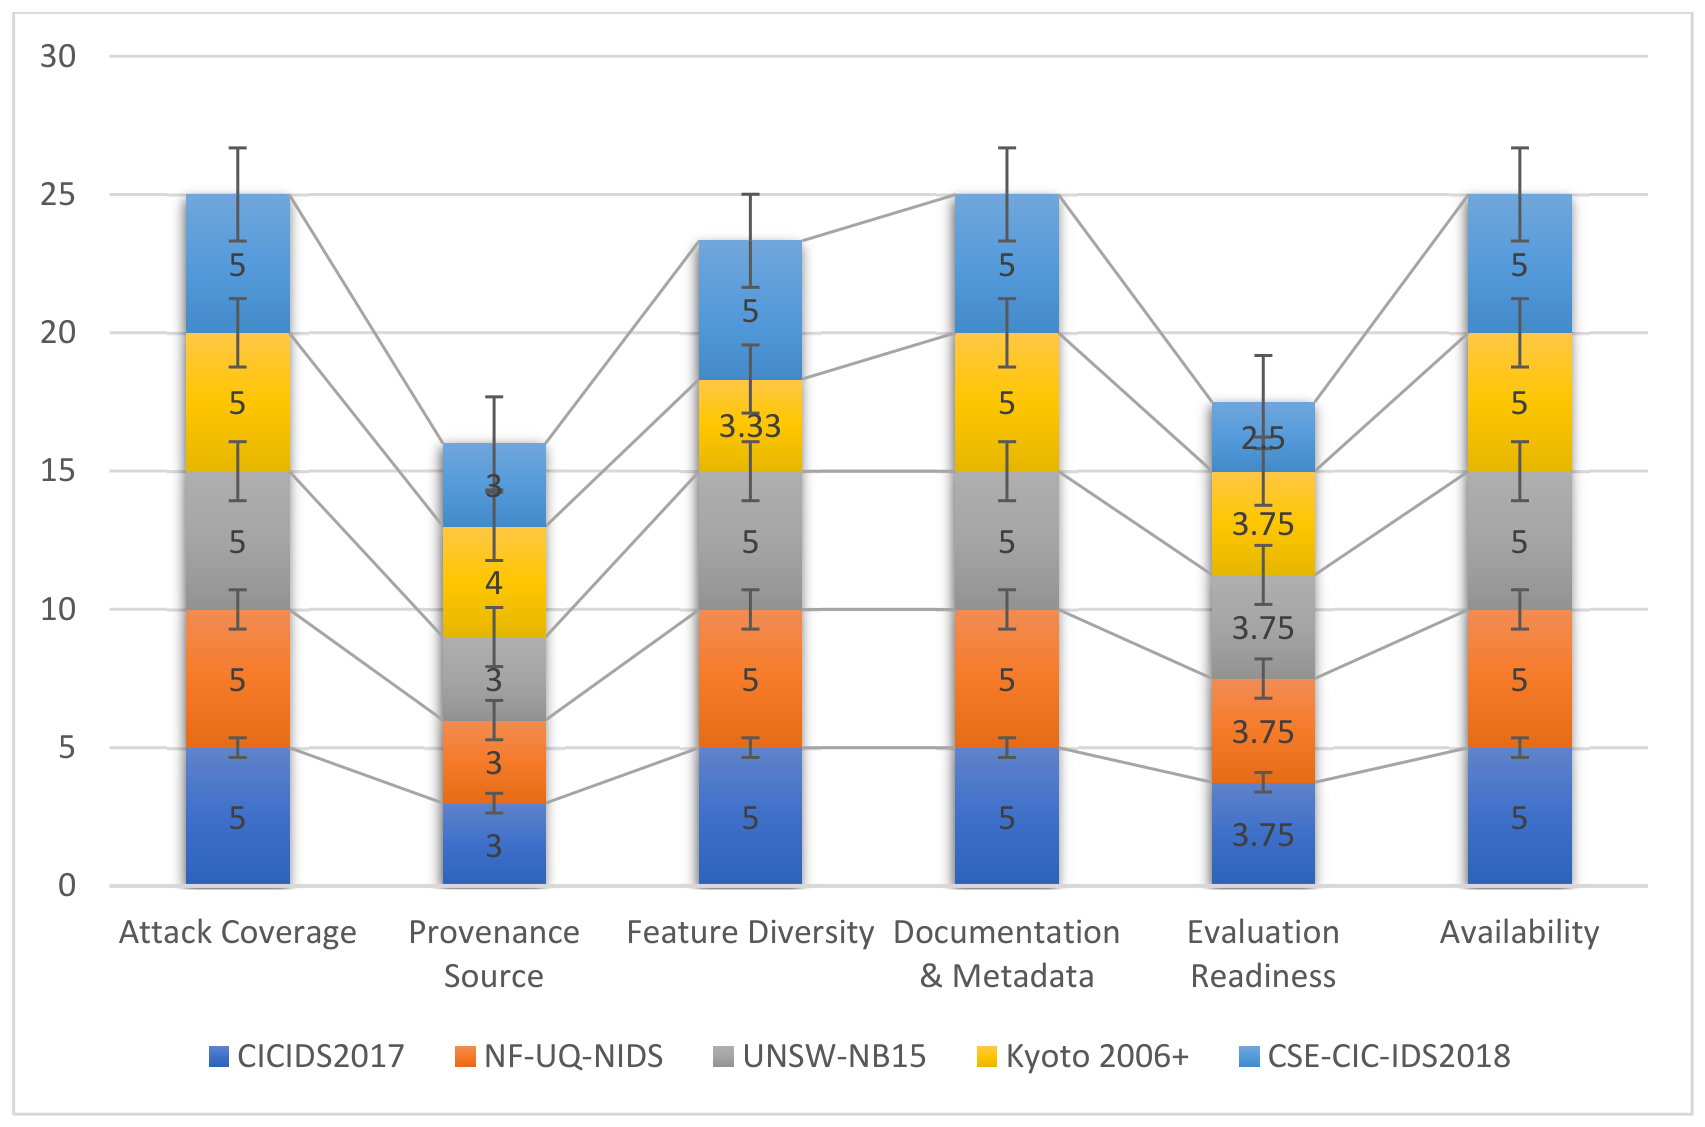

Disclaimer/Publisher’s Note: The statements, opinions and data contained in all publications are solely those of the individual author(s) and contributor(s) and not of MDPI and/or the editor(s). MDPI and/or the editor(s) disclaim responsibility for any injury to people or property resulting from any ideas, methods, instructions or products referred to in the content. |
© 2026 by the authors. Licensee MDPI, Basel, Switzerland. This article is an open access article distributed under the terms and conditions of the Creative Commons Attribution (CC BY) license.