


Abstract
The selection of vertical conveyor systems is a complex decision problem in transport, warehousing, and logistics infrastructure, requiring simultaneous consideration of capacity, energy demand, space utilization, and operational flexibility. This study develops the Self-Monitoring Adaptive Ranking Technique Based on Balanced Additive Weighting (SMART-BAW), an adaptive multi-criteria decision-making (MCDM) framework designed to support the evaluation and ranking of vertical conveyor alternatives. The proposed method introduces a balance-control mechanism that adjusts the influence of performance deviations according to the variability of the decision matrix, reducing the dominance of extreme criterion values and favoring alternatives with more balanced overall performance. Objective criterion weights are derived using the entropy method. The applicability of the framework is demonstrated through a case study involving different vertical conveyor technologies used in logistics and material handling operations. The results highlight trade-offs between continuous and intermittent conveying solutions, particularly regarding throughput, energy efficiency, footprint, and functional adaptability. The ranking results are validated through comparison with TOPSIS, VIKOR, EDAS, MARCOS, and RAWEC, while sensitivity analysis confirms ranking stability under changes in the adaptive balance coefficient and criterion-weight scenarios. The proposed framework provides a transparent and computationally efficient decision-support tool for sustainable logistics infrastructure planning.
1. Introduction
Efficient material handling represents one of the key challenges in modern industrial, transport, and logistics systems [1,2,3,4]. Increasing demands for higher throughput, reduced energy consumption, improved space utilization, and operational flexibility require the development of advanced transport solutions capable of operating efficiently under complex and dynamic conditions [5,6,7]. In warehouses, production facilities, and distribution centers, vertical transport systems play a particularly important role due to their ability to utilize vertical space while minimizing the occupied floor area.
Modern warehouse and material handling systems increasingly rely on compact system configurations in order to improve space utilization and operational efficiency [8]. The increasing complexity of modern logistics infrastructure requires systematic evaluation approaches capable of simultaneously considering multiple operational and sustainability-related criteria [9,10]. The evaluation of conveyor systems requires comprehensive decision-making frameworks capable of integrating throughput, energy consumption, space utilization, and operational flexibility criteria [11,12]. Recent studies in transport infrastructure have also applied multi-stage quantitative frameworks to evaluate passenger and freight efficiency and to identify the influence of heterogeneous operational and external factors [13].
Among various material handling technologies, vertical conveyors have gained significant attention because they enable efficient transportation of unit loads between different height levels while supporting high levels of automation and integration within logistics systems [14,15,16]. Different types of vertical conveyors, including inclined belt conveyors, elevators, paternoster conveyors, vertiveyors, and vertical indexing conveyors, exhibit substantially different operational characteristics in terms of throughput, energy requirements, floor footprint, transport continuity, and operational flexibility. Consequently, selecting the most suitable conveyor system represents a complex engineering decision-making problem involving multiple and often conflicting criteria [17,18,19,20,21].
To support such decisions, multi-criteria decision-making (MCDM) methods have been widely applied in engineering and infrastructure systems [17,22]. Established approaches such as Technique for Order of Preference by Similarity to Ideal Solution (TOPSIS) [23], VlseKriterijumska Optimizacija I Kompromisno Resenje (VIKOR) [24], Evaluation Based on Distance from Average Solution (EDAS) [25,26], Measurement of Alternatives and Ranking According to Compromise Solution (MARCOS) [27,28,29], and Ranking Alternatives with Weights of Criterion (RAWEC) [30] provide structured frameworks for evaluating alternatives under multiple criteria [31,32,33,34]. Recent studies additionally introduced advanced fuzzy and hybrid MCDM extensions [35]. Numerous recent extensions of established MCDM methodologies, including Multi-Attributive Border Approximation Area Comparison (MABAC)-based formulations, have also been proposed in the literature [36]. Recent studies have additionally proposed compact and computationally efficient engineering-oriented MCDM methodologies for operational performance evaluation, such as the Square-Root Based Evaluation Method (SREM) [37]. However, many existing methods involve multi-stage computational procedures, distance calculations, or complex ranking mechanisms, which may reduce transparent evaluation logic and practical applicability in engineering environments [19,20,29,38].
At the same time, simpler aggregation-based approaches often fail to adequately address the issue of performance imbalance across criteria [39,40]. In practical engineering systems, alternatives characterized by extremely high performance in a single criterion may still represent suboptimal solutions if they simultaneously exhibit poor performance in other important aspects [1,5,6,41]. Therefore, there is a need for decision-support methods that preserve computational simplicity while explicitly accounting for balanced performance across criteria [31,32]. Recent studies have additionally emphasized the importance of parsimonious and computationally efficient MCDM structures for practical engineering applications [42].
Recent developments in smart logistics and intelligent infrastructure systems have increased the demand for adaptive decision-support approaches capable of responding to varying operational conditions. Conventional MCDM methods typically employ fixed aggregation structures and predefined parameters that may not adequately capture differences in the balance and dispersion of alternative performances. Consequently, there is a growing need for self-monitoring and adaptive evaluation frameworks that dynamically adjust their decision logic according to the structural characteristics of the decision matrix while maintaining computational simplicity and transparency.
Motivated by these limitations, this study proposes SMART-BAW (Self-Monitoring Adaptive Ranking Technique Based on Balanced Additive Weighting), a novel MCDM method that combines weighted aggregation with an adaptive balance-adjustment mechanism designed to favor more balanced alternatives. Unlike conventional approaches that employ fixed balancing parameters, SMART-BAW dynamically determines the balance coefficient according to the dispersion characteristics of the evaluated alternatives, thereby reducing the influence of extreme criterion values and improving ranking robustness. The analysis considers multiple performance criteria, including throughput, energy consumption, maximum throughput, floor footprint, and bidirectional operational capability. Criterion weights are determined using the entropy method to ensure objective evaluation [7,32,43].
The main contributions of this study can be summarized as follows:
- Development of SMART-BAW, a novel self-monitoring adaptive MCDM method based on weighted aggregation and balance correction;
- Introduction of an adaptive balance-adjustment mechanism that dynamically determines the balancing coefficient according to the dispersion characteristics of alternatives;
- Application of the proposed SMART-BAW method to the evaluation of vertical conveyor systems in transport and logistics infrastructure;
- Comparative analysis with established MCDM approaches, including TOPSIS, VIKOR, EDAS, MARCOS, and RAWEC;
- Verification of ranking robustness through sensitivity and correlation analyses.
2. Research Framework
The conceptual research framework of the proposed SMART-BAW methodology for the evaluation of vertical conveyor systems in transport and logistics infrastructure is illustrated in Figure 1.
Figure 1.
Research Framework of the Proposed SMART-BAW Methodology.
The framework integrates the definition of conveyor alternatives and evaluation criteria, entropy-based criterion weighting, SMART-BAW evaluation, comparative analysis, and sensitivity analysis within a unified decision-making procedure.
The remainder of the paper is organized as follows. Section 3 presents the engineering background and case study of vertical conveyor systems. Section 4 introduces the conceptual foundation and mathematical formulation of the proposed SMART-BAW method. Section 5 presents the application results, comparative analysis, and sensitivity analyses. Finally, Section 6 summarizes the main conclusions, limitations, and directions for future research.
3. Vertical Conveyor Case Study
Recent advances in warehouse automation, e-commerce logistics, and high-density storage systems have significantly increased the importance of vertical conveyor technologies in modern transport and logistics infrastructure [11,44,45]. Continuous and intermittent vertical conveyors are increasingly applied in automated warehouses, multi-level distribution centers, and manufacturing systems due to their ability to improve throughput, reduce occupied floor area, and support flexible material flow integration [46,47]. Consequently, the selection of appropriate vertical conveyor systems has become an important engineering decision-making problem involving operational efficiency, energy consumption, spatial utilization, and automation compatibility [11].
Five types of vertical conveyors were considered in this study: inclined belt conveyor, elevator, paternoster continuous vertical conveyor, vertiveyor continuous vertical conveyor, and vertical indexing conveyor.
The load lifting height was defined as h = 3 m, with a nominal conveyor speed of v = 0.5 m/s according to the operational conditions adopted from previous studies [14,15].
The analysis assumes a parcel mass (load) of mP = 30 kg and parcel dimensions of aP × bP × hP = 0.5 × 0.4 × 0.35 m.
The same operating conditions and load characteristics were adopted for all considered conveyor systems to ensure objective comparative evaluation.
The conveyor systems were evaluated at their feasible nominal operating points under common load and lifting conditions; throughput was intentionally not equalized because it represents an explicit evaluation criterion C1, while imposing identical throughput would require technology-specific system reconfiguration.
3.1. Inclined Belt Conveyor
An inclined belt conveyor with an inclination angle of δ = 30 degrees (Figure 2) was considered in this study, enabling safe vertical transport of unit loads to the required lifting height. The conveyor employs an EP160/2 belt with a width of Bbelt = 0.5 m, while the rotary roller length is Broll = 0.6 m.
Figure 2.
Scheme of the inclined belt conveyor. Arrows indicate the direction of material flow.
The packages are positioned transversely on the belt with a spacing of Δt = 0.5 m, resulting in a parcel pitch of t = 1 m (Figure 2). Under these operating conditions, the conveyor achieves a throughput of Q = 1800 items/h, corresponding to a mass flow rate of Qm = 54 t/h, with a required motor power of P = 0.53 kW.
The conveyor speed can be increased up to vmax = 2.0 m/s while reducing the minimum parcel spacing to Δtmin = 0.1 m. Under these conditions, the maximum throughput reaches Qmax = 12,000 items/h, corresponding to Qm(max) = 360 t/h, with a required motor power of Pmax = 3.6 kW.
The estimated floor footprint of the inclined belt conveyor is approximately A = 6.5–7 m2.
Although larger inclination angles are technically feasible under specific operating conditions, they were not considered within the scope of this study.
3.2. Elevator for Small Loads
The main advantage of the elevator system is its minimal floor footprint compared to continuous vertical conveyors (Figure 3). Elevators operate as intermittent transport systems using a single carrier platform moving vertically between loading and unloading positions.
Figure 3.
Scheme of the elevator.
The considered elevator configuration is intended for small loads up to 75–100 kg.
Two operating modes were analyzed in this study:
- Nominal operating mode with v = 0.5 m/s;
- High-performance operating mode with vmax = 1.3 m/s.
The maximum speed was selected considering practical operational limitations associated with acceleration and deceleration phases, noise generation, and mechanical loading.
At the nominal lifting speed, the elevator achieves a throughput of Q = 230 items/hour, corresponding to a mass flow rate of Qm = 6.9 t/h with a required motor power of P = 0.2 kW.
Under the high-performance operating mode, the maximum throughput increases to Qmax = 330 items/h with a corresponding motor power requirement of Pmax = 0.51 kW.
The estimated floor footprint of the elevator system is approximately A = 0.6–0.75 m2 which represents the smallest occupied area among all considered conveyor systems.
3.3. Paternoster—Continuous Vertical Conveyor
Paternoster conveyors (Figure 4) are continuous vertical transport systems widely used in industrial, production, and warehousing environments due to their compact design and operational flexibility [14].
Figure 4.
Scheme of the paternoster-type vertical conveyor.
A major advantage of paternoster conveyors is their capability for continuous bidirectional transport, enabling simultaneous upward and downward movement of different loads. In addition, these systems can be integrated with horizontal and inclined conveyors to form combined transport solutions.
Under the operating conditions considered in this study, the paternoster conveyor achieves a throughput of Q = 1800 items/h with a required motor power of P = 0.56 kW [14].
The maximum throughput is obtained by increasing the number of carriers while maintaining constant conveyor speed, resulting in Qmax = 2530 items per hour [14]. Further increase in lifting speed is technically possible; however, the resulting improvement in throughput is expected to be limited.
The estimated floor footprint of the paternoster conveyor is approximately A = 1.25–1.75 m2, which is larger than that of elevator systems but substantially smaller than inclined belt conveyors.
3.4. Vertiveyor—Continuous Vertical Conveyor
Continuous vertical conveyors, commonly referred to as vertiveyors, are designed for uninterrupted vertical transport of unit loads [15]. Two principal configurations are commonly used: the “S/Z” configuration, in which the conveying direction remains unchanged between infeed and discharge levels, and the “C” configuration (Figure 5), characterized by reversed conveying direction and more complex kinematics.
Figure 5.
Scheme of the vertiveyor (“S” type). Arrows indicate the direction of material flow.
Vertiveyors may employ chain drives or reinforced toothed belts with tension cords. Under the operating conditions considered in this study, the vertiveyor achieves a throughput of Q = 1800 items/hour with a required motor power of P = 0.54 kW [15]. The maximum throughput reaches Qmax = 2520 items/hour, by increasing the conveyor speed to vmax = 0.7 m/s. The estimated floor footprint of the vertiveyor system is approximately A = 2 m2 which is slightly larger than that of the paternoster conveyor while still maintaining relatively compact spatial requirements.
3.5. Vertical Indexing Conveyors
Vertical indexing conveyors (Figure 6) may operate either in continuous mode or in sequential (indexing) mode. These systems transport products in a single direction while providing multiple infeed and discharge points, enabling high operational flexibility and compact spatial integration.
Figure 6.
Vertical indexing conveyors scheme. Black arrows indicate infeed/outfeed directions, while white and gray arrows indicate upward and downward platform movement, respectively.
The operational parameters were analyzed for a lifting speed of v = 0.5 m/s. The twin-platform pitch is defined according to the parcel dimensions, infeed displacement, and safety clearance requirements.
In sequential operating mode, the conveyor periodically stops during loading and unloading operations. Under the considered operating conditions, the throughput reaches Q = 1320 items/hour, corresponding to a mass flow rate of Qm = 39.5 t/h with a required motor power of P = 0.43 kW.
In continuous operating mode, the use of high-speed pushers enables increased throughput up to Qmax = 2400 items/hour.
Although higher lifting speeds are technically feasible, further speed increase would require larger platform pitch and would additionally complicate the unloading process, thereby limiting practical throughput improvement.
The estimated floor footprint of the vertical indexing conveyor is approximately A = 1.3–1.5 m2 indicating relatively compact spatial requirements combined with moderate throughput capability and operational flexibility.
Based on the presented engineering and operational characteristics of the considered conveyor systems, a multi-criteria evaluation framework was constructed to enable systematic comparative analysis. The identified operational differences among the considered conveyor alternatives directly formed the basis for the selection of evaluation criteria and decision matrix construction employed within the proposed SMART-BAW framework. Furthermore, the variability of alternative performances provides the foundation for the adaptive balance-adjustment mechanism introduced in the proposed methodology.
3.6. Evaluation Criteria and Data Basis
Based on the engineering and operational characteristics of the five conveyor systems presented in Section 3.1, Section 3.2, Section 3.3, Section 3.4 and Section 3.5, five evaluation criteria were defined for the subsequent multi-criteria analysis. Their meaning, measurement scale, optimization direction, and data basis are summarized in Table 1.
Table 1.
Evaluation Criteria and Data Basis for Vertical Conveyor Systems.
The quantitative values of criteria C1–C4 were obtained from the engineering characteristics and operating conditions described in Section 3.1, Section 3.2, Section 3.3, Section 3.4 and Section 3.5, whereas criterion C5 was evaluated using an engineering-based normalized assessment described in Section 5.1.
4. Development of the SMART-BAW Method
Existing multi-criteria decision-making methods frequently rely either on weighted aggregation, distance from ideal solutions, or deviation-based evaluation principles [22,25,27,28,29,30,31,32,38], including recent weighting-oriented approaches such as the Best-Worst Method [48]. Although these approaches provide valuable decision-support capabilities, they may exhibit limitations in practical engineering applications characterized by strong performance imbalance across criteria [39,40].
In transport and logistics infrastructure, alternatives demonstrating extremely high performance in one criterion may still represent suboptimal solutions if they simultaneously exhibit weak performance in other important operational aspects [2,3,4]. Consequently, there is a need for an evaluation framework capable of preserving compact computational structure, clear ranking rationale, and practical engineering applicability while explicitly accounting for performance balance [22,31,32,38,43,49].
To address the identified limitations of existing MCDM approaches, the present study proposes SMART-BAW (Self-Monitoring Adaptive Ranking Technique Based on Balanced Additive Weighting), an adaptive MCDM method that combines weighted aggregation with a self-monitoring balance-adjustment mechanism. The proposed approach preserves computational simplicity while dynamically adapting the balance correction according to the dispersion characteristics of evaluated alternatives [30,39,40].
4.1. Conceptual Foundation of the SMART-BAW Method
Multi-criteria decision-making problems inherently involve the simultaneous consideration of multiple and often conflicting criteria. In engineering systems, decision-makers are frequently required to identify solutions that achieve not only high overall performance, but also satisfactory balance across different operational, economic, and technical aspects.
Traditional additive aggregation models primarily evaluate alternatives according to their total weighted performance [30,31,43,49,50]. Although such approaches are computationally simple and highly interpretable, they may lead to biased rankings when an alternative exhibits extremely high performance in a single criterion while simultaneously underperforming in others. Unlike classical SAW models that evaluate only cumulative weighted performance, the SMART-BAW method simultaneously integrates aggregation and dispersion penalization within a unified compact scoring structure. In practical engineering applications, these unbalanced solutions may reduce operational reliability, flexibility, or long-term efficiency.
The conceptual foundation of the proposed SMART-BAW method is based on the assumption that reliable ranking should simultaneously account for two complementary evaluation perspectives:
- Overall criterion performance;
- Balance of performance across criteria.
In addition, the SMART-BAW framework incorporates a self-monitoring adaptive mechanism that dynamically regulates the influence of balance correction according to the dispersion characteristics of alternatives. This adaptive component enables the methodology to adjust the penalization intensity without requiring predefined fixed balancing assumptions, thereby increasing flexibility and robustness across different decision-making environments.
Figure 7 conceptually illustrates the SMART-BAW decision space, where alternatives are simultaneously evaluated according to overall weighted performance and criterion imbalance. Preferred alternatives are located in the region characterized by high aggregation performance and low dispersion across criteria. Consequently, alternatives positioned closer to the lower-right region of the decision space achieve larger SMART-BAW scores.
Figure 7.
General conceptual representation of the SMART-BAW decision space illustrating the trade-off between weighted performance and criterion imbalance.
The first component reflects the direct contribution of normalized and weighted criterion values to the overall evaluation. This principle is consistent with classical weighted aggregation models and ensures that alternatives with higher overall performance receive larger scores [51,52].
The second component introduces a balance-oriented evaluation mechanism [39,40,43]. In the proposed formulation, performance imbalance is quantified using the standard deviation of normalized criterion values. Alternatives characterized by large discrepancies between criteria are interpreted as less balanced and are therefore penalized within the evaluation process [53].
In engineering and logistics systems, well-balanced alternatives are often preferable to highly specialized alternatives dominated by a single criterion. For example, a vertical conveyor system with extremely high throughput may still represent an unfavorable solution if it simultaneously requires excessive floor space or exhibits poor operational flexibility. Consequently, the proposed balance correction mechanism improves the practical relevance of the obtained rankings.
Conceptually, the SMART-BAW method combines additive aggregation with an explicit mechanism for controlling performance imbalance. Unlike distance-based methods such as TOPSIS or compromise-based approaches such as VIKOR [54], the proposed method does not require ideal solutions, Euclidean distances, or multi-stage ranking procedures. Furthermore, unlike deviation-based methods such as EDAS, the balance effect is incorporated directly within a compact scoring structure. The proposed decision space therefore differs from ideal-distance geometries used in TOPSIS-like approaches. As a result, the proposed SMART-BAW methodology provides a transparent and interpretable evaluation framework suitable for engineering and infrastructure decision-making problems [49,55].
To provide a concise structured comparison with established MCDM approaches, the principal evaluation characteristics of the methods considered in this study are summarized in Table 2.
Table 2.
Conceptual characteristics of the compared MCDM methods.
The comparison shows that the benchmark methods employ different ranking principles, but they do not explicitly regulate performance imbalance according to the dispersion structure of the decision matrix. SMART-BAW differs by combining weighted aggregation with an adaptive balance correction whose intensity is determined directly from the characteristics of the evaluated alternatives. This provides an explicit mechanism for moderating the influence of strongly unbalanced performance while preserving a compact and transparent computational structure.
4.2. Mathematical Formulation of the SMART-BAW Method
The proposed SMART-BAW method is formulated within a normalized decision space and combines weighted aggregation with a balance correction mechanism. Let the multi-criteria decision problem be represented by:
as a set of alternatives,
as a set of criteria,
as the initial decision matrix, and
as the vector of criterion weights satisfying
The final SMART-BAW score of alternative Ai is defined as:
where
represents the weighted aggregation component, while
where Di represents the balance measure based on the standard deviation of normalized criterion performances of alternative Ai, while denotes the mean normalized performance value of alternative Ai.
The adaptive balance coefficient α controls the influence of the balance correction term. In the proposed SMART-BAW framework, α is adaptively determined according to the dispersion characteristics of the evaluated alternatives, enabling dynamic adjustment of the balance penalization intensity.
where represents the average dispersion of all alternatives and Dmax denotes the maximum observed dispersion.
The adaptive coefficient combines two complementary characteristics of the dispersion structure. The average dispersion reflects the overall imbalance of the decision matrix but considered alone may underrepresent an isolated highly unbalanced alternative. Conversely, Dmax captures the most pronounced imbalance, but its exclusive use could make the coefficient overly sensitive to a single extreme alternative. Therefore, their arithmetic mean was adopted as a parsimonious compromise between global and extreme dispersion, without introducing additional calibration parameters.
Furthermore, since the normalized criterion values satisfy rij ∈ [0, 1], the standard deviation used to calculate Di is bounded by
0 ≤ Di
≤ 0.5.
Consequently,
and the adaptive coefficient defined by Equation (10) satisfies
Thus, the endogenous SMART-BAW formulation naturally restricts the balance coefficient to a moderate range, ensuring that the balance correction remains a complementary component rather than dominating the weighted aggregation term.
This adaptive formulation enables the balance coefficient to automatically respond to the structural characteristics of the decision matrix. The adaptive coefficient formulation was intentionally designed as a simple self-monitoring mechanism that simultaneously considers both the average dispersion of all alternatives and the maximum observed imbalance within the decision set. In this way, the coefficient represents a compromise between the overall dispersion structure of the decision matrix and the most pronounced imbalance case, enabling adaptive yet computationally efficient regulation of the balance-correction intensity. Consequently, alternatives evaluated in highly dispersed decision environments receive stronger balance correction, while more homogeneous decision environments result in lower penalization intensity. The proposed formulation was intentionally selected to preserve methodological simplicity while avoiding the need for additional calibration procedures or external tuning parameters.
Lower values of Di indicate more balanced criterion performance, whereas larger values correspond to alternatives characterized by greater variability among normalized criterion performances. The standard deviation was selected due to its low computational complexity and intuitive interpretation of performance dispersion across criteria. Furthermore, standard deviation simultaneously captures both the magnitude and distribution of criterion deviations within a single compact measure.
The conceptual interpretation of the SMART-BAW decision space is illustrated later through the application phase of the methodology.
This ensures that the balance correction acts as a complementary evaluation component while preserving the dominant influence of overall weighted performance.
The SMART-BAW methodology consists of four computational stages:
- Normalization of the decision matrix;
- Weighted aggregation;
- Balance measure calculation;
- Calculation of the final SMART-BAW score.
The following subsections describe each stage of the proposed method in detail.
4.2.1. Normalization of the Decision Matrix
Since the considered evaluation criteria are expressed in different units and scales, the initial decision matrix must first be transformed into a dimensionless form [56]. This ensures comparability between criteria and prevents dominance caused solely by differences in measurement units.
The initial decision matrix , defined in Equation (3), is transformed into a dimensionless form.
The SMART-BAW method employs min–max normalization in order to transform all criterion values into the interval [0, 1], where larger normalized values indicate better performance.
For benefit criteria, the normalized value is calculated as:
where max(xj) and min (xj) represent the maximum and minimum values of criterion Cj, respectively.
For cost criteria, normalization is performed as:
This transformation ensures that lower values of cost criteria correspond to higher normalized scores.
The resulting normalized matrix is denoted as:
where all values satisfy:
The normalization procedure represents an essential stage of the proposed methodology because it establishes a common evaluation scale for all considered criteria [57]. Furthermore, the normalized matrix serves as the basis for both weighted aggregation and balance measure calculation in subsequent stages of the SMART-BAW method.
4.2.2. SMART-BAW Aggregation and Adaptive Balance Correction
After normalization of the decision matrix, the overall performance of each alternative is evaluated through weighted aggregation of normalized criterion values. This component represents the primary evaluation mechanism of the proposed SMART-BAW method.
After normalization of the decision matrix, the overall performance of each alternative is evaluated through weighted aggregation of normalized criterion values. The normalized decision matrix is given by Equation (13), while the criterion-weight vector and its normalization condition are defined by Equations (4) and (5), respectively. The weighted aggregation value Wi is calculated according to Equation (7), where:
- Wi denotes the aggregated performance score of alternative Ai;
- wj represents the weight of criterion Cj;
- rij is the normalized value of alternative Ai with respect to criterion Cj.
The weighted aggregation term reflects the overall performance level of the considered alternative. Higher values of Wi indicate better overall criterion satisfaction.
However, weighted aggregation alone may favor alternatives characterized by extremely high performance in a single criterion while simultaneously underperforming in others. To address this limitation, the proposed SMART-BAW method introduces a balance correction mechanism based on the standard deviation of normalized criterion values. The balance measure Di and the mean normalized criterion value are defined by Equations (8) and (9), respectively.
Lower values of Di indicate more balanced performance across criteria, whereas larger values correspond to alternatives characterized by greater variability among criterion performances.
The final SMART-BAW score is calculated according to Equation (6), where α\alpha is the adaptive balance coefficient controlling the penalization intensity. The adaptive coefficient α\alpha is automatically determined from the dispersion structure of the decision matrix according to Equation (10). Consequently, the penalization intensity adjusts to the variability of the evaluated alternatives while preserving the dominant influence of overall weighted performance.
The adaptive coefficient α is automatically determined from the dispersion structure of the decision matrix. Consequently, the penalization intensity adjusts to the variability of the evaluated alternatives while preserving the dominant influence of overall weighted performance.
5. Results and Discussion
The proposed SMART-BAW methodology was applied to the evaluation and ranking of five vertical conveyor systems commonly used in transport and logistics infrastructure. The considered alternatives differ significantly in terms of operational principle, throughput, energy requirements, spatial characteristics, and operational flexibility.
The objective of the analysis is to identify the most balanced conveyor solution considering multiple engineering and operational criteria simultaneously.
5.1. Decision Matrix Construction
The decision matrix was constructed using the five vertical conveyor alternatives described in Section 3.1, Section 3.2, Section 3.3, Section 3.4 and Section 3.5: A1—inclined belt conveyor, A2—elevator, A3—paternoster conveyor, A4—vertiveyor, and A5—vertical indexing conveyor. The evaluation criteria C1–C5 and their data basis are defined in Section 3.6.
While criteria C1–C4 are based on quantitative engineering and operating data, criterion C5 represents bidirectional transport capability and operational flexibility, which cannot be directly expressed in physical units. Therefore, its values were determined using an engineering-based normalized assessment within the interval [0, 1], where larger values indicate higher bidirectional transport capability and operational flexibility. The assessment was based on the engineering characteristics of the considered conveyor systems, including transport continuity, bidirectional capability, and operational integration flexibility.
The C5 values were assigned by the authors through an engineering-based assessment of the technical and operational characteristics described in Section 3.1, Section 3.2, Section 3.3, Section 3.4 and Section 3.5; no formal external expert panel or aggregation of independent expert judgments was employed.
To improve the transparency and reproducibility of the C5 assessment, an anchored engineering scale was adopted. Bidirectional transport capability was considered the primary characteristic, while transport continuity and operational integration flexibility were used as secondary differentiating factors. Ai value of 1.00 represents the highest level of bidirectional and operational capability, whereas values close to 0.10 represent predominantly unidirectional systems with limited directional flexibility (Table 3). A resolution of 0.05 was used to distinguish alternatives with similar qualitative characteristics.
Table 3.
Engineering-Based Assessment of Criterion C5.
The assigned C5 values should be interpreted as relative engineering scores representing the qualitative differences among the considered conveyor configurations rather than as directly measurable physical quantities. Bidirectional transport capability was treated as the primary assessment characteristic, while transport continuity and operational integration flexibility were used as secondary differentiating factors. For alternatives with similarly limited bidirectional capability, secondary operational characteristics were used to distinguish their scores. Accordingly, the small difference between A1 (0.20) and A4 (0.15) reflects their comparable directional limitations, with A1 receiving a slightly higher score due to its greater operational adjustability under the considered configuration. The assessment refers specifically to the conveyor configurations analyzed in this study and should not be interpreted as a universal rating of the corresponding conveyor technologies.
The resulting C5 values, together with the quantitative values of criteria C1–C4, were used to construct the decision matrix presented in Table 4.
Table 4.
Decision matrix for vertical conveyor evaluation.
The selected criteria simultaneously reflect transport efficiency, energy performance, spatial utilization, and operational flexibility. Such a combination enables comprehensive evaluation of vertical conveyor systems under realistic engineering conditions [12,44,46].
5.2. Determination of Criterion Weights
Criterion weights were determined using the entropy weighting method in order to ensure objective evaluation based on the informational content of the decision matrix [7,33,43,58].
The entropy method assigns larger weights to criteria characterized by greater variability across alternatives, since such criteria possess higher discriminatory power within the decision-making process [59]. The obtained entropy weights are presented in Table 5.
Table 5.
Entropy-based criterion weights.
The larger entropy weights of C2 and C5 reflect their greater dispersion and discriminatory information within the present decision matrix. Accordingly, these weights are dataset-specific and should not be interpreted as universal measures of criterion importance.
5.3. SMART-BAW Results and Ranking
The decision matrix was first normalized using the min–max normalization procedure described in Section 4.2.1.
Subsequently, weighted aggregation values Wi, balance measures Di, and final SMART-BAW scores Si were calculated for all considered alternatives (Table 6).
Table 6.
SMART-BAW calculation results.
The adaptive balance coefficient was determined using the SMART-BAW formulation introduced in Section 4.2.
For the considered decision matrix, the average dispersion and maximum dispersion were obtained as = 0.4232 and Dmax = 0.4899, respectively. Therefore, according to Equation (10),
The obtained value lies close to the upper bound of the endogenous interval [0, 0.5], indicating a relatively pronounced dispersion of criterion performances among the considered conveyor alternatives.
Based on the dispersion characteristics of the evaluated alternatives, the obtained adaptive coefficient value was α = 0.4566. This value ensures adaptive penalization intensity while preserving the dominant influence of the weighted aggregation component.
The results demonstrate that the proposed SMART-BAW methodology effectively differentiates alternatives according to both overall performance and balance of criterion satisfaction. Figure 8 shows the positions of the alternatives in the SMART-BAW decision space, where Wi denotes the weighted aggregation score, Di the balance penalty, and Si = Wi − αDi the final SMART-BAW score.
Figure 8.
Practical positioning of the considered alternatives within the SMART-BAW decision space.
The alternatives were ranked in descending order according to the obtained SMART-BAW scores. The final ranking is:
A2 > A3 > A1 > A5 > A4
The ranking reflects the combined effect of overall weighted performance and the balance penalty. Alternative A2 achieves the highest final SMART-BAW score because its high weighted aggregation value outweighs the applied balance penalty. Alternative A3 ranks second, while A1 occupies the third position despite its exceptionally high maximum throughput. Alternatives A4 and A5 obtain lower final scores primarily because of their lower overall weighted performance. These results demonstrate that SMART-BAW evaluates the trade-off between overall performance and performance imbalance rather than favoring either component independently.
The obtained ranking demonstrates the practical importance of incorporating performance balance into engineering decision-making. Similar ranking-oriented decision-support frameworks have recently been applied to transport technology evaluation, including electric vehicle assessment under fuzzy environments [60]. Alternatives characterized by exceptionally high performance in a single criterion do not necessarily represent optimal solutions when evaluated across multiple operational requirements simultaneously. By integrating weighted aggregation with adaptive balance correction, the SMART-BAW methodology reduces the dominance of extreme criterion values and promotes more robust and practically applicable solutions.
Overall, the results confirm that the proposed SMART-BAW method successfully combines overall performance assessment with adaptive balance-oriented evaluation. The methodology provides a computationally efficient, transparent, and practically meaningful decision-support framework for engineering applications in transport and logistics infrastructure while preserving interpretability and robustness of the obtained rankings.
5.4. Comparative Analysis with Established MCDM Methods
To further evaluate the effectiveness and reliability of the proposed SMART-BAW method, a comparative analysis was performed using several well-established multi-criteria decision-making approaches, namely TOPSIS, VIKOR, EDAS, MARCOS, and RAWEC [25,26,27,29,30]. All methods were applied using the same decision matrix and entropy-based criterion weights in order to ensure objective and consistent comparison.
The purpose of the comparative analysis is twofold and consistent with recent comparative MCDM validation studies [61,62,63]:
- To evaluate the consistency of the proposed SMART-BAW ranking structure relative to established MCDM methods;
- To examine the ability of the proposed approach to reduce the influence of extreme criterion values while preserving simpler computational structure.
The growing popularity of MABAC-based and hybrid fuzzy MCDM models in engineering decision-making further confirms the relevance of comparative validation studies [64]. The obtained ranking results are presented in Table 7.
Table 7.
Comparative ranking results.
The ranking results show that the proposed SMART-BAW method produces the ranking [65]:
which is fully consistent with the rankings obtained using the EDAS and VIKOR method, and highly similar to the rankings produced by MARCOS and RAWEC. The adaptive balance-adjustment mechanism slightly differentiates the ranking of the two lowest-performing alternatives (A4 and A5), while preserving the overall ranking structure.
A2 > A3 > A1 > A5 > A4
In contrast, TOPSIS identifies alternative A1 as the best solution. This difference can be explained by the extremely high maximum throughput value of the inclined belt conveyor, which strongly affects distance-based evaluation methods. Since TOPSIS emphasizes closeness to the ideal solution, alternatives characterized by extreme values in dominant criteria may achieve disproportionately high rankings.
TOPSIS is more appropriate when proximity to an ideal solution is the primary decision principle, whereas SMART-BAW is more suitable when balanced performance across criteria and reduced sensitivity to isolated extreme values are decision priorities.
A quantitative decomposition of the TOPSIS distance confirms this effect. For alternative A1, criterion C3 (maximum throughput) accounts for approximately 94.9% of the squared weighted distance from the negative ideal solution. This dominant contribution is mainly caused by the exceptionally high C3 value of 12,000 items/h compared with the remaining alternatives. In contrast, SMART-BAW evaluates A1 using both its aggregated performance and its internal performance dispersion. For A1, the weighted aggregation value is W1 = 0.3727, while the dispersion measure is D1 = 0.4596. With the adaptively determined coefficient α = 0.4566, the corresponding balance penalty is αD1 = 0.2098, resulting in a final SMART-BAW score of S1 = 0.1629. Consequently, A1 remains in the third position despite its extreme advantage in maximum throughput.
To further examine the influence of the extreme C3 value, an additional stress-test was performed by reducing the maximum throughput of A1 while keeping the remaining decision data and criterion weights unchanged. When C3 for A1 equals 12,000 items/h, TOPSIS ranks A1 first. Reducing this value to 9000 items/h moves A1 to the second position, while at 8000 items/h A1 falls to the third position. In contrast, SMART-BAW preserves the same ranking A2 > A3 > A1 > A5 > A4 in all three scenarios. This result quantitatively demonstrates the higher sensitivity of TOPSIS to the extreme C3 value and the ability of SMART-BAW to moderate the influence of a single dominant criterion.
The proposed SMART-BAW method reduces the influence of extreme criterion values through an adaptive balance-correction mechanism, promoting more balanced alternatives. This is consistent with recent developments in adaptive MCDM methodologies that emphasize dynamic ranking mechanisms for improving decision robustness under varying evaluation conditions [66].
The comparative analysis therefore confirms that the proposed SMART-BAW methodology behaves consistently with established MCDM approaches while simultaneously providing:
- Transparent ranking logic;
- Direct balance control;
- Computational simplicity;
- Reduced sensitivity to extreme values;
- Ranking robustness.
These properties make the proposed method particularly suitable for engineering and infrastructure decision-making problems where practical applicability and transparency are essential.
5.5. Spearman Rank Correlation Analysis
In order to further evaluate the consistency and reliability of the proposed SMART-BAW method, Spearman rank correlation analysis was conducted between the rankings generated by SMART-BAW and those obtained using established MCDM approaches, namely TOPSIS, VIKOR, EDAS, MARCOS, and RAWEC [67].
The Spearman rank correlation coefficient measures the degree of agreement between ranking structures produced by different decision-making methods [67,68,69]. Correlation values close to 1 indicate strong positive agreement, whereas lower values reflect larger deviations between ranking results. The obtained correlation coefficients are presented in Table 8.
Table 8.
Spearman rank correlation matrix.
The correlation structure demonstrates that the proposed SMART-BAW method behaves consistently with established compromise- and aggregation-based MCDM approaches while simultaneously reducing the influence of dominant criterion effects commonly observed in distance-based methods such as TOPSIS.
Perfect agreement was observed between SMART-BAW, EDAS, and VIKOR, which produced identical ranking structures for the considered case study. Furthermore, very high correlation coefficients were obtained between SMART-BAW and both MARCOS and RAWEC, confirming the overall consistency and robustness of the proposed methodology.
In contrast, lower correlation values were identified between SMART-BAW and TOPSIS. This behavior can be explained by the sensitivity of TOPSIS to criterion dominance and ideal-solution proximity. In the analyzed case study, the exceptionally high maximum throughput of the inclined belt conveyor strongly influences the TOPSIS ranking structure, resulting in alternative A1 being identified as the best-performing solution.
The proposed SMART-BAW methodology mitigates this effect through the incorporation of a direct balance correction mechanism that penalizes excessive discrepancies between criterion performances. Consequently, alternatives characterized by more balanced operational behavior achieve more favorable final rankings.
The strong agreement with EDAS, VIKOR, MARCOS, and RAWEC indicates that the adaptive balance-adjustment mechanism introduced within SMART-BAW improves ranking robustness without compromising consistency with established MCDM methodologies.
Overall, the correlation analysis confirms that the proposed SMART-BAW method provides stable and reliable ranking structures while maintaining a substantially simpler and more interpretable computational framework compared to more complex MCDM approaches.
5.6. Sensitivity Analysis of the SMART-BAW Balance Coefficient
Sensitivity analysis was performed in order to evaluate the robustness and stability of the proposed SMART-BAW methodology with respect to variations in the adaptive balance coefficient α [39,40,70]. Although the SMART-BAW framework adaptively determines the balance coefficient α, an additional sensitivity analysis was conducted by varying α over the interval [0, 1] in order to examine the influence of different balance-correction intensities on the obtained rankings.
It should be emphasized that the endogenous SMART-BAW formulation restricts the automatically determined coefficient to α ∈ [0, 0.5]. Values above 0.5 were included exclusively as stress-test scenarios to examine the behavior of the ranking procedure under deliberately intensified balance penalization and do not represent values generated by the adaptive coefficient defined in Equation (10).
In order to comprehensively investigate the influence of the balance parameter, the analysis was intentionally extended over a wide interval:
in order to investigate both moderate and extreme penalization scenarios, using an increment step of 0.05. Such an extended interval enables examination of both moderate and extreme penalization effects within the proposed balance-oriented evaluation framework.
α ∈ [0, 1]
Lower values of α correspond to weak penalization, where the weighted aggregation component remains the dominant factor of the evaluation process. Conversely, larger values increasingly emphasize criterion balance and progressively penalize alternatives characterized by substantial variability among criterion performances.
The following representative parameter values were considered:
α = 0, 0.05, 0.10, …,1.00
The entropy-based criterion weights remained unchanged throughout the entire analysis in order to isolate the influence of the balance correction parameter. The obtained results are presented in Table 9.
Table 9.
Effect of the balance coefficient α on SMART-BAW scores and rankings.
Figure 9 illustrates the variation in SMART-BAW scores for all considered alternatives under different values of the balance correction parameter α.
Figure 9.
Sensitivity Analysis of the SMART-BAW Method with Respect to the Adaptive Balance Coefficient α. The grey horizontal line indicates Si = 0, separating positive and negative SMART-BAW scores.
The obtained results demonstrate that the ranking of the three best alternatives remains unchanged throughout the entire analyzed interval of the balance parameter [71]:
A2 > A3 > A1
This behavior confirms the robustness and stability of the proposed SMART-BAW methodology [71]. The elevator system A2 consistently preserves the highest ranking position regardless of substantial variations in the penalization intensity, indicating reliable identification of the optimal alternative.
A minor rank reversal occurs only between alternatives A4 and A5 starting from approximately α = 0.15. This behavior can be explained by the relatively similar performance levels of these alternatives combined with the increasing influence of the balance correction mechanism for larger parameter values.
The results additionally show that increasing the value of α progressively decreases the scores of alternatives characterized by larger dispersion between criterion performances. Consequently, the proposed methodology increasingly favors performance-consistent alternatives as the penalization intensity increases.
For larger parameter values (α > 0.6), several alternatives obtain negative scores due to strong penalization effects. This behavior indicates that excessively large values of the balance parameter may overemphasize criterion consistency and reduce the practical interpretability of the obtained scores. Therefore, the balance correction mechanism should primarily serve as a secondary evaluation component rather than the dominant ranking factor.
The sensitivity analysis further demonstrates that the adaptive coefficient obtained by the SMART-BAW framework falls within the region characterized by stable ranking behavior, confirming the suitability of the proposed adaptive balance-adjustment mechanism.
Overall, the sensitivity analysis confirms that the proposed SMART-BAW methodology provides stable and reliable ranking structures while enabling direct and controllable adjustment of performance balance importance within the decision-making process.
This property represents a significant advantage for engineering and infrastructure applications where both overall performance and operational consistency must be simultaneously considered.
5.7. Sensitivity Analysis of Criterion Weights
In addition to the sensitivity analysis of the adaptive balance coefficient, the robustness of the SMART-BAW ranking was further examined with respect to variations in the criterion weights. The entropy-based weights presented in Table 5 were used as the baseline weighting vector. Each criterion weight was independently increased and decreased by 20%, while the remaining weights were proportionally adjusted to preserve the normalization condition .
For a perturbed criterion Cj, the modified weight was calculated as:
whereas the remaining criterion weights were proportionally rescaled according to:
The perturbation procedure defined by Equations (15) and (16) generated ten weight-perturbation scenarios, corresponding to a ±20% variation in each of the five criterion weights. The normalized decision matrix, balance measures Di, and adaptive balance coefficient α remained unchanged, allowing the influence of criterion-weight variations on the final SMART-BAW ranking to be isolated. The resulting weighting scenarios and rankings are presented in Table 10.
Table 10.
Criterion-weight variation scenarios, SMART-BAW rankings, and Spearman correlation coefficients.
The obtained results demonstrate that the ranking remains unchanged in all ten perturbation scenarios. Alternative A2 consistently retains the first position, followed by A3, A1, A5, and A4. Accordingly, the Spearman rank correlation coefficient between each perturbed scenario and the baseline ranking is equal to ρ = 1.00.
These findings indicate that moderate variations in individual criterion weights do not affect the ranking structure produced by the SMART-BAW method. The stability observed under ±20% weight perturbations therefore provides additional evidence of the robustness of the proposed methodology and confirms that the obtained ranking is not excessively dependent on small changes in the entropy-derived criterion weights.
6. Conclusions
This study introduced SMART-BAW (Self-Monitoring Adaptive Ranking Technique Based on Balanced Additive Weighting) as a computationally simple, transparent, adaptive, and balance-oriented multi-criteria decision-making approach for evaluating alternatives under multiple conflicting criteria. This self-monitoring adaptive balance-adjustment mechanism represents the principal SMART component of the proposed methodology, enabling automatic regulation of balance penalization according to the characteristics of the decision environment. The proposed method extends classical weighted aggregation by incorporating an adaptive balance-correction mechanism that dynamically adjusts the influence of performance imbalance according to the dispersion characteristics of evaluated alternatives.
The applicability of the proposed methodology was demonstrated through the evaluation of vertical conveyor systems used in transport and logistics infrastructure. Five conveyor alternatives were analyzed using multiple engineering and operational criteria, including throughput, required motor power, maximum throughput, floor footprint, and bidirectional operational capability. Criterion weights were objectively determined using the entropy weighting method.
The ranking results show that the elevator system A2 is identified as the optimal alternative according to the proposed SMART-BAW framework. Although this alternative did not achieve the highest throughput, its weighted overall performance remained sufficiently strong to achieve the highest final SMART-BAW score after the balance correction was applied. The analysis additionally confirmed that alternatives characterized by extreme superiority in a single criterion do not necessarily represent the most suitable engineering solutions when multiple operational aspects are simultaneously considered.
Comparative analysis with established MCDM approaches, including TOPSIS, VIKOR, EDAS, MARCOS, and RAWEC, demonstrated strong consistency and reliability of the proposed methodology. In particular, the obtained rankings showed complete agreement with EDAS and VIKOR, while differences relative to TOPSIS highlighted the capability of the SMART-BAW method to reduce sensitivity to extreme criterion values and excessive dominance effects.
Furthermore, sensitivity analysis confirmed the robustness and stability of the proposed approach with respect to both balance-correction intensity and criterion-weight variations. The ranking of the three best-performing alternatives remained unchanged throughout the analyzed balance-coefficient interval, while ±20% perturbations of individual criterion weights preserved the complete baseline ranking, with Spearman’s coefficient ρ = 1.00 in all scenarios. These results confirm the stability of the proposed decision-support framework under variations in both methodological parameters and criterion importance.
Compared with more computationally demanding MCDM approaches, the proposed SMART-BAW method offers several important advantages:
- Computational simplicity;
- Transparent mathematical structure;
- High interpretability;
- Adaptive balance adjustment;
- Reduced sensitivity to strong criterion asymmetry;
- Ranking robustness;
- Suitability for engineering and infrastructure applications.
Owing to these characteristics, the proposed methodology represents an efficient and practically applicable decision-support framework for transport and logistics infrastructure systems as well as other engineering problems involving multiple conflicting criteria.
Although the applicability of the proposed SMART-BAW methodology was demonstrated through the evaluation of vertical conveyor systems, the proposed framework is not limited to logistics applications only. Due to its straightforward implementation, transparent scoring mechanism, and flexible structure, the SMART-BAW method can be applied to a broad range of engineering, transport, sustainability, and industrial decision-making problems involving multiple conflicting criteria. This broader applicability is consistent with recent trends toward integrating decision-support methodologies with simulation-based planning and Industry 4.0 environments in logistics and production systems [72].
The practical application of SMART-BAW requires a clearly defined decision matrix, consistent benefit/cost criterion orientation, and criterion values that can be transformed into a common normalized scale. The method is particularly suitable for problems in which both overall performance and balance across criteria are decision-relevant. Its current limitations include dependence on the adopted normalization procedure and validation within a single engineering case study; therefore, broader validation across different datasets and application domains is required.
Future research should focus on validating the SMART-BAW methodology using larger datasets obtained from real warehouse and material-handling systems and under dynamic operating conditions, including variable throughput demand, equipment downtime, energy consumption, maintenance requirements, and changing order profiles. Particular attention should be given to integration with warehouse management systems, IoT-based monitoring, digital-twin technologies, and Industry 4.0 environments [45,46,72]. Further research may also investigate fuzzy and interval-based SMART-BAW extensions, the integration of subjective and objective weighting techniques, and applications across different warehouse layouts, storage strategies, and conveyor configurations [73,74].
Author Contributions
Conceptualization, S.M., N.P., V.J., V.S. and D.M.; methodology, S.M. and N.P.; validation, S.M., N.P. and V.J.; formal analysis, S.M. and N.P.; investigation, S.M.; resources, D.M.; data curation, N.P., V.S. and D.M.; writing—original draft preparation, S.M. and N.P.; writing—review and editing, S.M., N.P., V.J., V.S. and D.M.; visualization, S.M., N.P. and V.J.; supervision, N.P. and D.M.; project administration, D.M. All authors have read and agreed to the published version of the manuscript.
Funding
This research was financially supported by the Ministry of Education, Science and Technological Development and Innovation of the Republic of Serbia (Contract No. 451-03-34/2026-03/200109).
Institutional Review Board Statement
Not applicable.
Informed Consent Statement
Not applicable.
Data Availability Statement
This study primarily relies on publicly available and published data.
Conflicts of Interest
The authors declare no conflicts of interest.
References
- Triantaphyllou, E.; Mann, S.H. An examination of the effectiveness of multi-dimensional decision-making methods: A decision-making paradox. Decis. Support Syst. 1989, 5, 303–312. [Google Scholar] [CrossRef] [Scilit]
- Petrović, N.; Marković, S.; Nikolić, B.; Jovanović, V.; Petrović, M. Evaluating Alternative Propulsion Systems for Urban Public Transport in Niš: A Multicriteria Decision-Making Approach. J. Eng. Manag. Syst. Eng. 2024, 3, 72–81. [Google Scholar] [CrossRef] [Scilit]
- Petrović, N.; Jovanović, V.; Petrović, M.; Nikolić, B.; Pavlović, J. Evaluating the operation performance of the Serbian transport freight system by using multiple criteria decision-making technique. Eng. Today 2023, 1, 33–40. [Google Scholar] [CrossRef] [Scilit]
- Petrović, N.; Mihajlović, J.; Jovanović, V.; Ćirić, D.; Živojinović, T. Evaluating annual operation performance of Serbian railway system by using multiple criteria decision-making technique. Acta Polytech. Hung. 2023, 20, 157–168. [Google Scholar] [CrossRef] [Scilit]
- Rekik, S.; Khabbouchi, I.; El Alimi, S. A spatial analysis for optimal wind site selection from a sustainable supply-chain-management perspective. Sustainability 2025, 17, 1571. [Google Scholar] [CrossRef] [Scilit]
- Almutairi, K.; Mostafaeipour, A.; Jahanshahi, E.; Jooyandeh, E.; Himri, Y.; Jahangiri, M.; Issakhov, A.; Chowdhury, S.; Hosseini Dehshiri, S.J.; Hosseini Dehshiri, S.S.; et al. Ranking locations for hydrogen production using hybrid wind-solar: A case study. Sustainability 2021, 13, 4524. [Google Scholar] [CrossRef] [Scilit]
- Wang, C.N.; Le, T.Q.; Chang, K.H.; Dang, T.T. Measuring road transport sustainability using MCDM-based entropy objective weighting method. Symmetry 2022, 14, 1033. [Google Scholar] [CrossRef] [Scilit]
- Gue, K.R. Very high density storage systems. IIE Trans. 2006, 38, 79–90. [Google Scholar] [CrossRef] [Scilit]
- Božić, M.; Dabić-Miletić, S.; Andrejić, M.; Djurdjević, D. Ranking of autonomous technologies for sustainable logistics activities in the confectionery industry. Mathematics 2025, 13, 498. [Google Scholar] [CrossRef] [Scilit]
- Torkayesh, A.E.; Rajaeifar, M.A.; Rostom, M.; Malmir, B.; Yazdani, M.; Suh, S.; Heidrich, O. Integrating life cycle assessment and multi criteria decision making for sustainable waste management: Key issues and recommendations for future studies. Renew. Sustain. Energy Rev. 2022, 168, 112819. [Google Scholar] [CrossRef] [Scilit]
- Chandrasekar, R.; Devipriya, M.; Ramachandran, M.; Sathishkumar, M. Enhancing conveyor equipment selection: A multi-criteria integrated information approach. J. Electr. Mech. Mechatron. Eng. 2026, 12, 1–11. [Google Scholar] [CrossRef] [Scilit]
- Konieczna-Fuławka, M. Energy-saving solutions applied in belt conveyors: A literature review. Energies 2025, 18, 3019. [Google Scholar] [CrossRef] [Scilit]
- Sun, B.; Yang, Y.; Zhang, S.; Li, J. Urban Economic Structure Impact on Passenger and Freight Efficiencies of Nine Airports in China: A Two-Stage Method. J. Nonlinear Convex Anal. 2026, 27, 987–999. [Google Scholar]
- Marković, S.; Petrović, N.; Nikolić, B.; Mihajlović, J. Efficacy and Space Optimization in Industrial Warehouses: An Evaluation of Paternoster Continuous Vertical Conveyors. J. Eng. Manag. Syst. Eng. 2024, 3, 21–29. [Google Scholar] [CrossRef] [Scilit]
- Marković, S.; Marković, D.; Petrović, N.; Marinković, D. Design of continuous vertical conveyors—Vertiveyors. In Proceedings of the KOD 2024, Balatonfüred, Hungary, 23–26 May 2024; Mechanisms and Machine Science. Volume 174, pp. 345–353. [Google Scholar] [CrossRef] [Scilit]
- Chung, J.; Tanchoco, J.M. Material handling automation in production and warehouse systems. In Springer Handbook of Automation; Nof, S., Ed.; Springer: Berlin/Heidelberg, Germany, 2009; pp. 945–964. [Google Scholar] [CrossRef] [Scilit]
- Sahoo, S.K.; Choudhury, B.B.; Dhal, P.R. A Bibliometric Analysis of Material Selection Using MCDM Methods: Trends and Insights. Spectr. Mech. Eng. Oper. Res. 2024, 1, 189–205. [Google Scholar] [CrossRef] [Scilit]
- Komatina, N.; Tadić, D.; Aleksić, A.; Jovanović, A.D. The assessment and selection of suppliers using AHP and MABAC with type-2 fuzzy numbers in automotive industry. Proc. Inst. Mech. Eng. Part O J. Risk Reliab. 2022, 237, 836–852. [Google Scholar] [CrossRef] [Scilit]
- Tupenaite, L.; Zavadskas, E.K.; Kaklauskas, A.; Turskis, Z.; Seniut, M. Multiple criteria assessment of alternatives for built and human environment renovation. J. Civ. Eng. Manag. 2010, 16, 257–266. [Google Scholar] [CrossRef] [Scilit]
- Aleksic, A.; Runic Ristic, M.; Komatina, N.; Tadic, D. Advanced risk assessment in reverse supply chain processes: A case study in Republic of Serbia. Adv. Prod. Eng. Manag. 2019, 14, 421–434. [Google Scholar] [CrossRef] [Scilit]
- Jusufbašić, A. MCDM methods for selection of handling equipment in logistics: A brief review. Spectr. Eng. Manag. Sci. 2023, 1, 13–25. [Google Scholar] [CrossRef] [Scilit]
- Bošković, S.; Jovčić, S.; Simic, V.; Švadlenka, L.; Dobrodolac, M.; Bacanin, N. A new Criteria Importance Assessment (CIMAS) method in multi-criteria group decision-making: Criteria evaluation for supplier selection. Facta Univ. Ser. Mech. Eng. 2025, 23, 335–349. [Google Scholar] [CrossRef] [Scilit]
- Samhouri, M.; Abualeenein, M.; Al-Atrash, F. Enhancing Supply Chain Resilience Through a Fuzzy AHP and TOPSIS to Mitigate Transportation Disruption. Sustainability 2025, 17, 7375. [Google Scholar] [CrossRef] [Scilit]
- Vahedi Nikbakht, M.; Gheibi, M.; Montazeri, H.; Yeganeh Khaksar, R.; Moezzi, R.; Vadiee, A. Identification and Ranking of Factors Affecting the Delay Risk of High-Rise Construction Projects Using AHP and VIKOR Methods. Infrastructures 2024, 9, 24. [Google Scholar] [CrossRef] [Scilit]
- Gül, A.; Cakmak, E.; Karakas, A. Drone selection for forest surveillance and fire detection using interval valued neutrosophic EDAS method. Facta Univ. Ser. Mech. Eng. 2025, 23, 433–458. [Google Scholar] [CrossRef] [Scilit]
- Ghorabaee, M.K.; Zavadskas, E.K.; Olfat, L.; Turskis, Z. Multi-criteria inventory classification using a new method of evaluation based on distance from average solution (EDAS). Informatica 2015, 26, 435–451. [Google Scholar] [CrossRef] [Scilit]
- Xie, Z.; Chen, F. Auditing road safety achievement using MEREC–ARAS–QBKM model: An empirical study for APEC member economies. Sci. Rep. 2024, 14, 23049. [Google Scholar] [CrossRef] [Scilit] [PubMed]
- Wang, H.; Xu, T.; Feng, L.; Ullah, K. An improved ARAS approach with T-spherical fuzzy information and its application in multi-attribute group decision-making. Int. J. Fuzzy Syst. 2024, 26, 2132–2156. [Google Scholar] [CrossRef] [Scilit]
- Radović, D.; Stević, Ž.; Pamučar, D.; Zavadskas, E.K.; Badi, I.; Antuchevičiene, J.; Turskis, Z. Measuring performance in transportation companies in developing countries: A novel rough ARAS model. Symmetry 2018, 10, 434. [Google Scholar] [CrossRef] [Scilit]
- Puška, A.; Štilić, A.; Pamučar, D.; Božanić, D.; Nedeljković, M. Introducing a Novel multi-criteria Ranking of Alternatives with Weights of Criterion (RAWEC) model. Methods X 2024, 12, 102628. [Google Scholar] [CrossRef] [Scilit] [PubMed]
- Kizielewicz, B.; Sałabun, W. SITW Method: A New Approach to Re-identifying Multi-criteria Weights in Complex Decision Analysis. Spectr. Mech. Eng. Oper. Res. 2024, 1, 215–226. [Google Scholar] [CrossRef] [Scilit]
- Stevic, Z.; Ulutas, A.; Topal, A.; Marinkovic, D.; Cavoski, S. A new objective method for determining criteria weights in MCDM models—LOGSTA. Int. J. Simul. Model. 2025, 24, 589–600. [Google Scholar] [CrossRef] [Scilit]
- Yücenur, G.N.; Maden, A. Sequential MCDM methods for site selection of hydroponic geothermal greenhouse: ENTROPY and ARAS. Renew. Energy 2024, 226, 120361. [Google Scholar] [CrossRef] [Scilit]
- Gottwald, D.; Jovčić, S. Multi-criteria decision-making approach in personnel selection problem—A case study at the University of Pardubice. Econ. Comput. Econ. Cybern. Stud. Res. 2022, 56, 149–164. [Google Scholar] [CrossRef] [Scilit]
- Aydoğan, H.; Ozkir, V. A Fermatean fuzzy MCDM method for selection and ranking problems: Case studies. Expert Syst. Appl. 2024, 237, 121628. [Google Scholar] [CrossRef] [Scilit]
- Liang, R.X.; He, S.S.; Wang, J.Q.; Chen, K.; Li, L. An extended MABAC method for multi-criteria group decision-making problems based on correlative inputs of intuitionistic fuzzy information. Comput. Appl. Math. 2019, 38, 112. [Google Scholar] [CrossRef] [Scilit]
- Komatina, N.; Petrović, N.; Pamučar, D.; Simić, V.; Marinković, D. Multi-criteria ranking of industrial presses with respect to operational performance using the square-root based evaluation method (SREM). Facta Univ. Ser. Mech. Eng. 2026; in press.
- Avramova, T.; Peneva, T.; Ivanov, A. Overview of existing multi-criteria decision-making (MCDM) methods used in industrial environments. Technologies 2025, 13, 444. [Google Scholar] [CrossRef] [Scilit]
- Triantaphyllou, E.; Sánchez, A. A Sensitivity Analysis Approach for Some Deterministic Multi-Criteria Decision-Making Methods. Decis. Sci. 1997, 28, 151–194. [Google Scholar] [CrossRef] [Scilit]
- Vinogradova-Zinkevič, I. Comparative Sensitivity Analysis of Some Fuzzy AHP Methods. Mathematics 2023, 11, 4984. [Google Scholar] [CrossRef] [Scilit]
- Ulutaş, A. Supplier selection by using a fuzzy integrated model for a textile company. Econ. Eng. Decis. 2019, 30, 579–590. [Google Scholar] [CrossRef] [Scilit]
- Kabirifar, K.; Ashour, M.; Yazdani, M.; Mahdiyar, A.; Malekjafarian, M. Cybernetic-parsimonious MCDM modeling with application to the adoption of circular economy in waste management. Appl. Soft Comput. 2023, 139, 110186. [Google Scholar] [CrossRef] [Scilit]
- Mukhametzyanov, I. Specific character of objective methods for determining weights of criteria in MCDM problems: Entropy, CRITIC and SD. Decis. Mak. Appl. Manag. Eng. 2021, 4, 76–105. [Google Scholar] [CrossRef] [Scilit]
- Strøm, E.M.; Busch, J.A.; Hvam, L.; Haug, A. Conceptualizing Warehouse 4.0 technologies in the third-party logistics industry: An empirical study. Logistics 2025, 9, 125. [Google Scholar] [CrossRef] [Scilit]
- Roshid, M.M.; Waaje, A.; Meem, T.N.; Sarkar, A. Logistics 4.0: A comprehensive literature review of technological integration, challenges, and future prospects of implementation of Industry 4.0 technologies. Int. J. Technol. Knowl. Soc. 2024, 20, 65–85. [Google Scholar] [CrossRef] [Scilit]
- Alam, M.M.; Ugli, R.A.N.; Tanha, K.J.; Jun, T. AI-enhanced digital twin systems for warehouse logistics optimization: A review of challenges with solutions and future directions. ICT Express 2026, 12, 459–479. [Google Scholar] [CrossRef] [Scilit]
- Bhat, R.; Suresh, S.; Devakumar, D.; Subramanian, K.R.; Dhanush, D.; Krishnan, S. Design and simulation of a PLC-controlled omni wheel conveyor sorting system for high-speed material handling. Sci. Rep. 2025, 15, 34150. [Google Scholar] [CrossRef] [Scilit] [PubMed]
- Rezaei, J. Best-worst multi-criteria decision-making method. Omega 2015, 53, 49–57. [Google Scholar] [CrossRef] [Scilit]
- Shi, C.; Yao, Y. Explainable multi-criteria decision-making: A three-way decision perspective. Int. J. Approx. Reason. 2025, 187, 109528. [Google Scholar] [CrossRef] [Scilit]
- Taherdoost, H. Analysis of simple additive weighting method (SAW) as a multi-attribute decision-making technique: A step-by-step guide. J. Manag. Sci. Eng. Res. 2023, 6, 21–24. [Google Scholar] [CrossRef] [Scilit]
- Durmić, E.; Stević, Ž.; Chatterjee, P.; Vasiljević, M.; Tomašević, M. Sustainable supplier selection using combined FUCOM–Rough SAW model. Rep. Mech. Eng. 2020, 1, 34–43. [Google Scholar] [CrossRef] [Scilit]
- Zavadskas, E.K.; Turskis, Z.; Antucheviciene, J.; Zakarevicius, A. Optimization of weighted aggregated sum product assessment. Elektron. Elektrotech. 2012, 122, 3–6. [Google Scholar] [CrossRef] [Scilit]
- Su, L.; Wang, T.; Li, H.; Chao, Y.; Wang, L. Multi-criteria decision making for identification of unbalanced bidding. J. Civ. Eng. Manag. 2020, 26, 43–52. [Google Scholar] [CrossRef] [Scilit]
- Opricovic, S.; Tzeng, G.H. Extended VIKOR method in comparison with outranking methods. Eur. J. Oper. Res. 2007, 178, 514–529. [Google Scholar] [CrossRef] [Scilit]
- Zavadskas, E.K.; Kaklauskas, A.; Vilutienė, T. Multicriteria evaluation of apartment blocks maintenance contractors: Lithuanian case study. Int. J. Strateg. Prop. Manag. 2009, 13, 319–338. [Google Scholar] [CrossRef] [Scilit]
- Çelen, A. Comparative analysis of normalization procedures in TOPSIS method: With an application to Turkish deposit banking market. Informatica 2014, 25, 185–208. [Google Scholar] [CrossRef] [Scilit]
- Trung, D.D.; Truong, N.X.; Duc, D.V.; Bao, N.C. Data normalization in RAWEC method: Limitations and remedies. Yugosl. J. Oper. Res. 2024, 35, 467–482. [Google Scholar] [CrossRef] [Scilit]
- Petrović, N.; Živojinović, T.; Mihajlović, J. Evaluating the annual operational efficiency of passenger and freight road transport in Serbia through entropy and TOPSIS methods. J. Eng. Manag. Syst. Eng. 2023, 2, 204–211. [Google Scholar] [CrossRef] [Scilit]
- Milićević, M.; Župac, G. An objective approach to determining criteria weights. Vojnoteh. Glas. 2012, 60, 39–56. [Google Scholar] [CrossRef] [Scilit]
- Tadić, D.; Lukić, J.; Komatina, N.; Marinković, D.; Pamučar, D. A Fuzzy Decision-Making Approach to Electric Vehicle Evaluation and Ranking. Tech. Gaz. 2025, 32, 1066–1075. [Google Scholar] [CrossRef] [Scilit]
- Hien, N.T.T.; Quynh, P.H.; Minh, V.Q. A comparative analysis of multi-criteria decision-making methods. Eng. Technol. Appl. Sci. Res. 2025, 15, 26369–26375. [Google Scholar] [CrossRef] [Scilit]
- Tien, D.H.; Trung, D.D.; Thien, N.V. Comparison of multi-criteria decision making methods using the same data standardization method. Stroj. Čas. J. Mech. Eng. 2022, 72, 57–72. [Google Scholar] [CrossRef] [Scilit]
- Štirbanović, Z.; Gardić, V.; Stanujkić, D.; Marković, R.; Sokolović, J.; Stevanović, Z. Comparative MCDM analysis for AMD treatment method selection. Water Resour. Manag. 2021, 35, 3737–3753. [Google Scholar] [CrossRef] [Scilit] [PubMed]
- Božanić, D.; Puška, A.; Tešić, D.; Štilić, A.; Ullah, K.; Muhsen, Y.; Hezam, I. Fuzzy AHP—Fuzzy MABAC model for ranking a combined construction machine—Backhoe loader. Facta Univ. Ser. Mech. Eng. 2025, 23, 605–625. [Google Scholar] [CrossRef] [Scilit]
- Aydin, F.; Gümüş, B. Comparative analysis of multi-criteria decision making methods for the assessment of optimal SVC location. Bull. Pol. Acad. Sci. Tech. Sci. 2022, 70, e140555. [Google Scholar] [CrossRef] [Scilit]
- Zahari, N.A.M.; Abdullah, A.; Ismail, M.; Rahman, N.H.A. Adaptive Utility Ranking Algorithm for Evaluating Blockchain Technology Adoption. Int. J. Econ. Sci. 2025, 14, 123–146. [Google Scholar] [CrossRef] [Scilit]
- Andryana, S.; Mantoro, T.; Gunaryati, A.; Raffliansyah, A. Improving MCDM university rankings through statistical validation using Spearman’s correlation and THE benchmark. J. Appl. Data Sci. 2025, 6, 1876–1888. [Google Scholar] [CrossRef]
- Şahin, M. An integrated multi-criteria decision-making approach for facility layout problems. J. Supercomput. 2026, 82, 213. [Google Scholar] [CrossRef] [Scilit]
- Malefaki, S.; Markatos, D.; Filippatos, A.; Pantelakis, S. A comparative analysis of multi-criteria decision-making methods and normalization techniques in holistic sustainability assessment for engineering applications. Aerospace 2025, 12, 100. [Google Scholar] [CrossRef] [Scilit]
- Więckowski, J.; Sałabun, W. Sensitivity analysis approaches in multi-criteria decision analysis: A systematic review. Appl. Soft Comput. 2023, 148, 110915. [Google Scholar] [CrossRef] [Scilit]
- Petrović, N.; Jovanović, V.; Petrović, M.; Nikolić, B.; Mihajlović, J. Comparative Investigation of Normalization Techniques and Their Influence on MCDM Ranking—A Case Study. Spectr. Mech. Eng. Oper. Res. 2025, 2, 172–190. [Google Scholar] [CrossRef] [Scilit]
- Romano, A.L.; Santos, C.H.; Azzolini, W.; Caires, A. ERP-Driven Simulation for Production Planning and Control in Industry 4.0: A Review. Int. J. Simul. Model. 2025, 24, 425–436. [Google Scholar] [CrossRef] [Scilit]
- Wang, Z.; Nabavi, S.R.; Rangaiah, G.P. Multi-criteria decision making in chemical and process engineering: Methods, progress, and potential. Processes 2024, 12, 2532. [Google Scholar] [CrossRef] [Scilit]
- Dhal, P.R.; Choudhury, B.B.; Sahoo, S.K. Evaluating motor choices for a smart wheelchair prototype using an integrated TODIM-CoCoSo approach with MEREC weighting. Eng. Rev. 2024, 44, 22–44. [Google Scholar] [CrossRef] [Scilit]
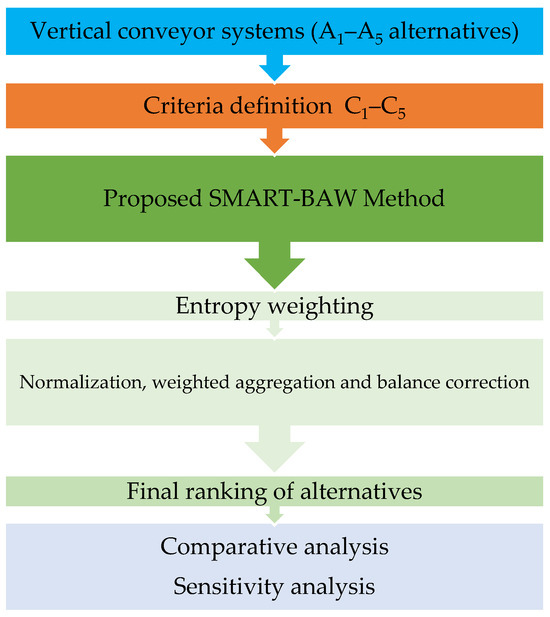
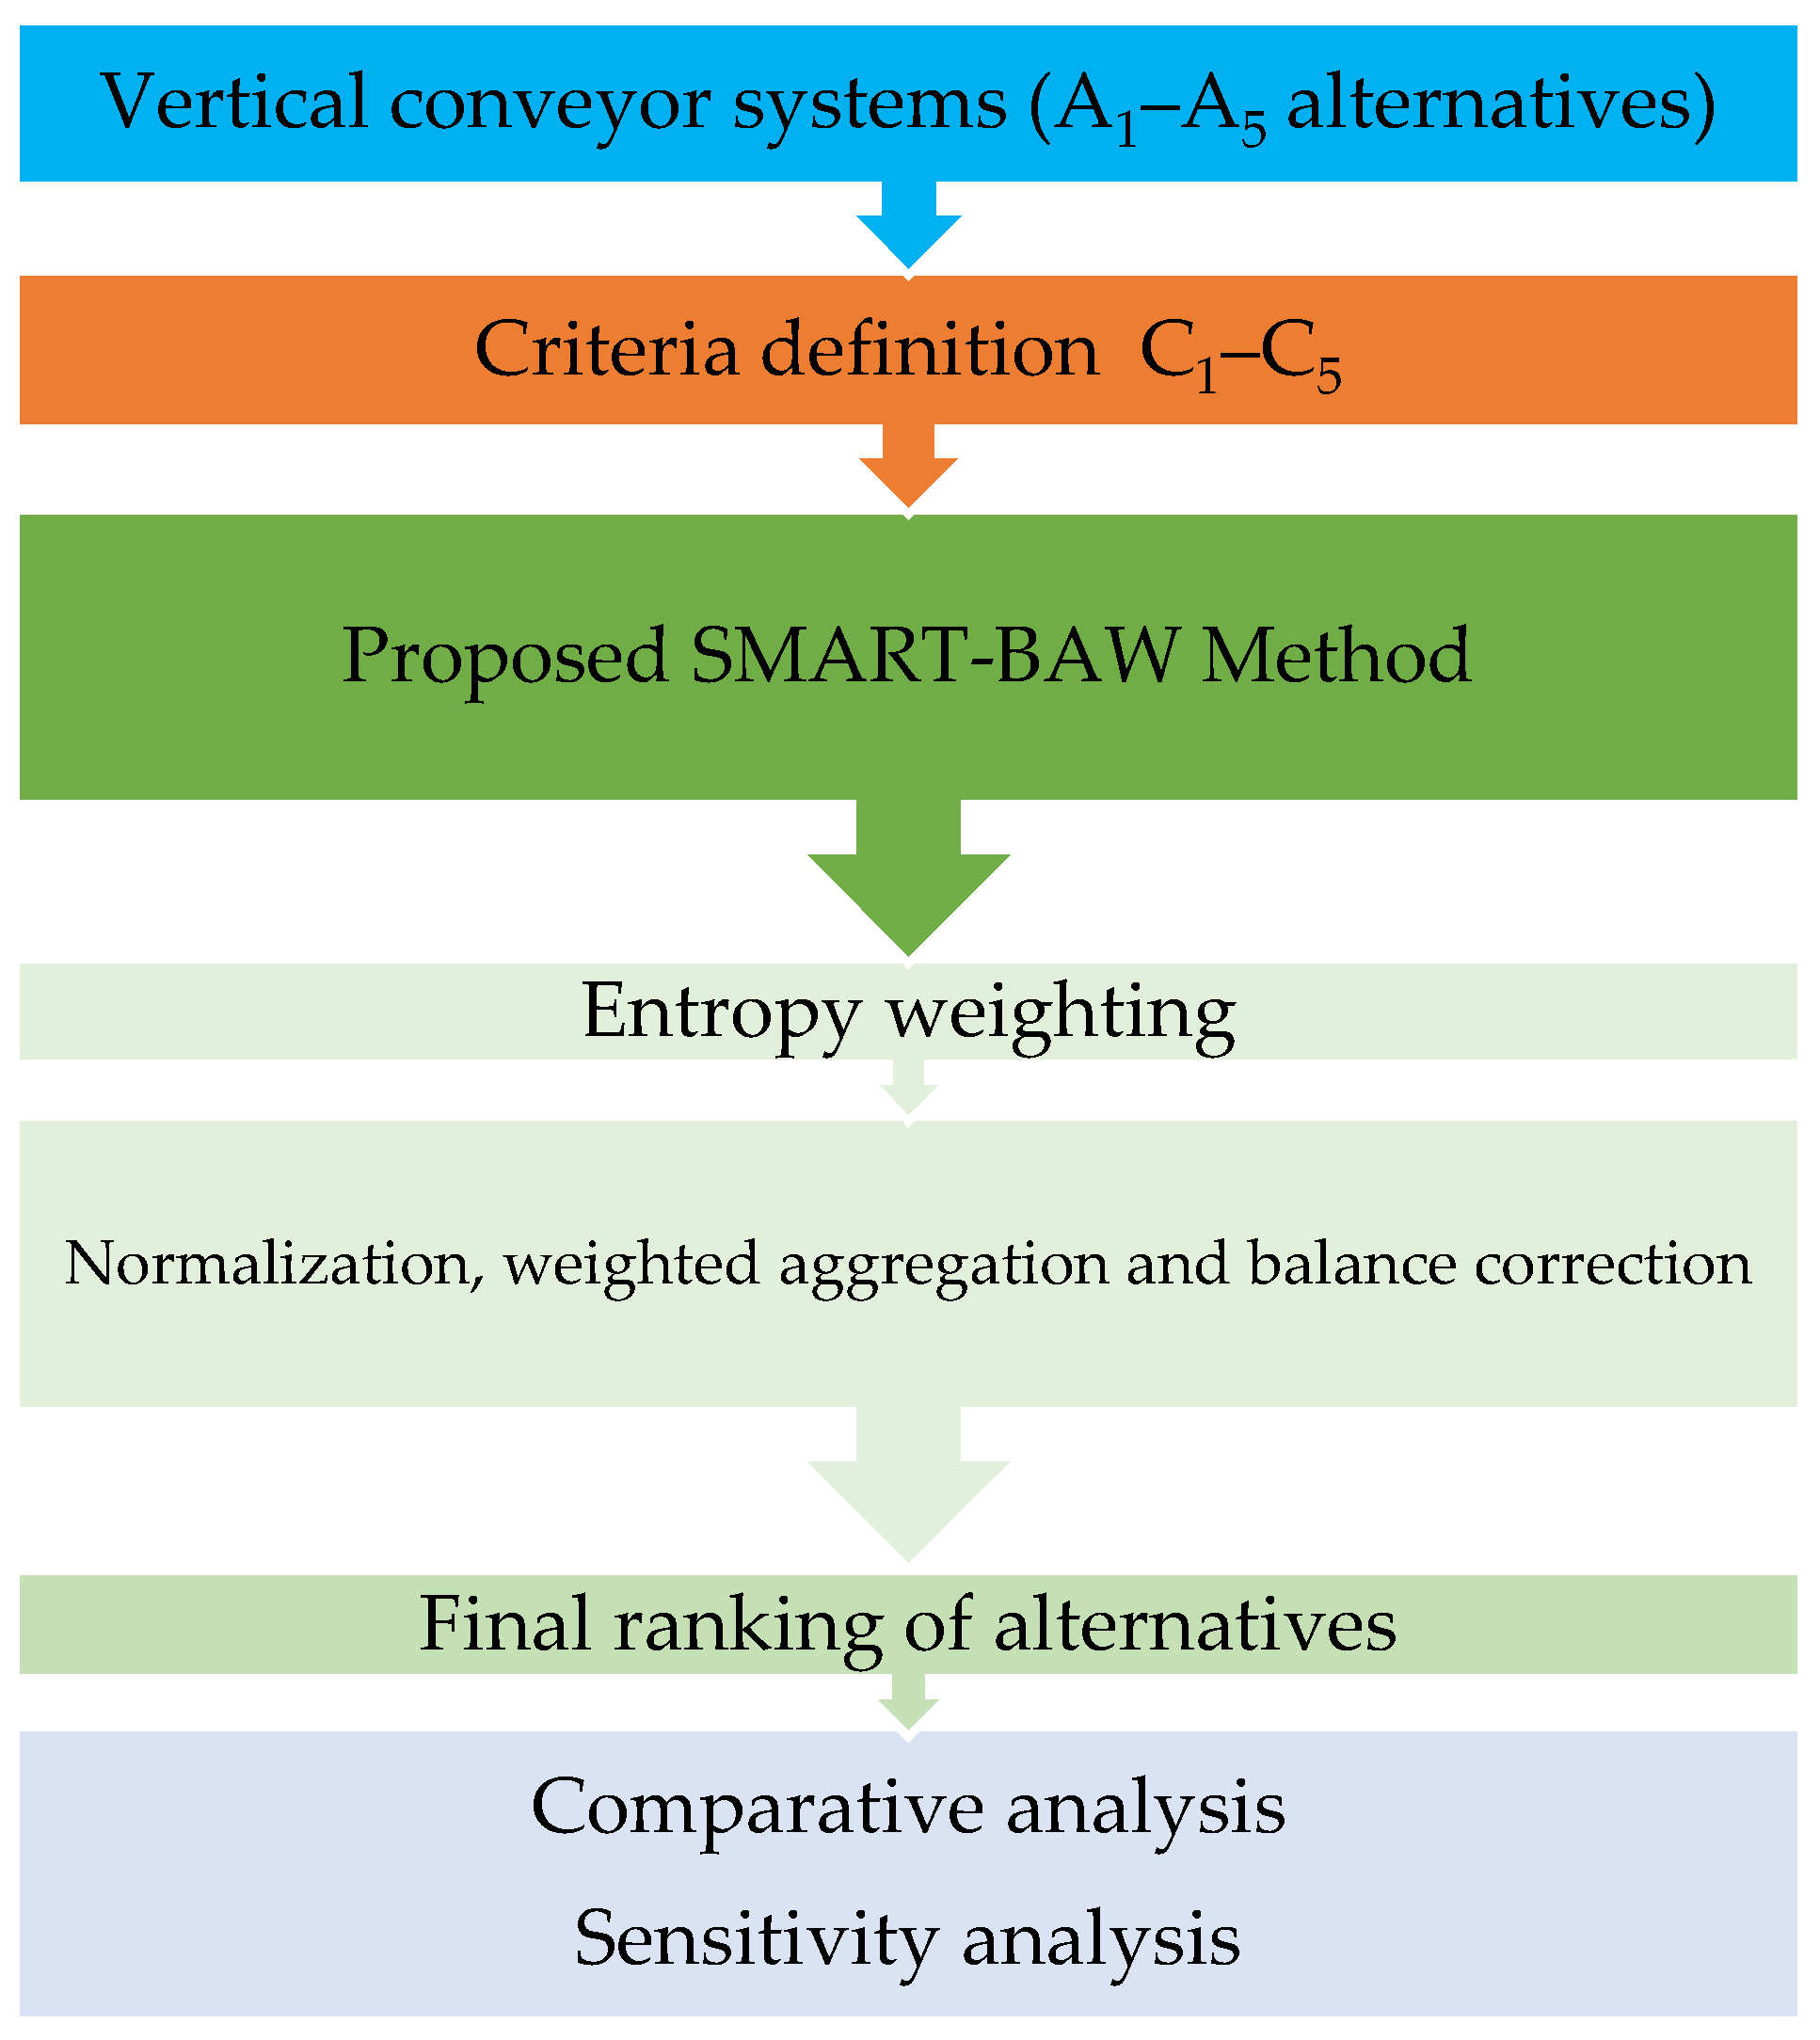
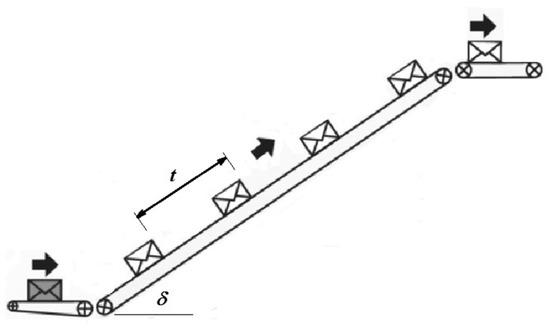
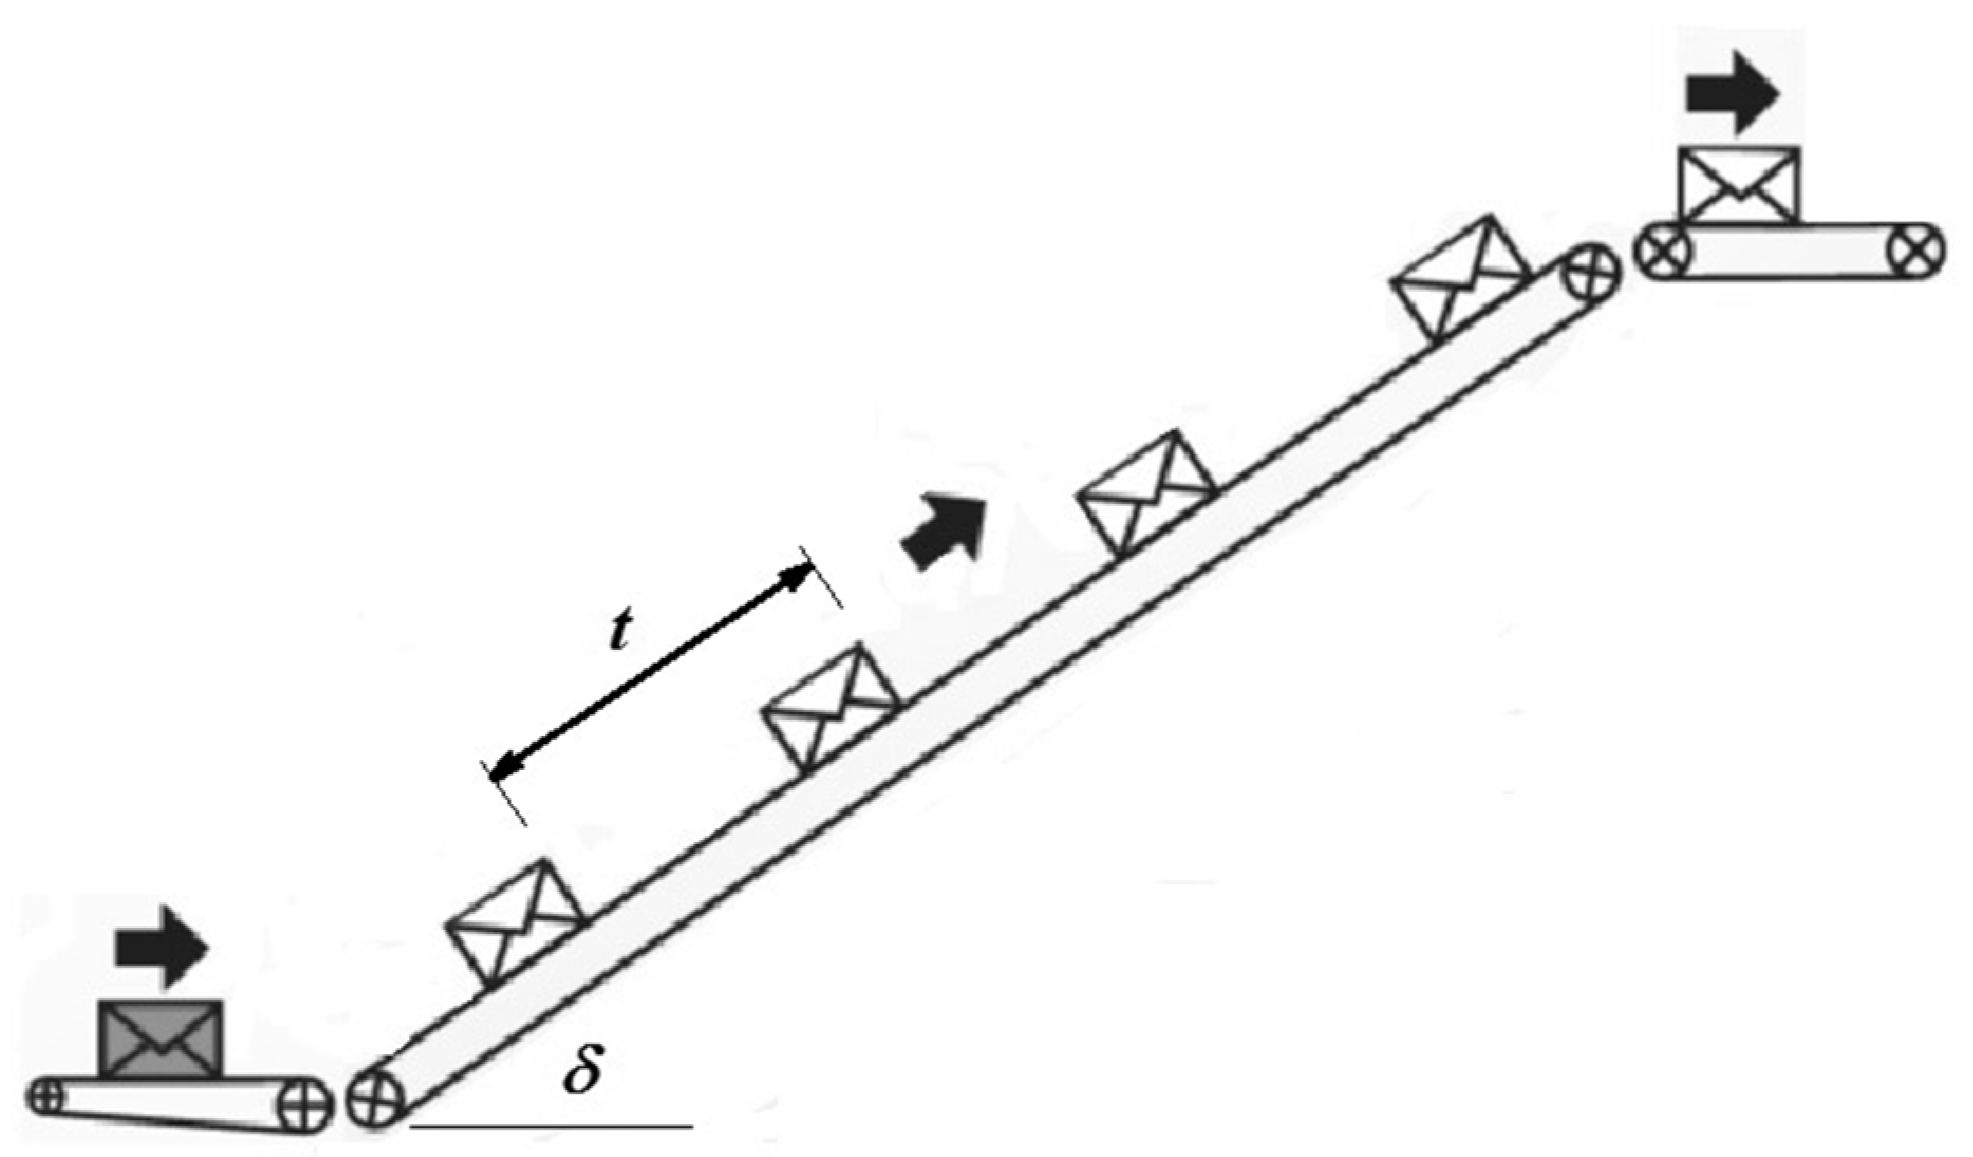
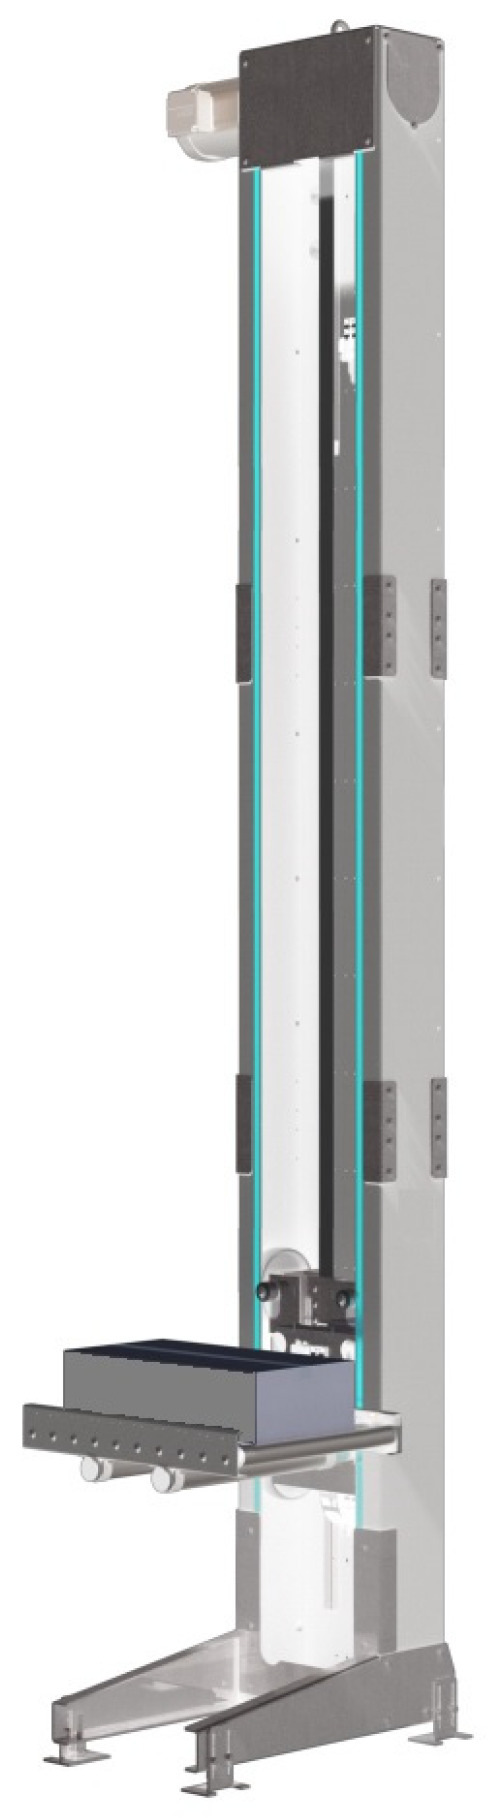
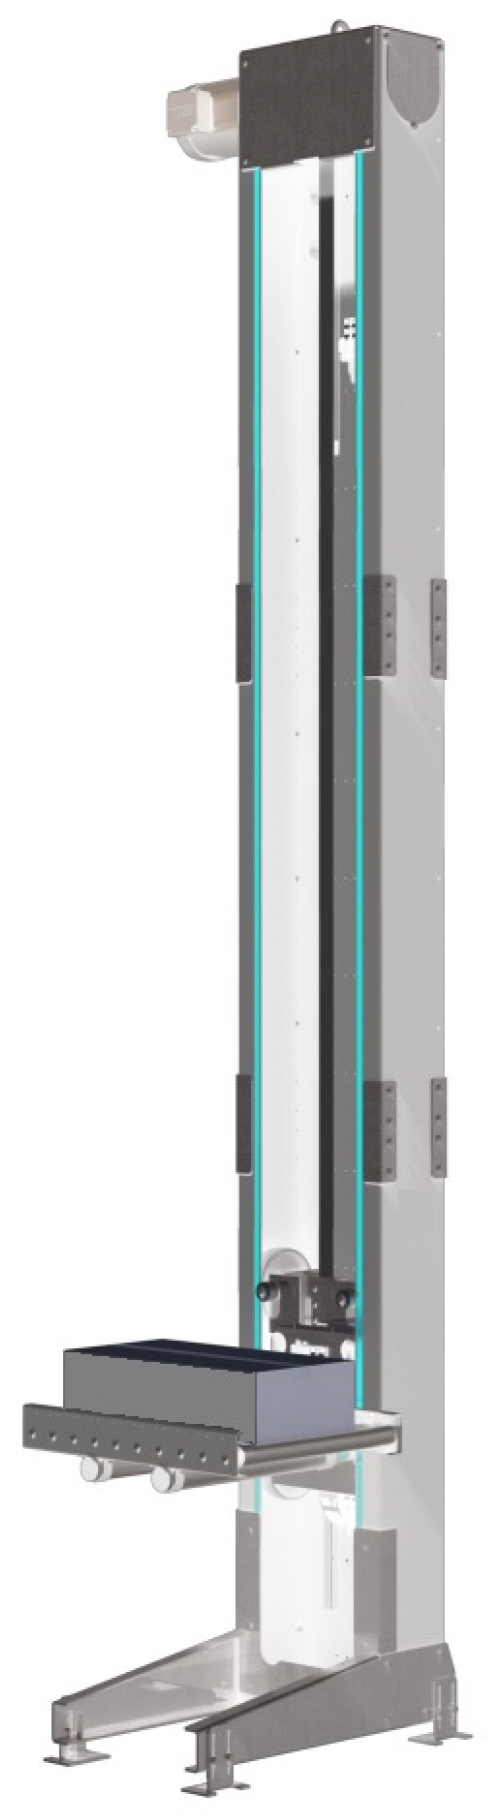
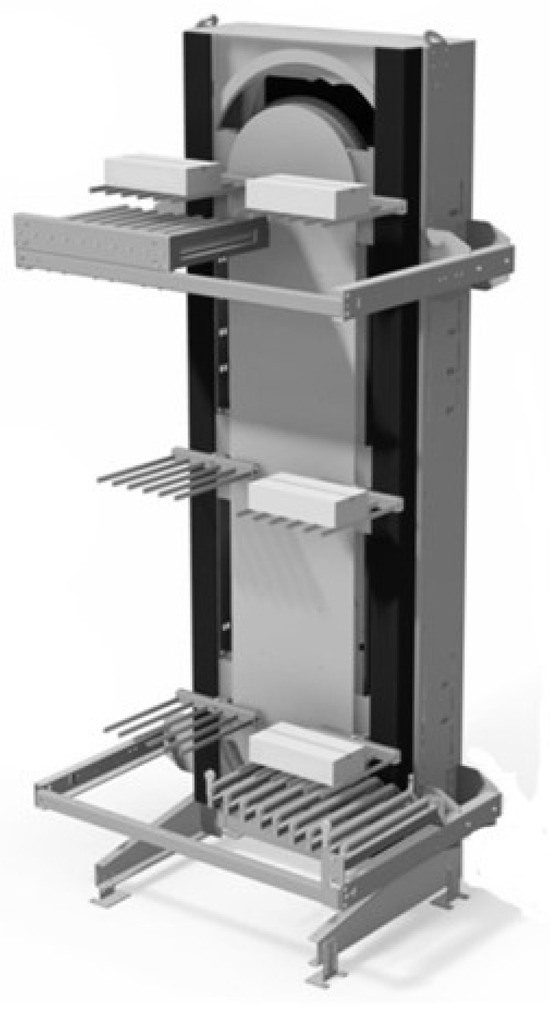
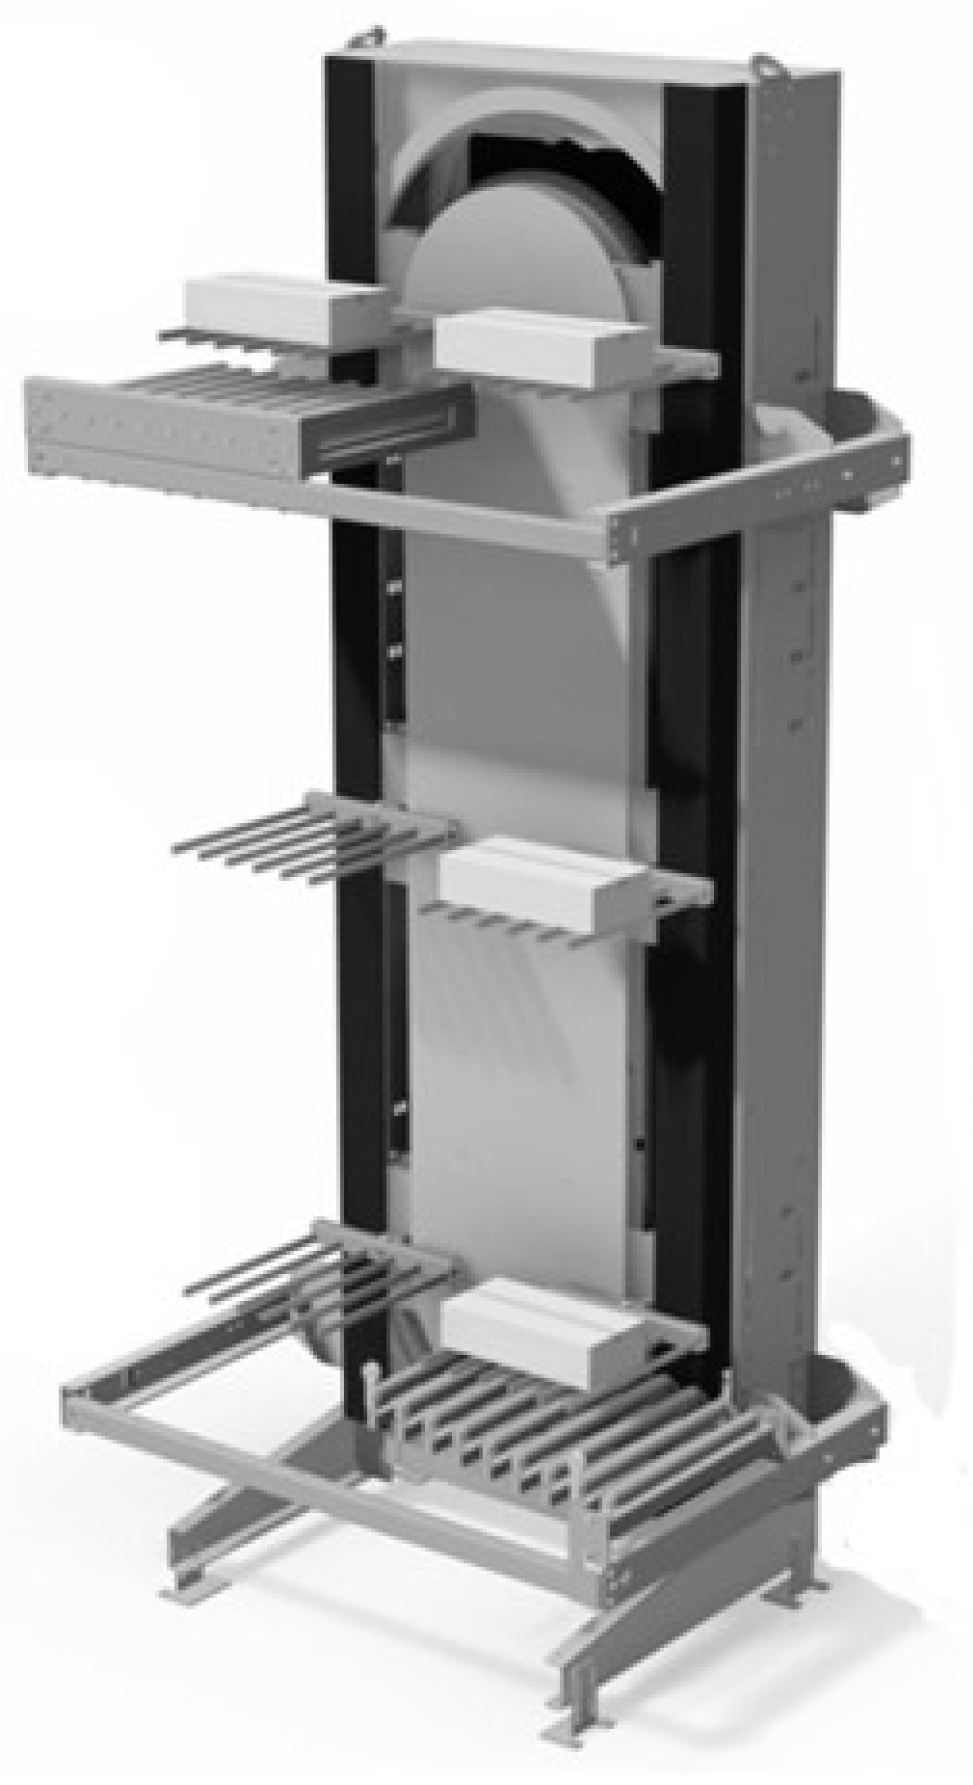
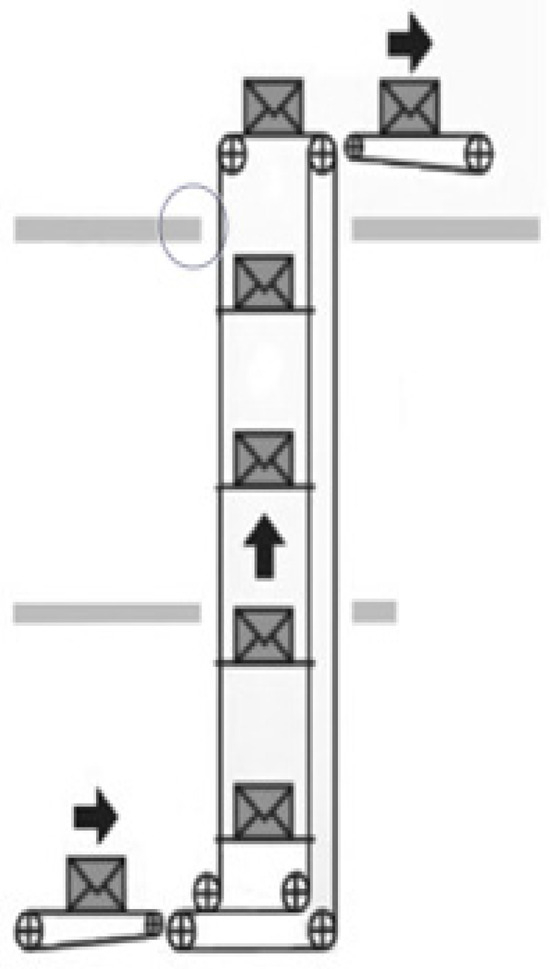
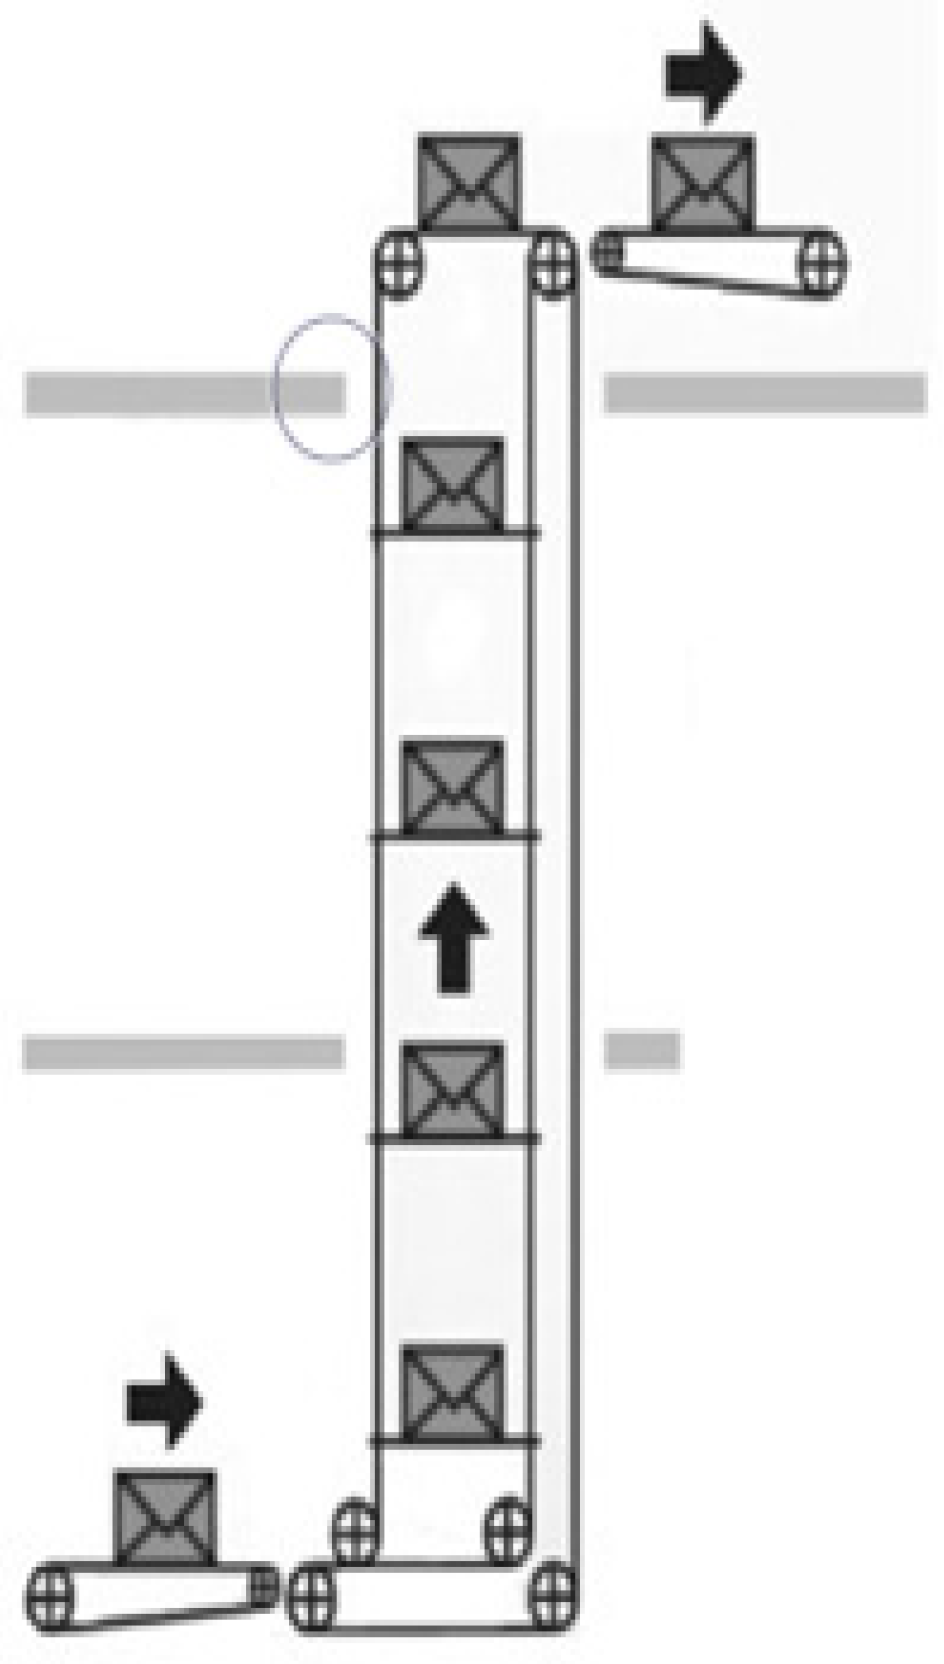
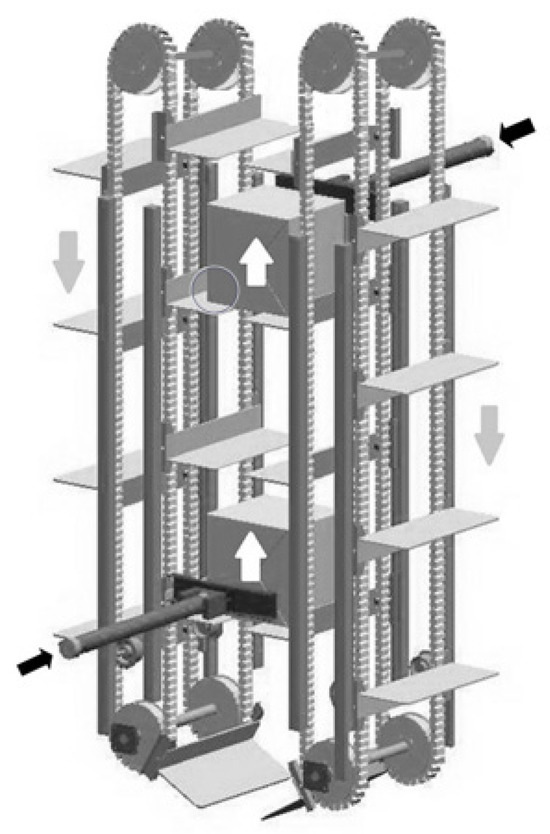
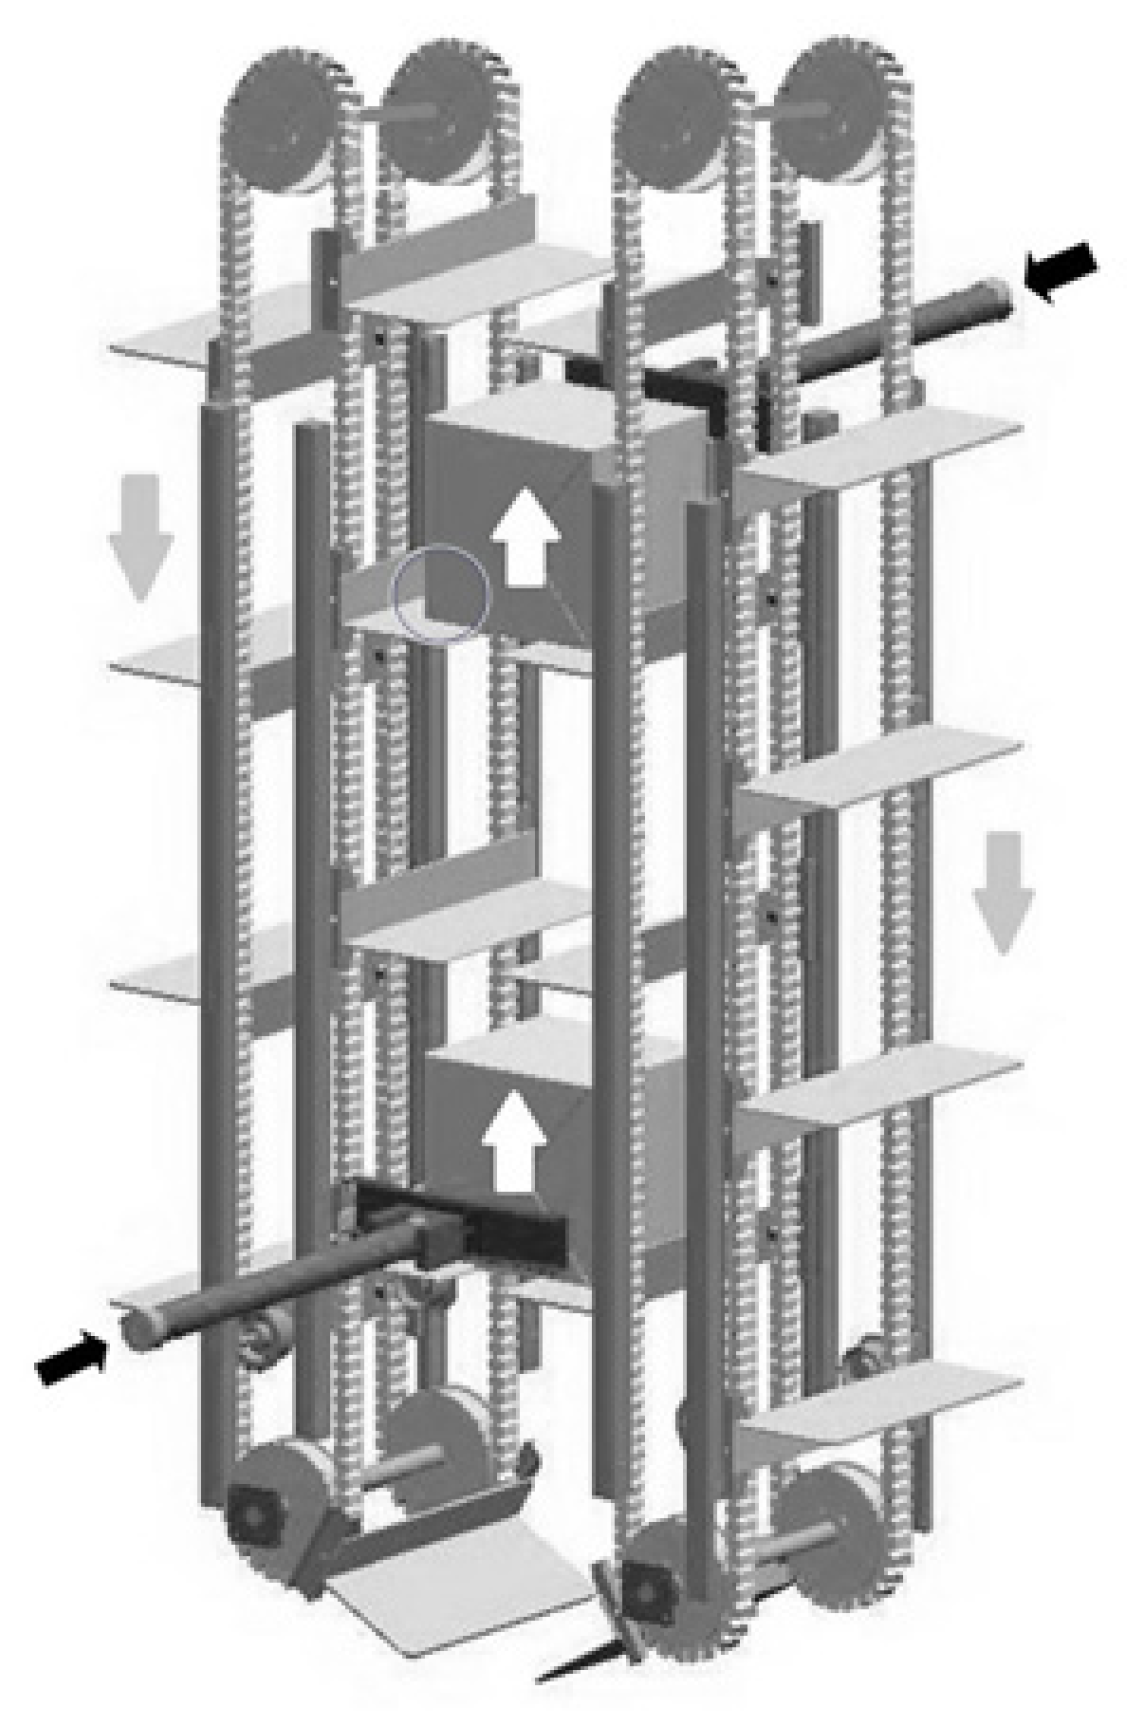
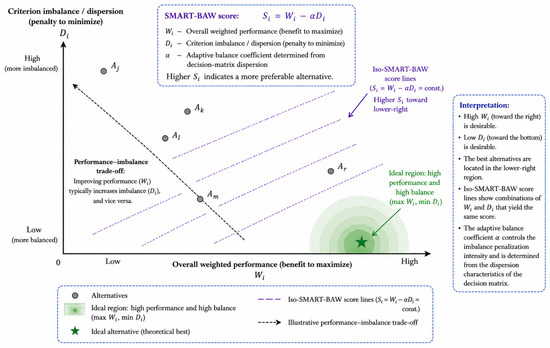
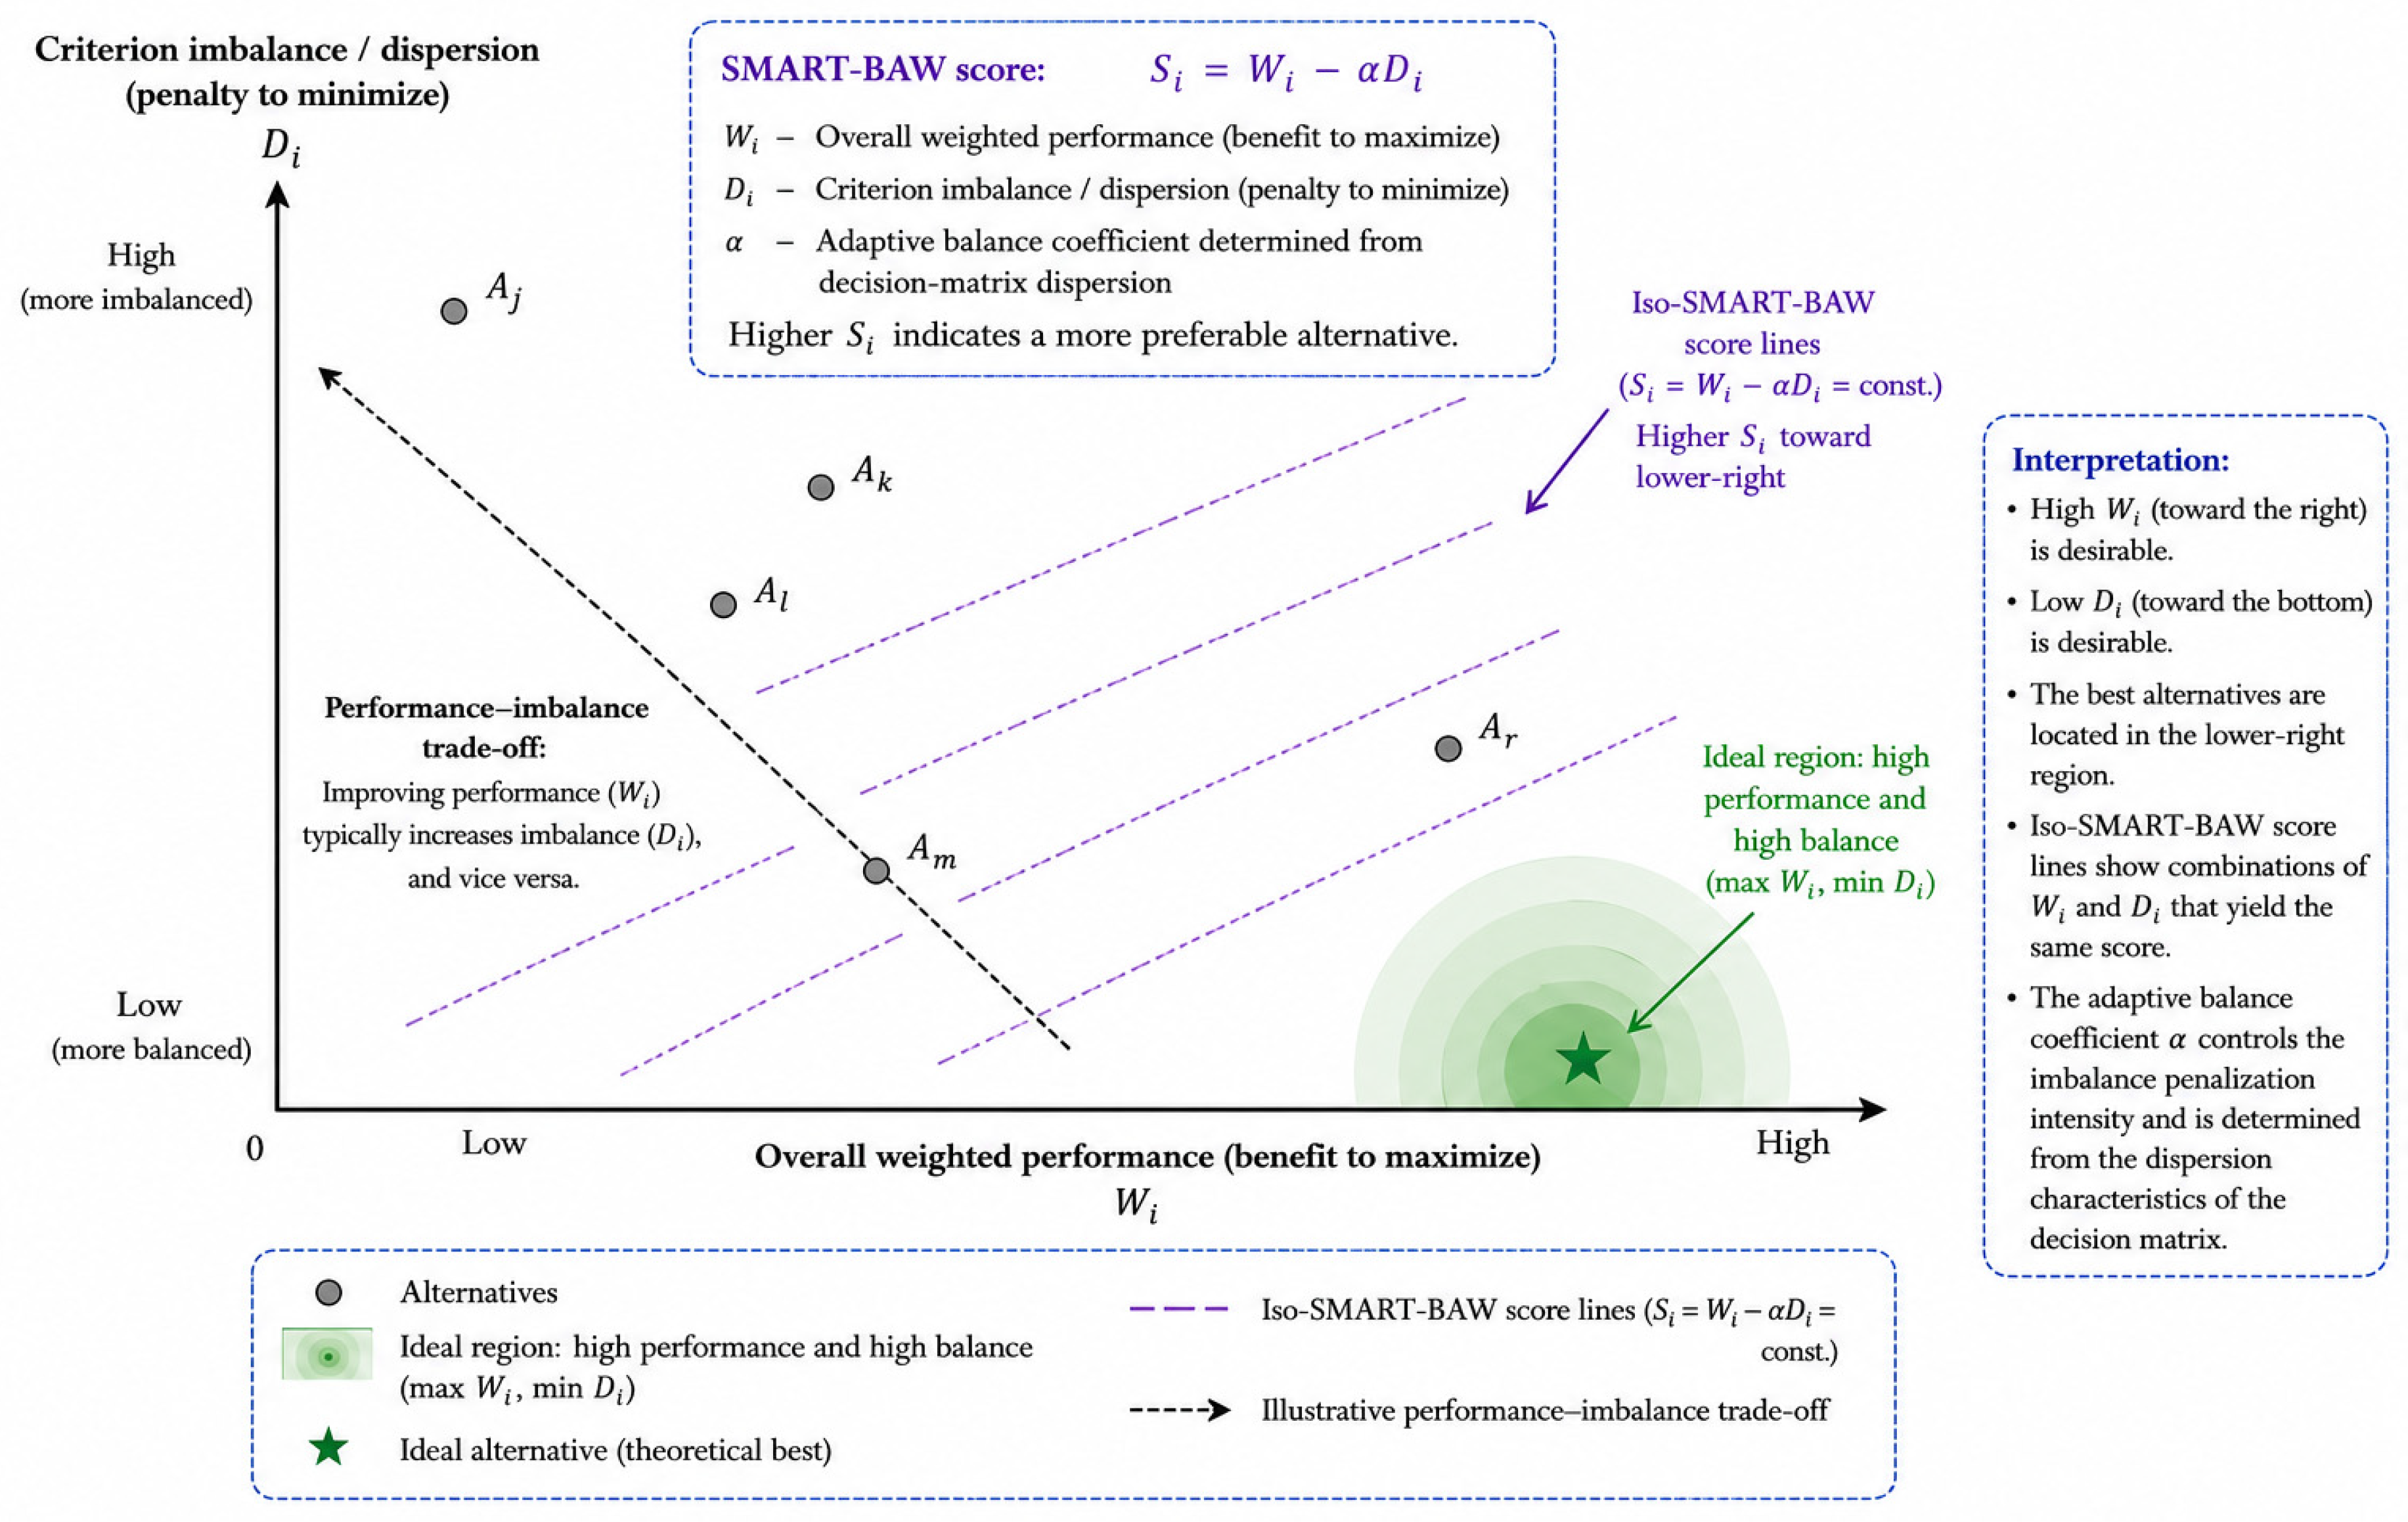
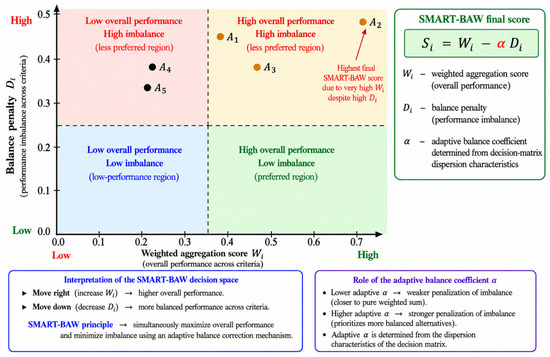
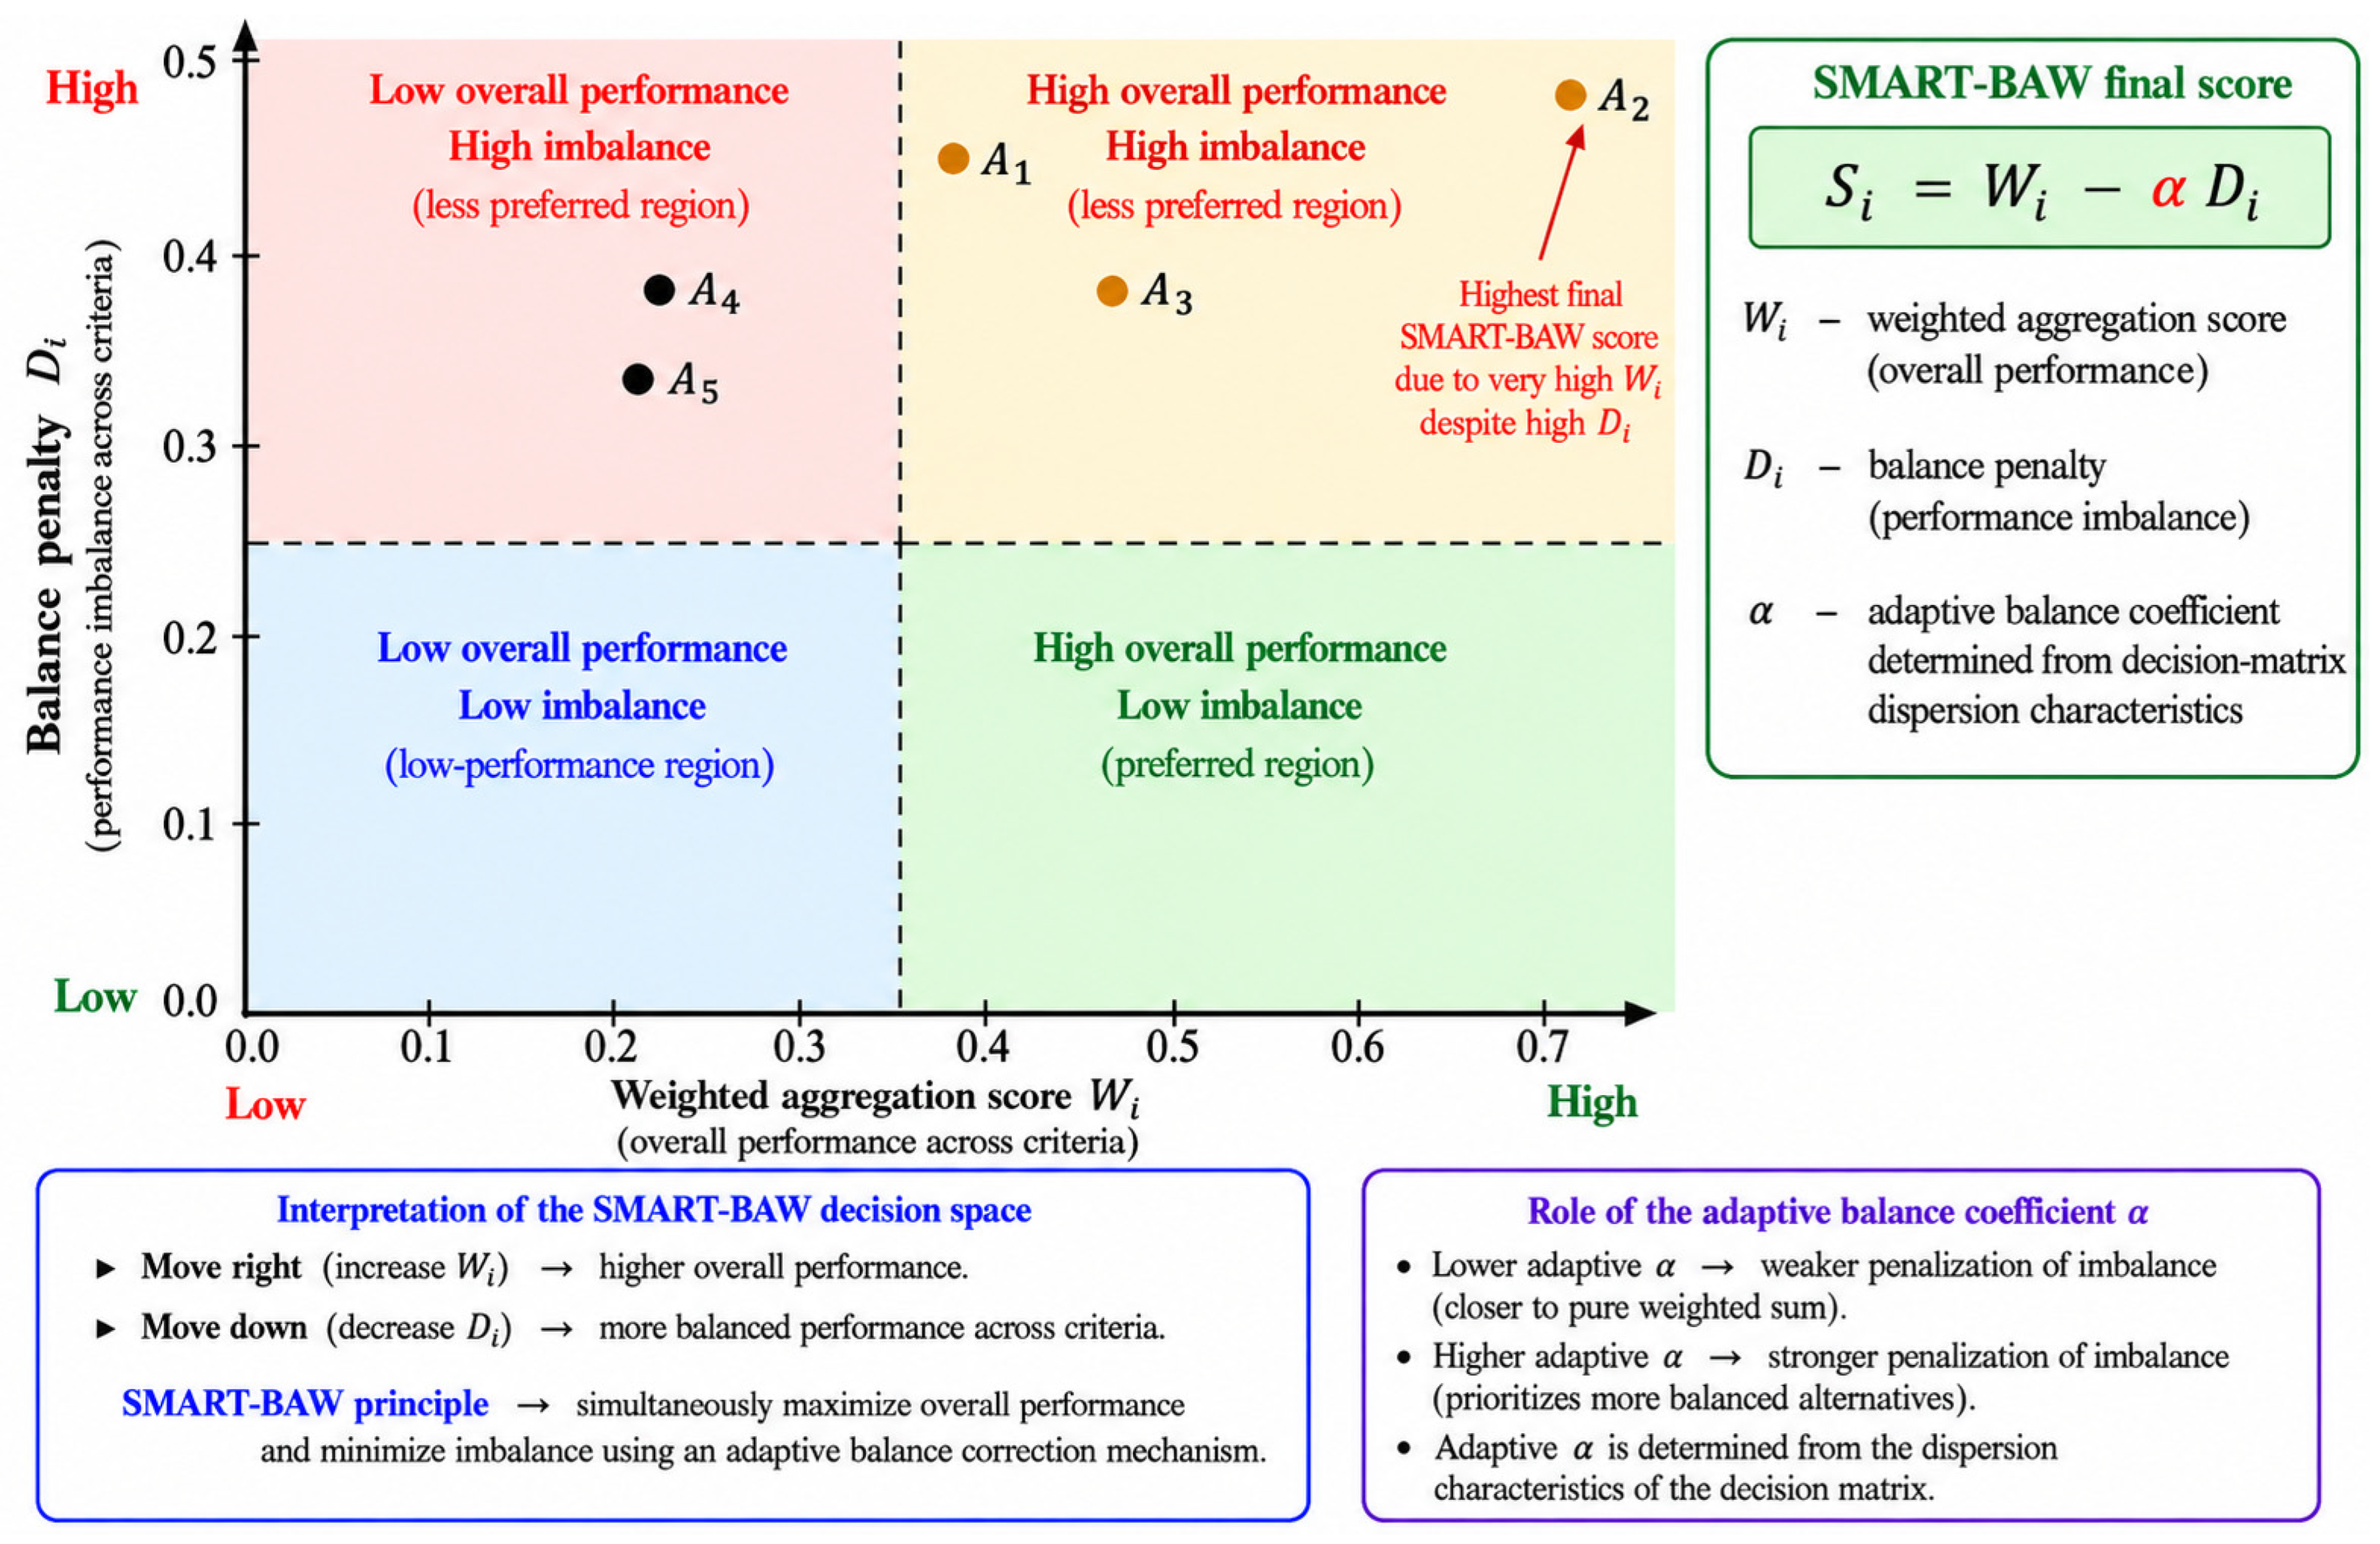
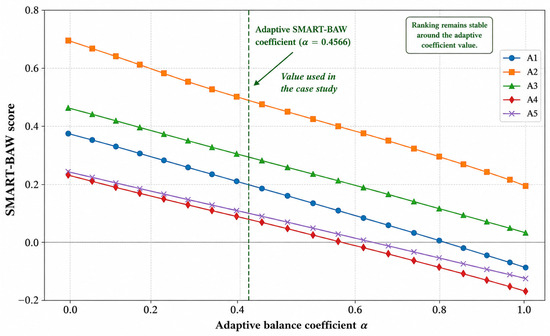
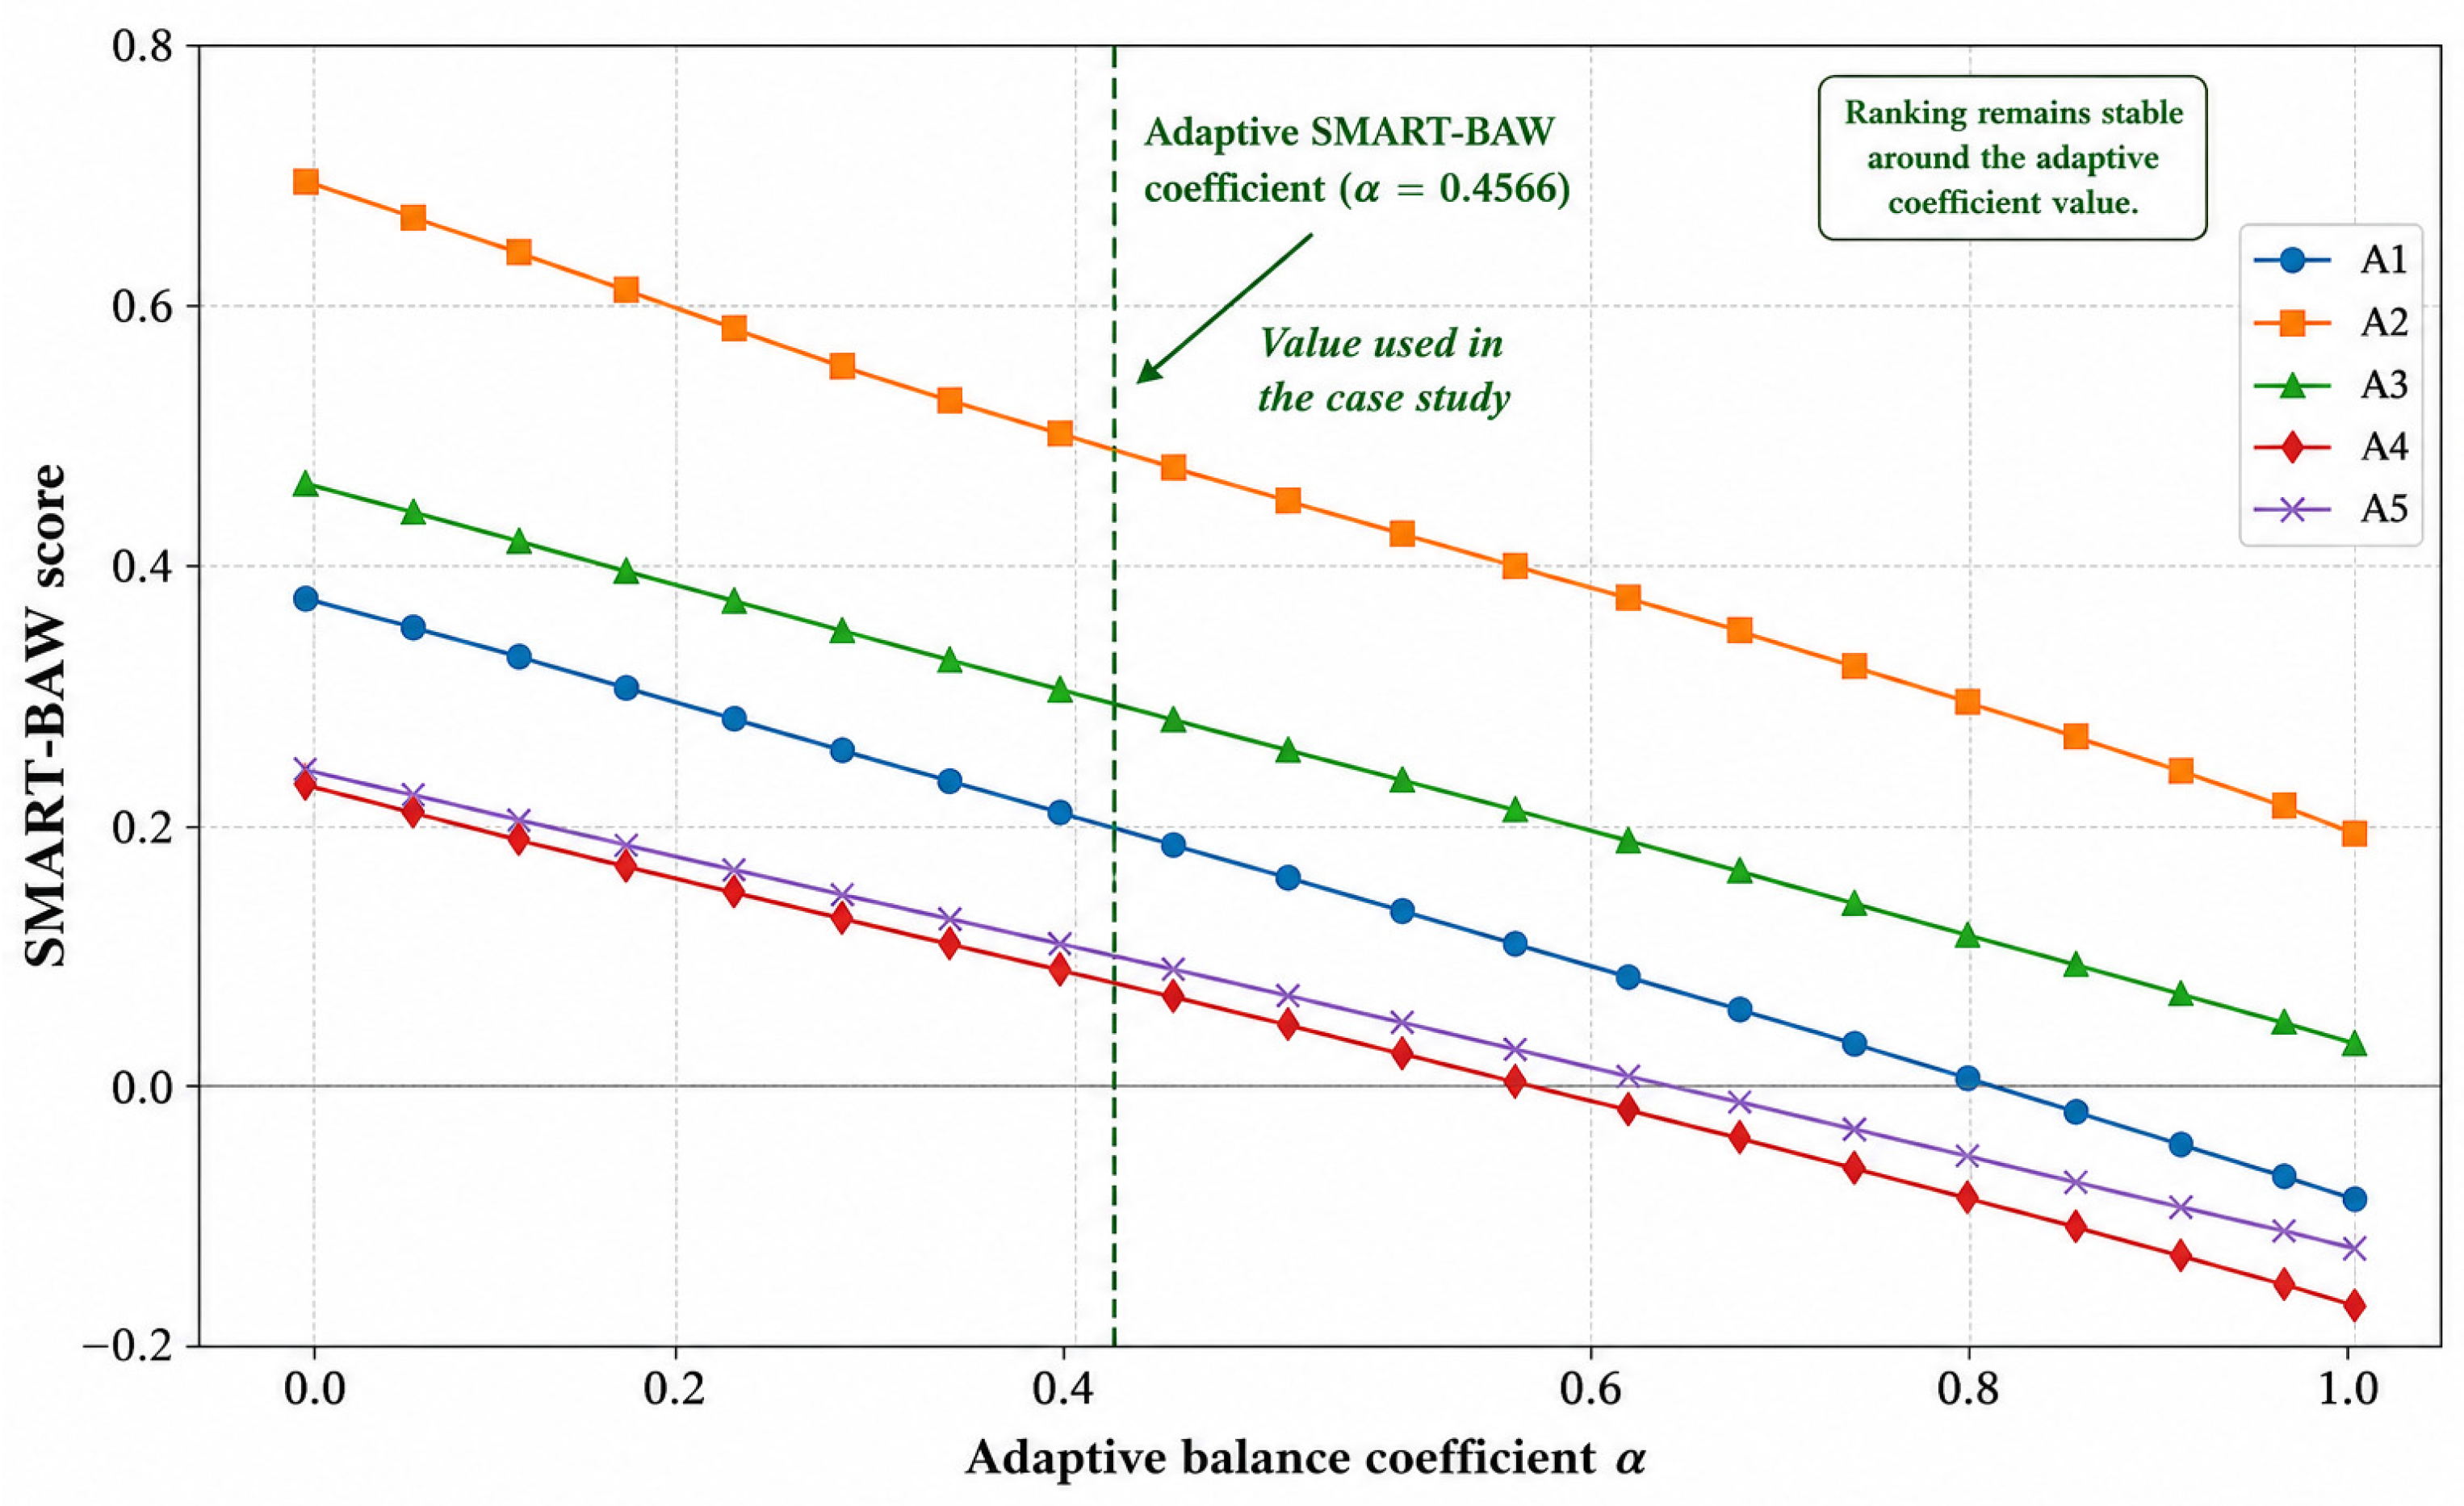

Disclaimer/Publisher’s Note: The statements, opinions and data contained in all publications are solely those of the individual author(s) and contributor(s) and not of MDPI and/or the editor(s). MDPI and/or the editor(s) disclaim responsibility for any injury to people or property resulting from any ideas, methods, instructions or products referred to in the content. |
© 2026 by the authors. Licensee MDPI, Basel, Switzerland. This article is an open access article distributed under the terms and conditions of the Creative Commons Attribution (CC BY) license.