


Abstract
Background: Volleyball court roles impose distinct physical demands, yet multi-domain position-specific profiles of elite female players are scarce. This study compared anthropometric characteristics and field-test physical performance across five positions. Methods: Fifty players (10 per position: setter, libero, outside hitter, opposite, middle blocker) from the Turkish Sultans League (2024–2025) completed anthropometry and a field-test battery (countermovement, block and spike jumps, standing long jump, drop jump, reactive strength index, seated chest-pass and overhead medicine-ball throws, Davies test, 10 m sprint, Yo-Yo IR1). One-way ANOVA, Games–Howell post hoc tests, partial η2, Cohen’s d and Benjamini–Hochberg correction (nineteen omnibus tests; 180 pairwise contrasts corrected across the complete contrast set) were applied. Results: Fourteen outcomes remained significant, with large effects (η2 = 0.29–0.62, p ≤ 0.003) for height, standing reach, mass, BMI, circumferences, all three vertical jumps, reactive strength index, both throws and Yo-Yo IR1 distance. Waist-to-hip ratio, standing long jump and 10 m sprint did not differ, but were underpowered for small-to-moderate effects rather than equivalent. Middle blockers and opposites were tallest, with the greatest jumping and throwing outputs; setters and liberos were smallest, and setters—but not liberos—covered significantly more Yo-Yo IR1 distance than the three attacking positions; outside hitters were intermediate. After adjustment for stature, the vertical-jump and reactive-strength differences persisted; whereas, the medicine-ball throw and Yo-Yo IR1 differences did not. Conclusions: Elite female volleyball players display distinct positional profiles in body size, vertical jumping and reactive strength, with outside hitters intermediate on most outcomes. Estimated VO2max is an indirect proxy derived from Yo-Yo IR1 distance and is not interchangeable with gas-exchange measurement; all pairwise contrasts and applied recommendations are exploratory and require prospective validation.
1. Introduction
Modern volleyball is a discontinuous, high-intensity team sport in which short bouts of maximal explosive actions—jumps, sprints, changes in direction and upper-body strike—alternate with brief recoveries [1,2]. The mechanical cost of these actions is concentrated in the repeated take-off and landing phases of the spike: three-dimensional kinematic and kinetic analyses show that the landing strategy adopted after a spike shot markedly alters lower-limb joint angles and moments, with the largest single-leg versus double-leg differences arising within the 30–50 ms window in which non-contact injuries are thought to occur [3]. Within each team, five technical-tactical roles (setter, libero, outside hitter, opposite and middle blocker) share the court but face distinctly different physical demands. Middle blockers and opposites are repeatedly required to jump and block at the net, outside hitters combine attack and reception, setters coordinate the offence, and liberos specialise in defensive reception and digging [4,5,6]. These differing demands have been reflected, particularly at elite levels, in position-specific anthropometric and performance profiles: taller, leaner and more powerful athletes tend to concentrate at the net, while shorter and more agile players populate the setter and libero positions [5,7,8]. Position-related differences in anthropometry, physiological capacity and jump performance in adult female players have already been documented. Nikolaidis et al. [9] profiled 58 adult female players across the five playing positions using anthropometry, cardiorespiratory performance, anaerobic power, strength and jumping performance, and Schaal et al. [6] compared physiologic performance tests by competition level and playing position. The present study therefore extends, rather than initiates, positional profiling in adult elite female volleyball. Its incremental contribution lies in combining, within a single cohort and one standardised protocol, a broader volleyball-specific jump battery (countermovement, block and spike jumps), drop-jump reactive strength, two medicine-ball throw variants, a closed-chain upper-extremity stability test and an intermittent-recovery field test, while resolving setters and liberos separately rather than pooling them into a single non-attacking category.
Anthropometric selection pressures in volleyball are well documented. Analyses of Olympic and World Championship squads, and of national-team and professional cohorts, have consistently shown that female middle blockers and opposites are 4–12 cm taller than setters and liberos, with correspondingly greater arm span and lean body mass [5,10]; comparably lean, height-selected builds have also been described in elite female team-sport athletes more broadly [11]. At the same time, body-mass index (BMI) and waist-to-hip ratio (WHR) have been used as surrogate measures of somatotype and regional fatness, with leaner builds typically favoured for jump-dominant positions [8,10,12]. Translating these height and lean-mass advantages into on-court performance requires explosive lower-limb capability, most often assessed through countermovement jump (CMJ), block and spike jumps [13,14,15,16]. Sattler and colleagues reported significant between-level differences in jump performance in elite volleyball players; however, between-position differences in females were inconsistent [14]. More recent work has begun to dissect position-related differences in bilateral and reactive jump tasks and in the reactive strength index (RSI), with conceptual and methodological frameworks proposing that positions relying on repeated maximal net actions may develop greater stretch-shortening-cycle efficiency [17,18].
Beyond lower-limb performance, volleyball attack and defence involve rapid upper-extremity strikes and overhead actions. Seated chest-pass and overhead medicine-ball throws are valid and reliable field measures of upper-body explosive performance [19,20,21], and the closed kinetic-chain upper-extremity stability (Davies) test assesses upper-extremity dynamic stability and has been shown to be reliable in athletic populations [22,23]. Linear speed over short distances (5–10 m), although not routinely highlighted in volleyball research, reflects the short explosive displacements that occur during pass-set-attack sequences and defensive repositioning [24,25]. Finally, although volleyball is not predominantly aerobic, the Yo-Yo Intermittent Recovery Test Level 1 (Yo-Yo IR1) has been widely used in intermittent sports to reflect repeated-sprint and recovery capacity [26,27], with limited application to positional profiling in female volleyball.
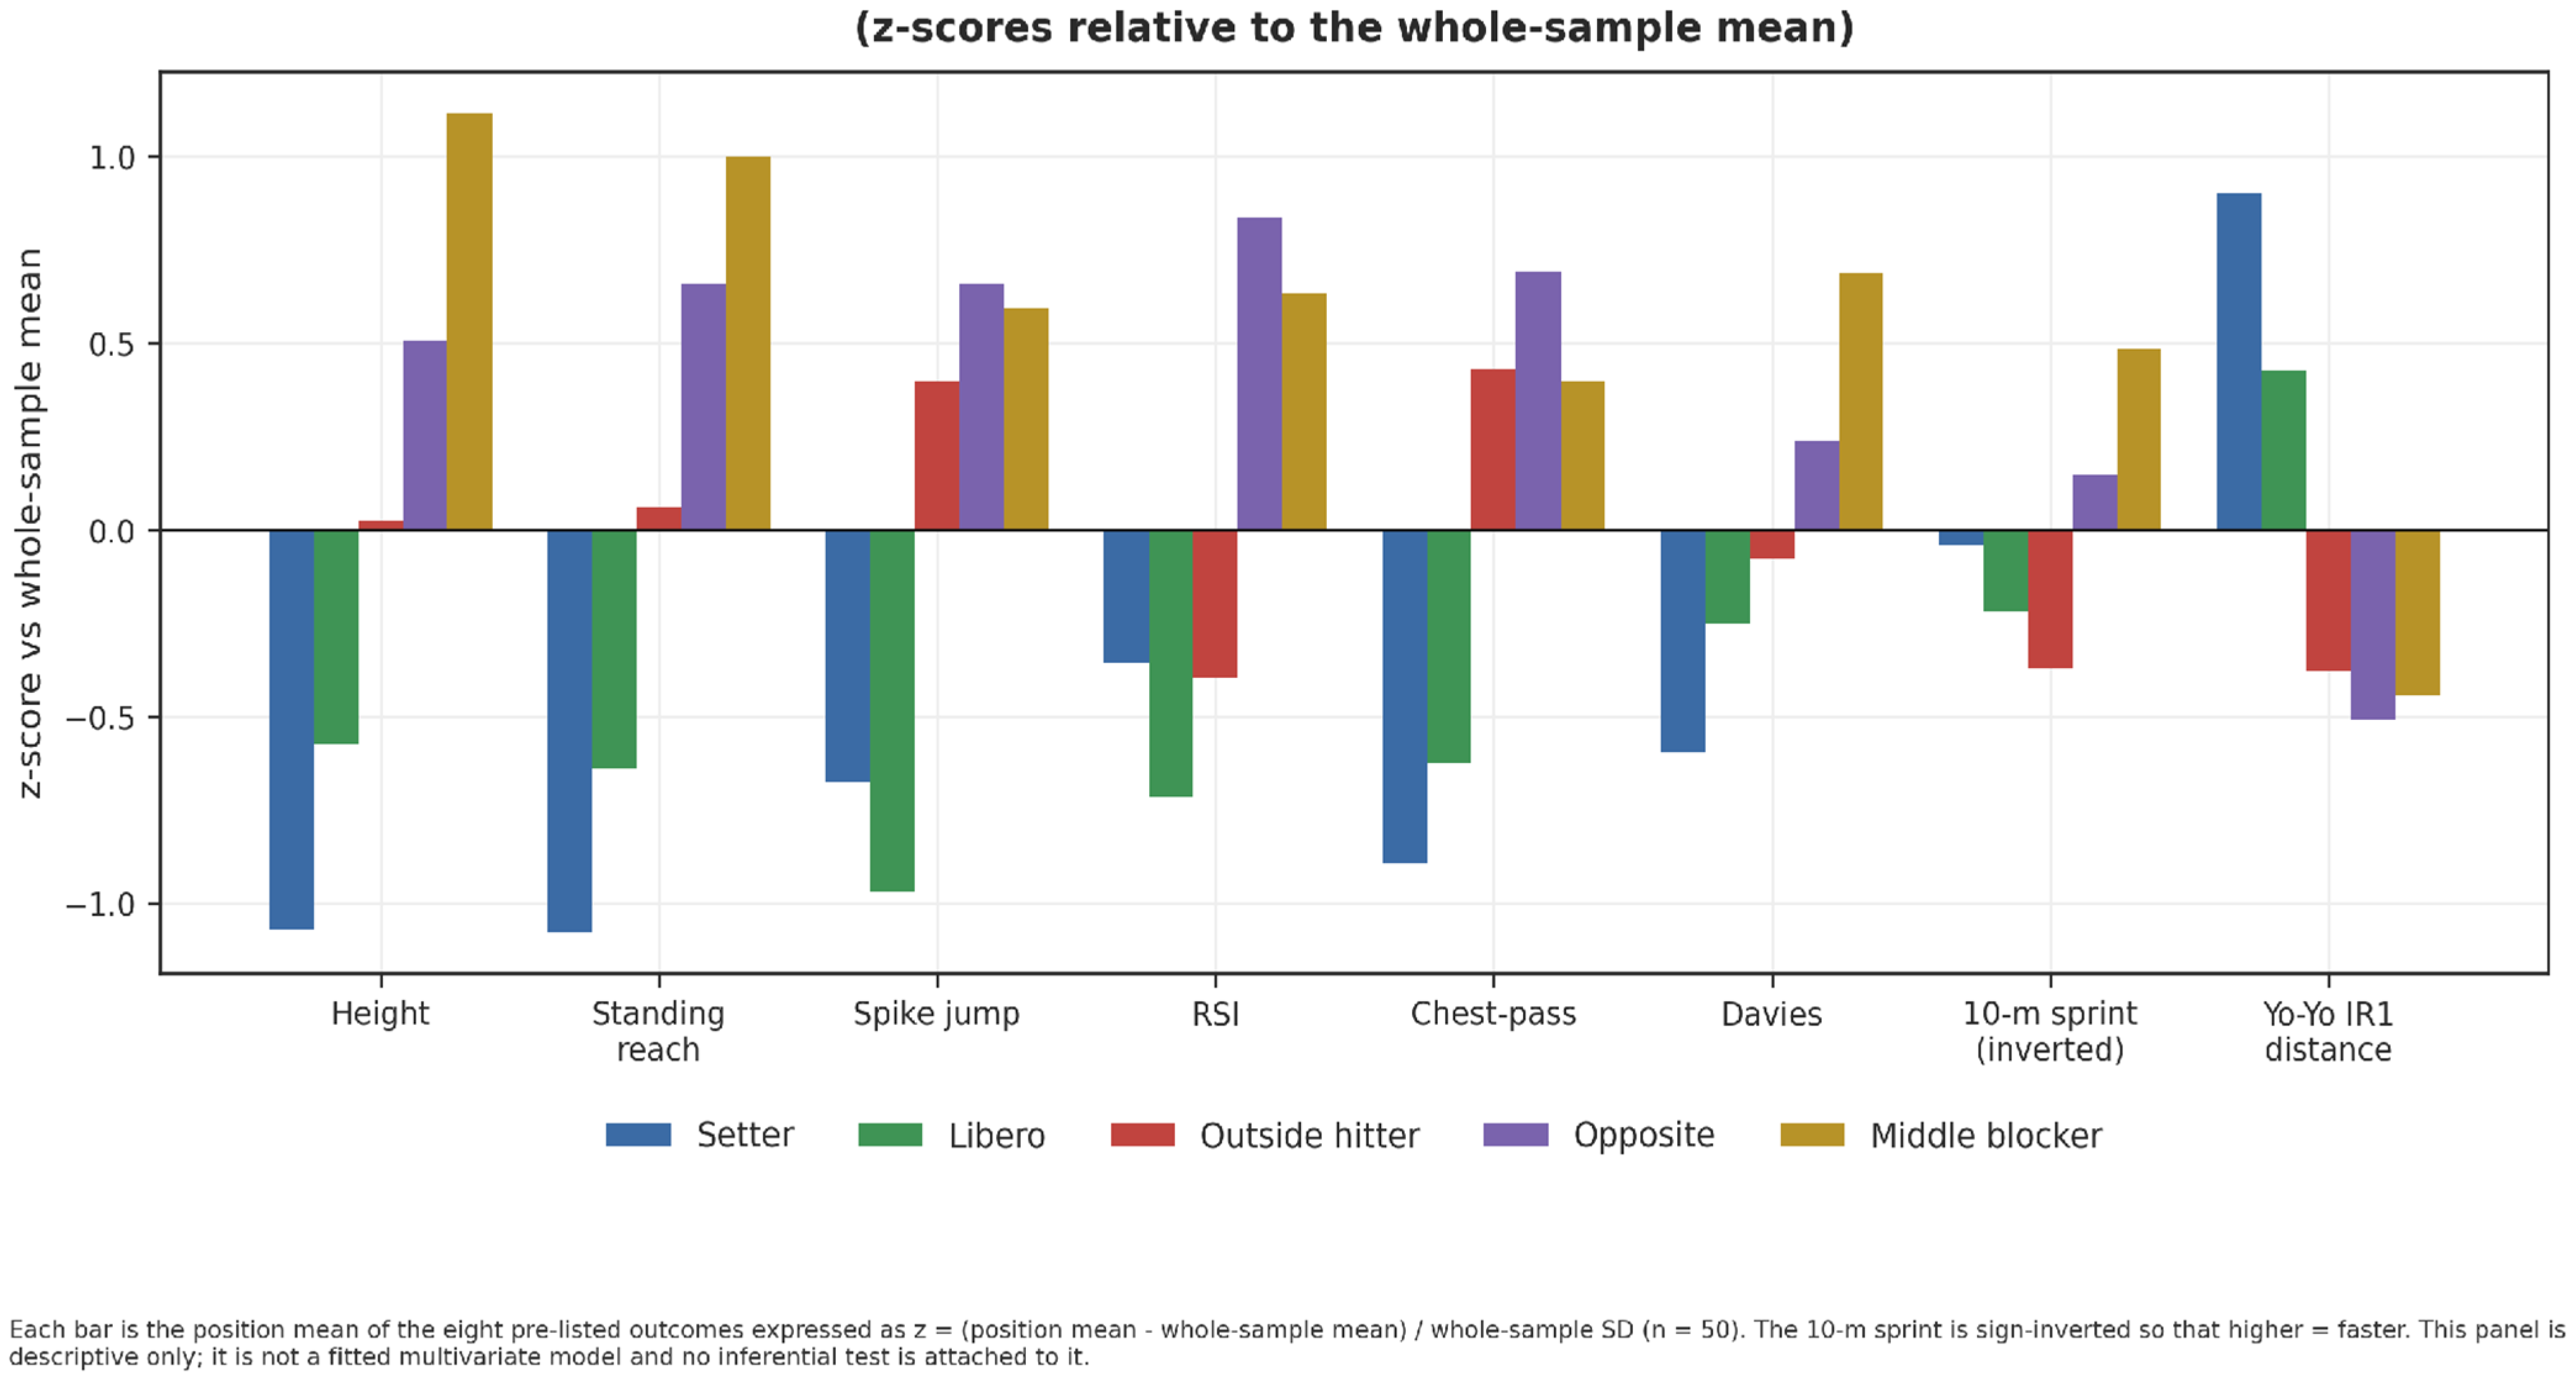
Despite this substantial literature, few studies have combined anthropometry with lower- and upper-body field-test performance, reactive strength, short-sprint and intermittent-recovery capacity in a single cohort of adult elite female volleyball players, and none has done so in Turkish top-flight athletes. Several previous studies have also aggregated attacking positions or have not analysed all five roles within a single female cohort combining anthropometric and multi-domain performance measures [7,28]. The present study is framed as a multi-domain descriptive comparison rather than as a fitted multivariate model: every outcome is analysed separately, and the composite z-score display (Figure 1) is a descriptive summary of a pre-specified subset of outcomes, not an inferential profile analysis, and no composite index of profile “balance” was computed. Therefore, the present study aimed to describe and compare anthropometric, jumping, upper-body throwing, short-sprint and intermittent-recovery profiles in five clearly defined court positions in elite Turkish female volleyball players. We hypothesised that middle blockers and opposites would display the largest height, standing reach and vertical-jump values, setters and liberos the smallest, with outside hitters occupying an intermediate profile, and that setters and liberos would cover the greatest Yo-Yo IR1 distance.
Figure 1.
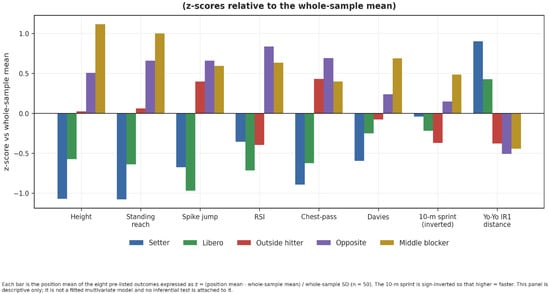
Descriptive multi-domain position profiles expressed as z-scores relative to the whole-sample mean. Each bar is (position mean—whole-sample mean) divided by the whole-sample standard deviation for one of eight pre-specified outcomes, chosen to represent one indicator per measurement domain; the 10 m sprint is sign-inverted so that higher values denote faster times. This figure is a descriptive summary only: it is not a fitted multivariate model, no composite or profile-“balance” index was computed, and no inferential test is attached to it. Middle blockers and opposites are displaced upwards on height, standing reach and the explosive tasks; setters on Yo-Yo IR1 distance; outside hitters lie close to the whole-sample mean on most outcomes.
2. Materials and Methods
2.1. Study Design and Participants
A cross-sectional, observational design was used. Fifty elite female volleyball players who competed in the Turkish first-division Sultans League during the 2024–2025 competitive season were recruited from several top-flight Sultans League clubs, which enabled the recruitment of ten athletes in each of the five court positions. Sampling was non-probabilistic. Players were recruited from the participating clubs by convenience, subject to an a priori quota of ten athletes per court position; no randomisation and no league-wide sampling frame were used. Eligibility was established against the criteria below in consultation with each club’s coaching staff, and recruitment for a given position ceased once its quota had been met. No player was selected on the basis of her anthropometric or performance characteristics. No prospective screening log was maintained, so the number of players assessed for eligibility and a formal participation rate cannot be reported; this is stated as a limitation. Because a fixed quota was filled non-randomly, selective inclusion—for example over-representation of the tallest or most readily available middle blockers—cannot be excluded, and this is revisited in the Limitations. Inclusion criteria were (i) chronological age 18–30 years; (ii) a minimum of five years of systematic volleyball training; (iii) a clearly defined primary court position (setter, libero, outside hitter, opposite or middle blocker) as verified by the coaching staff; and (iv) freedom from musculoskeletal injury or illness in the four weeks preceding testing. Primary court position was the role designated by the head coach as the athlete’s principal competitive position for the 2024–2025 season—that is, the position she occupied in the starting rotation and for the greater part of her match play—rather than the position in which she was trained. Rotation counts and match-minute records were not extracted independently, so coach designation was the operative criterion. Players fielded regularly in more than one role without a coach-designated primary position were excluded; nevertheless, residual positional flexibility—most plausibly between outside hitters and opposites—cannot be entirely ruled out, and the absence of quantitative match-role verification is stated as a limitation. Players were excluded if they occupied more than one court position without a coach-verified primary role, had fewer than five years of systematic training, had sustained a musculoskeletal injury or acute illness within the four weeks before testing, or were unable to complete the full test battery. An a priori power analysis for a five-group one-way ANOVA (α = 0.05, power = 0.80), computed with G*Power 3.1 and cross-checked in statsmodels, indicated that detecting a large effect of Cohen’s f = 0.60 requires a total of 39 players and f = 0.70 requires 30 players; the recruited sample of 50 (ten per position) therefore provided ≥80% power to detect between-position effects of approximately f ≥ 0.51. Ten players per position was adopted as a balanced and logistically feasible design, appropriate for the large anthropometric and jump effects previously reported in elite volleyball, while acknowledging more limited sensitivity to small and moderate effects. Beyond the ≥5-year inclusion criterion, training age, cumulative competitive experience and current weekly training and competition load were not quantified and are therefore not reported by position. Their absence is stated explicitly as a limitation, because they may differ between positions and could independently influence both jump and intermittent-recovery outcomes. All players provided written informed consent prior to assessment.
2.2. Ethics
The study was conducted in accordance with the Declaration of Helsinki. Ethical approval was obtained from the Health Sciences Ethics Committee of Çankırı Karatekin University (meeting no. 16; decision date 15 October 2024) prior to participant recruitment and data collection. Written informed consent was obtained from every participant, and the right to withdraw at any point without penalty was explicitly stated.
2.3. Procedures
All assessments were conducted over two consecutive days during the early competitive phase of the 2024–2025 season, at the same time of day (10:00–14:00) at a single indoor testing venue (ambient temperature 21 ± 1 °C, relative humidity 45–55%). Participants were familiarised with the test battery in the preceding training week. On each testing day, athletes performed a standardised 15 min warm-up including low-intensity jogging, dynamic mobility drills and progressive jump and sprint activations. Tests were performed in the following fixed order to minimise interference: (i) anthropometric measurements, (ii) medicine-ball throws, (iii) Davies test, (iv) countermovement, block and spike jumps, (v) drop jump, (vi) standing long jump, (vii) 10 m sprint, and (viii) Yo-Yo IR1. Five minutes of passive recovery separated successive tests. The best of three attempts was retained for all jump and throw trials; for sprint and Yo-Yo tests, single trials were performed. The eight tests were distributed across the two testing days without any change to the fixed order given above, the sequence being divided between the upper-body block and the lower-body block: the anthropometric measurements, both medicine-ball throws and the Davies test (i–iii) were completed on the first day, and the three vertical jumps, the drop jump, the standing long jump, the 10 m sprint and the Yo-Yo IR1 (iv–viii) on the second. Within each jump and throw test, the three trials were separated by at least 60 s of passive rest, and five minutes of passive recovery separated successive tests. All measurements were performed by the same investigators throughout the study, with each test administered by the same assessor for every athlete, so that no between-assessor variation was introduced across the positional groups. Because only the best of the three attempts was retained in the study database, within-session coefficients of variation could not be computed retrospectively; the absence of trial-level reliability data is acknowledged as a limitation. Athletes were asked to avoid strenuous training and competition in the 48 h preceding each testing day, to maintain their habitual diet, to abstain from caffeine and other stimulants for 12 h before testing, and to sleep at least 7 h on the preceding night; compliance was confirmed verbally on arrival. All tests were performed in the athletes’ own indoor court footwear on the same indoor volleyball court surface throughout. Only one maximal 10 m sprint trial was recorded, in order to limit the neuromuscular load imposed before the Yo-Yo IR1 on the same testing day. A single trial is nevertheless vulnerable to technical error and may under-represent true maximal acceleration; this is taken into account when interpreting the absence of positional differences in sprint time. The test order was fixed rather than randomised so that every athlete completed the battery under identical conditions, and so that the most fatiguing tasks were placed last. Randomisation would have introduced between-athlete order effects that cannot be estimated with ten players per position. A fixed sequence does, however, mean that any systematic residual fatigue is shared by all groups: tests performed late in the sequence—in particular the Yo-Yo IR1, which followed the jump and sprint tasks—may yield absolute values lower than would be obtained in a fully rested state. Because the order was identical for every participant, this is expected to affect the absolute calibration of these outcomes rather than the between-position comparisons that are the focus of the study, but it does limit direct comparison of the present absolute values with studies that used rested or randomised protocols.
2.4. Anthropometry
Body height was measured to the nearest 0.1 cm with a wall-mounted stadiometer (Seca 213, Hamburg, Germany), and body mass with a calibrated electronic scale to the nearest 0.1 kg (Seca 876). BMI was computed as body mass (kg) divided by stature squared (m2). Standing reach was measured to the nearest 0.01 m with the participant standing erect, feet flat on the floor and the dominant arm fully extended vertically overhead, as the distance from the floor to the tip of the middle finger. Waist and hip circumferences were measured with a non-elastic anthropometric tape (Seca 201) at the narrowest point of the abdomen and the greatest posterior protrusion of the buttocks, respectively, following ISAK guidelines [12]. Waist-to-hip ratio was computed by dividing waist by hip circumference.
2.5. Physical-Performance (Field) Tests
Vertical jumps (CMJ, block jump and spike jump) were performed on a floor-mounted optical photocell system (Optojump Next, Microgate, Bolzano, Italy) with a sampling frequency of 1000 Hz. CMJ was executed with hands on hips; block jump used a symmetric double-arm swing and a vertical reach simulating a block; spike jump followed a self-selected 2–3 step approach ending in a single-leg-plant double-leg take-off. The standing long jump (SLJ) was measured to the nearest 1 cm from the front of the take-off line to the closest body-part contact upon landing. Drop jump (DJ) was performed from a 30 cm box, with contact time (CT) and flight time (FT) captured by Optojump. Jump height for DJ was calculated as (g·FT2)/8, and the reactive strength index (RSI) as DJ height divided by contact time, following Flanagan and Comyns [17] and Markwick et al. [18]. Drop-jump height was converted from centimetres to metres, and contact time expressed in seconds, before the ratio was computed, so that RSI is reported in m·s−1 throughout the manuscript even though jump heights are tabulated in centimetres. Upper-body throwing performance was quantified with the seated chest-pass and seated overhead medicine-ball throws using a 3 kg medicine ball, following Stockbrugger and Haennel [19]. Distance was measured from the wall to the closest impression on a measuring tape. The Davies test was performed as described by Goldbeck and Davies [22]: in a prone push-up position, participants touched alternate hands as many times as possible in 15 s. The total touches are reported. Linear speed was assessed via a 10 m sprint with electronic timing gates (Witty, Microgate, Italy) from a standing start, with the beam at 0.4 m height. Yo-Yo IR1 was performed according to Bangsbo et al. [26]. The total distance covered (m) is the directly measured Yo-Yo IR1 outcome and is therefore reported as the primary intermittent-recovery variable. Estimated VO2max was additionally derived from that distance using VO2max = (distance × 0.0084) + 36.4 [26,27]; because this equation is a strictly linear transformation of Yo-Yo IR1 distance, the two variables carry identical statistical information and are treated as a single outcome in all analyses. The regression equation was derived in general intermittent-sport and field-sport populations and, to our knowledge, has not been validated specifically in elite female volleyball players. The estimated value is therefore used throughout as an indirect proxy for intermittent-recovery capacity and not as an independently measured physiological variable. Throughout the manuscript, jump height, medicine-ball throw distance, Davies-test touches and sprint time are reported as field-test measures of explosive performance. Because no force-platform, velocity-transducer or dynamometric data were collected, these outcomes are indirect indicators of explosive capability and are not direct measurements of mechanical power; the term “power” is consequently avoided when referring to the test results.
2.6. Statistical Analysis
Data are reported as mean ± standard deviation. Normality was examined with the Shapiro–Wilk test on model residuals (with the D’Agostino–Pearson K2 omnibus test as a supplementary check), and homogeneity of variance with Levene’s test (median-centred). Levene’s test was non-significant for all nineteen variables (all p ≥ 0.12); accordingly, a standard one-way analysis of variance (ANOVA) with (4, 45) degrees of freedom was used as the primary model for every variable, and Welch’s ANOVA—computed as a sensitivity analysis—did not alter which variables reached significance. Post hoc comparisons were conducted with the Games–Howell procedure, which is robust to heteroscedasticity and unequal group sizes. Partial η2 served as the effect-size estimate for ANOVA (small ≥ 0.01, medium ≥ 0.06, large ≥ 0.14) [29]. For pairwise contrasts, Cohen’s d was reported (small ≥ 0.2, medium ≥ 0.5, large ≥ 0.8, very large ≥ 1.2) [30]. Alpha was set at 0.05. Because nineteen omnibus tests (one per measured variable) were conducted, the false-discovery rate was controlled with the Benjamini–Hochberg procedure applied to the nineteen ANOVA p-values; fourteen of the nineteen outcomes remained significant after correction. Drop-jump height survived correction (raw p = 0.024, adjusted p = 0.033); whereas, the Davies test did not (raw p = 0.041, adjusted p = 0.052). Results that did not pass this prespecified omnibus FDR gate—the Davies test in particular—are reported separately and labelled exploratory throughout the Results, Tables and Figures, and are not counted among the confirmatory findings. In addition to the family-wise control that the Games–Howell procedure provides within each variable, the Benjamini–Hochberg procedure was applied a second time across the complete set of 180 pairwise contrasts. Of the 58 contrasts with an uncorrected p < 0.05, 38 remained significant after this global correction; the remaining 20 are flagged in Table 1 and are treated as exploratory. All pairwise results are regarded as hypothesis-generating rather than confirmatory. Ninety-five per cent confidence intervals are reported for every pairwise mean difference (derived from the Games–Howell studentised-range critical value) and for Cohen’s d (large-sample approximation), so that the precision of each point estimate can be judged; with ten players per position, even very large point estimates of d carry wide intervals. Because the positional groups differed markedly in stature and body mass, three prespecified sensitivity analyses were carried out to separate absolute field-test performance from size-independent physical capacity. First, every performance outcome was re-analysed by analysis of covariance with body height as a covariate. Second, waist and hip circumferences were re-expressed as a percentage of stature and re-analysed. Third, the two medicine-ball throw distances were allometrically scaled to body mass, with the scaling exponent estimated from the present sample by log–log regression. Kruskal–Wallis tests were run for all nineteen outcomes as a prespecified distribution-free check on the parametric models, with Benjamini–Hochberg correction applied to the resulting p-values; these results—including the waist-to-hip ratio—are reported in the Results section rather than introduced in the Discussion. Because the design provided ≥80% power only for large effects (f ≥ 0.51), non-significant omnibus results are interpreted as inconclusive rather than as evidence of positional equivalence. For the descriptive profile display (Figure 1), eight pre-specified outcomes—height, standing reach, spike jump, reactive strength index, seated chest-pass throw, Davies test, 10 m sprint and Yo-Yo IR1 distance, chosen to represent one indicator per measurement domain—were each converted to a z-score computed as (position mean—whole-sample mean) divided by the whole-sample standard deviation, with the 10 m sprint sign-inverted so that higher values denote faster times. No inferential test is attached to this display, and no composite index or formal measure of profile “balance” was computed. All fifty athletes completed the full test battery, so every analysis comprised complete data (N = 50) with (4, 45) degrees of freedom, or (4, 44) where height was entered as a covariate. Analyses were carried out in Python 3.12 (NumPy 1.26.4, pandas 2.2.x, SciPy 1.13.x, statsmodels 0.14.x and pingouin 0.5.x) and independently cross-validated against R 4.4.x; figures were produced with Matplotlib 3.8.4. The complete variable-by-variable output, including the Games–Howell post-hoc comparisons with confidence intervals, Levene’s test results, and raw and FDR-adjusted p-values, was incorporated into the main manuscript where relevant. Covariate-adjusted and allometrically scaled sensitivity analyses were also conducted and reported in the manuscript.
Table 1.
Exploratory pairwise Games–Howell comparisons across playing positions (all 58 of 180 contrasts with an uncorrected p < 0.05). Mean difference and Cohen’s d are Position A minus Position B and are reported with 95% confidence intervals; q is the Benjamini–Hochberg-adjusted p-value computed across the complete set of 180 contrasts. Contrasts marked † did not survive this global correction. All entries in this table are hypothesis-generating rather than confirmatory.
3. Results
Players’ chronological age did not differ between positions (F(4,45) = 0.21, p = 0.932, η2 = 0.02); the groups were thus comparable in age, although a non-significant test cannot by itself exclude residual age-related confounding. The five positional groups differed significantly on 15 of the remaining 18 variables at the omnibus level (Table 2), and fourteen of these survived Benjamini–Hochberg FDR correction; the Davies test did not survive correction (raw p = 0.041, adjusted p = 0.052) and is therefore reported as an exploratory finding rather than as a confirmatory positional difference. Only the standing long jump (F(4,45) = 1.60, p = 0.192, η2 = 0.12), 10 m sprint (F(4,45) = 1.13, p = 0.357, η2 = 0.09) and waist-to-hip ratio (F(4,45) = 2.08, p = 0.100, η2 = 0.16) were statistically similar across positions. Given that the design provided ≥80% power only for large effects, these three null results are inconclusive rather than evidence of positional equivalence: the largest observed pairwise effect sizes were still moderate to large (|d| = 1.21 for the standing long jump, 1.17 for waist-to-hip ratio and 0.80 for the 10 m sprint), so genuine small-to-moderate positional differences in these outcomes cannot be excluded. The prespecified Kruskal–Wallis checks agreed with the parametric models for every outcome except the waist-to-hip ratio, for which the distribution-free test was significant (H(4) = 14.09, p = 0.007; FDR-adjusted p = 0.009). Because the entire span of group means was 0.77–0.79—narrower than the practical resolution of tape measurement—this discrepancy is attributed to rank-level separation of a heavily rounded variable rather than to a meaningful positional difference. The waist-to-hip ratio is accordingly treated throughout as showing no practically relevant positional difference, and this analysis is reported here, in the Results, rather than being introduced post hoc in the Discussion. Complete descriptive statistics, ANOVA results and effect sizes are summarised in Table 2; all pairwise contrasts with an uncorrected p < 0.05 (Games–Howell) are reported in Table 1, together with 95% confidence intervals and globally FDR-corrected p-values.
Table 2.
Anthropometric and field-test performance variables by playing position (mean ± SD, n = 10 per position) with one-way ANOVA F(4,45), raw p-value, partial η2 and Benjamini–Hochberg FDR-adjusted p-value (final two columns).
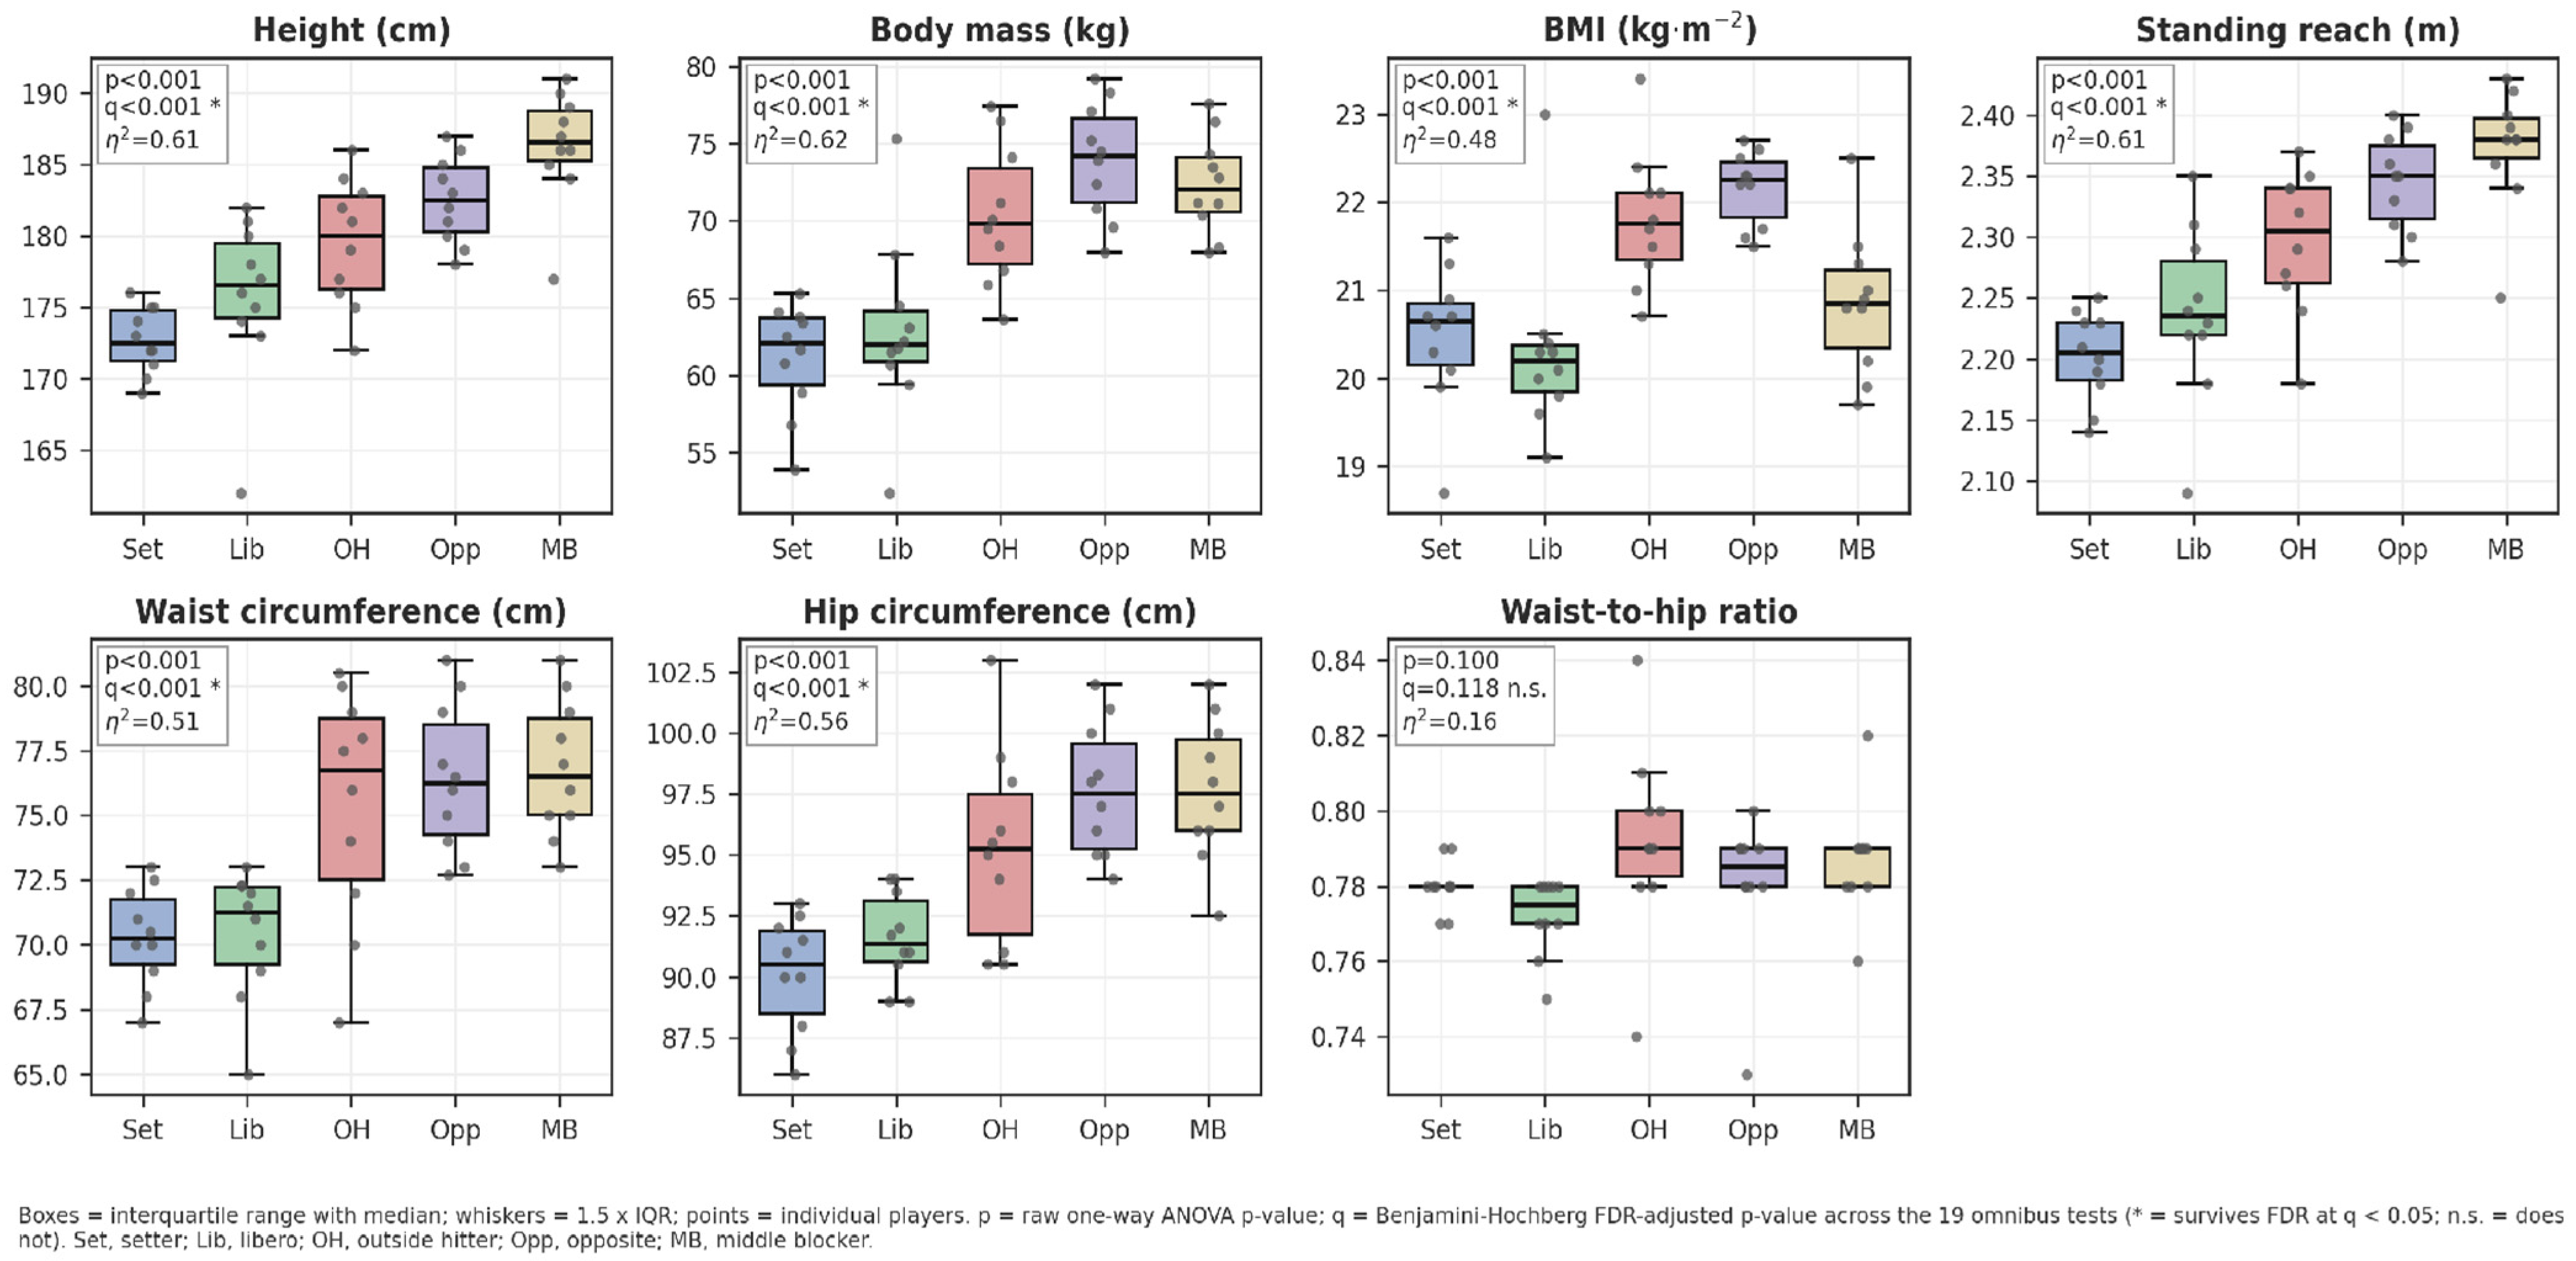
Body height differed significantly across positions (F(4,45) = 17.48, p < 0.001, η2 = 0.61). Middle blockers were tallest (186.3 ± 3.9 cm), followed by opposites (182.5 ± 3.0 cm), outside hitters (179.5 ± 4.5 cm), liberos (175.8 ± 5.7 cm) and setters (172.7 ± 2.3 cm). Games–Howell post hoc tests showed that setters were significantly shorter than outside hitters, opposites and middle blockers, and that middle blockers were significantly taller than setters, liberos and outside hitters; the middle-blocker–opposite difference was not significant (p = 0.16). A closely parallel pattern was observed for standing reach (F(4,45) = 17.95, p < 0.001, η2 = 0.62), which is consistent with the hypertrophic/ectomorphic somatotype of attacking positions in elite female volleyball [5,12]. Body mass (F(4,45) = 18.03, p < 0.001, η2 = 0.62) and BMI (F(4,45) = 10.58, p < 0.001, η2 = 0.49) were highest in opposites (73.9 ± 3.7 kg; 22.2 ± 0.4 kg·m−2) and lowest in setters/liberos (≈ 61–63 kg; 20.3–20.5 kg·m−2). Waist and hip circumferences showed the same setter/libero < attack positions gradient (both p < 0.001); whereas, WHR was essentially invariant (0.77–0.79; p = 0.100). Figure 2 displays the full distributions. Within-position variability was appreciable for several anthropometric variables. The standard deviation for stature ranged from 2.3 cm in setters (coefficient of variation, CV = 1.3%) to 5.7 cm in liberos (CV = 3.2%), and that for body mass from 3.2 kg in middle blockers (CV = 4.4%) to 5.9 kg in liberos (CV = 9.4%); the corresponding range for standing reach was 0.04 m (CV = 1.7%) in setters and opposites to 0.07 m (CV = 3.2%) in liberos. The libero group therefore spans a considerably wider morphological range than any other position, and the descriptive values reported here should be read as central tendencies for internally heterogeneous groups rather than as tight position-specific norms. Practically, this means that individual athletes routinely fall outside the interquartile range of their own position, so the values in Table 2 are unsuitable as inclusion or exclusion thresholds for individual players. Because waist and hip circumferences scale with overall body size, both were re-expressed relative to stature. The positional differences persisted but were markedly attenuated: waist circumference expressed as a percentage of stature differed across positions with η2 = 0.23 (F(4,45) = 3.41, p = 0.016), compared with η2 = 0.51 for the unadjusted measurement, and the corresponding values for hip circumference were η2 = 0.20 (F(4,45) = 2.86, p = 0.034) versus η2 = 0.56. Analysis of covariance with height as a covariate gave the same picture (waist: F(4,44) = 2.65, p = 0.046; hip: F(4,44) = 2.63, p = 0.047), with height itself a highly significant covariate in both models (both p < 0.001). A substantial part of the apparent circumference difference between defensive and net-oriented positions is therefore attributable to stature rather than to regional adiposity or trunk girth per se, and the unadjusted circumference values in Table 2 should be interpreted with that in mind.
Figure 2.
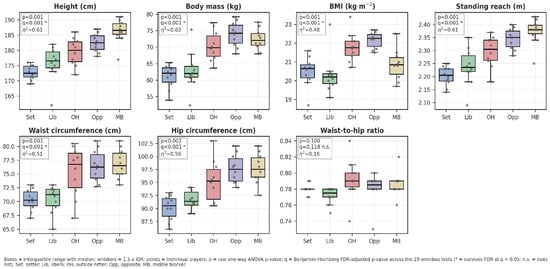
Anthropometric characteristics by playing position. Boxes show the interquartile range with the median (black line); whiskers extend to 1.5 × IQR; individual players are overlaid as points. Each panel reports the raw one-way ANOVA p-value, the Benjamini–Hochberg FDR-adjusted p-value (q) and partial η2; * marks an outcome that survived FDR correction at q < 0.05 and n.s. one that did not. A waist-to-hip-ratio panel has been added so that all seven anthropometric outcomes are displayed, and the figure has been resized to fit within the page margins. Set, setter; Lib, libero; OH, outside hitter; Opp, opposite; MB, middle blocker.
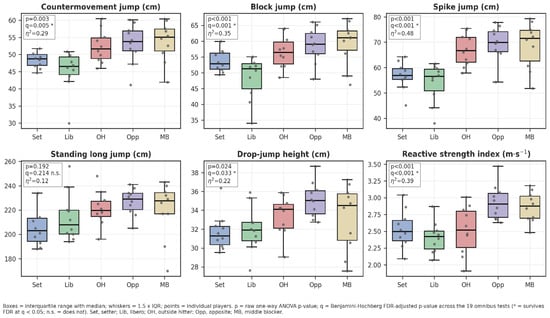
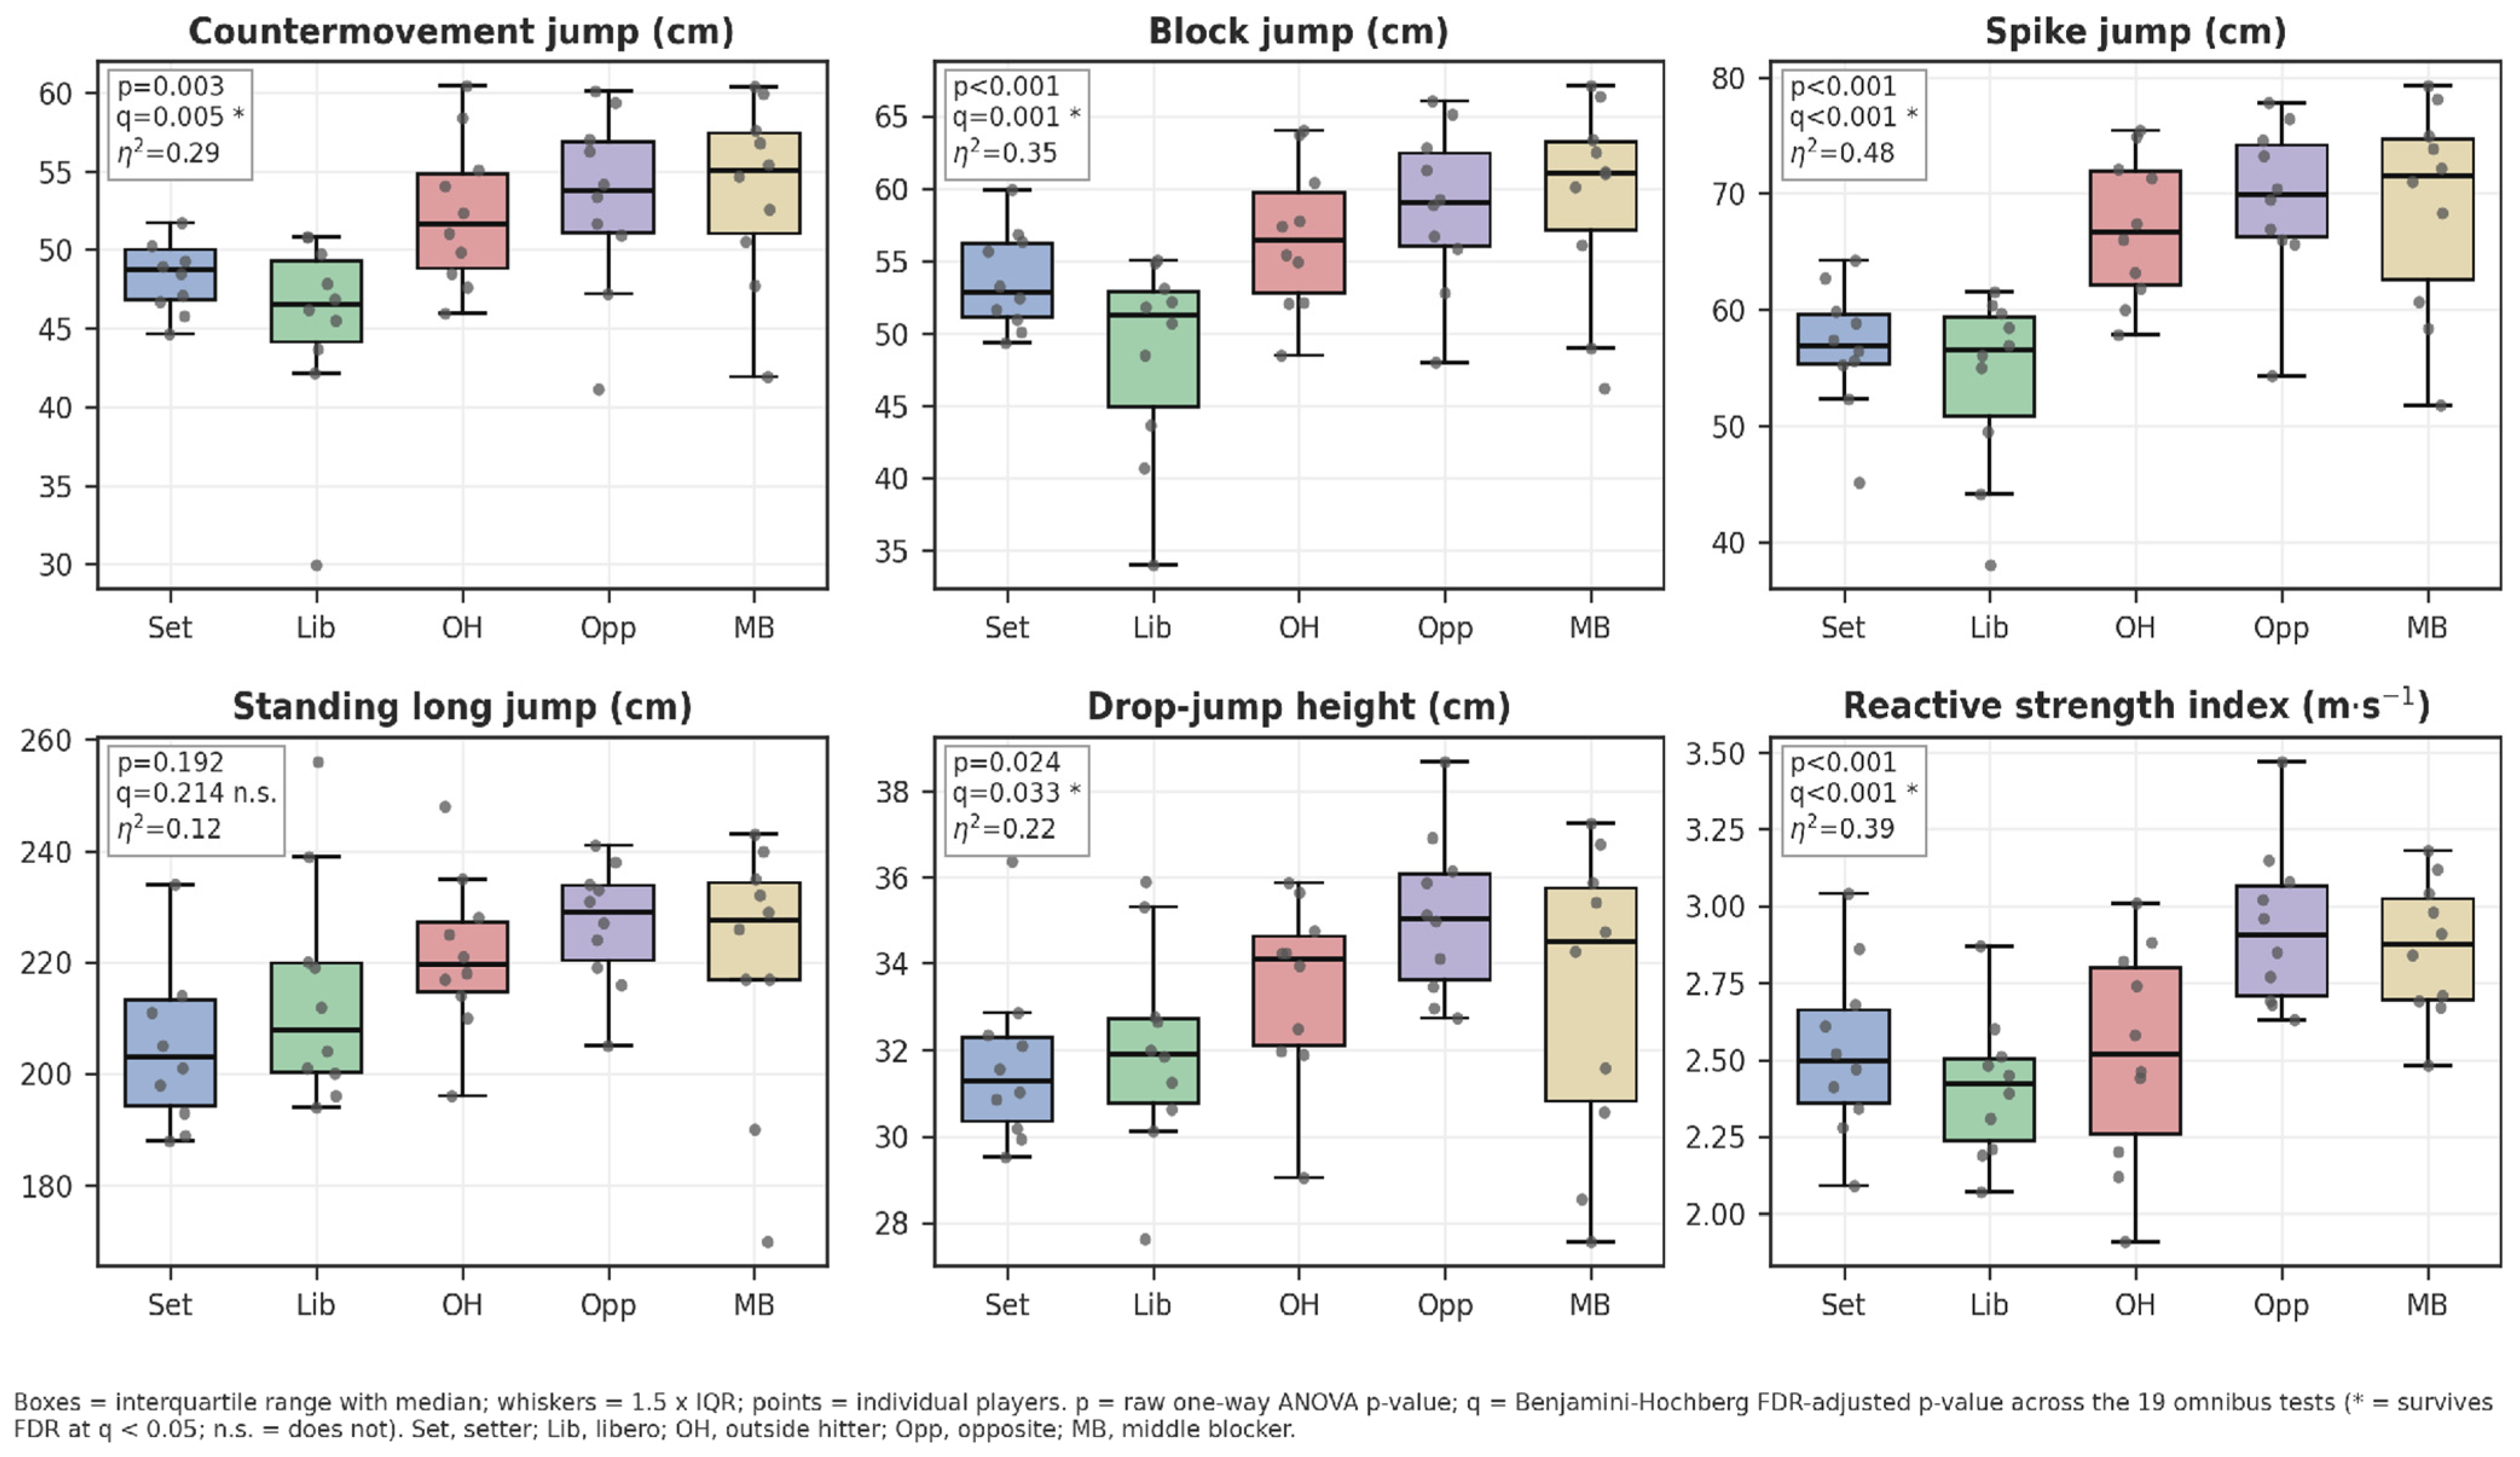
CMJ (F(4,45) = 4.64, p = 0.003, η2 = 0.29), block jump (F(4,45) = 5.98, p < 0.001, η2 = 0.35) and spike jump (F(4,45) = 10.31, p < 0.001, η2 = 0.48) all differed significantly between positions. The net-oriented attackers (middle blockers, opposites and outside hitters) consistently produced the highest vertical-jump outputs, and liberos the lowest. After Games–Howell correction, the spike jump was the most position-sensitive task, with liberos significantly lower than outside hitters, opposites and middle blockers and setters lower than outside hitters, opposites and middle blockers (Cohen’s d = 1.6–2.1). For block jump, only the libero–opposite and libero–middle-blocker contrasts reached significance, and for CMJ only the libero–middle-blocker contrast did; the remaining pairwise jump differences were non-significant once heteroscedasticity-robust correction was applied (Table 1; Figure 3). Drop-jump height was largest in opposites (35.1 ± 1.9 cm) and smallest in setters (31.7 ± 2.0 cm; p = 0.024, η2 = 0.22), with significant pairwise differences for opposite–setter and opposite–libero only. The RSI showed one of the largest positional effects in the battery (F(4,45) = 7.07, p < 0.001, η2 = 0.39): opposites (2.93 ± 0.26) and middle blockers (2.86 ± 0.22) displayed numerically greater reactive strength than setters (2.53 ± 0.28), liberos (2.41 ± 0.23) and outside hitters (2.52 ± 0.36); Games–Howell contrasts were significant for libero–opposite, libero–middle-blocker and setter–opposite, echoing the stretch-shortening cycle advantage reported for height-dependent attacking roles [15,17]. When body height was entered as a covariate, the positional differences in countermovement jump (F(4,44) = 2.67, p = 0.044, partial η2 = 0.20), block jump (F(4,44) = 2.78, p = 0.038, partial η2 = 0.20), spike jump (F(4,44) = 3.92, p = 0.008, partial η2 = 0.26) and reactive strength index (F(4,44) = 3.49, p = 0.015, partial η2 = 0.24) all remained significant, although the effect sizes were roughly one-third smaller than in the unadjusted models. Drop-jump height did not survive this adjustment (F(4,44) = 1.61, p = 0.190). Between-position differences in vertical jumping and reactive strength are therefore not simply a by-product of stature; whereas, the drop-jump height contrast may be. In contrast, the standing long jump did not differ across positions (p = 0.192, η2 = 0.12). The horizontal task shares the bilateral concentric demand of the vertical jumps but adds a substantial horizontal impulse and a technical landing component that elite volleyball players do not train, so it discriminates positions less sharply than the sport-specific vertical tasks; the same conclusion held after adjustment for height (F(4,44) = 0.62, p = 0.651). The observed group means nevertheless ranged over almost 19 cm (setters 207.9 ± 19.2 cm to opposites 226.8 ± 11.0 cm) with a largest pairwise |d| of 1.21, and the within-position standard deviations were the largest in the whole battery (11–23 cm). This combination of a moderate mean separation and high within-group dispersion, rather than a genuine absence of positional differences, is the most plausible explanation for the non-significant omnibus test at n = 10 per group.
Figure 3.
Jump and reactive-strength performance by playing position. Countermovement, block and spike jumps, standing long jump, drop-jump height and reactive strength index. RSI is expressed in m·s−1 (drop-jump height in metres divided by contact time in seconds), consistent with the Methods definition. Each panel reports the raw ANOVA p-value, the FDR-adjusted p-value (q) and partial η2, with * and n.s. indicating whether the outcome survived FDR correction. Annotations and abbreviations as in Figure 4.
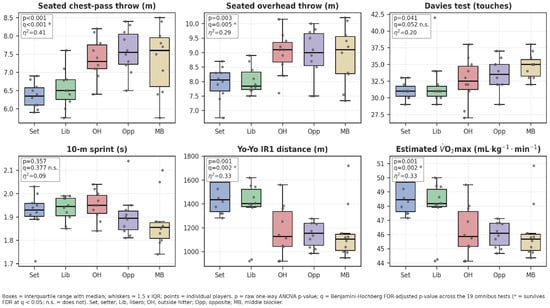
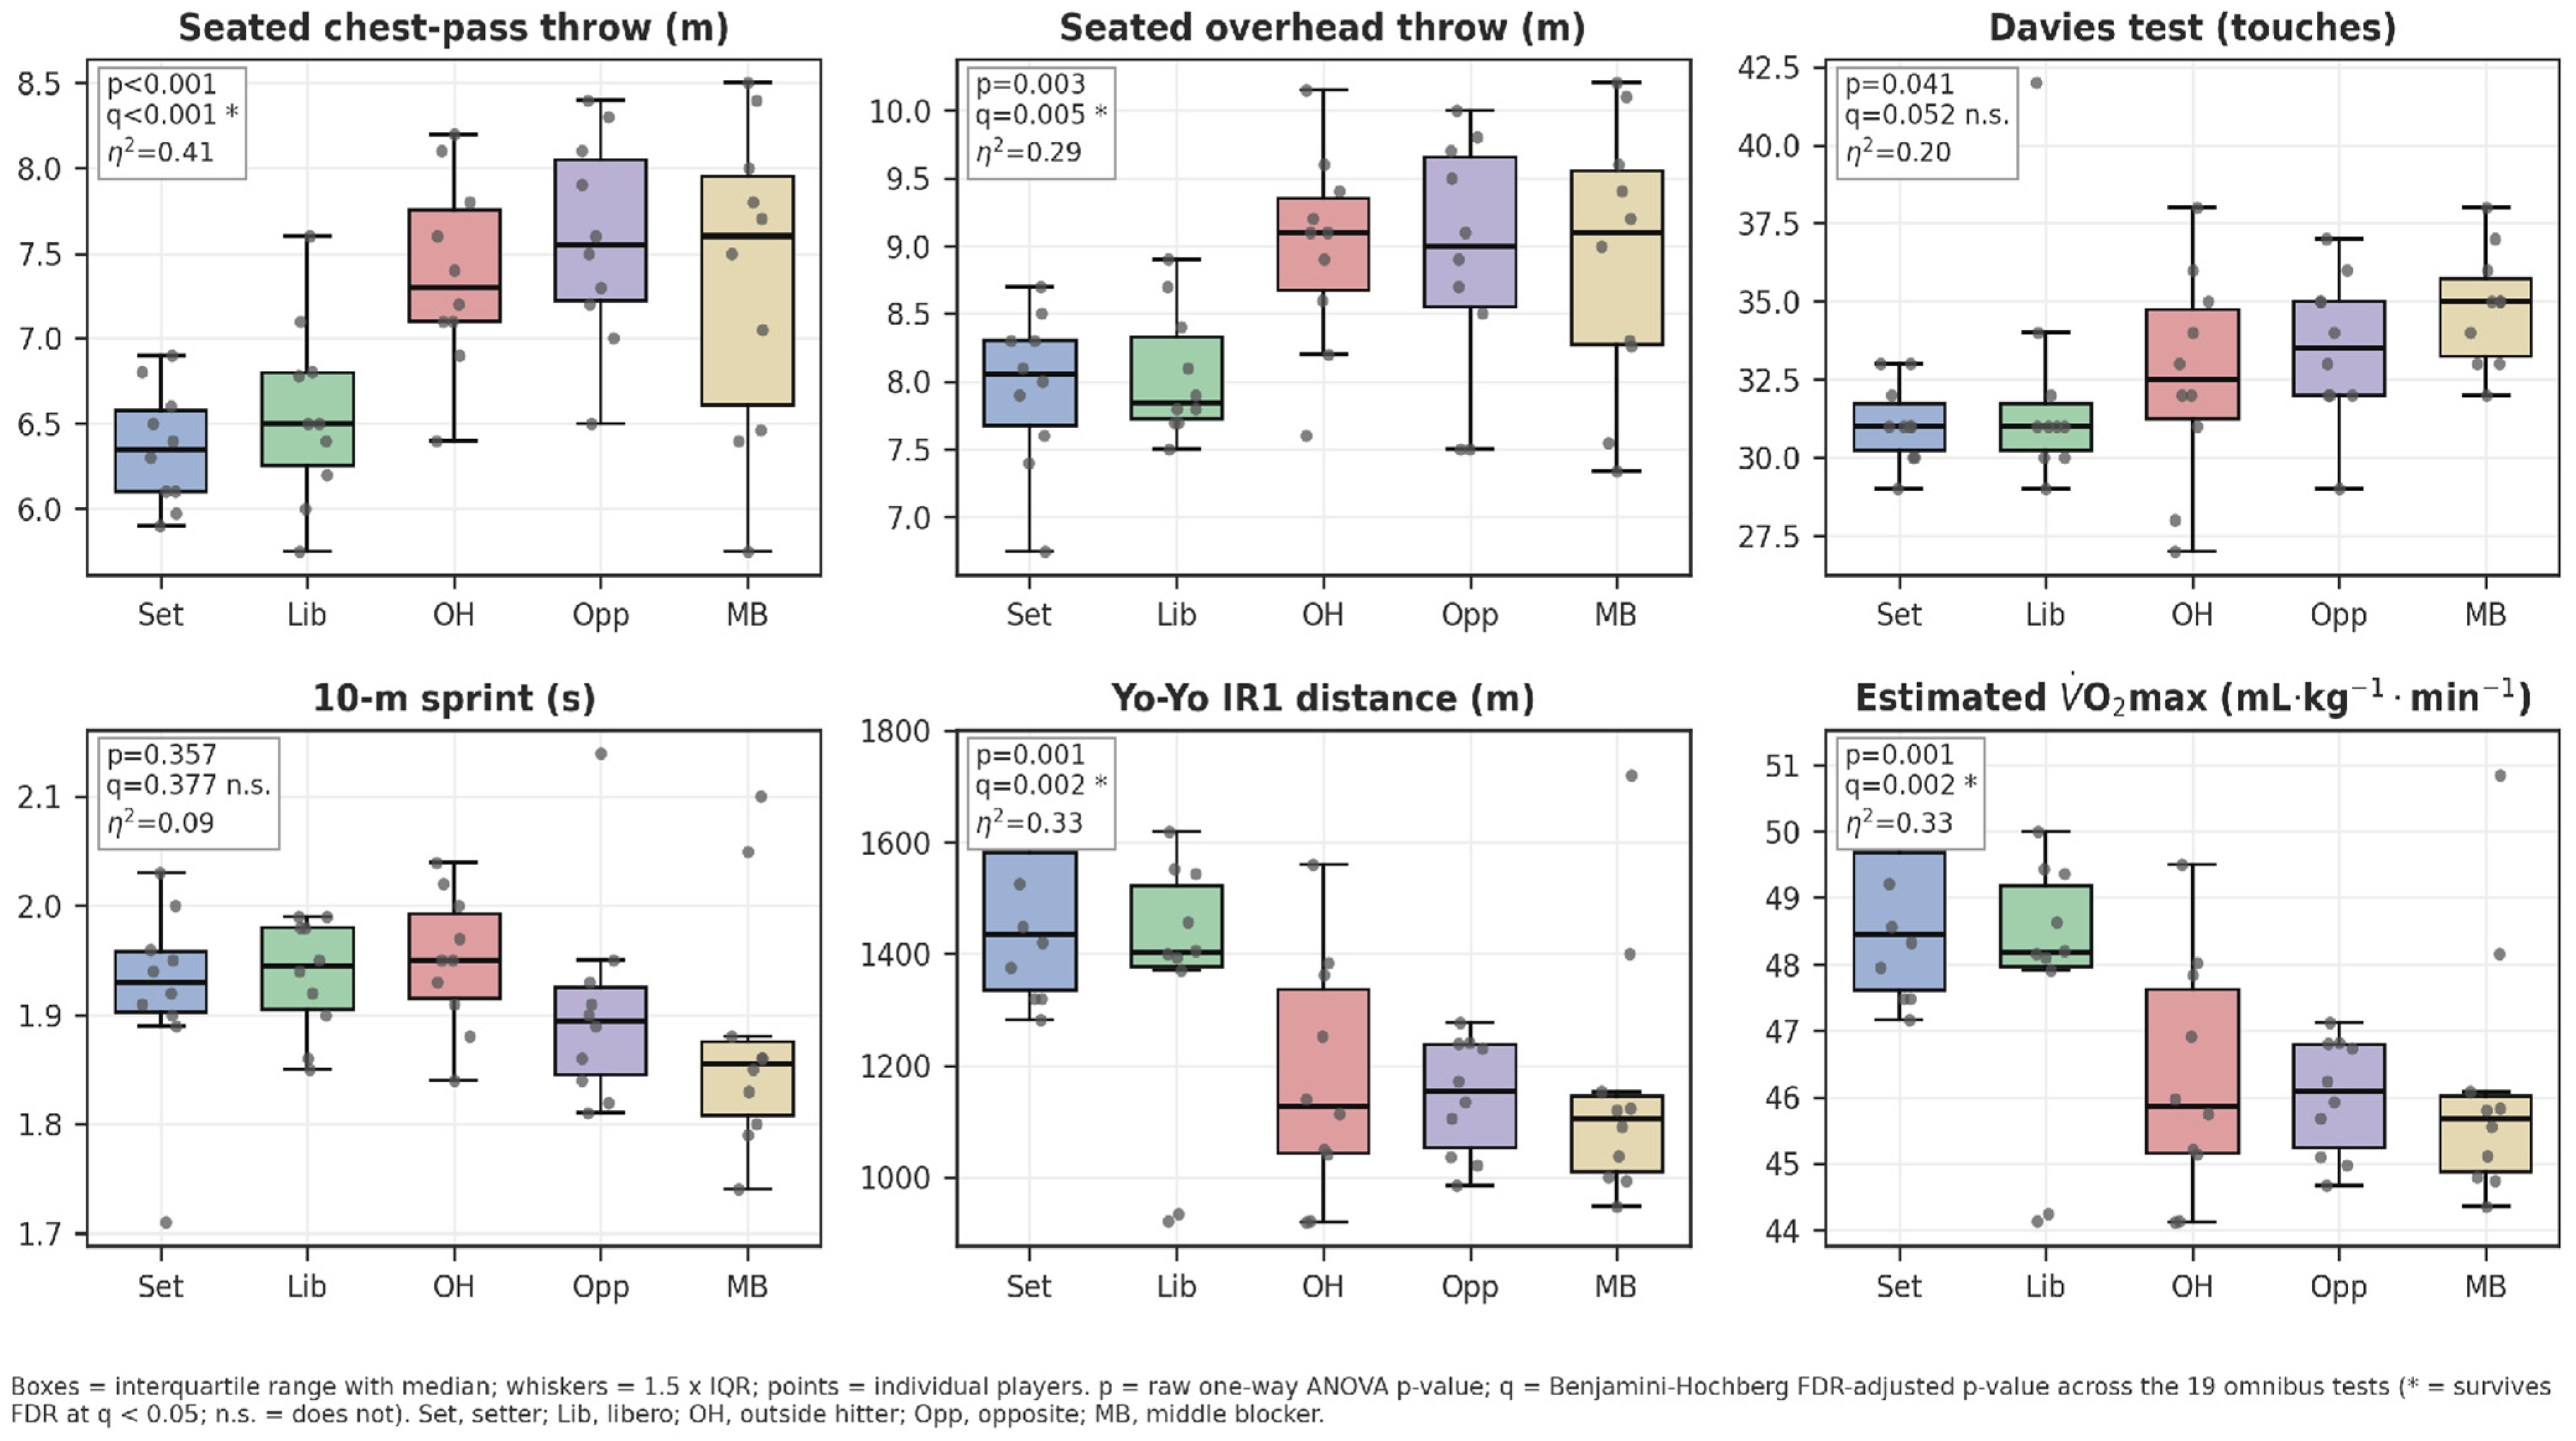
Seated chest-pass (F(4,45) = 7.80, p < 0.001, η2 = 0.41) and overhead (F(4,45) = 4.57, p = 0.004, η2 = 0.29) medicine-ball throws mirrored the anthropometric pattern, with opposites (7.58 ± 0.61 m; 8.92 ± 0.89 m) and outside hitters (7.38 ± 0.56 m; 8.98 ± 0.72 m) producing the greatest distances and setters the least (6.36 ± 0.34 m; 7.96 ± 0.58 m). These throwing differences did not, however, survive adjustment for body size. With height as a covariate the positional effect was no longer significant for either throw (chest-pass F(4,44) = 2.52, p = 0.054; overhead throw F(4,44) = 1.47, p = 0.226), height itself being a significant covariate in both models (p = 0.006 and p = 0.038, respectively). When the throws were allometrically scaled to body mass—the exponent estimated from the present sample being b = 0.79 (95% CI 0.57–1.01) for the chest-pass and b = 0.58 (95% CI 0.34–0.82) for the overhead throw—the positional differences disappeared entirely (scaled chest-pass F(4,45) = 0.35, p = 0.844; scaled overhead throw F(4,45) = 0.42, p = 0.792). Absolute medicine-ball throwing distance therefore distinguishes positions largely because attacking players are heavier and taller, not because they possess greater size-independent upper-body capability. Davies-test scores were greatest in middle blockers (34.8 ± 1.9 touches) and lowest in setters (31.1 ± 1.3 touches; raw p = 0.041, FDR-adjusted p = 0.052); the only pairwise contrast with an uncorrected p < 0.05 was middle blocker–setter. Because the omnibus effect did not pass the prespecified FDR gate, this result is reported as exploratory and is not counted among the confirmatory positional differences, notwithstanding its pairwise q-value in Table 1; the effect also disappeared after adjustment for height (F(4,44) = 1.34, p = 0.269). The 10 m sprint did not differ significantly across positions (p = 0.357, η2 = 0.09), despite a numerical advantage for middle blockers (1.88 ± 0.11 s) and opposites (1.90 ± 0.09 s). Finally, the Yo-Yo IR1 revealed significant positional differences in distance covered (F(4,45) = 5.46, p = 0.001, η2 = 0.33) (Figure 4). Here the pattern was reversed relative to the jumps: setters covered the greatest distance (1469 ± 158 m; estimated VO2max 48.7 ± 1.3 mL·kg−1·min−1), followed by liberos (1360 ± 242 m; 47.8 ± 2.0 mL·kg−1·min−1), outside hitters (1174 ± 211 m), middle blockers (1159 ± 234 m) and opposites (1144 ± 104 m). Games–Howell tests showed that setters covered significantly more distance than opposites (Δ = 325 m, 95% CI 141–509 m), outside hitters (Δ = 295 m, 95% CI 40–549 m) and middle blockers (Δ = 310 m, 95% CI 36–584 m), of which only the setter–opposite contrast survived correction across all 180 contrasts. None of the libero contrasts reached significance; the libero value is therefore numerically higher than those of the attacking positions but not statistically distinguishable from them, and the aerobic advantage identified here is specific to setters. The positional effect was also attenuated below significance when height was entered as a covariate (F(4,44) = 1.98, p = 0.114), consistent with the lower body mass and stature of play-making and defensive roles contributing to the difference (Figure 1).
Figure 4.
Upper-body field tests, dynamic stability, speed and intermittent-recovery capacity by playing position. Seated chest-pass and overhead medicine-ball throws, Davies test (closed kinetic-chain upper-extremity stability), 10 m sprint, Yo-Yo IR1 distance and the estimated VO2max derived from it. Yo-Yo IR1 distance is the directly measured outcome; the VO2max panel is a linear transformation of that distance and is shown for comparability only. Annotations and abbreviations as in Figure 1.
4. Discussion
The purpose of this study was to describe and compare positional profiles of adult elite female volleyball players across anthropometric, jumping, upper-body throwing, short-sprint and intermittent-recovery domains within a single cohort. The main findings were that (i) middle blockers and opposites displayed the largest body height, standing reach, body mass and jumping outputs; (ii) opposites, in particular, showed the highest reactive strength and drop-jump height; (iii) setters and liberos were shortest and lightest, and setters covered the greatest Yo-Yo IR1 distance; and (iv) outside hitters occupied an intermediate position on most variables. These patterns broadly support our a priori hypotheses and align with the positional architecture reported in prior elite female samples [5,8,9,14]. Three qualifications frame the interpretation that follows: the comparison is descriptive and variable-by-variable rather than multivariate; several differences are substantially attenuated once body size is taken into account; and, because the design is cross-sectional, none of the findings can establish that positional demands caused the observed profiles.
The pronounced height and standing-reach differences observed here (middle blockers 13.6 cm taller than setters; standing reach 0.17 m longer) closely parallel Palao, Manzanares and Valadés’ [5] 12-year Olympic and World Championship surveillance, in which female middle blockers were 10–14 cm taller than setters and liberos across competition levels. Milić et al. [8] similarly reported gradations of stature and lean-body mass across playing positions that match our effect-size pattern (η2 ≈ 0.60 for height); whereas, Nikolaidis et al. [7] documented comparable anthropometric gradients primarily as a function of competition level rather than court position; the present data extend this literature to a within-position comparison. These consistent anthropometric signatures reflect decades of selection pressure for height-dependent net actions and the advantage conferred on blockers and opposites by greater spike and block reach [5,13].
The largest between-position differences on jump tests were observed for the spike jump (η2 = 0.48, very large pairwise Cohen’s d), with more modest but still significant effects for CMJ and block jump. This sensitivity hierarchy is consistent with Sattler et al.’s [14] finding that spike and block jumps better distinguish between competition levels than CMJ, and with Ziv and Lidor’s [13] review indicating that approach (spike) jump performance is among the most discriminative jump actions in volleyball. Interestingly, opposites produced the highest drop-jump height and RSI, signalling more efficient stretch-shortening-cycle function, a faster eccentric-to-concentric transition and greater reactive force expression; whereas, liberos, who rarely perform maximal vertical actions, scored lowest. Position-related anthropometric and jump differences have been reported in adolescent female players by Milić et al. [31], although that study did not assess drop-jump reactive strength, so whether the specific RSI gradient observed here emerges earlier in development remains to be tested directly. In contrast, standing long jump did not differ across positions, consistent with the predominantly vertical demands of volleyball, in which horizontal jump tasks are generally weaker discriminators of playing position than vertical jumps [5]. Critically, the vertical-jump and reactive-strength differences were the only performance contrasts that remained significant when body height was entered as a covariate. Unlike the medicine-ball throws, the Davies test and the Yo-Yo IR1—all of which lost significance after this adjustment—jumping and reactive strength therefore appear to reflect a size-independent neuromuscular difference between positions rather than the anthropometric selection gradient alone. Their partial η2 values nonetheless fell by roughly one third after adjustment, so stature still accounts for an appreciable share of the raw between-position separation, and absolute jump height should not be equated with size-independent explosive capacity.
Absolute upper-body throwing performance followed the same attacker-dominant gradient: opposites and outside hitters threw the chest-pass medicine ball approximately 15–19% further than setters. This gradient did not, however, survive adjustment for body size, and disappeared entirely once the throws were allometrically scaled to body mass. The medicine-ball throw is therefore best read here as a measure of absolute, size-dependent throwing output—which is itself relevant to on-court actions performed against a fixed net height—rather than as evidence of greater size-independent upper-body capability in attacking players. These medicine-ball distances are consistent with the reliability reported for the seated medicine-ball throw [19,20]; because those reliability data derive from non-volleyball populations, they support the test concept rather than providing direct validation in elite female volleyball. Davies-test touches, reflecting closed-chain upper-extremity stability, peaked in middle blockers (34.8 touches in 15 s), in line with the reliability and descriptive data available for the closed kinetic-chain upper-extremity stability test [22,23]; because the Davies omnibus effect did not pass the prespecified FDR gate and did not persist after adjustment for height, these position-specific values are exploratory and descriptive only. Whether the Davies test could serve as a monitoring tool for positions with elevated chronic shoulder load is a hypothesis that would require dedicated longitudinal and clinical validation.
Intermittent-recovery capacity, indexed by Yo-Yo IR1 distance, displayed an inverted positional pattern. Setters covered significantly more distance than opposites, outside hitters and middle blockers, with differences of roughly 300 m (equivalent to 2–3 mL·kg−1·min−1 in the derived VO2max estimate). Liberos recorded numerically higher values than the attacking positions but did not differ from them statistically, so the advantage observed here should be attributed to setters rather than to setters and liberos jointly. Because the Yo-Yo IR1 indexes the ability to recover repeatedly between short high-intensity efforts, underpinned by aerobic power and repeated-sprint qualities, this pattern is physiologically consistent with the greater cumulative court coverage of play-making and defensive roles. This is directionally consistent with match-play analyses of elite men’s volleyball, in which defensive and setting roles undertake greater court coverage than attacking positions [32]; because that evidence derives from male players, the precise magnitude should not be assumed to transfer to female athletes. The systematic review of training stress, neuromuscular fatigue and well-being in volleyball by Rebelo et al. [33] similarly emphasises that physical loading differs by role. Two cautions apply. First, the derived VO2max value is a linear transformation of Yo-Yo IR1 distance obtained with an equation developed in general intermittent-sport populations and not, to our knowledge, validated in elite female volleyball players; it is a proxy for intermittent-recovery capacity and is not interchangeable with gas-exchange measurement. Second, the positional effect was no longer significant once stature was entered as a covariate, so part of the difference plausibly reflects the smaller body size of setters and liberos rather than a role-specific training adaptation. A cross-sectional difference in this kind cannot demonstrate that setters or liberos require additional aerobic or repeated-sprint training. That setters and liberos would benefit disproportionately from repeated-sprint conditioning, and attacking players from heavy-load and plyometric work, is a hypothesis generated by these data that would need to be tested in a controlled intervention.
The absence of a significant between-position difference in 10 m sprint time (1.88–1.95 s; p = 0.357) is noteworthy. Although middle blockers and opposites were numerically the fastest, the overall 70 ms range is comparable to the typical measurement error of timing-gate systems and to the trial-to-trial variation expected when only a single sprint is recorded, so it should not be interpreted as a meaningful positional difference [24,25]. Longer sprint distances (20–30 m) and change-of-direction tests, such as the 505 or T-test, may be more informative for future positional profiling. Waist-to-hip ratio was likewise homogeneous (0.77–0.79): absolute circumferences differ with stature, but relative regional fatness does not differ in any practically meaningful way, and the discrepant non-parametric result—now reported in full in the Results rather than introduced here—reflects rank-level separation of a heavily rounded variable rather than a real difference. Because body composition was not directly assessed, position-specific body-fat estimates cannot be derived from the present data. Importantly, the three outcomes with the weakest positional separation—waist-to-hip ratio, standing long jump and 10 m sprint time—were also those for which this study was least well powered. Their non-significance is therefore inconclusive rather than evidence that positions are equivalent on horizontal explosive capacity, very short linear acceleration or relative regional adiposity, and none of them should be dismissed as uninformative for positional profiling until tested in an adequately powered sample.
These position-specific profiles provide provisional, position-relative descriptive values for Turkish elite female volleyball. Because the design is cross-sectional, they cannot demonstrate that positional demands produced the observed profiles, that any given training programme would improve performance, or that any variable predicts future playing success. The following are therefore offered strictly as hypotheses for prospective testing rather than as recommendations arising from the present results: (i) that stature and standing reach, which showed the largest positional separation, may be informative among the variables considered when screening for net-oriented positions—this study cannot establish how heavily they should be weighted, because no predictive or longitudinal analysis was performed; (ii) that heavier-load and plyometric work for opposites and middle blockers, and repeated-sprint conditioning for setters, may address each role’s limiting quality; and (iii) that the reactive strength index, which separated positions robustly even after adjustment for height, is a candidate neuromuscular monitoring variable. The study evaluated neither injury risk, nor return-to-play outcomes, nor the responsiveness of any measure to training, so no screening, injury-prevention, medical-monitoring or return-to-play application follows from these data, and the values reported here must not be used as clinical reference thresholds.
This study has several limitations. First, the single-season sample (n = 50), although drawn from several top-flight clubs, limits generalisability to international or multi-league contexts; replication across competition levels is warranted. Moreover, the athletes were drawn exclusively from the top division and were enrolled through a consecutive convenience procedure with a fixed quota of ten per position, so the sample is subject to two forms of selection bias: the range of anthropometric and performance values is restricted by prior selection into an elite league, and the quota may have favoured the most available—and possibly the most typical—players within each squad. Both restrict the range of the outcome variables, and both are expected to bias the reported effect sizes downwards for the between-position comparisons while making the descriptive values unrepresentative of the wider volleyball population. Because no prospective screening log was kept, a participation rate cannot be reported, so the extent of any non-response bias cannot be quantified. For the same reason, these data cannot be used to infer which characteristics distinguish players who reach the elite level from those who do not, which is the question talent identification actually poses. Second, although position-specific profiling was the primary aim, match-play demands were not directly measured; integration with video-based jump-count and positional-tracking data would strengthen ecological validity [33]. Third, estimated VO2max from the Yo-Yo IR1 is not interchangeable with gas-exchange measurements [26,27]; because it is derived directly from Yo-Yo IR1 distance using an equation not validated in elite female volleyball, it should be regarded as a proxy for intermittent-recovery capacity rather than an independently measured aerobic outcome. Fourth, upper-limb performance was assessed via medicine-ball throws rather than isokinetic or force-plate dynamometry, which may underestimate rotational components of the attack. Fifth, no change-of-direction or agility test was included, so agility was not assessed and cannot be inferred from these data. Sixth, body composition was not directly assessed (DXA or bioimpedance) and only surrogate indices (BMI, WHR) were available; direct methods [34] are recommended for future work. Seventh, the groups differed substantially in stature and body mass, so several of the raw performance contrasts are partly anthropometric in origin; the covariate-adjusted and allometrically scaled analyses reported here mitigate but do not eliminate this confounding, since height and playing position are not separable by design in an elite cohort. Eighth, with only ten athletes per position the study was powered for large effects alone, so the non-significant outcomes are inconclusive rather than equivalent, and even the very large Cohen’s d values carry wide confidence intervals; the pairwise contrasts should accordingly be read as exploratory. Ninth, the fixed testing order means that the tasks placed late in the sequence, in particular the Yo-Yo IR1, may have been performed under some accumulated fatigue, which affects the absolute values more than the between-position comparisons; only a single 10 m sprint trial was recorded; and, because only the best of three attempts was retained in the database, within-session coefficients of variation could not be computed, so no trial-level reliability estimate can be given for the jump and throw tests. Tenth, training age, competitive experience beyond the five-year inclusion threshold and current training and competition load were not quantified by position and may confound both the jump and the intermittent-recovery results; primary court position rests on coach designation rather than on extracted rotation counts or match minutes, so a small degree of positional misclassification, most plausibly between outside hitters and opposites, cannot be excluded. Eleventh, within-position variability was substantial for several anthropometric variables—the libero group in particular—so the group means are central tendencies for heterogeneous groups rather than normative thresholds for individual athletes. Given the single-season design, the position-specific values reported here should be regarded as provisional rather than definitive norms and require confirmation in larger, multi-season and multi-league samples.
5. Conclusions
Elite Turkish female volleyball players display measurable positional differences in anthropometric characteristics and field-test physical performance across the five court positions. Middle blockers and opposites recorded the greatest height, standing reach and vertical-jump values, with opposites exhibiting the greatest reactive strength and drop-jump height. Outside hitters lay close to the whole-sample mean on most outcomes. Setters and liberos were shortest and lightest, and setters—but not liberos—covered significantly more Yo-Yo IR1 distance than the attacking positions. Estimated VO2max is a linear transformation of that distance obtained with an equation not validated in elite female volleyball, and is therefore an indirect proxy for intermittent-recovery capacity rather than a measured aerobic outcome. Only the vertical-jump and reactive-strength contrasts persisted after adjustment for stature; the throwing, dynamic-stability and intermittent-recovery differences did not, and are to that extent expressions of positional differences in body size. These cross-sectional findings characterise position-specific profiles and generate hypotheses; they do not establish causation, predictive validity or training responsiveness. Coaching and strength-and-conditioning staff may use the values as descriptive reference points against which to benchmark athletes, but the present design cannot show how selection variables should be weighted in talent identification, nor support any application to injury screening, medical monitoring or return-to-play. Future studies should test these profiles prospectively and longitudinally, incorporate direct body-composition, force-platform and match-load data, and recruit larger multi-club and multi-season samples across competition levels.
Author Contributions
Conceptualization, T.B. and B.S.; methodology, B.S., İ.K., M.T. and R.F.K.; validation, S.S., B.S. and G.A.; formal analysis, G.A.; investigation, T.B., M.T. and B.S.; resources, İ.K.; data curation, S.S.; writing—original draft preparation, B.S., M.T., R.F.K., S.S. and G.A.; writing—review and editing, T.B. and İ.K.; visualisation, G.A.; supervision, S.S.; project administration, T.B. All authors have read and agreed to the published version of the manuscript.
Funding
This research received no external funding.
Institutional Review Board Statement
The study was conducted in accordance with the Declaration of Helsinki and approved by the Health Sciences Ethics Committee of Çankırı Karatekin University, Çankırı, Türkiye (protocol code 16, date of approval 15 October 2024).
Informed Consent Statement
Informed consent was obtained from all subjects involved in the study.
Data Availability Statement
The de-identified individual-level dataset and the full analysis code that support the findings of this study are available from the corresponding author upon reasonable request. No data were publicly deposited. Further information or clarification regarding the data, statistical analyses, or study findings may be obtained from the corresponding author upon reasonable request.
Acknowledgments
We thank all the participants in this study.
Conflicts of Interest
The authors declare no conflicts of interest.
Abbreviations
| ANCOVA | Analysis of covariance |
| ANOVA | Analysis of variance |
| BMI | Body mass index |
| CI | Confidence interval |
| CMJ | Countermovement jump |
| CT | Ground contact time |
| CV | Coefficient of variation |
| DJ | Drop jump |
| DXA | Dual-energy X-ray absorptiometry |
| FDR | False discovery rate |
| FT | Flight time |
| IQR | Interquartile range |
| ISAK | International Society for the Advancement of Kinanthropometry |
| Lib | Libero |
| MB | Middle blocker |
| OH | Outside hitter |
| Opp | Opposite |
| RSI | Reactive strength index |
| SD | Standard deviation |
| Set | Setter |
| SLJ | Standing long jump |
| STROBE | Strengthening the Reporting of Observational Studies in Epidemiology |
| VO2max | Maximal oxygen uptake |
| WHR | Waist-to-hip ratio |
| Yo-Yo IR1 | Yo-Yo Intermittent Recovery Test Level 1 |
References
- Sheppard, J.M.; Gabbett, T.; Taylor, K.-L.; Dorman, J.; Lebedew, A.J.; Borgeaud, R. Development of a repeated-effort test for elite men’s volleyball. Int. J. Sports Physiol. Perform. 2007, 2, 292–304. [Google Scholar] [CrossRef] [Scilit] [PubMed]
- Lidor, R.; Ziv, G. Physical and physiological attributes of female volleyball players—A review. J. Strength Cond. Res. 2010, 24, 1963–1973. [Google Scholar] [CrossRef] [Scilit] [PubMed]
- Xu, D.; Lu, J.; Baker, J.S.; Fekete, G.; Gu, Y. Temporal kinematic and kinetics differences throughout different landing ways following volleyball spike shots. Proc. Inst. Mech. Eng. Part P J. Sports Eng. Technol. 2022, 236, 200–208. [Google Scholar] [CrossRef] [Scilit]
- Gabbett, T.; Georgieff, B. Physiological and anthropometric characteristics of Australian junior national, state, and novice volleyball players. J. Strength Cond. Res. 2007, 21, 902–908. [Google Scholar] [CrossRef] [Scilit] [PubMed]
- Palao, J.M.; Manzanares, P.; Valadés, D. Anthropometric, physical, and age differences by the player position and the performance level in volleyball. J. Hum. Kinet. 2014, 44, 223–236. [Google Scholar] [CrossRef] [Scilit] [PubMed]
- Schaal, M.; Ransdell, L.B.; Simonson, S.R.; Gao, Y. Physiologic performance test differences in female volleyball athletes by competition level and player position. J. Strength Cond. Res. 2013, 27, 1841–1850. [Google Scholar] [CrossRef] [Scilit] [PubMed]
- Nikolaidis, P.T.; Afonso, J.; Busko, K. Differences in anthropometry, somatotype, body composition and physiological characteristics of female volleyball players by competition level. Sport Sci. Health 2015, 11, 29–35. [Google Scholar] [CrossRef] [Scilit]
- Milić, M.; Grgantov, Z.; Chamari, K.; Ardigò, L.P.; Bianco, A.; Padulo, J. Anthropometric and physical characteristics allow differentiation of young female volleyball players according to playing position and level of expertise. Biol. Sport 2017, 34, 19–26. [Google Scholar] [CrossRef] [Scilit] [PubMed]
- Nikolaidis, P.T.; Afonso, J.; Buśko, K.; Ingebrigtsen, J.; Chtourou, H.; Martin, J. Positional differences of physical traits and physiological characteristics in female volleyball players—The role of age. Kinesiology 2015, 47, 75–81. [Google Scholar]
- Malousaris, G.G.; Bergeles, N.K.; Barzouka, K.G.; Bayios, I.A.; Nassis, G.P.; Koskolou, M.D. Somatotype, size and body composition of competitive female volleyball players. J. Sci. Med. Sport 2008, 11, 337–344. [Google Scholar] [CrossRef] [Scilit] [PubMed]
- Mala, L.; Maly, T.; Zahalka, F.; Bunc, V.; Kaplan, A.; Jebavy, R.; Tuma, M. Body composition of elite female players in five different sports games. J. Hum. Kinet. 2015, 45, 207–215. [Google Scholar] [CrossRef] [Scilit] [PubMed]
- Marfell-Jones, M.; Olds, T.; Stewart, A.; Lindsay Carter, L.E. International Standards for Anthropometric Assessment; International Society for the Advancement of Kinanthropometry: Lower Hutt, New Zealand, 2012. [Google Scholar]
- Ziv, G.; Lidor, R. Vertical jump in female and male volleyball players: A review of observational and experimental studies. Scand. J. Med. Sci. Sports 2010, 20, 556–567. [Google Scholar] [CrossRef] [Scilit] [PubMed]
- Sattler, T.; Hadžić, V.; Dervišević, E.; Markovic, G. Vertical jump performance of professional male and female volleyball players: Effects of playing position and competition level. J. Strength Cond. Res. 2015, 29, 1486–1493. [Google Scholar] [CrossRef] [Scilit] [PubMed]
- Sheppard, J.M.; Cronin, J.B.; Gabbett, T.J.; McGuigan, M.R.; Etxebarria, N.; Newton, R.U. Relative importance of strength, power, and anthropometric measures to jump performance of elite volleyball players. J. Strength Cond. Res. 2008, 22, 758–765. [Google Scholar] [CrossRef] [Scilit] [PubMed]
- Forthomme, B.; Croisier, J.-L.; Ciccarone, G.; Crielaard, J.-M.; Cloes, M. Factors correlated with volleyball spike velocity. Am. J. Sports Med. 2005, 33, 1513–1519. [Google Scholar] [CrossRef] [Scilit] [PubMed]
- Flanagan, E.P.; Comyns, T.M. The use of contact time and the reactive strength index to optimize fast stretch-shortening cycle training. Strength Cond. J. 2008, 30, 32–38. [Google Scholar] [CrossRef] [Scilit]
- Markwick, W.J.; Bird, S.P.; Tufano, J.J.; Seitz, L.B.; Haff, G.G. The intraday reliability of the Reactive Strength Index calculated from a drop jump in professional men’s basketball. Int. J. Sports Physiol. Perform. 2015, 10, 482–488. [Google Scholar] [CrossRef] [Scilit] [PubMed]
- Stockbrugger, B.A.; Haennel, R.G. Validity and reliability of a medicine ball explosive power test. J. Strength Cond. Res. 2001, 15, 431–438. [Google Scholar] [CrossRef] [Scilit]
- Harris, C.; Wattles, A.P.; DeBeliso, M.; Sevene-Adams, P.G.; Berning, J.M.; Adams, K.J. The seated medicine ball throw as a test of upper body power in older adults. J. Strength Cond. Res. 2011, 25, 2344–2348. [Google Scholar] [CrossRef] [Scilit] [PubMed]
- Ikeda, Y.; Kijima, K.; Kawabata, K.; Fuchimoto, T.; Ito, A. Relationship between side medicine-ball throw performance and physical ability for male and female athletes. Eur. J. Appl. Physiol. 2007, 99, 47–55. [Google Scholar] [CrossRef] [Scilit] [PubMed]
- Goldbeck, T.G.; Davies, G.J. Test-retest reliability of the closed kinetic chain upper extremity stability test: A clinical field test. J. Sport Rehabil. 2000, 9, 35–45. [Google Scholar] [CrossRef] [Scilit]
- de Oliveira, V.M.; Pitangui, A.C.; Nascimento, V.Y.; da Silva, H.A.; Dos Passos, M.H.; de Araújo, R.C. Test-retest reliability of the closed kinetic chain upper extremity stability test (CKCUEST) in adolescents: Reliability of CKCUEST in adolescents. Int. J. Sports Phys. Ther. 2017, 12, 125–132. [Google Scholar] [PubMed]
- Melrose, D.R.; Spaniol, F.J.; Bohling, M.E.; Bonnette, R.A. Physiological and performance characteristics of adolescent club volleyball players. J. Strength Cond. Res. 2007, 21, 481–486. [Google Scholar] [CrossRef] [Scilit] [PubMed]
- Nimphius, S.; Callaghan, S.J.; Bezodis, N.E.; Lockie, R.G. Change of direction and agility tests: Challenging our current measures of performance. Strength Cond. J. 2018, 40, 26–38. [Google Scholar] [CrossRef] [Scilit]
- Bangsbo, J.; Iaia, F.M.; Krustrup, P. The Yo-Yo intermittent recovery test: A useful tool for evaluation of physical performance in intermittent sports. Sports Med. 2008, 38, 37–51. [Google Scholar] [CrossRef] [Scilit] [PubMed]
- Castagna, C.; Impellizzeri, F.M.; Rampinini, E.; D’Ottavio, S.; Manzi, V. The Yo–Yo intermittent recovery test in basketball players. J. Sci. Med. Sport 2008, 11, 202–208. [Google Scholar] [CrossRef] [Scilit] [PubMed]
- Altundag, E.; Soylu, C.; Akyildiz, Z. Multidimensional analysis of serving speed in volleyball players by position, sets, and league types: Interactions and statistical differences. BMC Sports Sci. Med. Rehabil. 2024, 16, 240. [Google Scholar] [CrossRef] [Scilit] [PubMed]
- Cohen, J. Statistical Power Analysis for the Behavioral Sciences; Routledge: New York, NY, USA, 2013. [Google Scholar]
- Hopkins, W.G.; Marshall, S.W.; Batterham, A.M.; Hanin, J. Progressive statistics for studies in sports medicine and exercise science. Med. Sci. Sports Exerc. 2009, 41, 3–12. [Google Scholar] [CrossRef] [Scilit] [PubMed]
- Milić, M.; Vukadinović, N.; Grgantov, Z.; Nikolić, K.; Savić, Z.; Majstorović, N.; Nešić, G. Basic anthropological characteristics of elite U17 youth Serbian female volleyball players according to playing position. Appl. Sci. 2024, 14, 11197. [Google Scholar] [CrossRef] [Scilit]
- Sheppard, J.M.; Gabbett, T.J.; Stanganelli, L.-C.R. An analysis of playing positions in elite men’s volleyball: Considerations for competition demands and physiologic characteristics. J. Strength Cond. Res. 2009, 23, 1858–1866. [Google Scholar] [CrossRef] [Scilit] [PubMed]
- Rebelo, A.; Pereira, J.R.; Cunha, P.; Coelho-e-Silva, M.J.; Valente-dos-Santos, J. Training stress, neuromuscular fatigue and well-being in volleyball: A systematic review. BMC Sports Sci. Med. Rehabil. 2024, 16, 17. [Google Scholar] [CrossRef] [Scilit] [PubMed]
- Campa, F.; Toselli, S.; Mazzilli, M.; Gobbo, L.A.; Coratella, G. Assessment of body composition in athletes: A narrative review of available methods with special reference to quantitative and qualitative bioimpedance analysis. Nutrients 2021, 13, 1620. [Google Scholar] [CrossRef] [Scilit] [PubMed]

Disclaimer/Publisher’s Note: The statements, opinions and data contained in all publications are solely those of the individual author(s) and contributor(s) and not of MDPI and/or the editor(s). MDPI and/or the editor(s) disclaim responsibility for any injury to people or property resulting from any ideas, methods, instructions or products referred to in the content. |
© 2026 by the authors. Licensee MDPI, Basel, Switzerland. This article is an open access article distributed under the terms and conditions of the Creative Commons Attribution (CC BY) license.