


Abstract
Museums face a conflict between energy-efficient gallery lighting and protecting light-sensitive collections from photochemical damage: increasing the luminous efficacy of white LEDs requires shifting spectral power toward the high-energy blue band, accelerating degradation of organic materials. Prior work treated these separately; this study links them via a shared spectral property, the blue-to-yellow emission balance. For four artifact classes (water colors on paper rag, oil colors on canvas, textile materials, and rag paper), luminous efficacy is calculated from spectral radiant power distributions, alongside a material-specific damage factor per unit of useful light derived from first-order kinetics. For each class and color temperature (CCT), this factor is benchmarked against a reference halogen source, yielding a relative photochemical damage index—a relative comparison rather than a computed permissible dose or exposure time—that flags spectra with lower hazard than current practice. Across the database, the blue-to-yellow spectral balance shifts faster than efficacy gains above 4000–5000 K, so higher CCTs carry a growing conservation cost; class-specific limits cut radiant power input in robust material galleries without compromising sensitive ones. Evaluated on nearly 2850 commercial LED spectra, the index gives lighting engineers and conservators a quantitative tool for selecting energy-efficient, conservation-safe LED products.
1. Introduction
In recent years, the modernization of museum and gallery lighting systems has focused heavily on reducing electricity consumption and carbon footprints. The widespread replacement of legacy incandescent and halogen lamps with solid-state Light-Emitting Diode (LED) technology has yielded substantial energy savings, primarily due to the high luminous efficacy of contemporary semiconductor devices [1,2]. This efficiency reflects two decades of continual improvement in semiconductor die performance and device packaging [3]. Parallel advances in phosphor conversion efficiency have since pushed laboratory luminous efficacies to nearly 250 lm·W−1 [4]. This figure denotes the overall luminous efficacy of the device (lumens produced per watt of input electrical power, including electrical-to-optical conversion losses) and is therefore not directly comparable to the Luminous Efficacy of Radiation (LER) used throughout this study, which is a purely spectral quantity evaluated from the emitted radiant power alone and consequently higher for a given source. However, optimizing museum lighting is a highly complex engineering task. It requires balancing strict economic goals, such as maximizing energy efficiency, with demanding curatorial obligations, including the preservation of light-sensitive collections and the high-fidelity rendering of colors for visitors [5]. Museum lighting is therefore a case study in a broader building energy challenge: reconciling efficiency gains with constraints that cannot be relaxed. Unlike most building–energy–efficiency trade-offs, which can in principle be revisited or corrected after the fact, photochemical damage to museum and gallery collections is cumulative and irreversible: faded pigments cannot be restored to their original hue, and degraded cellulose cannot be returned to its original polymer chain length. This asymmetry is what elevates conservation safety from a soft design preference to a hard constraint and why heritage science bodies such as the International Commission on Illumination (CIE) have invested in dedicated, standards-based damage models rather than leaving illumination choices to qualitative guidance alone.
Unlike ambient humidity or air pollution, illumination is a risk factor that facility managers and lighting engineers can control directly at the point of source selection alone. Framed this way, the challenge is not simply to choose the lesser of two evils, accepting either elevated energy consumption to protect sensitive collections or elevated photochemical risk to reduce it, but to identify, among the many commercially available spectra that share a given color temperature, those that achieve both goals at once. This is not a trivial task: unlike incandescent and halogen sources, whose spectral power distribution is fixed by their blackbody temperature and cannot be tuned independently of it, phosphor-converted LEDs allow manufacturers to vary the blue-to-yellow balance of the emitted spectrum within limits even at a fixed nominal Correlated Color Temperature (CCT). This spectral flexibility is precisely what creates the opportunity this study exploits. Different commercial products at the same CCT can differ meaningfully in their blue-to-yellow ratio and therefore in both Luminous Efficacy of Radiation (LER) and photochemical risk; a genuinely conservation-safe, energy-efficient choice is therefore not merely a compromise position on a fixed trade-off curve but an achievable target that a systematic screening approach can help identify.
Museum lighting typically runs at near-constant output for most opening hours, so a source’s specific consumption (W per lumen) has a direct effect on electricity demand; retrofitting with higher-LER products is consequently among the most cost-effective building energy efficiency interventions available, provided it does not introduce unacceptable conservation risk. The screening framework developed here is accordingly a decision support tool for this problem: it identifies, for a given gallery’s material sensitivity, the highest-LER commercial product that still meets a defined conservation safety bar, rather than defaulting, out of caution, to a uniform, conservatively low-CCT specification across an entire building.
The Luminous Efficacy of Radiation (LER)—the fundamental metric for the energy efficiency of an optical spectrum itself, independent of luminaire losses—quantifies how effectively a spectral radiant power distribution matches the eye’s photopic sensitivity. To achieve higher LER at a specific CCT, modern phosphor-converted LEDs (pc-LEDs) rely on a fixed balance between the primary blue emission peak and the down-converted yellow-orange phosphor band [6,7]. This blue-to-yellow spectral power ratio determines not only the perceived visual characteristics of the light but also its total useful luminous output per watt of radiant power. This same efficacy–rendition trade-off has been quantified generally for LED lighting, independent of any conservation context [8].
From a conservation perspective, however, manipulating this spectral balance introduces a direct physical risk. Photons in the short-wavelength, high-energy blue-violet region carry sufficient energy to initiate photo-oxidative reactions, causing irreversible fading, yellowing, and embrittlement in organic and polymeric materials [9,10]. Accelerated aging exposure trials have characterized these photochemical and thermal degradation pathways in detail for a wide range of organic media [11]. Reciprocity between exposure intensity and duration, a key assumption underlying such accelerated aging extrapolations, has itself been shown to break down for some pigments under microfading spectrometry [12]. The CIE formalized this relationship in the CIE 157:2004 technical report, “Control of Damage to Museum Objects by Optical Radiation”, which assigns artifacts to sensitivity categories governed by an exponential spectral damage function [13]. Because different categories of museum objects respond very differently to the same spectrum, a single “optimal” LED spectrum cannot simultaneously be optimal for an entire materially heterogeneous collection. Although the efficacy–rendition trade-off and the CIE 157:2004 damage framework have each been studied extensively, they have rarely been linked directly within a single quantitative screening variable that a lighting designer can apply spectrum by spectrum.
To select sustainable yet non-destructive LED sources, the LER–damage trade-off must be analyzed separately for representative artifact classes spanning the CIE 157:2004 sensitivity categories that underlie the material-specific damage coefficients used throughout this framework. The four classes examined here are water colors on paper rag (CIE Category 1, extra-high sensitivity), oil colors on canvas (medium sensitivity), textile materials (CIE Category 2, high sensitivity), and rag paper (CIE Category 2, high sensitivity but the highest radiant exposure threshold of the four); the material-specific coefficients and thresholds underlying this classification are given in Section 2.5.
Despite extensive research on LED spectral engineering, conventional museum lighting design still largely follows a “one-size-fits-all” approach, installing a single high-color-rendering LED spectrum across all exhibition halls irrespective of material sensitivity. This practice results in an unnecessary compromise: either insensitive artifacts are over-protected at the cost of avoidably low LER and higher energy consumption or sensitive pieces are exposed to high-LER spectra that accelerate irreversible damage.
Two separate bodies of literature underlie this practice. One addresses the luminous efficacy of LED sources and systems [6,7]; the other characterizes photochemical damage risk to museum materials [9,10,14] within the CIE 157:2004 framework [13], alongside standardized methods for evaluating color rendition quality [15]. These two bodies are rarely combined into a single design variable. Several studies explore spectral filtering or illuminant design for safer museum lighting, including optical filters that reduce photochemical load while preserving color rendering [16]. Survey evidence shows that museums optimize illumination spectra in practice without a consistent quantitative method [17]; a broader survey of UK museum professionals similarly found that color temperature is rarely treated as a conservation issue and that CIE-Ra minimum thresholds, rather than spectral damage functions, are the dominant quantitative tool used in practice [18]. An earlier related US survey likewise found lighting selection practice to be quality-driven but inconsistently documented [19]. LED spectra can be chosen to visually compensate for faded colors [20]. Power distributions can likewise be optimized to minimize light absorption by artwork while preserving color appearance [21]. None of these expresses the trade-off as a standardized per-lumen damage index benchmarked against halogen practice. Prior work by our group related LED color rendition quality to energy efficiency for general lighting [22]. A companion study extended this evidence-based selection approach to healthcare lighting [23]. The same group has shown that CCT compliance alone is similarly an unreliable proxy in exterior heritage lighting, where identical CCT categories can differ substantially once evaluated against circadian, sky-glow, and phytochrome metrics [24], reinforcing the same limitation of CCT-only specification that motivates the screening approach developed here. Spectral composition and color quality have also been characterized broadly [25]. None of these studies have addressed material-specific conservation risk. A gap remains in expressing the blue-to-yellow ratio, the quantity governing both LER and photochemical damage, as an explicit link between efficiency and conservation risk and translating class-specific safe LER limits into a practical, zoned lighting strategy.
To address this gap, this paper presents a spectral efficiency analysis explicitly mapped to water colors on paper rag, oil colors on canvas, textile materials, and rag paper. Using absolute spectral radiant power distributions across a range of CCTs, we quantify the trade-off between LER and a material-specific relative damage factor per lumen: the share of a spectrum’s photochemically damaging content carried by each unit of useful light it delivers, computed under the CIE 157:2004 framework for each artifact class. The novelty of this work lies in expressing the damage–efficacy trade-off directly through the measurable blue-to-yellow spectral ratio rather than through CCT alone. Building on this, we introduce a relative photochemical damage index (DR) that benchmarks candidate LED spectra against a reference filtered halogen source representative of current museum practice and apply this index across the full compiled database to identify, for each artifact class and CCT, which commercially available products are demonstrably safer than current halogen-based practice. The result is a market-wide screening capability that supports a zoned museum lighting strategy in which each gallery is illuminated with the safest spectrum compatible with the sensitivity of its own contents. In this sense, the contribution is best understood as an energy-efficient, conservation-safe screening framework for existing commercial LED products, rather than a method for engineering new spectral profiles.
2. Materials and Methods
2.1. Development of the LED Spectral Power Distribution Database
The analysis presented in this paper is based on a database of spectral power distributions (SPD) of commercially available LED sources compiled from two publicly available, independent spectral data repositories. The first source is the “Real Light Source SPDs and Color Data for Use in Research” dataset, made available by the Pacific Northwest National Laboratory (PNNL, USA) [26], containing 1522 spectral power distributions of real, commercially available light sources across multiple technologies (LED, fluorescent, HID, incandescent/filament, laser diode, OLED, and plasma). This database is widely used in the work of CIE technical committees and in scientific research on the photometry and colorimetry of LED sources. Because this study concerns only solid-state sources, records were first filtered to the 1370 entries tagged as LED technology; the remaining 152 non-LED records (fluorescent, HID, incandescent/filament, laser diode, OLED, and plasma sources) were excluded before further processing.
The second source is the “EMPIR PhotoLED SPECTRAL DATABASE”, compiled within the European research project EMPIR [27]. This dataset comprises 1494 relative spectral power distributions of LED products from numerous manufacturers measured in independent laboratories, including national metrology institutes. Because the pooled database spans products from multiple LED technology generations and manufacturers, not every compiled spectrum meets modern color rendition and chromaticity expectations for conservation-grade lighting; the quality-based filtering described in Section 2.2 is therefore applied before further analysis.
The two repositories differ in native wavelength range and resolution: PNNL records vary per source (start 350 or 380 nm, end 780 or 850 nm, resolution 1, 2, or 5 nm), while EMPIR PhotoLED spectra are uniformly reported at 1 nm resolution from 360 to 830 nm. Every spectrum was therefore resampled onto the common 1 nm grid through cubic spline interpolation and truncated to the 380–780 nm analysis window used throughout this study (Section 2.3) before any further processing (full interpolation methodology and rationale in Appendix B.5). Duplicate identification could not rely on manufacturer or product metadata alone, as EMPIR PhotoLED records are anonymized (individual product and manufacturer identities are withheld by the source repository); candidate duplicates were therefore identified based on close agreement in spectral shape, quantified using the Goodness-of-Fit Coefficient (GFC ≥ 0.9999) together with matching CCT and Duv, and confirmed duplicates were retained once per unique product (full procedure and threshold justification in Appendix B.3).
Because the two source repositories were compiled independently, some commercially available products were measured and reported by both, so, after merging the two datasets and removing these duplicate records, along with incomplete or erroneous records (including zero-valued spectra), a combined total of nearly 2850 unique spectral power distributions of commercially used LED sources was obtained (from a combined maximum of 1370 (PNNL, LED-technology only) + 1494 (EMPIR) = 2864 records prior to deduplication and cleaning), forming a representative sample of LED products available on the lighting market.
2.2. Source Selection According to Museum Lighting Guidelines
Because museum and gallery lighting is subject to specific, elevated requirements, the light quality selection criteria defined in the “LED Lighting in Museums and Art Galleries—Technical Bulletin 36” [28] were applied for further analysis. These guidelines represent one of the most developed and comprehensive approaches to evaluating light source quality in a conservation context. Unlike many other industry recommendations, they take into account not only the conventional color rendering index (CRI Ra) but also the R9 parameter (rendering of saturated red, the hue most difficult for LED sources to reproduce accurately) and the chromaticity deviation from the blackbody locus (Duv, the perpendicular distance of a source’s chromaticity coordinates from the Planckian locus on a uniform chromaticity diagram; a large positive Duv gives the light a visible greenish tinge, while a large negative Duv gives it a pink tinge, even at the correct nominal CCT). This makes Technical Bulletin 36 the most rigorous of the available recommendations for museum lighting.
Following these guidelines, two light quality levels were defined:
- Good-quality light: CRI Ra ≥ 90, R9 ≥ 50, Duv in the range of −0.003 to +0.003;
- Excellent-quality light: CRI Ra ≥ 90, R9 ≥ 90, Duv in the range of −0.003 to +0.003.
Based on the above criteria, two subgroups of spectral power distributions were extracted from the combined database meeting the “good-quality” and “excellent-quality” requirements, respectively, as defined by Technical Bulletin 36; these are referred to hereafter as the good-quality and excellent-quality source databases, whose spectral power distributions and chromaticity coordinates are examined in Section 3.
Of the nearly 2850 spectra compiled in Section 2.1, exactly 1040, meeting a general-purpose CRI Ra ≥ 80 threshold, fall within one of the five nominal CCT categories examined in this study (2700/3000/4000/5000/6500 K, per the ANSI C78.377-2017 seven-step quadrangles of Section 2.1); the full filtering pathway, including per-CCT breakdowns, is given in Appendix B.7, Appendix B.8 and Appendix B.9 (Table A1 and Table A2). Of these 1040, 124 satisfy the good-quality criteria defined above, of which 30 additionally satisfy the stricter R9 ≥ 90 threshold required for excellent-quality classification, roughly one in four. This proportion is itself informative: the additional fidelity demanded by the excellent-quality tier is not a marginal refinement but a substantial narrowing of the field, consistent with the pronounced CCT-specific scarcity described below.
Commercially available LED sources meeting the R9 ≥ 90 criterion of the excellent-quality tier are concentrated almost exclusively in the warm-white range: only two qualifying products exist at 4000 K, and none at 5000 K or 6500 K. This scarcity is examined further, together with its market interpretation and practical implications, in Appendix B.9.
The CRI Ra criterion underlying both quality levels above has its own long developmental history. CRI Ra itself is derived from the CIE’s original color rendering method, later superseded in scope by TM-30 but still widely used as a first-pass screening criterion [29]. The pursuit of a reliable single-number color quality metric has, in fact, a long history that predates TM-30 by several decades. Judd proposed an early flattery-based index for artificial illuminants [30], Thornton later introduced a color discrimination index addressing some of the shortcomings of the original CRI Ra [31], Davis and Ohno subsequently developed the Color Quality Scale, an intermediate step incorporating both fidelity and preference considerations [32], and Rea and Freyssinier-Nova reviewed this progression, arguing for treating fidelity and gamut as two separate, complementary metrics rather than collapsing color quality into a single figure [33]. Automated measurement systems for evaluating exactly these color quality parameters at scale have themselves been the subject of dedicated instrumentation research [34]. Complementary guidance is provided by the IES Recommended Practice for Museum Lighting, which independently arrives at similar spectral quality principles [35], and by Saunders’ guide for conservators and curators, which likewise emphasizes spectral quality over raw illuminance as the primary lever for conservation-safe display lighting [36].
Having compiled and filtered the LED spectral database (Section 2.1 and Section 2.2), the remaining methodology proceeds through the spectral radiant power data used as input (Section 2.3), the calculation of the Luminous Efficacy of Radiation and the blue-to-yellow spectral ratio (Section 2.4), the CIE 157:2004 photo-degradation model applied to four artifact classes (Section 2.5), and, finally, the relative photochemical damage index that benchmarks each candidate spectrum against a reference filtered halogen lamp (Section 2.6).
2.3. Spectral Radiant Power Data
The analysis is based on the absolute spectral radiant power distribution, P(λ), expressed in watts per nanometer (W·nm−1), of a set of phosphor-converted white LED sources covering the CCT range typically encountered in museum lighting (nominally 2700–6500 K). All spectral quantities are evaluated over the visible range of λ = 380–780 nm at a discrete resolution of Δλ = 1 nm. Working directly with P(λ), rather than with a normalized or system-level quantity such as the Luminous Efficacy of the Source (LES), keeps the analysis independent of driver and optical losses and isolates the physical trade-off that originates in the emitted spectrum itself. This is distinct from the constant-flux rescaling described in Section 2.6: before computing DR, every spectrum in the database, including P(λ) itself, is rescaled to the same reference luminous flux so that comparisons across spectra capture the effect of spectral shape—the blue-to-yellow balance—rather than differences in reported flux magnitude between products or between the two source repositories. This rescaling does not reintroduce driver or luminaire losses, as it is applied uniformly to the spectral data itself independently of any system-level efficacy measurement. Chromaticity coordinates (u′, v′) and CCT for each spectrum were computed following standard CIE colorimetric procedures [37]. Terminology and unit definitions used throughout this study, including LER, CCT, and Duv, follow the CIE International Lighting Vocabulary [38], and Duv itself was calculated following established practical guidance on its use alongside CCT [39]. Foundational colorimetric formulae for converting spectral data to tristimulus and chromaticity values follow the classic reference text of Wyszecki and Stiles [40].
2.4. Luminous Efficacy of Radiation and the Blue-to-Yellow Ratio
The Luminous Efficacy of Radiation (LER, in lm·W−1) expresses how effectively the radiant power of a given spectrum is converted into luminous flux as perceived by the human eye. It is calculated as
where Km = 683.002 lm·W−1 is the maximum spectral luminous efficacy for photopic vision at λ = 555 nm and V(λ) is the CIE 1924 standard photopic luminous efficiency function.
To quantify the spectral asymmetry that underlies the LER–damage trade-off, the blue-to-yellow spectral power ratio, γB/Y, is defined as the ratio of radiant power in the photochemically active blue band to that in the low-energy yellow-orange band:
where the integration limits are 400–500 nm for the blue band and 550–650 nm for the yellow-orange band.
These band boundaries were chosen because 400–500 nm brackets the primary emission peak of the blue LED chip common to all phosphor-converted white LEDs in the compiled database (typically centered near 445–460 nm), while 550–650 nm brackets the peak of the down-converted yellow-orange phosphor band; together, the two bands capture the two spectral features whose relative weight changes most with CCT and phosphor blend. Re-computing γB/Y for all 124 good-quality spectra with the alternative bounds 420–480/560–640 nm gives values strongly correlated with those from the 400–500/550–650 nm bounds used throughout (Pearson r = 0.97; Spearman ρ = 0.82), indicating that rankings are preserved to a good approximation, though not exactly, under this alternative choice.
Because γB/Y integrates total radiant power across the whole 400–500 nm band, two spectra with the same γB/Y, CCT, and CRI can nonetheless differ in the position, width, or shape of the blue LED emission peak within that band (e.g., a peak near 420 nm versus 450 nm); because srel(λ) (Equation (3)) falls off exponentially with λ, a shift of the peak toward shorter wavelengths increases the damage-weighted dose even when γB/Y is unchanged. A multiple regression of DR on γB/Y and blue-peak wavelength, fitted separately for the two CCT sub-ranges identified in Section 3.1, confirms that peak position carries independent information: in the 4000–6500 K sub-range, adding peak wavelength significantly improves the fit for all three material groups (N = 19; p = 0.014–0.018), with a shorter peak wavelength increasing DR at fixed γB/Y, consistent with the exponential form of srel(λ). The effect is weaker and only marginal in the 2700–3000 K sub-range (N = 105; p = 0.05–0.16). γB/Y and DR as reported here should therefore be read as capturing the dominant, first-order effect of the blue/yellow balance, with peak position contributing a smaller secondary effect that is most detectable at higher CCTs.
Together, Equations (1) and (2) allow every candidate spectrum to be positioned simultaneously in terms of its energy efficiency (LER) and its spectral composition (γB/Y).
2.5. Photo-Degradation Modeling for Four Artifact Classes (CIE 157:2004)
The destructive potential of each candidate spectrum is evaluated using the framework established in CIE 157:2004, Control of Damage to Museum Objects by Optical Radiation [13]. The relative spectral damage function, srel(λ), expresses the increase in photochemical damage potential with decreasing wavelength (increasing photon energy) and normalized to unity at λ = 300 nm:
where b (in nm−1) is a material-specific empirical coefficient.
This exponential form is not an arbitrary curve fit; it follows from treating photochemical degradation as a first-order, single-photon damage process. Let N(λ,t) denote the population of light-sensitive chromophores that remain intact in a material after exposure to monochromatic radiation of wavelength λ for a time t, and let I(λ) denote the incident spectral irradiance. If every absorbed photon triggers an irreversible degradation event with a wavelength-dependent probability p(λ), the intact chromophore population obeys the first-order kinetic equation. In a short time interval, the number of degradation events is proportional to three quantities multiplied together: the incident photon flux I(λ), the probability p(λ) that an absorbed photon causes degradation, and the number of intact molecules N(λ,t) still available to degrade; because this loss reduces the population itself, the rate of change carries a negative sign, giving
This first-order character implies that the population loses a fixed fraction of its remaining undamaged molecules per unit time, the same type of decay law that describes radioactive decay. The absolute number of degradation events slows down as fewer intact molecules remain, but the underlying risk per molecule per unit time stays constant.
Equation (4) has solution
A fixed, visually detectable level of damage is therefore reached once the cumulative exposure H(λ) = I(λ)·t satisfies p(λ)·H(λ) = const., i.e., once the reciprocity law threshold dose H(λ) ∝ 1/p(λ) has been delivered.
Because chromophore bond dissociation is an activated process, the per-photon damage probability p(λ) is expected to fall off approximately exponentially as photon energy decreases (wavelength increases) below the activation threshold of the dominant chromophore population, i.e., p(λ) ∝ exp[−b(λ − 300)]. Identifying srel(λ) with this damage probability, normalized to its value at the reference wavelength λ = 300 nm, recovers Equation (3) directly as a kinetic damage effectiveness function rather than an unmotivated empirical curve. Under this reading, the coefficient b (Section 2.5) is not merely a fitted slope but an effective activation energy parameter of the chromophore population dominating degradation in each material class: a larger b corresponds to a steeper exponential fall-off, confining photochemical damage more narrowly to the shortest, highest-energy wavelengths, while a smaller b corresponds to a chromophore population whose degradation extends further into the longer-wavelength part of the visible range. This matches the class-specific coefficients listed below, where rag paper (b = 0.0125 nm−1) exhibits the steepest fall-off and textile materials (b = 0.0100 nm−1) the flattest.
Following CIE 157:2004, the four artifact classes considered in this study are assigned the following coefficients:
- Water colors on paper rag: Extra-high sensitivity; b = 0.0115 nm−1, threshold radiation Hs,dm = 175 Wh/m2, because organic pigments bound on a paper substrate degrade readily under relatively low radiant exposure, reflecting their pronounced photochemical fragility.
- Oil colors on canvas: Medium sensitivity; b = 0.0115 nm−1, threshold radiation Hs,dm = 850 Wh/m2, because damage is concentrated in the violet-blue region, consistent with the known short-wavelength sensitivity of oil-based media.
- Textile materials: High sensitivity; b = 0.0100 nm−1, threshold radiation Hs,dm = 290 Wh/m2, because natural and dyed fibers show a comparatively flat spectral damage function, indicating vulnerability that extends further into the longer-wavelength part of the visible range than for the other material classes considered.
- Rag paper: High sensitivity; b = 0.0125 nm−1, threshold radiation Hs,dm = 1200 Wh/m2, because unpigmented cellulose is damaged almost exclusively by the shortest, highest-energy wavelengths, producing the steepest of the four damage functions (Section 2.5); its comparatively high threshold radiation reflects the large cumulative exposure this blue-confined damage requires before becoming visible, rather than any broadening of the spectral range it responds to.
Figure 1 plots the resulting relative spectral damage function srel(λ) for the four material classes computed from Equation (3) using the coefficients above; because oil colors on canvas and water colors on paper rag share an identical b coefficient, their curves overlap exactly, while rag paper’s higher b produces the steepest short-wavelength rise of the four and textile materials the flattest.
Figure 1.
Relative spectral damage function srel(λ), determined according to CIE 157:2004 for the selected museum materials (rag paper, oil colors on canvas, water colors on paper rag, and textile materials) over the visible spectrum of 380–780 nm, calculated using Equation (3) with the material-specific coefficients b given in Section 2.5.
The four artifact classes are therefore represented by only three distinct srel(λ) curves; water colors on paper rag and oil colors on canvas are distinguished from one another not by spectral shape but by their threshold radiation Hs,dm (Section 2.5). Hs,dm does not enter the DR calculation itself, which depends on b alone (Equations (3) and (7)). It is instead a separate qualitative indicator of absolute fragility—how little total light exposure the material can tolerate before visible damage occurs—and it is on this qualitative basis, not through the DR formula, that the two materials remain distinct despite sharing an identical curve and DR value. Water colors on paper rag nonetheless remain the most fragile class of the four in absolute terms, owing to their much lower threshold radiation Hs,dm. Because both materials share the same b coefficient, their ser values are numerically identical for any given spectrum; they are therefore grouped in a single column in Tables 8 and 9, where the reported DR values apply equally to both classes.
To express the destructive potential of a spectrum relative to the amount of useful light it provides, the relative damage factor per lumen, ser (in mW·lm−1) is defined for each artifact class as
The factor of 1000 in the denominator converts the result to mW·lm−1. For a given spectrum, ser is evaluated separately with each of the four b coefficients above, yielding four class-specific damage values per candidate LED spectrum. Because γB/Y is itself closely tied to LER (Section 3.1), fitting DR against γB/Y for each class (Section 3.4) provides a lightweight, class-specific screening relationship that, combined with the LER-γB/Y association established in Section 3.1, allows candidate spectra to be assessed, for every CCT, against a defined DR conservation threshold for that class.
2.6. Relative Photochemical Damage Index (DR)
To directly compare the destructive potential of the individual LED sources contained in the compiled database with a reference solution used in museum practice, a relative photochemical damage index DR is introduced. This index expresses the ratio of the effective photochemical load imposed on a material by the analyzed LED source to the load imposed by the spectral power distribution of a reference filtered tungsten halogen lamp (known also as a cold mirror halogen lamp, meaning a dichroic filter is used to reflect the visible output toward the display object while transmitting most of the infrared heat and much of the ultraviolet component away from it, a common museum retrofit for reducing the damage and heat load of legacy tungsten halogen fixtures without discarding them outright), recommended for museum lighting [41]. The reference lamp itself has a nominal CCT of 2856 K, γB/Y = 0.222, TM-30 Rf = 94 (fidelity index), Rg = 96 (gamut index; both defined in Section 3.6), Rcs,h1 = −3%, and R9 = 74 (computed here from the SPD reported in [41], since as the TM-30 method postdates that source), a high-fidelity source in its own right, so that a candidate LED spectrum with DR < 1 must be less photochemically damaging than an already efficacious and high-quality benchmark, not merely a low-efficacy incandescent source. Unlike the sharply peaked, phosphor-converted emission of LED sources, the halogen lamp’s spectral power distribution is a smooth, continuous, red-shifted curve characteristic of thermal emission, as shown in Figure 2; this shape (subscripted THCM, for Tungsten Halogen Cold Mirror) is used as PTHCM(λ) in Equation (7) below.
Figure 2.
Spectral power distribution PTHCM(λ) of the reference filtered halogen lamp recommended for museum lighting used as the reference spectrum in calculating the relative photochemical damage index DR. Based on the data from [41].
Note that DR is defined here specifically relative to this filtered halogen reference and is not proposed as a universal, reference-independent damage metric; absolute DR values would change under a different choice of reference source, so cross-study comparison of absolute DR values requires that the same reference spectrum be used.
The index DR is defined as
where PLED(λ) denotes the spectral power distribution of the analyzed LED source (drawn from the “good-quality” or “excellent-quality” database, as classified in Section 2.2), PTHCM(λ) is the spectral power distribution of the reference filtered halogen lamp, and sdm,rel(λ) [equivalent to srel(λ) in Equation (3)] is the relative photochemical damage function from Equation (3), calculated separately for each material (rag paper, oil colors on canvas, water colors on paper rag, textile materials) using the corresponding b coefficients listed in Section 2.5 (CIE 157:2004). Integration was carried out over the visible range of λ = 380–780 nm.
Because the two constituent repositories described in Section 2.1 report spectra on different absolute scales (PNNL spectra are absolute radiant power distributions, whereas the EMPIR PhotoLED spectra are relative), and because the reference lamp spectrum PTHCM(λ) originates from yet another source, every spectrum entering Equation (7) is first rescaled to a common photometric condition before the damage-weighted integrals are evaluated. Each P(λ) is multiplied by a constant k, defined as
Here, Φ is the luminous flux implied by the spectrum as reported, and Φref is a common reference luminous flux applied identically to every spectrum in the database, including PTHCM(λ). Equation (7) is therefore evaluated on kP(λ) rather than P(λ) directly. Because LER, γB/Y, and ser (Equations (1), (2) and (6)) are each ratios of two integrals of the same spectrum, they are unaffected by this rescaling; only DR (Equation (7)), which compares two distinct spectra, requires this step, and all DR values reported in Section 3.3 and Section 3.5 were recomputed on this common flux basis. This convention was verified directly against the compiled database: for every spectrum, the product of its reported LER and its total integrated radiant power is constant to within 0.01%, confirming that every spectrum, including PTHCM(λ), is already normalized to an identical reference luminous flux prior to DR calculation.
A value of DR = 1 indicates that the given LED source produces the same photochemical load on the material as the reference filtered halogen lamp. A value of DR < 1 indicates that the analyzed LED source is less damaging to the given material than the reference solution, whereas DR > 1 indicates a greater risk of degradation to the material compared with the filtered halogen lamp.
The DR equivalence for classes sharing the same damage coefficient b, noted in Section 2.5, follows directly from the ratio definition in Equation (7). A second structural property used below is that the ranking of candidate spectra by DR is invariant to the choice of reference lamp, so only the absolute DR = 1 cutoff, not the relative ordering of products, would shift under a different reference spectrum. The full derivations, together with a closed-form sensitivity analysis of DR to the coefficient b, are given in Appendix A.
The numerical evaluation of Equation (7) is well-conditioned. Because srel(λ) is smooth, strictly positive, and monotonically decreasing (and, as it is a pure exponential, everywhere convex) over 380–780 nm for every b value used in this study, both the numerator and denominator integrals in Equation (7) are free of singularities, sign changes, or oscillatory behavior, so no special quadrature is required beyond the composite trapezoidal rule applied at the Δλ = 1 nm spectral resolution used throughout (Section 2.3). For a smooth integrand, this rule has local truncation error O(Δλ2) per interval, and because the integrand’s convexity is one-signed over the whole domain, the trapezoidal rule introduces a small, systematic, and analytically boundable over-estimate of each integral rather than an unpredictable error of either sign. Because the same bias direction and order of magnitude apply to both the numerator and the denominator of Equation (7), it is further damped in the ratio DR, which is markedly smaller than either integral’s own discretization error. At Δλ = 1 nm, this quadrature error is negligible relative to the measurement uncertainty of the spectroradiometric data underlying the compiled LED database, so the DR rankings reported in Section 3 are not sensitive to the choice of numerical integration scheme. All spectral integrals, LER, γB/Y, ser and DR calculations, and the polynomial curve fits reported in Section 3.4 were performed in Microsoft Excel.
Sample sizes vary substantially across CCT bins, particularly for the excellent-quality subset (Section 2.2); differences between DR < 1 proportions reported in Section 3.5 were therefore tested using Fisher’s exact test, with a Holm–Bonferroni step-down correction applied where multiple materials were compared simultaneously, and 95% confidence intervals for small-sample proportions were computed using the Wilson score method. Because the excellent-quality subset is by construction a subset of the good-quality subset (Section 2.2: 30 of the 124 good-quality spectra additionally satisfy R9 ≥ 90), the good-quality and excellent-quality groups are not statistically independent samples. Comparisons in Section 3.5 between the two quality tiers were therefore restated as comparisons between two non-overlapping groups, good-quality-only (the 94 good-quality spectra that do not also satisfy the excellent-quality criterion) and excellent-quality, and Fisher’s exact test and the associated Holm–Bonferroni correction were re-run on this partition. Re-running the comparison at 2700 K (the only bin with non-zero DR < 1 shares) on this non-overlapping partition gives good-quality-only (N = 23) versus excellent-quality (N = 13) proportions of 83% versus 38% for rag paper, 83% versus 23% for oil colors on canvas/water colors on paper rag, and 65% versus 8% for textile materials. Fisher’s exact test gives p = 0.011, 0.0009, and 0.0013, respectively, and a Holm–Bonferroni step-down procedure now holds all three differences significant at α = 0.05—the opposite conclusion from the original overlapping group comparison reported in Section 3.5, which found none significant.
The DR index was calculated independently for every spectral power distribution in the compiled database and separately for each of the four analyzed materials, enabling a normalized, multidimensional comparative assessment of all LED sources meeting the “good-quality” and “excellent-quality” light criteria of Technical Bulletin 36 [28] against the reference practice currently used in museum object lighting.
3. Results
This section applies the screening framework in Section 2 to the compiled LED database. Section 3.1 characterizes how LER and the blue-to-yellow ratio vary with CCT for the good-quality and excellent-quality subsets. Section 3.2 expresses this trend directly as an LER–damage trade-off across the full database, and Section 3.3 disaggregates it by artifact class. Section 3.4 fits empirical models to the class-specific DR–γB/Y relationship for practical reference. Section 3.5 reports the relative photochemical damage index DR that benchmarks the database against current halogen-based practice, Section 3.6 characterizes the TM-30 color rendition quality of the screened sources, and Section 3.7 examines a separate subset of commercial LEDs explicitly designed to mimic the spectral shape of natural sunlight as a case study in whether high color rendition fidelity alone predicts photochemical safety.
Figure 3 and Figure 4 show the spectral power distributions and chromaticity coordinates of the good-quality and excellent-quality source databases, respectively (classified per the criteria of Section 2.2).
Figure 3.
(a) Spectral power distributions of LED sources in the good-quality light database at nominal CCTs of 2700 K, 3000 K, 4000 K, 5000 K, and 6500 K and (b) chromaticity points confirming membership of the corresponding nominal CCT quadrangle per the seven-step ANSI C78.377 quadrangles provided by ANSI C78.377-2017 [42].
Figure 4.
(a) Spectral power distributions of LED sources in the excellent-quality light database at nominal CCTs of 2700 K, 3000 K, and 4000 K (no excellent-quality products were identified at 5000 K or 6500 K; see Section 2.2) and (b) chromaticity points confirming membership of the corresponding nominal CCT quadrangle per the seven-step ANSI C78.377 quadrangles.
In panel (a) of each figure, the spectral peak associated with the blue LED chip becomes progressively more prominent relative to the phosphor-converted yellow-orange band as nominal CCT increases from 2700 K to 6500 K, visually confirming the spectral asymmetry that underlies the LER–damage trade-off quantified in Section 2.4. Panel (b) confirms that despite this variation in spectral shape, every source’s chromaticity coordinates fall within the seven-step quadrangle appropriate to its nominal CCT, verifying that the CCT labels used throughout this study reflect genuine membership in the corresponding color temperature category rather than a loosely rounded nominal value.
3.1. LER and Blue-to-Yellow Ratio as a Function of CCT
Figure 5 and Table 1, Table 2, Table 3 and Table 4 summarize how LER and γB/Y vary with nominal CCT, providing the baseline efficacy–spectrum relationship against which the damage-related results in the following subsections are interpreted. Figure 5a plots LER against CCT and Figure 5b plots γB/Y against CCT, with every individual commercial LED spectrum in the compiled database shown as a single point and the good-quality and excellent-quality subsets distinguished throughout.
Figure 5.
Relationship between LER, γB/Y and CCT for individual LED spectra in the compiled database (good-quality and excellent-quality light subsets, as labeled). (a) Luminous Efficacy of Radiation (LER) versus CCT. (b) Blue-to-yellow spectral ratio (γB/Y) versus CCT. Each point represents one commercial LED spectrum; the underlying statistics are summarized in Table 1, Table 2, Table 3 and Table 4.
Table 1.
LER across the studied CCT range (good-quality light). At 6500 K, N = 3 (SD = 1.38 lm·W−1); the narrow spread reflects sample size, not spectral uniformity.
Table 2.
LER across the studied CCT range (excellent-quality light). Note: at 4000 K, N = 2 (SD = 2.69 lm·W−1); no excellent-quality LEDs at 5000/6500 K.
Table 3.
Blue-to-yellow spectral ratio (γB/Y) across the studied CCT range (good-quality light). Note: at 6500 K, N = 3 (SD = 0.0550); reflects sample size, not spectral uniformity.
Table 4.
Blue-to-yellow spectral ratio (γB/Y) across the studied CCT range (excellent-quality light). Note: at 4000 K, N = 2 (SD = 0.0272); no sources at 5000/6500 K.
Table 1 and Table 2 report the corresponding LER descriptive statistics binned by nominal CCT for the good-quality and excellent-quality subsets, respectively, while Table 3 and Table 4 report the equivalent γB/Y statistics for the same two subsets. Together, these four tables quantify both the central tendency and the spread of each quantity within every CCT bin, including the bin-specific sample sizes that determine how much weight should be given to each comparison in Section 3.2 onward. Each table reports the same nine descriptive statistic rows, quartiles, mean, median, extremes with and without outliers, and standard deviation, so the format is consistent across all four CCT bins and both quality tiers.
Both quantities increase with nominal CCT but at markedly different rates: mean LER rises quickly and then plateaus above 4000 K, whereas mean γB/Y increases monotonically across the entire range, roughly quadrupling from the warmest to the coolest nominal CCT (exact per-bin values are given in Table 1, Table 2, Table 3 and Table 4 and are not repeated here). The excellent-quality subset follows the same qualitative pattern over the narrower 2700–4000 K range for which it has data.
Figure 5 necessarily overlaps in content with the precise statistics reported in Table 1, Table 2, Table 3 and Table 4; it is included as a visual quick-reference so that a reader can grasp the overall LER–CCT and γB/Y—CCT trends at a glance before consulting the tables for exact values. Each spectrum is plotted as an individual point rather than as a box-and-whisker summary, as this additionally conveys cluster density, gaps, and outlying products within each CCT bin that a box plot would compress into quartiles alone. For the sparsest bins (good-quality sources at 5000–6500 K, N = 3–4; excellent-quality sources at 4000 K, N = 2), the individual points shown are the complete available data rather than a reliable statistical sample; no excellent-quality sources were identified at 5000 K or 6500 K, labeled accordingly in Figure 5, reflecting the market scarcity of high-R9 products at cool-white CCTs discussed in Section 2.2.
3.2. LER–Damage Trade-Off Across the Compiled Database
The CCT-dependent trend just described has a direct counterpart at the level of individual products: Figure 6 and Figure 7 plot LER and γB/Y directly against the relative photochemical damage factor ser (Equation (6)) for every spectrum in the compiled database, making the efficacy–damage trade-off explicit for each commercial product rather than CCT bins alone. A simple linear fit across the pooled database (all CCTs combined) yields a near-zero coefficient of determination for LER against ser (Figure 6), reflecting the saturating, non-linear CCT dependence of LER established in Section 3.1. Pooling all CCTs together obscures rather than reveals a simple trend, which is precisely why the CCT-specific analysis in Section 3.4 is needed. In contrast, γB/Y against ser shows a strong, consistent linear relationship across the pooled database (across materials and quality tiers, Figure 7), as both quantities are direct functions of spectral shape rather than CCT indirectly.
Figure 6.
LER plotted against the relative photochemical damage factor ser for the compiled database of (a) good-quality and (b) excellent-quality LED sources across the studied CCT range, color-coded by artifact class (rag paper, oil colors on canvas/water colors on paper rag, textile materials).
Figure 7.
Blue-to-yellow spectral ratio (γB/Y) plotted against the relative photochemical damage factor ser for the compiled database of (a) good-quality and (b) excellent-quality LED sources across the studied CCT range, color-coded by artifact class (rag paper, oil colors on canvas/water colors on paper rag, textile materials).
The color coding in both figures reveals a further consistent pattern: because ser is itself material-specific (Section 2.5), the three artifact class clusters occupy visibly separated portions of the horizontal axis even within the pooled scatter. Rag paper is concentrated at the lowest ser values, textile materials extend furthest toward the highest, and oil colors on canvas/water colors on paper rag fall between, foreshadowing the class-specific breakdown developed in Section 3.3.
3.3. Class-Specific LER-Damage Trade-Offs
This database-wide trade-off is not the same for every material, however. Figure 8, Figure 9 and Figure 10 break it down by artifact class, showing the DR-γB/Y relationship separately for rag paper, oil colors on canvas and water colors on paper rag, and textile materials.
Figure 8.
DR plotted against the blue-to-yellow spectral ratio (γB/Y) for rag paper under good-quality: (a) nominal CCT 2700–3000 K, (b) nominal CCT 4000–6500 K, and (c) excellent-quality LED light sources, nominal CCT 2700–3000 K.
Figure 9.
The DR plotted against the blue-to-yellow spectral ratio (γB/Y) for oil colors on canvas and water colors on paper rag under good-quality: (a) nominal CCT 2700–3000 K, (b) nominal CCT 4000–6500 K, and (c) excellent-quality LED light sources, nominal CCT 2700–3000 K.
Figure 10.
The DR plotted against the blue-to-yellow spectral ratio (γB/Y) for textile materials under good-quality: (a) nominal CCT 2700–3000 K, (b) nominal CCT 4000–6500 K, and (c) excellent-quality LED light sources, nominal CCT 2700–3000 K.
Unlike Section 3.2, which plotted LER and γB/Y against the raw damage factor ser, Figure 8, Figure 9 and Figure 10 plot DR (Equation (7)) directly on the vertical axis so that each point already expresses damage relative to the filtered halogen benchmark rather than in the dimensionless ser units used earlier; the DR = 1 line in each panel therefore marks the halogen-equivalent threshold discussed in Section 2.6. To keep the three figures directly comparable, each follows the same three-panel layout: panel (a) covers good-quality sources at the 2700–3000 K sub-range, panel (b) covers good-quality sources at the 4000–6500 K sub-range, and panel (c) covers excellent-quality sources, which the data availability constraint noted in Section 2.2 restricts to 2700–3000 K. The two good-quality sub-ranges are shown as separate panels, rather than pooled onto a single axis, because Section 3.2 already established that the LER–γB/Y relationship shifts regimes around 4000 K; fitting a single trend line across that break would obscure rather than describe the underlying DR-γB/Y pattern, which is why the second-order polynomial fits reported in Section 3.4 are likewise computed separately per sub-range. Because all three figures share identical axis scales within each matching sub-range, a reader scanning Figure 8, Figure 9 and Figure 10 in sequence can compare the steepness of the fitted curve directly across material classes at a glance without needing to renormalize between panels; that steepness, discussed further below, is what ultimately separates one material’s screening implications from another’s.
The three panels also differ substantially in how many points they draw on. Panel (a) pools the 2700 K and 3000 K good-quality bins for N = 105 spectra, whereas panels (b) and (c) are necessarily sparser at N = 19 (good-quality, 4000–6500 K) and N = 28 (excellent-quality, 2700–3000 K), respectively, consistent with the CCT-specific scarcity already discussed in Section 2.2. This difference in point density is visible directly in the scatter of Figure 8, Figure 9 and Figure 10 and worth keeping in mind when comparing how tightly the fitted curve tracks the data from one panel to the next.
Across all three material groups, DR rises monotonically with γB/Y within each CCT sub-range (panels a–b in Figure 8, Figure 9 and Figure 10), consistent with the pooled database trend already established in Section 3.2, but the steepness of that rise differs visibly by class: rag paper’s DR climbs fastest with γB/Y (Figure 8), textile materials’ climbs most gently (Figure 10), and oil colors on canvas/water colors on paper rag fall between (Figure 9). The steepness ranking follows the class-specific b coefficients used to generate each panel (Section 2.5: rag paper 0.0125 nm−1 > oil colors on canvas/water colors on paper rag 0.0115 nm−1 > textile materials 0.0100 nm−1) and is quantified directly by the leading (quadratic) coefficient of the polynomial fits reported in Section 3.4 (Table 5, Table 6 and Table 7), which decreases in the same order across every matching CCT sub-range and quality tier. A second consistent feature across all three figures is the visible break between panel (a) (2700–3000 K) and panel (b) (4000–6500 K): within each sub-range, DR and γB/Y track each other closely, but the slope changes markedly at the sub-range boundary for every material class, reflecting the same regime shift in the LER–γB/Y relationship discussed in Section 3.1 rather than a class-specific artifact. Panel (c), the excellent-quality subset restricted to 2700–3000 K by the data availability noted in Section 2.2, shows the same qualitative DR–γB/Y trend as the good-quality panel (a) at the same CCTs, with a comparable, though noisier, class ordering given its smaller sample size.
Table 5.
Empirical fit between DR and the blue-to-yellow spectral ratio (γB/Y) for rag paper.
Table 6.
Empirical fit between DR and the blue-to-yellow spectral ratio (γB/Y) for oil colors on canvas and water colors on paper rag.
Table 7.
Empirical fit between DR and the blue-to-yellow spectral ratio (γB/Y) for textile materials.
3.4. Empirical Fit Models for the DR–γB/Y Relationship
Table 5, Table 6 and Table 7 translate these class-specific trends into a quick screening reference: for each material, a second-order polynomial relates DR to γB/Y, fitted separately for the 2700–3000 K and 4000–6500 K sub-ranges identified above.
Fit quality is consistently high but not uniform. R2 ranges from 0.83 to 0.94 across the nine reported fits, with the 4000–6500 K sub-range fitting consistently better (R2 = 0.93–0.94) than the 2700–3000 K sub-range (R2 = 0.83–0.87) for every material class. Part of this difference likely reflects sample size rather than a purely tighter physical coupling: the 4000–6500 K sub-range draws on only N = 19 good-quality spectra (Section 3.3) compared with N = 105 in the 2700–3000 K sub-range, so its higher R2 should be read with some caution rather than as unambiguous evidence of a stronger underlying DR–γB/Y relationship. The missing 4000–6500 K excellent-quality row in each table is not a fitting failure but a direct consequence of the market scarcity pattern established in Section 2.2. Only two excellent-quality products are available at 4000 K—too few to support a regression fit—and none at all at 5000 K or 6500 K, so no fit could be computed at those higher CCTs. Practically, these formulas let a lighting engineer estimate DR for a candidate product directly from its measured γB/Y without recomputing the underlying spectral integrals of Equation (7), provided the product’s nominal CCT falls within the corresponding sub-range and quality tier; extrapolation outside of the fitted γB/Y range is not recommended given the polynomials’ unconstrained behavior beyond the sampled data.
3.5. Relative Photochemical Damage Index (DR) Across the Compiled Database
Section 3.1 and Section 3.2 express the efficacy–damage trade-off on the abstract ser scale, while Section 3.3 and Section 3.4 recast it as DR fitted against γB/Y for each material. This section instead reports DR directly as a percentage-based screening outcome per CCT and quality tier. Table 8 and Table 9 report the relative photochemical damage index DR (Equation (7)) computed for every spectrum in the compiled database against the reference filtered halogen lamp for the good-quality and excellent-quality light subsets, respectively. For each nominal CCT and material, the table gives the number of spectra evaluated (N), the mean DR, and the percentage of spectra with DR < 1 (i.e., demonstrably less photochemically damaging than the reference halogen lamp).
Table 8.
Relative photochemical damage index DR across the studied CCT range (good-quality light). Cells marked * should not be read as reliable estimates of the population proportion; see Section 3.5.
Table 9.
Relative photochemical damage index DR across the studied CCT range (excellent-quality light). Cells marked * should not be read as reliable estimates of the population proportion; see Section 3.5.
Two findings stand out. First, DR rises with CCT for every material and both quality tiers, mirroring the γB/Y trend in Section 3.1. Only at the warmest nominal CCT (2700 K) does a meaningful share of commercially available products fall below the halogen benchmark (DR < 1: 44–67% of good-quality and 8–38% of excellent-quality products, depending on material). From 3000 K upward, none of the products in either subset are less damaging than the reference halogen lamp for any of the three material columns in Table 8 and Table 9 (oil colors on canvas and water colors on paper rag being grouped as a single column, as noted in Section 2.5). The 0% observations at 4000 K, 5000 K, and 6500 K should be read with appropriate statistical caution, as sample sizes fall to single digits at these CCTs (e.g., N = 3–4 for good-quality sources at 5000–6500 K), so a true underlying share of up to roughly 50% cannot be excluded from these bins alone (95% Wilson score interval); this finding is directionally consistent with the trend but not conclusive at these CCT bins. It is worth noting that at 2700 K, the mean DR values for good-quality sources slightly exceed 1.0 (e.g., 1.05 for rag paper) even though 44–67% of products achieve DR < 1; this reflects a right-skewed distribution in which a minority of products with particularly high blue content pull the mean above unity while the majority of the distribution lies below it. At 3000 K, in contrast, the DR distribution is concentrated entirely above 1.0 with very low dispersion (consistent with the narrow SD of γB/Y reported in Table 3), meaning the halogen benchmark is not achievable by any product in this bin regardless of individual spectral variation. Second, at the same nominal CCT, the excellent-quality subset generally shows a lower share of DR < 1 products than the good-quality subset (e.g., 8% versus 44% for textile materials at 2700 K). Because the excellent-quality subset is by construction a subset of the good-quality subset (Section 2.2), a valid significance test requires comparing excellent-quality against the non-overlapping good-quality-only group (N = 94 overall; N = 23 at 2700 K) rather than against the full overlapping good-quality group. On this corrected partition, Fisher’s exact test at 2700 K gives p = 0.011 for rag paper, p = 0.0009 for oil colors on canvas/water colors on paper rag, and p = 0.0013 for textile materials; a Holm–Bonferroni step-down procedure (α = 0.05) holds all three differences significant. Unlike the original overlapping group comparison, this corrected test therefore supports treating the DR gap between good-quality-only and excellent-quality sources as a robust, independently confirmed finding: the broader phosphor blend required to reach R9 ≥ 90 measurably increases photochemical risk, not only reducing LER. Together, these results indicate that CCT and color rendition class alone are insufficient screening criteria. A genuinely conservation-safe LED retrofit additionally requires DR screening of the individual candidate spectrum, particularly above 2700 K.
3.6. TM-30 Color Rendition Quality of the Compiled Database
Although source selection (Section 2.2) was based on CRI Ra, R9, and Duv, the compiled database was additionally characterized using the IES TM-30 fidelity (Rf), Local Chroma Shift (Rcs,h1), and gamut (Rg) indices [15], which provide a more complete picture of color rendition than CRI Ra alone. The TM-30 framework itself moved from an initial fidelity-only proposal to the two-measure Rf/Rg system used here over roughly a decade of refinement [43]. Its calculation framework was subsequently harmonized with the CIE’s own color fidelity index [44]. A more recent, updated edition of the CIE’s colorimetry recommendations has since superseded the version used for the present chromaticity calculations, although without materially affecting the reported results [37]. Reservations about single-number color rendering indices had, in fact, already been raised in earlier CIE deliberations on the topic [45]. Table 10 summarizes Rf, Rg, Rcs,h1, R9, and CRI Ra across the full compiled database (all CCTs pooled) for the good-quality and excellent-quality light subsets.
Table 10.
TM-30 fidelity (Rf), gamut (Rg), and Local Chroma Shift (Rcs,h1) indices, R9, and CRI Ra across the compiled database (all CCTs pooled).
Both subsets achieve Rg close to 100 (mean 100.3 and 100.8, respectively), indicating that neither the good-quality nor the excellent-quality sources systematically over- or under-saturate colors relative to the reference illuminant; Rf tracks R9 and CRI Ra closely, confirming that the higher R9 ≥ 90 requirement imposed on the excellent-quality subset (Section 2.2) is reflected consistently across the independent TM-30 fidelity metric (mean Rf 94.0 versus 91.8), rather than being an artifact of the CRI Ra/R9 selection criteria alone. The minimum observed Rf (84.2) and Rg (94.1) both remain within ranges generally considered acceptable for critical color rendering applications, supporting the use of CRI Ra/R9/Duv as an adequate first-pass screening criterion even though it does not, on its own, guarantee low DR (Section 3.5).
Table 11 shows that this pattern is not uniform across CCT: in the good-quality subset, as both mean R9 and mean Rf decline toward cooler CCTs (values in Table 11), consistent with the diminishing availability of high-R9 phosphor blends at cooler CCTs already noted in Section 2.2; the excellent-quality subset, by construction, maintains R9 ≥ 90 across all represented CCTs.
Table 11.
TM-30 fidelity (Rf), gamut (Rg), and Local Chroma Shift (Rcs,h1) indices, R9, and CRI Ra broken down by nominal CCT for the good-quality and excellent-quality subsets.
The Rf/Rg framework used here builds on roughly a decade of perceptual validation work, much of it converging on the same conclusion: fidelity alone is an incomplete predictor of how people actually judge color rendition. Observer preference depends on chromaticity as well as Rf and Rg, Royer and colleagues found [46], and a related study from the same group showed, that perceived rendition tracks average fidelity, average gamut, and gamut shape jointly rather than fidelity in isolation [47]. Independently, Jost et al. demonstrated that Rf predicts perceived color difference better than the legacy CRI Ra [48], while Gu et al., testing several competing metrics against empirical color difference data, likewise found Rf among the strongest predictors [49]. A unified color quality model folding both fidelity and gamut into a single framework was proposed by Zhang et al. [50]. Even before TM-30 existed, Teunissen et al. had already shown that pairing CRI Ra with a gamut area index outperforms CRI Ra alone at predicting user preference, effectively anticipating the two-measure logic TM-30 would later formalize [51]. Together, this body of work motivates the choice of Rf and Rg, rather than CRI Ra alone, as the color quality benchmark applied to the compiled database in this study.
3.7. LEDs Mimicking Sunlight
A separate group of commercially available LED products [52] (N = 14), explicitly designed to reproduce the spectral shape of natural sunlight, is analyzed in this section. Every source in it independently satisfies the excellent-quality criterion (CRI Ra ≥ 90, R9 ≥ 90, Duv within −0.003 to +0.003) on the basis of its own measured color rendering parameters. As shown in Figure 11a, these sources are characterized by a comparatively narrow blue peak near 450 nm, a pronounced local minimum around 480 nm, and a broad, red-shifted emission band centered near 630–650 nm that follows the visible portion of the solar spectrum more closely than the narrower yellow-orange phosphor band typical of conventional phosphor-converted white LEDs. Figure 11b confirms that despite this markedly different spectral shape, the chromaticity coordinates of every source in this subset remain within the corresponding seven-step quadrangle relative to the Planckian locus on the CIE 1976 (u′, v′) diagram, i.e., all sources still qualify as white-light sources of an identifiable nominal CCT under the same criteria used in Section 2.2. Table 12 additionally reports the TM-30 color rendition metrics (Rf, Rg, Rcs,h1, R9, and CRI Ra) for the LEDs mimicking sunlight subset in the same format used for the compiled database in Section 3.6 (Table 10).
Figure 11.
(a) Spectral power distributions of LEDs mimicking sunlight in the excellent-quality LED light sources database and (b) chromaticity points confirming membership of the corresponding nominal CCT quadrangle per the seven-step ANSI C78.377 quadrangles provided by ANSI C78.377-2017 [42].
Table 12.
TM-30 fidelity (Rf), gamut (Rg), and Local Chroma Shift (Rcs,h1) indices, R9, and CRI Ra for the LEDs mimicking sunlight subset.
Figure 12 plots LER (a) and γB/Y (b) for the LEDs mimicking sunlight subset against the material-specific relative damage factor per lumen, ser (Equation (6)), in the same format used for the full compiled database in Section 3.2 (Figure 6 and Figure 7). Because ser is evaluated separately for each of the three material groups (rag paper; oil colors on canvas/water colors on paper rag; textile materials) while LER is a single spectrum-level quantity, each individual sunlight-mimicking product contributes three points at an identical LER value but at three different ser positions (visible in Figure 12a). The γB/Y tracks ser more closely than LER does (Figure 12b), consistent with the finding in Section 3.2 that γB/Y is more directly a function of spectral shape than LER. As in Figure 6 and Figure 7 (Section 3.2), the same material-specific clustering along the ser axis is visible here: rag paper occupies the lowest ser range, textile materials extend furthest toward the highest values, and oil colors on canvas/water colors on paper rag fall between, confirming that this ordering holds even within the narrower, high-fidelity LEDs mimicking sunlight subset.
Figure 12.
Relationship between LER (a) and γB/Y (b) versus the relative photochemical damage factor ser for the LEDs mimicking sunlight subset (excellent-quality LED sources), color-coded by artifact class (rag paper, oil colors on canvas/water colors on paper rag, textile materials).
Table 13 summarizes LER and γB/Y values for the analyzed database of LEDs mimicking sunlight.
Table 13.
Descriptive statistics of LER and γB/Y for the LEDs mimicking sunlight subset. In the outlier rows, a dash means no outlier was present, not missing data.
Figure 13 fits second-order polynomial models between DR and γB/Y separately for the three material groups within the LEDs mimicking sunlight subset, following the same procedure as Section 3.4 (Table 5, Table 6 and Table 7) but without splitting by CCT sub-range. Because every product in this subset follows the same solar-mimicking spectral design strategy across its full CCT range, rather than switching between different phosphor blend strategies at different CCTs the way the broader commercial market does (Section 3.1), the DR–γB/Y relationship here does not exhibit the same regime shift that motivated splitting Table 5, Table 6 and Table 7 into separate sub-ranges. The resulting fits, reported in Table 14, achieve markedly higher coefficients of determination (R2 = 0.99 for all three material groups) than the corresponding fits for the full compiled database (R2 = 0.83–0.94, Table 5, Table 6 and Table 7), indicating that the DR-γB/Y relationship is substantially more predictable within this spectrally consistent product family than across the heterogeneous commercial market as a whole.
Figure 13.
The DR plotted against the blue-to-yellow spectral ratio (γB/Y) for the LEDs mimicking sunlight subset: (a) rag paper, (b) oil colors on canvas/water colors on paper rag, and (c) textile materials, with fitted second-order polynomial models (Table 14).
Table 14.
Empirical fit between DR and the blue-to-yellow spectral ratio (γB/Y).
As in Section 3.4, the leading (quadratic) coefficient follows the same decreasing order across the three materials (Table 14), mirroring the b-coefficient ordering established in Section 2.5. This consistent ordering across both the full compiled database and this narrower, spectrally homogeneous subset indicates that it reflects the underlying photochemical damage function itself, rather than an artifact of the broader product mix.
Figure 13 reveals a further, more striking pattern: in all three panels, every data point already lies above the DR = 1 halogen benchmark threshold, even at the lowest observed γB/Y values. Table 15, reported in the same percentage-based format used for the excellent-quality subset in Section 3.5 (Table 9), confirms this quantitatively, showing a 0% share of DR < 1 products for every material class in this subset.
Table 15.
Relative photochemical damage index DR for LEDs mimicking sunlight (excellent-quality light).
None of the LEDs mimicking sunlight products achieve DR < 1 for any of the three material classes; mean DR instead ranges from 1.39 (textile materials) to 1.48 (rag paper), placing this entire subset above the halogen benchmark despite its excellent-quality TM-30 credentials (Table 12). This outcome, and what it implies for perceptual fidelity marketing claims more broadly, is examined further in Section 4.
4. Discussion
The LER-γB/Y asymmetry reported in Section 3.1 confirms the fundamental trade-off that motivates this study. Because γB/Y is the spectral quantity that drives the CIE 157:2004 damage function, this asymmetry means that the last increments of LER gained by moving to higher CCTs are bought at a disproportionately large increase in photochemically active blue radiant power, as the efficacy gain flattens out just as the conservation risk keeps climbing.
Comparing the good-quality and excellent-quality subsets reinforces this picture. At every CCT for which both subsets contain data, the excellent-quality sources achieve a lower mean LER and a lower mean γB/Y than the good-quality sources at the same nominal CCT (e.g., 251.65 lm·W−1 versus 264.26 lm·W−1 at 2700 K), consistent with the additional R9 ≥ 90 constraint forcing a broader, less efficacious phosphor blend. More strikingly, the excellent-quality database contains only two qualifying products at 4000 K and none at 5000 K or 6500 K, indicating that commercially available LEDs meeting the R9 ≥ 90 criterion are concentrated in the warm-white range and are scarce or absent among cooler, higher-LER products. For collections that require the highest color-rendering fidelity, this scarcity is itself a practical constraint on how far the LER–damage trade-off can be pushed toward energy efficiency.
The class-specific damage coefficients used in Section 2.5, and the resulting class-specific DR–γB/Y trends plotted in Section 3.3, order the four artifact classes by sensitivity. This ordering, based on the threshold radiation Hs,dm from CIE 157:2004 (Section 2.5), is a qualitative fragility ranking rather than a quantity computed within the DR/LER framework itself, and it is consistent with, rather than derived from, the DR results reported below. Water colors on paper rag, with the lowest threshold radiation (Hs,dm = 175 Wh/m2), can be regarded as tolerating the smallest safe LER window in this qualitative sense. Textile materials and oil colors on canvas follow, while rag paper, with its comparatively high threshold (1200 Wh/m2), sits closest to the least restrictive end of the scale among this study’s four classes. This ordering is consistent with the widely used CIE 157:2004 sensitivity categories and supports treating each artifact class as requiring its own point on the DR–γB/Y curve rather than a single collection-wide compromise.
The empirical polynomial models in Section 3.4 (Table 5, Table 6 and Table 7) translate these class-specific DR–γB/Y relationships into a lightweight screening reference that can be applied without recomputing the full spectral integral. The fits are well-conditioned within each sub-range (R2 = 0.83–0.94) but should not be extrapolated across the break between the 2700–3000 K and 4000–6500 K groups, where the slope change reflects a genuine shift in the spectral trade-off regime rather than a smooth continuum. For oil colors on canvas and water colors on paper rag (Section 2.5), a single polynomial suffices per sub-range; for textile materials, the flatter damage function produces a shallower DR–γB/Y slope, yielding a wider safe LER window at any given CCT relative to the other high-sensitivity class, which practitioners can exploit in galleries displaying only textile artifacts.
The relative photochemical damage index, DR, computed in Section 3.5, provides a practically interpretable benchmark against the filtered halogen practice that many museums still use as their reference point. The results in Table 8 and Table 9 show that this benchmark is far from automatically met by commercially available LED products; only at 2700 K does a substantial share of sources achieve DR < 1, and at 3000 K and above essentially none do for either quality tier or any of the three materials. In practice, this means that CCT and CRI Ra/R9-based selection criteria alone, however carefully applied, are not a reliable proxy for photochemical safety, meaning DR screening of the individual candidate spectrum remains necessary, particularly for any retrofit above 2700 K. Even within the 2700 K band, only 44–67% of good-quality commercial products (depending on material) actually achieve DR < 1, meaning a substantial share of nominally warm-white, high-CRI Ra products marketed for museum use remain more damaging than the incumbent halogen benchmark. Because DR is computed per material and per candidate spectrum, it allows a curator or lighting engineer to identify, within the compiled database, which specific commercially available LED products already outperform the incumbent halogen solution for a given collection, rather than relying on CCT or quality class labels as a shortcut.
The TM-30 results in Section 3.6 add a further, independent line of evidence to this picture. Rf and Rg confirm that both quality tiers render color faithfully and without systematic gamut distortion, and the higher mean Rf of the excellent-quality subset shows that its R9 ≥ 90 criterion is reflected consistently in fidelity, not only in the single R9 hue. Read together with the DR results, however, this confirms that color rendition quality and photochemical safety are largely independent axes: a source can score well on Rf, Rg, CRI Ra, and R9 while still exceeding the halogen DR benchmark because color rendition metrics are computed from the visible spectrum weighted by human color perception, whereas DR is computed from the same spectrum weighted by a wavelength-dependent damage function that penalizes short-wavelength content much more heavily. This independence is further consistent with evidence from fine art illumination research showing that gamut and tint affect the color appearance of artwork at low illuminances independently of fidelity-based metrics [53], as well as painting preference research showing that fidelity (Rf) is a less critical determinant of observer preference than gamut-related indices when viewers evaluate unfamiliar artwork [54]. This is consistent with dedicated CCT/appearance studies of paintings, which find that a painting’s color content and background lightness, not just its CCT and CRI, shape viewer color appearance and appreciation [55]; a themed LEUKOS issue on museum lighting surveys this broader shift toward jointly optimizing visitor experience and conservation risk [56]. Consequently, TM-30 and CRI Ra/R9 remain necessary for verifying visual quality, but they cannot substitute for DR screening when conservation safety is the binding constraint.
Section 3.7’s LEDs mimicking sunlight subset extends this dissociation between color rendition quality and photochemical safety to a class of products marketed specifically on visual/perceptual grounds. Every source in that subset independently satisfies the excellent-quality criterion and, on average, out-performs the general excellent-quality database on TM-30 fidelity and red hue rendering (Table 12 versus Table 10), yet none of them achieve DR < 1 for any of the three material groups (Table 15). The reason is visible in the underlying spectra (Figure 11a): reproducing the solar spectrum’s red-shifted emission band requires a blue-to-yellow ratio comparable to a 4000 K excellent-quality source (Table 4) while delivering a mean LER below even the warmest 2700 K excellent-quality bin (Table 2). In other words, this subset is simultaneously less energy-efficient and no safer than the general excellent-quality database, despite (and largely because of) the spectral shape that gives it its marketing rationale. This is a pointed illustration of the broader argument above: a product’s perceptual or marketing credentials, however well substantiated on fidelity grounds, do not license skipping DR screening for a specific artifact class.
The present screening framework is, by design, model-based: photochemical damage is computed from cataloged real LED spectra using the CIE 157:2004 damage function rather than measured directly through in situ monitoring or accelerated aging trials on actual museum objects, so the absolute damage thresholds inherit whatever uncertainty applies to the underlying CIE 157:2004 standard itself. Appendix A derives, in closed form, how this input uncertainty propagates rather than resolving it and identifies which material classes’ DR rankings are most and least sensitive to any future revision of the CIE 157:2004 coefficients (Equation (A7)). This propagation result does not by itself narrow the uncertainty inherited from the external standard, as b is fixed by CIE 157:2004 rather than estimated from the compiled spectral database; it does, however, indicate which of the class-specific rankings reported in Section 3.5 would need to be revisited first if that standard were updated. A further caveat applies to the compiled database itself: the two constituent datasets (PNNL and EMPIR PhotoLED) were measured in different laboratories using different calibration chains, and although both are widely regarded as reliable, potential systematic offsets between the two sources cannot be excluded and could, in principle, introduce a small bias into the pooled LER and γB/Y distributions reported in Section 3.1. Model-based spectral damage assessment of this kind is nonetheless an established approach in conservation science, having previously been applied to derive spectral damage models for oil, acrylic, and gouache paintings [57]; consistent with the screening framework proposed here, DR should therefore be interpreted as a comparative relative benchmark for prioritizing candidate spectra rather than an absolute, certified prediction of measured fading rates for a specific object. A natural next step is to validate the DR ranking directly against microfading spectrometry, the established technique already used to test the reciprocity assumptions underlying CIE 157:2004 [12], applied to a representative subset of the highest- and lowest-ranked LED spectra identified here. In addition, the empirical fit models in Section 3.4 (Table 5, Table 6 and Table 7) are, for several materials, well-conditioned only in the 2700–3000 K and 4000–6500 K sub-ranges separately, reflecting the same data scarcity noted above for excellent-quality sources at higher CCTs; extending the compiled database with more cool-white, high-R9 products would allow these fits to be validated over the full CCT range. Finally, while the DR results in Section 3.5 quantify which spectra and CCTs are demonstrably safer than current halogen-based practice, translating this into a floor-plan-level energy consumption estimate for a specific museum still requires site-specific data on gallery areas, fixture counts, and operating hours and remains a natural extension of this work. As a worked example rather than a site-specific estimate, pairing a water color gallery held at 2700 K (mean LER ≈ 264 lm·W−1) with an adjoining rag paper gallery permitted at 6500 K (mean LER ≈ 287 lm·W−1, Table 1) cuts the radiant power input needed for equal light output in the latter by roughly 8% (1 − 264/287). Assuming comparable driver and luminaire efficiency between the two products—reasonable when comparing similar class commercial LED retrofits, though not guaranteed—this radiant input saving translates into a comparable reduction in electrical input without penalizing the sensitive gallery.
The 8% figure itself is illustrative, but the underlying building energy management argument does not depend on the precise number. From this standpoint, the savings a zoned retrofit can realistically deliver should be read as a lower bound rather than an upper estimate. Museum lighting circuits typically operate at near-constant output for most opening hours and are rarely dimmed for conservation reasons alone, so a reduction in LER-driven radiant power consumption of this kind translates, under the same driver and luminaire efficiency assumption, into a proportional reduction in the electricity drawn by the lighting circuit without any change to illuminance levels, visitor dwell times, or curatorial practice. Unlike envelope or HVAC retrofits, which typically require capital-intensive building interventions, these savings are realizable purely through source selection at the point where LED products are next specified or replaced using fixtures already compatible with the existing installation. The proposed DR-based screening procedure is therefore directly actionable for building energy managers and lighting engineers looking to reduce electricity consumption in existing cultural and public buildings. It functions primarily as a building energy efficiency retrofit tool, with the conservation constraint serving as a boundary condition that keeps optimization from simply converging on the highest-CCT, highest-LER product on the market. This building-level framing, however, does not extend to every dimension of retrofit safety.
It is also worth noting that DR addresses material damage risk specifically and does not substitute for photobiological safety assessment of LED products for human viewers, which is governed by a separate international standard [58]. Museum-specific illuminant design has also been explored outside of the CIE 157:2004 damage function framework used here. Martínez-Domingo et al., for example, developed a spectral image processing approach for evaluating artwork under standardized LED illuminants, a complementary rather than competing strategy to the screening approach adopted in this study [59]. An existing practitioner-facing tool, the Canadian Conservation Institute’s Light Damage Calculator (Version 2), addresses a related but distinct question: for a fixed test illuminant (a 3000 K, CRI Ra ≥ 95 LED) and a spectrophotometrically characterized material currently limited to a published dataset of early synthetic dyes on textiles, how much color change accumulates over a chosen exposure dose [60]. More recent work has pursued closely related spectral optimization approaches for conservation lighting: Kore and Durmus optimize source spectra for art conservation around basic color groups [61], and Kore, Brown, and Durmus optimize augmented reality projector output to jointly balance conservation risk, color quality, and energy consumption [62]. The framework proposed here instead operates upstream of that step, screening thousands of already available commercial LED spectra against each other and against current practice to narrow the field of candidate products by material class and CCT before any single product is chosen for dose-based exposure planning.
5. Conclusions
This study is, to our knowledge, the first to link LED energy efficiency and conservation risk through a single measurable spectral quantity, the blue-to-yellow ratio. We operationalize this quantity as a per-material, standards-based index and apply it at market scale to nearly 2850 commercial LED spectra, rather than a small illustrative set.
As emphasized in Section 4, DR < 1 identifies a lower photochemical hazard per unit of delivered light than the halogen baseline; it is a relative comparison, not a computed permissible exposure dose or time, which still requires the class-specific threshold dose Hs,dm (Section 2.5).
LER and γB/Y both increase with CCT, but γB/Y grows markedly faster above roughly 4000–5000 K, so the marginal efficacy gained there carries a growing conservation cost. Because the four artifact classes differ substantially in their damage coefficients, the maximum safely applicable LER is class-dependent: water colors on paper rag tolerate the narrowest, lowest-CCT window, while rag paper tolerates the widest. This supports the central premise of the paper: a single collection-wide LED spectrum is a poor compromise, and a zoned lighting strategy—matching each gallery’s spectrum to its own material sensitivity—can cut energy consumption in robust material spaces without raising risk in sensitive ones.
Applied to the compiled database, a source genuinely safer than the incumbent halogen benchmark is realistically available only among 2700 K products, including among those explicitly marketed to mimic natural sunlight (Section 4). From 3000 K upward, even efficient, color-accurate LEDs impose greater photochemical stress than current practice, confirming that CCT and CRI-based selection alone cannot guarantee a conservation-safe retrofit. The warmest sources should therefore be reserved for the most fragile collections—water colors and textiles—while cooler, more efficient sources remain appropriate only for robust materials such as oil paintings and rag paper.
Future work should extend the database with more cool-white, high-R9 products to close the data gap identified above 3000 K, validate the CIE 157:2004-derived thresholds against accelerated aging or in situ monitoring data—direct comparisons against measured paint stability outcomes under LED versus halogen exposure would be especially valuable [63]—and combine the DR screening demonstrated here with site-specific floor plan and fixture data to produce a quantified energy-saving estimate for a real zoned installation. The framework’s value lies not in engineering new LED spectra but in giving lighting engineers, conservators, and facility managers a repeatable, standards-based procedure for screening products already on the market for the best available balance of energy efficiency and conservation safety.
Author Contributions
Conceptualization, P.B. and I.F.; methodology, P.B.; software, P.B.; validation, P.B., M.L., C.D.G., and D.M.; formal analysis, P.B. and S.Z.; investigation, P.B. and M.L.; resources, I.F., M.L., S.Z., C.D.G., and D.M.; data curation, P.B., M.L., S.Z., C.D.G., D.M., and I.F.; writing—original draft preparation, I.F. and P.B.; writing—review and editing, I.F., M.L., S.Z., C.D.G., and D.M.; visualization, P.B., M.L., and S.Z.; supervision, I.F., C.D.G., and D.M.; project administration, I.F.; funding acquisition, I.F. All authors have read and agreed to the published version of the manuscript.
Funding
This research was carried out under project No. WZ/WE-IA/4/2026 at Bialystok University of Technology and financed from the research subsidy granted by the minister responsible for science of Poland.
Institutional Review Board Statement
Not applicable. This study did not involve humans or animals; it is based exclusively on publicly available spectral power distribution data for commercial LED products.
Informed Consent Statement
Not applicable.
Data Availability Statement
The data are available from the corresponding author upon reasonable request.
Conflicts of Interest
The authors declare no conflicts of interest.
Abbreviations
The following abbreviations are used in this manuscript:
| Abbreviation | Definition |
| LED | Light-Emitting Diode |
| pc-LED | Phosphor-Converted Light-Emitting Diode |
| CCT | Correlated Color Temperature |
| LER | Luminous Efficacy of Radiation |
| CIE | International Commission on Illumination (Commission Internationale de l’Éclairage) |
| SPD | Spectral Power Distribution |
| CRI Ra | Color Rendering Index |
| TM-30 | IES Method for Evaluating Light Source Color Rendition |
| ser | Relative photochemical damage factor per lumen (mW/lm) |
| DR | Relative Photochemical Damage Index |
| Duv | Chromaticity deviation from the blackbody locus |
| R9 | Special color rendering index for saturated red |
| Rf | TM-30 Fidelity Index |
| Rg | TM-30 Gamut Index |
| PNNL | Pacific Northwest National Laboratory |
| EMPIR | European Metrology Programme for Innovation and Research |
| ANSI | American National Standards Institute |
| IEC | International Electrotechnical Commission |
| IES | Illuminating Engineering Society |
| THCM | Tungsten Halogen Cold Mirror (reference lamp subscript) |
| Hs,dm | Threshold radiation (material-specific radiant-exposure limit, CIE 157:2004) |
| Rcs,h1 | TM-30 Local Chroma Shift Index (hue bin 1, red) |
Appendix A. Derivation of DR Structural Properties and Sensitivity to the Damage Coefficient b
This appendix gives the full derivations summarized in Section 2.6: that two material classes sharing the same damage coefficient b necessarily receive identical DR values (Equations (A1)–(A5)), and the closed-form sensitivity of DR to b (Equations (A6)–(A8)).
Section 2.5 already relied on a fact that is worth spelling out explicitly: whenever two material classes share the same damage coefficient b in the CIE 157:2004 model, they receive exactly the same DR score for any given LED spectrum, no matter how different the two materials’ overall tolerance to light exposure (Hs,dm) actually is. To see why, start again from the damage weighting curve defined in Equation (3):
As written, this curve depends on the material being studied only through the single parameter b—nothing else about the material, including its threshold radiation Hs,dm, enters this formula. So, if class A and class B are assigned the same b, their weighting curves are, by construction, identical at every wavelength across the visible range:
Now, recall how DR itself is defined in Equation (7). It is the ratio of two integrals—the candidate LED spectrum weighted by srel(λ) in the numerator and the fixed halogen reference spectrum weighted by the same curve in the denominator. Writing this out explicitly for each class X ∈ {A, B} using each class’s own damage weighting curve srel,X(λ) gives
Both the numerator and the denominator here depend on the material only through srel,X(λ). The underlying spectra PLED(λ) and PTHCM(λ) do not change from one material class to another; only the weighting curve does. Because Equation (A2) already established that the two classes share an identical weighting curve,
substituting this into Equation (A3) means the numerator and denominator integrals for class A and class B coincide term by term. The ratio—that is, DR itself—must therefore also be identical for the two classes for every candidate spectrum P(λ):
The threshold radiation Hs,dm never appears in Equation (3) or Equation (7), so it plays no role in this result. It enters only as a separate, independent description of a material’s absolute fragility (Section 2.5), and it remains free to differ between classes A and B without affecting DR at all.
This is exactly the situation for two of the four material classes examined in this study. Water colors on paper rag and oil colors on canvas are both assigned b = 0.0115 nm−1 (Section 2.5). Because they share this coefficient, Equations (A2)–(A5) show that their DR values are identical for every candidate LED spectrum, which is why the two classes are reported together in a single combined column in Table 8 and Table 9. The two materials nonetheless remain clearly distinct in their absolute fragility: water colors tolerate only Hs,dm = 175 Wh/m2 before visible damage occurs versus 850 Wh/m2 for oil colors, nearly a five-fold difference. In other words, DR alone cannot distinguish between these two materials, even though one can withstand almost five times more cumulative light exposure than the other before damage becomes visible; Hs,dm therefore remains the necessary, separate indicator of a material’s absolute fragility, a distinction returned to in Section 4.
A further property of DR follows directly from the ratio structure of Equation (7), independently of Proposition 1. Because the denominator PTHCM(λ) is fixed across every candidate spectrum, substituting a different reference source would rescale all DR values by the same multiplicative constant and therefore leave the relative ranking of LED candidates by DR unchanged; only the absolute DR = 1 cutoff, and hence the specific percentages reported in Section 3.5, would shift with the choice of reference. This invariance follows directly and exactly from the algebraic structure of Equation (7): because the halogen integral in the denominator is a single fixed number per material, independent of the candidate LED spectrum, it acts as a normalizing constant common to every ranking comparison rather than an empirically fitted parameter, so the rank preservation property is a mathematical consequence of the ratio definition and does not itself require separate empirical validation across alternative reference lamps. The filtered halogen lamp was retained here because it represents current, still widely deployed museum practice, making DR < 1 a direct like-for-like comparison against the incumbent solution rather than an arbitrary benchmark.
Section 2.5 treats b as an empirical input, so it is useful to know how sensitive DR is to it. Specifically, if the true value of b for a given material were slightly different from the one used here, how much would the resulting DR ranking shift? The standard way to quantify how a quantity responds to a small change in one of its inputs is its derivative with respect to that input; because DR depends on b only through srel, the first step is to differentiate srel with respect to b. Writing srel(λ;b) to make the b-dependence explicit, recall from Equation (3) that srel(λ;b) = exp[−b(λ − 300)]. Differentiating this exponential with respect to b based on the chain rule, the exponent −b(λ − 300) itself has derivative −(λ − 300) with respect to b, so this factor is carried down in front of the original exponential unchanged:
Equation (A6) indicates that a small change in b shifts the damage weighting curve by an amount that is largest at wavelengths far from the 300 nm reference point and smallest close to it; wavelengths near the blue end of the visible range, which sit furthest from 300 nm, are therefore the ones most affected when b is revised.
Because DR (Equation (7)) is itself a ratio of two integrals that each depend on b through srel, its derivative with respect to b follows from the quotient rule of elementary calculus, applied directly to Equation (7); substituting the identity from Equation (A6) for the derivative of srel inside of each integral and simplifying gives a closed-form sensitivity expression:
Equation (A7) expresses the sensitivity of DR to b as the product of DR itself and the difference between two damage-weighted mean wavelengths, one for the halogen reference lamp and one for the candidate LED, both defined below. Because this sensitivity follows directly from a quantity already computed, no additional spectral integrals are required, which makes the result practically useful for propagating uncertainty in b without repeating the full calculation for every candidate value.
Where
denotes the srel-weighted mean wavelength of spectrum X ∈ {LED, THCM}, i.e., the average emission wavelength after down-weighting longer wavelengths according to their reduced photochemical effectiveness. This result shows that the sign and magnitude of DR’s sensitivity to b depend only on the difference between the damage-weighted mean wavelengths of the candidate LED and of the halogen reference, not b itself except through the multiplicative factor DR. Because white LEDs typically place more radiant power at shorter wavelengths than the smooth, red-shifted continuum of a filtered tungsten halogen source, ⟨λ⟩LED is generally shorter than ⟨λ⟩THCM, so ∂DR/∂b > 0 is expected in practice. Materials with a larger b (i.e., more strongly blue-weighted damage sensitivity, such as rag paper) are the ones whose DR ranking is most sensitive to uncertainty in the CIE 157:2004 coefficient b, whereas the ranking for classes with smaller b (e.g., textile materials) is comparatively robust to this input uncertainty. This closed-form result also removes the need for finite-difference re-evaluation of DR under perturbed b when propagating the coefficient’s reported uncertainty from CIE 157:2004 into an uncertainty band on DR.
In short, the more strongly a material’s damage response leans toward blue light (larger b) and the more blue-rich the candidate LED is relative to the halogen reference, the more that material’s DR ranking would move if the CIE 157:2004 coefficients were later revised, which is exactly the kind of warning sign a conservation screening tool should be able to surface.
Appendix B. LED Spectral Database: Provenance, Filtering, and Representativeness
Appendix B.1. Input Databases and Their Metrological Credibility
The analysis draws on two independent, publicly available spectral power distribution (SPD) repositories of real, commercially available white-light sources (see also Section 2.1):
- PNNL—“Real Light Source SPDs and Color Data for Use in Research” (Pacific Northwest National Laboratory, USA)—1522 records across multiple lighting technologies, of which 1370 are tagged as LED technology and were retained for this study (Section 2.1). This dataset is widely used in the work of CIE technical committees and in photometric and colorimetric research on LED sources, supporting its methodological credibility within the scientific community.
- EMPIR PhotoLED SPECTRAL DATABASE (European Metrology Programme for Innovation and Research)—1494 LED spectra. Measurements were carried out in independent laboratories, including national metrology institutes, bodies subject to mutual recognition arrangements for measurement standards, with documented traceability to primary optical radiation standards.
Critically, neither repository consists of theoretical or simulated spectra: both report measured spectra of real commercial products from numerous manufacturers, spanning multiple LED technology generations. The two datasets were compiled independently by different research teams in different countries, which limits the risk of systematic bias from a single calibration chain or a single geographic market.
Appendix B.2. Merging the Databases and Initial Cleaning: Numerical Balance
After combining the two repositories (a combined maximum of 1370 + 1494 = 2864 records, following LED technology filtering of the PNNL repository as described in Section 2.1), the following were removed:
- Duplicate records—products measured and reported independently in both repositories (identification procedure described in Appendix B.3);
- Incomplete or erroneous records, including zero-valued or otherwise invalid spectra (exclusion criteria described in Appendix B.4).
This yields the combined total of nearly 2850 unique spectra reported in Section 2.1.
Appendix B.3. Duplicate Identification Procedure
A record was treated as a duplicate when it described the same commercial product, measured and reported independently in both the PNNL and the EMPIR PhotoLED repositories. Identification proceeded in two steps:
- Metadata matching. Records were compared on manufacturer/model designation and declared nominal CCT, where such metadata were available.
- Spectral verification via the Goodness-of-Fit Coefficient (GFC).
Spectral similarity was quantified using the Goodness-of-Fit Coefficient, a metric widely used to quantify similarity between spectral distributions, where Rm and Re denote the two spectra being compared. Before computing the GFC, both spectra under comparison were resampled onto the common Δλ = 1 nm grid (Appendix B.5). A record pair was treated as a duplicate of the same commercial product when GFC ≥ 0.9999, indicating near-perfect agreement. This threshold was chosen to reject only records that were practically indistinguishable in spectral shape (corresponding to the same product measured and reported independently in both repositories) while retaining in the database distinct products with similar but not identical spectral shapes, thereby avoiding the false rejection of genuinely different commercial products from the same manufacturer. Where a duplicate was confirmed, one record was retained in the final database and the other was excluded from further analysis.
Appendix B.4. Exclusion Criteria for Incomplete or Erroneous Spectra
A record was excluded from further analysis if it met at least one of the following criteria:
- Zero or constant spectrum—no value of P(λ) greater than zero across the full 380–780 nm range, or a constant value suggesting a data export error;
- Incomplete spectral range—data covering a range narrower than 380–780 nm, preventing reliable integration under Equations (1), (2), (6) and (7) across the full 380–780 nm range;
- Missing colorimetric metadata required for classification—inability to unambiguously assign a nominal CCT under the seven-step ANSI C78.377-2017 quadrangles [42] (Section 2.2, Figure 3b and Figure 4b).
Appendix B.5. Spectral Interpolation and Resampling
The two source repositories report spectral power distributions at native sampling intervals that can differ between repositories (Section 2.1). Because every calculation in this manuscript and the GFC-based duplicate identification procedure above are carried out on a uniform Δλ = 1 nm spectral grid, every source spectrum was resampled onto this grid through cubic spline interpolation between successive measured points, which preserves the continuity of the interpolated function together with its first and second derivatives at the grid nodes.
Cubic spline interpolation was preferred over simpler piecewise linear interpolation for this application for the following reasons:
- Physical smoothness of LED spectra and fidelity of peak shape. LED radiant power distributions are smooth functions with continuous first and second derivatives, including across the narrow, steep blue-LED emission peak (typically 440–460 nm) and the broader, more slowly varying phosphor band (550–650 nm). Cubic spline interpolation preserves continuity of the first and second derivatives at the interpolation nodes, reproducing the curvature of the blue peak more faithfully than a piecewise linear approximation, particularly where one source repository’s native sampling is coarser than the target Δλ = 1 nm grid.
- Consistency with the weighting functions used downstream. V(λ) (Equation (1)) and srel(λ) (Equation (3)) are themselves smooth functions; spline interpolation preserves an analogous smoothness in the interpolated P(λ), avoiding artificial slope discontinuities at measurement grid nodes that piecewise linear interpolation would introduce.
- Interpolation quality control. All interpolated spectra were visually checked against the original measured points to rule out unrealistic overshoot.
Following interpolation, all subsequent spectral integrals (Equations (1), (2), (6) and (7)) were evaluated using the trapezoidal rule on the uniform Δλ = 1 nm grid, as described in Section 2.6; spline interpolation was used only to prepare the input data on this grid, not for integration itself. Records whose native measurement range did not cover the full 380–780 nm interval were subject to the exclusion criterion in Appendix B.4; spline interpolation was not used to extrapolate beyond a record’s measured range.
Appendix B.6. Harmonization of Absolute and Relative Spectral Power Distributions
Regardless of source repository, every spectrum was rescaled to a common reference luminous flux before further analysis and visualization, following the constant flux normalization already defined in Section 2.6 (Equation (7) and the paragraph immediately following it). This rescaling makes every spectrum’s implied luminous flux identical, whether the source spectrum was originally reported on an absolute or a relative scale, so that comparisons between spectra reflect spectral shape alone.
Appendix B.7. Preliminary Filtering for Museum Applications
From the final database (Appendix B.2), the subset corresponding to the five nominal Correlated Color Temperatures (CCT) typically used in museum and gallery lighting (2700 K, 3000 K, 4000 K, 5000 K, 6500 K) was extracted, applying the general purpose color rendition criterion CRI Ra ≥ 80 conventionally used for interior lighting. Sample sizes in each CCT bin are given in Table A1.
Table A1.
Number of LED spectra meeting the CRI Ra ≥ 80 criterion within the five nominal CCTs used in museum lighting (input subset, prior to applying the Technical Bulletin 36 recommendations).
Even under this general, non-restrictive CRI Ra ≥ 80 criterion alone, a clear market asymmetry is already visible: fully 94.9% of available products with good color rendition are concentrated in the warm-to-neutral-white range (2700–4000 K), while cooler CCTs (5000 K, 6500 K) together account for only 53 spectra (5.1% of the subset). This is an early signal of the pattern developed further below: the market for high-color-rendition LEDs is not evenly distributed across CCT.
Appendix B.8. Filtering Using Technical Bulletin 36 Conservation Criteria
The 1040-spectrum subset was then filtered using the museum-lighting-specific criteria defined in “LED Lighting in Museums and Art Galleries—Technical Bulletin 36” [28], which jointly consider CRI Ra, the R9 parameter (rendition of saturated red), and the chromaticity deviation Duv from the Planckian locus:
- Good-quality light: CRI Ra ≥ 90, R9 ≥ 50, Duv ∈ [−0.003, +0.003];
- Excellent-quality light: CRI Ra ≥ 90, R9 ≥ 90, Duv ∈ [−0.003, +0.003].
Results of this filtering are given in Table A2, together with the share of products “surviving” each successively stricter selection threshold.
Table A2.
Number of LED spectra meeting the good-quality and excellent-quality criteria (Technical Bulletin 36) by nominal CCT relative to the input subset (CRI Ra ≥ 80).
Appendix B.9. Interpretation: From Thousands of Products to a Few Dozen Meeting the Conservation Standard
Table A1 and Table A2 together trace the full selection pathway from the full market-representative database to the final set used in the DR analysis: nearly 2850 spectra (full compiled database) → 1040 spectra meeting only the general, non-restrictive CRI Ra ≥ 80 criterion within the five CCTs relevant to museum lighting (36.5% of the database) → 124 spectra meeting the good-quality criterion under Technical Bulletin 36 (11.9% of the input subset, 4.3% of the full database) → 30 spectra meeting the stricter excellent-quality criterion (24.2% of the good-quality set, i.e., only roughly one in four “good-quality” products also meet the R9 ≥ 90 conservation threshold, just 2.9% of the input subset and 1.1% of the fully compiled market database).
This result carries interpretive weight beyond descriptive statistics alone:
- The input database is representative of the market, not selected to support the paper’s thesis. It comprises nearly 2850 measured spectra from numerous manufacturers, drawn from two independent, metrologically credible sources (national metrology institutes, PNNL), which rules out the objection that the sample was chosen to produce a predetermined result.
- The rigor of the conservation criteria is not a formality—it genuinely eliminates the large majority of the market. Even with this large input database, only 30 out of 2850 candidate products meet the excellent-quality threshold. This is not a methodological artifact but a reflection of the actual structure of the LED market’s product offering.
- The effect deepens with increasing CCT. At 2700 K and 3000 K, the share of products advancing from good- to excellent-quality is 36.1% and 21.7%, respectively; at 4000 K, this falls to 16.7% (corresponding to just two products in the entire nearly 2850-spectrum market database), and at 5000 K and 6500 K it is 0%, even though good-quality products do exist in these CCT bins (four and three spectra, respectively). This absence therefore reflects a structural feature of the phosphor conversion market (the broad red-emission band needed for R9 ≥ 90 is technologically harder to combine with a cool-white base emission—see Section 2.2) rather than a gap in data collection.
Because of the small cell counts in some categories (N ≤ 4 for 5000 K/6500 K at the good-quality level and N = 0 for excellent-quality above 4000 K), these results should be read, consistent with the approach adopted in Section 3.5, as indicating the direction and scale of a market phenomenon rather than a precise population estimate; nonetheless, the fact of zero counts in two independent CCT bins, given such a large input database, is itself a sufficiently strong basis for concluding that there is a genuine shortage of such products on the market.
References
- Tsao, J.Y.; Saunders, H.D.; Creighton, J.R.; Coltrin, M.E.; Simmons, J.A. Solid-state lighting: An energy-economics perspective. J. Phys. Appl. Phys. 2010, 43, 354001. [Google Scholar] [CrossRef] [Scilit]
- Krames, M.R.; Shchekin, O.B.; Mueller-Mach, R.; Mueller, G.O.; Zhou, L.; Harbers, G.; Craford, M.G. Status and Future of High-Power Light-Emitting Diodes for Solid-State Lighting. J. Disp. Technol. 2007, 3, 160–175. [Google Scholar] [CrossRef] [Scilit]
- Haitz, R.; Tsao, J.Y. Solid-state lighting: ‘The case’ 10 years after and future prospects. Phys. Status Solidi A 2011, 208, 17–29. [Google Scholar] [CrossRef] [Scilit]
- Narukawa, Y.; Ichikawa, M.; Sanga, D.; Sano, M.; Mukai, T. White light emitting diodes with super-high luminous efficacy. J. Phys. Appl. Phys. 2010, 43, 354002. [Google Scholar] [CrossRef] [Scilit]
- Cuttle, C. Light for Art’s Sake: Lighting for Artworks and Museum Displays; Routledge: New York, NY, USA, 2007. [Google Scholar]
- Ohno, Y. Spectral design considerations for white LED color rendering. Opt. Eng. 2005, 44, 111302. [Google Scholar] [CrossRef] [Scilit]
- Schubert, E.F. Light-Emitting Diodes, 2nd ed.; Cambridge University Press: Cambridge, UK, 2006. [Google Scholar]
- Royer, M. Evaluating tradeoffs between energy efficiency and color rendition. OSA Contin. 2019, 2, 2308. [Google Scholar] [CrossRef] [Scilit]
- Feller, R.L. Control of deteriorating effects of light upon museum objects*. Mus. Int. 1964, 17, 57–98. [Google Scholar] [CrossRef] [Scilit]
- Saunders, D.; Kirby, J. Wavelength-dependent fading of artists’ pigments. Stud. Conserv. 1994, 39, 190–194. [Google Scholar] [CrossRef] [Scilit]
- Feller, R.L. Accelerated Aging: Photochemical and Thermal Aspects; Research in conservation; Getty Conservation Institute: Marina del Rey, CA, USA, 1994. [Google Scholar]
- Del Hoyo-Meĺendez, J.M.; Mecklenburg, M.F. An Investigation of the Reciprocity Principle of Light Exposures Using Microfading Spectrometry. Spectrosc. Lett. 2011, 44, 52–62. [Google Scholar] [CrossRef] [Scilit]
- International Commission on Illumination. CIE 157 ”Control of Damage to Museum Objects by Optical Radiation: Technical Report”; CIE: Vienna, Austria, 2004. [Google Scholar]
- Aydinli, S.; Hilbert, G.S.; Krochmann, J. Über die Gefährdung von Ausstellungsgegenständen durch optische Strahlung. Licht-Forsch. 1983, 5, 35–47. [Google Scholar]
- Illuminating Engineering Society. IES TM 30 “Method for Evaluating Light Source Color Rendition”; Illuminating Engineering Society: New York, NY, USA, 2020. [Google Scholar]
- Delgado, M.F.; Dirk, C.W.; Druzik, J.; WestFall, N. Lighting the world’s treasures: Approaches to safer museum lighting. Color Res. Appl. 2011, 36, 238–254. [Google Scholar] [CrossRef] [Scilit]
- Padfield, J.; Aston, S.; Kergourlay, F.; Luo, M.R.; Hurlbert, A.C. Optimisation of Artwork Illumination Spectra By Museum Professionals; International Commission on Illumination (CIE): London, UK, 2016; pp. 17–21. [Google Scholar]
- Garside, D.; Curran, K.; Korenberg, C.; MacDonald, L.; Teunissen, K.; Robson, S. How is museum lighting selected? An insight into current practice in UK museums. J. Inst. Conserv. 2017, 40, 3–14. [Google Scholar] [CrossRef] [Scilit]
- Druzik, J.; Perrin, T.; Miller, N.J. SSL Adoption by Museums: Survey Results, Analysis, and Recommendations; Energy Efficiency and Renewable Energy, U.S. Department of Energy: Washington, DC, USA, 2014. [Google Scholar] [CrossRef]
- Viénot, F.; Coron, G.; Lavédrine, B. LEDs as a tool to enhance faded colours of museums artefacts. J. Cult. Herit. 2011, 12, 431–440. [Google Scholar] [CrossRef] [Scilit]
- Durmus, D.; Abdalla, D.; Duis, A.; Davis, W. Spectral Optimization to Minimize Light Absorbed by Artwork. LEUKOS 2020, 16, 45–54. [Google Scholar] [CrossRef] [Scilit]
- Fryc, I.; Listowski, M.; Supronowicz, R.; Martinsons, C. Selecting Energy-Efficient LED Retrofits with Optimal Color Qualities for New and Refurbished Buildings. Energies 2024, 18, 112. [Google Scholar] [CrossRef] [Scilit]
- Fryc, I.; Listowski, M.; Martinsons, C. Color Quality Versus Energy Efficiency: A Dual Perspective on LED Retrofits in Healthcare Examination Rooms. Appl. Sci. 2025, 15, 756. [Google Scholar] [CrossRef] [Scilit]
- Fryc, I.; Listowski, M.; Supronowicz, R.; Fan, J.; Bałdyga, P.; Gajewski, B.; Krupiński, R. Spectral Assessment of LED Heritage Lighting: Visual Quality and Photobiological Impacts Beyond CCT Specifications in Protected Areas. LEUKOS 2026, 1–19. [Google Scholar] [CrossRef] [Scilit]
- Esposito, T.; Houser, K. Models of colour quality over a wide range of spectral power distributions. Light. Res. Technol. 2019, 51, 331–352. [Google Scholar] [CrossRef] [Scilit]
- Royer, M. Real Light Source SPDs and Color Data for Use in Research. Figshare. Dataset. Doi 2023, 10, m9. [Google Scholar] [CrossRef]
- Jost, S.; Thorseth, A.; Poikonen, T.; Blattner, P.; Gerloff, T.; Kokka, A.; Dekker, P.; Smid, M.; Ferrero, A.; Kubarsepp, T.; et al. EMPIR 15SIB07 PhotoLED—Database of LED Product Spectra; Technical University of Denmark: Lundtofte, Denmark, 2021; p. 9353466. [Google Scholar] [CrossRef]
- Michalski, S.; Druzik, J. LED Lighting in Museums and Art Galleries—Technical Bulletin 36; Canadian Conservation Institute: Ottawa, ON, Canada, 2020. [Google Scholar]
- CIE 13.3-1995; Method of Measuring and Specifying Colour Rendering Properties of Light Sources. International Commission on Illumination: Vienna, Austria, 1995.
- Judd, D.B. A Flattery Index for Artificial Illuminants. Illum. Eng. 1967, 62, 593–598. [Google Scholar]
- Thornton, W.A. Color-discrimination index. J. Opt. Soc. Am. 1972, 62, 191–194. [Google Scholar] [CrossRef] [Scilit] [PubMed]
- Davis, W.; Ohno, Y. Color quality scale. Opt. Eng. 2010, 49, 033602. [Google Scholar] [CrossRef] [Scilit]
- Rea, M.S.; Freyssinier-Nova, J.P. Color rendering: A tale of two metrics. Color Res. Appl. 2008, 33, 192–202. [Google Scholar] [CrossRef] [Scilit]
- Fryc, I.; Dimitrova-Grekow, T. An automated system for evaluation of the quality of light sources. In Proceedings of the 2016 IEEE Lighting Conference of the Visegrad Countries (Lumen V4); IEEE: Karpacz, Poland, 2016; pp. 1–4. [Google Scholar] [CrossRef] [Scilit]
- ANSI/IES RP-30-17; Recommended Practice for Museum Lighting. Illuminating Engineering Society: New York, NY, USA, 2017.
- Saunders, D. Museum Lighting: A Guide for Conservators and Curators; Getty Conservation Institute/J. Paul Getty Museum: Los Angeles, CA, USA, 2020. [Google Scholar]
- CIE. TC 1-85 CIE 015:2018: Colorimetry, 4th ed.; International Commission on Illumination: Vienna, Austria, 2018. [Google Scholar] [CrossRef] [Scilit]
- CIE (International Commission on Illumination). CIE S 017/E:2020 ILV: International Lighting Vocabulary, 2nd ed.; International Commission on Illumination: Vienna, Austria, 2020. [Google Scholar] [CrossRef] [Scilit]
- Ohno, Y. Practical Use and Calculation of CCT and Duv. LEUKOS 2014, 10, 47–55. [Google Scholar] [CrossRef] [Scilit]
- Wyszecki, G.; Stiles, W.S. Color Science: Concepts and Methods, Quantitative Data and Formulae, 2nd ed.; Wiley: New York, NY, USA, 1982. [Google Scholar]
- Druzik, J.; Miller, N.J. Demonstration Assessment of Light-Emitting Diodes (LED) Retrofit Lamps: Host Site, J. Paul Getty Museum, Malibu, California; U.S. Department of Energy by Pacific Northwest National Laboratory: Richland, WA, USA, 2012. [Google Scholar] [CrossRef]
- ANSI C78.377-2017; American National Standard for Electric Lamps—Specifications for the Chromaticity of Solid-State Lighting (SSL) Products. American National Standards Institute: Washington, DC, USA, 2017.
- Royer, M.P. Tutorial: Background and Guidance for Using the ANSI/IES TM-30 Method for Evaluating Light Source Color Rendition. LEUKOS 2022, 18, 191–231. [Google Scholar] [CrossRef] [Scilit]
- CIE 224:2017; CIE 2017 Colour Fidelity Index for Accurate Scientific Use. International Commission on Illumination: Vienna, Austria, 2017.
- CIE (International Commission on Illumination). CIE 135/2-1999 Colour Rendering. TC1-33 Closing Remarks; International Commission on Illumination: Vienna, Austria, 1999. [Google Scholar]
- Royer, M.; Wilkerson, A.; Wei, M. Human perceptions of colour rendition at different chromaticities. Light. Res. Technol. 2018, 50, 965–994. [Google Scholar] [CrossRef] [Scilit]
- Royer, M.; Wilkerson, A.; Wei, M.; Houser, K.; Davis, R. Human perceptions of colour rendition vary with average fidelity, average gamut, and gamut shape. Light. Res. Technol. 2017, 49, 966–991. [Google Scholar] [CrossRef] [Scilit]
- Jost, S.; Cauwerts, C.; Avouac, P. CIE 2017 color fidelity index Rf: A better index to predict perceived color difference? J. Opt. Soc. Am. A 2018, 35, B202. [Google Scholar] [CrossRef] [Scilit] [PubMed]
- Gu, H.; Luo, M.; Liu, X. Testing different colour rendering metrics using colour difference data. Light. Res. Technol. 2017, 49, 539–560. [Google Scholar] [CrossRef] [Scilit]
- Zhang, F.; Xu, H.; Feng, H. Toward a unified model for predicting color quality of light sources. Appl. Opt. 2017, 56, 8186. [Google Scholar] [CrossRef] [Scilit] [PubMed]
- Teunissen, C.; Van Der Heijden, F.; Poort, S.; De Beer, E. Characterising user preference for white LED light sources with CIE colour rendering index combined with a relative gamut area index. Light. Res. Technol. 2017, 49, 461–480. [Google Scholar] [CrossRef] [Scilit]
- Jakubowski, P. Artificial light sources as light pollutant of humans melatonin suppression. Photonics Lett. Pol. 2019, 11, 78. [Google Scholar] [CrossRef] [Scilit]
- Mundinger, J.; Houser, K. Fine art under low illuminance: Gamut and tint. Light. Res. Technol. 2024, 56, 570–592. [Google Scholar] [CrossRef] [Scilit]
- Lin, C.-W.; Jost-Boissard, S.; Meuret, Y.; Smet, K.A.G. Quantitative and Qualitative Evaluation of IES TM-30 Indices for the Color Preference of Landscape Oil Paintings. LEUKOS 2026, 22, 461–484. [Google Scholar] [CrossRef] [Scilit]
- Feltrin, F.; Leccese, F.; Hanselaer, P.; Smet, K.A.G. Impact of Illumination Correlated Color Temperature, Background Lightness, and Painting Color Content on Color Appearance and Appreciation of Paintings. LEUKOS 2020, 16, 25–44. [Google Scholar] [CrossRef] [Scilit]
- Hurlbert, A.; Cuttle, C. New Museum Lighting for People and Paintings. LEUKOS 2020, 16, 1–5. [Google Scholar] [CrossRef] [Scilit]
- Mayorga Pinilla, S.; Vázquez, D.; Álvarez Fernández-Balbuena, A.; Muro, C.; Muñoz, J. Spectral damage model for lighted museum paintings: Oil, acrylic and gouache. J. Cult. Herit. 2016, 22, 931–939. [Google Scholar] [CrossRef] [Scilit]
- IEC 62471:2006; Photobiological Safety of Lamps and Lamp Systems. International Electrotechnical Commission: Geneva, Switzerland, 2006.
- Martínez-Domingo, M.Á.; Melgosa, M.; Okajima, K.; Medina, V.J.; Collado-Montero, F.J. Spectral Image Processing for Museum Lighting Using CIE LED Illuminants. Sensors 2019, 19, 5400. [Google Scholar] [CrossRef] [Scilit] [PubMed]
- Hagan, E. CCI Light Damage Calculator 2—Multipoint Source Data. 2023. Available online: https://herie.pl/Home/ManualLightDamageCalculator2 (accessed on 20 July 2026).
- Kore, R.; Durmus, D. Optimizing Light Source Spectra for Art Conservation: Exploring Basic Color Groups. LEUKOS 2025, 21, 257–269. [Google Scholar] [CrossRef] [Scilit]
- Kore, R.; Brown, N.; Durmus, D. Optimising augmented reality projector light output to balance art conservation, colour quality and energy consumption. Light. Res. Technol. 2024, 56, 421–438. [Google Scholar] [CrossRef] [Scilit]
- Richardson, E.; Woolley, E.; Yurchenko, A.; Thickett, D. Assessing the Impact of LED Lighting on the Stability of Selected Yellow Paint Formulations. LEUKOS 2020, 16, 67–85. [Google Scholar] [CrossRef] [Scilit]
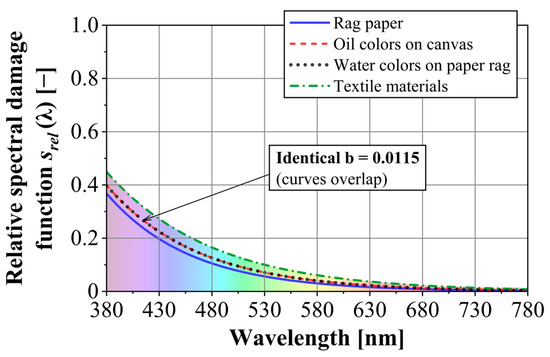
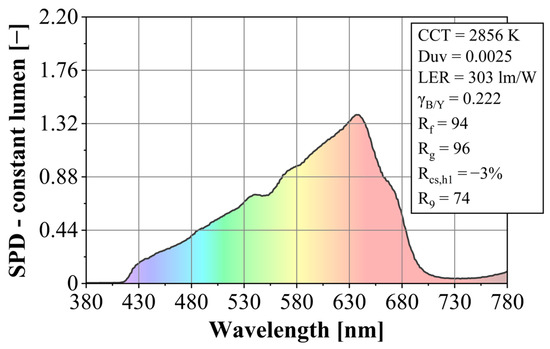
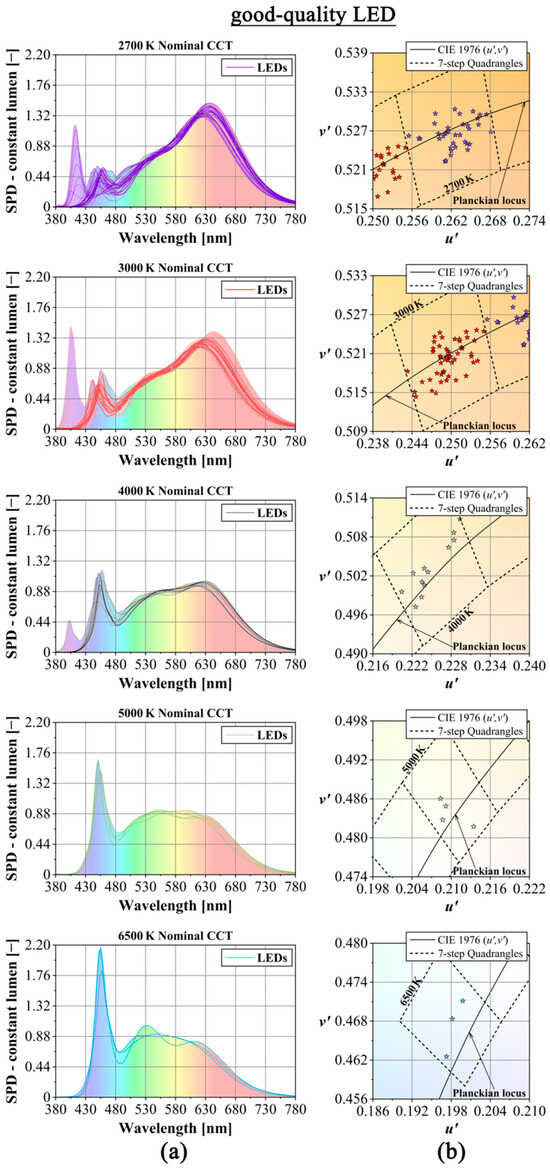
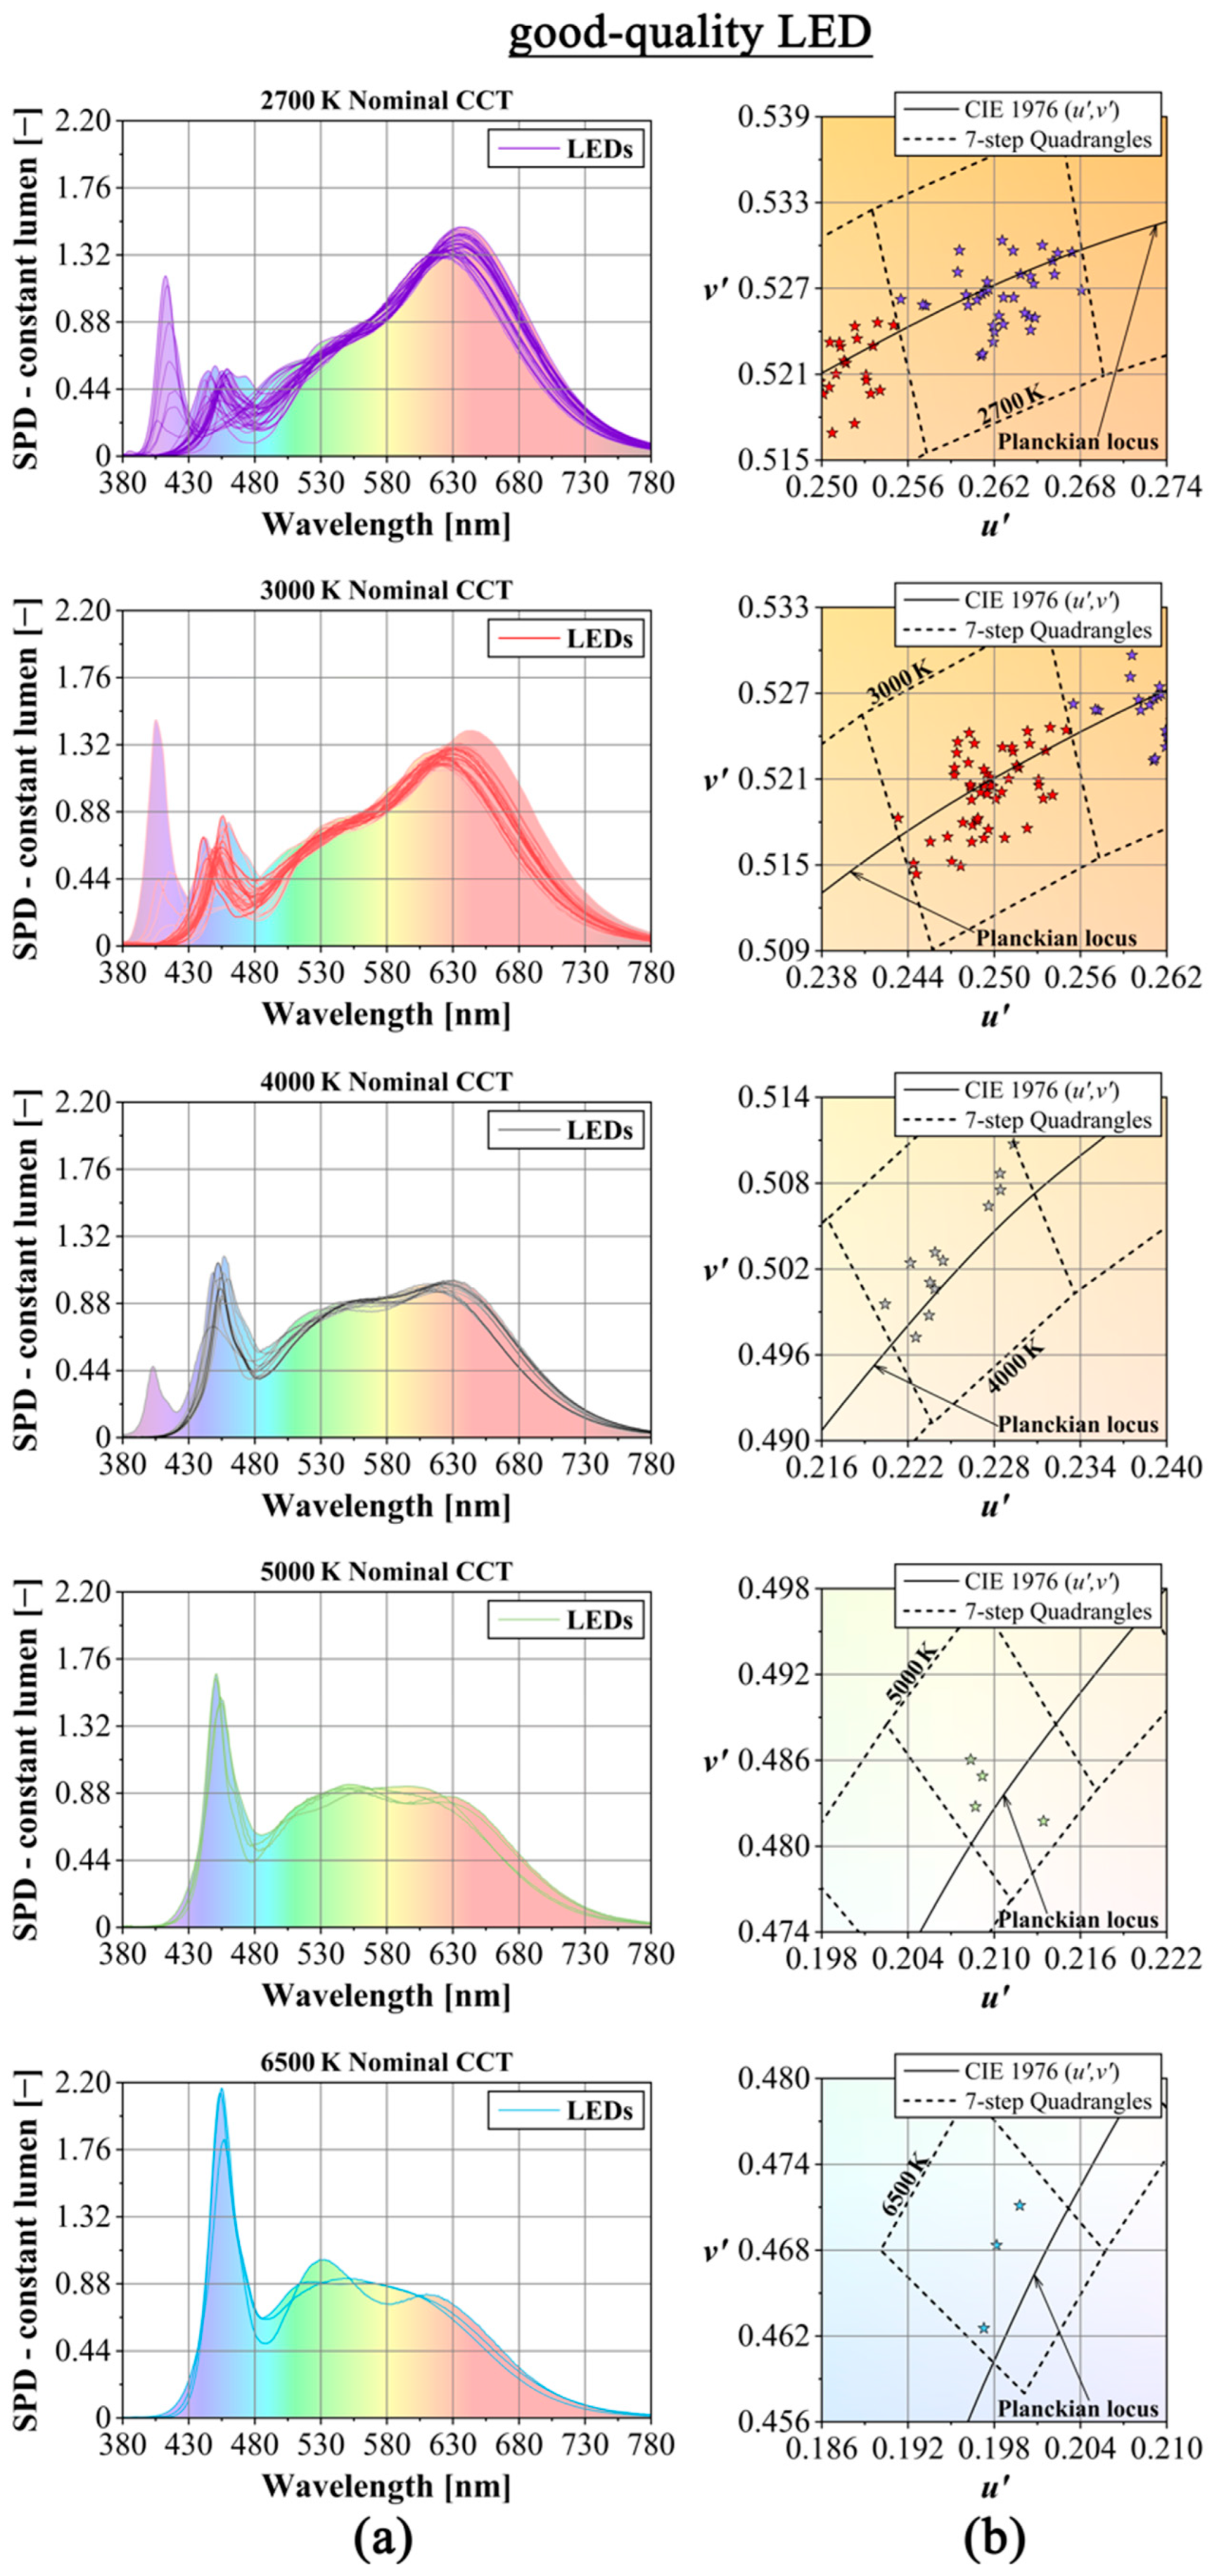
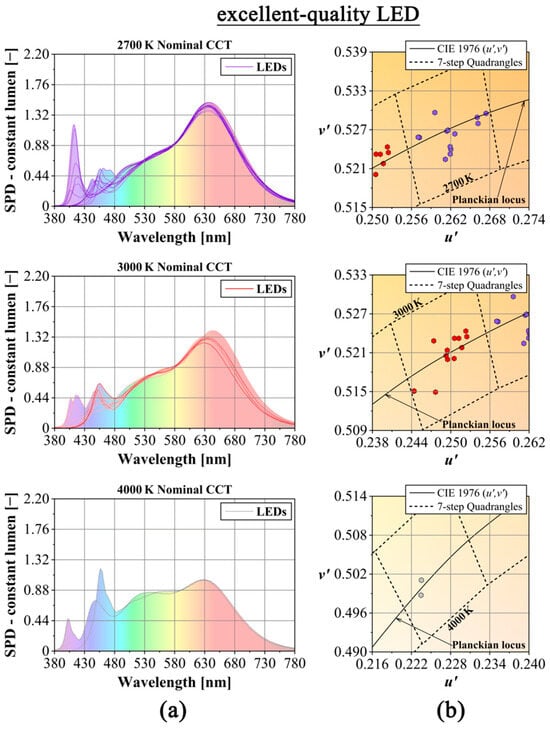
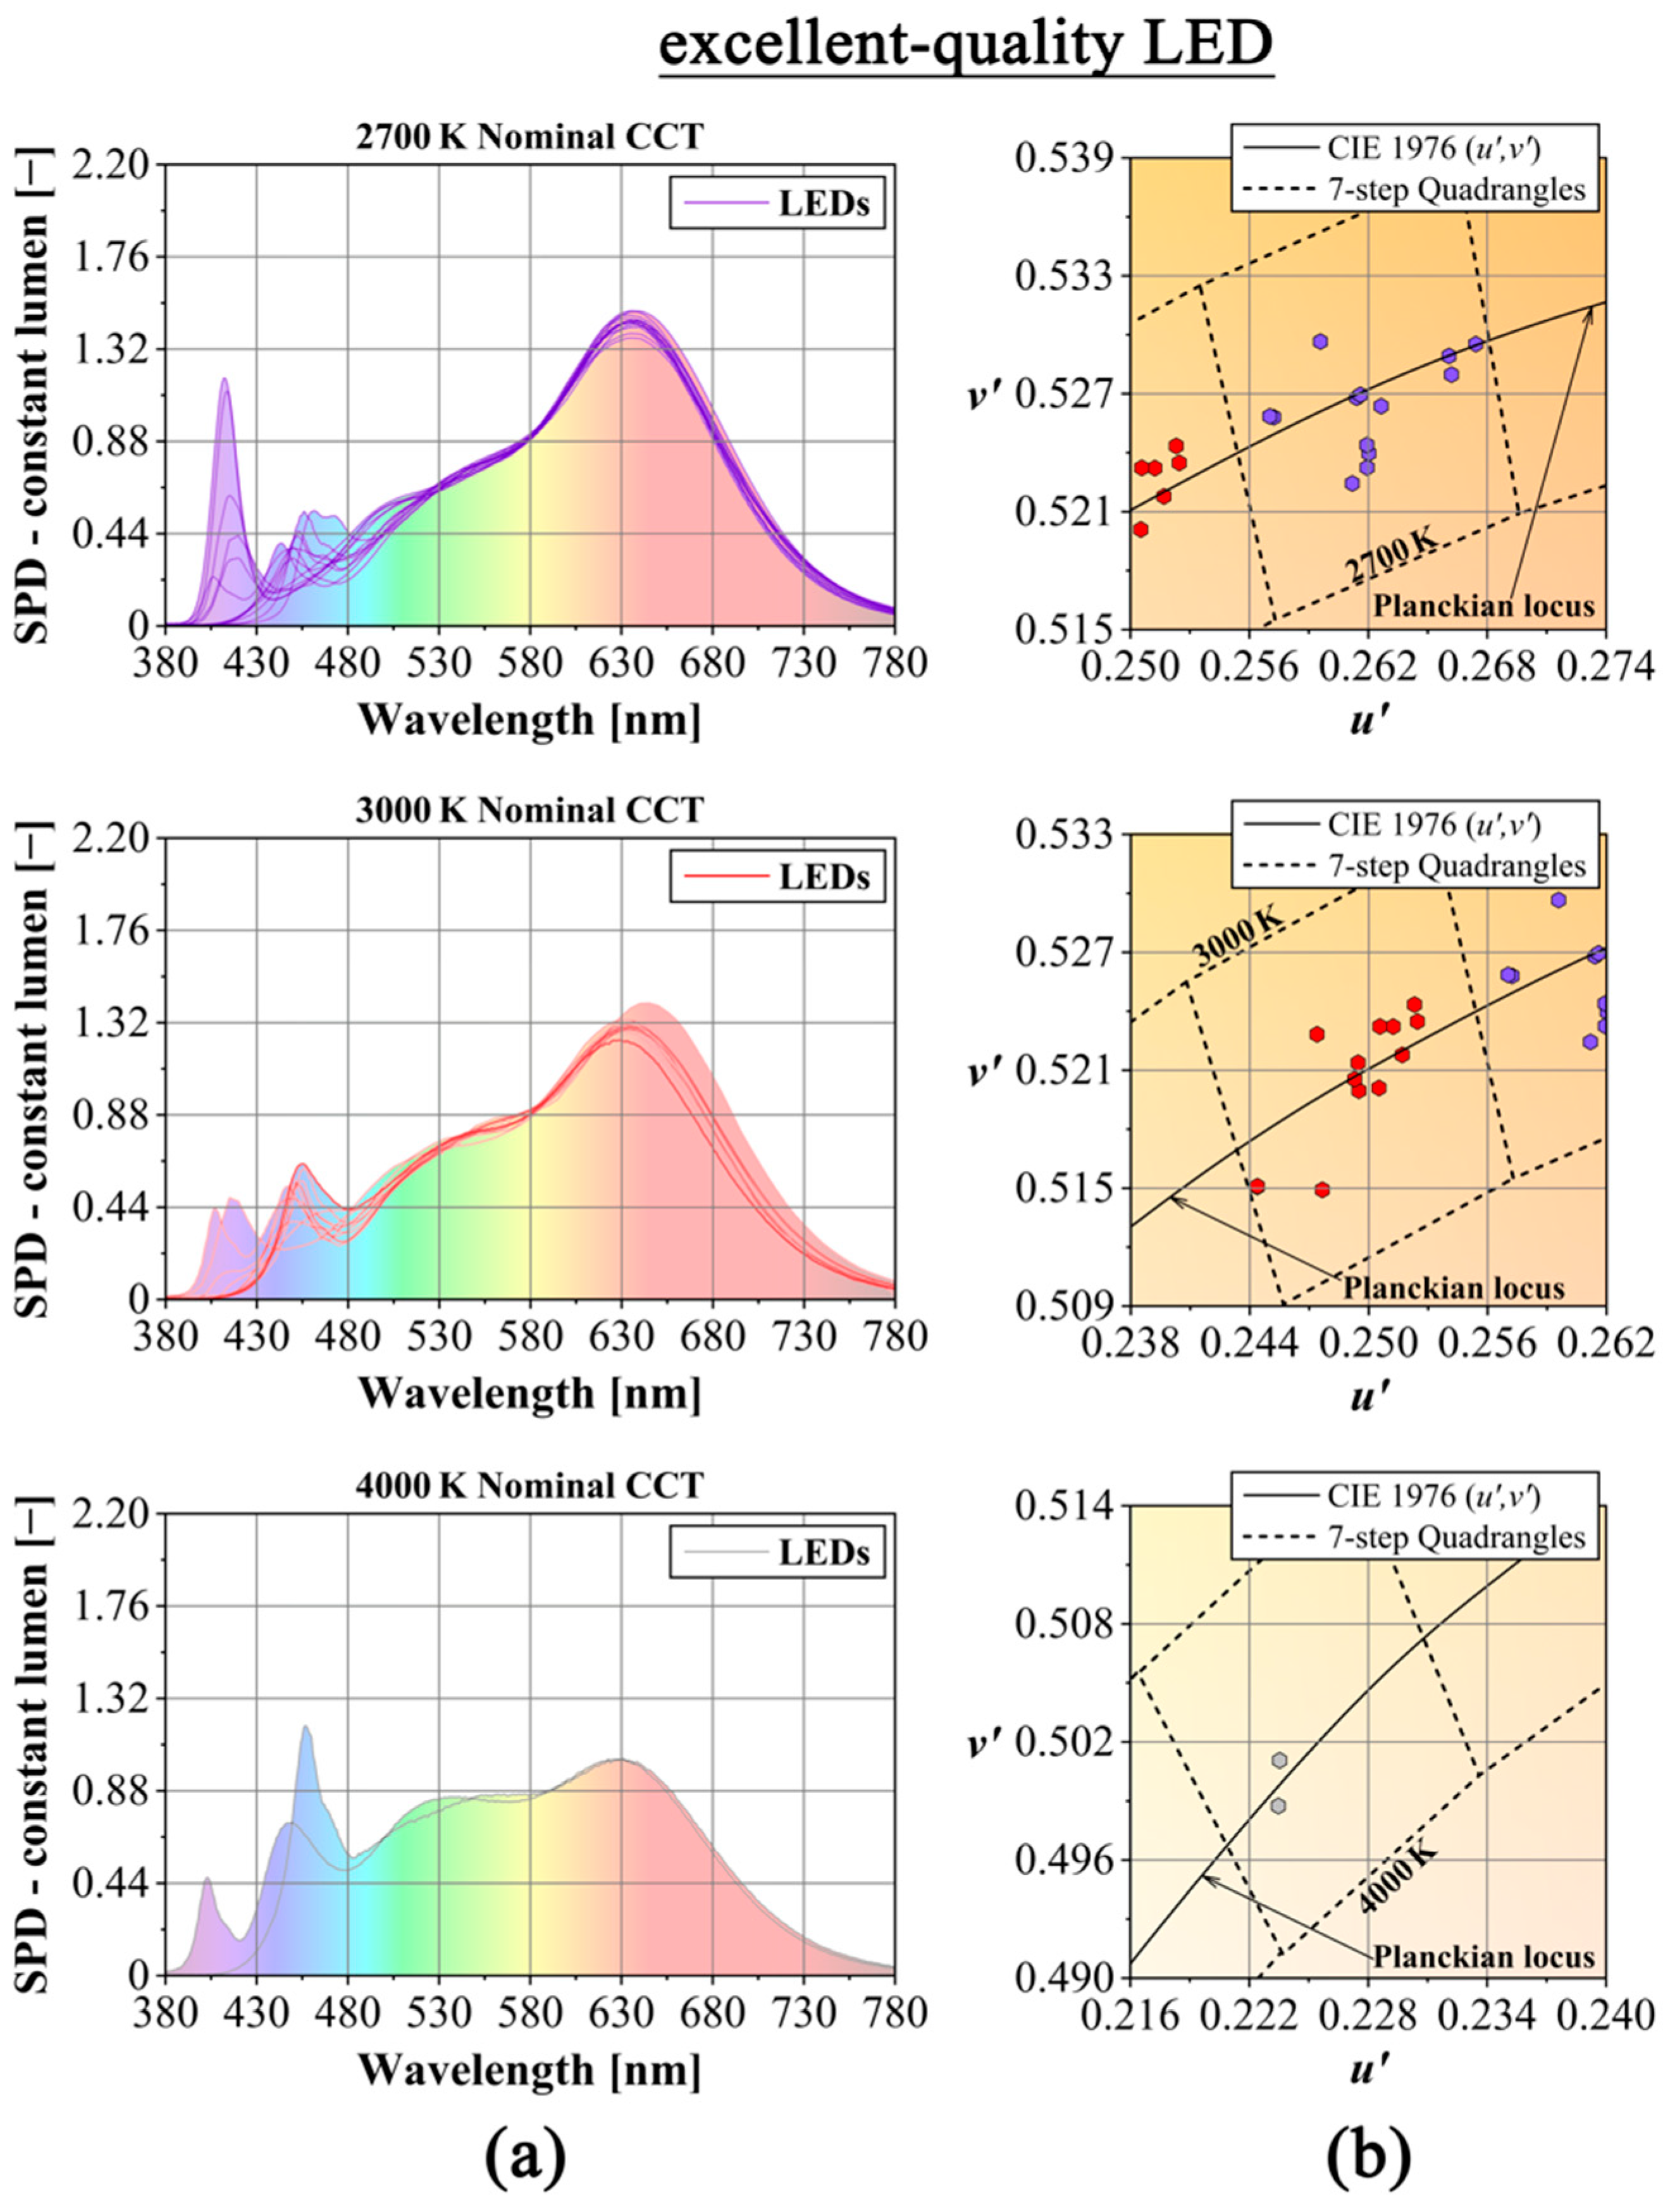
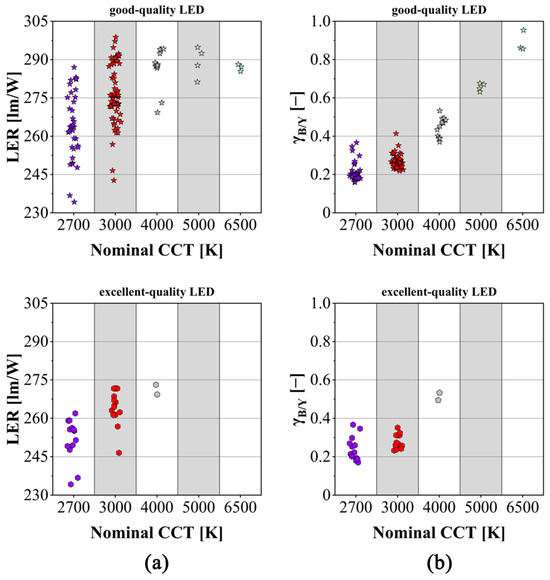
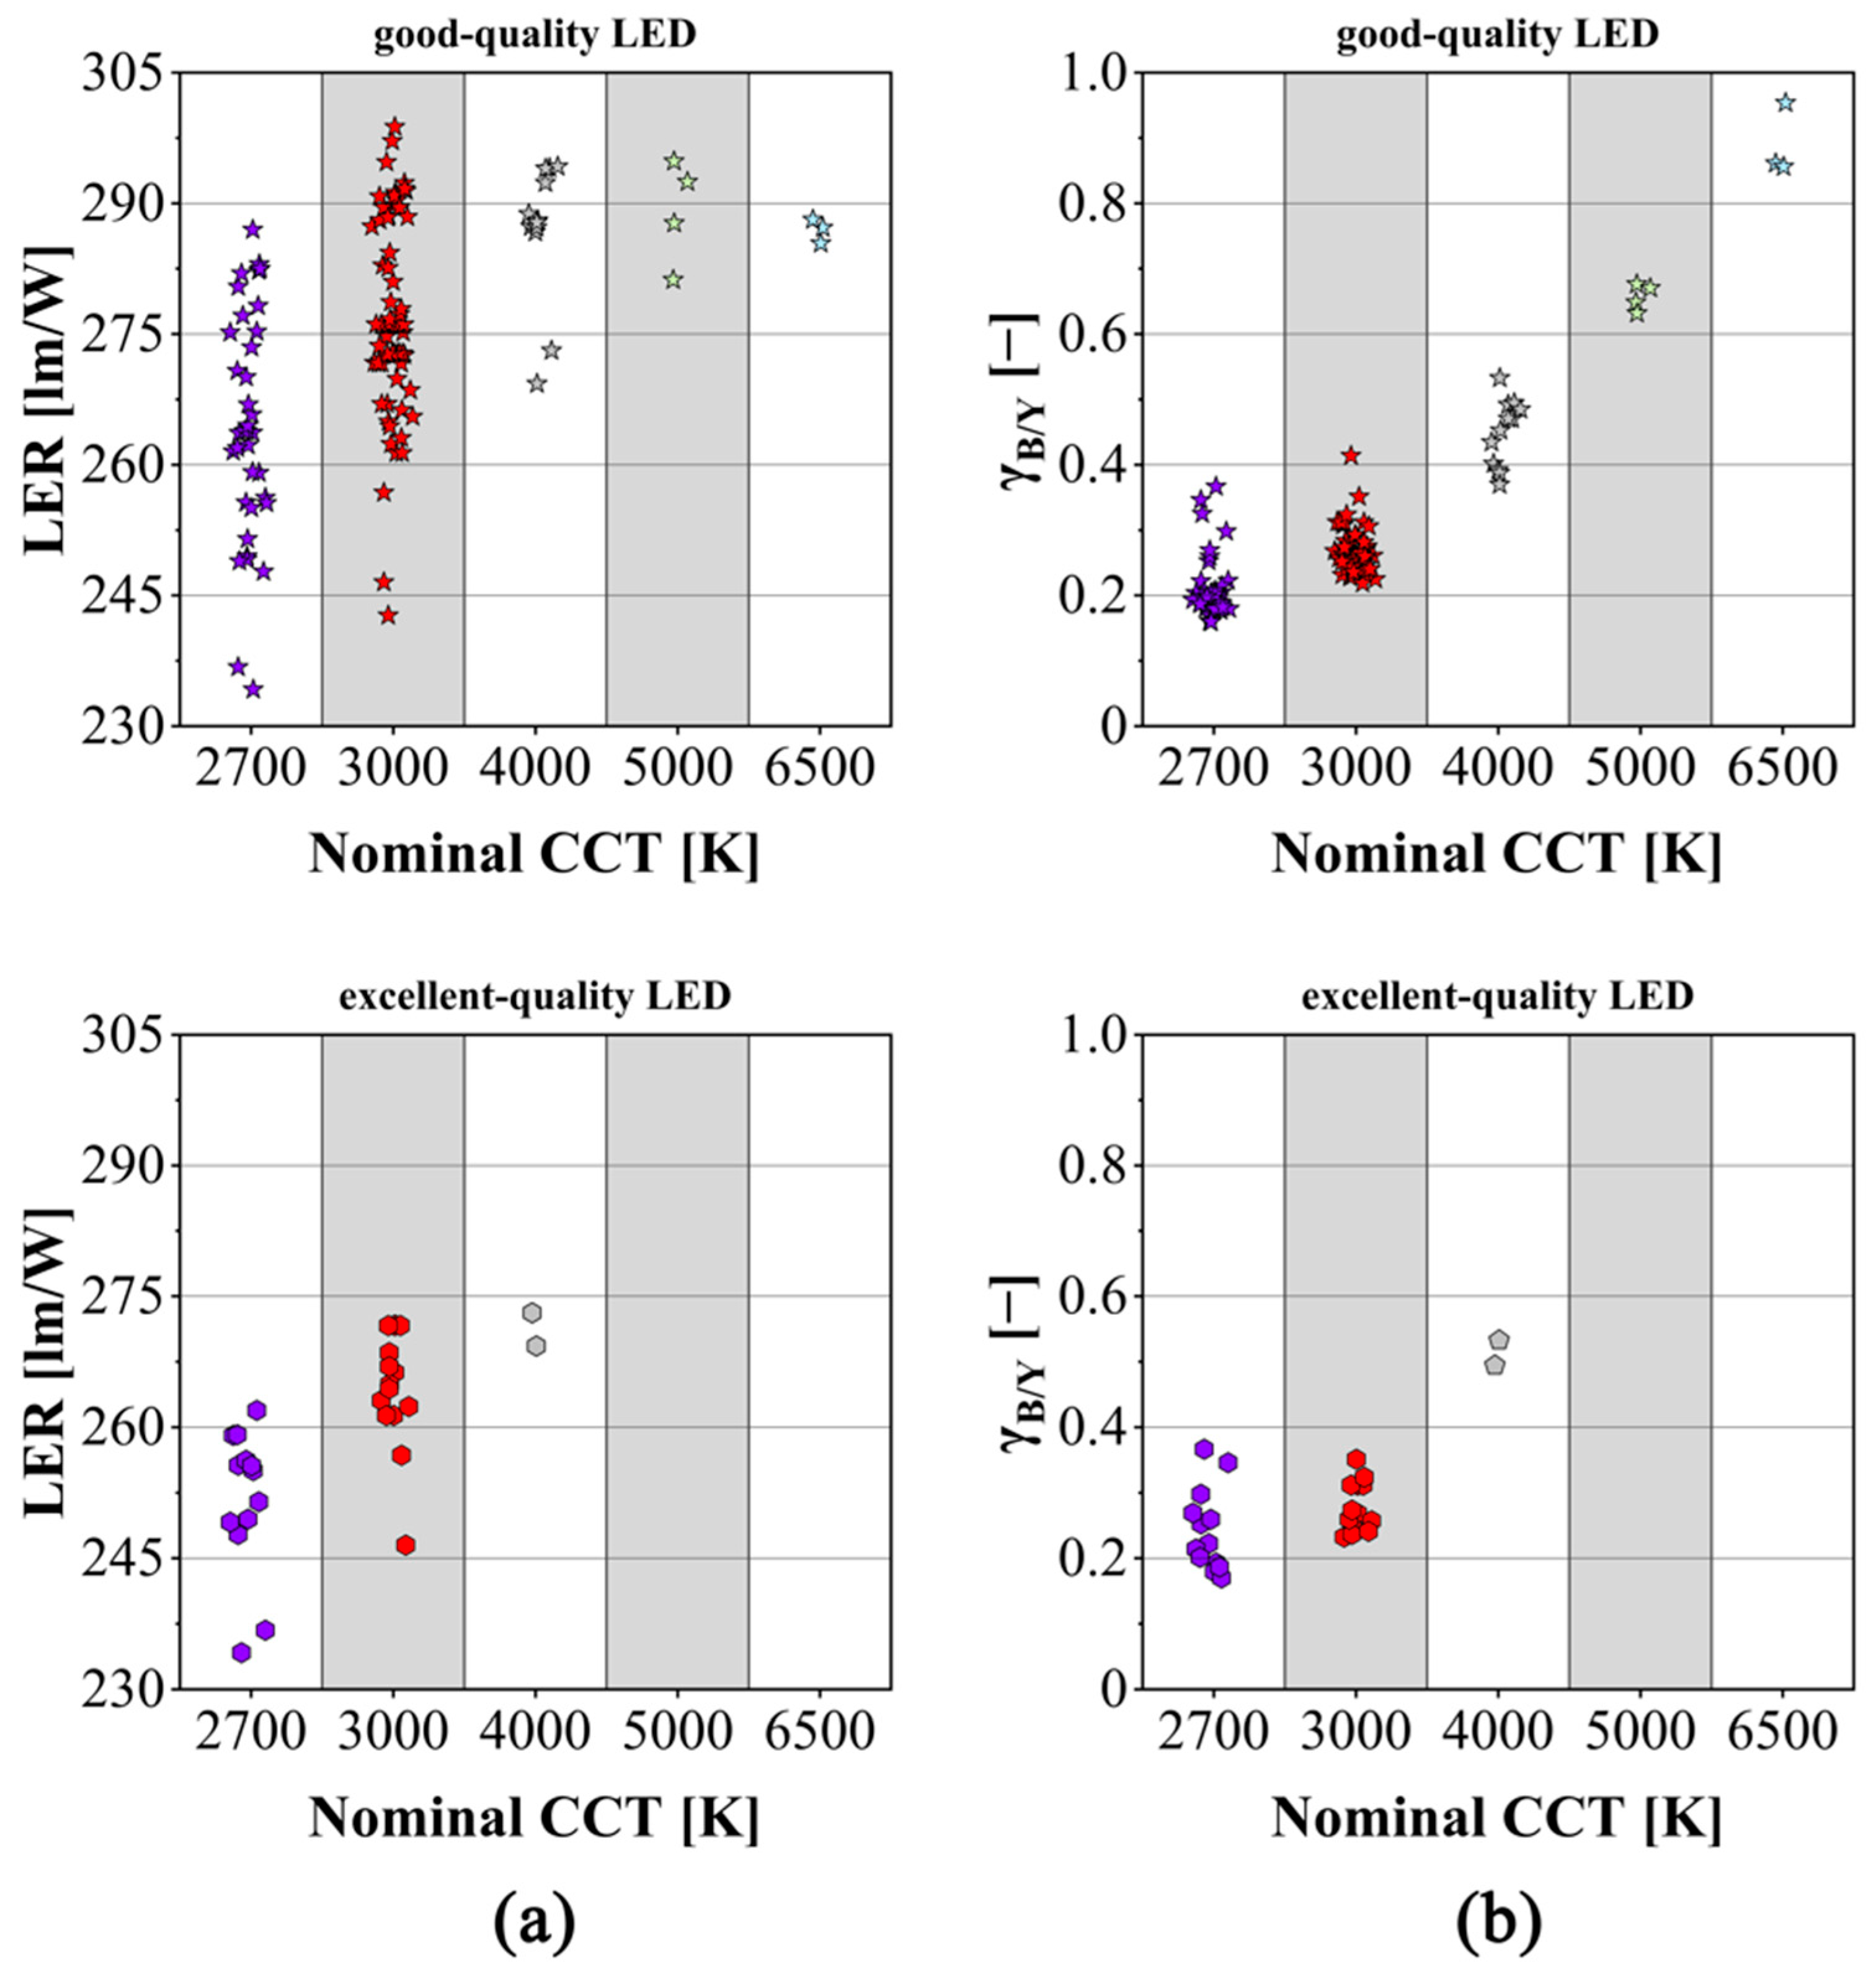
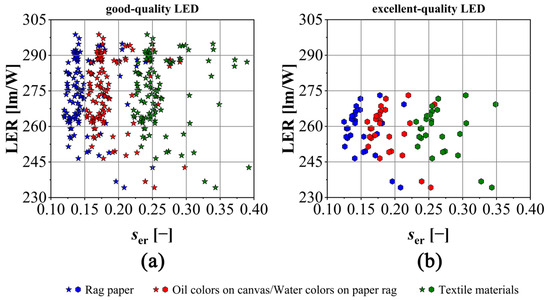
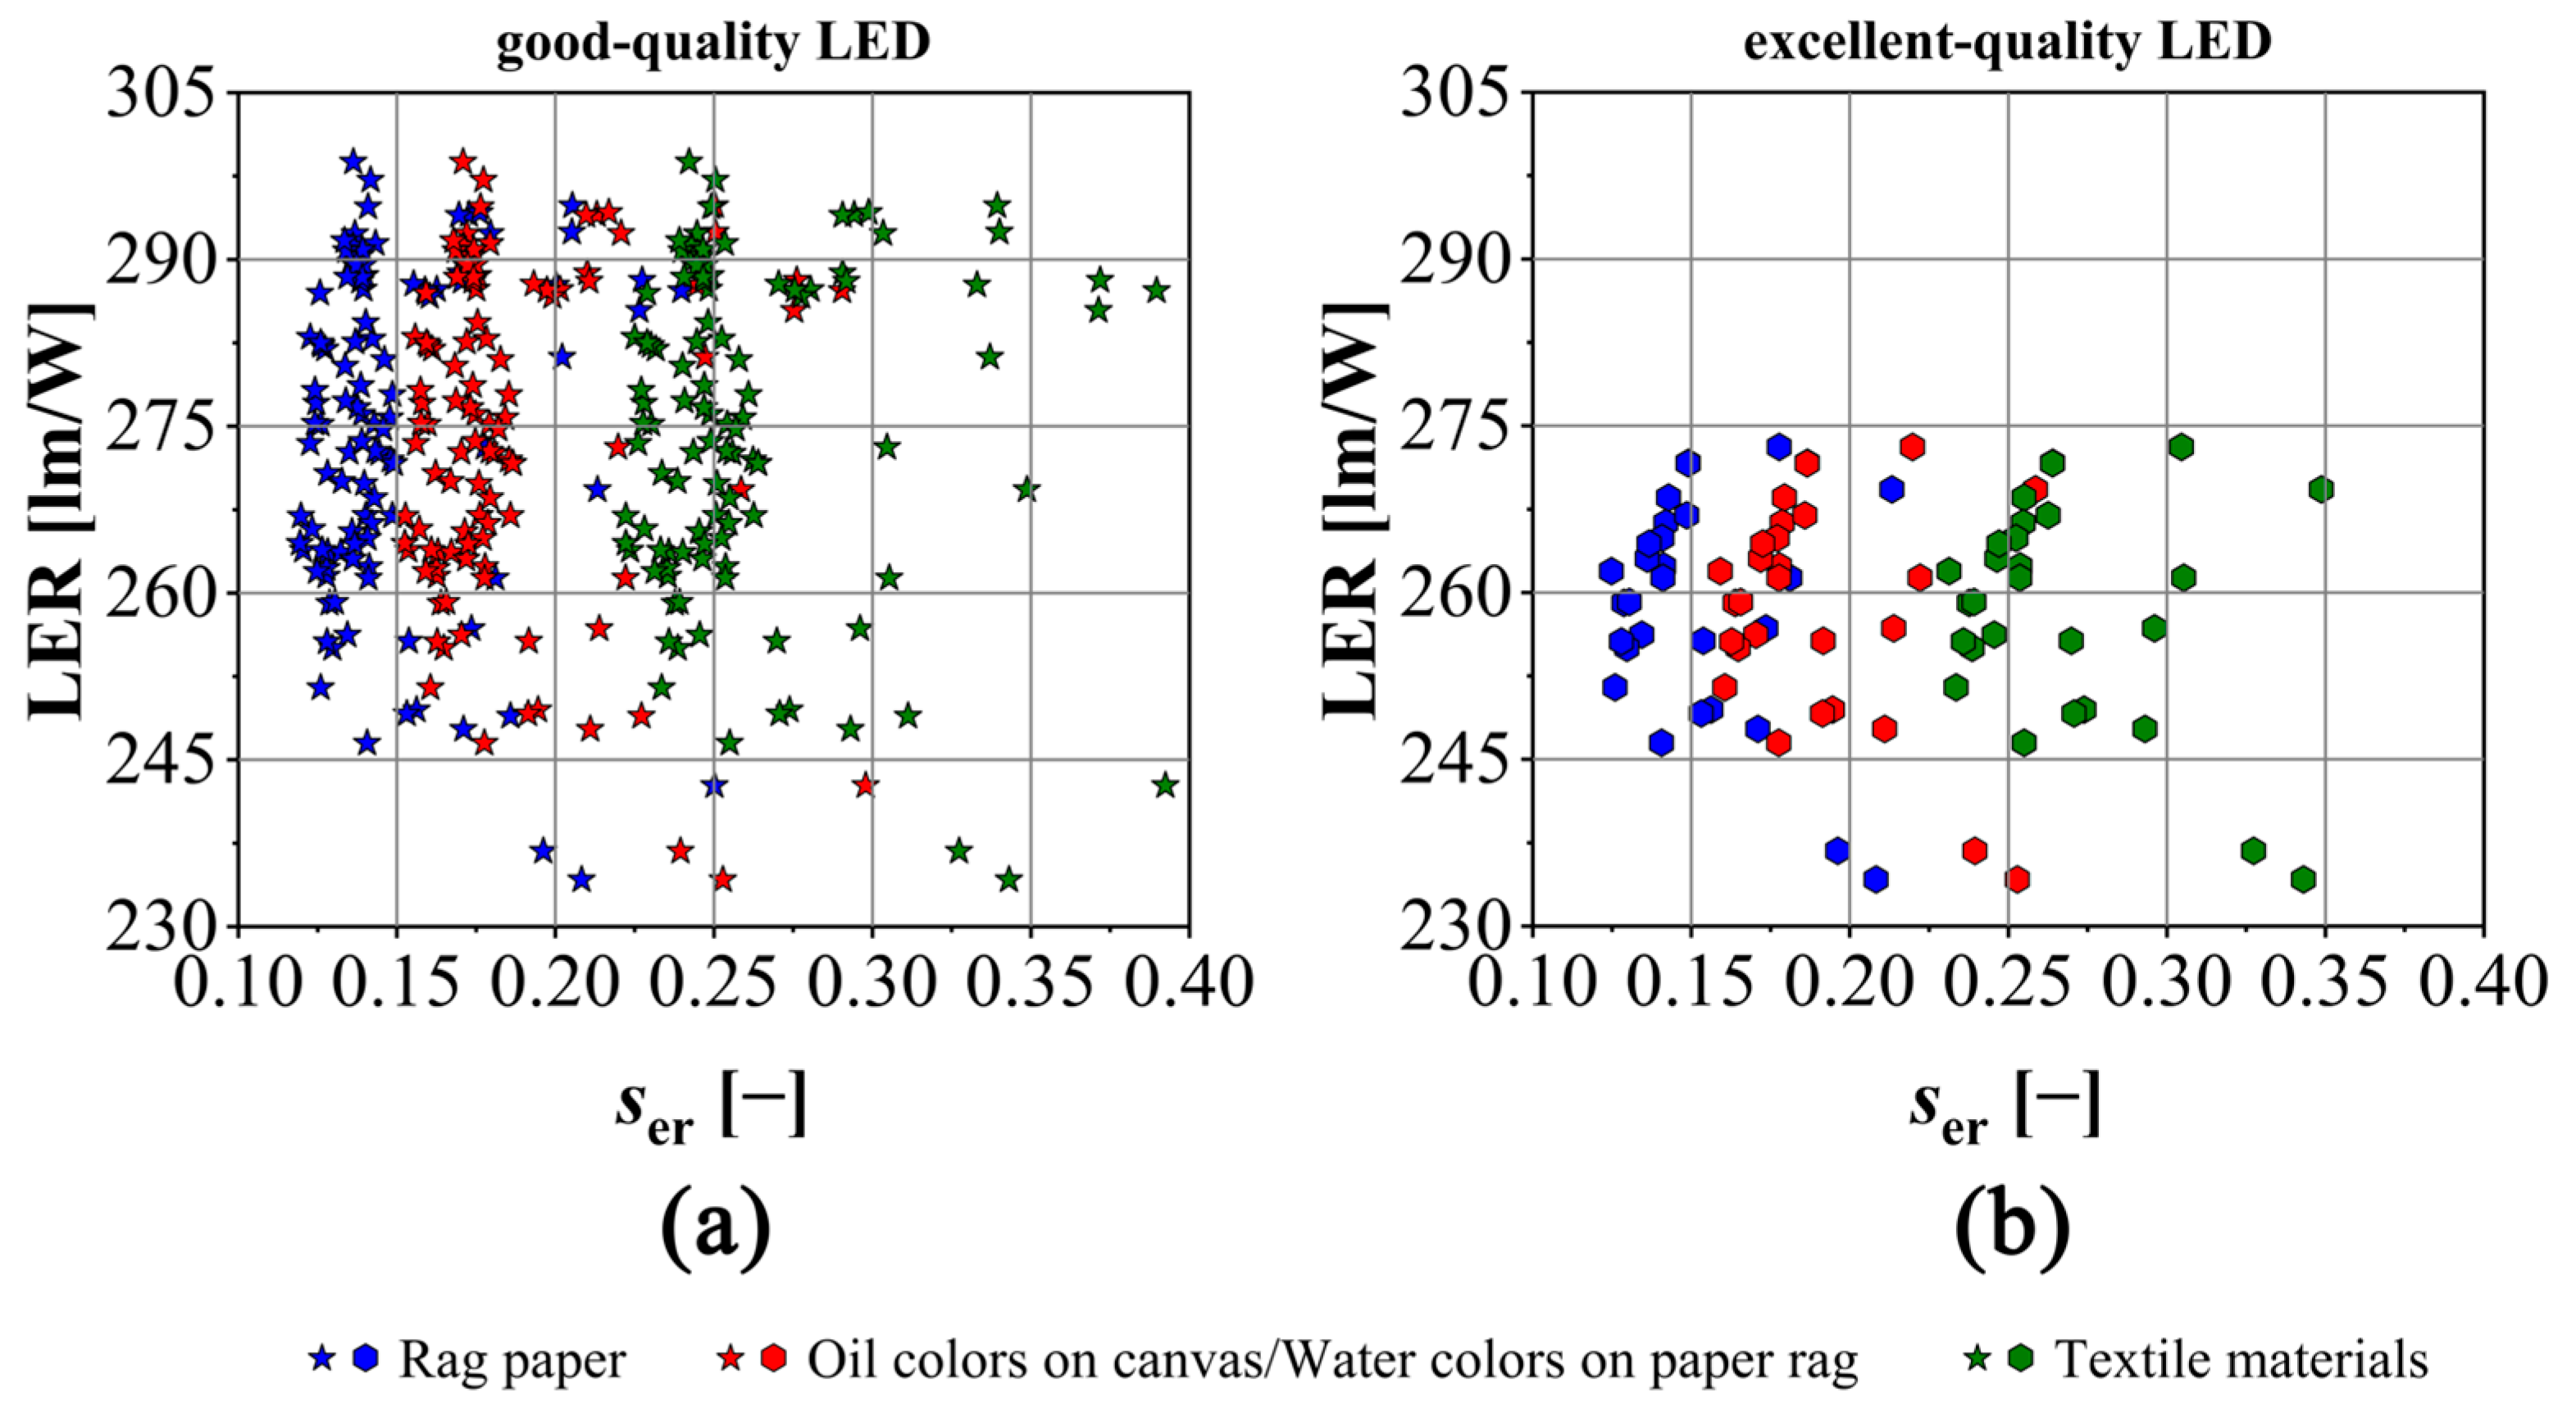
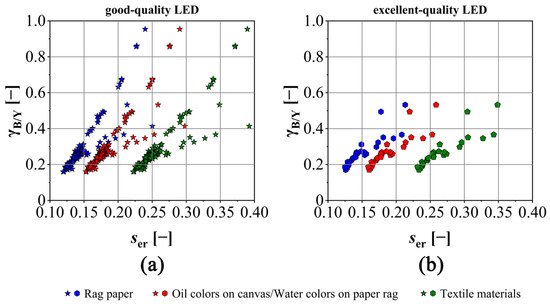
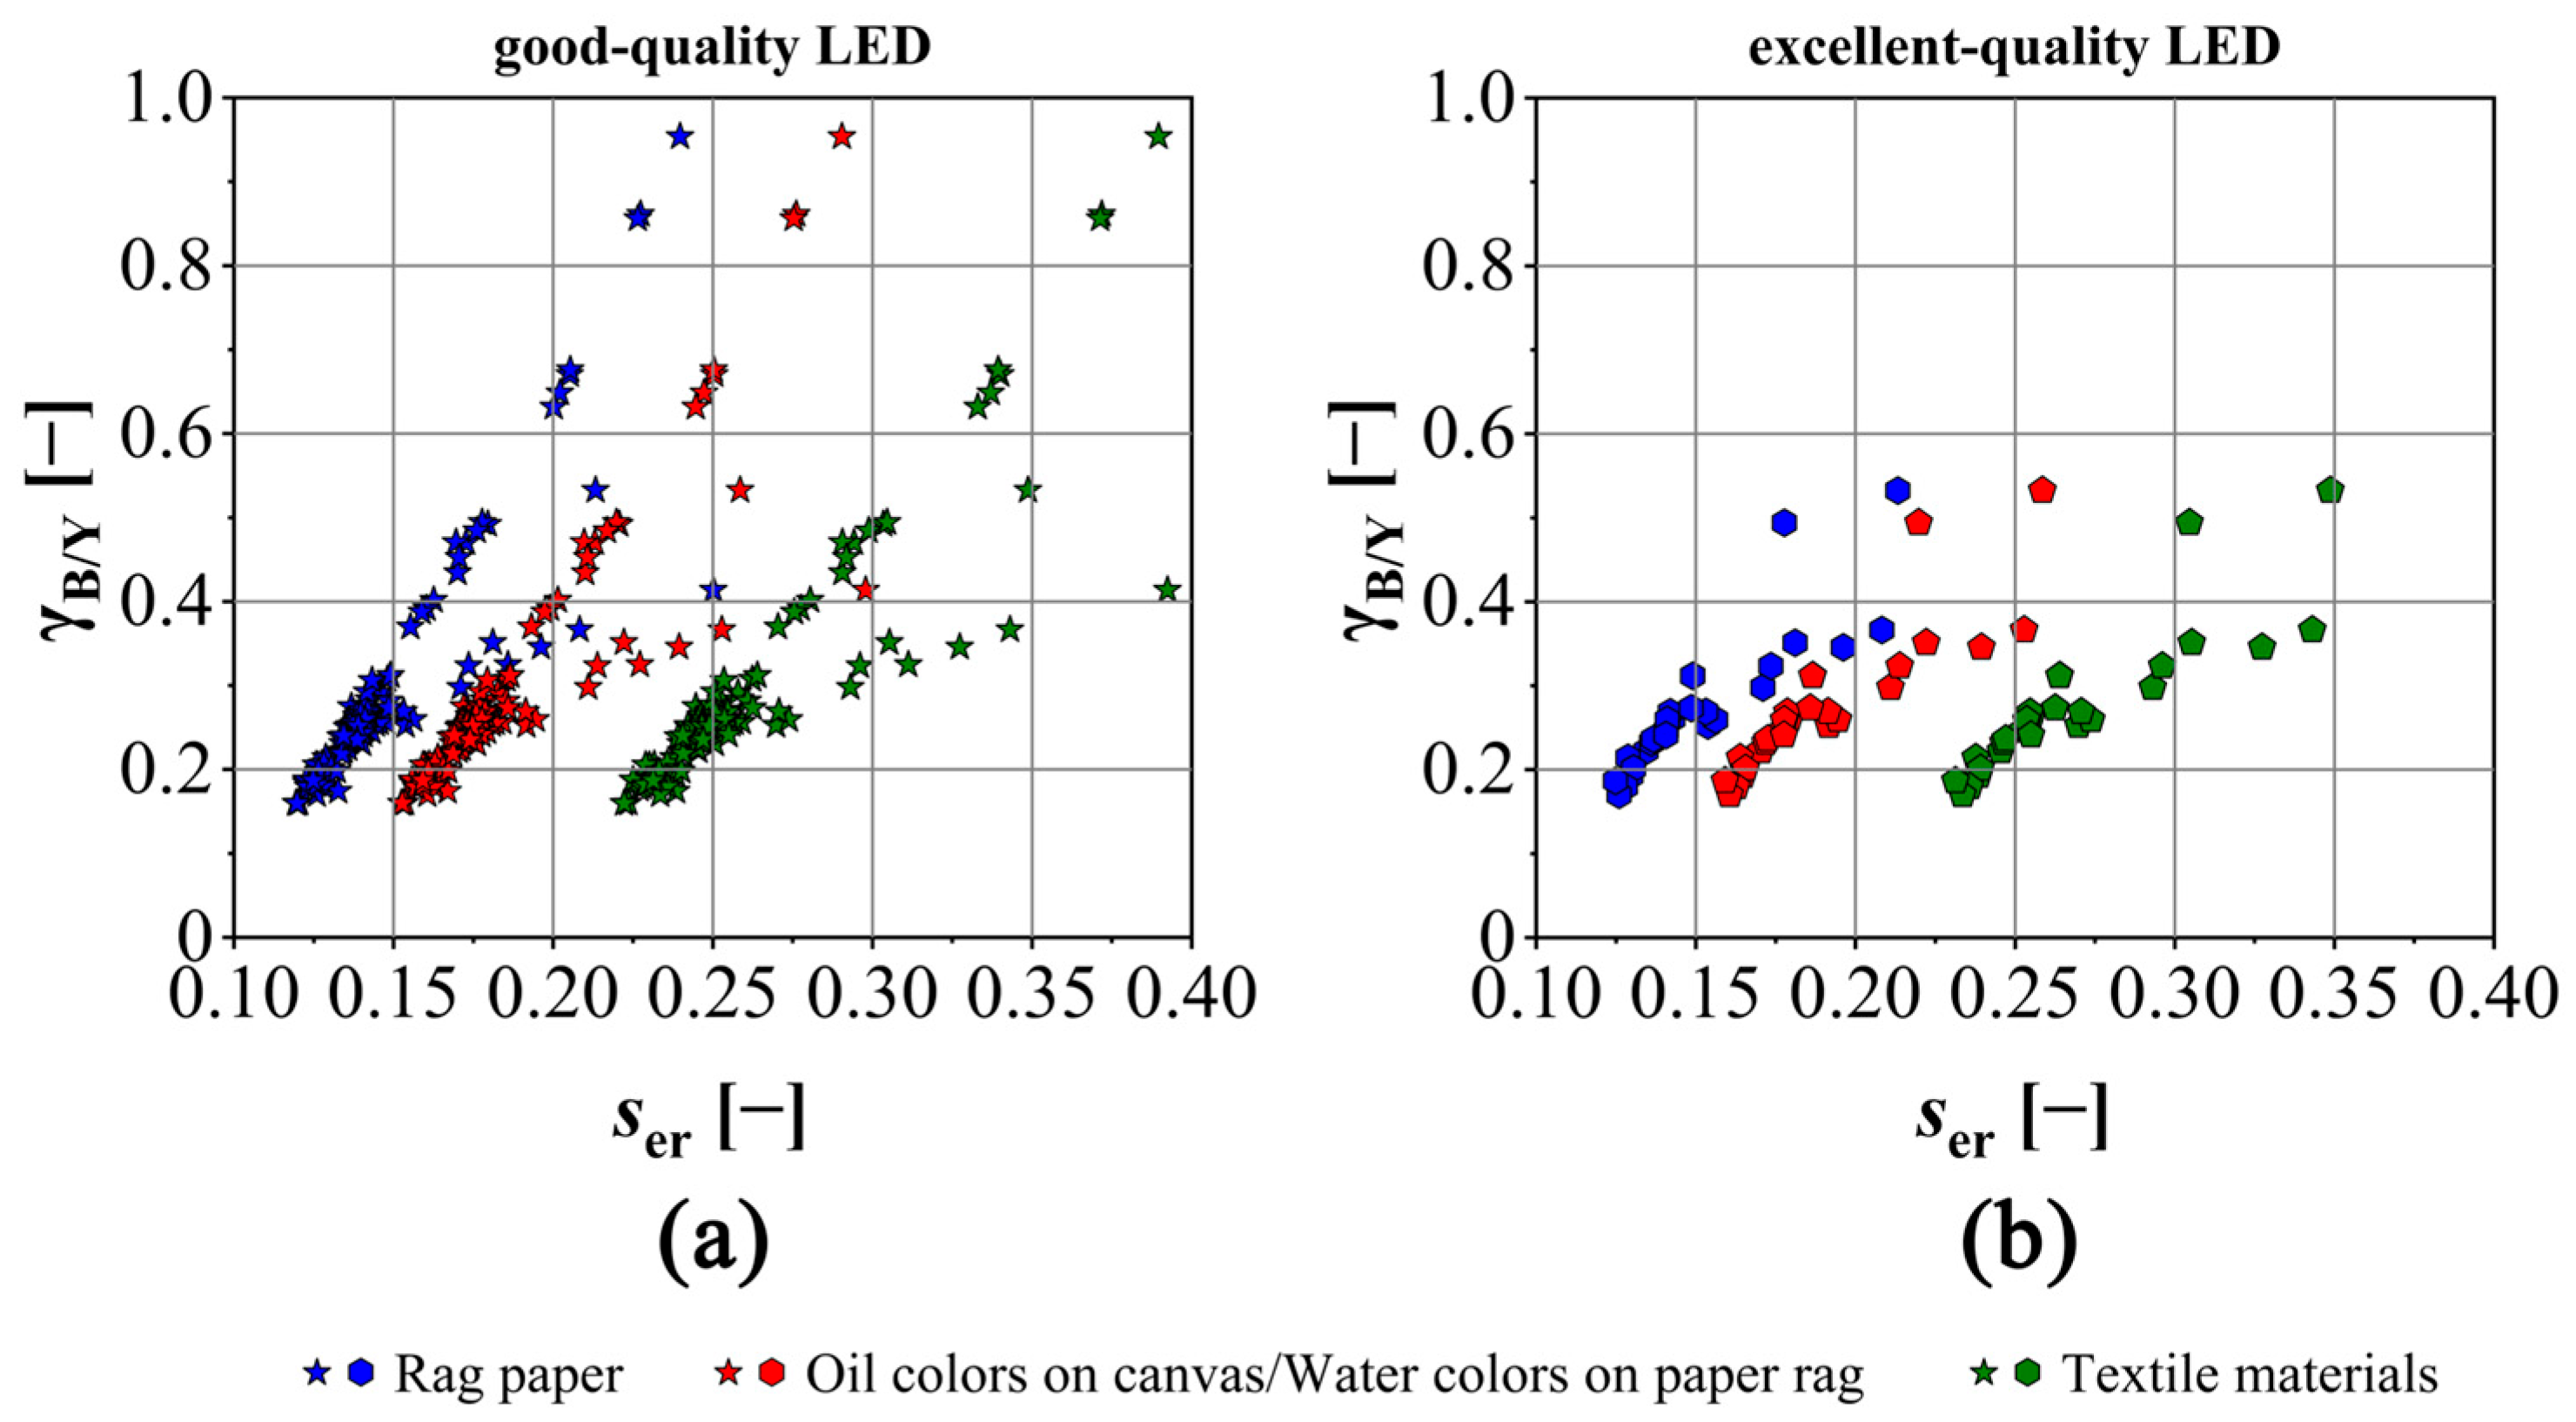
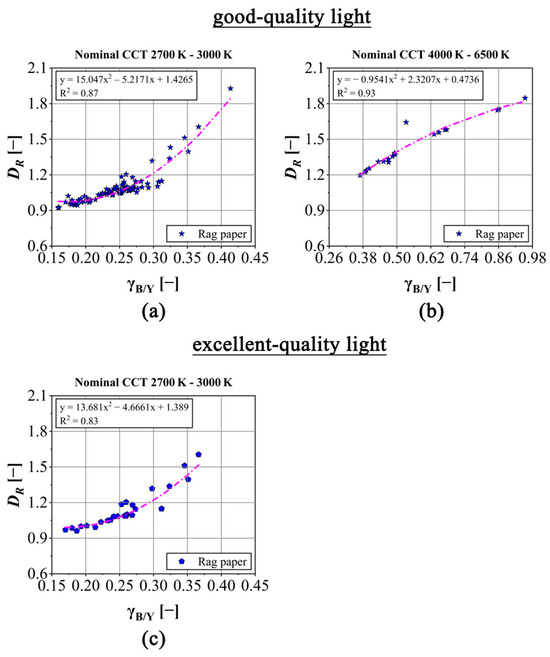
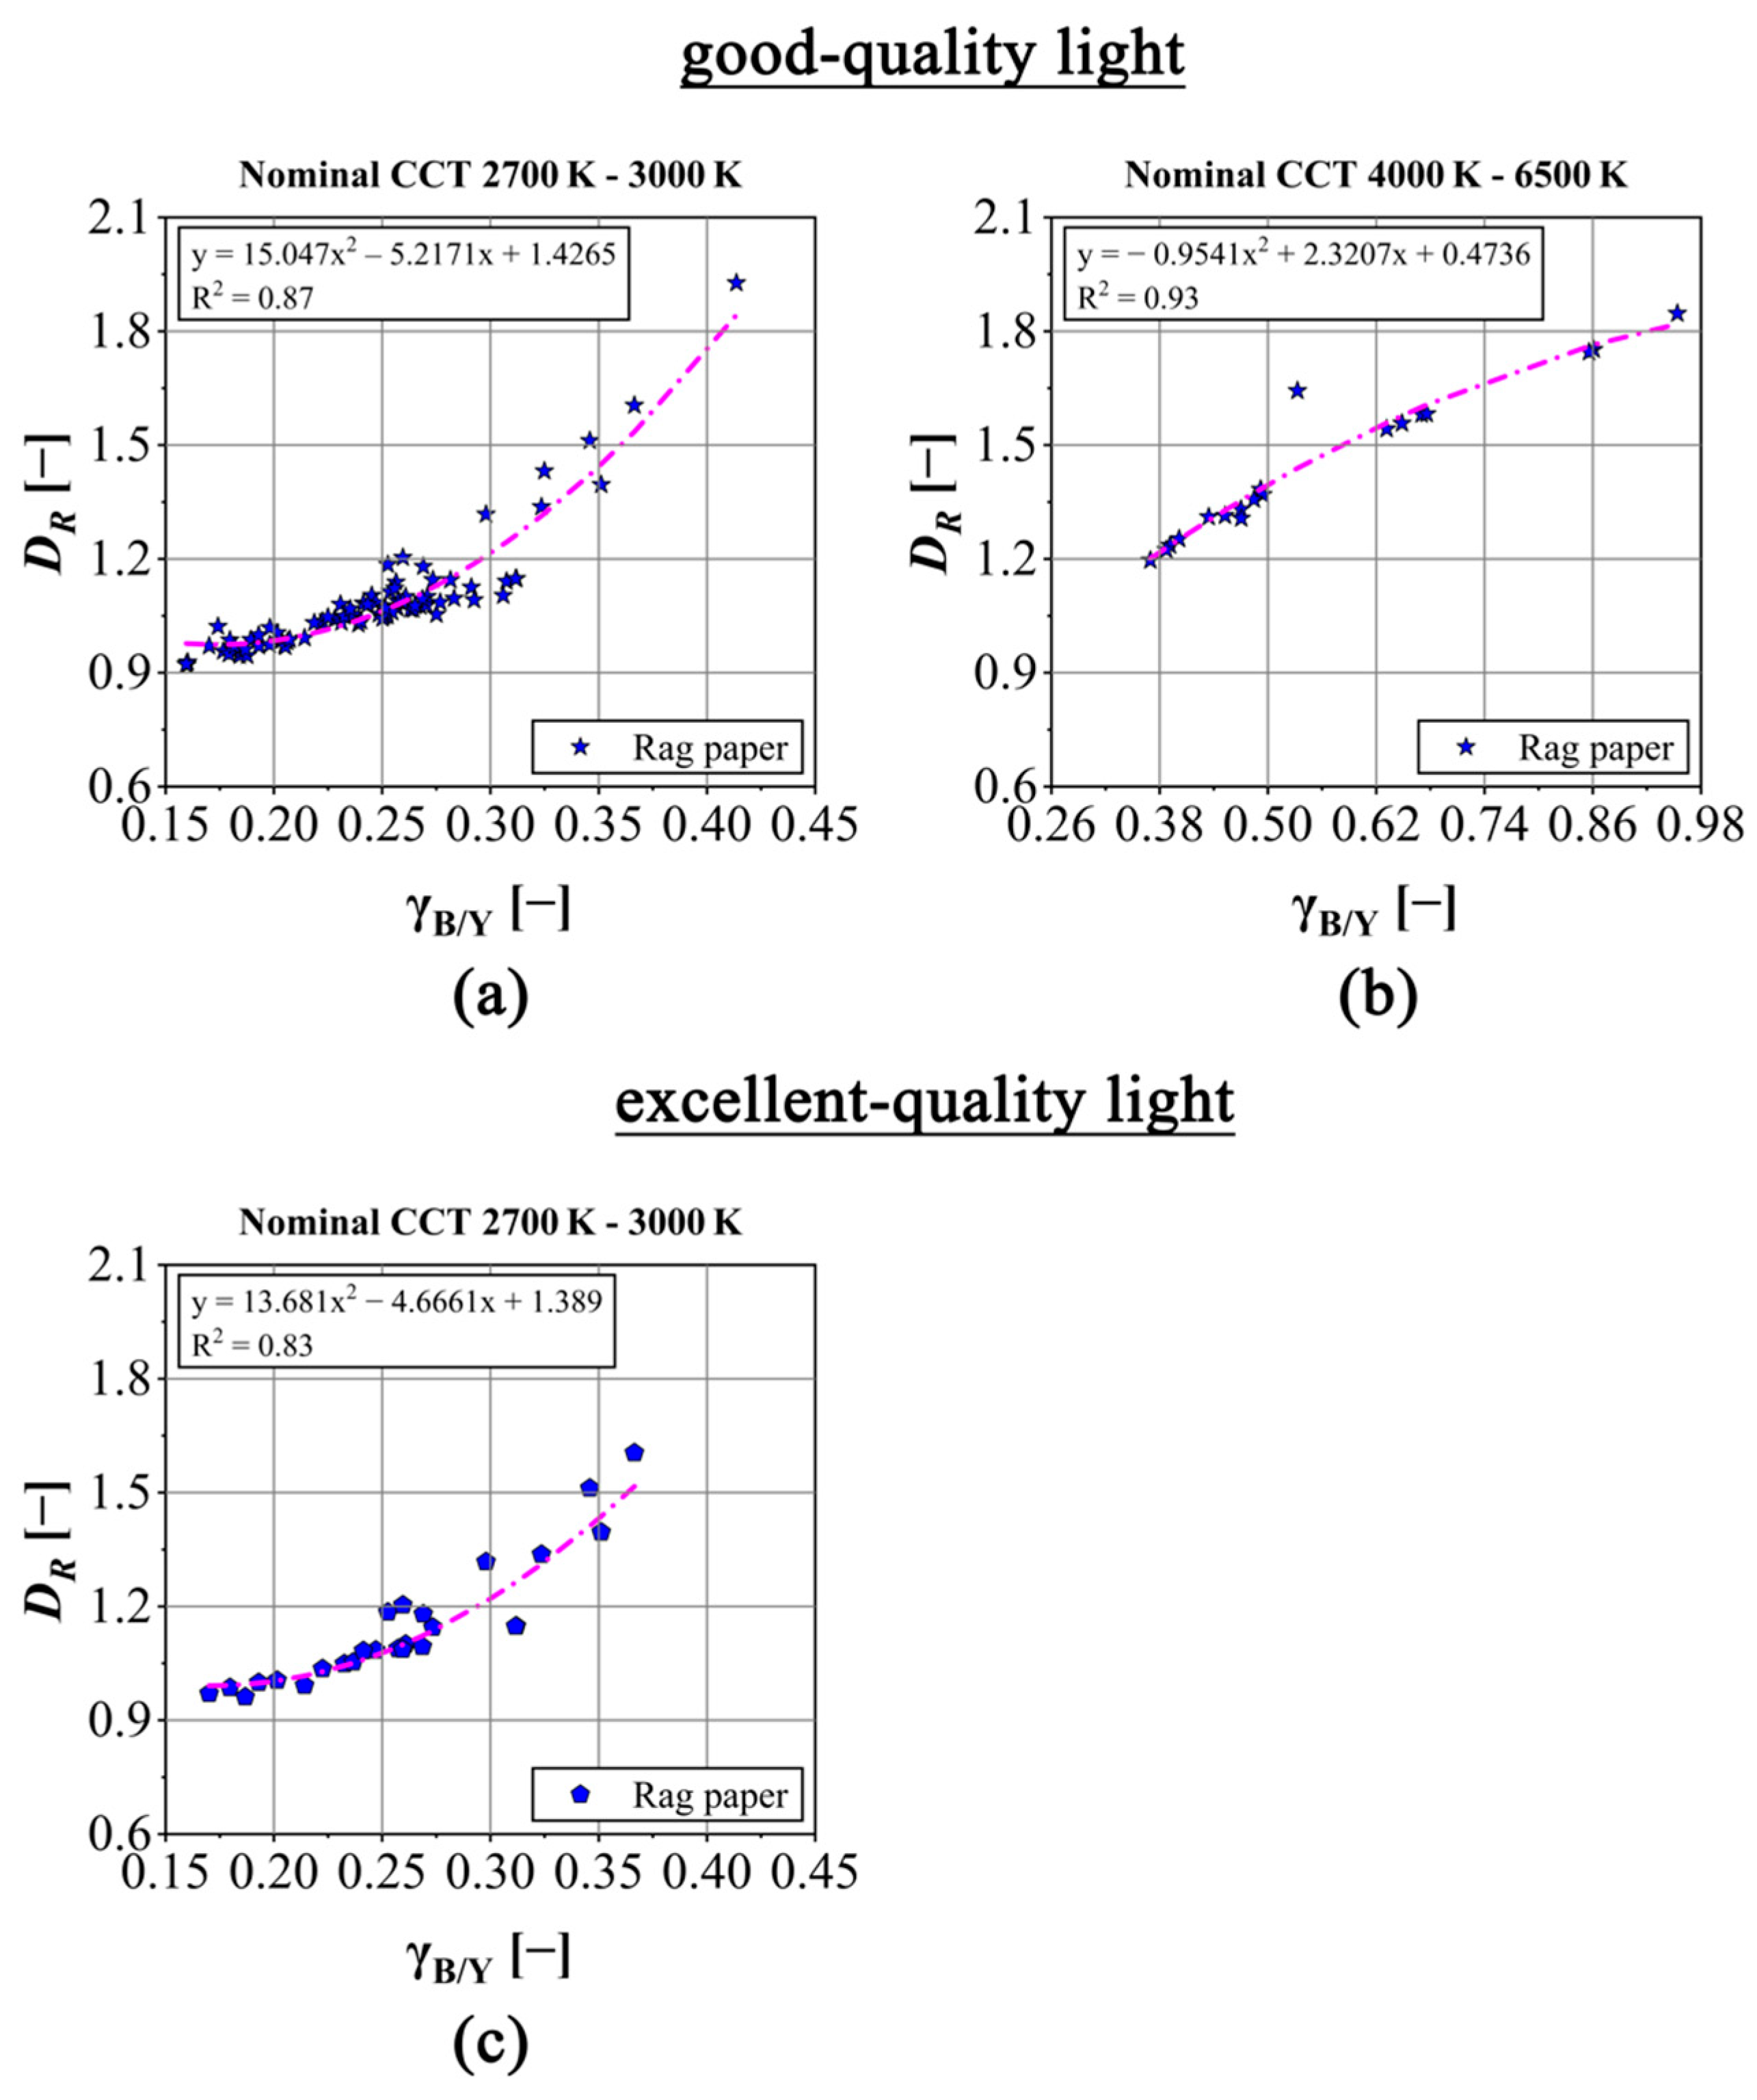
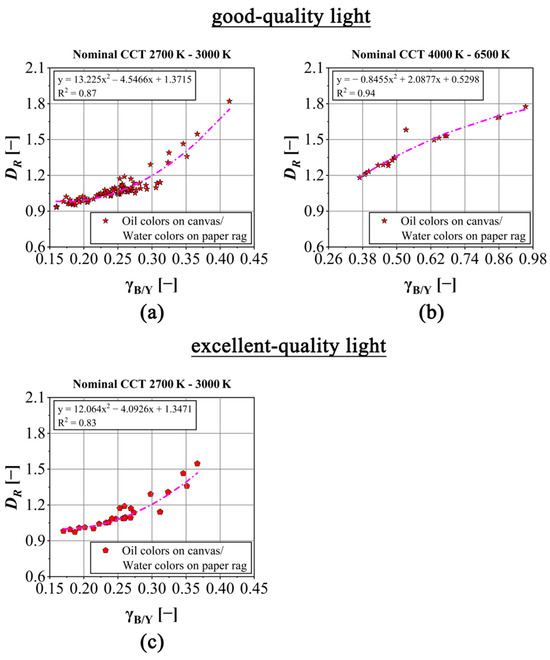
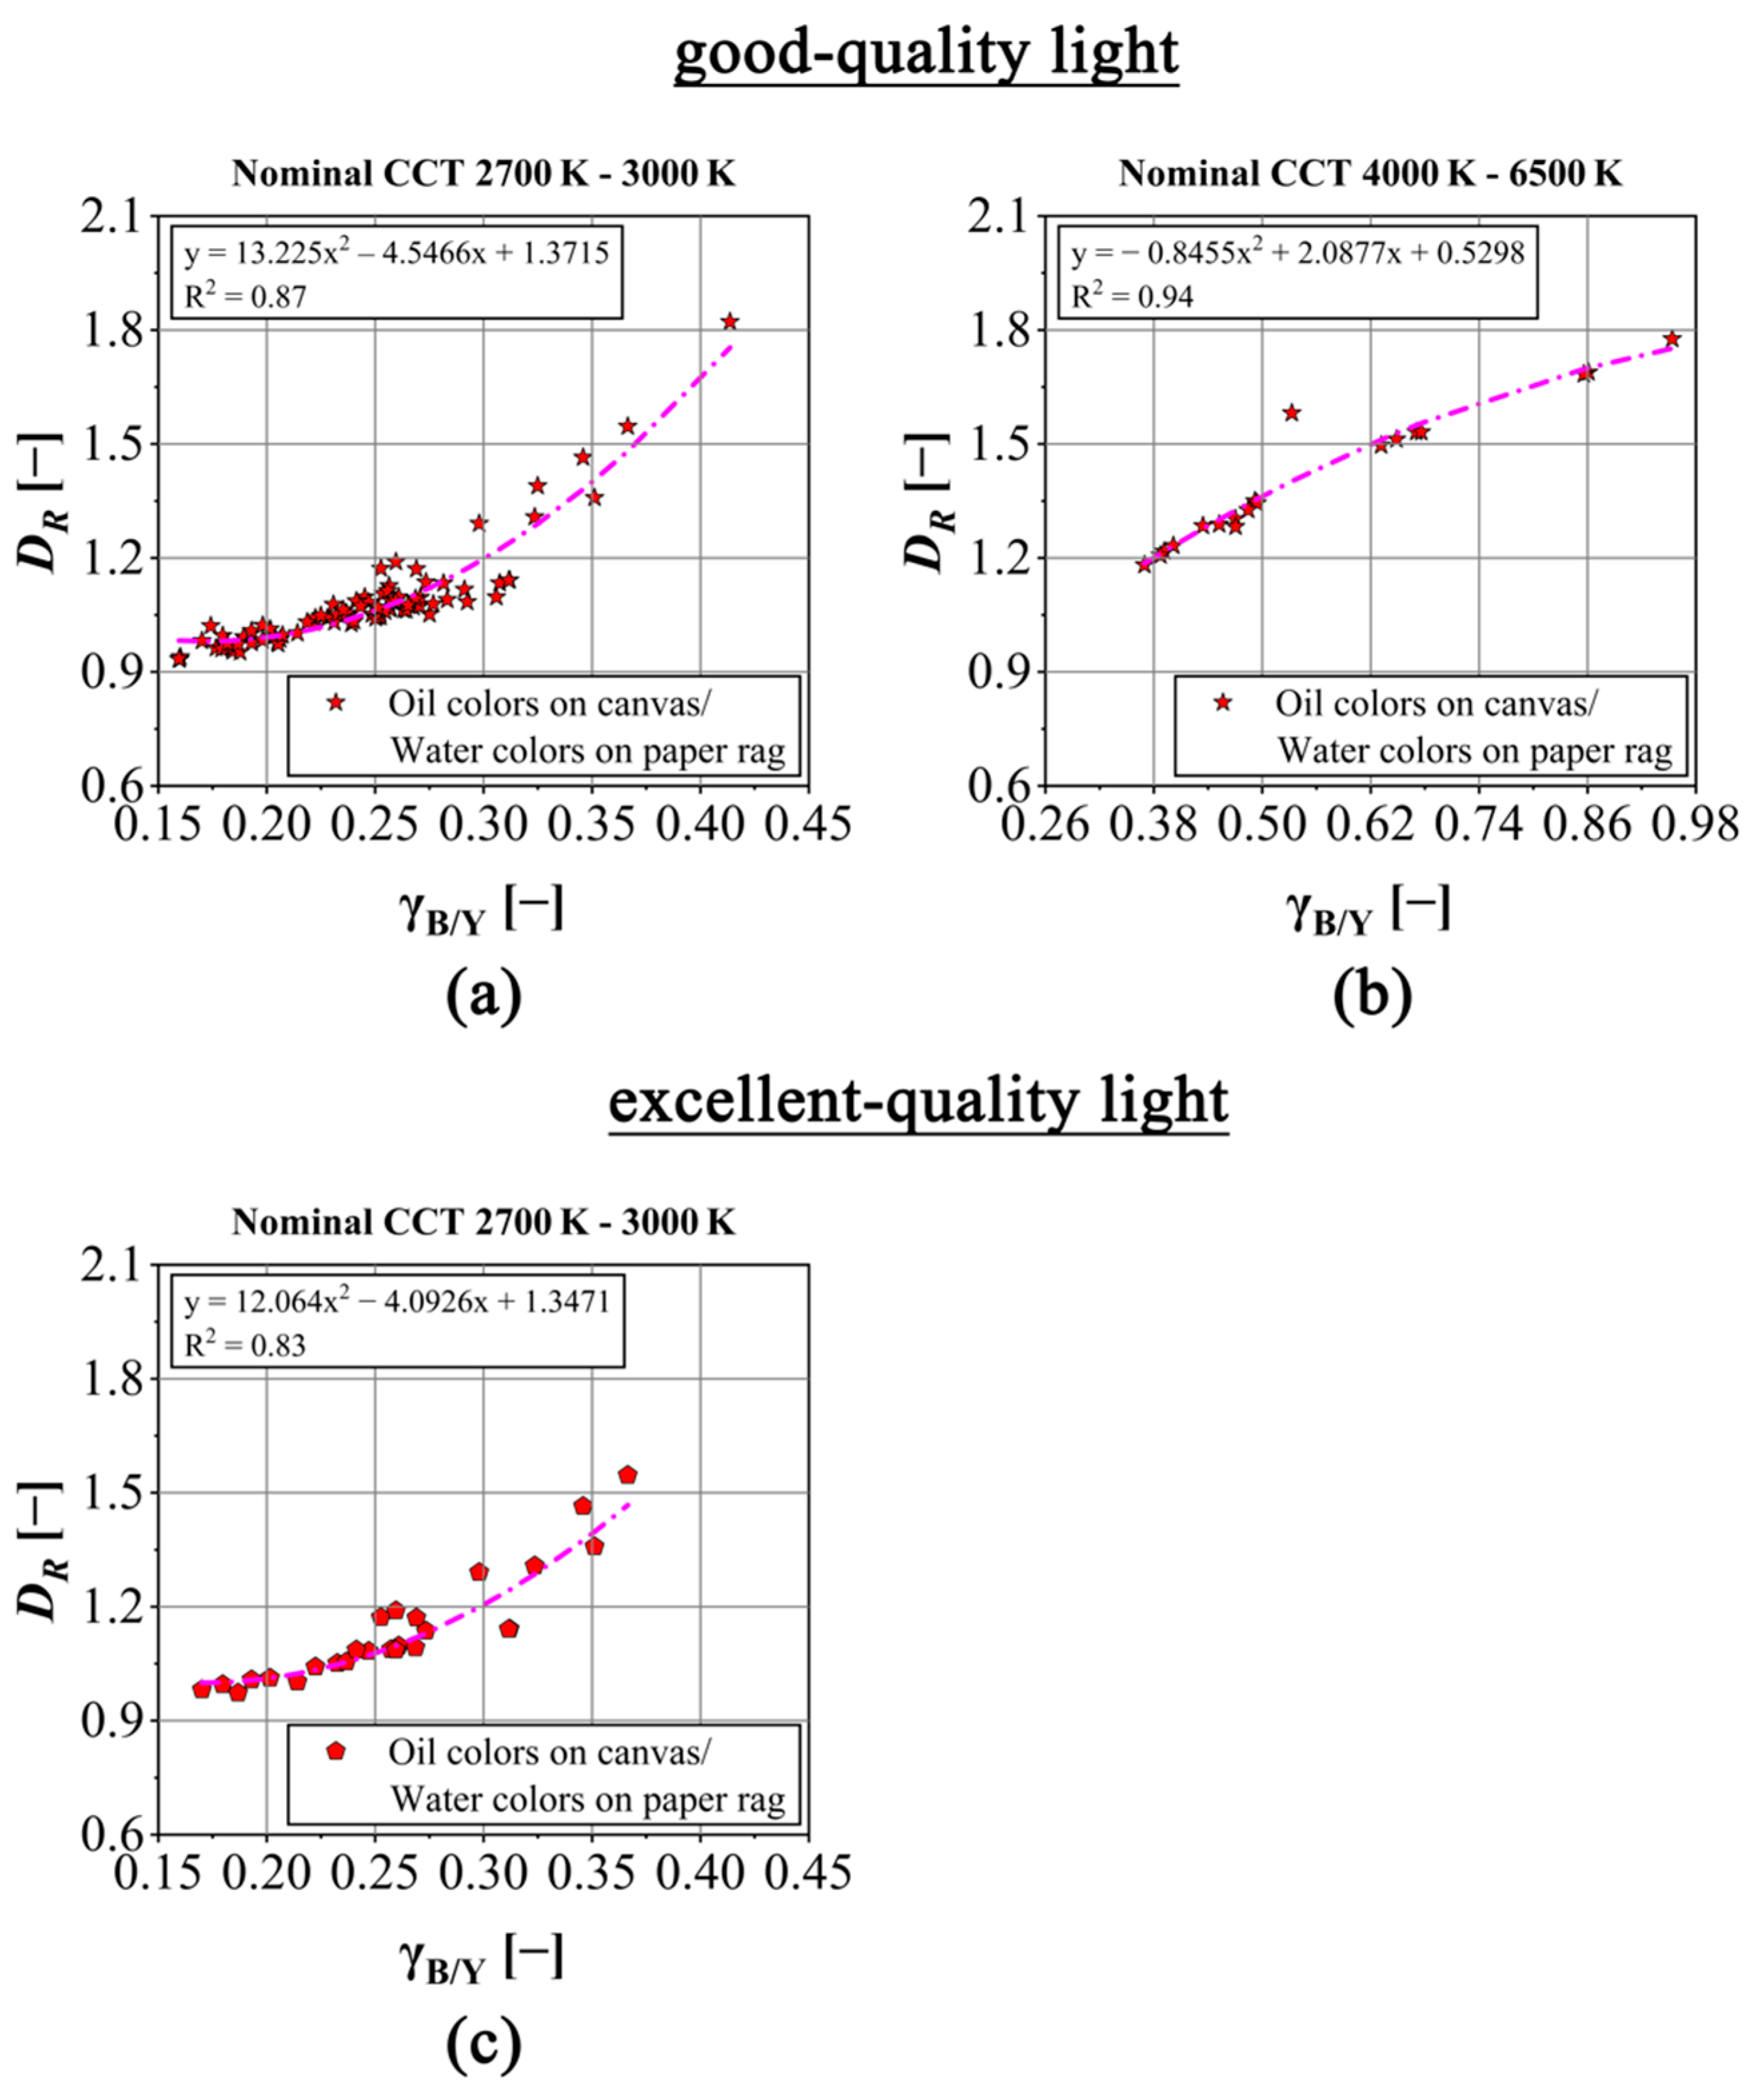
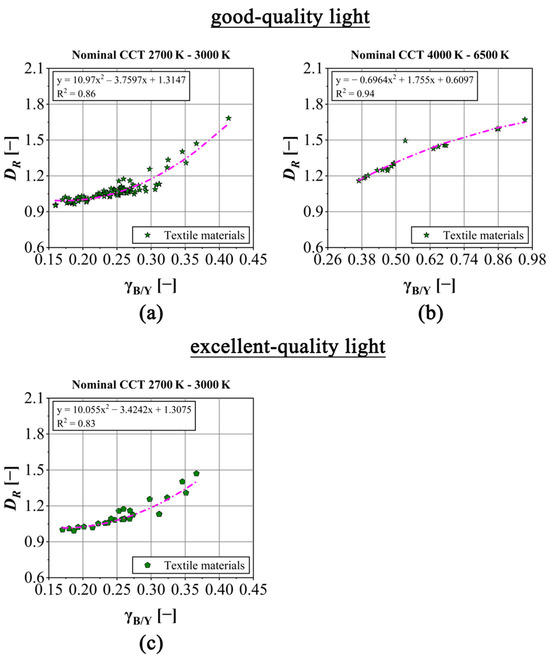
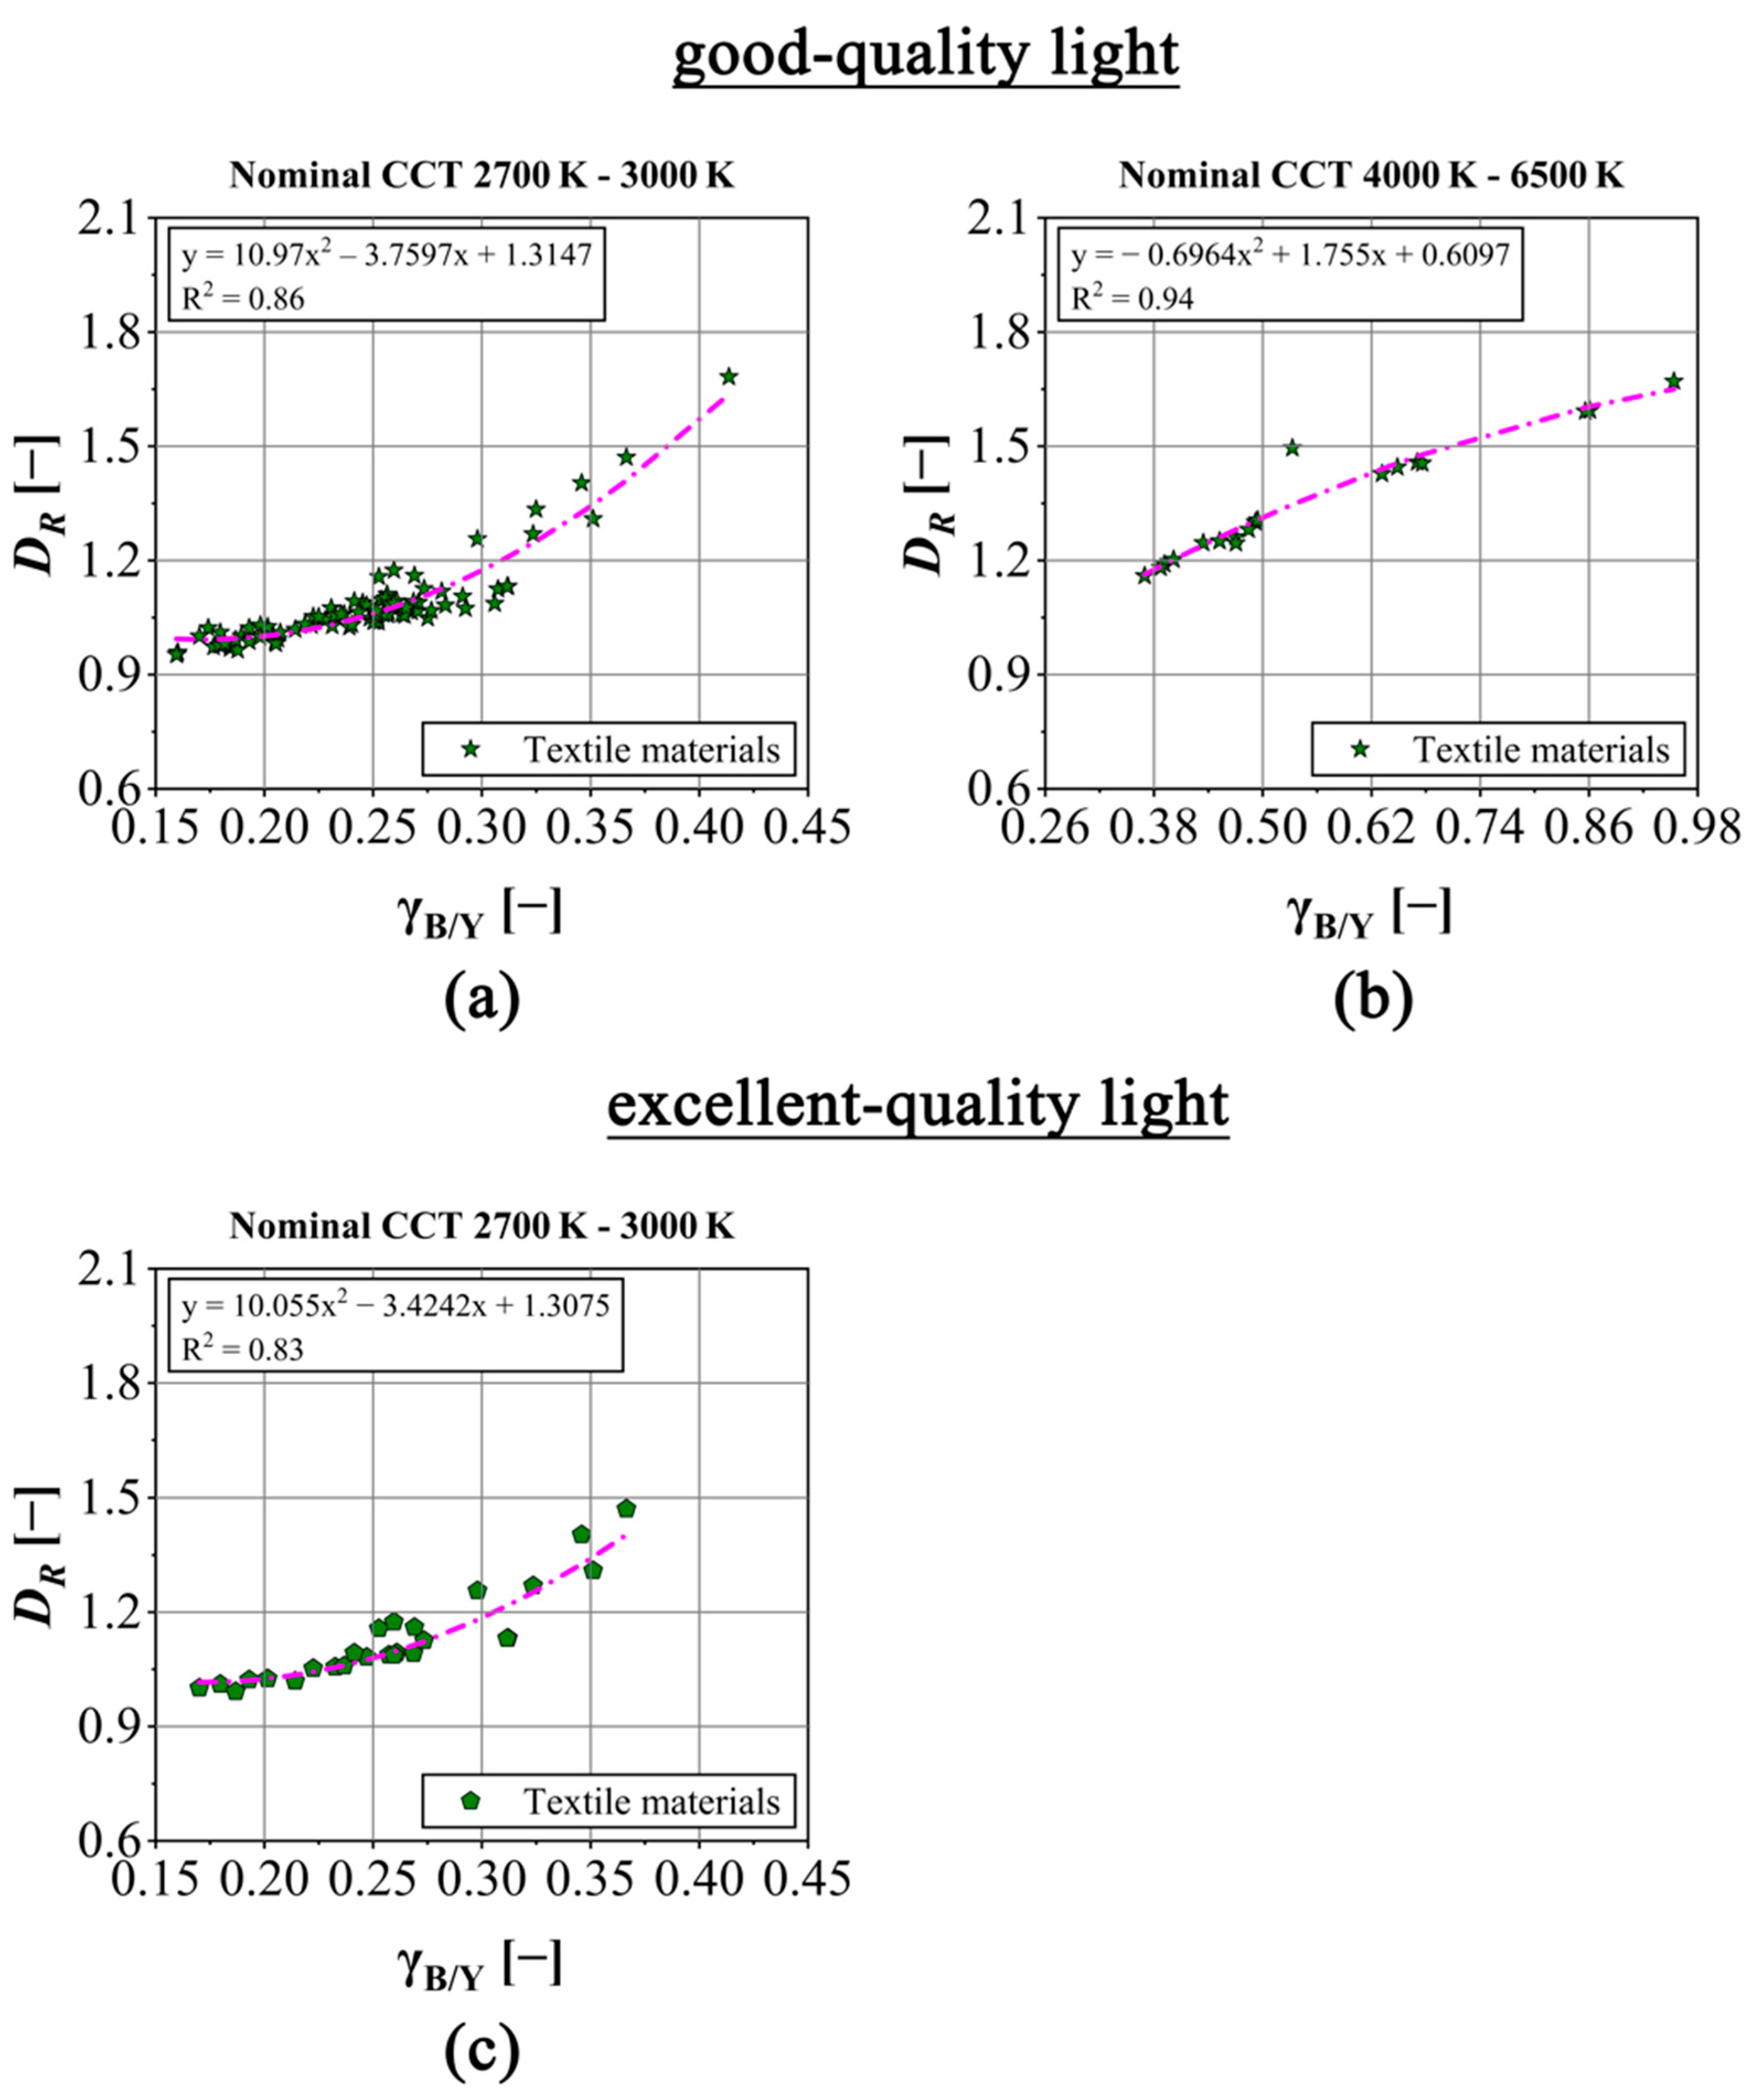
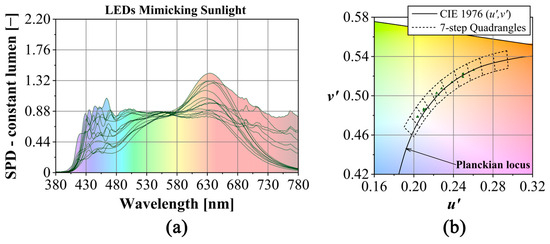
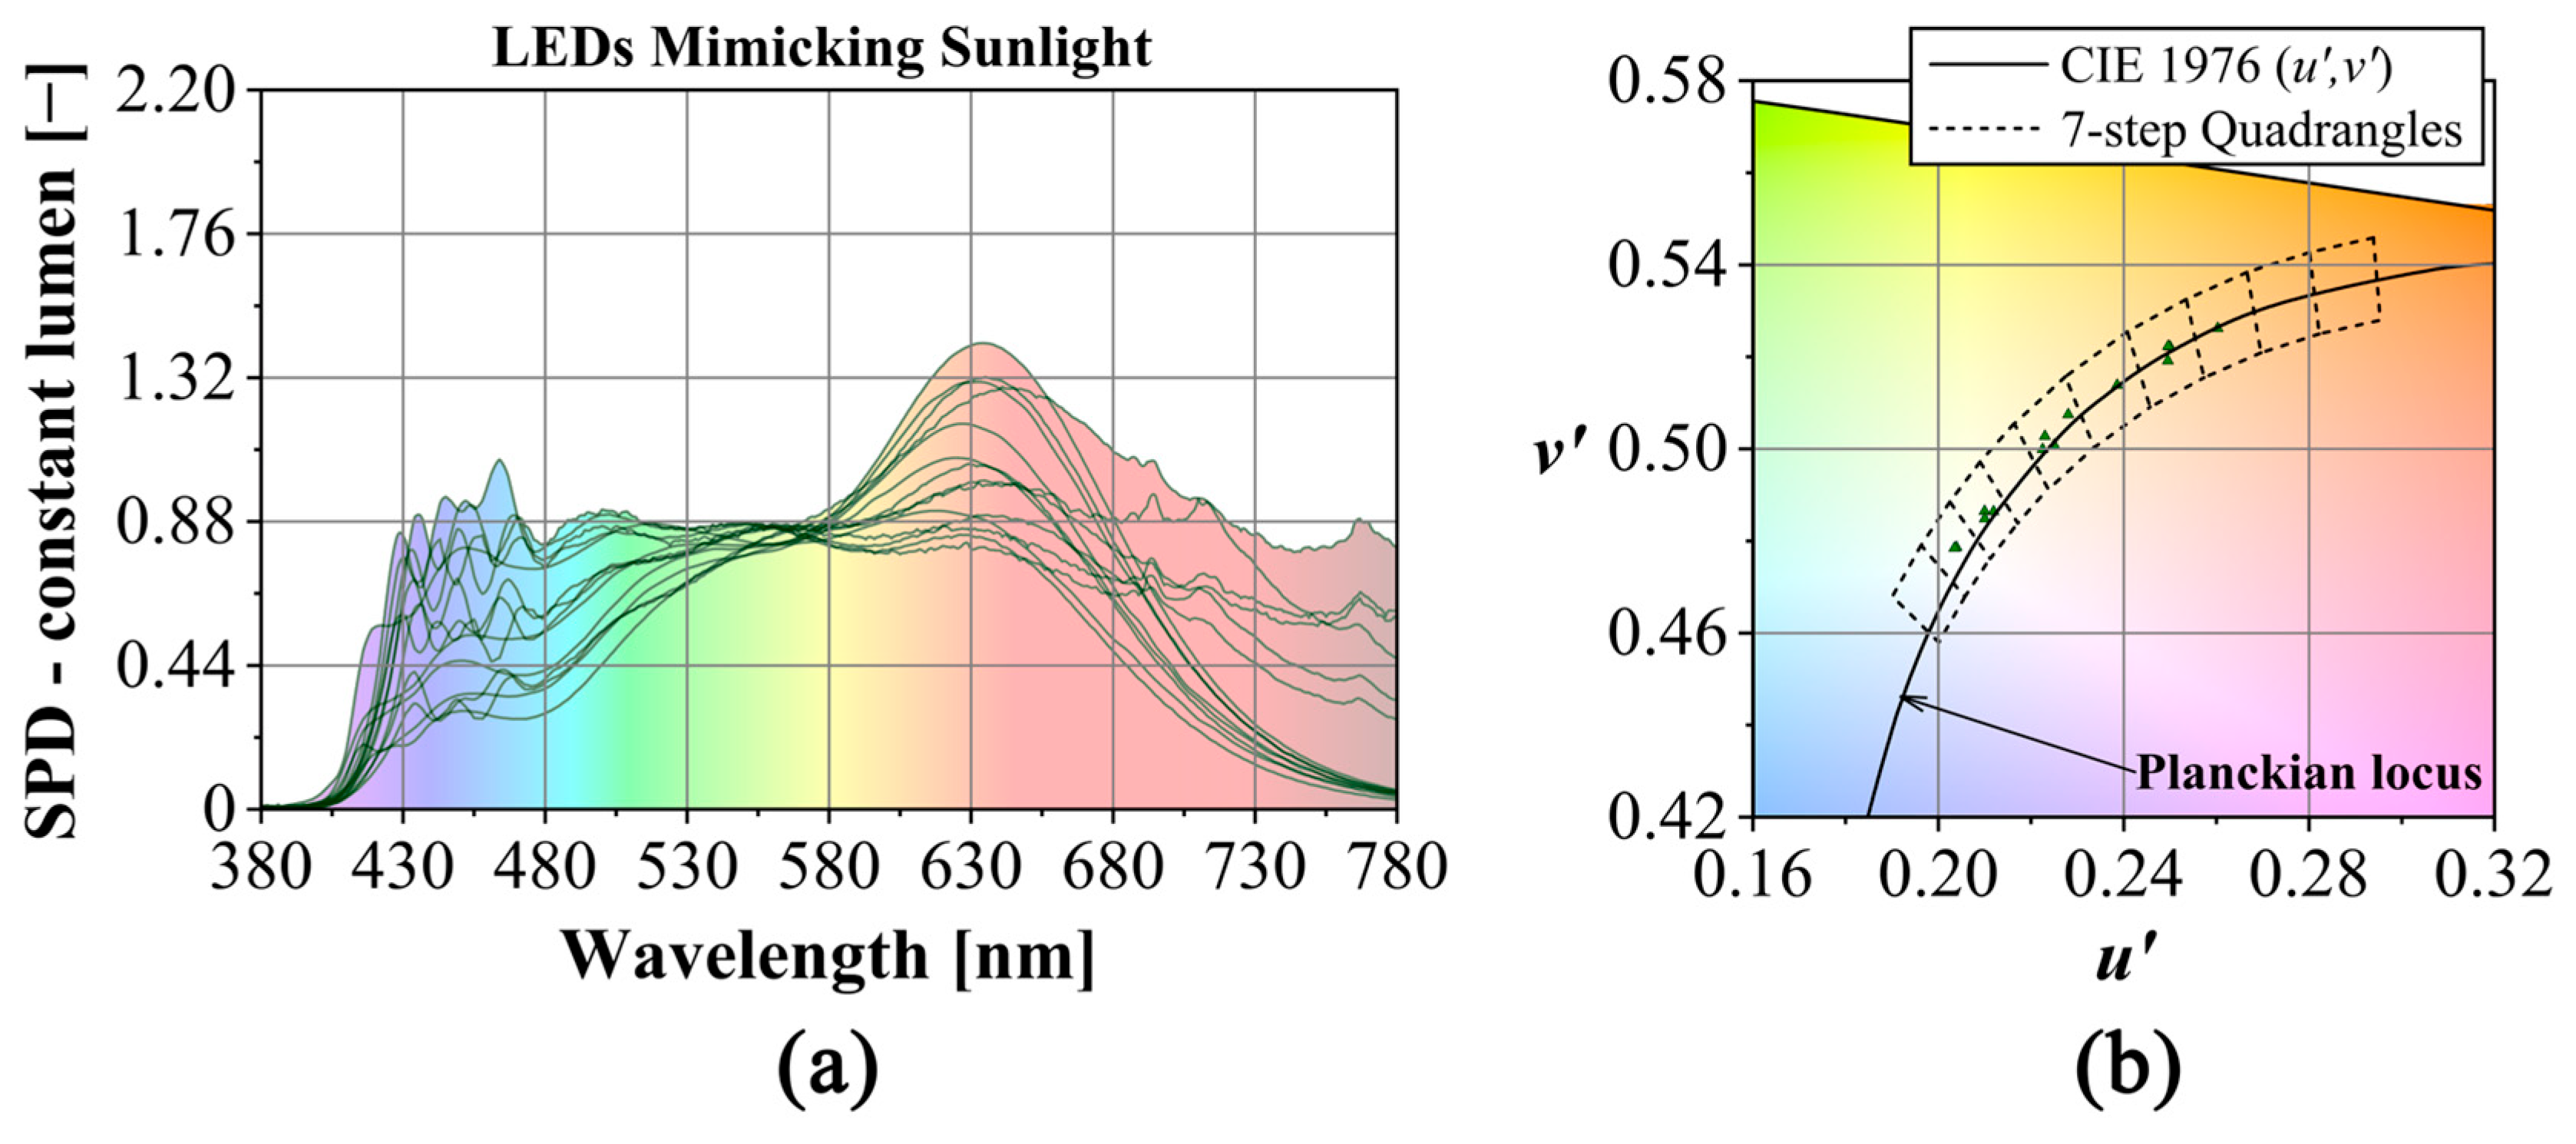
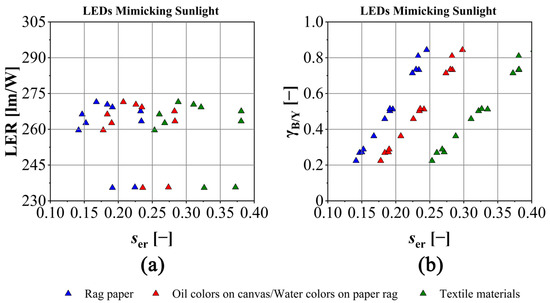
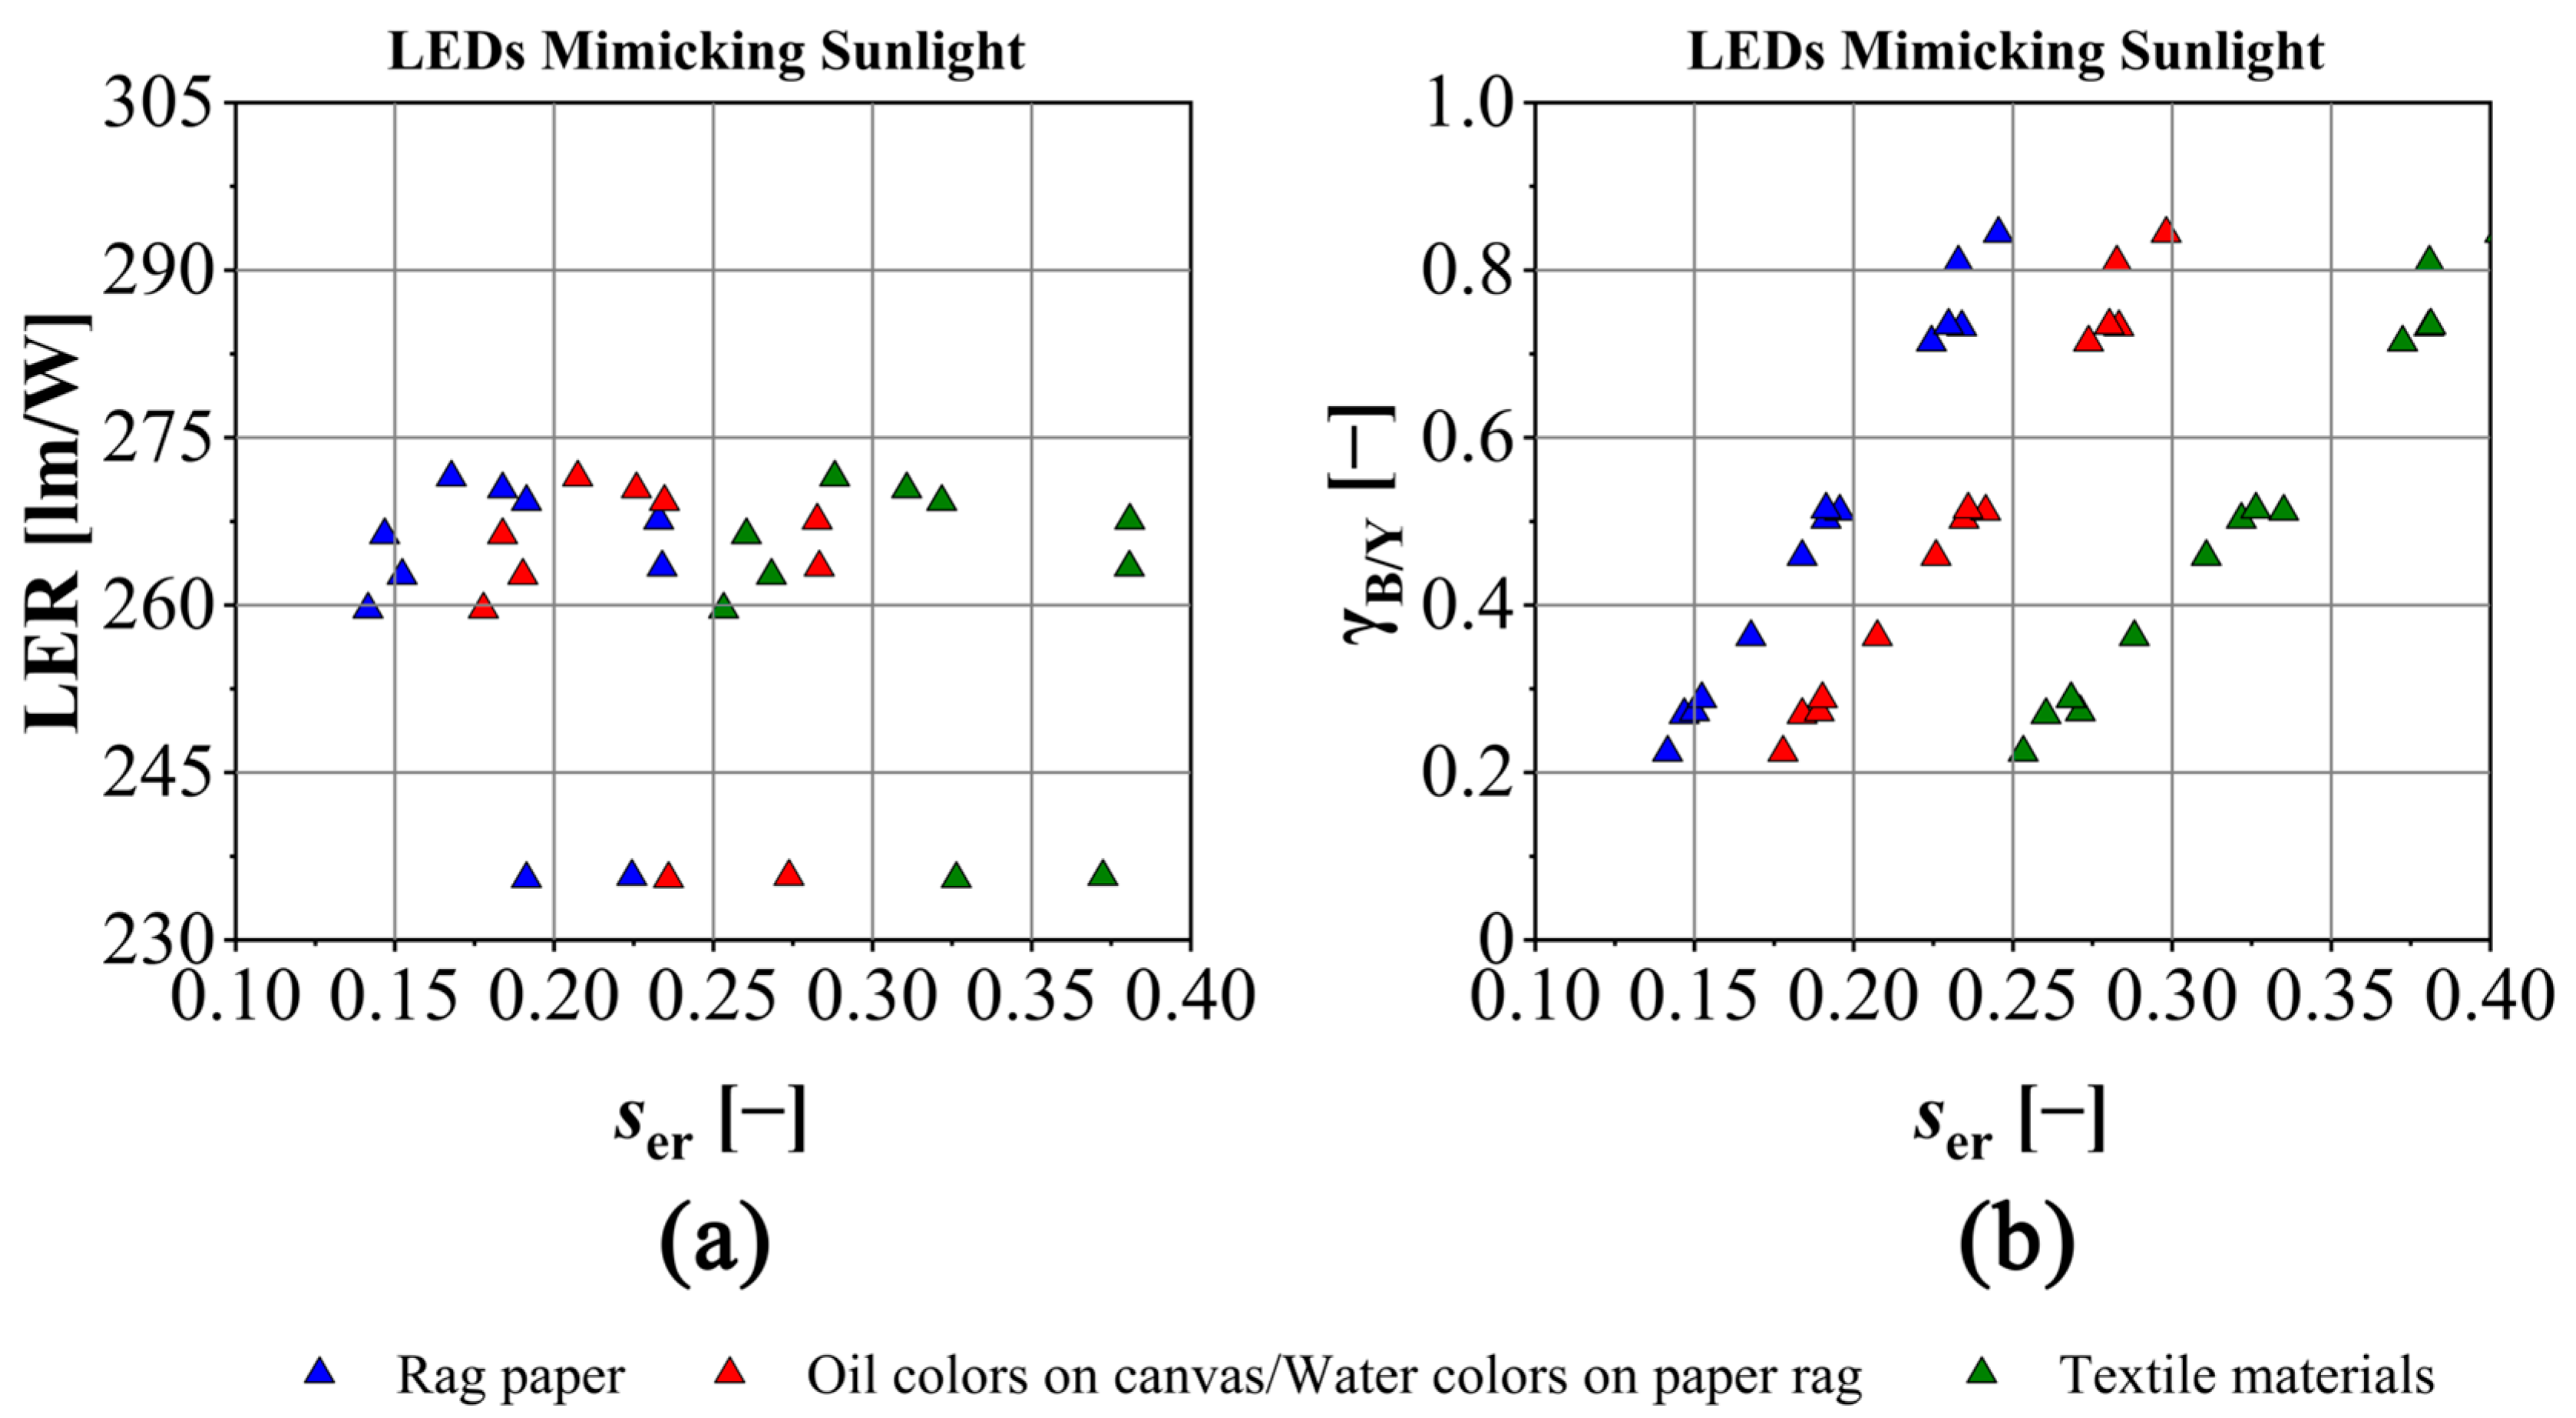
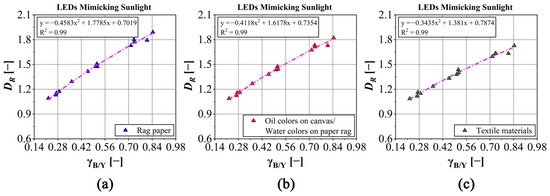
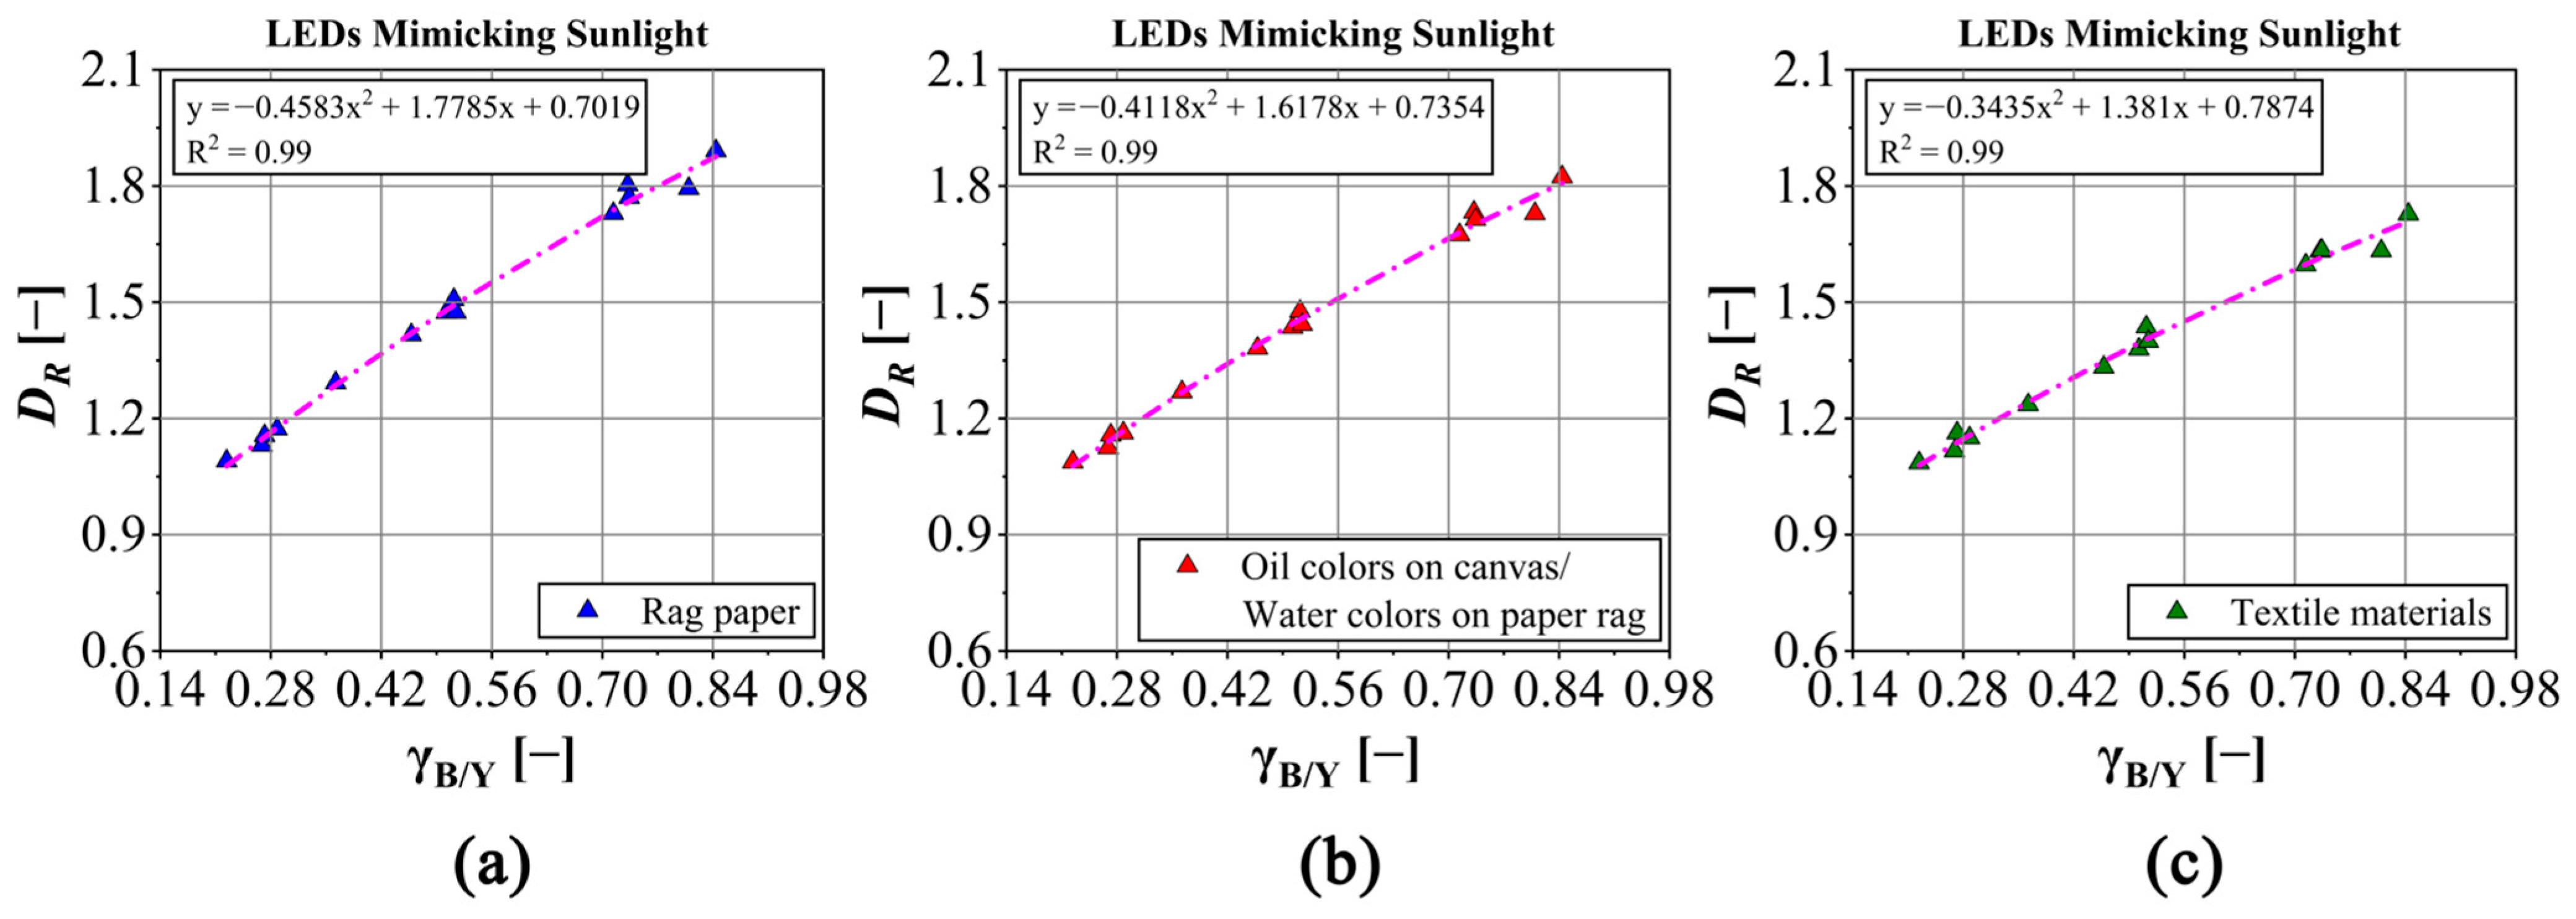

Disclaimer/Publisher’s Note: The statements, opinions and data contained in all publications are solely those of the individual author(s) and contributor(s) and not of MDPI and/or the editor(s). MDPI and/or the editor(s) disclaim responsibility for any injury to people or property resulting from any ideas, methods, instructions or products referred to in the content. |
© 2026 by the authors. Licensee MDPI, Basel, Switzerland. This article is an open access article distributed under the terms and conditions of the Creative Commons Attribution (CC BY) license.