


Featured Application
The proposed trajectory reconstruction framework extends the applicability of consumer-grade GNSS devices by improving the quality of degraded spatial and temporal data. Beyond recreational sports monitoring, the methodology may support mobile health applications, intelligent fitness platforms, outdoor navigation analysis, human mobility studies, and large-scale movement data analytics where accurate positioning must be obtained from inexpensive wearable sensors and smartphones.
Abstract
Global Navigation Satellite System (GNSS)-based measurements are widely used for sports monitoring and outdoor activity analysis; however, consumer-grade smartphones often produce degraded trajectories, inaccurate elevation profiles, and unreliable pace estimates. This study proposes a multi-stage framework for reconstructing low-fidelity GNSS running trajectories using an averaged high-fidelity wearable GNSS reference proxy. The framework combines activity-window selection, trajectory filtering and route-consistent projection, reference-based elevation correction, and pace reconstruction using two complementary approaches: a Linear Acceleration Influence Model and a Physics-Based Model. The methodology was validated using three high-fidelity and three low-fidelity recordings collected on a shared 5.726 km route. Within the common activity window, raw low-fidelity observations had a pooled nearest-route RMSE of 30.72 m, whereas retained route-consistent assignments had a residual RMSE of 14.84 m. Aggregate pace agreement improved from 2.40 to 1.74 min/km RMSE and from 32.84% to 25.46% MAPE. Raw smartphone elevation had a pooled RMSE of 190.27 m relative to the adopted reference profile, supporting reference-based elevation substitution. A constant-velocity Kalman RTS baseline reduced positional RMSE from 30.72 to 29.05 m (5.4%), whereas the complete route-association procedure eliminated severe backtracking that remained after distance thresholding alone. The proposed framework provides a transparent and reproducible solution for reconstructing sparse consumer-grade GNSS activities while preserving explicit uncertainty.
1. Introduction
Global Navigation Satellite System (GNSS) technologies have become an essential component of modern sports monitoring systems [1,2,3]. Running watches, fitness trackers, and smartphones routinely collect location, speed, distance, and elevation data, enabling athletes and coaches to quantify training loads and analyze performance in outdoor environments [3]. The widespread availability of consumer-grade wearable devices has significantly increased the accessibility of GNSS-based monitoring, allowing both professional and recreational athletes to record large amounts of movement data during everyday training sessions [2].
Despite their popularity, consumer-grade GNSS devices remain susceptible to measurement errors that may substantially affect the quality of recorded trajectories [2,4]. Signal degradation can occur due to satellite geometry, atmospheric disturbances, tree cover, urban infrastructure, multipath propagation, or limitations of the receiving hardware itself [2,4,5]. These factors often lead to positional inaccuracies, distorted elevation profiles, unrealistic speed fluctuations, and missing trajectory segments. Such problems are particularly evident in smartphones and low-cost wearable devices, where hardware constraints and power-saving mechanisms frequently reduce measurement fidelity [4,5].
The accuracy of GNSS measurements is especially important in outdoor sports applications, where derived parameters such as running pace, route geometry, elevation gain, and segment duration are used for performance assessment and training evaluation [4,6,7,8,9]. Numerous studies have investigated the reliability of wearable devices in measuring distance, speed, and physiological variables during physical activity [6,7,8]. Field-based studies conducted during hiking and trail running further indicate that the validity of wearable-device outputs may depend on both the device and the outdoor activity context [10]. While high-end sports watches generally provide satisfactory performance, considerable discrepancies have been reported between professional devices and consumer-grade smartphones operating under identical environmental conditions [4,7,8,11].
To improve the quality of GNSS measurements, researchers have proposed various approaches based on filtering, interpolation, sensor fusion, and machine learning techniques [5,12,13,14,15]. Kalman filtering and smoothing algorithms are commonly employed to reduce measurement noise, while more advanced methods combine information from multiple sensors, including inertial measurement units and barometric altimeters [5,12,13]. Accelerometers and inertial measurement units are also widely used to quantify movement under field conditions, although published protocols and study quality remain heterogeneous [16]. Although these approaches can reduce local positioning errors, they often focus on signal smoothing rather than the reconstruction of substantially degraded trajectories [5,14]. Existing map-matching algorithms are primarily intended to associate GNSS observations with known transportation networks rather than reconstruct free-running trajectories affected by severe signal degradation [15]. Furthermore, many existing methods require additional sensors or specialized hardware that may not be available in low-cost consumer devices [5,12,13].
An important challenge therefore remains: the recovery of meaningful trajectory information from incomplete or low-fidelity GNSS recordings [1]. Recent studies have also explored GNSS-independent trajectory reconstruction using inertial measurements and data-driven models, demonstrating the growing interest in recovering reliable trajectories under degraded positioning conditions [17]. In practical applications, users frequently rely on smartphones or entry-level wearable devices that generate trajectories containing positional noise, unrealistic elevation changes, or missing speed information [9]. The ability to reconstruct such data would significantly increase the usefulness of low-cost monitoring systems and improve the reliability of subsequent analyses based on recorded movement patterns [1]. Recent bibliometric evidence confirms the rapid expansion and increasing methodological diversity of GPS/GNSS–GIS research, including map-matching and AI-based techniques [18].
Although filtering and map-matching methods can improve positional consistency, they generally do not address the simultaneous reconstruction of route geometry, elevation profile, and running pace from sparse consumer-grade GNSS observations.
This study therefore proposes and evaluates a multi-stage framework for degraded GNSS trajectories collected during outdoor running. The framework combines activity-window selection, route-consistent trajectory association, reference-based elevation correction, and pace reconstruction using locally adaptive and physics-inspired models. It was evaluated using real-world running recordings acquired with high-fidelity wearable GNSS devices and low-fidelity smartphones. The objective was to determine whether the proposed workflow can recover spatial and temporal characteristics of degraded activities under practical field conditions.
2. Materials and Methods
This section describes the dataset, construction of the high-fidelity reference proxy, preprocessing of low-fidelity recordings, spatial and elevation reconstruction, pace-estimation models, and the comparative validation protocol. All processing stages were applied deterministically to the original GPX files without modifying the source recordings.
2.1. Dataset Description
The dataset consisted of GPX recordings collected during outdoor running on a shared route. Three high-fidelity wearable GNSS recordings were used to construct an averaged reference proxy, while three smartphone recordings were treated as low-fidelity inputs requiring filtering and reconstruction. To ensure temporal comparability, smartphone observations were restricted to a common activity window derived from the high-fidelity timestamps. The window extended from 30 s before the earliest reference start to 300 s after the latest reference end (25 May 2025, 09:02:24-09:43:55 UTC), allowing for device start and stop offsets. The full low-fidelity GPX files contained 699 timestamped observations, of which 224 fell within the common activity window and formed the validation population (LD1: 184; LD2: 8; LD3: 32). All remaining observations were preserved in the unmodified source files and were outside the defined analysis window. Manufacturer names are reported only here for methodological transparency; the Results section uses neutral identifiers LD1–LD3. Table 1 reports the full-file counts, analysis-window population, and reconstruction coverage.
Table 1.
Dataset quality, common activity-window population, and reconstruction coverage for primary low-fidelity recordings.
The three primary low-fidelity recordings (LD1–LD3) were selected to represent distinct degradation scenarios in sampling density, positional distortion, and trajectory completeness. The analysis was designed as a preliminary methodological evaluation rather than a population-level validation; therefore, the recordings should not be interpreted as evidence of generalizability across participants, devices, or environments.
2.2. Reconstruction Workflow
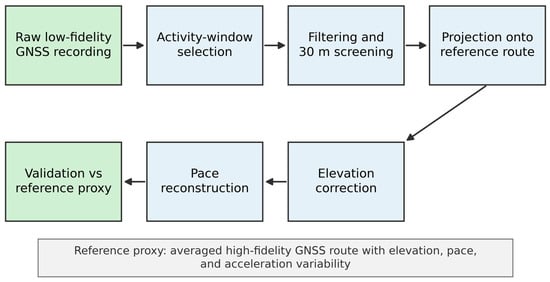
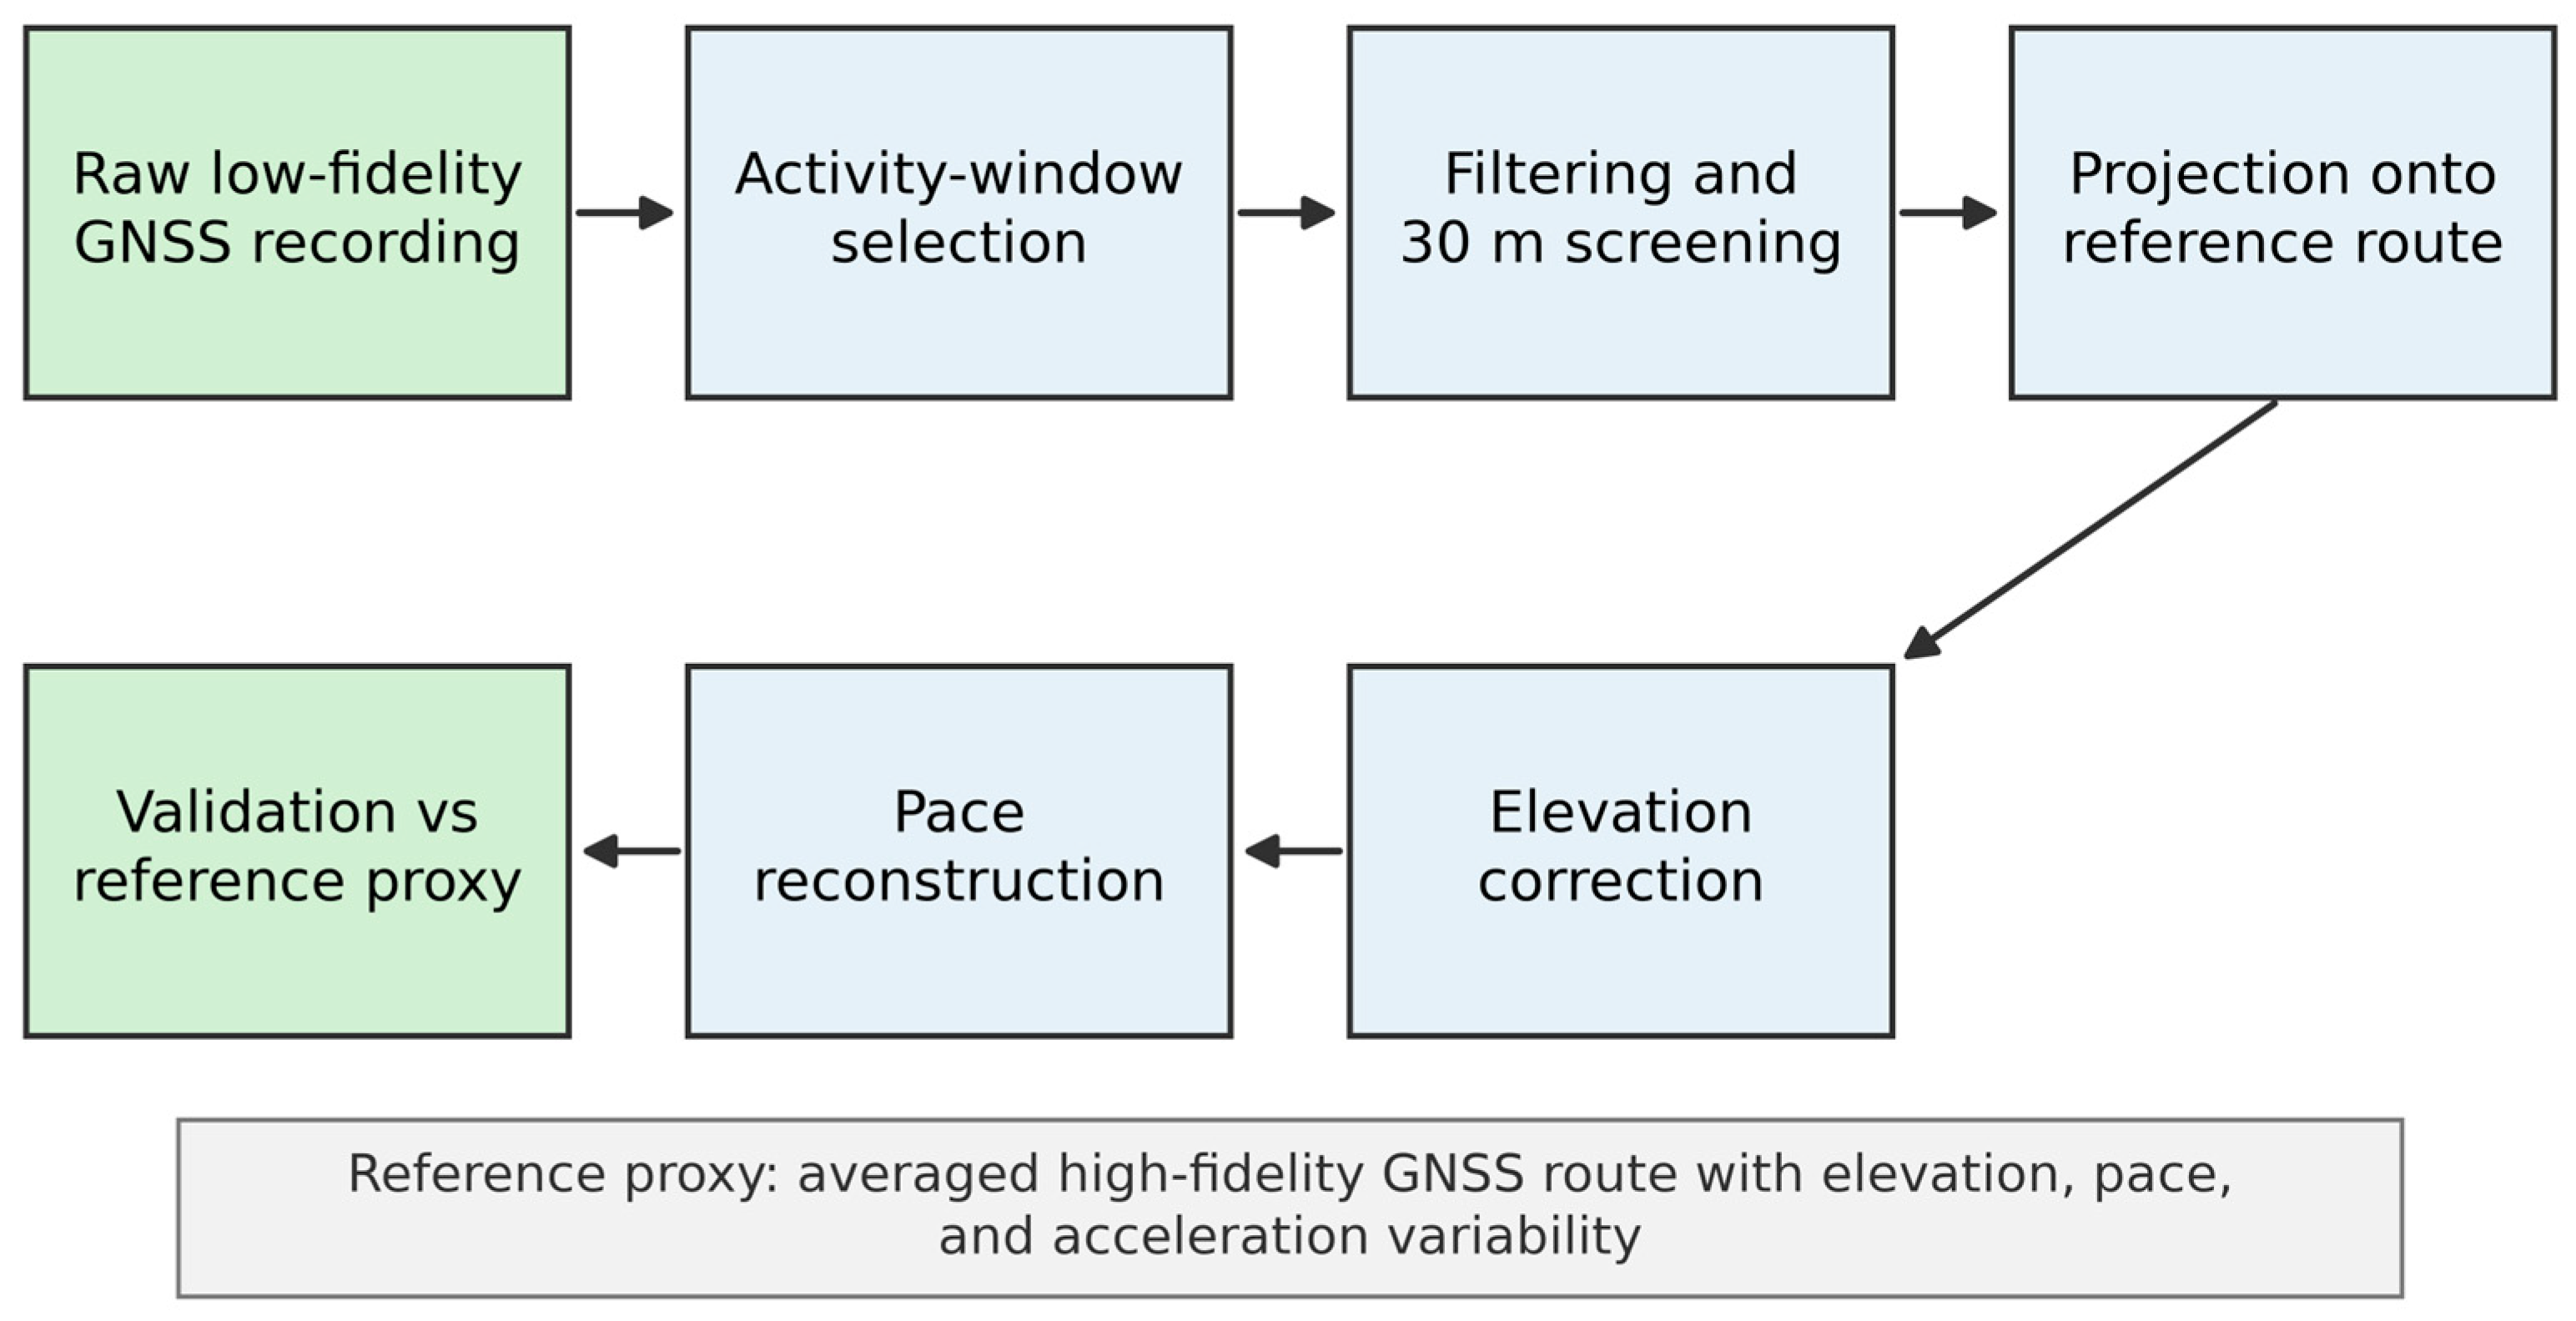
The proposed workflow separates data-quality screening from trajectory reconstruction. Smartphone points within the common activity window are filtered, associated with time-feasible checkpoints on the reference route, corrected in elevation using the reference profile, and then used to reconstruct pace through two complementary models. This separation is important because reconstruction coverage is not equivalent to reconstruction accuracy (Figure 1).
Figure 1.
Multi-stage workflow for GNSS trajectory reconstruction and validation.
2.3. GNSS Reference Device
Garmin Forerunner devices were selected as the higher-fidelity wearable GNSS reference platform because previous dynamic validation studies reported good positional and distance-measurement performance during outdoor activities [6,7,8]. Szot et al. [7] showed that newer multi-constellation receivers provided higher positioning accuracy than earlier GPS-only models, while Gilgen-Ammann et al. [8] reported accurate distance recording across positioning-enabled sports watches. These findings support using the Garmin-derived averaged trajectory as a high-fidelity consumer-grade reference proxy for evaluating lower-fidelity smartphone recordings; it is not treated as survey-grade ground truth.
2.4. Reference Track Construction
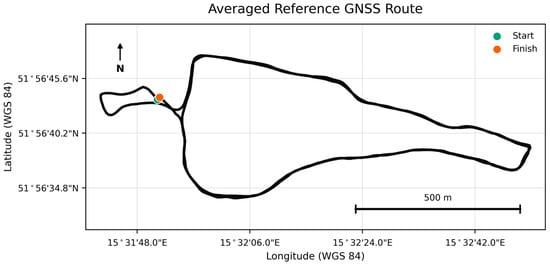
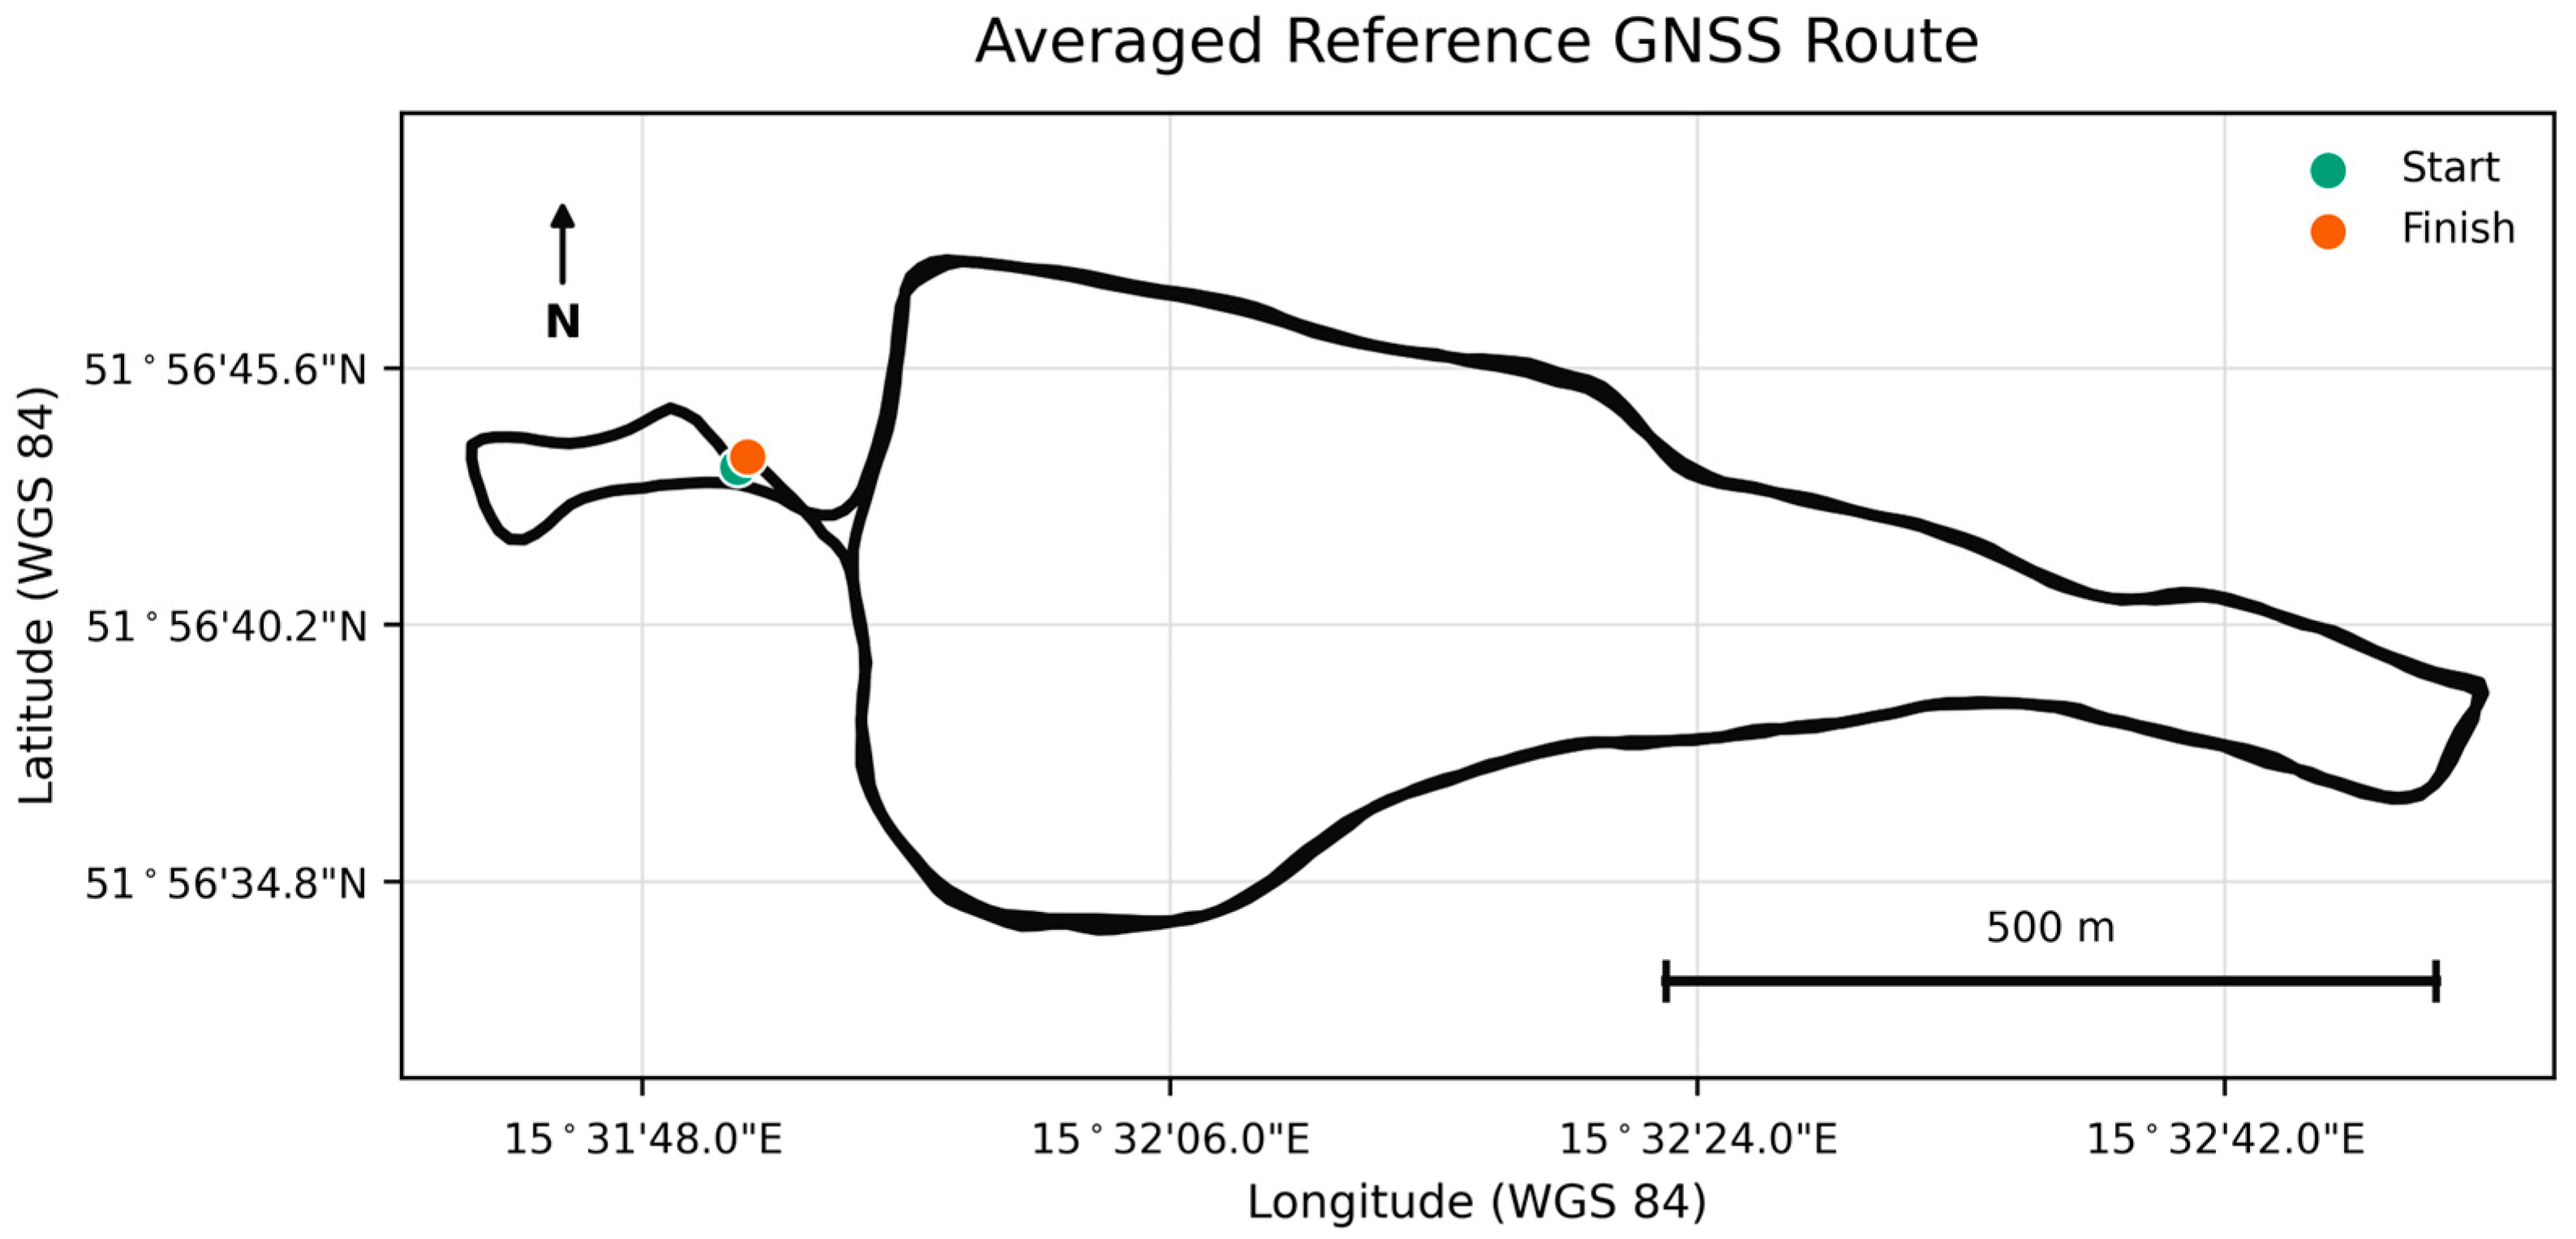
The reference route was derived from multiple Garmin Forerunner recordings, whose suitability as higher-fidelity wearable GNSS devices is supported by previous dynamic validation studies [6,7,8]. Each trajectory was distance-normalized, resampled to a common 574-checkpoint grid, and averaged point-by-point. The resulting route contains latitude, longitude, elevation, cumulative and segment distance, mean pace and speed, and elevation, pace, speed, and acceleration variability (Figure 2). The averaged trajectory was treated as a high-fidelity consumer-grade reference proxy rather than absolute geodetic ground truth. Consequently, all reported reconstruction errors quantify agreement relative to this proxy.
Figure 2.
Averaged reference GNSS route used for projection and validation.
2.5. Smartphone Track Filtering and Projection
Low-fidelity points were transformed to local metric coordinates and associated with reference checkpoints. Points whose nearest-route distance exceeded 30 m were rejected. For points within 30 m, the assignment cost combined spatial distance with deviation from route progress expected from elapsed time and mean reference speed. Successive assignments were allowed to backtrack by at most five checkpoints, while forward progress was limited to 7 m/s multiplied by the elapsed interval plus a 50 m margin. These deterministic constraints resolve the start/finish ambiguity of the loop-like route, where geographically adjacent start and finish coordinates could otherwise produce implausible checkpoint jumps. The threshold, speed bound, and margin are transparent engineering quality-control parameters rather than statistically optimized coefficients. Nearest-checkpoint projection is therefore one component of the integrated reconstruction framework rather than its principal methodological contribution. Only observations with valid coordinates and timestamps inside the common activity window were analyzed.
2.6. Elevation Correction
Raw smartphone elevation was evaluated against the mapped reference elevation. Because smartphone altitude readings showed systematic bias and instability, elevation reconstruction used the reference mean elevation profile with local variability represented by the reference standard deviation.
2.7. Pace Reconstruction and Uncertainty Modeling
Pace was reconstructed with two methods. Observed speed anchors were calculated from along-route distance divided by elapsed time between consecutive retained, route-consistent observations; raw point-to-point smartphone speed was not used because isolated coordinate jumps can produce implausible anchors. Anchors outside the declared 3–13 min/km range were discarded. Method 1 used local retained speed anchors modulated by the reference acceleration profile. Method 2 propagated speed using a physics-inspired acceleration prior. For each method, baseline, optimistic, and pessimistic variants were calculated to represent uncertainty around the acceleration prior. The pace limits were introduced as physiological plausibility constraints rather than coefficients fitted to the validation data.
2.8. Validation Metrics
Validation used mean error, standard deviation, MAE, RMSE, MAPE for pace, P95 error, outlier rate, and reconstruction coverage. Raw positional error was defined as nearest-route distance for every observation within the common activity window. Post-screening positional error was the residual distance from a retained observation to its assigned time-feasible checkpoint. Because retention is an integral quality-control stage, these summaries describe the input population and the retained output population and were not treated as a paired point-by-point effect. Raw elevation was compared with reference elevation at retained checkpoints. Pace was evaluated as agreement with the averaged high-fidelity reference pace profile. Model-estimated final times are reconstruction outputs rather than independently observed finish times. The pace outlier criterion was an absolute segment error greater than two times the reference pace standard deviation plus 0.5 min/km.
The statistical evaluation performed in the present study was descriptive and error-based. No formal hypothesis tests were conducted to establish statistical significance between reconstruction methods. Accordingly, differences in MAE, RMSE, MAPE, and related metrics are interpreted as descriptive differences in reconstruction performance rather than statistically significant effects. Group-level statistical inference was not performed because the three low-fidelity recordings represent individual reconstruction scenarios rather than a sufficiently large independent participant sample.
2.9. Comparative Baseline and Robustness Analyses
To distinguish the contribution of the proposed integrated workflow from generic smoothing and route-association effects, four complementary analyses were conducted. These included a constant-velocity Kalman baseline, an ablation of spatial and progression constraints, threshold-sensitivity and reference-stability analyses, and a focused comparison with sequence-aware route-association methods.
2.9.1. Constant-Velocity Kalman Baseline
To provide a quantitative comparison with a standard deterministic trajectory-estimation method, a two-dimensional constant-velocity (CV) Kalman filter was implemented in local metric coordinates. The state vector comprised planar position and velocity, [x, y, vx, vy]T, and the state-transition matrix was recalculated from the actual interval between successive GPX timestamps. Position measurements were used directly in the observation update. The measurement standard deviation was fixed at 15.0 m and the process-acceleration standard deviation at 1.5 m/s2. These parameters were specified before evaluation and were not optimized against the reference-route errors. The state was reinitialized after temporal gaps longer than 60 s.
Two Kalman outputs were evaluated: the causal constant-velocity Kalman filter and an offline Rauch–Tung–Striebel (RTS) smoother applied to the forward-filtered states. Raw, filtered, and smoothed coordinates were evaluated on exactly the same 224 valid activity-window observations. Position error was calculated as the Euclidean distance in local metric coordinates to the nearest checkpoint of the averaged high-fidelity reference proxy. MAE, RMSE, P95 error, maximum error, and the percentage of errors exceeding 30 m were reported.
2.9.2. Route-Association Ablation
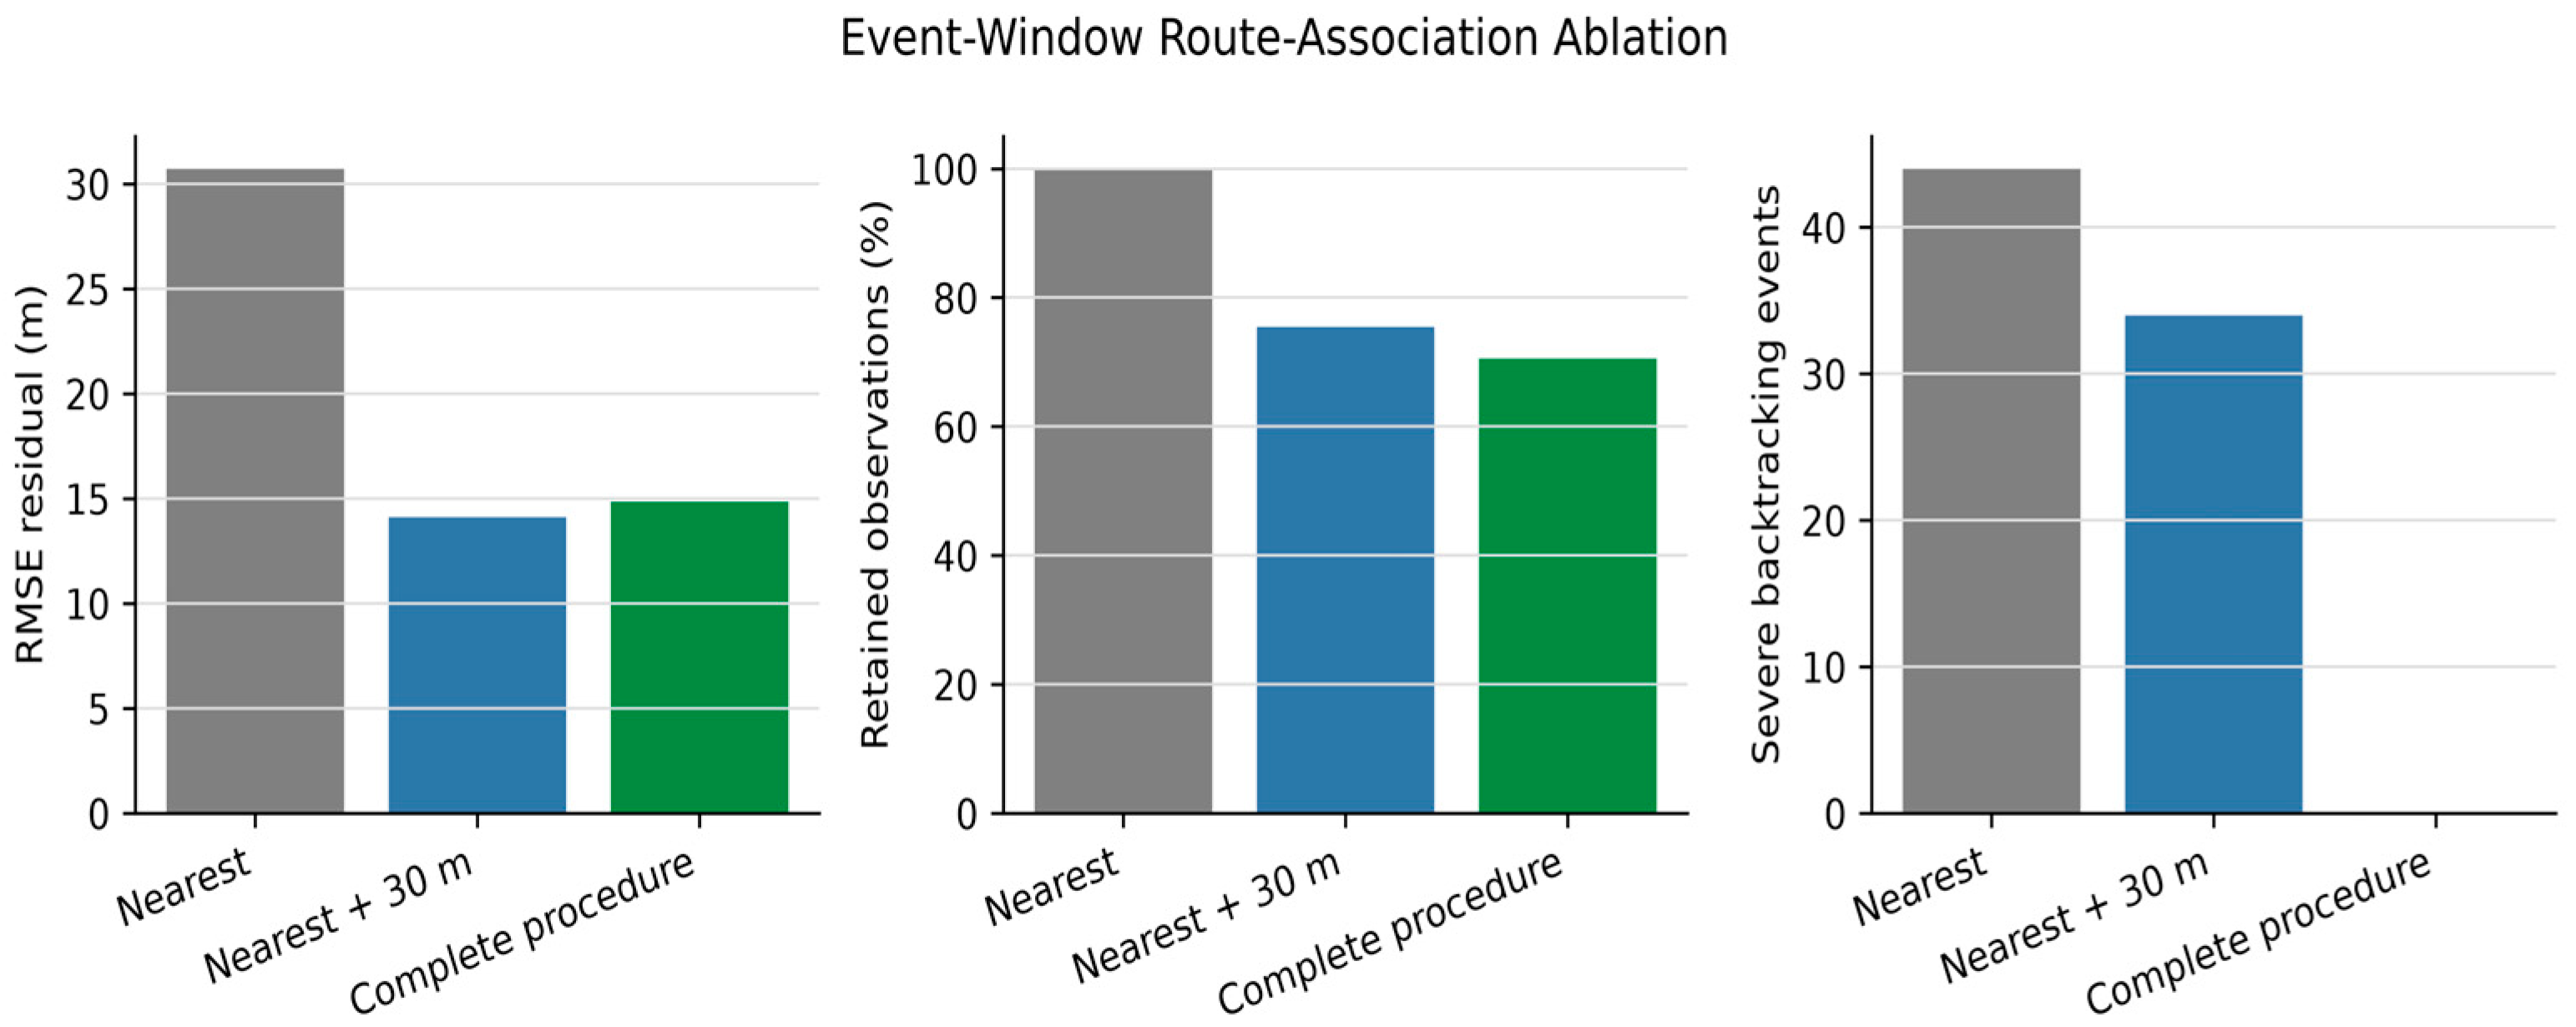
A route-association ablation was additionally performed to separate the contributions of spatial thresholding and route-progression control. Three configurations were compared: naive nearest-checkpoint association; nearest-checkpoint association with the 30 m distance threshold; and the complete proposed procedure combining the threshold with temporal route-consistency filtering. A severe backtracking event was defined as a decrease of more than five reference checkpoints between successive retained observations. Retention, unique reference checkpoints, residual position error, backtracking events, and large forward jumps were quantified.
2.9.3. Sensitivity and Reference-Proxy Stability
Two descriptive robustness analyses were conducted. First, the spatial threshold was varied from 10 to 50 m in 10 m increments to evaluate the trade-off between observation retention, route coverage, and residual error. Second, leave-one-reference-recording-out analysis was used to assess the stability of the Garmin-derived proxy. Each of the three reference trajectories was held out in turn and compared with a mean reference constructed from the remaining two recordings. Nearest-route position and elevation disagreement were reported. These quantities represent inter-recording reference uncertainty and not absolute geodetic error.
2.9.4. Comparative Sequence-Aware Route-Association Benchmark
A focused route-association benchmark was conducted on the same 224 chronological low-fidelity observations within the common activity window. Four nonredundant configurations were selected for the main comparison: (i) independent nearest-checkpoint association as the pointwise geometric baseline; (ii) Hidden Markov Model (HMM) map matching decoded using the Viterbi algorithm; (iii) deterministic monotonic dynamic-programming alignment; and (iv) the proposed quality-controlled framework. The previously reported 30 m threshold and Kalman RTS configurations were retained as complementary ablation and smoothing analyses, respectively, but were not duplicated in the focused four-method table.
The HMM state space comprised the 574 ordered checkpoints of the reference route. For each observation, the 40 geometrically nearest checkpoints were retained as candidate states. Emission costs were calculated from point-to-checkpoint distance using a Gaussian model with a fixed standard deviation of 20 m. Transition costs jointly penalized disagreement between along-route progress, progress expected from elapsed time and reference mean speed, and displacement between consecutive observations. Backward transitions exceeding five checkpoints received a strong penalty, and the complete state sequence was obtained by Viterbi decoding [14,15].
The deterministic monotonic alignment baseline minimized cumulative point-to-checkpoint distance under a non-decreasing checkpoint-order constraint. It assigned one checkpoint to every observation but did not include an explicit timing model. The proposed framework combined the 30 m spatial threshold with time-feasible route progression. Candidate transitions were required to remain within the five-checkpoint backward tolerance and could not exceed 7.0 m/s multiplied by the elapsed interval plus a 50 m progression margin. All benchmark parameters were fixed before comparison of the reported outcomes and were not optimized against residual error.
The operational comparison included observation retention, assigned-checkpoint RMSE, P95 residual, severe backtracking events, and forward jumps exceeding 50 checkpoints. Residuals were calculated from each original low-fidelity coordinate to the reference checkpoint assigned by the evaluated method. Because independent nearest-neighbor association minimizes geometric residual by construction and because the proposed procedure may reject observations, the metrics were interpreted jointly. A paired comparison was additionally performed on the identical 158-observation subset retained by the proposed framework. The assigned-checkpoint residual represents agreement with the adopted reference proxy and is not an absolute geodetic error or checkpoint-index ground truth.
3. Results
The results are reported in four complementary dimensions: data quality and reconstruction coverage, spatial and elevation accuracy, pace and terrain-related reconstruction, and comparative robustness against alternative processing configurations. Reconstruction coverage and reconstruction accuracy are reported separately because the proportion of estimated checkpoints does not constitute an accuracy measure.
3.1. Raw Data Quality and Reconstruction Coverage
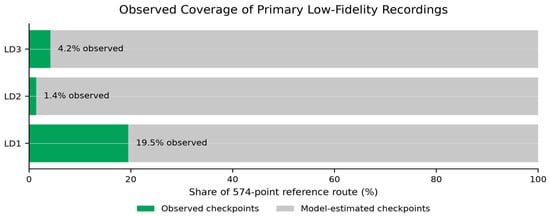
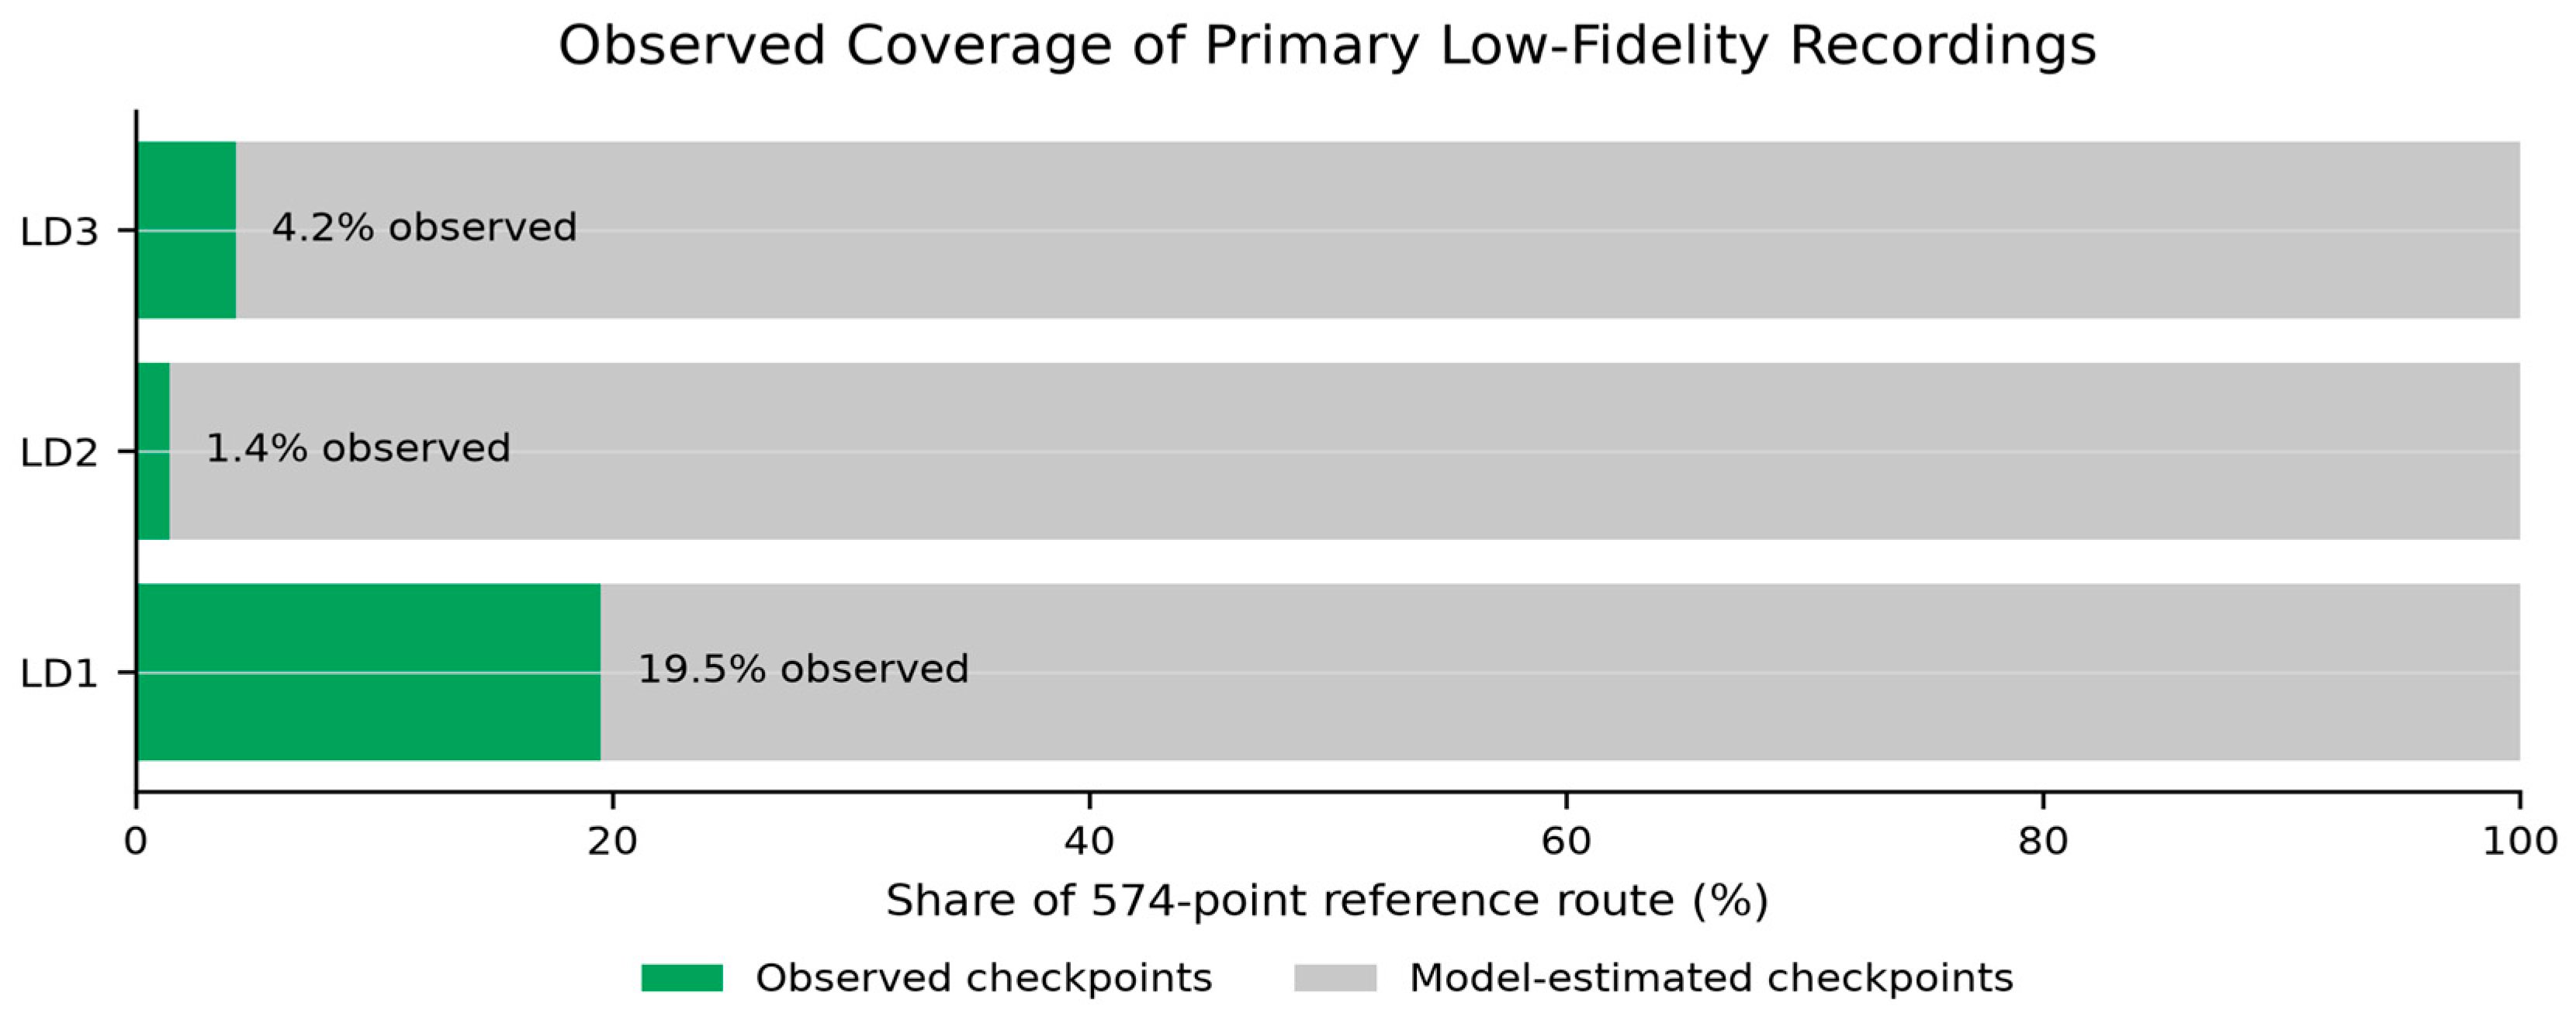
The common activity window contained 184 observations for LD1, 8 for LD2, and 32 for LD3. The complete procedure retained 118, eight, and 32 observations, respectively. These retained observations represented 112 (19.5%), eight (1.4%), and 24 (4.2%) unique checkpoints of the 574-point route. Consequently, 80.5%, 98.6%, and 95.8% of the reference checkpoints required model-based reconstruction. These percentages quantify reconstruction coverage, not accuracy (Figure 3).
Figure 3.
Observed versus model-estimated reference checkpoints for primary low-fidelity recordings.
3.2. Accuracy Metrics Summary
The main validation evidence is summarized in Table 2. Within the common activity window, raw observations had a pooled nearest-route RMSE of 30.72 m and MAE of 21.91 m, whereas retained route-consistent assignments had residual values of 14.84 and 12.60 m, respectively. Aggregate pace agreement improved from 2.40 to 1.74 min/km RMSE and from 32.84% to 25.46% MAPE. The large raw elevation discrepancy supported reference-based elevation correction; its non-independent post-correction status is specified in the table note.
Table 2.
Accuracy metrics comparing raw low-fidelity recordings with filtered, corrected, or reconstructed outputs.
3.3. Statistical Validation by Recording
Per-recording statistical validation is reported separately for positional, elevation, and pace domains (Table 3a–c). Positional and elevation errors are expressed in meters, whereas pace errors are expressed in min/km and MAPE in percent. Because positional error was defined as a non-negative Euclidean distance, its mean equals the positional MAE. For LD3, the two methods converged under sparse observations and differ only beyond the displayed precision. Table 3a–c reports recording-level validation for three different reconstruction domains and should not be interpreted interchangeably. Table 3a evaluates horizontal route-association residuals after filtering and projection, Table 3b evaluates disagreement between raw smartphone altitude and the reference elevation assigned at retained checkpoints, and Table 3c evaluates reconstructed pace against the reference pace profile.
Table 3.
(a) Recording-level horizontal position error after filtering and sequence-consistent projection onto the reference route. (b) Recording-level raw smartphone elevation error relative to the reference elevation at retained route checkpoints. (c) Recording-level pace-reconstruction error for the baseline variants of Method 1 (M1) and Method 2 (M2).
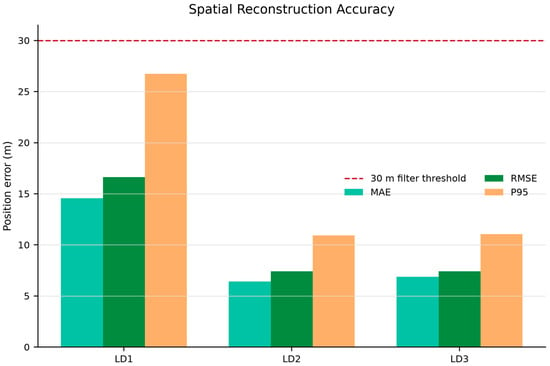
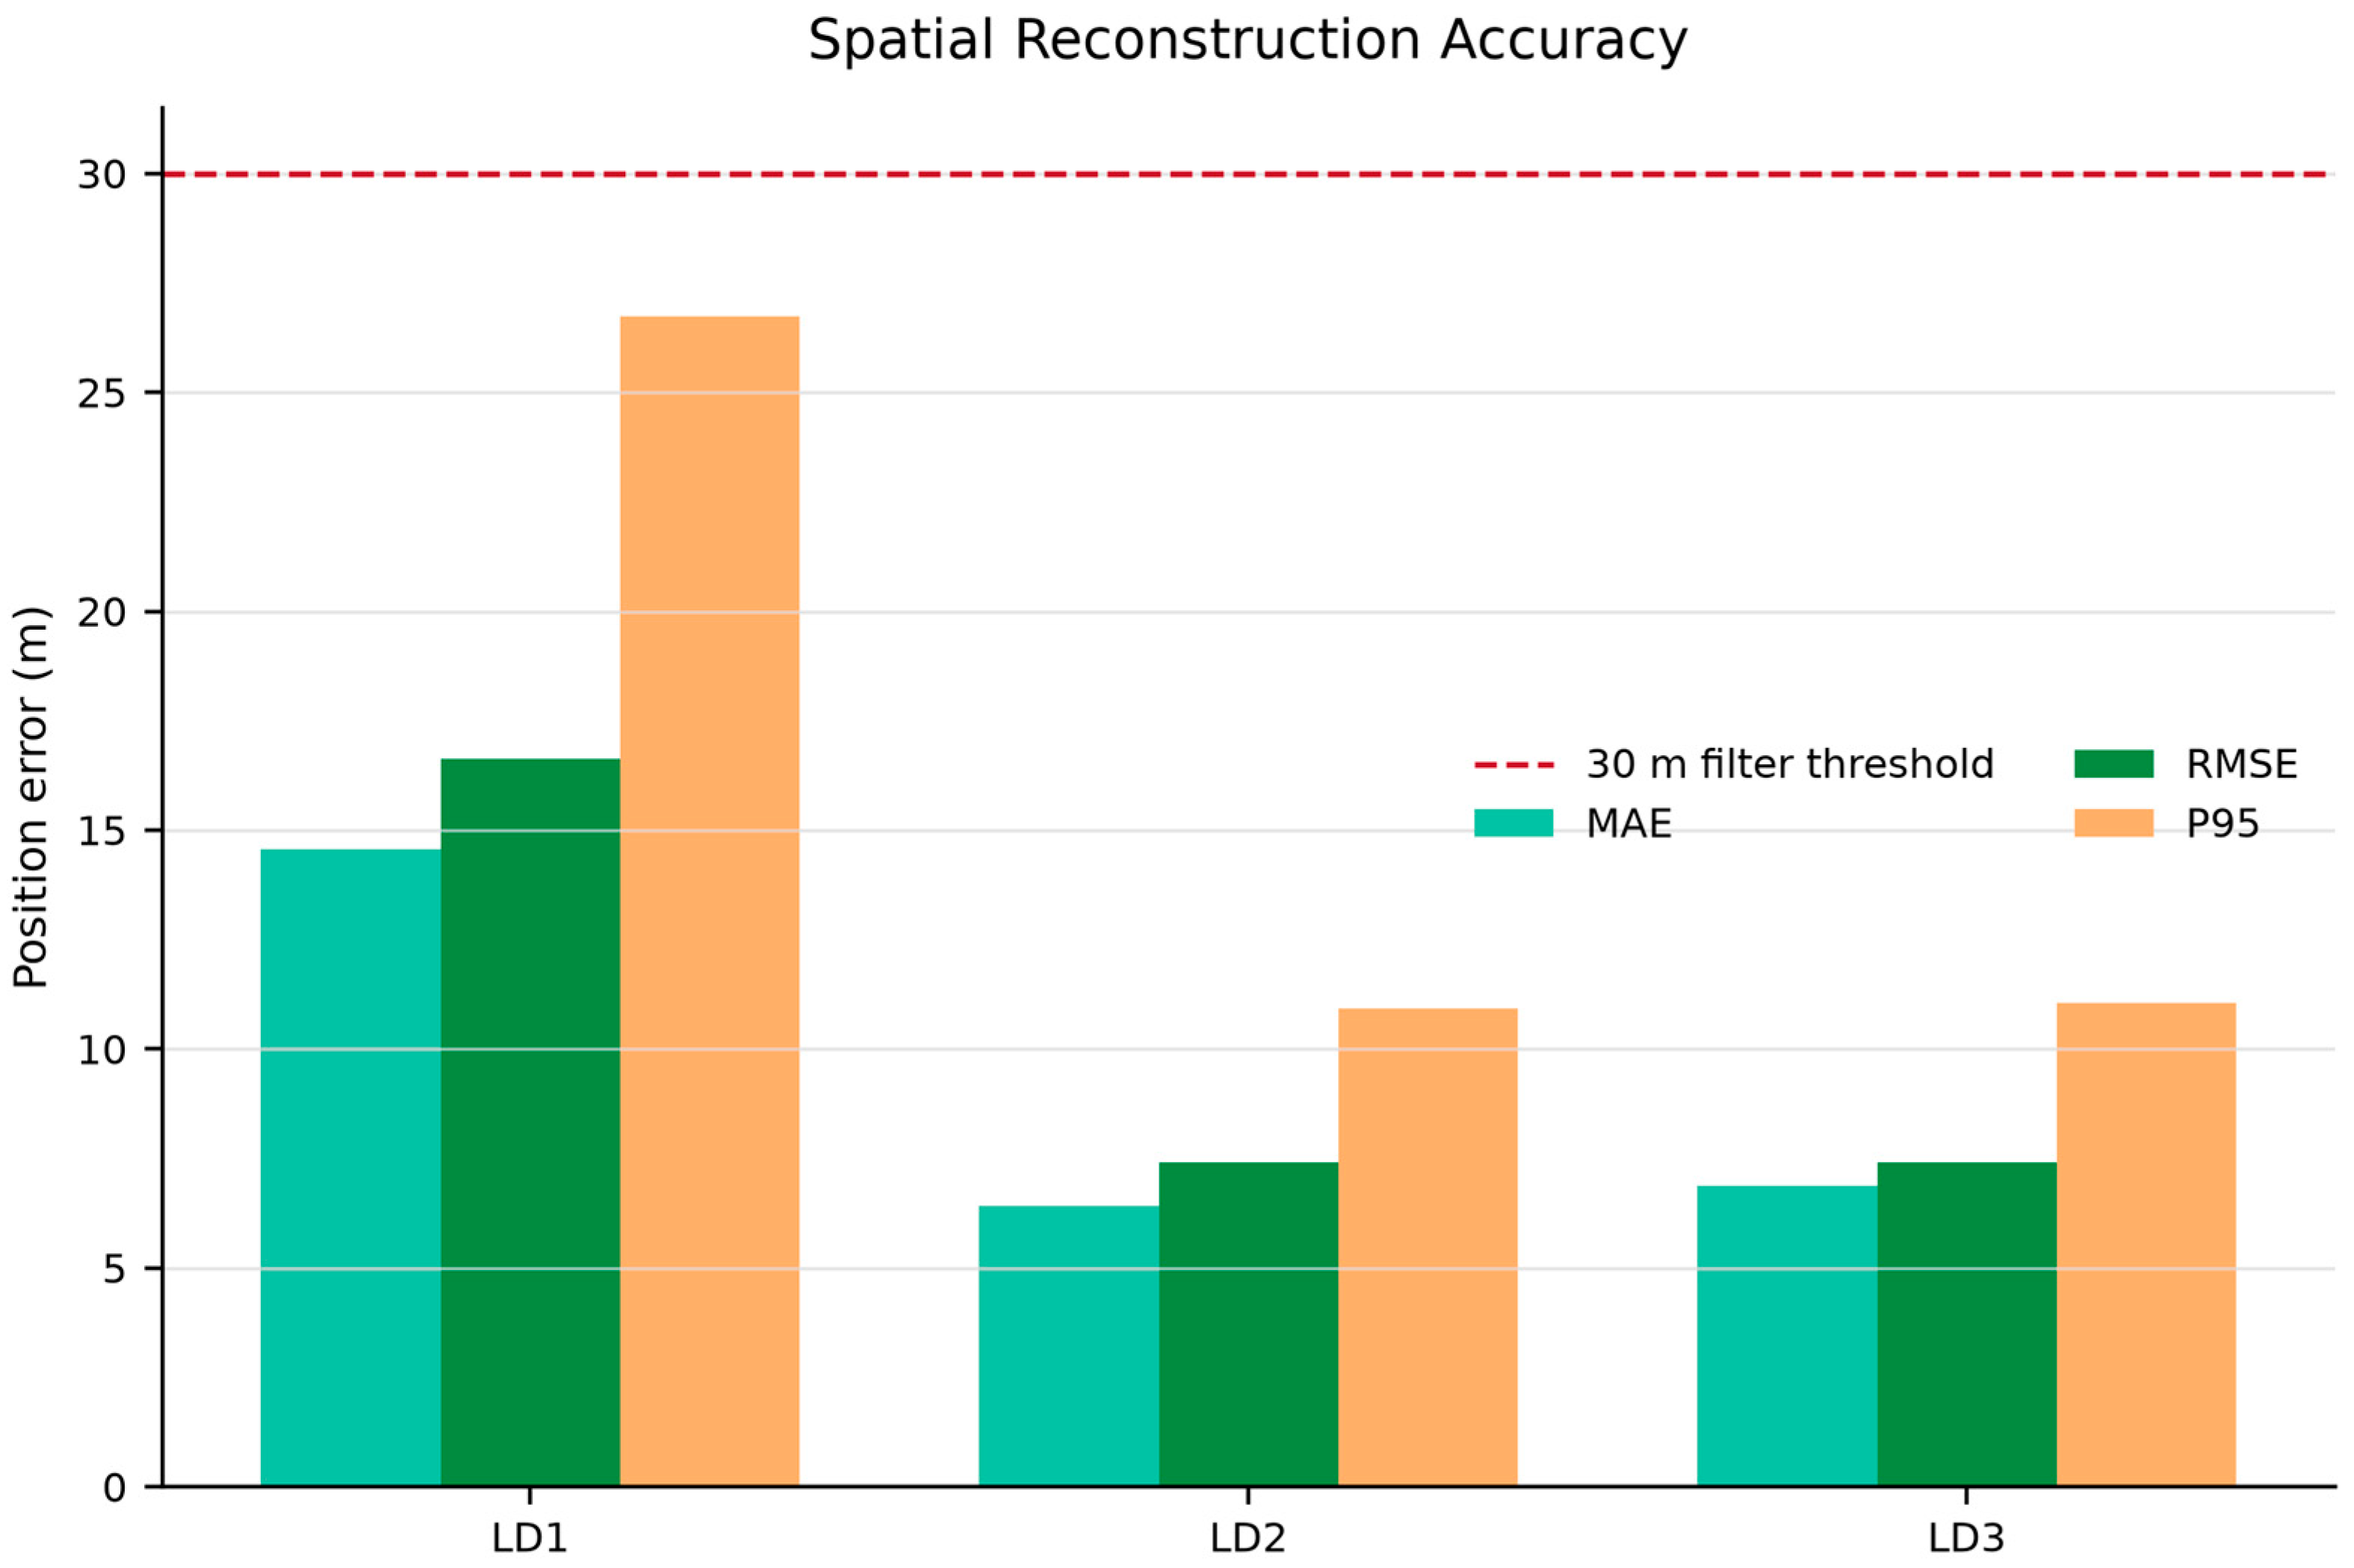
Table 3a shows that LD1, despite providing the largest retained sample, had the highest residual position error (RMSE 16.63 m; P95 26.75 m). LD2 and LD3 produced lower RMSE values of 7.42 and 7.41 m, respectively, although LD2 was represented by only eight observations. Thus, sampling density alone did not determine residual spatial accuracy.
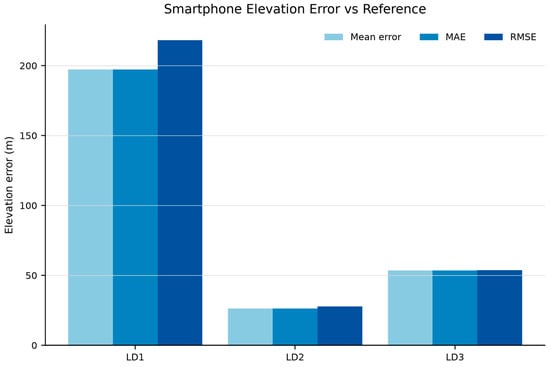
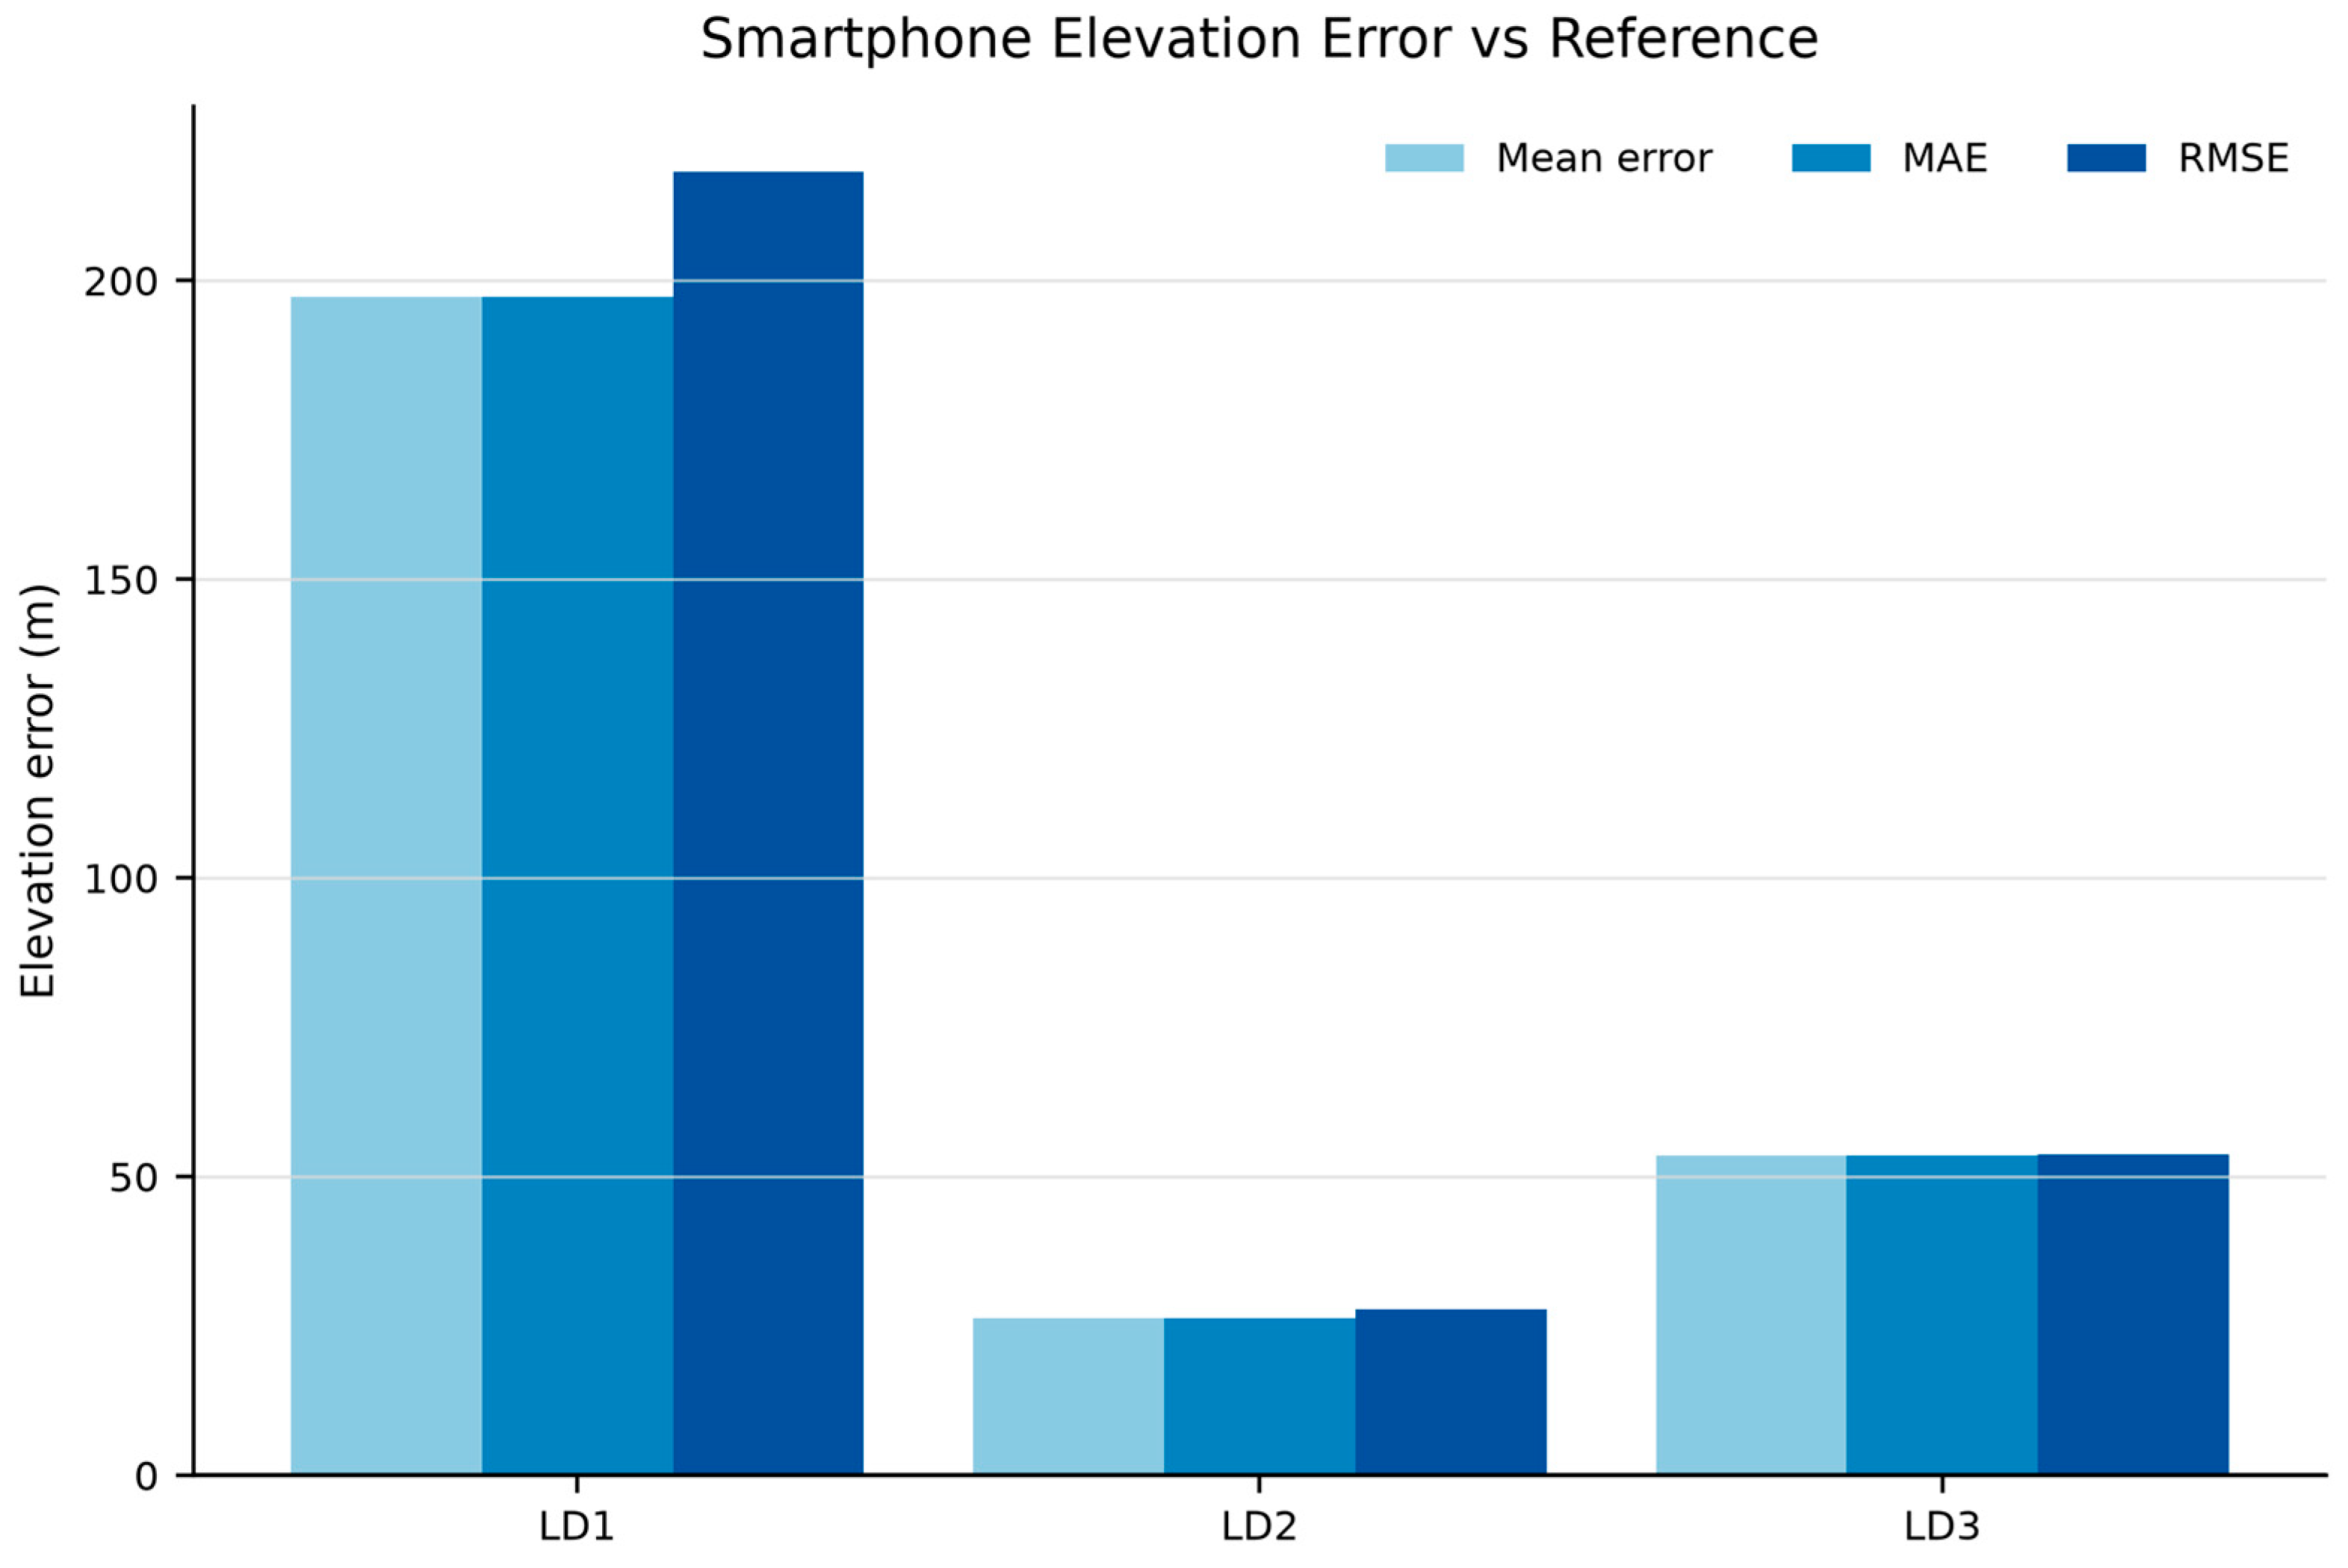
Table 3b demonstrates systematic positive elevation bias in all three recordings. The discrepancy was particularly large for LD1 (bias 197.27 m; RMSE 218.27 m), while LD2 and LD3 showed RMSE values of 27.85 and 53.79 m. These results justify replacing raw smartphone altitude with the reference elevation profile for terrain-dependent analysis; they do not constitute independent validation of the substituted elevation.
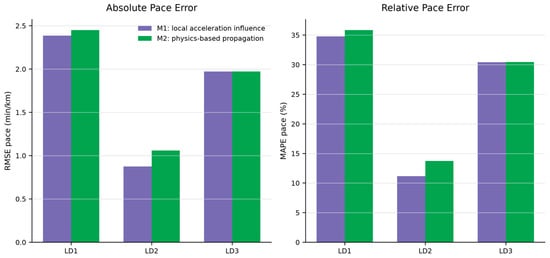
Table 3c indicates that M1 achieved lower or effectively equal baseline error in all three scenarios. The best agreement was obtained for LD2 (M1 RMSE 0.88 min/km; MAPE 11.18%), whereas LD1 and LD3 remained more challenging, with M1 MAPE values of 34.77% and 30.44%. For LD3, M1 and M2 converged to nearly identical results because sparse valid anchors and pace-clipping constraints dominated the reconstruction. M1 was therefore more accurate in the present recordings, whereas M2 remains relevant because of its smoother propagation over gaps.
3.4. Spatial Reconstruction and Projection Results
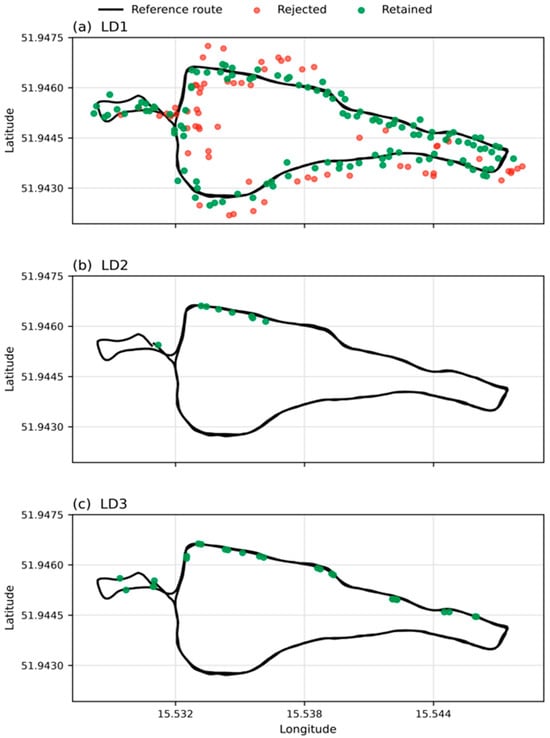
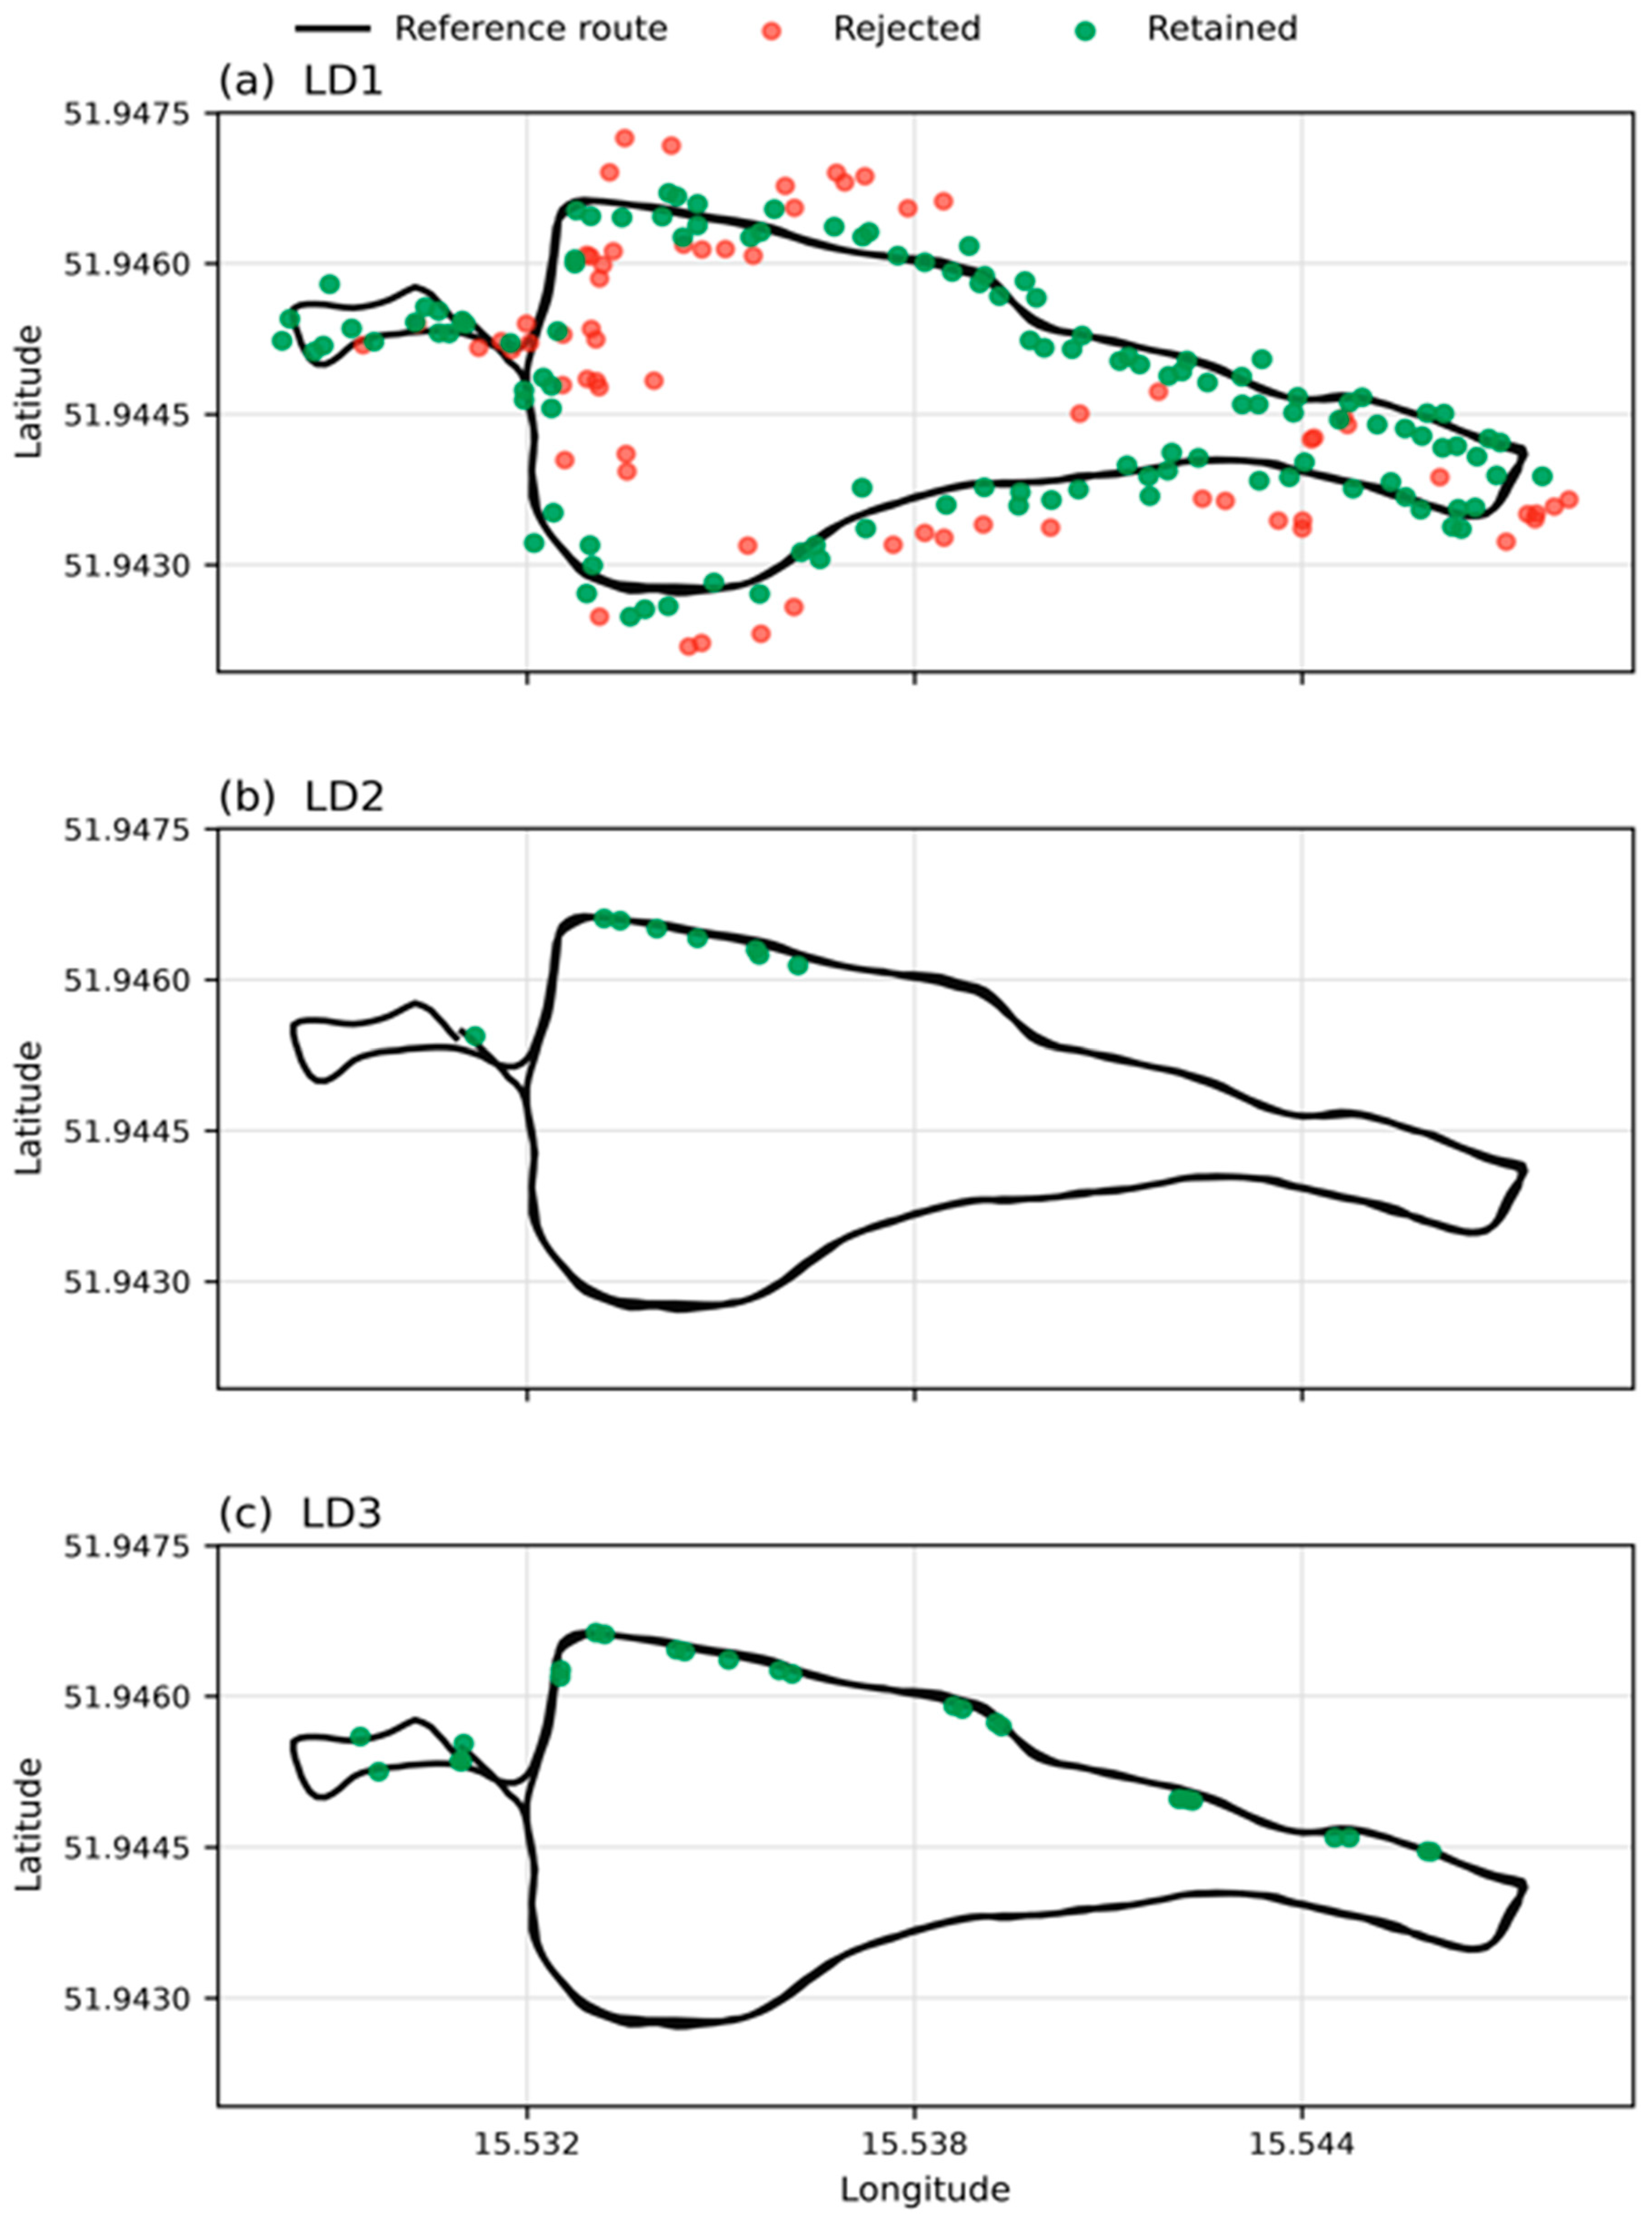
Retained smartphone points were compared with their assigned reference checkpoints. Spatial accuracy was summarized using MAE, RMSE, and P95 error (Table 3a). Figure 4 presents the retained and rejected route projections, whereas Figure 5 summarizes positional MAE, RMSE, and P95 error.
Figure 4.
Projection of low-fidelity smartphone points onto the reference route. Green points were retained; red points were rejected.
Figure 5.
Spatial reconstruction accuracy expressed as MAE, RMSE, and P95 position error.
The projection patterns reveal distinct degradation mechanisms across the three recordings. LD1 provided the largest number of usable observations but also exhibited the greatest coordinate dispersion, whereas LD2 and LD3 were substantially sparser but their retained observations remained closer to the route. Thus, a larger number of recorded points did not necessarily translate into higher positional accuracy.
3.5. Elevation Correction Results
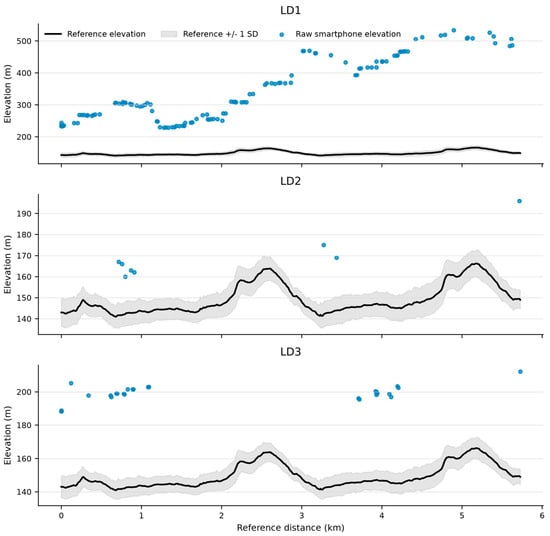
The elevation comparison confirmed that raw smartphone altitude was unsuitable for direct terrain-dependent analysis. The bias and RMSE quantify disagreement with the adopted reference profile and support the reference-based correction applied before terrain and pace interpretation (Figure 6 and Figure 7).
Figure 6.
Raw smartphone elevation error relative to the reference elevation profile.
Figure 7.
Raw smartphone elevation observations compared with the reference elevation profile and +/−1 SD reference band.
3.6. Pace Reconstruction Results
Both reconstruction methods were evaluated against the reference pace. Method 2 generally produced smoother behavior, while Method 1 remained more locally adaptive where low-fidelity speed anchors were available. Because direct smartphone coverage was sparse, method comparison should be interpreted through aggregate error metrics rather than isolated segment-level fluctuations. Baseline performance for both methods is reported in Table 3c.
The corresponding comparison of pace-reconstruction RMSE and MAPE is presented in Figure 8.
Figure 8.
Pace-reconstruction error comparison between Method 1 and Method 2 using RMSE and MAPE.
Across all recordings, M1 achieved lower or effectively equal RMSE and MAPE than M2, with the clearest difference observed for LD2. The nearly identical LD3 results indicate model convergence under sparse anchors and pace-clipping constraints rather than independent confirmation by two reconstruction approaches. M1 was therefore the more accurate baseline in this dataset, whereas the principal advantage of M2 was smoother propagation over observation gaps.
3.7. Uncertainty Analysis
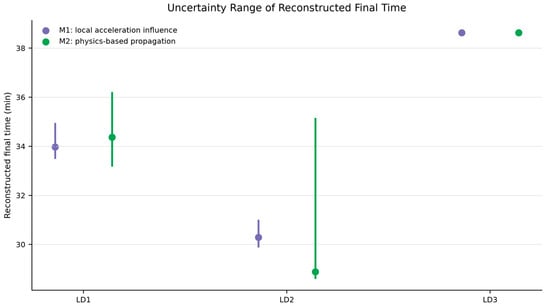
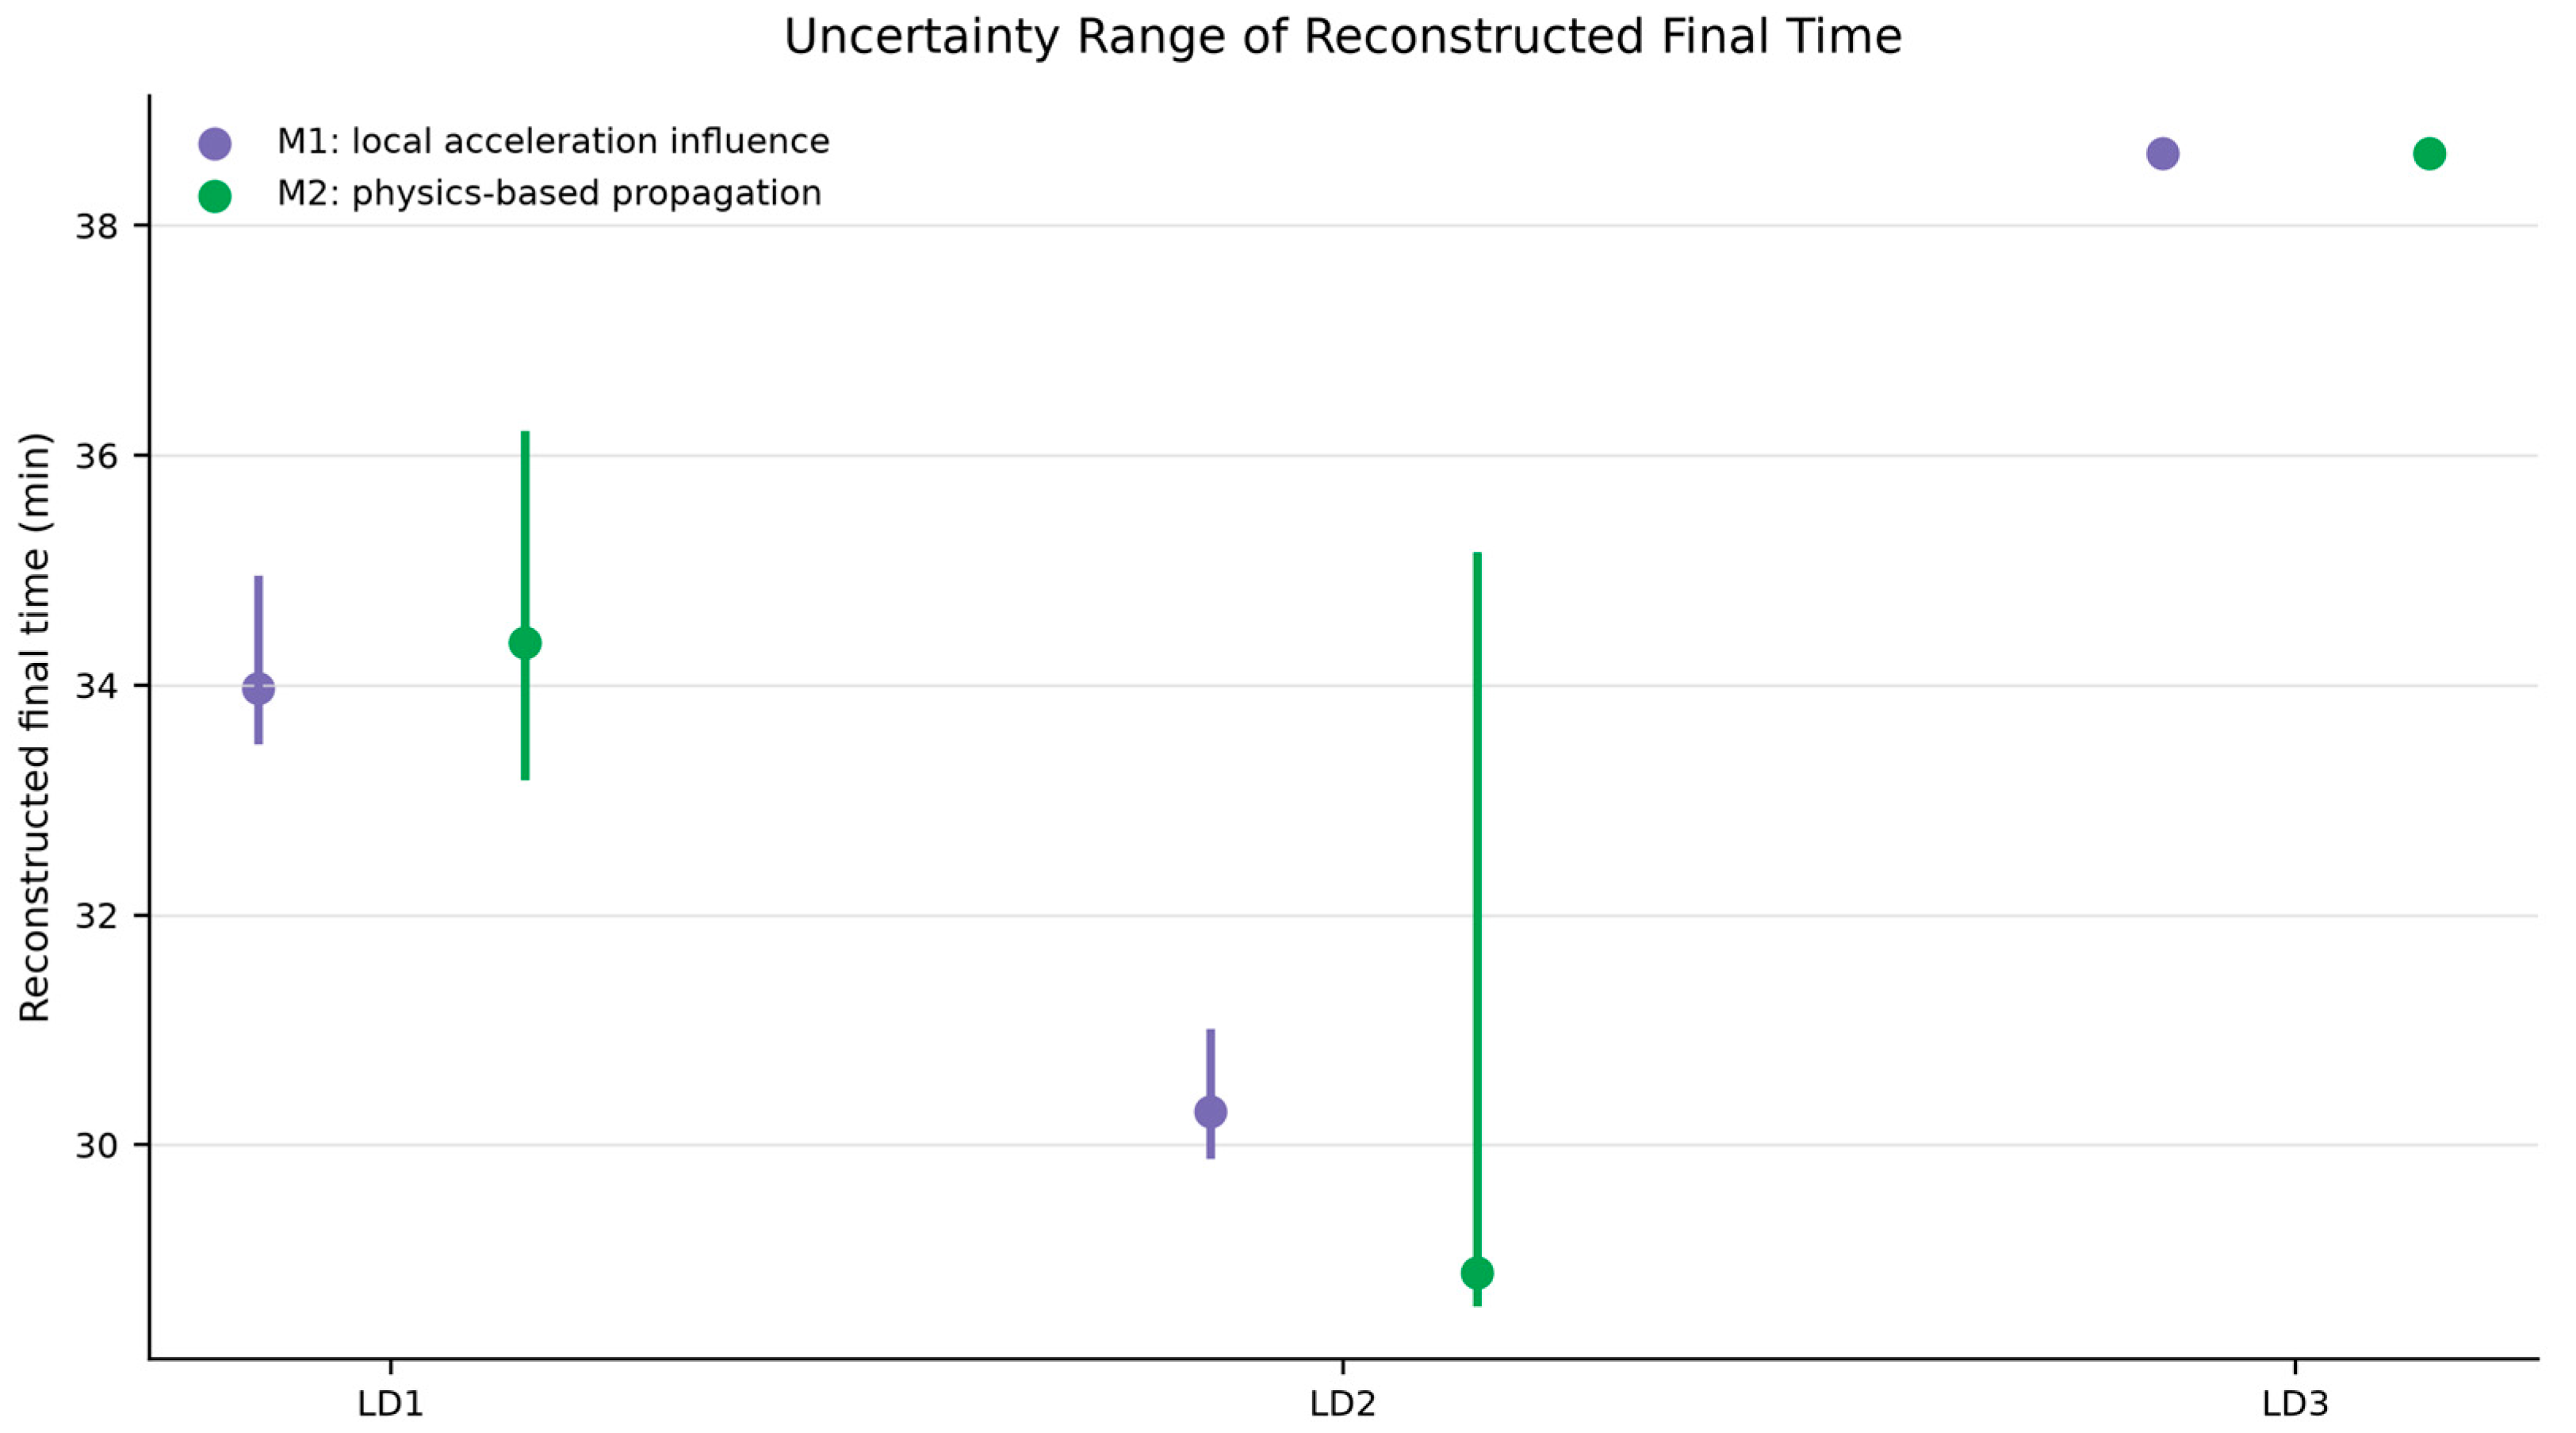
Optimistic and pessimistic variants represent reconstruction uncertainty around the reference acceleration prior. The spread between variants is useful for reporting sensitivity of final time and average pace, especially where low-fidelity observations are sparse (Table 4). For LD3, both methods and all three variants yielded the same final time of 38.63 min because sparse valid speed anchors and pace-clipping constraints dominated the perturbations of the acceleration prior.
Table 4.
Reconstructed final-time uncertainty across optimistic, baseline, and pessimistic variants.
The reconstructed final-time uncertainty ranges for both pace models are presented in Figure 9.
Figure 9.
Final-time uncertainty range for the two pace-reconstruction methods.
3.8. Terrain-Based Elevation and Pace Analysis
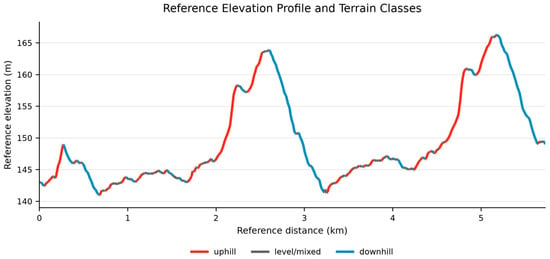
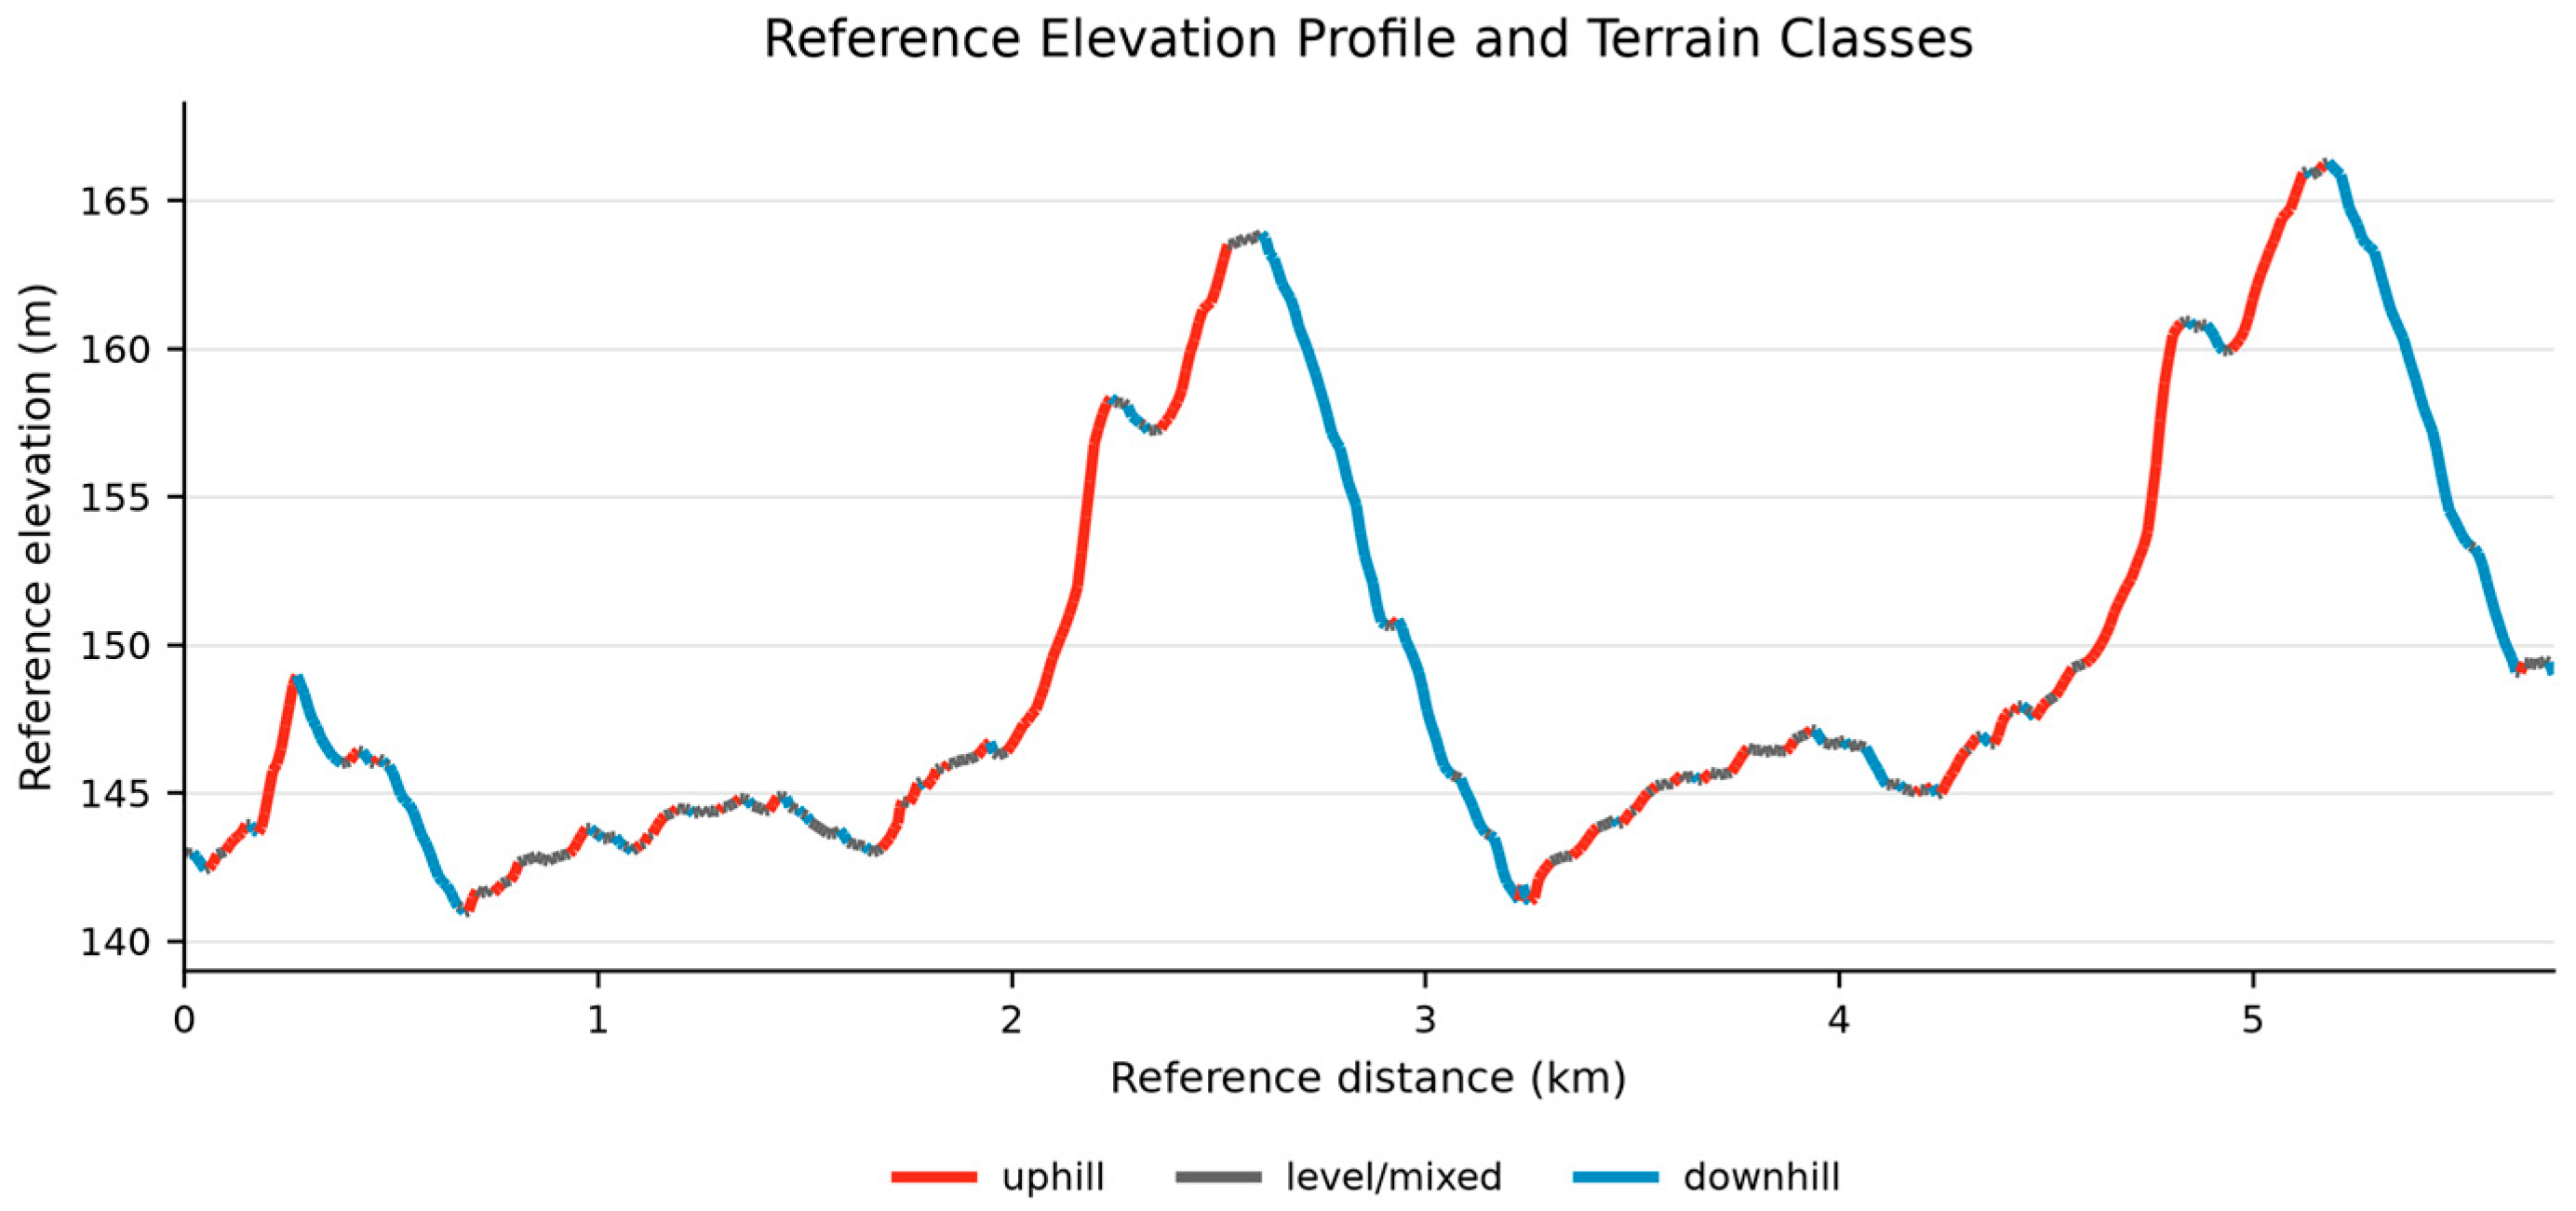
The corrected reference elevation profile was segmented into uphill, level/mixed, and downhill sections using local grade thresholds of +1% and −1%. This analysis links elevation reconstruction with the practical interpretation of running pace: once unreliable smartphone altitude is replaced by the reference elevation profile, pace can be interpreted in relation to terrain rather than only as an isolated time series (Figure 10, Table 5).
Figure 10.
Corrected reference elevation profile classified into uphill, level/mixed, and downhill terrain sections.
Table 5.
Terrain-based pace analysis using corrected elevation classes.
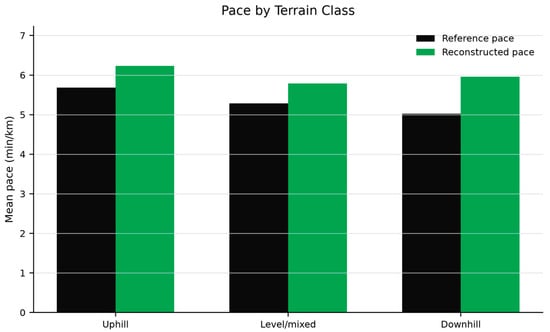
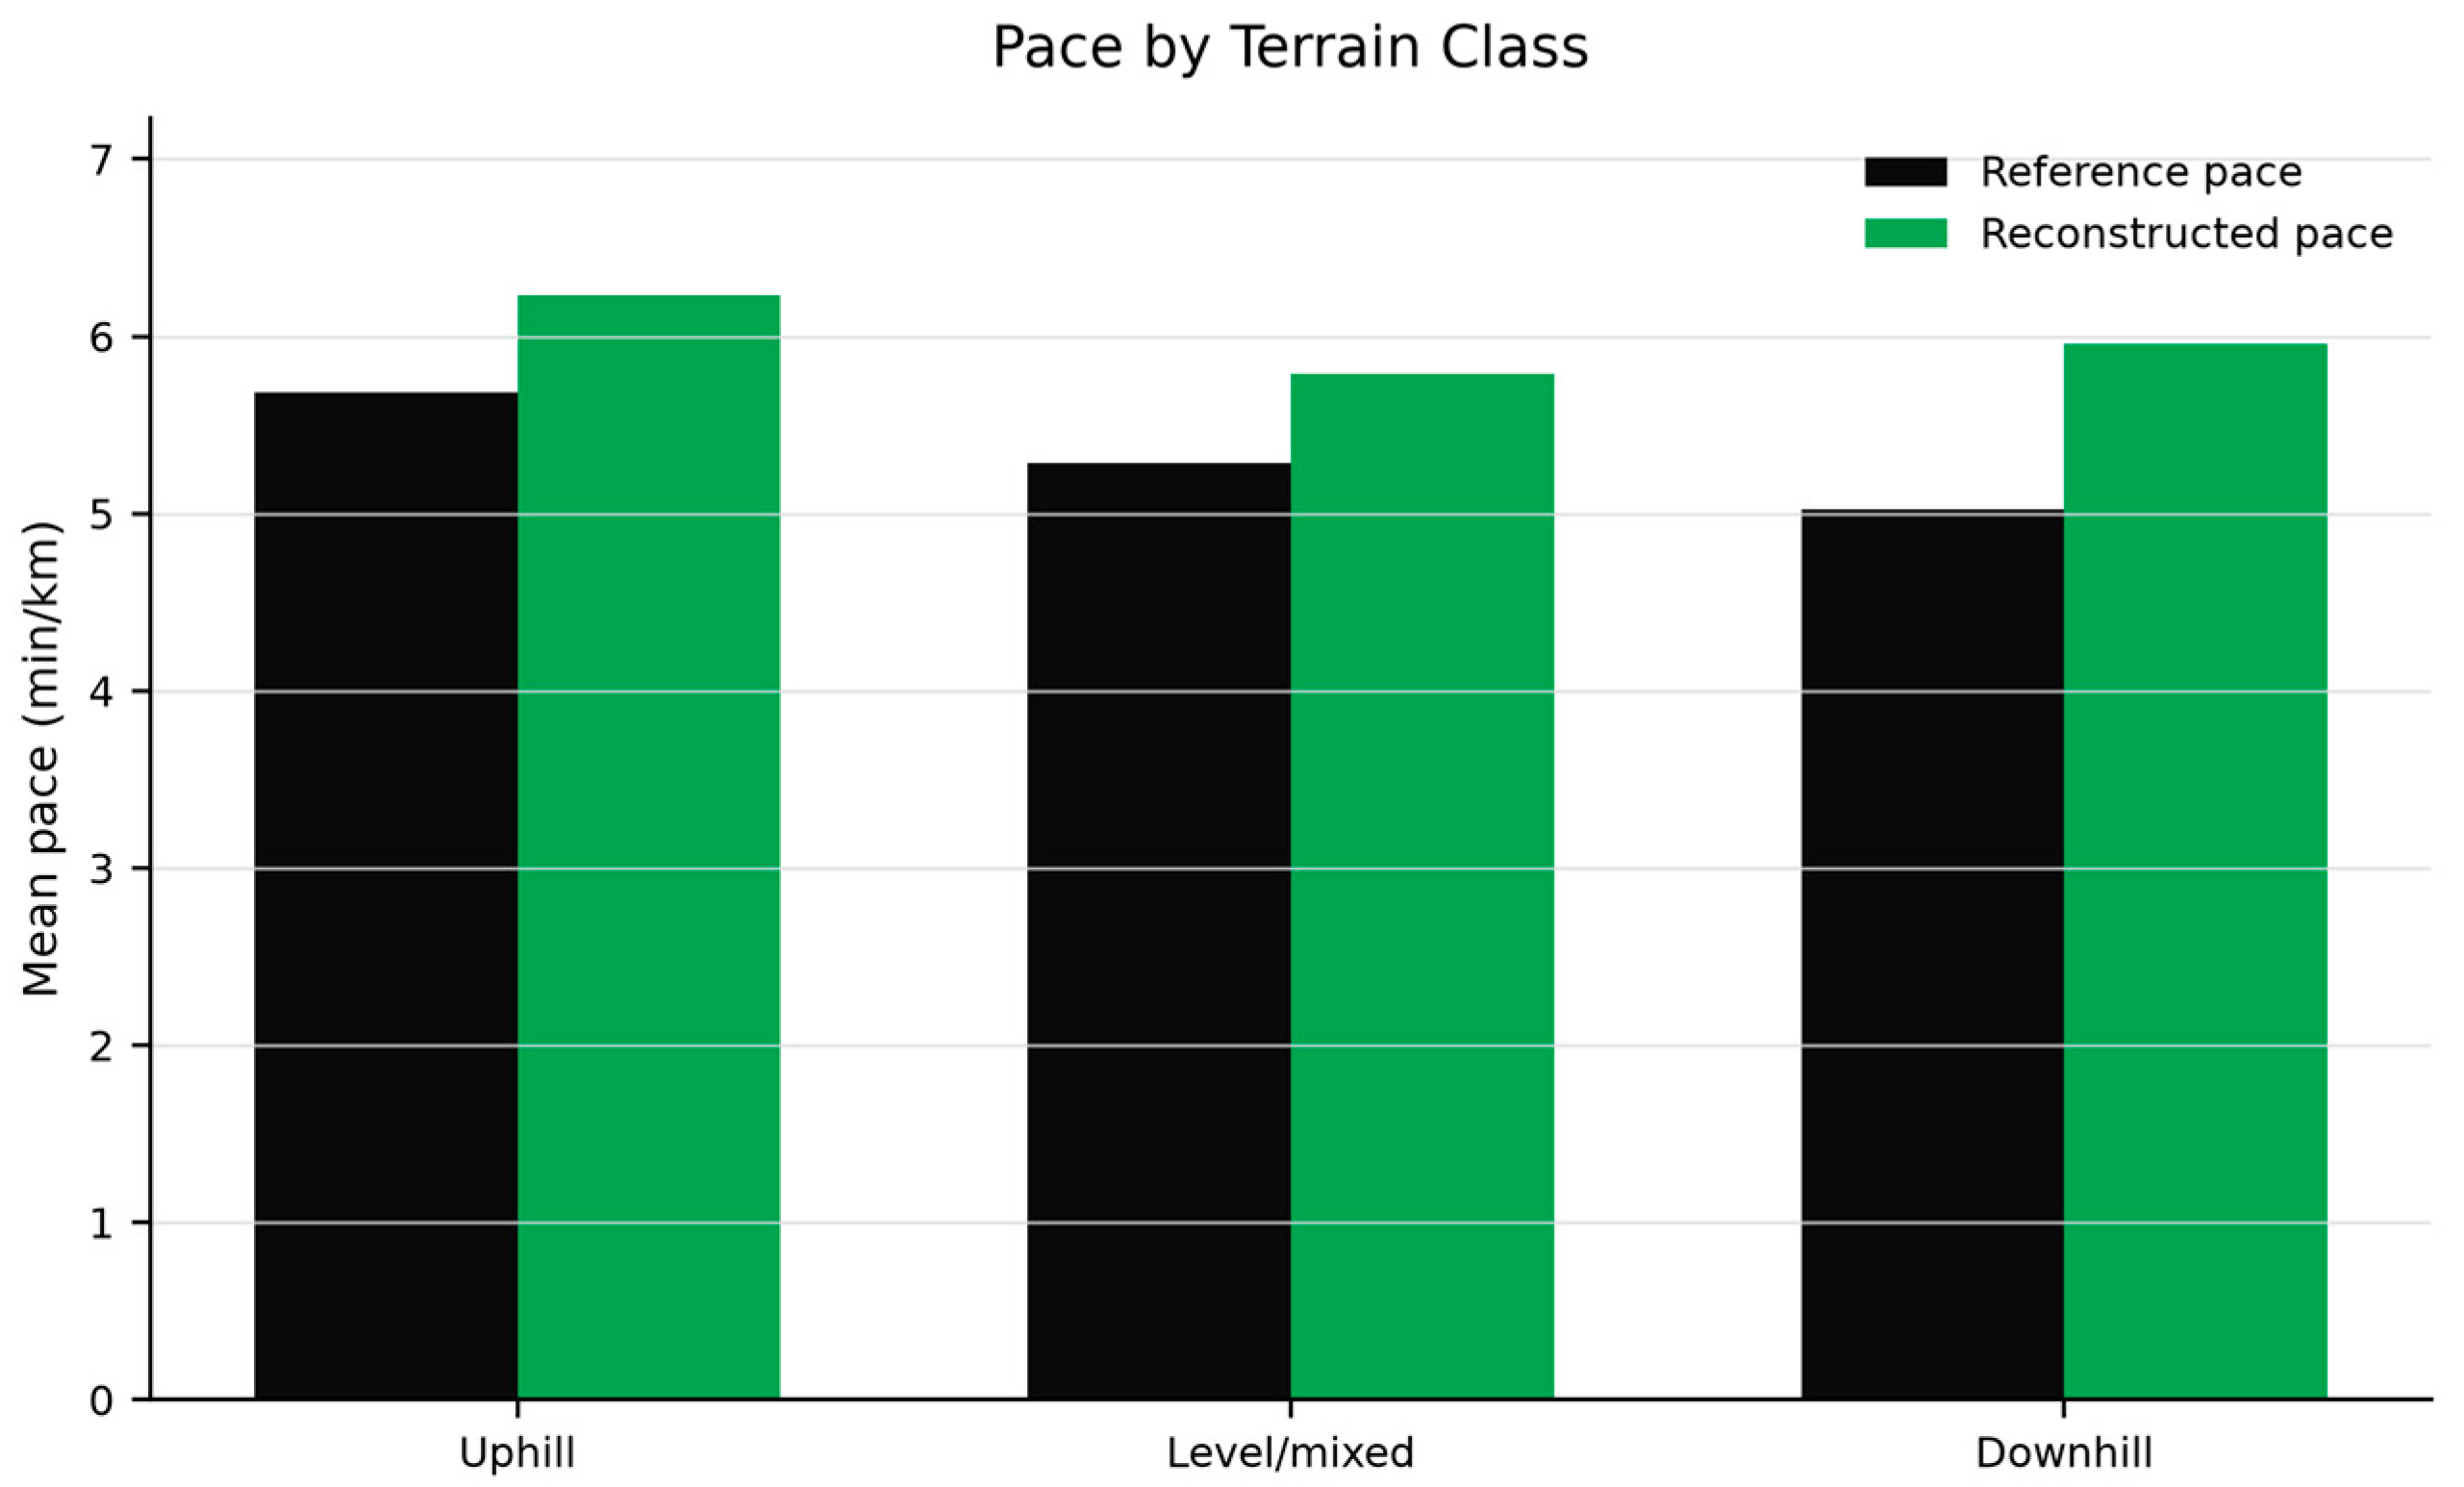
The terrain-based results should be interpreted as post-reconstruction analysis rather than as an independent validation layer. The reference pace shows the expected pattern of slower uphill running and faster downhill running (Figure 11).
Figure 11.
Mean reference and reconstructed pace by terrain class.
The reconstructed aggregate preserved the principal practical terrain effect: mean pace was slower uphill (6.23 min/km) than on level/mixed sections (5.79 min/km). The downhill estimate (5.96 min/km) did not fully reproduce the faster reference downhill pace (5.02 min/km), indicating that sparse speed anchors limited finer terrain responsiveness. Thus, reference-elevation correction supports terrain-aware interpretation, while a more granular eight-segment analysis is better reserved for supplementary material or future validation with denser observations.
3.9. Comparative Baseline and Robustness Results
The following analyses quantify which elements of the workflow contributed to the observed outcome and how the proposed procedure compared with established baselines. Results are presented for generic Kalman smoothing, route-association ablation, parameter sensitivity and reference-proxy stability, and sequence-aware HMM/Viterbi and monotonic dynamic-programming configurations.
3.9.1. Constant-Velocity Kalman Baseline
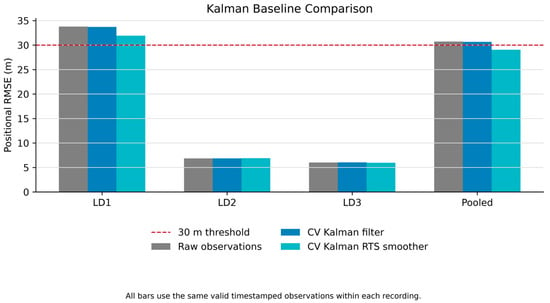
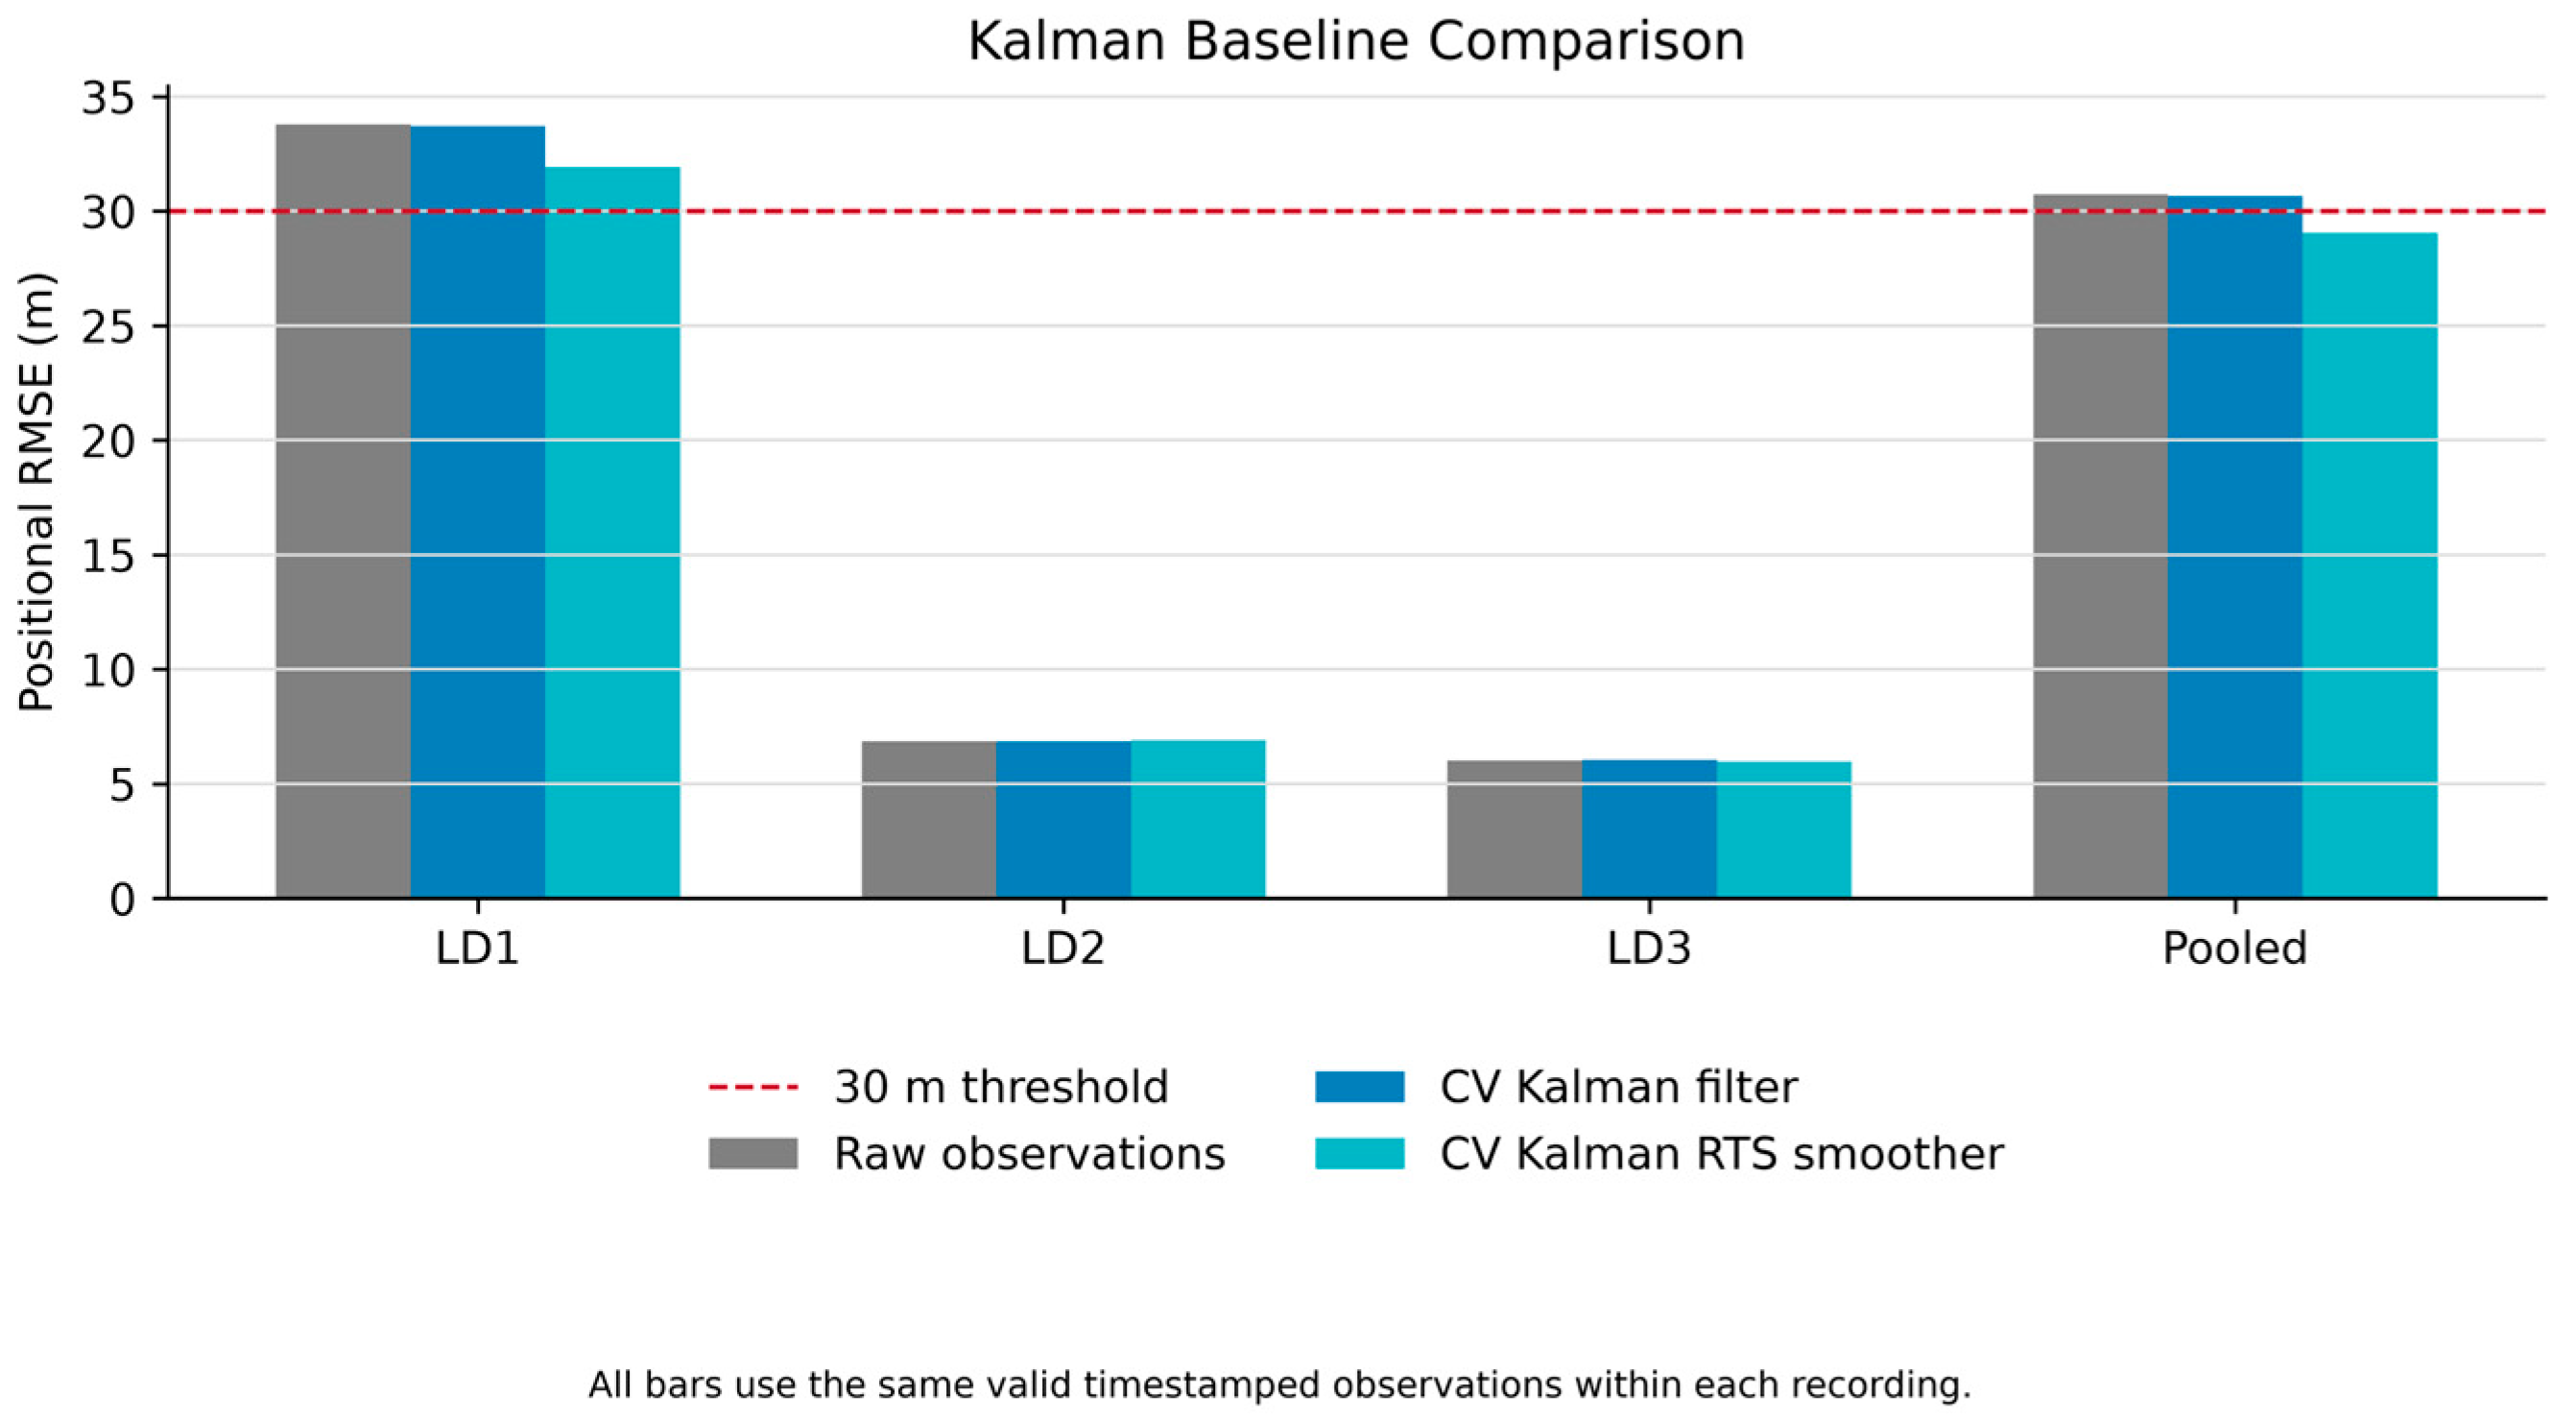
Across the same 224 activity-window observations, raw position error was 21.91 m MAE and 30.72 m RMSE (Table 6). The causal constant-velocity Kalman filter produced 21.75 m MAE and 30.66 m RMSE, corresponding to a 0.2% RMSE reduction. The offline RTS smoother reduced MAE to 20.64 m and RMSE to 29.05 m, representing a 5.4% reduction relative to the raw observations. P95 error decreased from 65.86 to 61.94 m. Improvement was concentrated in LD1, while changes for the two sparse recordings were negligible or slightly unfavorable. Thus, generic motion smoothing attenuated part of the positional noise but did not restore missing route progression, elevation, or pace information. The pooled positional RMSE values for the raw observations, CV Kalman filter, and RTS smoother are additionally illustrated in Figure 12.
Table 6.
Pooled positional-error metrics for raw observations and the constant-velocity Kalman baseline.
Figure 12.
Position RMSE for raw observations, the causal constant-velocity Kalman filter, and the offline RTS smoother. All three series use the same 224 activity-window observations.
3.9.2. Route-Association Ablation
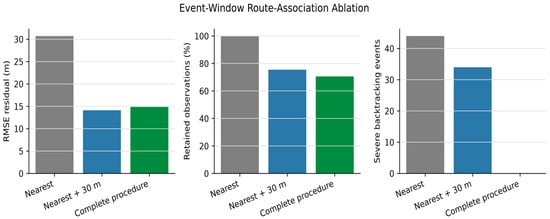
The ablation showed that the 30 m threshold reduced spatial residuals but did not ensure a logically ordered route sequence (Table 7). Distance screening alone left 34 severe backtracking events, whereas the complete time-feasible procedure eliminated them. Spatial quality control and route-progression constraints therefore address complementary failure modes. The effect of spatial screening and route-consistency constraints on observation retention and sequence consistency is illustrated in Figure 13.
Table 7.
Pooled ablation of reference-route association.
Figure 13.
Ablation of reference-route association showing the trade-off between retained observations and route-progression consistency.
3.9.3. Sensitivity and Reference-Proxy Stability
Threshold sensitivity confirmed an explicit retention-error trade-off. At thresholds of 20, 30, and 40 m, pooled retention was 54.46%, 70.54%, and 79.91%, while residual RMSE was 10.57, 14.84, and 18.43 m, respectively. Increasing the threshold from 20 to 30 m retained 36 additional observations and represented 34 additional per-recording checkpoints, at the cost of a 4.27 m RMSE increase. Increasing it to 40 m retained 21 further observations but increased RMSE by another 3.59 m. The selected 30 m threshold is therefore a dataset-specific compromise between observation retention and residual error rather than a universally optimal value.
In leave-one-reference-recording-out analysis, pooled nearest-route disagreement between an individual high-fidelity recording and the reference reconstructed from the remaining two was 7.30 m MAE and 9.09 m RMSE for position. Elevation disagreement was 7.49 m MAE and 8.66 m RMSE. These non-zero values quantify variability within the consumer-grade reference system and support its interpretation as a high-fidelity reference proxy rather than absolute ground truth. Detailed threshold and leave-one-reference-out results are provided in the Supplementary Materials.
3.9.4. Comparative Sequence-Aware Route-Association Results
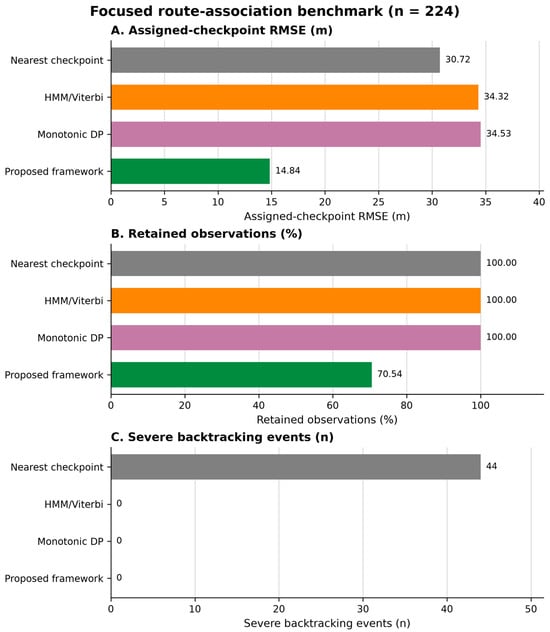
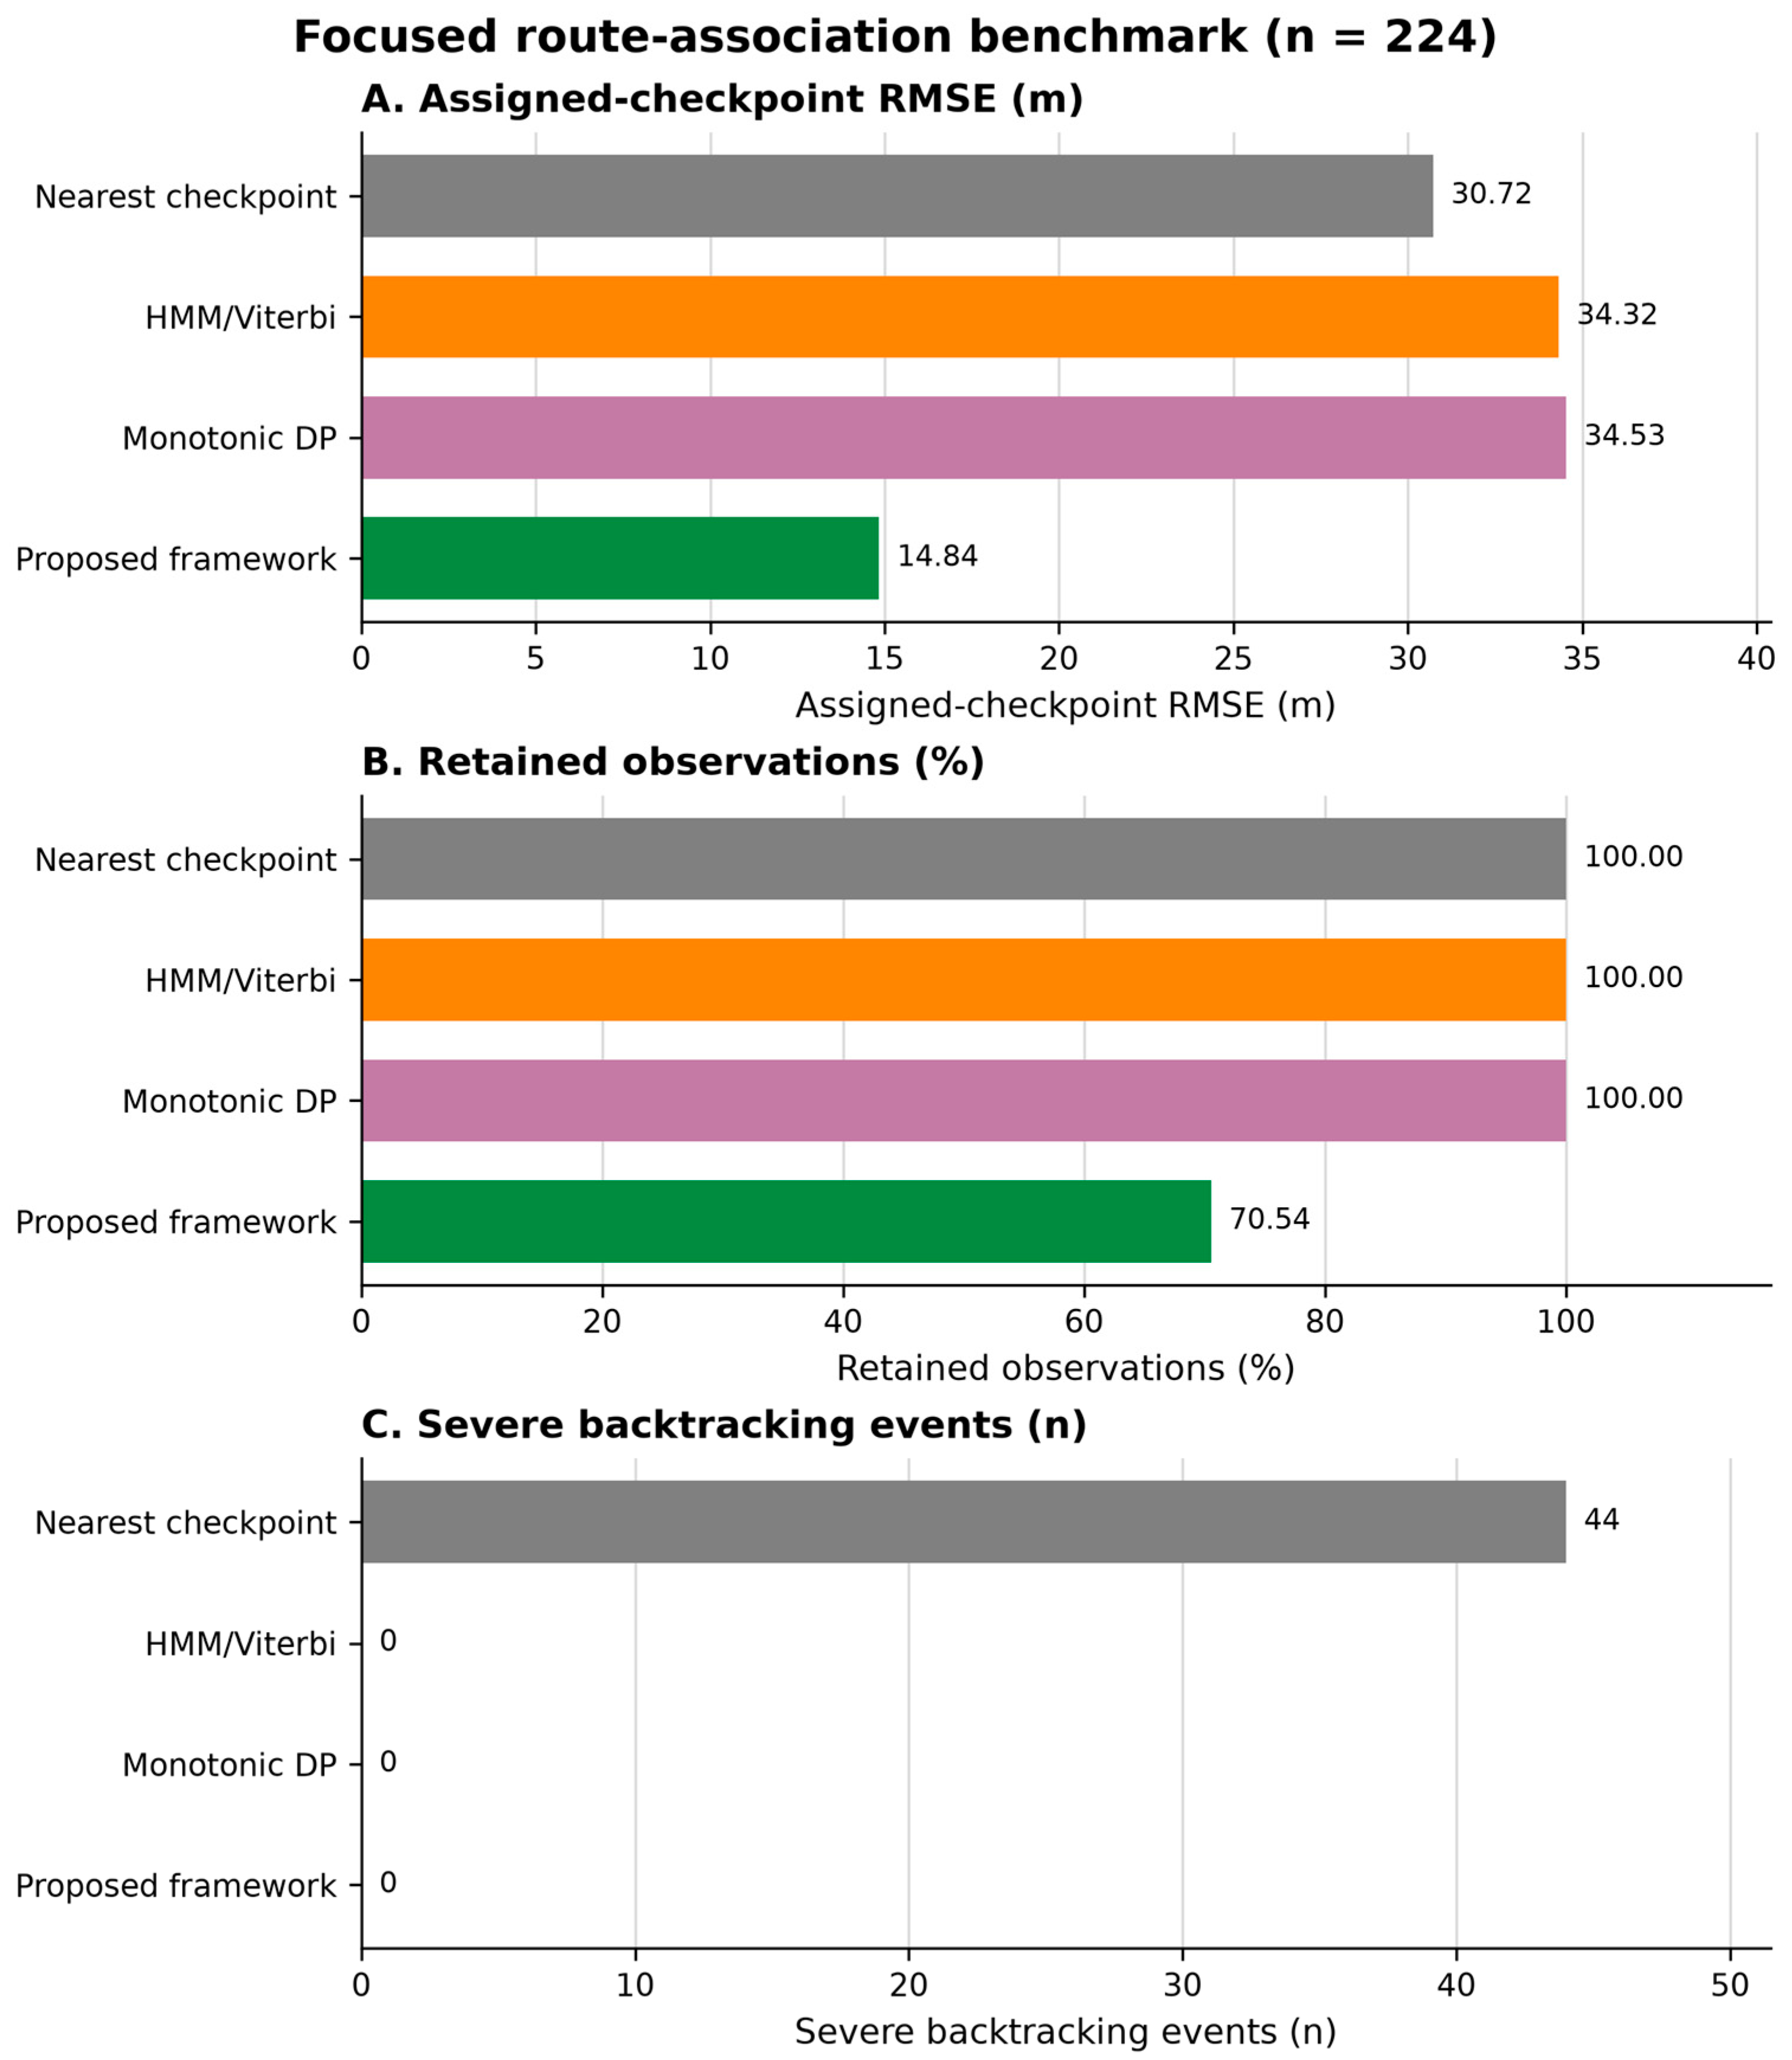
The operational benchmark compared all methods on the common 224-observation activity window (Table 8A). HMM/Viterbi and monotonic dynamic programming retained all observations and eliminated severe backtracking, but their residuals included off-route observations rejected by the proposed quality-control stage. The proposed framework retained 70.54% of observations, eliminated severe backtracking, and achieved an operational RMSE of 14.84 m. Because retention differed, these outcomes represent a quality-control trade-off rather than a paired accuracy comparison.
Table 8.
(A) Operational comparison of the four focal route-association configurations on 224 observations from the common activity window. (B) Paired comparison on the identical 158-observation subset retained by the proposed framework.
The operational comparison of the four focal route-association configurations is summarized graphically in Figure 14.
Figure 14.
Focused operational route-association benchmark. Assigned-checkpoint RMSE, observation retention, and severe backtracking must be interpreted jointly because pointwise nearest association minimizes geometric residual and quality-controlled procedures may reject observations.
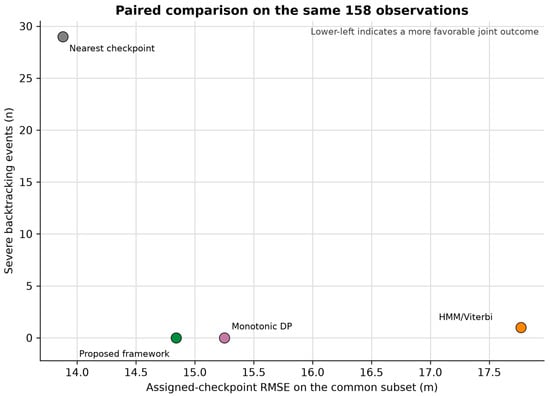
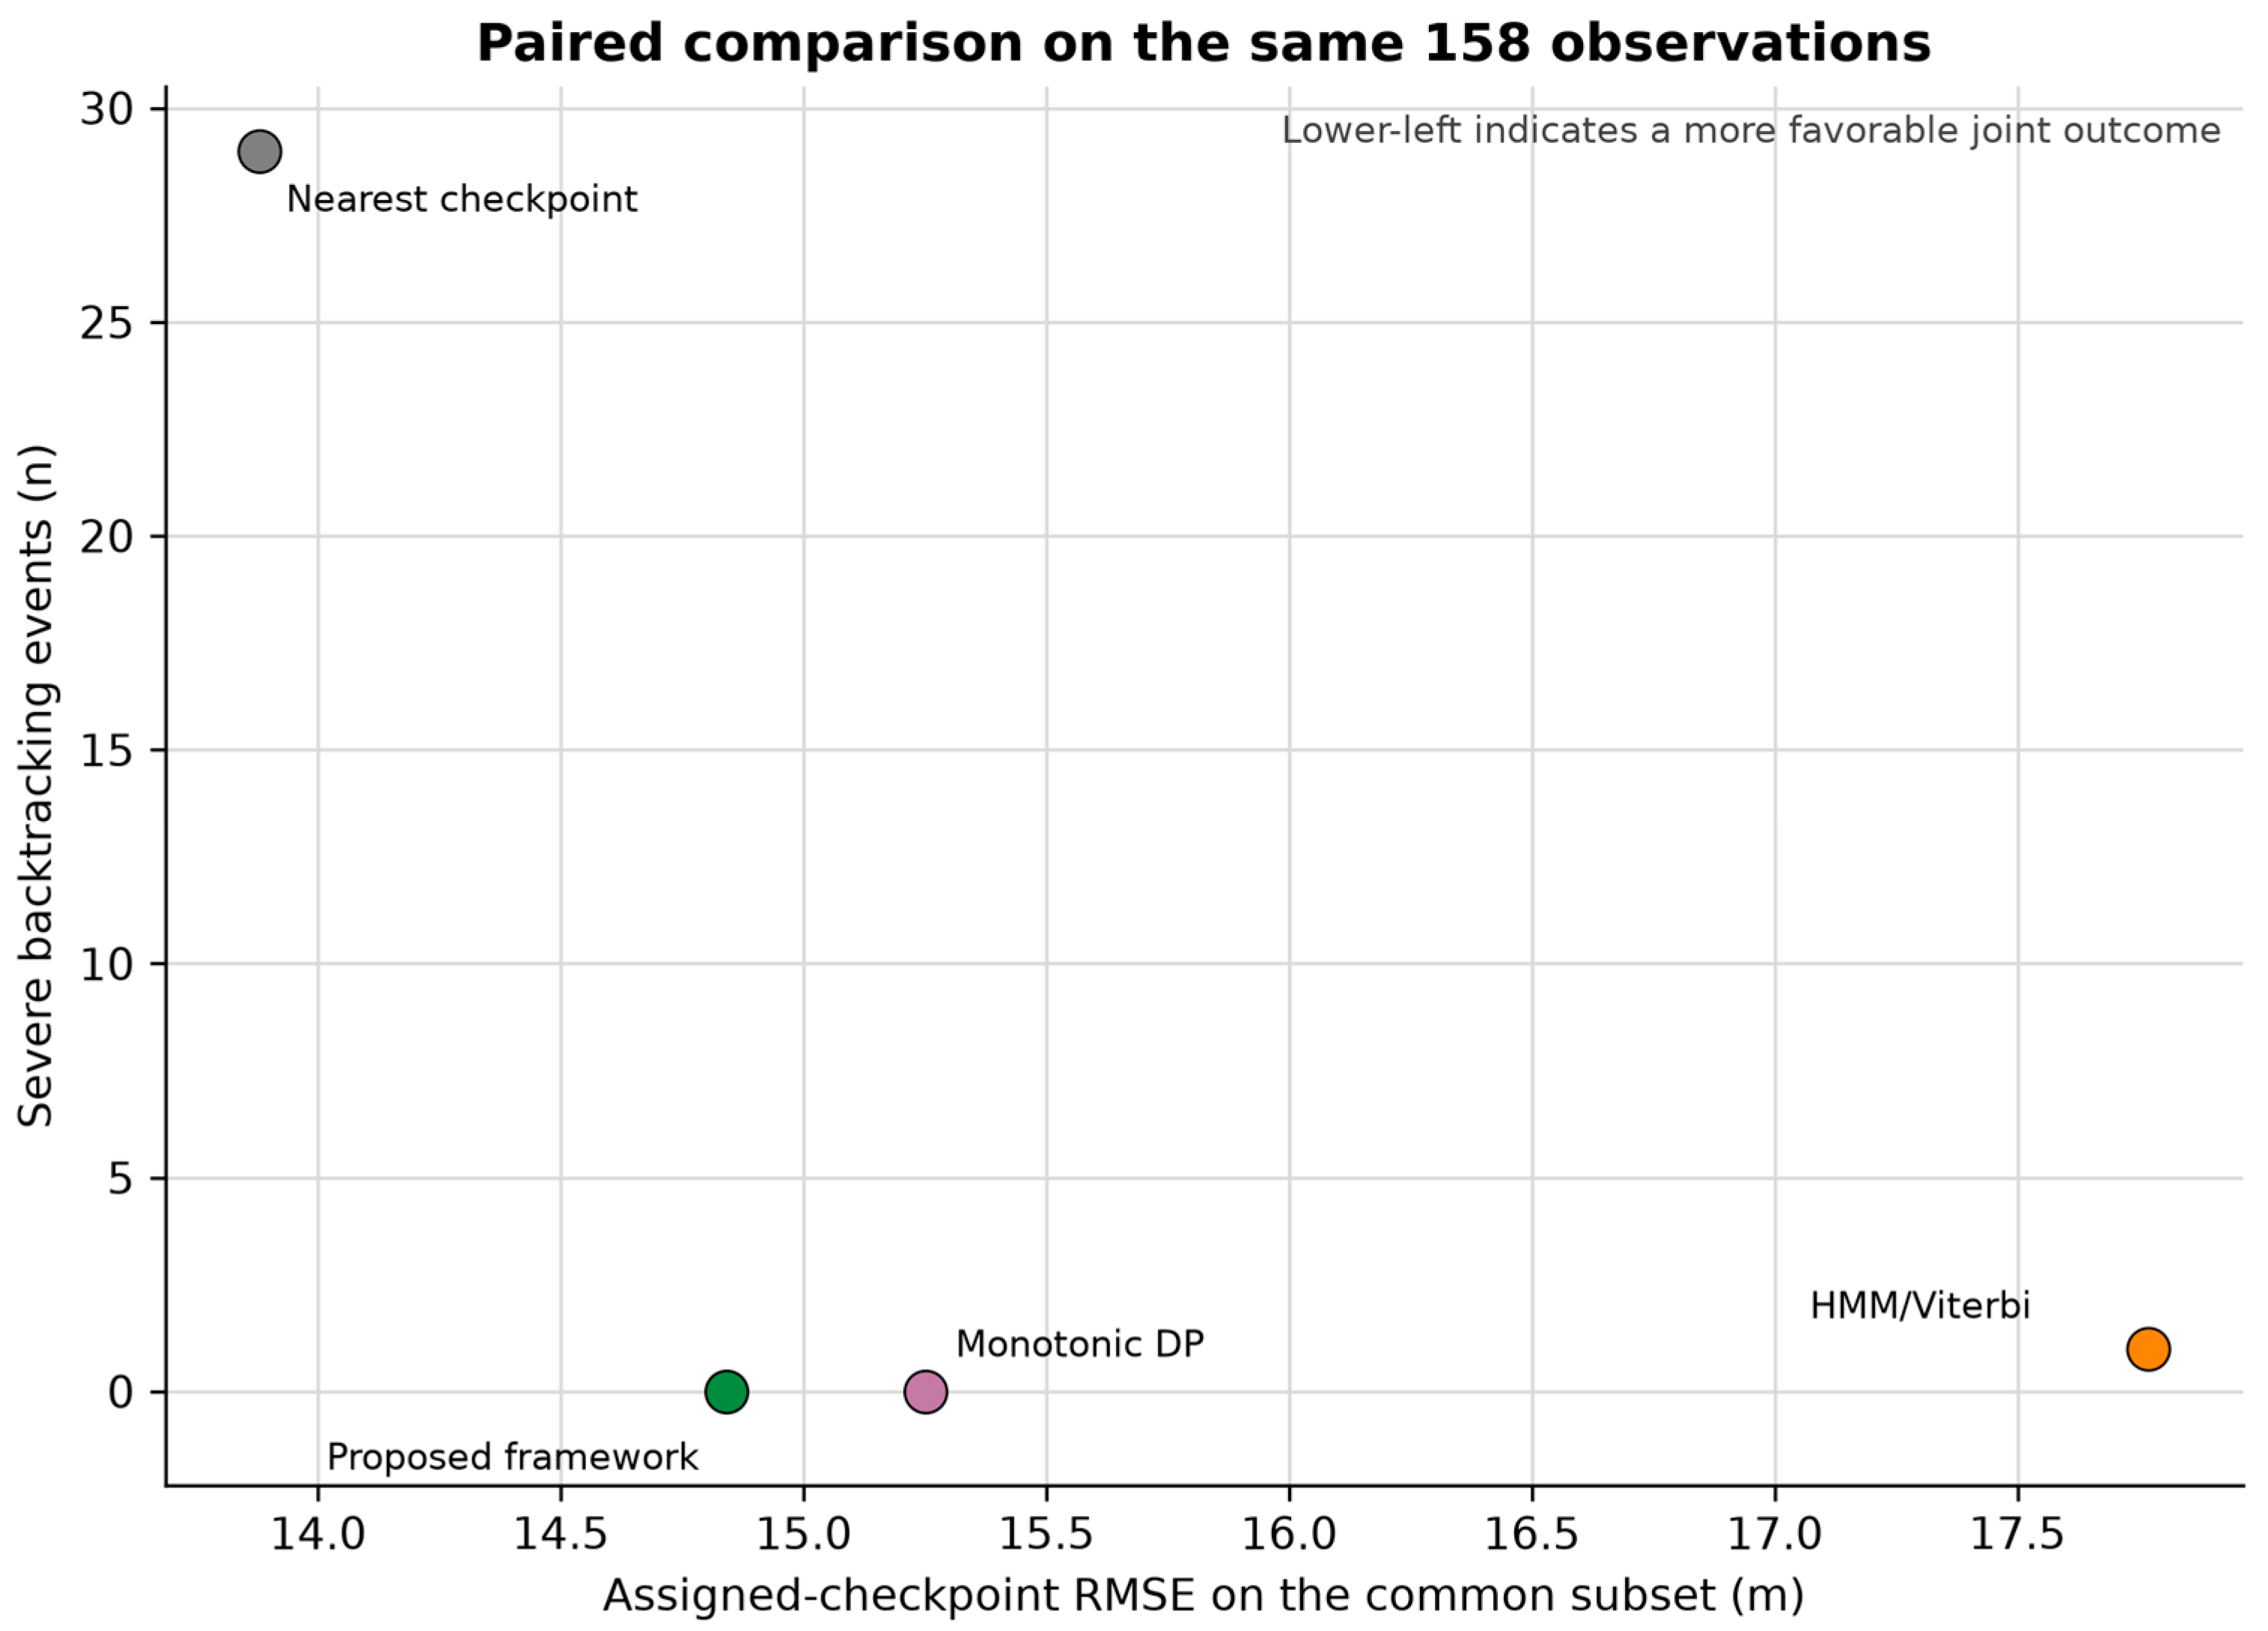
On the identical 158-observation subset, nearest-checkpoint association produced the lowest geometric RMSE but 29 severe backtracking events (Table 8B). Among the sequence-consistent methods, the proposed framework achieved 14.84 m RMSE with no severe backtracking, compared with 17.77 m and one event for HMM/Viterbi and 15.25 m and no events for monotonic dynamic programming. The proposed framework therefore provided the most favorable joint accuracy-consistency result among the evaluated sequence-aware configurations. Because the paired subset was defined by the proposed framework’s quality-control decision, it should be interpreted as a sensitivity analysis rather than an independent test population.
The paired residual-consistency comparison on the identical 158-observation subset is presented in Figure 15.
Figure 15.
Paired residual-consistency comparison on the same 158 observations. A lower RMSE and fewer severe backtracking events indicate a more favorable joint outcome.
4. Discussion
The findings are interpreted in relation to three questions: whether reference-constrained reconstruction improves the analytical usability of degraded GNSS recordings, which stages of the workflow are responsible for this improvement, and under which conditions the resulting trajectories should be considered reliable. Particular attention is given to the distinction between geometric residual, route-sequence consistency, reconstruction coverage, and absolute positioning accuracy.
4.1. Accuracy of GNSS Trajectory Reconstruction in Relation to Previous Studies
Classical filtering, smoothing, map matching, and sensor fusion remain important approaches for reducing positioning error in consumer-grade GNSS data [5,12,13,14,15,17]. In the present dataset, the offline constant-velocity RTS smoother reduced pooled positional RMSE from 30.72 to 29.05 m, confirming that generic motion smoothing attenuated only part of the observed error. It did not recover missing route progression, elevation, or pace information.
The nearest-reference-checkpoint operation used in this study is a simplified route-association step and is not presented as a methodological novelty by itself. The contribution lies in the integrated workflow that combines activity-window selection, spatial screening, sequence-consistent route association, reference-based elevation correction, pace reconstruction, and explicit uncertainty variants. This broader formulation addresses the reconstruction of an activity record rather than coordinate smoothing alone.
The focused route-association benchmark further clarified the trade-off between pointwise geometric fit and sequence consistency. On the common 158-observation subset, nearest-checkpoint association achieved the lowest geometric RMSE but produced 29 severe backtracking events. HMM/Viterbi yielded 17.77 m RMSE with one event, monotonic dynamic programming yielded 15.25 m with no events, and the proposed framework yielded 14.84 m with no events. These findings do not establish universal superiority, but they show that the proposed configuration provided the most favorable joint residual-consistency outcome among the evaluated sequence-aware methods [14,15].
The route-association ablation further showed that spatial screening and sequence control addressed different failure modes. The 30 m threshold substantially reduced positional residuals but left 34 severe backtracking events, whereas the complete time-feasible procedure eliminated them. Threshold sensitivity additionally confirmed that 30 m was a dataset-specific compromise between observation retention and residual error rather than a universally optimal value.
The Garmin-derived trajectory should be interpreted as a high-fidelity consumer-grade reference proxy rather than absolute geodetic ground truth. The leave-one-reference-recording-out analysis produced non-zero positional and elevation disagreement, demonstrating that the reference itself contains consumer-device variability. Accordingly, the reported errors quantify reconstruction performance relative to the adopted proxy.
Pace reconstruction extends the framework beyond spatial route association. Method 1 achieved lower or effectively equal baseline error in the present scenarios, whereas Method 2 produced smoother profiles when usable route-progress anchors were available. Their complementary behavior supports the use of both locally retained information and a physically interpretable acceleration prior [19,20,21].
The framework is practically relevant for repeated or previously characterized routes because it operates on standard GPX recordings and does not require tightly coupled inertial-navigation hardware. It may therefore support retrospective analysis of incomplete activities and repeated-course monitoring, while its reference-dependent scope must be kept explicit.
4.2. Interpretation of the Proposed Reconstruction Framework
The results indicate that degraded running activities cannot be reconstructed through positional correction alone. Spatial location, route progression, elevation, and pace form a coupled spatio-temporal description; failure in one domain can compromise the interpretation of the others. The multi-stage structure was therefore designed to preserve consistency across these domains.
Elevation correction has a specific methodological role in this workflow. Raw smartphone altitude was not treated as reliable terrain information, and the adopted reference profile provided a stable basis for terrain classification and pace interpretation. Because elevation was assigned from the reference profile, this step is a reconstruction by substitution and not an independent demonstration of post-correction altimetric accuracy.
The terrain-based analysis provided a practical test of the corrected elevation profile. The reconstructed aggregate preserved the principal pattern of slower uphill pace but did not fully reproduce the faster reference pace on downhill sections, indicating that sparse speed anchors limited terrain responsiveness. Thus, reference-elevation correction enabled terrain-aware interpretation without removing the uncertainty associated with pace reconstruction.
The reference-dependent design defines the intended operational domain. The current framework is suitable for repeated training routes, standardized courses, organized events, and retrospective datasets for which a representative route can be established. It is not intended as an autonomous solution for arbitrary unknown trajectories.
The deterministic constraints and optimistic, baseline, and pessimistic variants were selected to preserve transparency and reproducibility. These variants express sensitivity to the acceleration prior rather than probabilistic confidence intervals. The framework should therefore be interpreted as an auditable engineering reconstruction method and a baseline for future probabilistic or data-driven extensions.
4.3. Limitations and Future Research
The principal limitation is the scale of the validation dataset. Three low-fidelity recordings and 224 common-window observations represent distinct degradation scenarios but do not support population-level generalization or group-level statistical inference. Larger multi-participant and multi-device datasets are required to quantify variability across users, hardware, and movement conditions.
The averaged wearable GNSS trajectory is a reference proxy rather than survey-grade ground truth. Leave-one-reference-recording-out analysis quantified internal reference variability, but absolute horizontal and vertical accuracy remains unknown. Future validation should therefore include synchronized geodetic-grade RTK-GNSS measurements.
The current implementation depends on a known or previously characterized route and was evaluated on a single recreational running course. Its robustness under urban-canyon multipath, dense vegetation, mountainous terrain, prolonged GNSS outages, different movement speeds, and alternative smartphone chipsets has not yet been established.
The sequence-aware benchmark was intentionally focused rather than exhaustive. HMM/Viterbi and monotonic dynamic programming were implemented with fixed, transparent parameters and were not extensively optimized for this dataset. Assigned-checkpoint residual measures agreement with the adopted reference proxy, not checkpoint-index ground truth. In addition, the paired subset was selected by the proposed quality-control procedure, so paired results should be interpreted as a sensitivity analysis. Comparisons with particle filters, alternative probabilistic map-matching models, and trained deep-learning methods require a larger independent benchmark and method-specific calibration.
Computational cost was not formally benchmarked. The present implementation should therefore be regarded as an offline post-processing workflow rather than a validated real-time mobile solution, even though its deterministic stages do not require neural-network inference or large-scale iterative optimization.
Studies in other biomedical embedded-system contexts similarly emphasize simulation-based validation of acquisition architectures before practical deployment [22].
Future work should combine larger cohorts, diverse routes and devices, RTK-GNSS reference measurements, and computational profiling. Integration with inertial or barometric sensors and comparison with data-driven reconstruction models may then be evaluated under a common preregistered protocol [5,17]. Cross-domain embedded-platform research has likewise explored the integration of GNSS, IMU, and onboard AI for sensor fusion and trajectory optimization, although in a substantially different UAV application context [23].
5. Conclusions
The experimental results demonstrate that the proposed framework improves the analytical usability of degraded GNSS data.
This study developed and evaluated a multi-stage framework for reconstructing degraded consumer-grade GNSS running activities. The workflow combines activity-window selection, spatial quality control, sequence-consistent reference-route association, reference-based elevation correction, two pace-reconstruction models, and explicit sensitivity variants using standard GPX inputs.
Within the common activity window, raw nearest-route positional RMSE was 30.72 m, while retained route-consistent assignments had a residual RMSE of 14.84 m and no severe backtracking. Raw smartphone elevation had an RMSE of 190.27 m relative to the adopted reference profile, supporting reference-based substitution for terrain-dependent analysis. Aggregate pace RMSE improved from 2.40 to 1.74 min/km and MAPE from 32.84% to 25.46%. On the paired 158-observation benchmark, the proposed framework achieved 14.84 m RMSE with no severe backtracking, compared with 17.77 m and one event for HMM/Viterbi and 15.25 m and no events for monotonic dynamic programming; nearest-checkpoint association achieved a lower geometric RMSE but produced 29 severe backtracking events.
Complementary robustness analyses clarified why the integrated workflow was required. The constant-velocity RTS smoother reduced positional RMSE by only 5.4%, from 30.72 to 29.05 m, while distance thresholding alone left 34 severe backtracking events. Threshold sensitivity showed that the adopted 30 m criterion represented a dataset-specific balance between observation retention and residual error rather than a universally optimal value. Leave-one-reference-recording-out analysis yielded positional and elevation RMSE values of 9.09 and 8.66 m, respectively, confirming that the averaged wearable trajectory should be treated as a high-fidelity reference proxy rather than absolute ground truth.
Method-specific findings also remain relevant. Method 1 provided lower or effectively equal baseline errors and retained greater responsiveness to locally available speed information, whereas Method 2 generated smoother profiles where usable route-progress anchors were available. Terrain-based analysis preserved the principal pattern of slower uphill pace, although downhill responsiveness remained limited by sparse observations. The optimistic, baseline, and pessimistic variants should be interpreted as sensitivity scenarios around the acceleration prior rather than probabilistic confidence intervals.
The results support the practical value of integrated reference-constrained reconstruction for sparse activities recorded on known or repeated routes. Because the study used a small number of scenarios and a consumer-grade reference proxy, broader claims require validation across participants, devices, environments, and survey-grade reference measurements.
Supplementary Materials
The following supporting information can be downloaded at https://www.mdpi.com/article/10.3390/app16188972/s1.
Author Contributions
Conceptualization, D.C. and J.Z.; methodology, M.W.; software, A.R. and W.J.; validation, D.C., M.W. and J.Z.; formal analysis, D.C.; investigation, A.R.; resources, J.Z.; data curation, A.R. and W.J.; writing—original draft preparation, D.C., A.R., J.Z.; writing—review and editing, M.W.; visualization, A.R.; supervision, M.W.; project administration, D.C. and M.W.; funding acquisition, J.Z. All authors have read and agreed to the published version of the manuscript.
Funding
This research was funded by Polish Ministry of Science and Higher Education, grant number MNiSW/2025/DAP/323.
Institutional Review Board Statement
Not applicable.
Informed Consent Statement
Informed consent was obtained from all subjects involved in the study.
Data Availability Statement
The original contributions presented in this study are included in the article/Supplementary Material. Further inquiries can be directed to the corresponding author.
Conflicts of Interest
The authors declare no conflicts of interest.
References
- Zheng, Y. Trajectory Data Mining: An Overview. ACM Trans. Intell. Syst. Technol. TIST 2015, 6, 29. [Google Scholar] [CrossRef] [Scilit]
- Groves, P.D. Principles of GNSS, Inertial, and Multisensor Integrated Navigation Systems; Artech House: Boston, MA, USA, 2013. [Google Scholar]
- GNSS and Secure SATCOM User Technology Report|EU Agency for the Space Programme. Available online: https://www.euspa.europa.eu/tech-report (accessed on 21 July 2026).
- Zandbergen, P.A.; Barbeau, S.J. Positional Accuracy of Assisted GPS Data from High-Sensitivity GPS-Enabled Mobile Phones. J. Navig. 2011, 64, 381–399. [Google Scholar] [CrossRef] [Scilit]
- Jiang, C.; Chen, Y.; Chen, C.; Jia, J.; Sun, H.; Wang, T.; Hyyppa, J. Implementation and Performance Analysis of the PDR/GNSS Integration on a Smartphone. GPS Solut. 2022, 26, 81. [Google Scholar] [CrossRef] [Scilit]
- Budig, M.; Keiner, M.; Stoohs, R.; Hoffmeister, M.; Höltke, V. Heart Rate and Distance Measurement of Two Multisport Activity Trackers and a Cellphone App in Different Sports: A Cross-Sectional Validation and Comparison Field Study. Sensors 2022, 22, 180. [Google Scholar] [CrossRef] [Scilit] [PubMed]
- Szot, T.; Specht, C.; Dabrowski, P.S.; Specht, M. Comparative Analysis of Positioning Accuracy of Garmin Forerunner Wearable GNSS Receivers in Dynamic Testing. Measurement 2021, 183, 109846. [Google Scholar] [CrossRef] [Scilit]
- Gilgen-Ammann, R.; Schweizer, T.; Wyss, T. Accuracy of Distance Recordings in Eight Positioning-Enabled Sport Watches: Instrument Validation Study. JMIR mHealth uHealth 2020, 8, e17118. [Google Scholar] [CrossRef] [Scilit] [PubMed]
- Mason, R.; Pearson, L.T.; Barry, G.; Young, F.; Lennon, O.; Godfrey, A.; Stuart, S. Wearables for Running Gait Analysis: A Systematic Review. Sports Med. 2023, 53, 241–268. [Google Scholar] [CrossRef] [Scilit] [PubMed]
- Navalta, J.W.; Montes, J.; Bodell, N.G.; Aguilar, C.D.; Lujan, A.; Guzman, G.; Kam, B.K.; Manning, J.W.; DeBeliso, M. Wearable Device Validity in Determining Step Count During Hiking and Trail Running. J. Meas. Phys. Behav. 2018, 1, 86–93. [Google Scholar] [CrossRef] [Scilit]
- Hu, X.; Wang, G.; Ma, G. A Wearable Monitoring System for Running Gait Analysis by Diffusion Transformer. PLoS ONE 2026, 21, e0341066. [Google Scholar] [CrossRef] [Scilit] [PubMed]
- Kalman, R.E. A New Approach to Linear Filtering and Prediction Problems. J. Basic Eng. 1960, 82, 35–45. [Google Scholar] [CrossRef] [Scilit]
- Grewal, M.; Andrews, A. Kalman Filtering: Theory and Practice Using MATLAB; John Wiley & Sons: New York, NY, USA, 2001; Volume 14. [Google Scholar] [CrossRef] [Scilit]
- Newsom, P.; Krumm, J. Hidden Markov Map Matching through Noise and Sparseness. In Proceedings of the 17th ACM SIGSPATIAL International Conference on Advances in Geographic Information Systems; ACM: New York, NY, USA, 2009; pp. 336–343. [Google Scholar] [CrossRef] [Scilit]
- Quddus, M.A.; Ochieng, W.Y.; Noland, R.B. Current Map-Matching Algorithms for Transport Applications: State-of-the Art and Future Research Directions. Transp. Res. Part C Emerg. Technol. 2007, 15, 312–328. [Google Scholar] [CrossRef] [Scilit]
- Edwards, N.A.; Talarico, M.K.; Chaudhari, A.; Mansfield, C.J.; Oñate, J. Use of Accelerometers and Inertial Measurement Units to Quantify Movement of Tactical Athletes: A Systematic Review. Appl. Ergon. 2023, 109, 103991. [Google Scholar] [CrossRef] [Scilit] [PubMed]
- Jun, S.; Kim, G.M.; Kim, H.K.; Kwak, B.I. S-TRAVERSE: GNSS-Free Vehicle Trajectory Reconstruction Using Smartphone IMU and Vehicle Speed Sensors. IEEE Sens. J. 2025, 25, 41985–41997. [Google Scholar] [CrossRef] [Scilit]
- Konakoglu, B.; Kurt Konakoglu, S.S.; Celik, K.T.; Ustun Topal, T. A Bibliometric Analysis of GPS/GNSS Contributions to GIS. J. Geovis. Spat. Anal. 2026, 10, 9. [Google Scholar] [CrossRef] [Scilit]
- Winter, D. Biomechanics and Motor Control of Human Movement, 4th ed.; John Wiley & Sons: Hoboken, NJ, USA, 2009. [Google Scholar] [CrossRef] [Scilit]
- Zatsiorsky, V.M. Kinetics of Human Motion; Human Kinetics: Champaign, IL, USA, 2002. [Google Scholar]
- Hamill, J.; Knutzen, K.M.; Derrick, T. Biomechanical Basis of Human Movement, 4th ed.; Wolters Kluwer: Baltimore, MD, USA, 2015. [Google Scholar]
- Laganà, F. Design and Simulation-Based Validation of an Embedded Acquisition Architecture for In Situ PCB Integrity Monitoring in Biomedical Devices. Electronics 2026, 15, 833. [Google Scholar] [CrossRef] [Scilit]
- Bibbò, L.; Laganà, F.; Bilotta, G.; Meduri, G.M.; Angiulli, G.; Cotroneo, F. AI-Enhanced Eco-Efficient UAV Design for Sustainable Urban Logistics: Integration of Embedded Intelligence and Renewable Energy Systems. Energies 2025, 18, 5242. [Google Scholar] [CrossRef] [Scilit]

Disclaimer/Publisher’s Note: The statements, opinions and data contained in all publications are solely those of the individual author(s) and contributor(s) and not of MDPI and/or the editor(s). MDPI and/or the editor(s) disclaim responsibility for any injury to people or property resulting from any ideas, methods, instructions or products referred to in the content. |
© 2026 by the authors. Licensee MDPI, Basel, Switzerland. This article is an open access article distributed under the terms and conditions of the Creative Commons Attribution (CC BY) license.