


Abstract
Underground subway stations are highly vulnerable to flooding due to their below-grade configuration, multiple interconnected levels, and reliance on a limited number of vertical access points, yet the extent to which flood progression affects evacuation performance remains insufficiently quantified. This study evaluates the impact of flooding on evacuation performance in an actual four-level transfer station in Seoul, South Korea, by coupling a hydraulic inundation model with a node–link-based evacuation simulation. Water depth and flow velocity obtained from an EPA SWMM-based inundation simulation were converted into walking-speed reduction factors and applied to link weights in a Dijkstra’s algorithm-based evacuation routing model, together with crowd-congestion-based speed reduction. Evacuation performance was compared across three scenarios: a non-flooded baseline and evacuation initiated under 300 s and 600 s flood conditions. The maximum evacuation time increased from 453 s under the non-flooded condition to 523 s and 596 s under the 300 s and 600 s flood conditions, respectively, corresponding to increases of approximately 15.5% and 31.6%. Tracing the route of the last evacuated group showed that this delay arose not from a change in route length—the governing route measured approximately 78 m in all three cases—but from a congestion-driven shift in which platform side produced the binding delay, as evacuee flow was redistributed away from the flooded exit toward the unaffected side. These findings indicate that the onset of flooding measurably increases evacuation time by altering the spatial distribution of congestion rather than the route itself, and that evacuation guidance based on a fixed, pre-computed route cannot fully offset this time-dependent penalty, underscoring the need for real-time, flood-adaptive evacuation routing in underground station environments.
1. Introduction
Large-scale underground facilities, including subway stations, are among the most vulnerable components of urban infrastructure when exposed to flooding. Their below-grade configuration, multiple interconnected levels, and heavy reliance on a limited number of vertical access points mean that even moderate flood events can rapidly compromise passenger mobility and safety. Because these facilities routinely accommodate large volumes of passengers, particularly during peak operating hours, any disruption to normal movement conditions can quickly translate into a life-safety concern. In South Korea, urban underground stations have experienced recurring flood damage during heavy rainfall events, underscoring the practical urgency of understanding how flooding affects passenger evacuation and of developing evacuation strategies that explicitly account for flood-induced hazards.
Simulation studies have been conducted to assess evacuation safety and support evacuation route planning during flooding in underground spaces. Staircases are among the primary means of evacuation in such environments, and three-dimensional simulations have been widely used to investigate flood-flow characteristics on staircases in detail. Staircase-focused studies have examined how staircase slope, landings, and connection configurations affect flood propagation within stairways and adjoining passages [1,2]. In addition, 3D simulations incorporating the spatial configuration of subway stations and the hydraulic behavior of staircase flows have been used to analyze the spatiotemporal evolution of flooding in underground spaces [3,4]. However, the complexity of staircase connections between levels substantially increases computational cost, making the application of 3D models to large, multi-level underground spaces computationally demanding. Accordingly, inter-level coupling approaches based on the two-dimensional shallow water equations have been developed to simulate flood propagation across multiple levels. Kim et al. [5] applied an adaptive transfer method to a 2D shallow water model to simulate flood propagation between two levels of an underground shopping complex. Shin et al. [6] incorporated the additional momentum induced by staircase flow into the source terms of a 2D model, simulated flooding in a three-level underground shopping structure, and evaluated the spatial distribution of flood risk. Zhang et al. [7] proposed a multi-level hydrodynamic framework based on the 2D shallow water equations and simulated flood propagation across three levels of a rectangular underground station. Because subway stations have complex inter-level connections, evacuation route selection during flooding should account for the temporal evolution of flood conditions both within and across multiple levels.
In parallel, evacuation route planning in complex indoor environments has been extensively studied using graph-based pathfinding approaches, most notably Dijkstra’s algorithm, which guarantees identification of the shortest path by exhaustively evaluating cumulative travel cost across a node–link network [8]. Building on this foundation, subsequent studies have applied node–link evacuation models to a range of underground and building environments: Li et al. simulated evacuation in a subway station and identified staircases and fare gates as primary bottleneck points [9]; Mirahadi and McCabe developed EvacuSafe, a real-time Dijkstra-based building evacuation model incorporating dynamic hazard indices such as structural collapse and door malfunction [10]; and Zhou et al. proposed a multi-modal cooperative guidance system for subway station evacuation, demonstrating substantial reductions in evacuation time through combined signage, leader, and broadcast guidance [11]. Haam et al. applied Dijkstra’s algorithm to a deep underground station with six basement levels to quantify the reduction in maximum evacuation time achieved by installing additional evacuation routes and to identify structurally vulnerable evacuation zones [12]. Separately, Kim et al. compared the performance of Dijkstra’s algorithm and the A* algorithm under static, dynamic, and real-time congestion conditions in a six-basement-level underground station in Seoul [13]. Beyond building and station contexts, Dijkstra-based routing has also been applied to broader disaster scenarios, including three-dimensional evacuation routing under tailings dam failure [14] and evacuation route optimization in resource-constrained urban environments lacking advanced GIS infrastructure [15]. More recently, Haam et al. proposed a two-phase centralized evacuation guidance model comparing the A* and Dijkstra’s algorithms under user-equilibrium and system-optimum conditions in an underground station environment [16].
Despite this progress, the majority of existing evacuation routing studies have evaluated pathfinding performance under normal or congestion-only conditions, without explicitly incorporating the compounding effect of an evolving environmental hazard such as flooding on pedestrian movement speed. Flood-induced reductions in walking speed—driven by water depth and flow velocity—have generally been studied in isolation from evacuation routing frameworks, while evacuation routing studies have generally treated link weights as governed solely by distance or crowd density. As a result, the extent to which flood conditions alter both evacuation time and route selection, relative to non-flooded conditions, remains insufficiently quantified.
To address this gap, this study evaluates the impact of flooding on evacuation performance in an underground subway station by integrating flood simulation results with a node–link-based evacuation model. Using an actual transfer station in Seoul as the target facility, a flood simulation was performed to derive time-dependent velocity reduction factors based on water depth and flow velocity. These reduction factors were then applied to the evacuation model, in which Dijkstra’s algorithm was used to determine evacuation routes under both non-flooded and flooded conditions. By comparing evacuation time and route characteristics across a non-flooded baseline and two flood scenarios of differing duration, this study quantitatively demonstrates how flood progression affects evacuation performance and provides a basis for evacuation planning strategies that account for the combined influence of environmental hazard and pedestrian congestion in underground station environments.
2. Methodology
2.1. Spatial Modeling
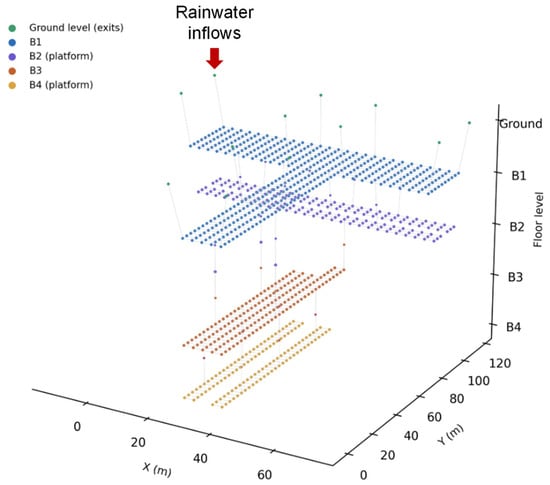
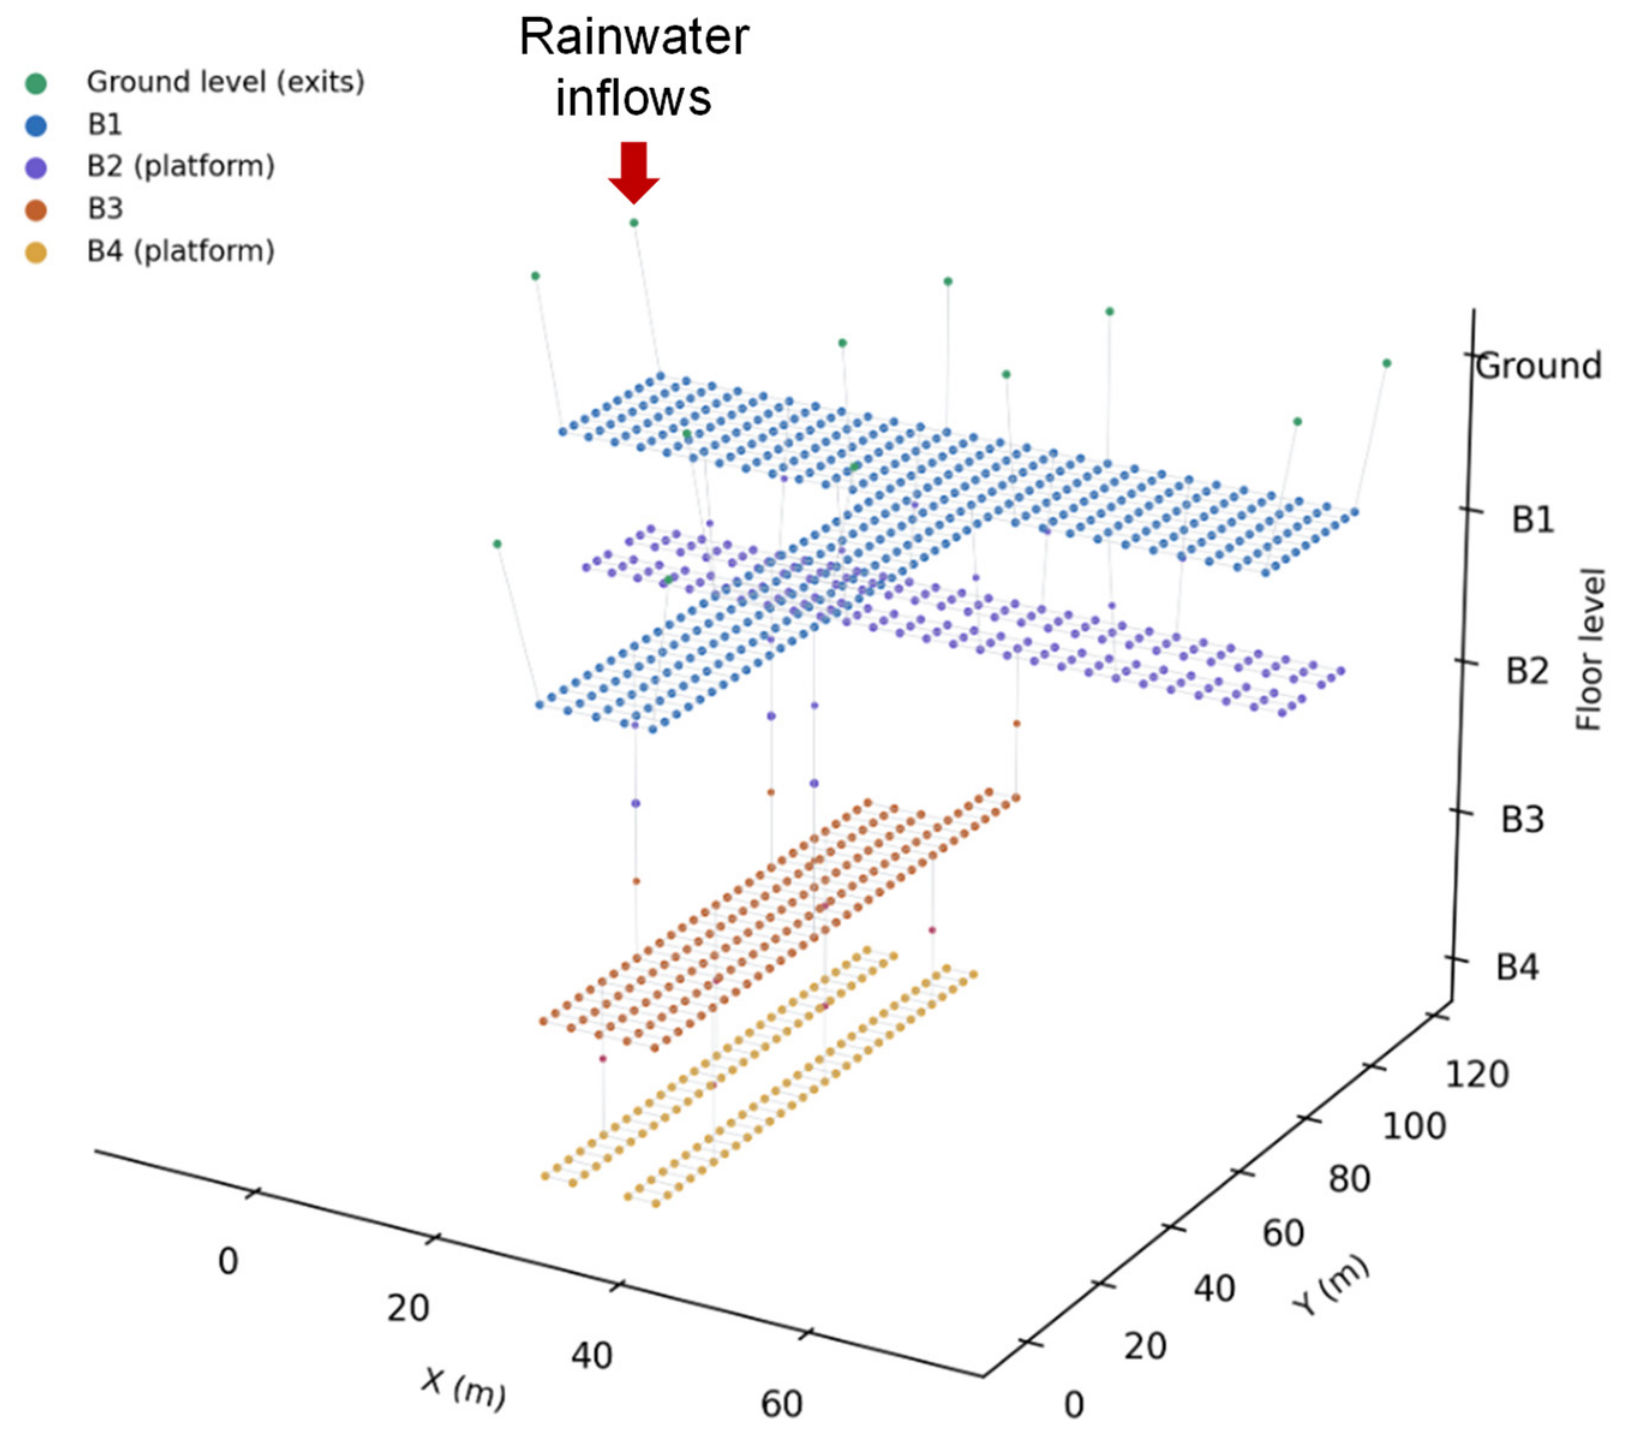
The evacuation model developed in this study represents an actual subway station located in Seoul, South Korea, selected as the target facility for analysis. The station is a transfer station served by two subway lines and consists of four underground levels (B1–B4), with train platforms located on the second underground level (B2) and the fourth underground level (B4). A total of twelve exits were identified for the station, all situated at the ground level and each connected to the underground concourse network through a single dedicated link.
The spatial configuration of the station was discretized into a node–link network, in which nodes represent discrete spatial locations—platform areas, concourses, and stairway landings—and links represent the walkable connections between them. The resulting network comprises 896 nodes and 1544 links in total. Of these links, 1490 connect nodes on the same floor, representing horizontal movement along platforms and concourses, while the remaining 54 links represent vertical movement through stairways connecting adjacent floors. Nodes were spaced at a uniform horizontal interval of 3 m, consistent with typical column-bay spacing observed in platform and concourse layouts.
Vertical connectivity between floors was implemented through stairway landing nodes positioned at intermediate half-levels. Eleven stairway connections link B1 to B2, four link B2 to B3, and six link B3 to B4, reflecting the reduced number of direct vertical access points at greater depth. The B2 and B4 platform levels comprise 162 and 120 nodes, respectively, consistent with the occupant-loading configuration summarized in Table 1.
Table 1.
Node-based occupant allocation for platform levels.
Based on peak-hour ridership data, occupant loading was applied to the platform levels to represent a conservative, worst-case evacuation scenario. Because the simulated evacuation completes within 600 s in all scenarios, platform waiting populations were derived from the peak 10-min pedestrian flow volume rather than a full peak-hour boarding volume, in order to more closely match the time scale of the evacuation event itself.
In addition to waiting passengers, occupants aboard an arriving train were included to represent the most congested moment at the station—the instant of train arrival.
The combined populations at each platform were then evenly distributed across the corresponding platform nodes and rounded to the nearest integer to construct the initial occupant distribution for the evacuation simulation, as presented in Table 1. As summarized in the table, the train-arrival side platform on the B2 level (81 nodes) was assigned 15 waiting occupants and 9 additional train occupants per node, yielding 24 occupants per node; the opposite-side platform on B2 (81 nodes) was assigned 15 occupants per node with no train contribution. On the B4 level, the train-arrival side platform (60 nodes) was assigned 14 waiting occupants and 6 additional train occupants per node (20 occupants per node), while the opposite-side platform (60 nodes) was assigned 14 occupants per node. Table 1 is placed immediately following this paragraph, alongside the corresponding station layout and node–link network illustrated in Figure 1.
Figure 1.
Node-link network model of the underground station.
2.2. Inundation Simulation Model
In this study, EPA SWMM (version 5.2) was employed as a hydraulic solver to simulate inundation flows within the underground station. The simulation results were subsequently incorporated into the evacuation route-selection algorithm to account for flood-induced reductions in pedestrian walking speed. Instead of resolving detailed local flow fields, the station was discretized into a pseudo-two-dimensional storage–link network, while hydraulic routing within each link remained one-dimensional. The storage-link network approach has been applied for urban inundation modeling [17,18]. The hydraulic network was constructed to be spatially consistent with the node–link structure of the evacuation model. The floor area associated with each evacuation node was represented by a SWMM storage unit with a plan area of 3 m × 3 m. Water depth was therefore calculated for each storage cell, assuming a level floor and a uniform water-surface elevation within the cell. Adjacent storage cells were connected by rectangular open-channel conduits representing the principal pathways of water exchange between neighboring floor areas.
Dynamic Wave routing was adopted to solve the full one-dimensional Saint-Venant equations along the conduits. This formulation allowed unsteady flow, backwater effects, and flow reversal to be represented within the interconnected network [19]. Stairways connecting different floors were represented as equivalent sloping rectangular open-channel links. The length of each stair link was determined based on the vertical difference between the connected floors and the corresponding stair geometry. This treatment approximated inter-floor water transfer but did not explicitly resolve step-scale flow structures, local plunging, air entrainment, or transverse velocity variations along the stairways. These simplified inundation simulation approaches enabled to calculate inundation depth and velocity connecting the four underground spaces and multiple staircases. The simulated water depth and velocity were then used to estimate inundation-related reductions in pedestrian walking speed for normal males, following the experimental results by Ishigaki et al. [20] as
where and are the walking speed retention factors for corridors and stairways, respectively; is the specific force per unit width (m3/m); is the inundation depth (m); is the flow velocity (m/s); is the gravitational acceleration (m/s2). Although Equations (1)–(3) may not fully represent the demographic diversity of subway users, the equations were fitted to the lower envelope of the experimental observations for safety-oriented assessment. Accordingly, they were adopted in this study as a conservative representation of flood-induced walking-speed reduction. The calculated walking-speed reduction rates were subsequently used to determine the link weights in the evacuation route-selection algorithm.
2.3. Evacuation Simulation Model
Evacuation route selection in this study was modeled using Dijkstra’s algorithm, a graph-based shortest-path method widely applied in network optimization and routing problems. The algorithm operates on a node–link representation of the underground station, where nodes correspond to discrete spatial locations such as platform areas, concourses, and stairway landings, and links represent the connecting pathways between them, each assigned a weight reflecting travel cost such as distance or travel time.
Starting from a given origin node, Dijkstra’s algorithm iteratively expands the search frontier by selecting, at each step, the unvisited node with the smallest cumulative cost from the origin. This selection is typically implemented using a priority queue, which allows the algorithm to efficiently identify the next node to process without repeatedly scanning the entire node set. The cumulative cost to each node is updated whenever a shorter path is found through a newly visited neighbor, and once a node’s cumulative cost is finalized, it is not revisited. This process continues until the destination node is reached or all reachable nodes have been evaluated.
Because the algorithm exhaustively considers cumulative cost across all candidate paths rather than relying on directional heuristics or approximations, it guarantees identification of the globally shortest path between the origin and destination nodes, provided all link weights are non-negative. This property distinguishes Dijkstra’s algorithm from heuristic-based search methods, which can improve computational speed but do not always guarantee an exact optimal solution, particularly in networks where edge weights change dynamically over time.
This exhaustive and deterministic property makes Dijkstra’s algorithm particularly suitable for evacuation planning applications, where reliably identifying the true shortest route—rather than an approximate one—is critical to safety-oriented decision-making. In life-safety contexts such as underground station evacuation, an algorithm that systematically evaluates all feasible paths provides a more defensible basis for route guidance than one that prunes the search space based on estimated distance alone, since the latter may overlook a route that becomes optimal once time-varying hazard and congestion effects are taken into account.
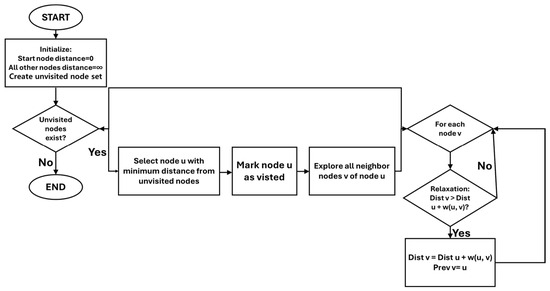
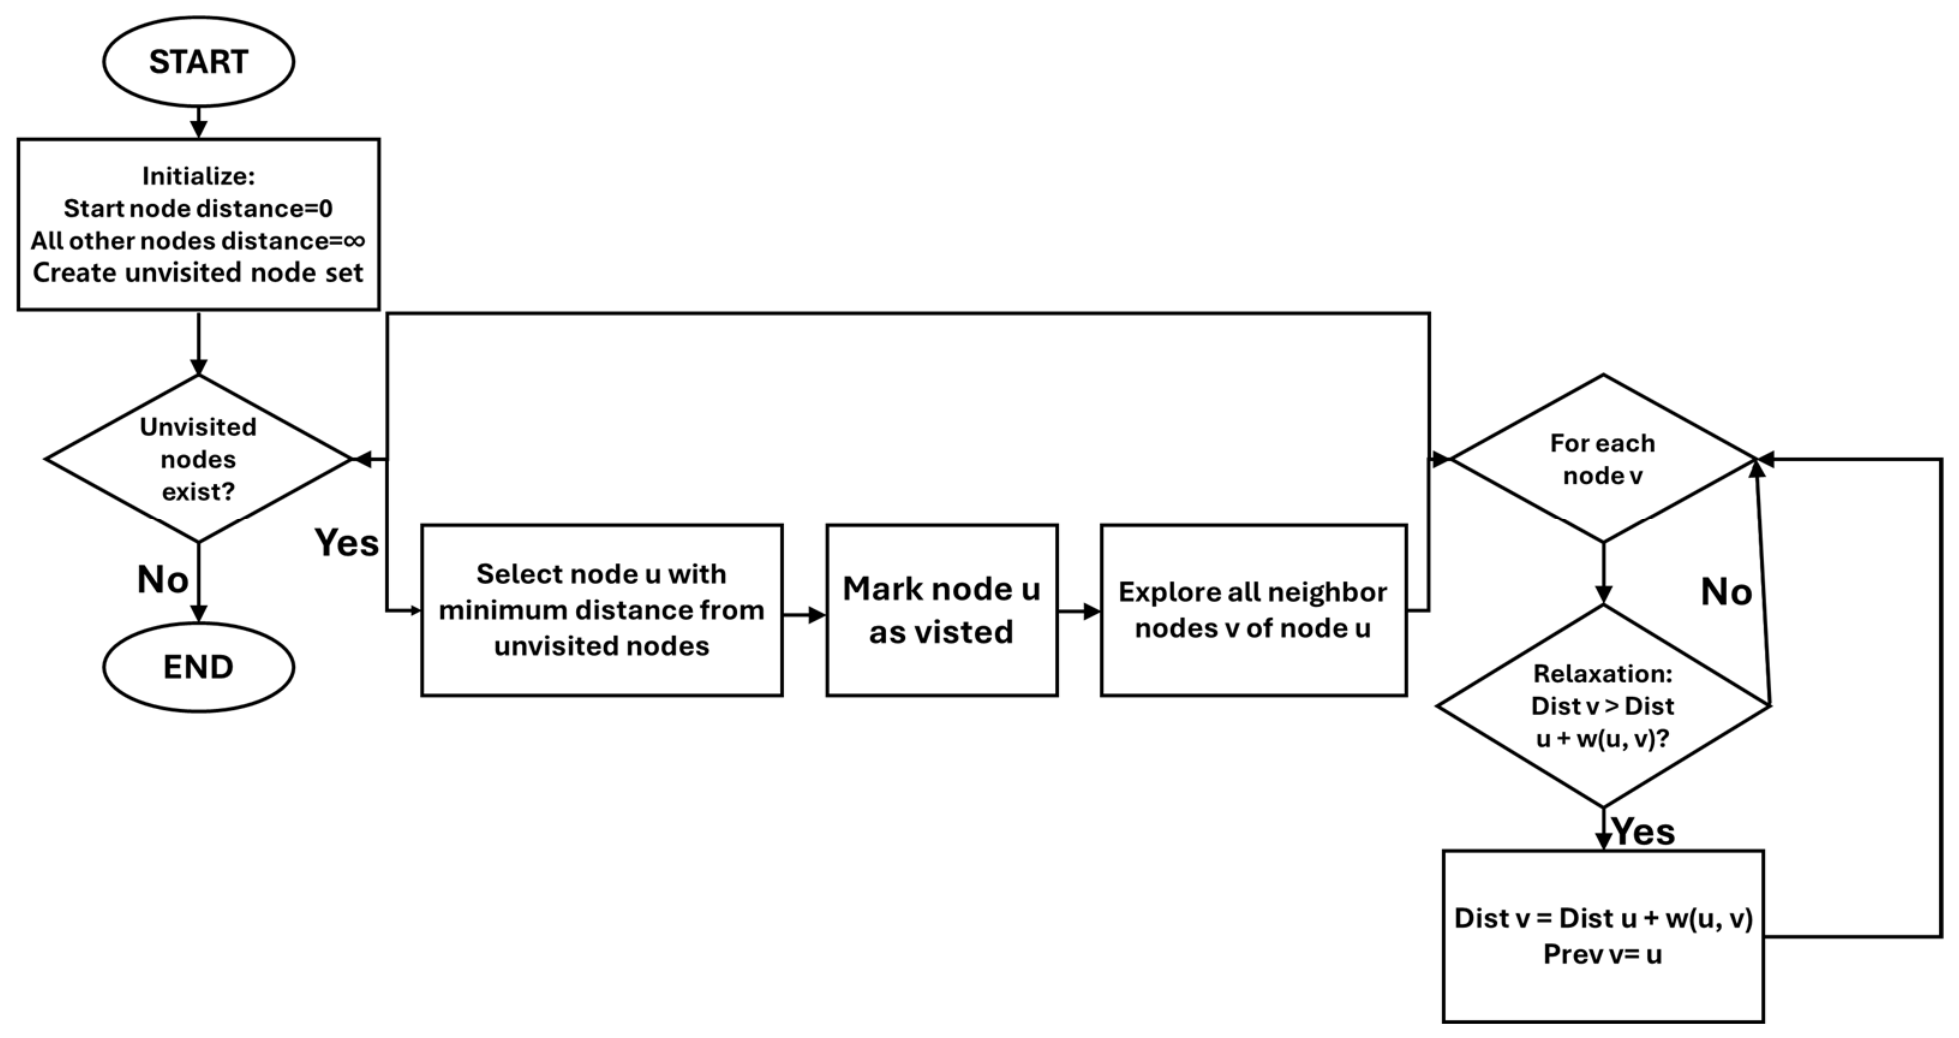
In this study, link weights were dynamically updated during the evacuation simulation to reflect crowd-congestion effects, which were recalculated at each time step based on the evolving nodal occupancy. Flood-induced walking-speed reduction, in contrast, was incorporated as a fixed spatial input corresponding to the prescribed flood condition (300 s or 600 s) at the onset of each scenario, and this component remained constant throughout the simulated evacuation process for that scenario. Because Dijkstra’s algorithm recalculates the shortest path based on the current weight configuration at each evaluation point, it naturally accommodates the real-time re-optimization required by the dynamically evolving congestion component; the flood-induced component, by contrast, reflects a specific stage of flood progression rather than a continuously evolving hazard field. The overall execution procedure of Dijkstra’s algorithm applied in this study is illustrated in Figure 2.
Figure 2.
Dijkstra’s Algorithm Flow Chart [16].
3. Inundation Simulation Results
Surface floodwater entering the station was represented based on a conceptual inundation sequence in which surface flooding around the station causes the external water level to rise above the entrance threshold, resulting in overflow into the underground space. The entrance inflow was represented using a weir boundary because the dominant inflow mechanism was assumed to be overtopping of the entrance threshold and stairway crest. To represent a hypothetical extreme inundation scenario, a constant overflow depth of 0.5 m above the entrance stairway crest was prescribed for 10 min. This condition was selected to represent severe surface inundation capable of producing substantial flood propagation within a large underground station. As shown in Figure 1, the prescribed rainwater inflow was applied to only one of the 12 station exits on B1, while the remaining exits were assumed to remain unaffected by direct floodwater intrusion. The inflow discharge was calculated using the overflow equation proposed by Nakasaka and Ishigaki [21]:
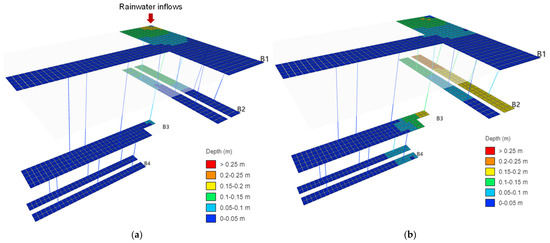
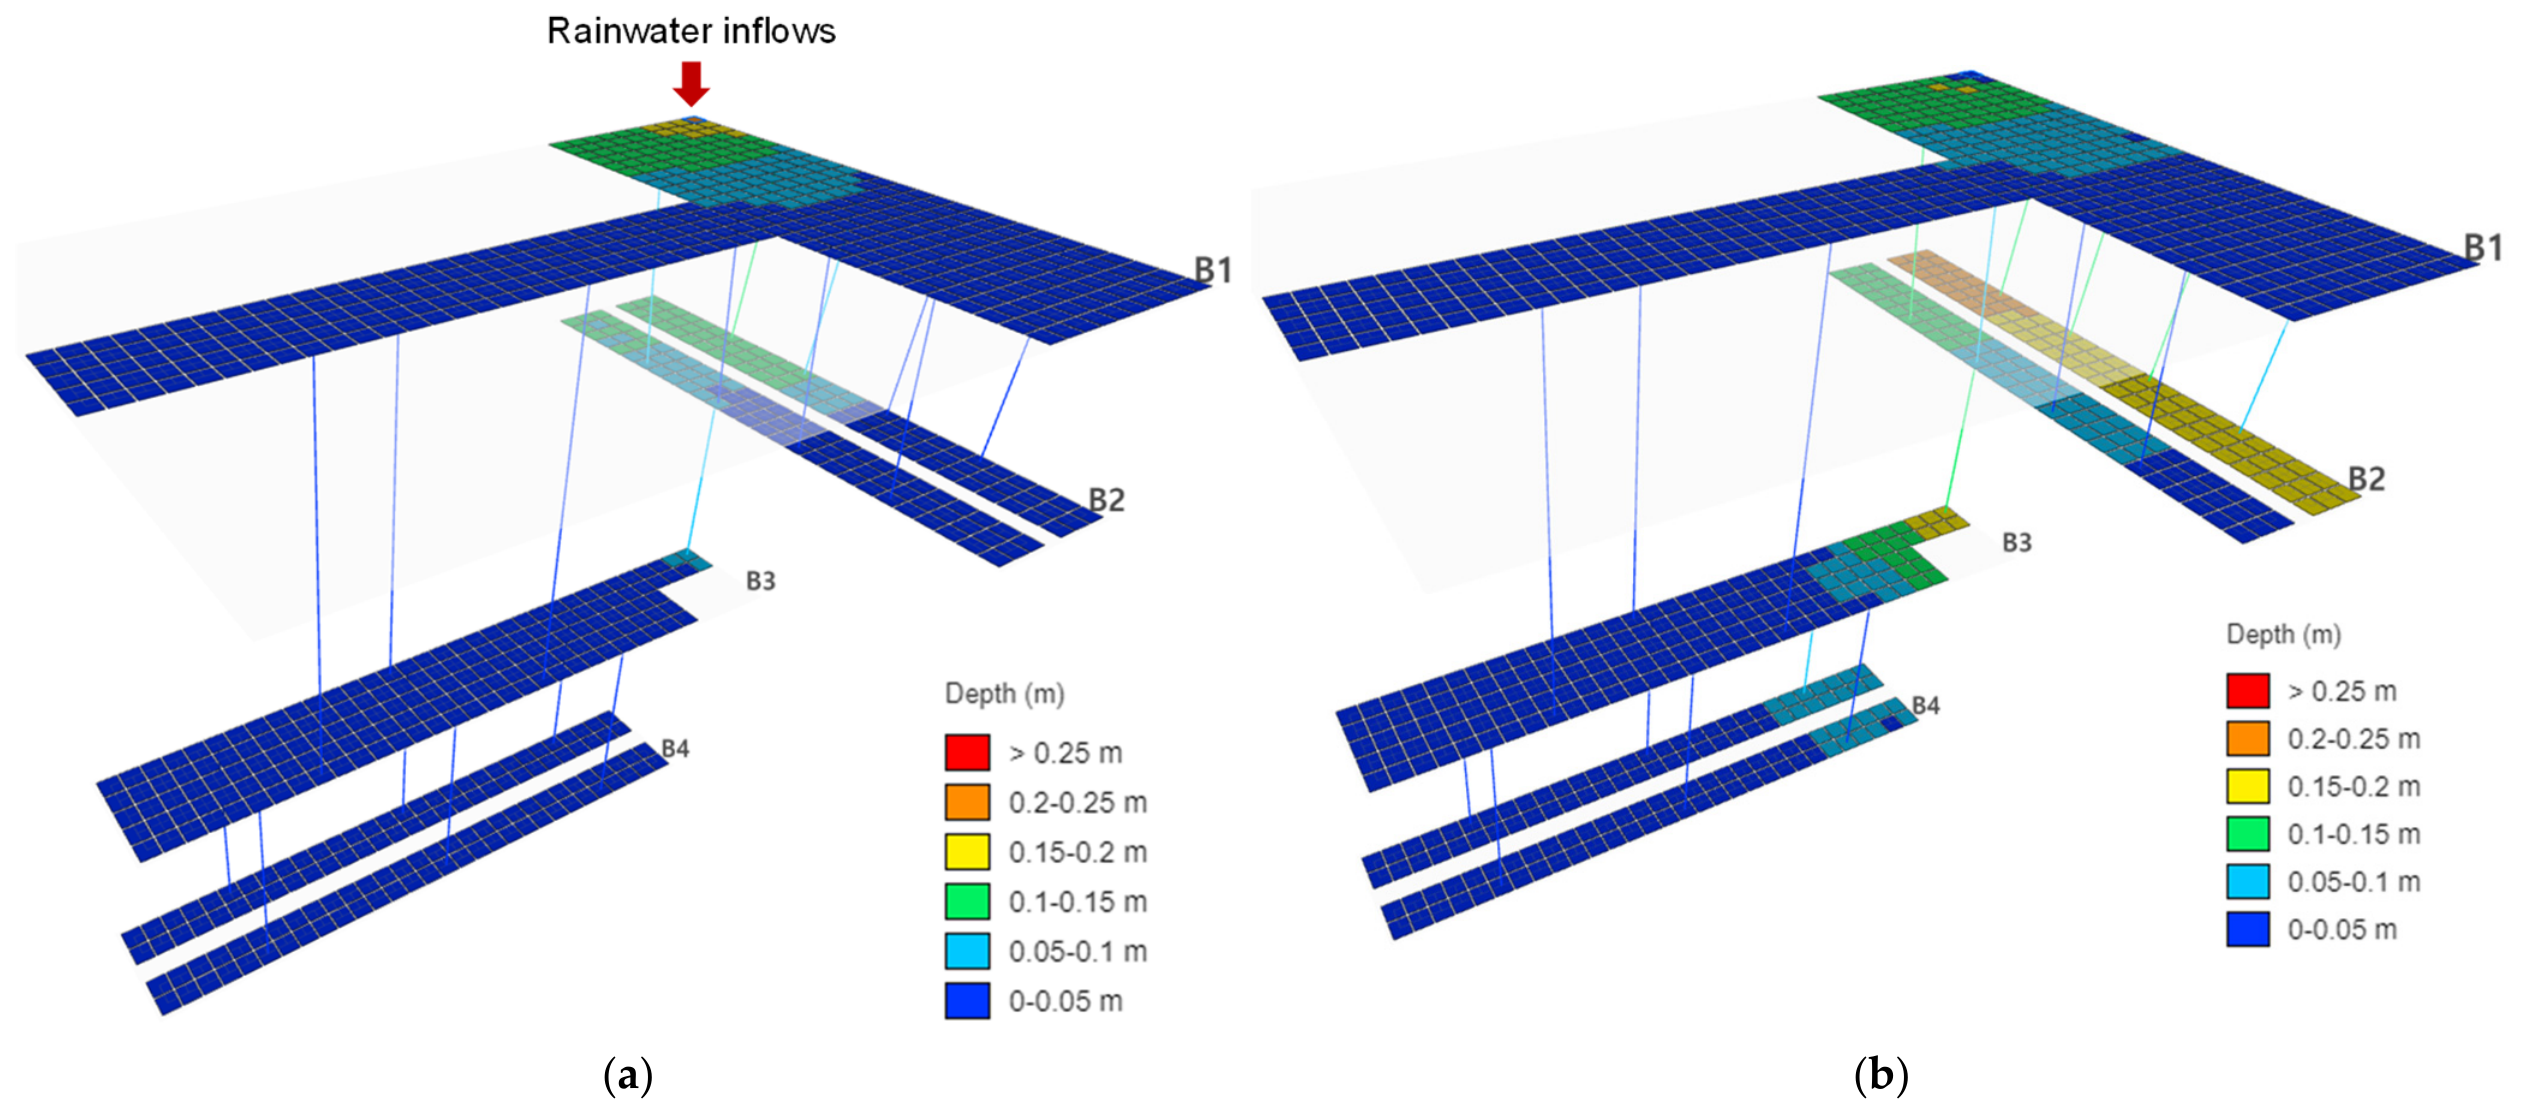
where is the inflow discharge (m3/s); is the discharge coefficient; is the entrance-stair width (2 m), is the overflow depth above the top of the stairway (0.5 m). Figure 3 shows the spatial distributions of inundation depth at 300 and 600 s. At 300 s, inundation was concentrated near the inflow entrance and the adjacent stairway leading to B2. Water depths exceeding 0.10 m occurred in parts of B2, and the floodwater had reached the stairway connecting B2 and B3, resulting in the onset of localized inundation on B3. By 600 s, corresponding to the end of the 10-min inflow period, inundation had expanded substantially across B2 and propagated further toward B3 and B4. Water depths of 0.20–0.25 m occurred on the opposite side of B2, while depths exceeding 0.15 m were widely distributed across the floor. Inundation on B3 remained spatially localized near the stairway connected to the arrival side of B2, indicating downward water transfer through the inter-floor connection. Water depths exceeding 0.05 m were also observed near the stairway leading to B4.
Figure 3.
Simulation results of inundation depth: (a) at 300 s; (b) at 600 s.
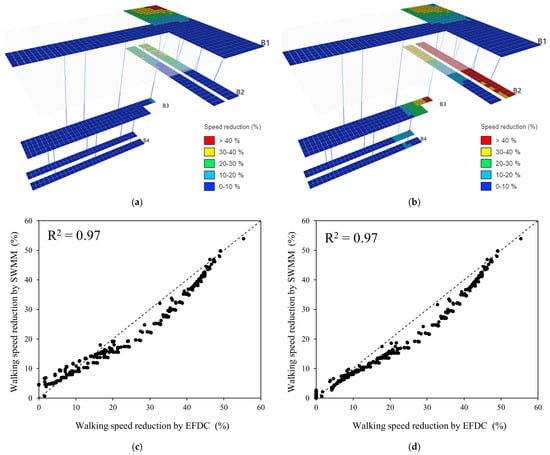
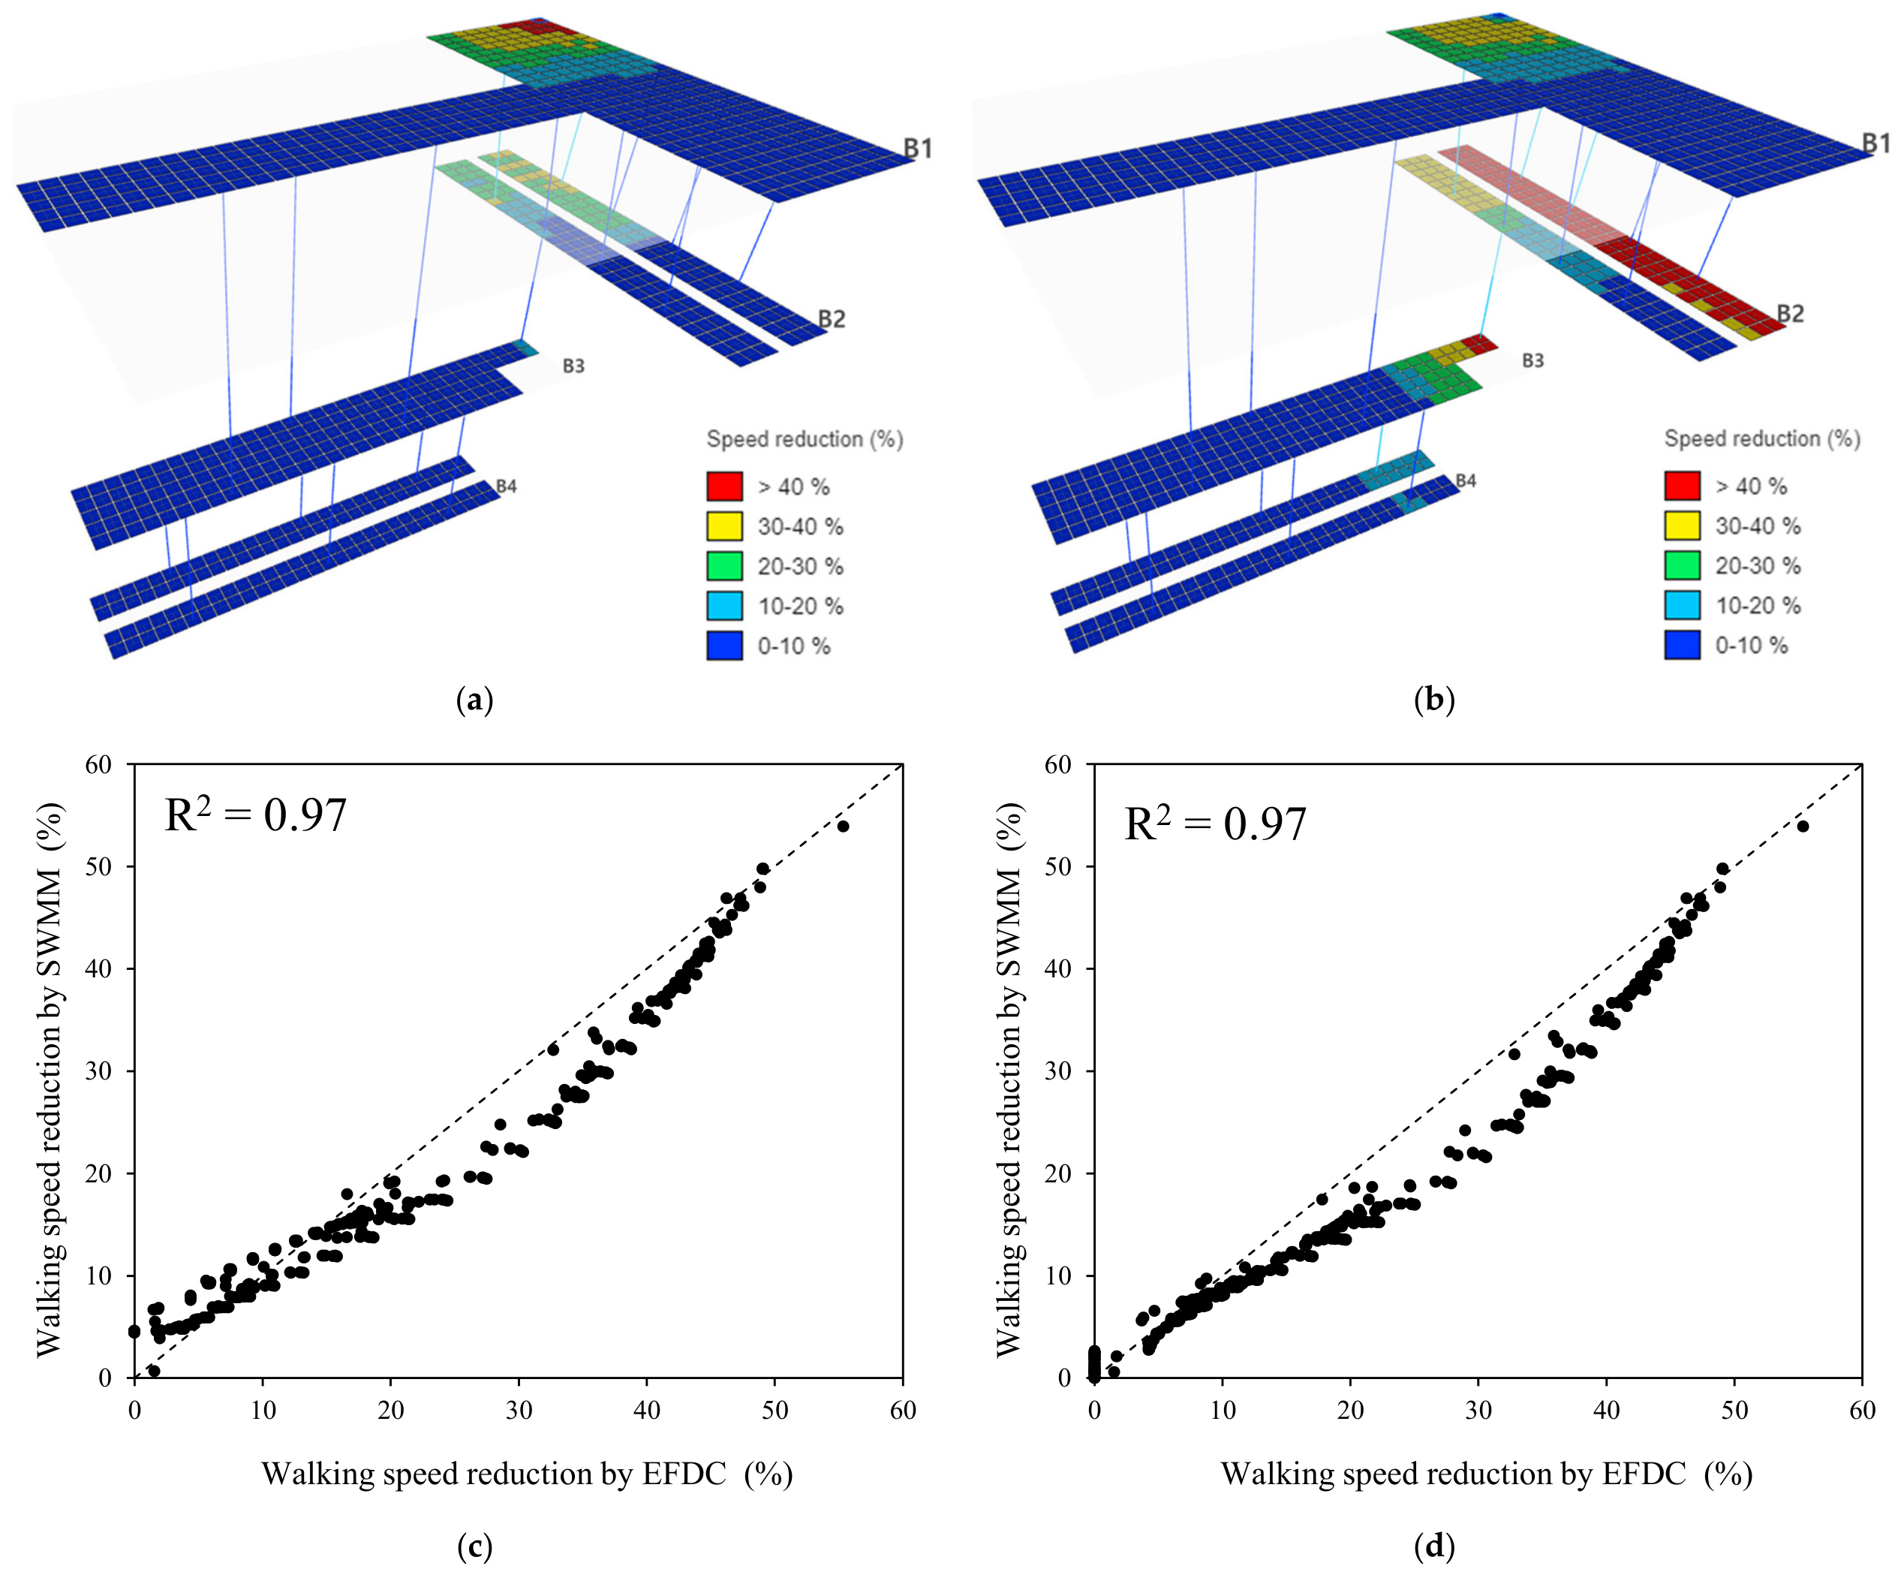
Walking-speed reduction rates were calculated using the inundation depths and flow velocities obtained from the hydraulic simulation. Figure 4 shows the spatial distributions of the walking-speed reduction rate at 300 and 600 s. At 300 s, the walking speed was reduced by approximately 51% near the rainwater-inflow stairway on B1. Similarly, a maximum reduction of approximately 36% occurred on B2 around the stairway receiving floodwater from B1. In contrast, only minor reductions were observed on B3 because inundation had only begun to reach this floor. At 600 s, corresponding to the end of the 10-min inflow period, zones with walking-speed reductions exceeding 40% had developed on the opposite side of B2 and near the stairway connecting B2 and B3. These results demonstrate that the areas experiencing substantial mobility impairment shifted toward the lower floors as inundation propagated through the station. Consequently, delayed evacuation may expose evacuees on the lower floors to increasingly adverse walking conditions, potentially increasing route travel times and the overall evacuation duration.
Figure 4.
Node-based pedestrian walking speed reduction under flood conditions: (a) at 300 s; (b) at 600 s; (c) comparison between pseudo-2D results and EFDC results at 300 s; (d) comparison between pseudo-2D results and EFDC results at 600 s. The dashed line in (c,d) represents the 1:1 line.
To evaluate the applicability of the pseudo-2D representation for evacuation analysis, the calculated walking-speed reduction factors on B1F were additionally compared with those obtained from a depth-averaged 2D simulation using the Environmental Fluid Dynamics Code (EFDC) model. EFDC was configured with a single vertical layer, and the same inflow condition used in the SWMM simulation—a 0.5 m overflow depth maintained for 10 min—was applied. Outflow boundaries were assigned to represent drainage toward the lower levels. Figure 4c and Figure 4d compare the spatial distributions of walking-speed reduction at 300 and 600 s, respectively. The two modeling approaches showed reasonable agreement in the overall spatial pattern of flood-induced walking-speed reduction, with R2 = 0.97 at both 300 s and 600 s. Although local discrepancies remained because of the different hydraulic formulations—storage-link routing in SWMM versus depth-averaged two-dimensional flow simulation in EFDC—the pseudo-2D approach reproduced the station-scale mobility-reduction pattern with reasonable consistency. Accordingly, the simplified SWMM-based representation was considered suitable for the purpose of the present evacuation analysis, while its limitations in representing detailed two-dimensional hydraulic behavior are acknowledged. Based on the walking speed reduction factors derived for the 300 s and 600 s flood conditions, evacuation routes and evacuation times were subsequently derived by applying these time-dependent reduction factors to the evacuation simulation.
4. Evacuation Simulation Results
4.1. Primary Input Parameters
The evacuation simulation requires two categories of input parameters that govern pedestrian movement: baseline walking speed and speed reduction under crowd congestion.
Baseline walking speeds were assigned in accordance with the design guidelines issued by the Ministry of Land, Infrastructure and Transport (MOLIT [22]). A speed of 60 m/min was applied to horizontal movement across platforms, concourses, and corridors, while a reduced speed of 15 m/min was applied to vertical movement along stairways. This guideline deliberately specifies a conservative baseline stairway speed to accommodate the full range of station users, including elderly passengers, children, and other transportation-disadvantaged individuals, rather than reflecting only the free-walking speed of unencumbered adults reported in the general international literature. As this study models an actual Korean underground station, these nationally regulated design speeds were adopted to conservatively represent the general ridership population. These baseline speeds were held constant across all evacuees, isolating the effect of flooding and congestion on evacuation performance. Although the station also includes escalators at several vertical connections, these were modeled as stationary and treated identically to fixed stairways in terms of walking speed and capacity (Table 2), based on the conservative assumption that electrical power to mechanical conveyance systems is lost once flooding begins, consistent with typical emergency shutdown protocols for escalators during station flooding events. This assumption avoids overestimating evacuation performance by crediting evacuees with escalator-assisted movement that may not be reliably available during an actual flood emergency.
Table 2.
Walking speed Reduction Table Based on Crowd Density (Kim et al. 2026) [13].
The initial occupant distribution followed directly from the platform loading condition. A combined population of 5199 evacuees was distributed across the 282 platform nodes on the B2 and B4 levels, following the per-node allocation summarized in Table 1. This loading condition was intended to represent the most congested moment at the station, namely the instant of train arrival, when platform occupancy reaches its peak.
Pedestrian movement was represented using a node-based discrete flow formulation rather than a continuous microscopic pedestrian model. In this formulation, the population assigned to each node advances along the links selected by the pathfinding algorithm, with travel time between nodes determined by link length and the applicable walking speed. At each simulation time step, the number of evacuees present at every node is updated according to the inflow and outflow across connected links, allowing the model to represent large-scale crowd movement efficiently without simulating each individual’s trajectory.
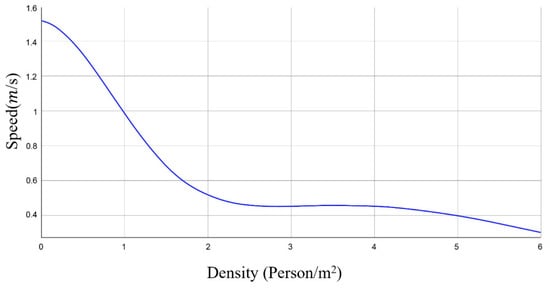
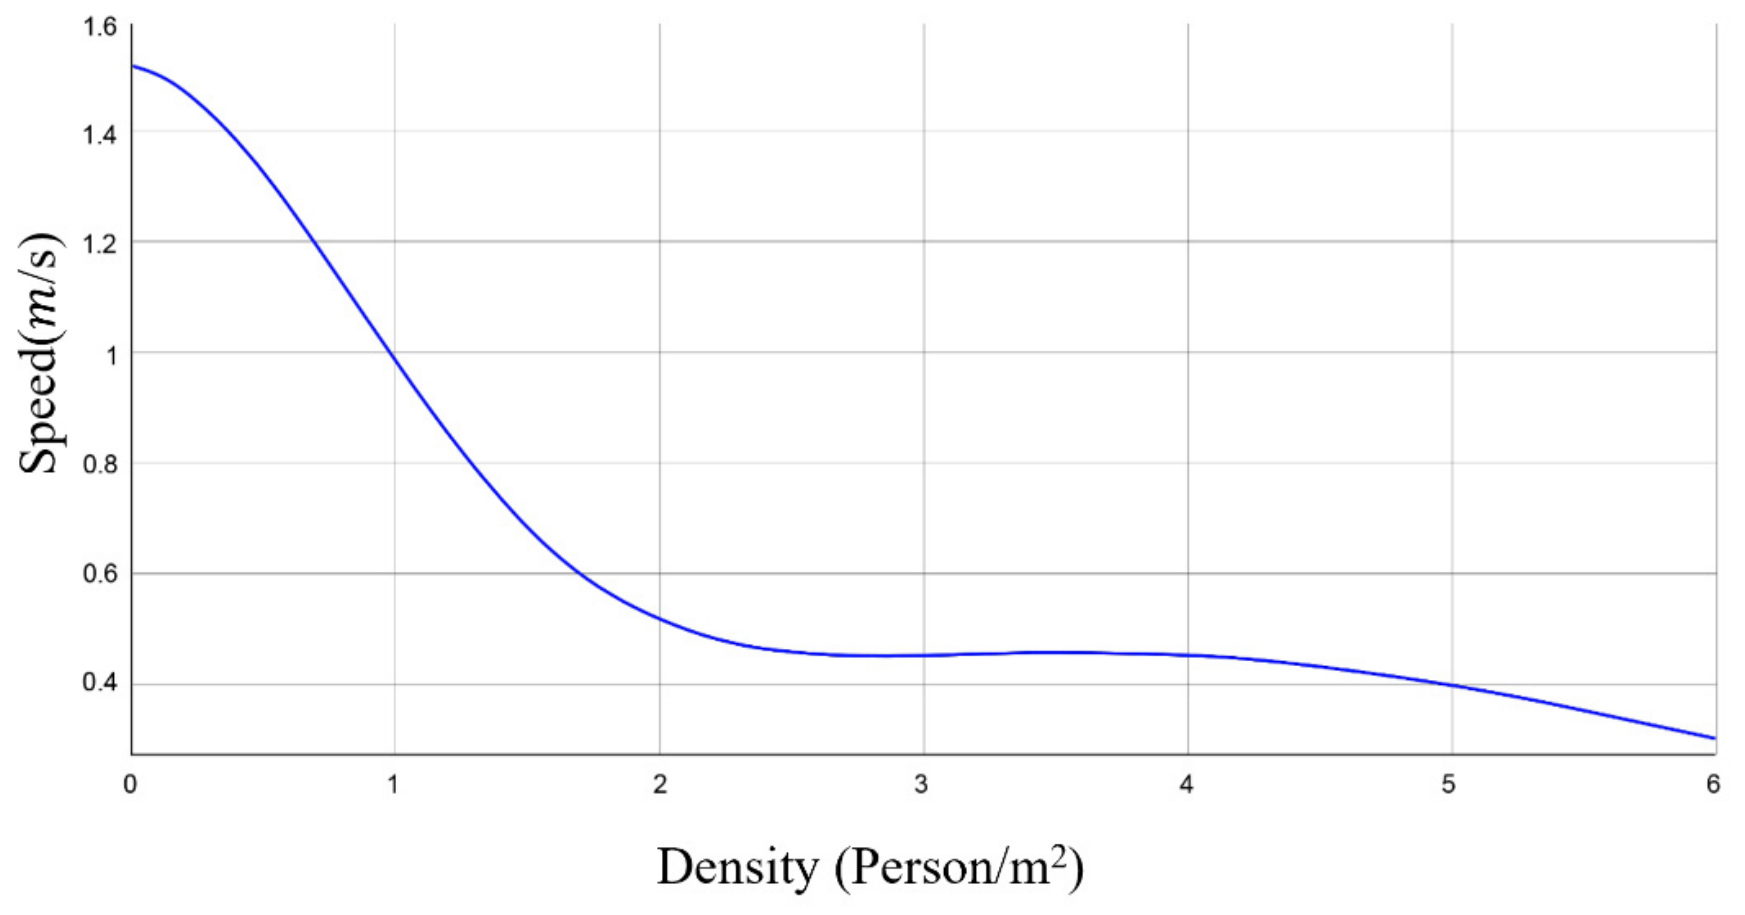
As evacuation proceeds, crowd congestion becomes a critical factor governing movement efficiency, since a concentration of evacuees within a confined node reduces walking speed and can generate localized bottlenecks. To capture this effect, a speed reduction factor was applied to any link whose connecting node held an occupant count exceeding a predefined capacity threshold. The threshold for each node was derived from the product of the nodal floor area and the per-unit-width evacuation capacity specified in the MOLIT design guidelines, which designate 80 persons/(m·min) for horizontal passageways and 60 persons/(m·min) for vertical passageways [22]. Following the node-area-based conversion approach applied by Kim et al. (2026) [13] to a comparable node–link evacuation network, these per-unit-width capacities were first converted to a per-second basis (80 persons/(m·min) = 1.33 persons/(m·s); 60 persons/(m·min) = 1.00 persons/(m·s)) and then scaled by the nodal floor area to obtain an equivalent per-node capacity threshold. Given the uniform 3 m × 3 m (9 m2) nodal spacing adopted throughout the present network, this yields first-tier capacity thresholds of approximately 1.33 × 9 ≈ 12 persons for horizontal nodes and 1.00 × 9 = 9 persons for vertical nodes. The corresponding second- and third-tier thresholds (24/36 persons for horizontal nodes; 18/27 persons for vertical nodes), associated with speed reduction multipliers of 2.5 and 3, were obtained by doubling and tripling the first-tier value, respectively, consistent with the discrete threshold structure adopted by Kim et al. (2026) [13]. These threshold values correspond to nodal occupant densities of approximately 1.3–4.0 persons/m2, which fall within the density range over which walking speed is shown to decline in the video-based density–speed relationship of Zhou et al. (2020) [23], confirming the physical plausibility of the adopted thresholds.
The relationship between pedestrian density and walking speed underlying these thresholds was adopted from the video-based analysis of Zhou et al. (2020) [23], which showed that walking speed declines nonlinearly as pedestrian density increases, with the sharpest reductions occurring under high-density conditions. Building on this relationship, three discrete congestion thresholds were defined for both horizontal and vertical movement, each associated with a corresponding speed reduction multiplier of 2, 2.5, and 3. These multipliers were applied directly to the link weights in the routing algorithm, so that once a node’s occupancy exceeded a given threshold, evacuees passing through it experienced a proportional delay. The density–speed relationship and the resulting threshold values are summarized in Figure 5 and Table 2.
Figure 5.
The fitting curve of the evacuation speed under different density (Zhou et al. 2020) [23].
4.2. Evacuation Time and Route Comparison
To evaluate the impact of flooding on evacuation performance, three scenarios were defined based on the flood duration at the time evacuation commenced: Case 1, representing a non-flooded baseline condition; Case 2, representing evacuation initiated under a 300 s flood condition; and Case 3, representing evacuation initiated under a 600 s flood condition. In Cases 2 and 3, the flood-induced walking speed reduction factors were applied to the corresponding link weights, together with the crowd-congestion reduction factors, so that the resulting evacuation routes and evacuation times reflected the combined effect of flooding and crowd congestion.
The maximum evacuation time and the number of nodes explored during route search are summarized for each scenario in Table 3. The results show a clear increase in maximum evacuation time with longer flood duration, rising from 453 s under the non-flooded condition (Case 1) to 523 s under the 300 s flood condition (Case 2) and 596 s under the 600 s flood condition (Case 3). This corresponds to an increase of approximately 15.5% at 300 s and 31.6% at 600 s relative to the non-flooded baseline. With only three scenarios available, the precise functional form of this increase relative to flood duration cannot be established; we characterize it descriptively below without asserting a specific growth pattern. Notably, while the increase in maximum evacuation time across the three scenarios is close to linear (70 s and 73 s over successive 300 s intervals of flood progression), the number of explored nodes increases at an accelerating rate (14,208 and 18,655 over the same intervals), indicating that the computational search effort required to identify optimal routes grows faster than the resulting evacuation-time penalty itself.
Table 3.
Evacuation performance summary for each case.
This increase in evacuation time is attributable to a shift in which occupant group governs the maximum evacuation time, rather than to a uniform intensification of delay across the network. Flooding, confined to the entrance stairway of one specific exit at the B1 level, raises the link cost along the route to that exit; the routing algorithm responds by directing a smaller share of evacuee flow toward the flooded exit and a correspondingly larger share toward the unaffected exits on the opposite side. This redistribution concentrates occupants onto the non-flooded side, increasing the likelihood that node-level occupancy there exceeds the congestion thresholds and triggering the corresponding speed reduction multipliers—even though that side is not itself subject to flood-induced speed reduction. As flood duration increases, this redistribution effect intensifies, further concentrating flow away from the flooded exit and raising congestion-driven delay on the side that governs the maximum evacuation time.
The number of explored nodes rises from 58,354 in Case 1 to 72,562 in Case 2 and 91,217 in Case 3, an increase of 14,208 and 18,655 over successive 300 s intervals of flood progression—an accelerating trend distinct from the near-linear increase observed in maximum evacuation time. “Explored Nodes” denotes the cumulative number of node evaluations performed by Dijkstra’s algorithm across all route recalculations during the simulation, reflecting repeated re-execution of the algorithm as evacuees move through the network; it therefore exceeds the number of unique nodes in the physical network (896) and is not a count of distinct nodes visited. Because Dijkstra’s algorithm evaluates cumulative cost across all candidate paths before finalizing the shortest route, an increase in explored nodes reflects a larger and more heterogeneous set of link weights across the network, consistent with the flood- and congestion-induced weight adjustments described above. This indicates that the computational cost of route-finding itself rises as disaster severity increases, a factor that may be relevant when considering the feasibility of real-time route guidance under actual flood emergencies.
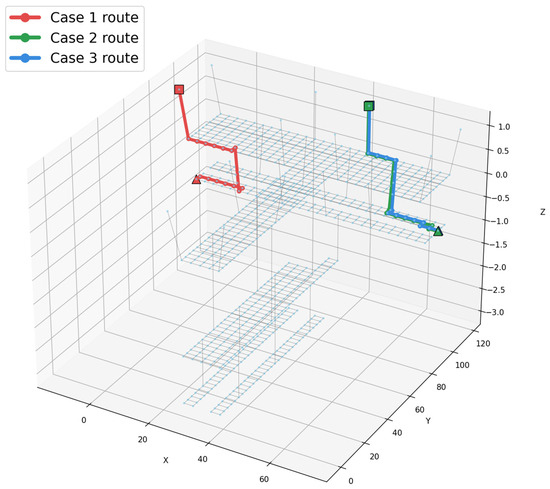
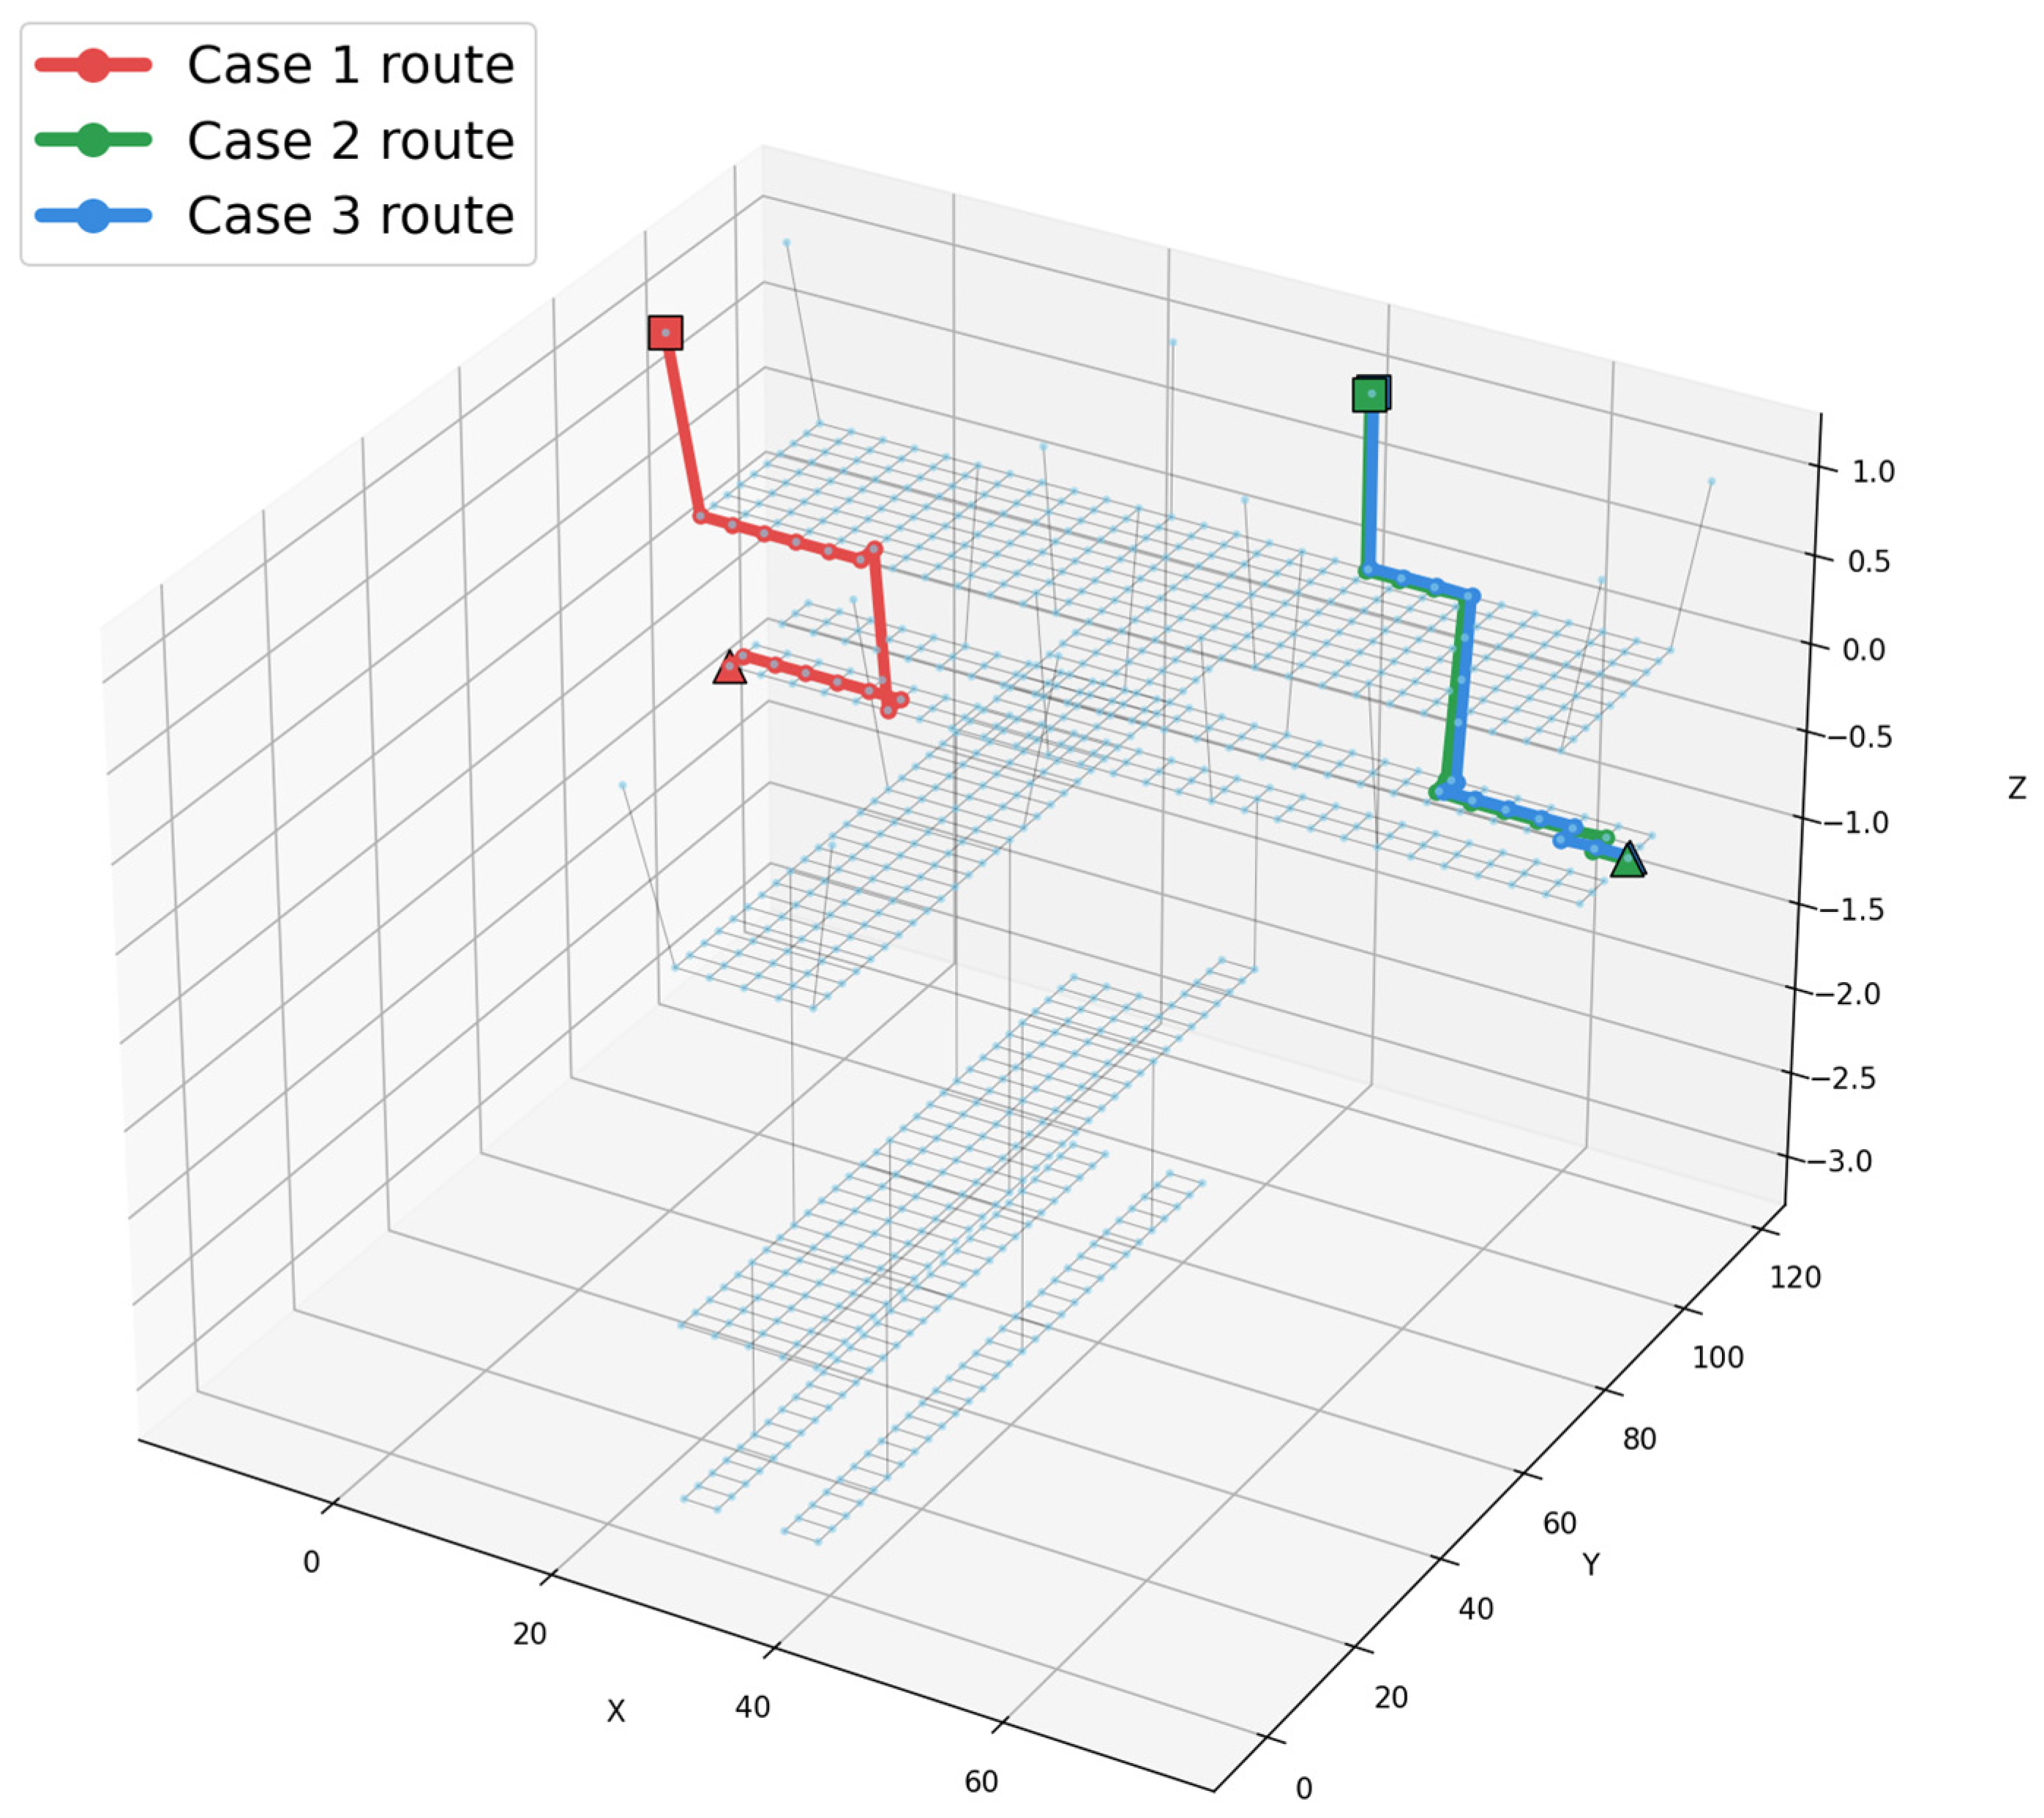
To examine how flood-induced rerouting manifests spatially, the evacuation path of the last evacuated group—the group governing the maximum evacuation time in each scenario—was traced for Cases 1, 2, and 3, as shown in Figure 6. In all three cases, the group originated from the same node and was assigned to the same exit, and the route remained confined to the same two floors. Notably, the physical length of the route followed by the last evacuated group was approximately 78 m in all three cases; the increase in evacuation time observed with flood progression is therefore not attributable to a lengthening of this route, but to a shift in which occupant group governs the maximum evacuation time.
Figure 6.
Evacuation paths of the last evacuated group under Case 1, Case 2, and Case 3. (Triangle: Start point, Square: End point).
Evacuees on the B4 level reach an exit without passing through the B2 platform. Because the B2 platform accommodates a substantially larger occupant population than B4, congestion-driven delay is generally more severe on B2 despite the comparable route length. Under the non-flooded condition (Case 1), the maximum evacuation time is governed by the innermost occupant on the train-arrival-side platform at B2, where local congestion is most severe; combined with the baseline horizontal and vertical walking speeds, this yields a maximum evacuation time of 453 s.
Flooding in the present scenarios originates at the B1 level, at the entrance stairway leading to one particular exit (Section 3), and the resulting speed reduction is confined to that flooded exit and the concourse segments leading to it. Under flooded conditions (Cases 2 and 3), the routing algorithm reduces the share of evacuee flow directed toward this flooded exit in response to its elevated link cost, redistributing relatively more flow toward the unaffected exits on the opposite side. This redistribution intensifies congestion on the non-flooded side, so that the maximum evacuation time shifts there rather than remaining at the flooded exit itself—even though the governing route length (78 m) remains unchanged, and even though that side is not directly subject to flood-induced speed reduction.
5. Discussion
Flood propagation within underground stations is strongly influenced by the spatial arrangement and connectivity of entrances, corridors, connecting passages, and staircases. Consequently, hydraulic conditions can vary substantially even among locations on the same floor [3]. Considerable spatial variations in the depth and rate of water accumulation within a complex interchange station and found that narrow, long, and multi-flight evacuation passages were particularly susceptible to deep water accumulation [24]. The present results also exhibit a spatial heterogeneity: the opposite and arrival sides of B2 experienced different inundation depths and associated reductions in walking speed as floodwater spread through the station. This finding indicates that representing an entire floor as a single hazard zone may overlook locally hazardous sections of an evacuation route. Therefore, evacuation safety should be evaluated at the level of individual corridors, stairways, and route links rather than solely on the basis of floor level or travel distance.
In addition to this horizontal variability, the downward propagation of floodwater through vertical connections creates a progressively expanding hazard for occupants on lower levels. Floodwater entering through station entrances first spreads across concourse areas and subsequently descends through stairways toward the platform and tunnel levels. Based on their 3D simulation results, Shin et al. [4] reported that pedestrians near stairways could be exposed to hazardous conditions during inundation because of the increased hydrodynamic drag exerted by the flow. In the present study, areas with substantial walking-speed reductions expanded from the B1–B2 staircase at 300 s toward the opposite side of B2 and the B2–B3 staircase by 600 s. This downward progression of mobility impairment helps explain the greater increase in evacuation time when evacuation was initiated at a later stage of flooding.
From an evacuation planning perspective, a key implication of these results is that even when evacuees are guided along the optimal route at every stage, flooding still increases evacuation time substantially. In this study, the maximum evacuation time increased by approximately 15.5% under the 300 s flood condition and by 31.6% under the 600 s flood condition relative to the non-flooded baseline, indicating that the penalty imposed by flooding is not fixed but depends strongly on how far the flood has progressed at the moment evacuation begins. In other words, algorithmic optimality alone cannot offset the physical constraints imposed by flood conditions; the routing algorithm can only identify the best path available under a given hazard state, not eliminate the delay caused by that hazard. This also implies that the effectiveness of any evacuation countermeasure is inherently tied to timing—the same guidance strategy may perform adequately if evacuation begins early in a flood event, yet prove far less effective if initiated after the flood has advanced further. Evacuation countermeasures for underground stations must therefore explicitly account for this time-dependent penalty, rather than assuming that optimized routing alone is sufficient to maintain evacuation performance comparable to non-flooded conditions. Practical measures such as earlier evacuation initiation, flood-aware capacity planning for critical routes, or supplementary guidance during the early stages of a flood event may be necessary to compensate for this inherent, time-sensitive delay. Beyond these case-specific findings, one general design implication follows: because flooding at a single exit was found to shift the location of peak congestion to the opposite, unaffected side rather than remaining confined to the flooded exit itself, station capacity planning should not assume that only the directly flood-affected exit requires reinforced egress capacity. Vertical connections and concourse capacity serving flood-unaffected exits should also be sized to absorb this redistributed flow, since the governing bottleneck during a flood event can occur away from the flood itself. This principle is intended to generalize beyond the specific station geometry examined here and to inform the design and retrofit of flood-resilient evacuation infrastructure in underground stations more broadly.
At the same time, the routes and evacuation times derived in this study were computed for evacuation scenarios initiated at fixed flood durations of 300 s and 600 s, meaning that the flood condition was treated as static at the moment evacuation began. In an actual flood event, however, water depth and flow velocity continue to evolve throughout the evacuation process itself, so a route that is optimal at the moment of route selection may no longer remain optimal—or even passable—as flooding progresses further. This represents a limitation of the present study: the evacuation routing framework does not yet incorporate real-time updating of routes in response to ongoing changes in flood conditions during the evacuation process.
In addition to this treatment of flood conditions as static snapshots, several other modeling assumptions carry inherent uncertainty that should be acknowledged. The walking-speed reduction factors applied under flood conditions follow the empirical relationship of Ishigaki et al. (2010) [20], derived from experiments involving normal male pedestrians under controlled flood conditions; applying these coefficients to a general commuting population, which includes a broader range of ages and physical capacities, introduces uncertainty in the absolute magnitude of the resulting delay, although the qualitative trend—slower walking speed with increasing water depth and flow velocity—is expected to hold regardless of the specific coefficient values. In addition, the present model does not explicitly incorporate pedestrian instability or impassability criteria under severe combinations of water depth and flow velocity. Similarly, the crowd-congestion thresholds summarized in Table 2 were derived from MOLIT design capacities and the density–speed relationship of Zhou et al. (2020) [23], both established in prior literature; nonetheless, threshold values obtained under different pedestrian populations or cultural contexts could shift the specific onset density at which congestion-induced delay begins. Additional uncertainty arises from the prescribed hydraulic boundary condition and the simplified inundation-model representation. The prescribed 0.5 m overflow depth represents a hypothetical extreme boundary condition, and variations in the prescribed overflow depth or inflow duration could alter the magnitude and spatial extent of internal inundation. In actual flood events, the external water level and resulting station inflow would vary dynamically depending on rainfall, surface runoff, drainage performance, and local topography; therefore, coupling with an urban stormwater or surface-inundation model is identified as an important direction for future work. Furthermore, the pseudo-two-dimensional storage–link representation adopted for flood propagation simplifies the true three-dimensional hydraulic behavior at stairways and other complex geometries; while this approach is computationally tractable for a station-scale, multi-scenario analysis, it may not fully capture localized flow acceleration or floor-to-floor transfer dynamics that a fully resolved two- or three-dimensional model would represent. Although a full quantitative sensitivity analysis across these parameter families is beyond the scope of the present study, we expect the qualitative conclusions—namely, that flood progression increases evacuation time and shifts the location of peak congestion to the exit side unaffected by flooding—to be robust to reasonable variation in these parameters, since all three assumptions consistently bias the model toward representing hazard severity rather than underestimating it. A systematic sensitivity analysis quantifying the propagation of this parameter uncertainty into evacuation time estimates is identified as a valuable direction for future work.
Addressing this limitation constitutes a clear direction for future research. A more advanced evacuation framework would need to re-evaluate link weights continuously as flood depth and velocity evolve in real time, allowing evacuation routes to be dynamically re-derived as conditions change, rather than being fixed at the onset of evacuation. Such a real-time, flood-adaptive routing model would more realistically capture the interaction between an evolving hazard and evacuee movement, and would provide a stronger basis for evacuation guidance systems intended for actual flood emergencies in underground station environments.
Beyond the hazard-representation limitations discussed above, the practical feasibility of implementing the proposed routing framework within a real-time evacuation guidance system also depends on its computational requirements. As shown in Table 3, the number of explored nodes during route search increased from 58,354 under the non-flooded baseline to 91,217 under the 600 s flood condition, reflecting the added computational burden imposed by dynamically evolving link weights and a narrower set of viable routes. For the moderate-sized network considered in this study (896 nodes, 1544 links), Dijkstra’s algorithm-based route computation is readily achievable within the time scales required for pre-computed guidance; however, in a real-time application where routes must be re-derived every few seconds as flood conditions evolve, computational efficiency becomes an important consideration, particularly for larger, multi-line transfer stations. Heuristic-based alternatives such as the A* algorithm, which has been shown to achieve computation times significantly shorter than Dijkstra’s algorithm while producing identical optimal routes under static hazard conditions [13], may offer a more computationally efficient basis for real-time deployment, provided that route quality under dynamically evolving hazard conditions is carefully validated. Practical implementation would additionally require integration with real-time sensor data, such as water-level and flow-velocity monitoring, and a centralized control architecture capable of updating link weights and broadcasting revised route guidance within operationally meaningful time frames—an integration we identify as an important direction for future work. More broadly, the coupled inundation–evacuation framework developed in this study is well suited to integration within a digital twin of the underground station, in which real-time water-level and flow-velocity readings from distributed sensors continuously update the flood-induced link weights, while occupancy data from ticketing or video-based counting systems update the crowd-congestion weights, together driving a live, station-specific evacuation guidance layer. Such an integration would allow the present offline, scenario-based analysis to evolve into an operational decision-support tool for station operators and emergency responders—for example, by flagging which stairway connections are approaching a hazard-driven threshold in real time, or by pre-positioning guidance signage and personnel toward routes projected to remain viable. Demonstrating this operational pathway, from the scenario-based framework presented here toward a fully sensor-integrated digital twin, represents an important next step toward translating the present findings into practical emergency management capability.
6. Conclusions
This study evaluated the impact of flooding on evacuation performance in an underground subway station by coupling a hydraulic inundation model with a node–link-based evacuation simulation. Using an actual four-level transfer station in Seoul as the target facility, water depth and flow velocity obtained from the inundation simulation were converted into walking-speed reduction factors and applied to link weights in a Dijkstra-based evacuation routing model. Evacuation performance was compared across three scenarios—a non-flooded baseline and evacuation initiated under 300 s and 600 s flood conditions—to quantify how flood progression affects both evacuation time and route selection.
The results showed that maximum evacuation time increased from 453 s under the non-flooded condition to 523 s and 596 s under the 300 s and 600 s flood conditions, respectively, corresponding to increases of approximately 15.5% and 31.6%. This increase indicates that the penalty imposed by flooding on evacuation performance is not fixed but grows as flood duration extends, driven by the compounding interaction between flood-induced speed reduction and crowd congestion within the network. Tracing the path of the last evacuated group further showed that this delay arises not from a change in route length—the governing route measured approximately 78 m in all three cases—but from a shift in which occupant group governs the maximum evacuation time. Because flooding in this study originates at the entrance stairway of one specific exit at the B1 level, the routing algorithm redirects evacuee flow away from that flooded exit and toward the unaffected exits on the opposite side; this redistribution intensifies congestion on the non-flooded side, causing the maximum evacuation time to shift there rather than remaining at the flooded exit itself.
These findings demonstrate that even an optimal routing algorithm cannot fully offset the physical constraints imposed by an evolving flood hazard, and that the effectiveness of evacuation guidance is inherently tied to how early evacuation begins relative to flood onset. Evacuation planning for underground stations should therefore explicitly account for this time-dependent penalty rather than relying on route optimization alone to maintain evacuation performance comparable to non-flooded conditions.
This study is limited by its treatment of flood conditions as static at the moment evacuation begins, whereas actual flood events continue to evolve throughout the evacuation process. Future work should extend the present framework toward a real-time, flood-adaptive routing model capable of continuously updating link weights and evacuation routes as flood depth and velocity change, providing a more realistic basis for evacuation guidance systems in underground stations during actual flood emergencies.
Author Contributions
D.P.: Writing—original draft, methodology. I.P.: methodology, visualization. M.Y.: review and editing, conceptualization, visualization. D.S.R.: Writing—review and editing, conceptualization, methodology. The authors confirm that this work has not been published before. All authors have read and agreed to the published version of the manuscript.
Funding
The research for this paper was carried out under the KICT Research Program (Project no. 20260161-001, Development of Digital Urban Flood Control Technology for the Realization of Flood Safety City) funded by the Ministry of Science and ICT.
Institutional Review Board Statement
Not applicable.
Informed Consent Statement
Not applicable.
Data Availability Statement
The original contributions presented in this study are included in the article. Further inquiries can be directed to the corresponding authors.
Acknowledgments
The research for this paper was carried out under the KICT Research Program (Project no. 20260161-001, Development of Digital Urban Flood Control Technology for the Realization of Flood Safety City) funded by the Ministry of Science and ICT.
Conflicts of Interest
The authors declare no conflicts of interest.
References
- Hou, J.; Chen, G.; Zhang, Y.; Li, B.; Yang, S.; Tong, Y.; Zhang, D.; Fu, D. A simulation study on risks of pedestrian evacuation from flooded staircases of different slopes in the underground space. Nat. Hazards 2022, 110, 519–543. [Google Scholar] [CrossRef] [Scilit]
- Lin, Z.; Hu, S.; Lin, H. Flow Pattern and Escape Hazards of People from Flood Intrusion into the Staircase of Underground Spaces with Multiple Rest Platforms. Buildings 2024, 14, 941. [Google Scholar] [CrossRef] [Scilit]
- Wang, M.; Chen, G.; Liu, W.; Cui, C. Numerical simulation and disaster prevention strategies for flood intrusion process in subway stations. Int. J. Disaster Risk Reduct. 2024, 114, 104984. [Google Scholar] [CrossRef] [Scilit]
- Shin, J.; Rhee, D.S.; Park, I. Analysis of inundation flow characteristics and risk assessment in a subway model using flow simulations. Appl. Sci. 2024, 14, 8096. [Google Scholar] [CrossRef] [Scilit]
- Kim, H.-J.; Rhee, D.S.; Song, C.G. Numerical Computation of Underground Inundation in Multiple Layers Using the Adaptive Transfer Method. Water 2018, 10, 85. [Google Scholar] [CrossRef] [Scilit]
- Shin, E.; Kim, H.J.; Rhee, D.S.; Eom, T.; Song, C.G. Spatiotemporal flood risk assessment of underground space considering flood intensity and escape route. Nat. Hazards 2021, 109, 1539–1555. [Google Scholar] [CrossRef] [Scilit]
- Zhang, D.M.; Li, H.Y.; Zhou, W.D.; Chen, S.R.; Huang, Z.K. A multi-layer coupling framework for hydrodynamic simulation of underground station flooding. Tunn. Undergr. Space Technol. 2026, 168, 107208. [Google Scholar] [CrossRef] [Scilit]
- Dijkstra, E.W. A note on two problems in connexion with graphs. Numer. Math. 1959, 1, 269–271. [Google Scholar] [CrossRef] [Scilit]
- Li, Z.Y.; Tang, M.; Liang, D.; Zhao, Z. Numerical simulation of evacuation in a subway station. Procedia Eng. 2016, 135, 616–621. [Google Scholar] [CrossRef] [Scilit]
- Mirahadi, F.; McCabe, B.Y. EvacuSafe: A real-time model for building evacuation based on Dijkstra’s algorithm. J. Build. Eng. 2021, 34, 101687. [Google Scholar] [CrossRef] [Scilit]
- Zhou, M.; Dong, H.; Ioannou, P.A.; Wang, F.Y. Crowd evacuation with multi-modal cooperative guidance in subway stations: Computational experiments and optimization. IEEE Trans. Comput. Soc. Syst. 2022, 10, 2536–2545. [Google Scholar] [CrossRef] [Scilit]
- Haam, S.; Kim, H.; Yoo, M.; Song, W.S. Optimal additional evacuation route analysis in deep underground station structures using Dijkstra’s algorithm. Dev. Built Environ. 2025, 24, 100784. [Google Scholar] [CrossRef] [Scilit]
- Kim, H.; Haam, S.; Yoo, M.; Song, W.S. Algorithmic evaluation of fire evacuation efficiency under dynamic crowd and smoke conditions. Fire 2026, 9, 32. [Google Scholar] [CrossRef] [Scilit]
- Zhu, Y.; Zhou, Z.; Zhou, J.; Xu, X.; Wu, X.; Nie, W. An improved 3D Dijkstra algorithm of evacuation route considering tailings dam failure. Nat. Hazards 2025, 121, 2483–2505. [Google Scholar] [CrossRef] [Scilit]
- Gonzales, S.H.; Vega-Huerta, H.; Maquen-Niño, G.L.E.; De-la-Cruz-VdV, P.; Moquillaza-Henríquez, S.D.; Benito-Pacheco, O.; Cabrera-Diaz, J.; Lázaro-Guillermo, J.C. Optimized earthquake evacuation routes using Dijkstra’s Algorithm and WinQSB. J. Comput. Sci. 2025, 21, 2349–2360. [Google Scholar] [CrossRef] [Scilit]
- Haam, S.; Kang, C.; Kim, H.; Yoo, M. Centralized exit allocation framework for system optimal evacuation in underground stations. Dev. Built Environ. 2026, 27, 100967. [Google Scholar] [CrossRef] [Scilit]
- White, E.; Knighton, J.; Martens, G.; Plourde, M.; Rajan, R. Geoprocessing tools for surface and basement flooding analysis in SWMM. J. Water Manag. Model. 2013, 21, 33–55. [Google Scholar] [CrossRef] [Scilit]
- Beck, J. Comparison of three methodologies for quasi-2D river flood modeling with SWMM5. J. Water Manag. Model. 2016, 24, C402. [Google Scholar] [CrossRef] [Scilit]
- Rossman, L.A.; Huber, W.C. Storm Water Management Model Reference Manual Volume II–Hydraulics; US Environmental Protection Agency: Washington, DC, USA, 2017.
- Ishigaki, T.; Asai, Y.; Nakahata, Y.; Shimada, H.; Baba, Y.; Toda, K. Evacuation of aged persons from inundated underground space. Water Sci. Technol. 2010, 62, 1807–1812. [Google Scholar] [CrossRef] [Scilit]
- Nakasaka, Y.; Ishigaki, T. Vulnerability to mega under- ground inundation and evacuation assuming devastating urban flood. J. Disaster Res. 2021, 16, 321–328. [Google Scholar] [CrossRef] [Scilit]
- Ministry of Land, Infrastructure and Transport (MOLIT). Design Guidelines for Urban Railway Stations and Transfer Facilities (Notice No. 2022-78); MOLIT: Sejong, Republic of Korea, 2022.
- Zhou, J.; Li, S.; Nie, G.; Fan, X.; Xia, C. Developing a revised social force model for pedestrians’ earthquake emergency evacuation. Geomat. Nat. Hazards Risk 2020, 11, 335–356. [Google Scholar] [CrossRef] [Scilit]
- Lin, Z.; Hu, S.; Zhou, T.; Zhong, Y.; Zhu, Y.; Shi, L.; Lin, H. Numerical Simulation of Flood Intrusion Process under Malfunction of Flood Retaining Facilities in Complex Subway Stations. Buildings 2022, 12, 853. [Google Scholar] [CrossRef] [Scilit]

Disclaimer/Publisher’s Note: The statements, opinions and data contained in all publications are solely those of the individual author(s) and contributor(s) and not of MDPI and/or the editor(s). MDPI and/or the editor(s) disclaim responsibility for any injury to people or property resulting from any ideas, methods, instructions or products referred to in the content. |
© 2026 by the authors. Licensee MDPI, Basel, Switzerland. This article is an open access article distributed under the terms and conditions of the Creative Commons Attribution (CC BY) license.