


Abstract
The growth of big data ecosystems has shifted the classical paradigm of selective storage toward an approach that preserves large volumes of heterogeneous data for subsequent exploitation, thereby strengthening the adoption of repositories such as data warehouses and, particularly, data lakes. In this context, data ingestion from multiple sources, formats, and structures is a critical activity in implementing and operating these environments. However, it is often carried out in a highly ad hoc manner, with low levels of standardization and with variability managed informally. Beyond the operational complexity of ingestion itself, the variability in features such as source types, ingestion frequencies, transformation needs, and loading strategies constitutes an additional engineering problem that must be addressed systematically. This work tackles both issues in the context of a consulting firm involved in data migration projects to data lakes under governance constraints defined by clients in the BFSI sector. The goal is to formalize the data ingestion process through an architecture that provides technical, documentation, and training support for engineering teams, while also incorporating a variability management tool to model, analyze, and guide the configuration of ingestion solutions according to project-specific needs. In this way, the proposal seeks to reduce uncertainty, improve development quality, optimize resource utilization, and provide a more systematic treatment of variability in data ingestion projects. The proposal was evaluated through a structured survey answered by two cohorts totaling 29 respondents: an enterprise cohort of 15 practitioners (60% of the firm’s staff) and a prospective cohort of 14 engineering interns. For the enterprise cohort, the survey obtained average scores of 76 (individual) and 83.1 (role-averaged) for usability and 85.71 (individual) and 91.56 (role-averaged) for perceived quality; for the intern cohort, the corresponding individual averages were 70.18 for usability and 74.74 for perceived quality. In addition, a before/after comparison against the previous ad hoc workflow, covering objective engineering indicators, was conducted with both cohorts, providing task-based evidence that complements the perception-based results.
1. Introduction
Today, the data storage paradigm has shifted from preserving only the data considered important under storage constraints to retaining virtually all available raw data, allowing their potential informational value to be assessed later [1,2]. This shift has driven the industry toward the conceptualization and construction of repositories such as data warehouses (DWs) and data lakes (DLs) to enable the processing of large and diverse data volumes at adequate speeds [3,4]. These properties are characteristic of big data, a domain in which DLs and their associated processes are designed as storage components for data of variable structures and formats, high volumes, and continuous generation.
From this perspective, DLs have emerged as an alternative to traditional relational database management systems (RDBMSs) and the RDBMS-based DW. The concept reflects the idea of a lake composed of several zones separated according to distinct criteria, typically segregating the area where multiple unprocessed datasets are received from diverse sources, formats, and structures, which are subsequently processed, refined, and analyzed in dedicated zones [3,5].
Consequently, migrating data from heterogeneous sources, also known as data ingestion, is crucial for DL implementation. Because ingestion exhibits source-specific characteristics, this complicates the normalization and standardization of its development. To manage this, organizations often design each ingestion process in a quasi-artisanal, tailor-made manner, without consolidated standardization or an architecture that provides systematic support [3,6]. This situation can entail substantial risk, since the inappropriate selection of components in a big data initiative may lead to project failure [6].
However, the challenge is not limited to the operational complexity of ingestion alone. In practice, ingestion processes vary across multiple features, including source types, file structures, ingestion frequencies, triggering conditions, validation rules, transformation requirements, loading strategies, and governance constraints. When these differences are addressed informally, commonalities and variabilities remain implicit, hindering reuse, documentation, training, and decision-making. From a software engineering perspective, this type of problem can be treated as a variability management concern, where a family of related solutions must be described in terms of shared and variable characteristics, in order to support systematic analysis, configuration, and evolution [7,8,9,10].
The consulting firm where the present project was developed is not an exception to this scenario. The organization routinely faces the challenge of ensuring consistency between source and target systems while dealing with the inherent complexities and particularities of data ingestion. As building and executing ingestion processes are among the most frequent activities in this context, having a reference architecture is desirable. This architecture would formalize the components of the data ingestion process, improving the quality of implementation, strengthening documentation, and establishing a common conceptual framework. At the same time, since ingestion scenarios vary from one project to another, this architecture should be complemented by a variability management mechanism that offers configurable options and guides the selection of appropriate ingestion solutions for each case [8,11].
Establishing a reference architecture would yield multidimensional benefits. Most directly, it would improve data ingestion processes by defining an explicit set of features and attributes; additionally, it could strengthen requirement elicitation and serve as a foundational training and documentation asset once formalized. Given the nature of the discipline, such an architecture must remain flexible and evolve over time, incorporating new elements or updating existing ones. For this reason, the proposal should not only document a static architecture but also provide a way to manage its variability through a supporting tool that allows the modeling, analysis, and guided configuration of ingestion alternatives [7,9,11].
Accordingly, the purpose of this work is to propose a solution to the described problem by formalizing the data lake ingestion process, defining a supporting architecture, and documenting it as a technical support and training resource for engineers. In addition, the proposal incorporates a variability management perspective through a tool intended to model, analyze, and guide the configuration of ingestion solutions according to project-specific needs. In this way, the proposal is expected to reduce uncertainty when approaching the task and to support the more efficient use of resources, from onboarding and training to the definition of new data ingestion initiatives; the extent to which these expected benefits materialize is assessed in this work through practitioners’ perceptions, while their objective measurement is part of the planned follow-up studies.
Regarding scope, this study is conducted and evaluated within a single consulting firm; consequently, its results should be interpreted as evidence obtained in this organizational context and are not claimed to be externally generalizable across firms, regions, or industries at this stage. Additional limitations are those inherent to the enterprise context, such as the confidentiality of sensitive client information and internal processes, as well as the anonymization of participants in the evaluation.
Finally, the project comprises two main work streams. The first focuses on bibliographic research and on building the theoretical foundations to address the problem; the second focuses on the development and qualitative evaluation of the proposal.
Despite this study’s industrial relevance, the specific gap addressed here becomes apparent only when the existing literature is examined in detail. Prior feature model applications in the data domain, such as those of Avci Salma et al. [6,12], model variability at the level of the overall big data stack, where ingestion appears merely as an optional subfeature of data processing and its internal structure is not decomposed. More recent ingestion-oriented proposals either center on transformation and orchestration concerns [13], adopt a technology-specific granularity that limits generalization [14], or formalize ingestion through metadata-driven configuration, without an explicit variability model [15]. As the review reported in Section 4 shows, only seven studies are found to address data lake ingestion architecturally, and none provides a variability-oriented representation that makes the mandatory, optional, and alternative elements of the ingestion process explicit at a granularity that is sufficient to guide implementation and automated configuration. The present work targets precisely this gap.
The key contributions of this work are the following:
- A feature model-based reference architecture for data lake ingestion that makes explicit the mandatory, optional, and alternative elements of the ingestion process at a level of granularity intended to guide implementation decisions;
- An industrial evaluation of the proposal in a consulting firm serving BFSI-sector clients, based on usability and quality instruments, complemented by open-ended feedback and a focused discussion session;
- The characterization of the state of the art in data lake ingestion architectures and software variability in the data domain, combining a systematic mapping study, a brief systematic review, and the documented exploratory use of AI-based research support tools.
The remainder of this paper is structured as follows. Section 2 provides the theoretical background regarding big data, data lakes, ingestion processes, variability, and the VariaMos tool. Section 3 details the research methodology, including the design of the instruments to validate the proposal. Section 4 presents the findings obtained in relation to the research question and the proposal evaluation. Section 5 analyzes the principal results. Finally, Section 6 summarizes the contributions of the paper and identifies directions for future research.
2. Background
The proposed solution emerges from the intersection of an industrial problem and a set of concepts from data engineering and software variability management. Accordingly, this section first characterizes the organizational context in which the ingestion problem was identified and then introduces the theoretical foundations required to understand the proposal, progressing from big data and data lakes to data ingestion, variability management, feature models, and, finally, VariaMos.
2.1. Company Background
The study was conducted in a big data consulting firm founded in 2013, with approximately 25 developers and clients, mainly in the banking, financial services, and insurance (BFSI) sectors. Its core services include data migration and ingestion from legacy systems to cloud or distributed platforms, together with ETL, analytics, and visualization developments defined by client requirements. These engagements require the preservation of consistency between legacy and target systems while addressing the recurrent technical challenges of data ingestion. This setting is consistent with documented experience in the same national and sectoral context: a case study of a Chilean bank migrating from on-premise infrastructure to a cloud-based ecosystem reports that data ingestion processes were previously executed through ad hoc scripts on a pivot server and later replaced by governed, traceable pipelines, underscoring the need for formalized and auditable ingestion in the financial sector [16].
Operationally, developers exhibit heterogeneous levels of knowledge and experience, which leads to non-uniform implementation practices. Ingestion tasks are commonly assigned to developers already familiar with the corresponding process type or, when deadlines allow, to developers who must learn it. Combined with ongoing team turnover, this makes the formalization and consolidation of ingestion knowledge a priority for the organization.
Commercially, initiatives are categorized as projects (developed in-house and delivered as a product, typically involving several developers) or services (developer time embedded in a client-owned team). This study focuses on projects because they concentrate the collaboration between junior and experienced developers, involve fewer client-imposed technical restrictions, and are therefore the setting where a framework supporting decisions and case analysis, independent of the individuals implementing them, is most needed.
This organizational context establishes the practical motivation for the study; ingestion decisions recur across projects, but the knowledge required to make them remains largely dependent on individual experience. To determine how this problem can be systematically addressed, it is therefore necessary to examine the concepts, architectural practices, and variability mechanisms reported in the literature.
2.2. State of the Art
The theoretical background is developed progressively from the broader technological context toward the specific engineering problem addressed in this study. We first introduce big data and data lakes as the environment in which ingestion takes place; we then characterize the ingestion process itself; and, finally, we introduce the variability concepts and modeling mechanisms used to formalize the proposed solution.
2.2.1. Big Data
One of the most significant phenomena of the 21st century is not only the growth in the amount of data produced across domains but also the need to preserve such information in order to extract value from it. In recent decades, this trend has been strongly driven by the accumulation of data generated by social networks and, more recently, by the emergence of the Internet of Things [4].
This evolution has contributed to the consolidation of the term big data, referring to datasets with distinctive properties in terms of volume, variety, and generation speed, which make them difficult to manage using traditional RDBMS technologies, thereby fostering the development of dedicated tools, techniques, and methodologies [3,17,18,19].
Depending on the needs of an industry, organization, or user, relational databases remain the first option within the available technology pool. However, when relational databases are insufficient due to architectural constraints, alternatives such as non-relational databases and the DW become relevant. A DW not only stores information but is also closely aligned with business analytics, data-driven decision-making, and the transformation of data into value.
In response to the emergence of new data types and formats (e.g., from social networks, videos, images, and natural-language or unstructured text), big data adopts DL as a storage component that is capable of handling such formats and properly addressing the 5Vs: volume, variety, velocity, veracity, and value [3,17].
2.2.2. Data Lakes
Before discussing DLs in detail, it is important to frame the concept within a broader context. A data lake is not a monolithic store but a layered architecture in which data progress through several functional components. Recent surveys and reference proposals consistently describe distinct zones or layers for data ingestion, storage, transformation or processing, and access or analysis, each with a clearly defined function and complemented by a cross-cutting governance concern [1,4,20]. Data ingestion is therefore one component among many within the wider data lake context; in this work, we focus specifically on the ingestion process associated with this component.
A data lake is a storage system for heterogeneous unstructured, semi-structured, or structured data, acquired from diverse sources and intended for subsequent transformation and analysis [5]. Compared to the DW as a storage entity, it provides a new set of capabilities and characteristics [21]. These capabilities enable the inclusion of unstructured data with multiple origins and formats and the incorporation of ETL, ELT, and data enrichment processes within the same environment, ultimately making data available for analytics and knowledge extraction.
Sawadogo [4] provides a useful discussion of how to classify DL architectures according to their composition, distinguishing between functional architectures, data maturity-based architectures, and hybrid architectures. While this conceptual taxonomy supports initial decision-making regarding DL construction, it offers limited technical guidance, since current approaches rarely provide concrete architectural options or a technology pool for deploying a DL—and even less so for detailing its internal processes.
Among the architectural families characterized above, the primary focus of this project is those that organize the DL into zones, since these zones make explicit how data are used and progressively refined. Two such approaches are of particular interest, and they differ in the criteria used to separate the zones.
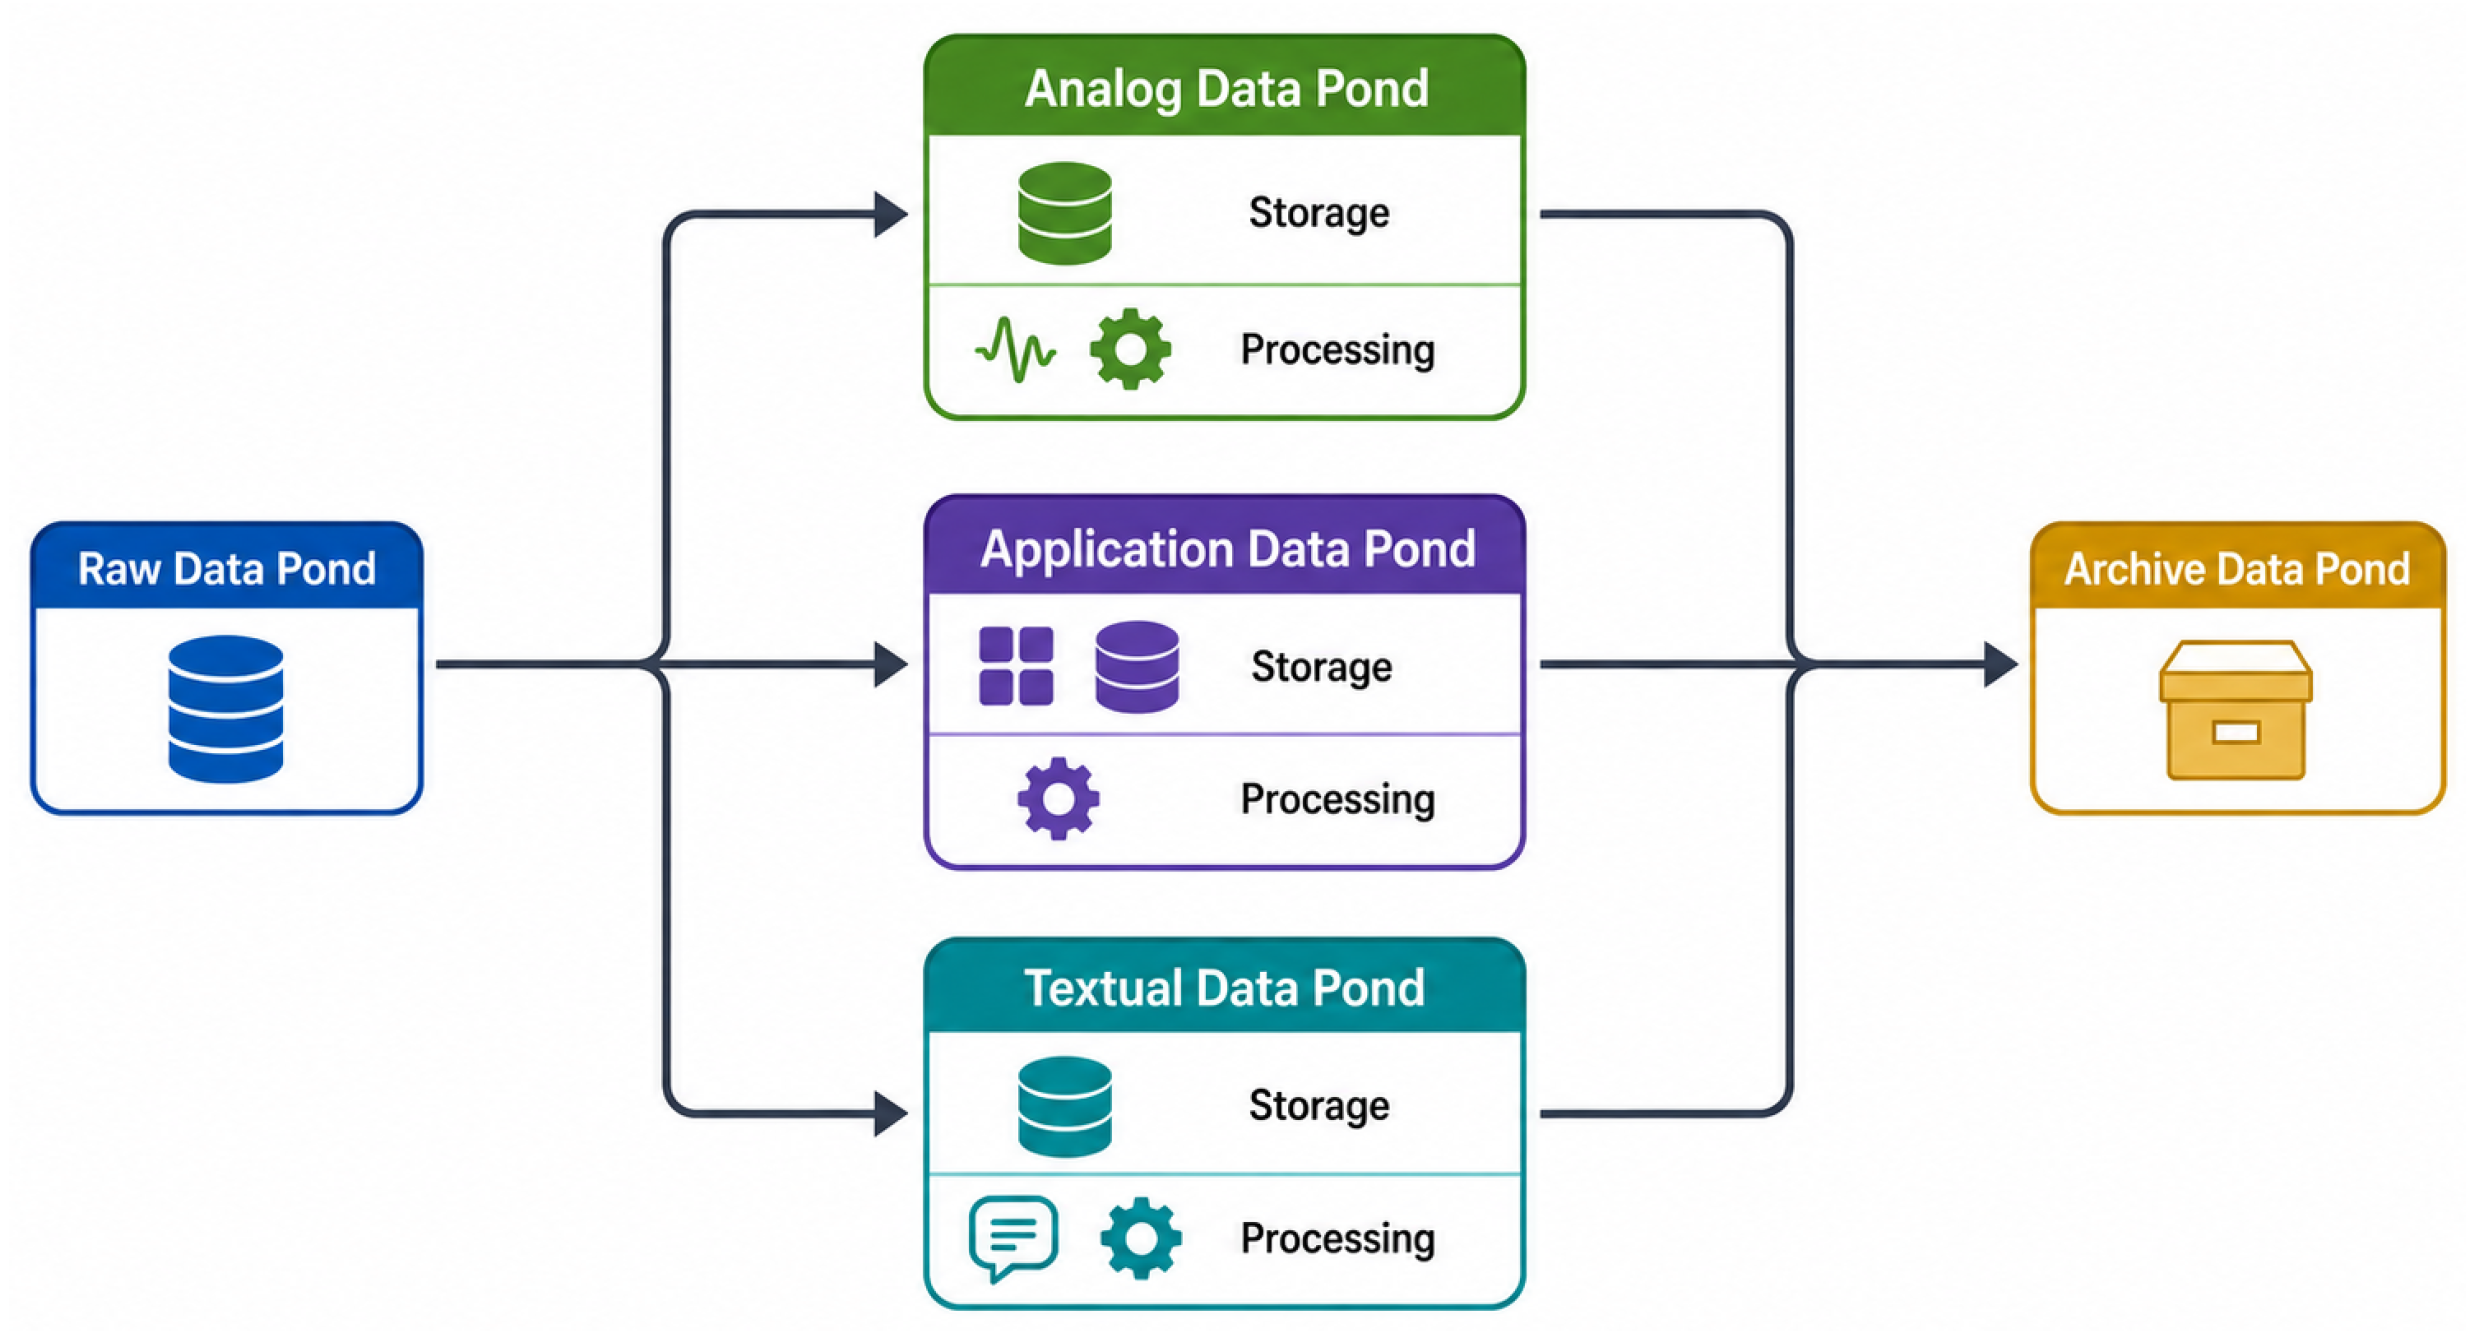
The first, referred to as the pond architecture, separates data according to their profile: it distributes data across different ‘ponds’, each corresponding to a distinct data profile, such as newly ingested data, analog data, data originating from other software, textual data, and archived data. Here, the distribution criterion is the nature of the data themselves, i.e., characteristics such as the data type, origin, or usage frequency, as shown in Figure 1.
The second approach, which is the focus of this work, instead separates data according to their degree of refinement. Rather than grouping data by profile, it maintains data continuity across zones, allowing datasets to progress from a preprocessing or transient stage and raw form through increasing refinement levels until they are made available for consumption, analysis, and knowledge extraction. Within this scheme, presented in Table 1, a practical decision factor is determining which zones should be employed depending on the needs of a specific initiative or project.
Table 1.
Data zones and their main purposes.
Figure 1.
Pond-based data lake architecture organized according to data profiles.
2.2.3. Data Ingestion
Data ingestion refers to the replication of data from multiple sources into the DL, without necessarily deleting the data from their origin. Sources may include relational, non-relational, and distributed database engines; legacy systems; and files of various formats and content types, such as text, images, video, and audio.
From the architectural perspective adopted in this work, ingestion most commonly targets an initial zone referred to as landing or ingest, which is equivalent to the raw zone in Table 1. Data arrive in raw form without special processing, except in cases where specific files or source systems must pass through a prior preprocessing zone (e.g., when the source contains corruption, non-printable characters, or specific business rules that must be applied, such as value encryption or anonymization).
Both paths result in data being available in the landing zone, ready for downstream ETL, ELT, or the construction of new data assets using these or other techniques.
Among the many industries worldwide, banking is particularly distinctive. Its data quality criteria for data curation are stringent; consequently, banks traditionally do not adopt technological changes lightly or at the pace of other sectors when faced with emerging trends.
2.2.4. Data Ingestion Types
Data ingestion can be classified following [22] into three types: batch, streaming, and orchestrated. In general, beyond periodicity and the particular characteristics discussed in the following items, it is important to consider whether ingested data will be stored incrementally.
In incremental ingestion, the target structures the data by retaining all previously ingested content and appending new arrivals, thereby producing an increasingly large consolidated dataset. In non-incremental ingestion, the target may overwrite older data with new data or, depending on business planning, generate a new data structure for each ingestion instance (e.g., a new column, a table, or a partition, among others).
Batch ingestion [22] transports data from the source to the destination at a given periodicity, determined by the nature of the data and their business usage. Accordingly, batch ingestion is characterized by the accumulation of data in the source, which are then ingested together through a single ingestion process for that dataset. This ingestion type is commonly associated with sources in which data may change over time but do so gradually, consistently, and often transactionally (e.g., databases, physical files, or similar storage systems).
Streaming ingestion [22] is also commonly referred to as real-time ingestion. Strictly speaking, true real-time processing is difficult to achieve; therefore, this category often includes near-real-time and micro-batch approaches, which, following the batch principles described above, operate at very short intervals in an attempt to emulate real-time behavior from a functional and conceptual standpoint. Streaming ingestion is characterized by a continuous flow of data and aims to ingest data as they are generated or as close to this moment as possible. This ingestion type is typically associated with sources where data cannot be stored for long periods or in large quantities and must be transmitted immediately after generation or capture (e.g., environmental sensors, transaction listeners, consumers connected to Kafka/Confluent message streams, or social media trend identifiers).
Finally, while batch and streaming ingestion describe how data are transported, orchestrated ingestion [22] describes when data are transported. Consequently, for the purposes of this paper, where the temporal dimension is linked to orchestration components, ingestion will be addressed solely in terms of its classification as batch or streaming.
2.2.5. Data Ingestion Stages
In the industrial context of the consulting firm, the ingestion stages depend primarily on the ingestion types described above and reflect the steps currently used in the company. In addition, each ingestion exhibits a degree of variability and discretion in decision-making, depending on factors such as project maturity, the extent of exploration of the employed technologies, and client-imposed constraints, among others.
For the following description, we consider a common case: a three-zone DL (raw, refined, and trusted) under the terminology used by [4].
Batch Ingestion Stages
Batch ingestion in the company encompasses the following stages:
- The process begins with the capture of source data, typically obtained from transactional systems or files and transferred to a storage system where they can be manipulated by the technology ecosystem (generally HDFS, Azure ADLS, or Amazon S3), using mechanisms that range from Unix command-based copying and SFTP upload to Sqoop or existing connectors.
- The source schema is then defined and encoded, specifying the data types and other fields of interest for the target storage destination.
- On this basis, a DataFrame is created for the source, acting as a preview of the ingested data that enables preliminary data quality analysis and, when needed, more convenient manipulation.
- If required, transformations are then applied, ranging from adding a new column to performing some level of ETL.
- The process concludes by loading the (potentially manipulated) DataFrame into the raw zone of the data lake as a table backed by an AVRO, ORC, or Parquet file, thereby making the data available.
Streaming Ingestion Stages
Based on the batch ingestion stages described above, the primary difference in streaming ingestion lies in the source data capture step. Here, this step is replaced by those described below, while the subsequent batch stages remain applicable.
- The first step in acquiring data via streaming is establishing the connection to the source, which, depending on the case, may range from a simple HTTP protocol to tools such as Kafka/Confluent. The data obtained at this stage are typically called messages, and the entity that produces them is the producer; accordingly, this stage involves not only identifying the producer but also defining the micro-batch interval at which messages are sent or read.
- Next, the consumer is configured. As the counterpart to the producer, the consumer receives the messages for initial handling, and, in a streaming ecosystem, several consumers may receive the same messages in order to support different data usage flows.
- Once the producer and consumer are configured, message serialization and deserialization are set up and executed. In a key–value scheme, the producer’s messages are serialized as byte arrays that are received by consumers, which, using the appropriate key–value mapping, reconstruct these byte arrays back into values.
- From this point on, the data are available and can be manipulated according to the previously described steps: defining the source schema, creating a DataFrame, applying transformations, and loading into the DL.
The stages described above reveal that ingestion processes share a recurrent structural core while differing in multiple implementation decisions, including the ingestion type, source, collection mechanism, transformations, processing requirements, and storage alternatives. Consequently, the problem is not merely to document a single ingestion workflow but to represent a family of related ingestion solutions and the decisions that distinguish one solution from another. This observation motivates the introduction of software variability as the engineering perspective adopted in this work.
2.2.6. Variability
Variability can be understood as the capability of a solution family to accommodate differences in structure, behavior, and configuration while preserving a shared conceptual core. In software product lines (SPLs), this property is treated as a first-class engineering concern because it enables the systematic generation of multiple solution instances from a common base of reusable assets, rather than addressing each case as an isolated development effort [23]. This explicit treatment of variability supports consistency, reduces duplication, and provides a controlled mechanism for adapting systems to distinct stakeholder requirements and operational contexts [9,24,25,26,27].
From this perspective, variability management provides the bridge between a shared architectural base and the configuration decisions required for a particular solution. It makes it possible to establish mandatory, optional, and alternative elements, as well as to define the constraints among them. This is especially relevant in industrial settings, where variability is not only pervasive but also distributed across artifacts, teams, and decision levels, making explicit modeling and coordinated management essential for maintaining coherence as systems evolve [9,10,24,26].
In the context of data lake ingestion, this perspective is particularly useful, because ingestion processes are not fully independent implementations but rather variants of a recurrent engineering problem. Although they share a common structural purpose, moving data from source systems into the data lake in a controlled manner, they differ in relevant characteristics [28], such as the ingestion mode (e.g., batch or streaming), source type, collection mechanism, integration technology, transformation needs, intermediate storage, final storage, scheduling conditions, and governance-related restrictions. Treating each ingestion initiative as a separate ad hoc design obscures these commonalities and variabilities, whereas modeling them explicitly allows the solution space to be described, communicated, analyzed, and reused in a systematic way [4,12,29].
However, the benefits of explicit variability modeling also introduce management challenges. As the number of variables (e.g., features or attributes), dependencies, and configuration rules grows, variability models become more difficult to understand, maintain, and evolve [30]. This difficulty is amplified in collaborative and industrial settings, where variability knowledge is distributed across multiple stakeholders and must remain aligned with technical, organizational, and governance constraints. Therefore, the effective treatment of ingestion variability requires not only an expressive variability representation but also a supporting architecture and a variability management tool capable of guiding the shared understanding, configuration, and evolution of the ingestion solution space in a controlled manner [9,10,24].
2.2.7. Feature Model
One of the most established mechanisms for representing such variability is the feature model (FM), originally proposed in the context of feature-oriented domain analysis (FODA) [7] and reflected in some approaches to the data domain in works such as [6,12]. A feature model represents a family of solutions as a hierarchical structure rooted in a domain concept, where subordinate features capture capabilities, options, or refinements. It may also include cardinalities and cross-tree constraints, enabling the specification of valid configurations and supporting automated analyses such as consistency, satisfiability, and the detection of invalid combinations [31]. These capabilities make feature models particularly suitable for domains such as data ingestion architectures, where common and variable characteristics must be made explicit and reasoned about systematically [12,32].
This notation is relatively simple in terms of its elements while still providing the information that we aim to communicate. Moreover, it has been previously used in this domain in works such as [6,12], where feature modeling was applied to the broad domain of big data systems, producing a family FM that covers the full stack from data acquisition to visualization. Within this model, ingestion appears as an optional subfeature of data processing without decomposing its internal structure. Moreover, cross-tree constraints are defined at the system level but do not descend into ingestion-specific rules. No variability management tool is employed, and automated configuration support is identified as future work.
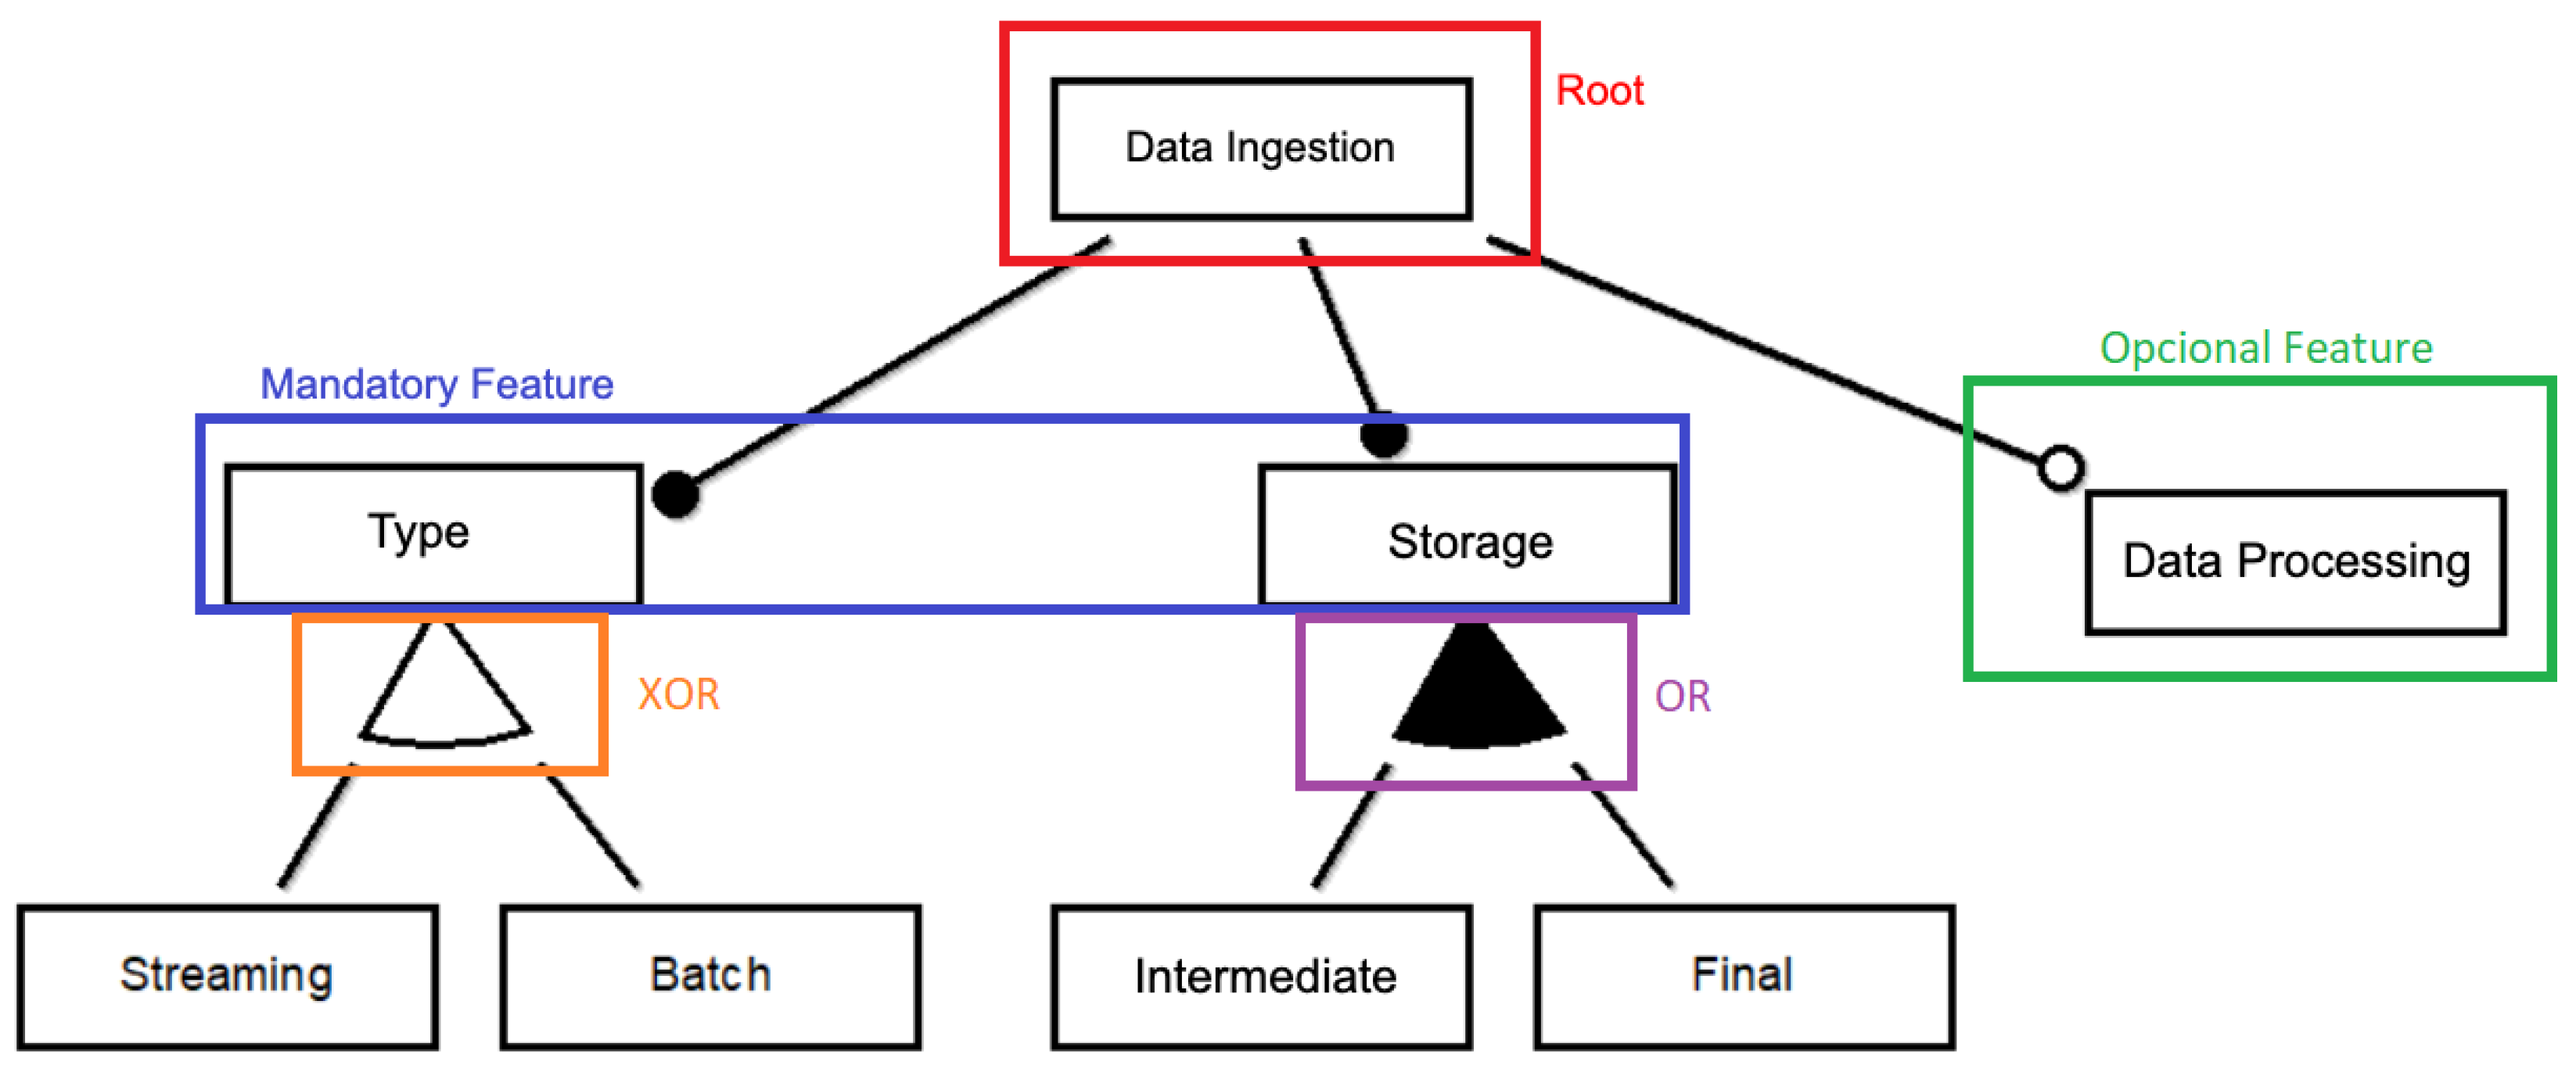
The example diagram in Figure 2 can be interpreted through the following statements:
- Data ingestion has mandatory features (solid circle) such as type and storage;
- Data ingestion has an optional feature (hollow circle) called data processing;
- Within type, exactly one option must be selected (XOR, white arc): streaming or batch.
- Within storage, one can select intermediate, final, or both storage types (OR, black arc).
Although a feature model provides the notation required to represent ingestion variability, the practical use of such a model also requires mechanisms for editing, validating, analyzing, and deriving configurations. For this reason, the proposal is operationalized through VariaMos, which provides the variability management environment used to implement and analyze the ingestion model.
Figure 2.
FM example.
2.2.8. VariaMos
VariaMos is an SPL engineering environment designed to support variability modeling, model integration, verification, analysis, and product derivation, with an emphasis on constraint-based reasoning over multi-view product line models [33,34]. The environment supports multiple interconnected modeling notations, such as feature models, configuration models, requirement specifications, and architectural diagrams, and transforms them into a common reasoning space, reflecting the distributed nature of variability across complementary artifacts [33,35]. Its reasoning capabilities include configuration validation, dependency analysis, product counting, commonality estimation, and simulation, positioning it as an environment where modeling and reasoning are tightly integrated, rather than being a standalone feature model editor [35]. Additionally, the version employed in this study incorporates an AI-assisted chatbot that enables the generation and modification of SPL models through natural language interaction, functioning as a complementary accelerator for SPL design.
In the context of this work, VariaMos serves as the implementation host for the proposed ingestion architecture and its associated variability management mechanism [36]. Specifically, it provides the modeling infrastructure to represent the feature model describing ingestion variability, supports the verification and analysis of valid configurations derived from this model, and enables the guided configuration of ingestion solutions according to project-specific constraints. This use of VariaMos thus operationalizes the variability management dimension of the proposal within a technically mature and extensible SPL environment.
The present work addresses the identified research gap by applying feature modeling specifically to the ingestion process at sufficient granularity to guide implementation decisions and operationalizes variability management through VariaMos, providing automated configuration support that no prior work offers. In particular, with respect to the reference architecture previously proposed by Lagos [28,37], the contribution of the present manuscript is threefold: (i) the migration of the architectural representation into VariaMos as an explicit variability management environment; (ii) the resulting automated configuration support, including the verification of valid configurations and the automatic derivation of solution variants; and (iii) an expanded validation scope that combines the usability and quality instruments with open-ended feedback and a focused discussion session with practitioners.
3. Methodology
This study adopts Design Science Research (DSR) as the overarching methodological framework for addressing a practical and recurrent engineering problem in the context of data lake ingestion. The problem is not limited to the absence of a formalized ingestion process but also involves the need to represent, organize, and manage the variability in ingestion solutions across heterogeneous scenarios. In this sense, the research is oriented toward the design and evaluation of an artifact intended to support engineering practice in a real organizational setting.
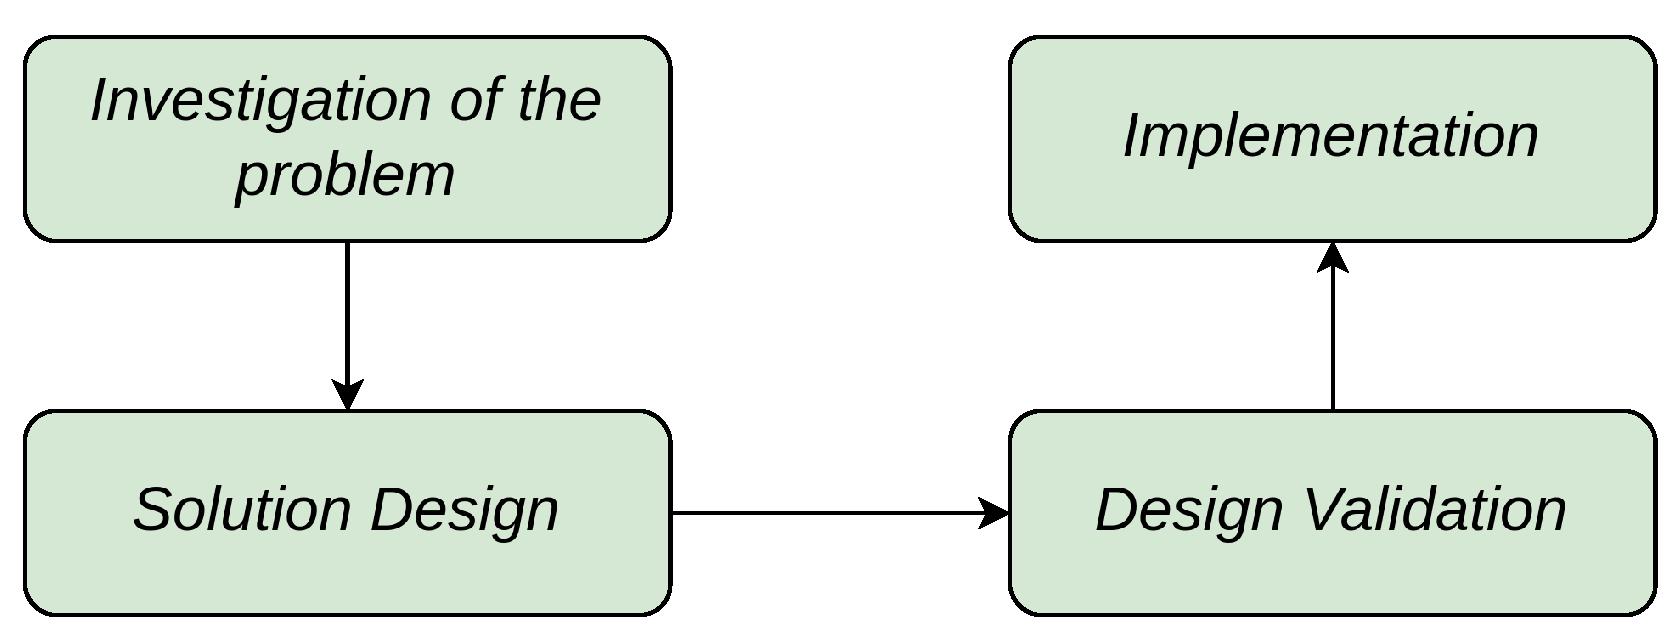
The methodology follows the Design Science perspective described by [38], which is widely applied in information systems and software engineering research. This approach emphasizes the creation and validation of artifacts as a means of solving relevant real-world problems. In particular, it structures the research process through the regulative cycle, composed of four main activities: conceptual analysis, solution design, design validation, and implementation. In the present work, these activities are used to organize both the construction of the proposed artifact and the evaluation of its utility in the enterprise context.
This methodological approach is appropriate because the objective of the study is not only to describe or explain a phenomenon but to produce an actionable solution in the form of a reference architecture and its associated variability support. Accordingly, the work combines problem investigation through literature analysis, artifact construction grounded in theory and practice, and empirical validation with stakeholders involved in the target context.
Following [38], the methodological process is structured into four complementary stages, as illustrated in Figure 3. First, conceptual analysis is used to understand the problem domain, identify its main challenges, and establish the theoretical basis for the artifact. Second, solution design focuses on the construction of the proposed artifact, grounded in both the literature and the enterprise needs identified during the study. Third, design validation evaluates the proposed artifact before full-scale deployment, with an emphasis on stakeholder perceptions regarding its usefulness, usability, and quality. Finally, implementation addresses the introduction of the artifact into the organizational context as a support mechanism for engineering practice, supported by the VariaMos tool.
Figure 3.
Representation of the Design Science cycle [39].
For the purposes of this work, the four DSR stages are operationalized through two major research streams. The first stream corresponds to the investigation of the state of the art and is mainly developed during conceptual analysis through a systematic mapping study and the exploratory use of AI tools to assist the research process. The second stream corresponds to the development and evaluation of the proposal, covering solution design, validation, and its initial organizational adoption.
3.1. Conceptual Analysis
The conceptual analysis stage seeks to understand the problem of data lake ingestion formalization and its associated variability from both a theoretical and practical perspective. At this stage, the research focuses on identifying how data ingestion is described in the literature, which architectural elements are recurrently reported, which challenges remain insufficiently addressed, and which concepts can support the formal representation of ingestion variability. To achieve this, the conceptual analysis is divided into three main sections:
- Consolidating information obtained through systematic mapping [40], partially presented in [28], which establishes the conceptual and theoretical basis of the project, since it allows the domain to be explored in a structured way, the available evidence to be categorized, and research gaps to be identified;
- A brief systematic review based on the systematic mapping methodology [40] to assess the state of the art regarding alternatives to the present proposal;
- Conducting an exploratory study of AI-based research support tools to identify how variability is being addressed in the data domain.
3.1.1. Conceptual and Theoretical Basis
The systematic mapping study partially published in [28] is developed through the following activities according to [40].
Definition of Research Questions
The first step consists of defining the research questions that guide the mapping. These questions establish the scope of the review and determine the relevance criteria for selecting studies. Their role is to orient the identification of knowledge related to data ingestion in data lakes, its architectural characteristics, and the open space for new contributions.
Research Questions (RQs)
- RQ1.
- What is the most commonly used ingestion method in big data implementations?
- RQ2.
- What are the challenges encountered when executing a big data ingestion process?
- RQ3.
- What kinds of contributions (methodology, techniques, approach) are found in the selected papers?
- RQ4.
- Which tools or technologies are used in the ingestion process?
- RQ5.
- What are the characteristics of the architectures identified?
- RQ6.
- What challenges and gaps remain for future work?
Search Query Design
Once the scope is established, search queries are defined in order to retrieve an initial corpus of potentially relevant studies. These queries are constructed using key terms associated with data ingestion, data lakes, and big data and may be adapted to different digital libraries while preserving the same search intent.
The search query is defined by the terms ‘ingest’ and ‘big data’, which must appear in any of the search fields. This broad search is justified primarily by the following:
- The specific domain is still novel, so a refined search yields few or no results;
- The intention is to view the broader context of the domain and then ‘zoom in’ on what is of greatest interest.
Taking into consideration the search engines used, the specific search terms for each are as follows in Table 2. In the case of DBLP, given its limited filtering options and the small number of results retrieved, the inclusion and exclusion criteria were applied manually to each result.
Table 2.
Specification of search queries by search engine for systematic mapping.
Inclusion and Exclusion Criteria
The retrieved studies are filtered by applying explicit inclusion and exclusion criteria. Some of these criteria can be incorporated directly into the search strings, while others must be applied manually after retrieval. Typical criteria include the publication period, language, document type, topical relevance, and availability of the full text.
The inclusion and exclusion criteria are as follows:
- Language—include only documents in English;
- Date—include documents from January 2016 to August 2021;
- Relevance—exclude documents that do not pertain to the field or address the research questions;
- Sources—include only scientific journal articles and conference papers;
- Availability—exclude articles that cannot be obtained or downloaded;
- Duplicates—review and retain only one of the repeated documents in the event of duplicates.
Classification Scheme
After study selection, a classification scheme is defined to organize the extracted information. This scheme structures the evidence in a way that provides support in answering the research questions and identifying both expected and emerging categories. In this work, the classification scheme is especially relevant in characterizing ingestion components, distinguishing common and variable elements, and identifying architectural patterns reported in the literature.
- RQ1: Types of Ingestion
- Batch
- Streaming
- RQ2: Challenges in Big Data Ingestion
- Compliance with the 5 Vs of big data
- Synchronization of multiple sources
- Component selection
- Commercial off-the-shelf (COTS)
- Vendor lock-in
- Data not supported by ingestion
- RQ3: Contribution of the Document
- Methodology
- Technique
- Approach
- Framework/architecture
- RQ4: Tools or Technologies for Ingestion
- Spark, Kafka, Hadoop, AWS, SQL, among others
- RQ5: Characteristics of the Architecture Found
- Architectural components described in the paper
- RQ6: Challenges or Future Work
- Heterogeneous data sources
- Data structuring level
- Data changes over time
- Data quality
- Ingestion frequency
Data Extraction and Mapping
Finally, the selected studies are analyzed, and their data are extracted and synthesized. The resulting information is represented using tables and graphical mechanisms that facilitate the interpretation of the state of the art. This stage provides the conceptual basis for identifying the constitutive features of data ingestion and supports the transition toward artifact design.
3.1.2. Alternatives to the Present Proposal
Using the principles of systematic mapping [40], a brief review has been conducted to identify which alternatives exist to the specific proposal in this study with the following stages.
Definition of Research Questions
This step consists of defining the research questions that guide the review. These questions establish the scope of the review and determine which studies about data ingestion architectures and their characteristics have been published.
Research Questions (RQs)
- RQ7.
- Are there any formal architectures for data ingestion into a data lake?
- RQ8.
- What are the characteristics of these architectures?
Search Query Design
The search query is defined by the terms ‘data ingestion’ and ‘architecture’, which must appear in the title of the document, as shown in Table 3.
Table 3.
Specification of search queries by search engine for brief review.
The inclusion and exclusion criteria are as follows:
- Language—include only documents in English;
- Date—include documents from January 2021 to April 2026;
- Relevance—exclude documents that do not pertain to the field or address the research questions;
- Sources—include only scientific journal articles and conference papers.
- Availability—exclude articles that cannot be obtained or downloaded;
- Duplicates—review and retain only one of the repeated documents in the event of duplicates.
Data Extraction and Mapping
Finally, the selected studies are analyzed, and their data are extracted and synthesized to answer the RQs.
3.1.3. Data Domain and Variability Management
This subsection reports an exploratory study conducted as a secondary methodological contribution, documenting the use of AI-powered research support tools as instruments for academic literature exploration. The study addresses RQ9: ’How is software variability addressed in the data domain?’.
The research question was submitted to four AI-based tools: Asta (web-based scientific research assistant; version Olmo 2 1B, accessed on 29 May 2026), Anara (version 3.0, accessed on 29 May 2026), Consensus (web application; version 2.0, accessed on 29 May 2026), and Elicit (web application; accessed on 29 May 2026). For each tool, the steps reported by the tool itself, the references retrieved, and the key ideas produced were recorded and analyzed.
The goal is twofold: to obtain a conceptual overview of how variability is treated in the data domain and to document the behavior and limitations of AI-assisted research tools in an academic context.
This study is exploratory in nature and does not constitute a systematic review. Its results are not treated as primary evidence for the architectural proposal but are included as contextual support.
3.2. Solution Design
The solution design stage corresponds to the construction of the artifact intended to address the identified problem. In this work, the artifact consists of a reference architecture for data lake ingestion, complemented by a variability-oriented representation that makes it possible to distinguish mandatory, optional, and alternative elements of ingestion solutions.
The design of the artifact is grounded on two inputs. The conceptual analysis provides a view of the architectural elements that are frequently reported in the literature. The second is the practical knowledge derived from the enterprise context, where ingestion processes are developed under technical, organizational, and governance constraints.
Based on these inputs, the proposal is structured as a reusable engineering support artifact aimed at improving communication, documentation, onboarding, and solution definition. In methodological terms, this stage corresponds to the transformation of conceptual findings into an explicit and usable design proposal.
3.3. Design Validation
The design validation stage evaluates whether the proposed artifact is perceived as useful and appropriate for addressing the identified problem before considering broader implementation. In this work, validation is performed through an evaluation plan based on a structured survey administered to stakeholders from the enterprise context.
The survey instrument is built from prior validated experiences reported in the literature, particularly drawing on [41,42,43,44]. The instrument is organized into several sections.
3.3.1. Profiling
Basic characterization of the respondents is conducted in order to identify their organizational roles and their experience in the enterprise context. This information supports the interpretation of the responses according to the participants’ proximity to the ingestion process.
3.3.2. Usability
For this criterion, we adopt Brooke’s ‘System Usability Scale’ (SUS) [42], which consists of 10 Likert-scale statements rated from 1 to 5. In our instrument, these values correspond to ‘strongly disagree’ and ‘strongly agree’, respectively. The statements evaluate the use of the proposed architecture after it has been introduced.
The items in this questionnaire section are as follows:
- I would like to use the architecture frequently to verify the elements of a data lake ingestion process.
- I think the architecture is unnecessarily complex.
- I think the architecture is easy to apply.
- I think I need technical support to use the architecture.
- I found the various elements of the architecture to be well integrated.
- I think the architecture presents too many inconsistencies.
- I think most people could learn to apply the architecture quickly.
- I found the architecture very complex to apply.
- I would feel confident using the architecture.
- I need extensive technical knowledge to be able to apply the architecture.
To score usability, Equation (1) is used, where U denotes the usability score of one respondent and denotes the Likert score given by the respondent to item k of the list above (), so that the item indices in the equation are mapped one-to-one to the ten SUS statements enumerated in this section.
Following the standard SUS procedure [42], odd-numbered items () are positively oriented and contribute points, whereas even-numbered items () are negatively oriented and contribute points. The final sum is multiplied by 2.5, yielding a minimum score of 0 and a maximum score of 100.
The survey is conducted via an anonymous digital form that does not allow responses outside the Likert scale or the omission of any item.
3.3.3. Quality
For the quality criterion, we adopt the validation survey presented by Nadal in [44]. The instrument consists of 7 Likert-scale statements rated from 1 to 5 (’strongly disagree’ to ’strongly agree’). In this evaluation section, the statements are linked to quality criteria from ISO/IEC 25010 [45].
The items in this questionnaire section are as follows:
- The presented architecture is useful for my work.
- Overall, I am satisfied with the proposed architecture.
- I would trust the proposed architecture to design a data ingestion process.
- Overall, the proposed architecture covers my needs for designing a data ingestion process.
- The proposed architecture helps to improve metrics (design time, analysis, understanding, learning, etc.).
- I would like to adopt this architecture in my next ingestion process.
- Using the proposed architecture, I would improve how I analyze data ingestion processes.
For scoring, since all questions are positively oriented, Equation (2) is used, where Q denotes the quality score of one respondent and denotes the Likert score given by the respondent to item i of the list above ().
The sum of each item’s score minus 1 is expressed as a percentage with respect to a real maximum of 28 points. This ensures that the instrument yields a minimum of 0 and a maximum of 100 (comparable to the usability score). Notably, this adjustment makes the quality criterion more stringent than a direct percentage calculation.
The survey is conducted via an anonymous digital form that does not allow responses outside the Likert scale or the omission of any item.
3.3.4. Qualitative Evaluation Scale
To conclude the evaluation of the architectural proposal, the scores for both criteria are independently analyzed using Bangor’s adjective rating scale [41]—see Table 4—which provides a qualitative perspective on the quantitative results.
Table 4.
Mapping of SUS scores to Bangor’s adjective rating scale.
Using this scale provides a perspective on the degree of ‘approval’ achieved by the proposal under the two criteria described above. We consider a minimum acceptability level of ‘marginal high’ (or grade D) desirable under our self-demanding benchmark, with ‘acceptable’ as the ideal outcome.
3.3.5. Feedback Meeting
Following the analysis of the survey results, a complementary qualitative data collection activity was conducted in the form of a focused group discussion. After the quantitative results were processed, an open call was communicated to all survey respondents, inviting voluntary participation in a discussion session oriented around responses near the scale midpoint—specifically those related to the need for technical support and prior technical knowledge to apply the architecture (items 4 and 10 in Section 3.3.2).
Participation was voluntary and self-selected as respondents who agreed to lose their anonymity and attend the session were included, resulting in seven participants. This format was chosen to allow open elaboration on quantitative responses that were ambiguous in isolation and to collect perspectives on the operationalization and future use of the architecture that the closed-ended instrument could not capture.
3.3.6. Engineering Metric Evaluation
To complement the perception-based instruments, a ‘before/after’ comparison was applied, in which each participant took part in a data ingestion design scenario without the proposed architecture (considered the ‘before’ condition) and, subsequently, an equivalent data ingestion design scenario with the proposed architecture implemented in VariaMos (considered the ’after’ condition). The results are presented in aggregated and segmented form.
For both conditions, the same set of indicators was recorded, as shown in Table 5, which defines each indicator, the dimension that it captures, and its unit of measurement.
Table 5.
Engineering metrics recorded in the before/after study.
This design was applied to two participant cohorts, which are reported separately in Section 4 because they differed in nature.
- Cohort 1: Enterprise Practitioners. A group of 15 practitioners who answered the usability and quality survey, after which the information for the indicators of Table 5 was collected retrospectively.
- Cohort 2: Enterprise Interns. A second, independent group of 14 computer engineering interns carried out the same paired before/after protocol prospectively: each intern first completed an ingestion design case without the architecture and then an equivalent case with the architecture in VariaMos, with the indicators recorded at the moment of execution. This cohort provides prospective evidence.
3.4. Implementation
The implementation stage corresponds to the initial introduction of the artifact into the organizational environment. In this work, implementation is understood as an early application of the proposal in the enterprise context, where the architecture and its variability-oriented support can begin to inform communication, training, and solution definition practices. VariaMos was used as the variability management environment supporting the implementation of the architecture [34].
4. Results
4.1. Conceptual Analysis Results
This section presents the results in direct response to the points presented in the previous section on the methodology.
4.1.1. Conceptual and Theoretical Basis: Systematic Mapping Results
This section presents the analysis and visualization of the systematic mapping results for the stated research questions. The total number of documents found was as follows in Table 6.
Table 6.
Number of documents by search engine after filtering stages.
RQ1: What Is the Most Commonly Used Ingestion Method in Big Data Implementations?
Across the documents reviewed during the filtering stage (broadly addressing big data), streaming was the most frequent ingestion type, with 67 documents, compared to 20 for batch. When narrowing the analysis to the seven documents focused exclusively on data lakes, the conclusion remained the same, albeit with a smaller margin, as shown in Table 7.
Table 7.
Ingestion types reported in the analyzed documents.
RQ2: What Are the Challenges Encountered When Executing a Big Data Ingestion Process?
The main issues identified by the authors are listed in Table 8. Notably, the five Vs appear frequently, as they represent inherent challenges of the domain.
Table 8.
Issues identified in the literature.
RQ3: Which Types of Contributions Are Found in the Selected Papers?
As shown in Table 9, notably, none of the selected documents proposes or contributes a methodology. Most propose big data frameworks or architectures that, with varying degrees of refinement, provide elements related to data ingestion.
Table 9.
Contribution types of the analyzed documents. ✓ specifies which papers each type of contribution appears in.
RQ4: Which Tools or Technologies Are Used in the Data Ingestion Process Within a Data Lake?
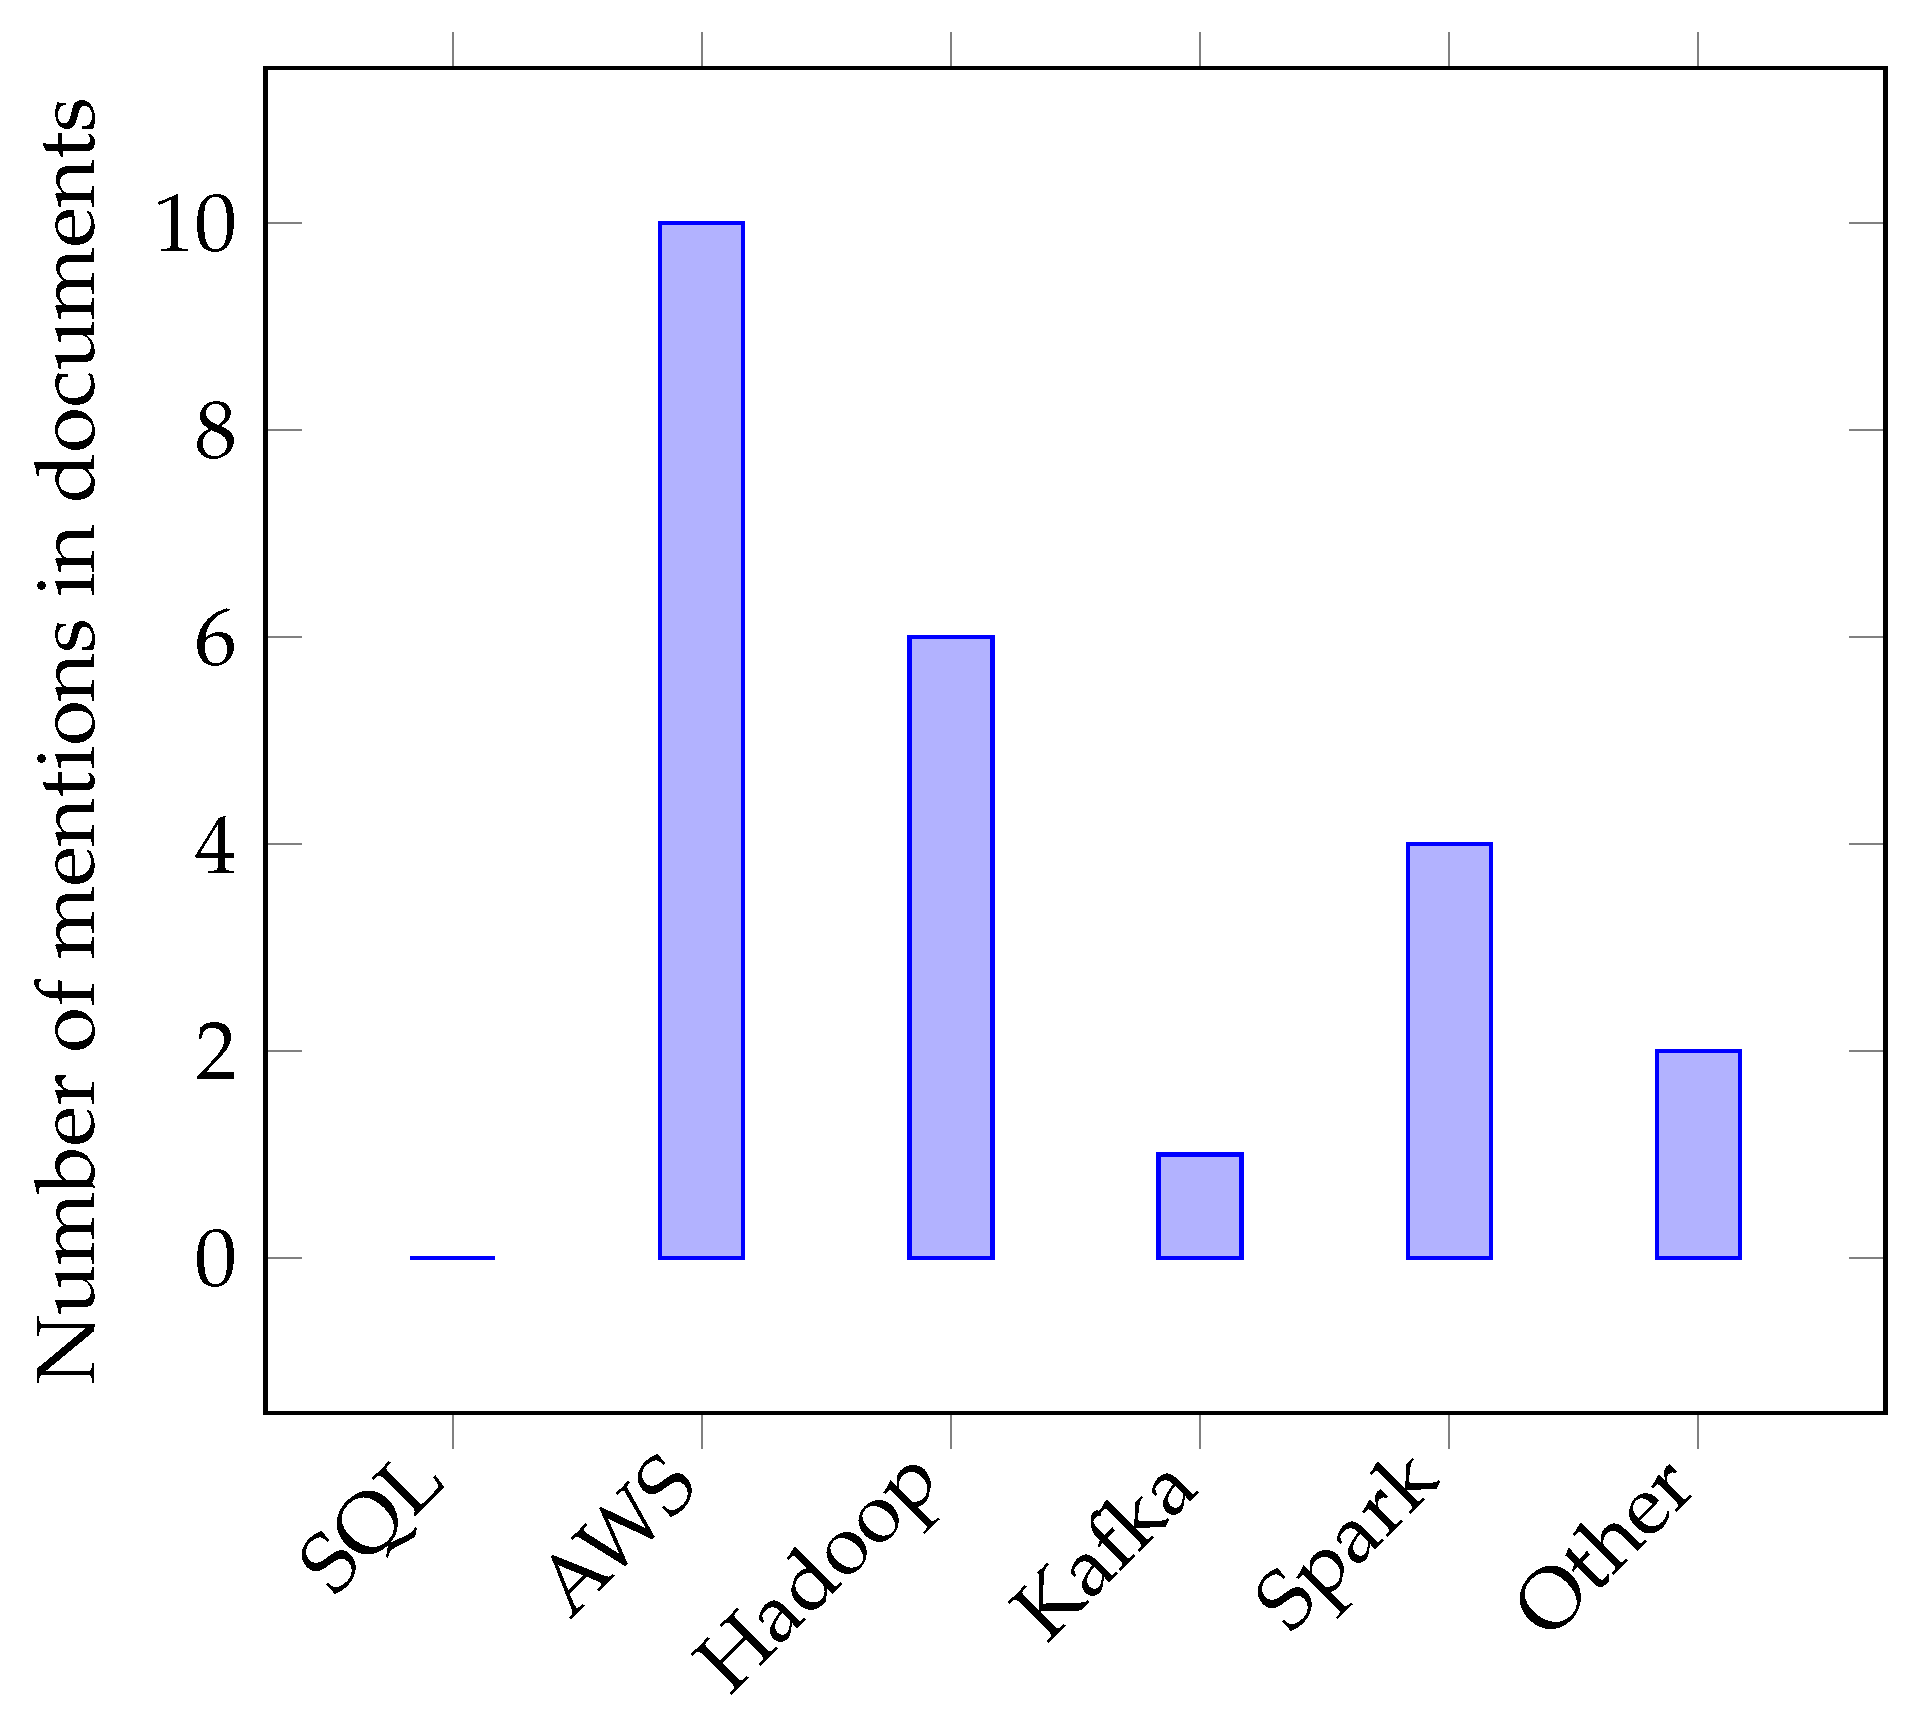
As indicated in Figure 4, the selected documents reveal that AWS, as an ecosystem, provides the largest number of tools/technologies used for ingestion. Contrary to the initial expectation, there is no explicit mention of SQL in relation to data ingestion.
Figure 4.
Count of tools/technologies for data ingestion.
RQ5: Which Characteristics Are Reported for the Identified Architectures?
Among the seven analyzed documents, one did not explicitly consider elements of a possible architecture. For the remaining six, all identified elements that could be considered mandatory for data ingestion, while others could be considered optional, as shown in Figure 5.
RQ6: What Challenges and Gaps Are Identified for Future Work?
The main challenges proposed by the authors are shown in Table 10. Notably, none of the documents reports challenges directly related to the ingestion process itself.
Table 10.
Challenges and future work reported by the authors.
4.1.2. A View on Data Ingestion Architectures
In this analysis, several documents were found based on the search queries entered into the search engines, as shown in Table 11.
Table 11.
Number of documents by search engine.
Figure 5.
Mapping of data ingestion components.
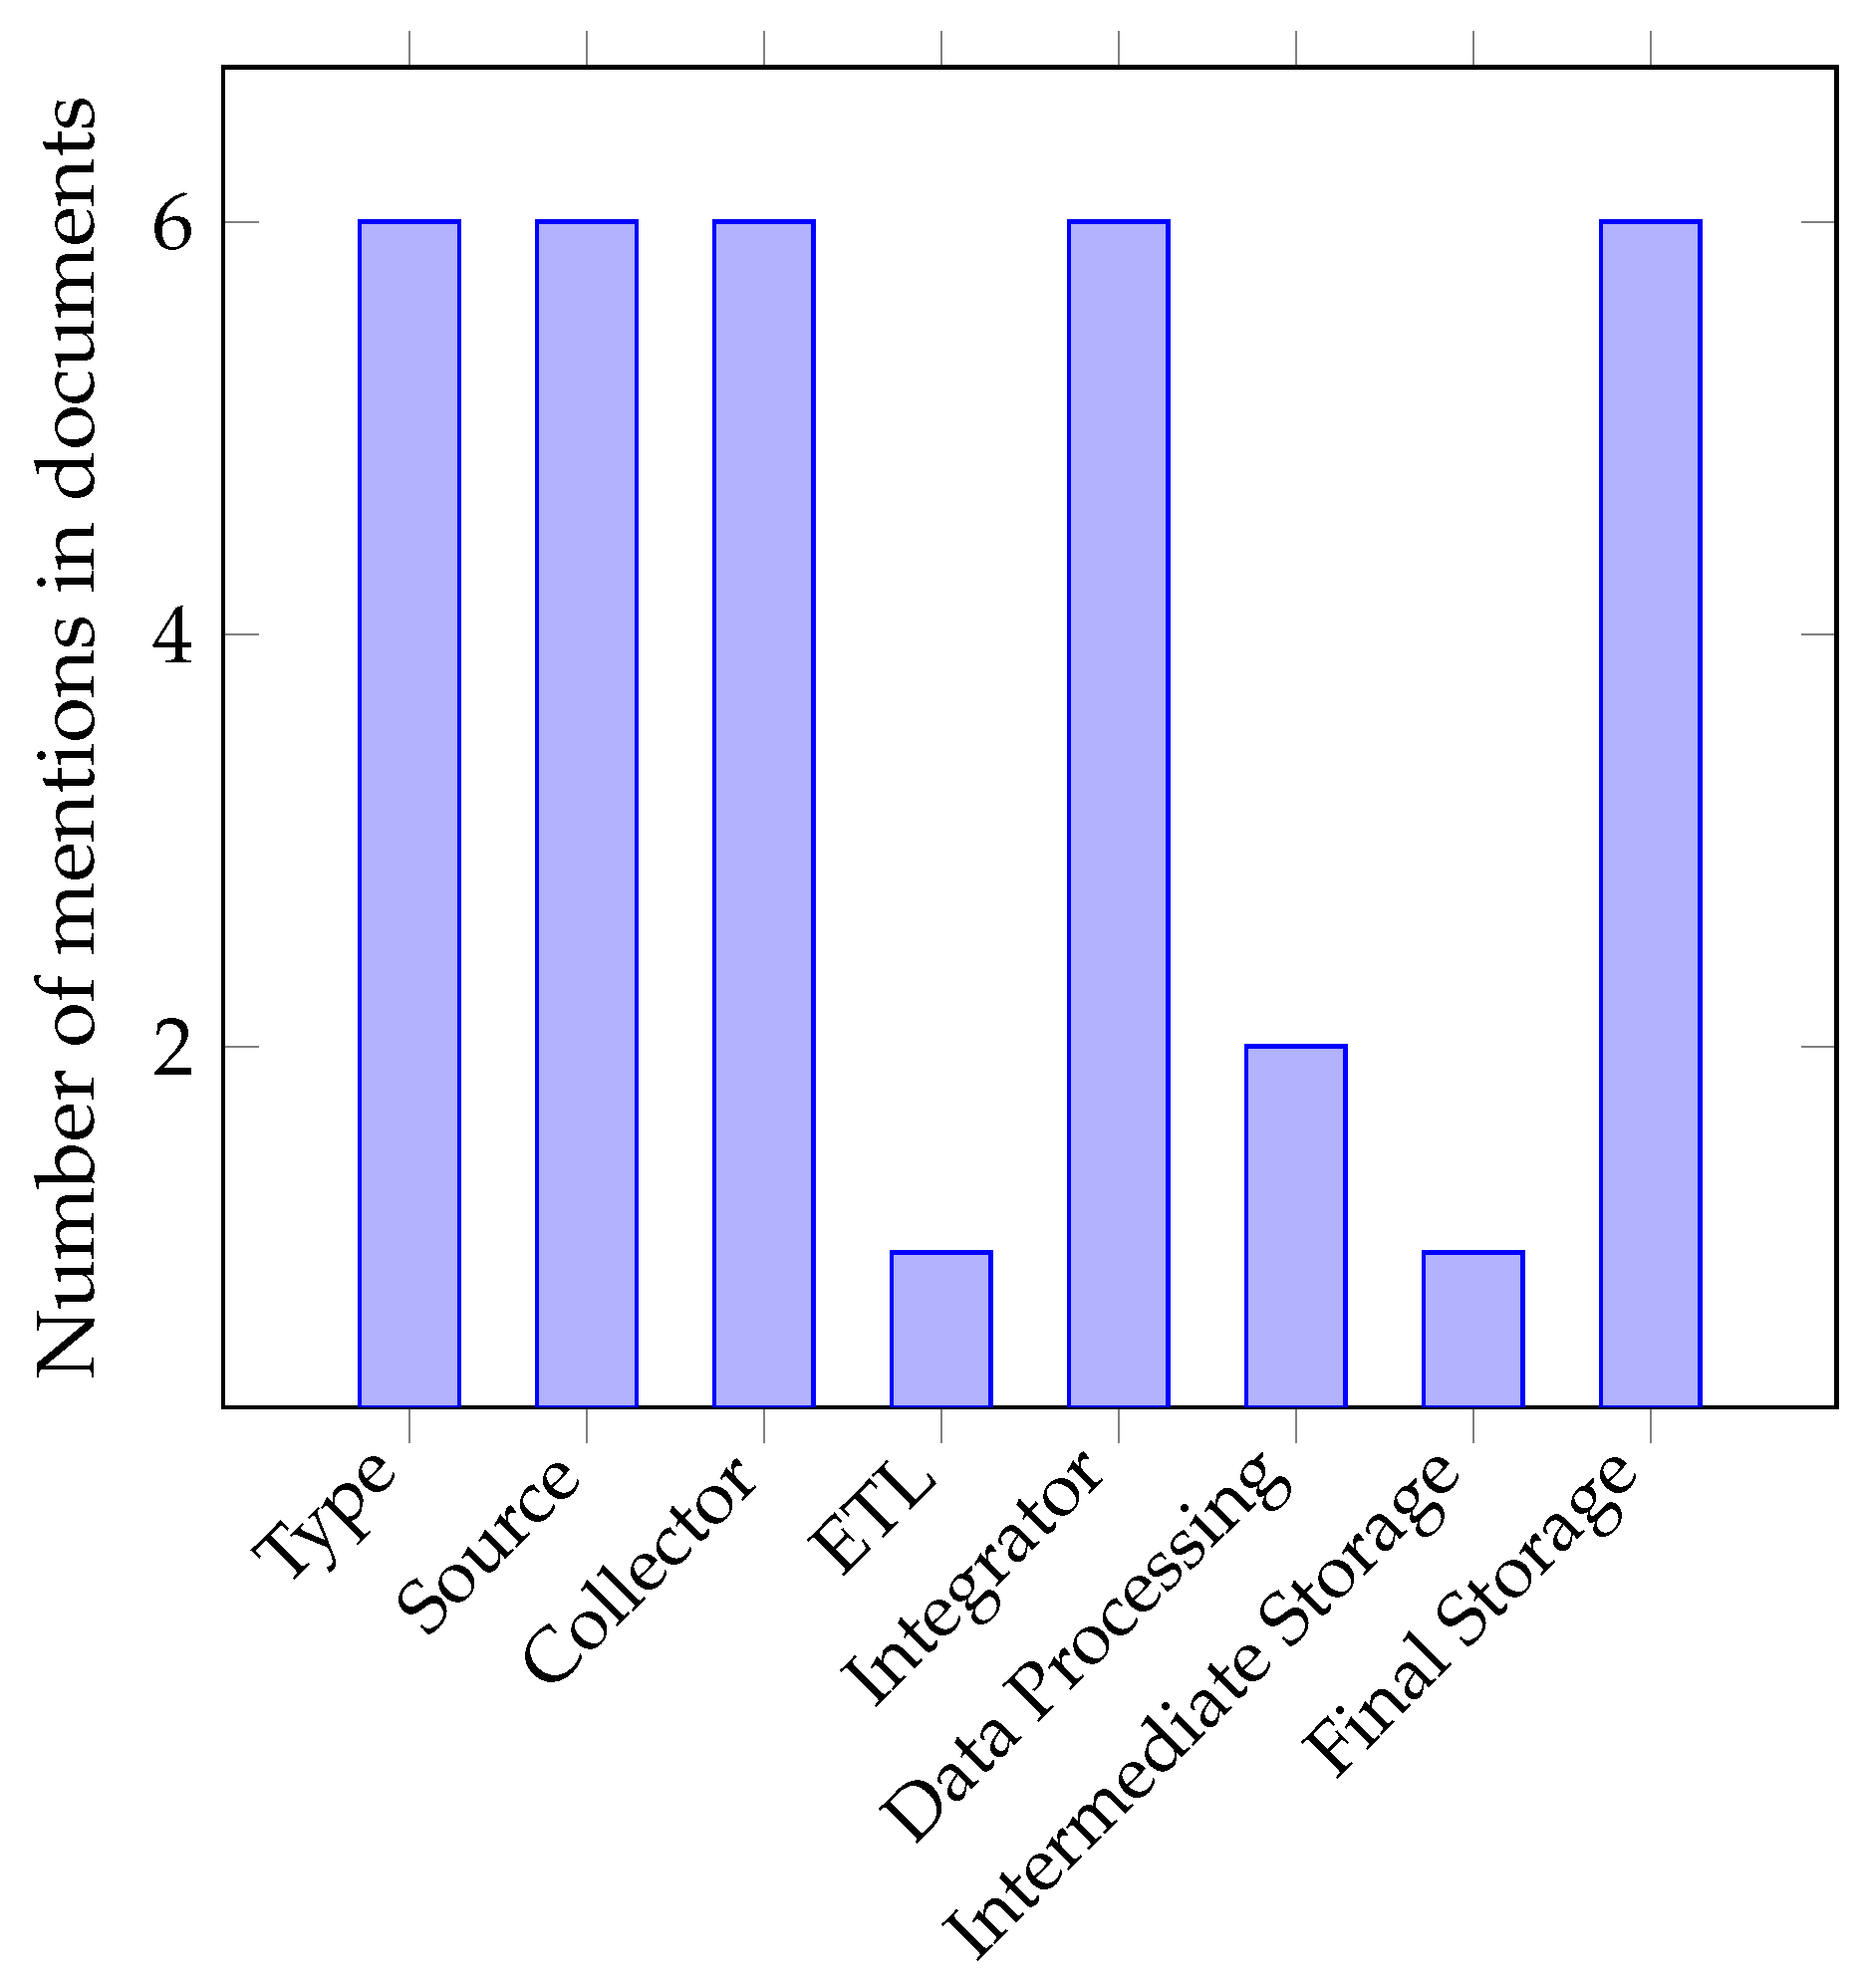
The reviewed documents provide complementary perspectives on data ingestion architectures for data lake implementations. Abirami and Punitha [13] propose a hybrid ETL framework for data lakehouse architectures, emphasizing the combination of batch and real-time processing through AI-driven orchestration and contextual data partitioning. The proposal outlines key elements such as data sources, types of data ingestion, and ETL as a central process, which are relevant in generalizing these processes. In this regard, their work differs from an architectural perspective focused specifically on data ingestion, as it emphasizes the orchestration process for data transformation and utilization from an organizational standpoint.
Li et al. [14] present Karst, a scalable architecture for transactional data ingestion in analytical systems. Rather than addressing the full data lake lifecycle, this work focuses on the ingestion problem from the perspectives of correctness, serializability, and scalability. The proposal includes elements of interest in its description that allow for the generalization of processes, such as data sources, data ingestion methods, persistent and final data storage, and metadata management. In this regard, their work differs from the perspective of our study, as Karst adopts a finer technical granularity, going so far as to address elements such as worker nodes and partitions associated with specific technologies, thereby sacrificing its potential for generalization.
Rucco et al. [15] propose a cloud-based data ingestion design pattern for big data and lakehouse contexts. Their contribution is centered on a metadata-driven framework that supports both full refresh and incremental ingestion, enabling dynamic adaptation to heterogeneous data sources, schema changes, and different ingestion requirements across cloud platforms. The proposal presents a pipeline flow or design aimed at illustrating the components involved in a data ingestion process—from the source to storage—including metadata management and key features of our proposal, such as connectors and ingestion types, focusing not on the batch-versus-streaming dichotomy but rather on the distinction between incremental and full ingestion.
Finally, Lagos [28] presents a reference architecture for data ingestion into a data lake, derived from a systematic mapping study and represented through feature models. The work explicitly identifies mandatory and optional components of the ingestion process, such as the ingestion type, source, collector, integrator, ETL, processing, intermediate storage, and final storage, and evaluates the proposal in an industrial context. As the foundation of this study’s proposal, its structure at the feature model level translates into enhanced graphical representation as a model for managing variability using a tool designed for such as purpose, e.g., VariaMos.
Since [28] is the present authors’ own prior work and the direct antecedent of this manuscript, it is worth stating explicitly what is new in the present study with respect to it. The earlier work contributed the initial reference architecture and its feature model representation; the present manuscript extends this by (i) implementing the architecture in VariaMos, thereby adding an operational variability management mechanism that the earlier work did not provide, and (ii) broadening the validation scope, which now combines the usability and quality survey with open-ended feedback and a focused discussion session, together with an updated review of alternative ingestion architectures and an exploratory study of variability in the data domain.
RQ7: Are There Any Formal Architectures for Data Ingestion into a Data Lake?
Regarding RQ7, the reviewed literature indicates that formal or semi-formal architectures for data ingestion into data lakes do exist, although they vary in their levels of abstraction and formalization.
The reference architecture proposed by Lagos [28] represents the ingestion process using feature models and distinguishes between mandatory and optional architectural features.
In addition, the cloud-based design pattern proposed by Rucco [15] formalizes ingestion through a metadata-driven configuration model, while the hybrid ETL framework structures ingestion as an adaptive lakehouse pipeline combining orchestration, partitioning, and real-time processing.
Karst [14], although not designed specifically as a data lake reference architecture, contributes a formal architectural and protocol-level solution for transactional ingestion in partitioned analytical systems.
Therefore, the evidence suggests that the field contains formal architectural proposals, design patterns, and framework-based solutions, but there is still no single consolidated standard architecture that is universally adopted for data lake ingestion.
RQ8: What Are the Characteristics of These Architectures?
Regarding RQ8, the main characteristics of these architectures are flexibility, scalability, metadata orientation, support for heterogeneous sources, and the ability to combine batch and real-time ingestion.
The architectures commonly include components for identifying the ingestion type, connecting to the source, collecting or accessing data, integrating data into the target platform, optionally transforming or processing the data, and storing them in intermediate or final repositories, usually in a raw or foundational data lake layer.
Recent proposals also emphasize metadata-driven configuration, allowing ingestion strategies, schemas, and source-specific parameters to be modified without redesigning the complete pipeline. Scalability is addressed through cloud-native services, distributed processing, partitioning strategies, and optimized transaction protocols.
In lakehouse-oriented approaches, additional characteristics include ACID compliance, schema management, query optimization, contextual partitioning, and orchestration mechanisms capable of dynamically switching between batch and real-time modes.
Overall, these architectures seek to reduce manual effort, standardize ingestion design, improve data availability, and support the increasing volume, variety, and velocity of modern data ecosystems.
4.1.3. An Approach to Software Variability in the Data Domain
As mentioned previously, this section is the result of an exploratory study, seeking not only to analyze the answer to RQ9—‘How is software variability addressed in the data domain?’—itself but also to document the performance of AI-based research support tools.
Given its exploratory nature and its role as contextual support rather than primary evidence, only a summary of this study is provided here; the detailed per-tool outputs (steps, search traces, and key idea tables for Asta, Anara, Consensus, and Elicit), together with the reproducibility details of the exploration, are provided in Appendix A. In summary, the four tools were used in their free versions and all retrieved, academically relevant material and produced structured answers to RQ9, although with different search strategies and depths. Regarding the research question, the results consistently indicate that software variability in the data domain is a recognized concern, addressed through techniques derived from software product line engineering, with feature modeling emerging as the most widely reported representational mechanism for capturing mandatory, optional, and alternative elements of data schemas, warehouse structures, and pipelines. This aligns with the architectural foundation adopted in the present work. At the same time, the integration of formal variability management tools, such as VariaMos, in data-intensive engineering contexts remains largely underexplored in the reviewed material, indicating the gap that the present proposal contributes to addressing. Regarding the tools themselves, they accelerated the initial literature exploration and offered useful transparency mechanisms, but they do not guarantee coverage of paywalled literature, are exposed to hallucinated or misattributed references, and do not replace the methodological rigor of a formal systematic review.
4.2. Architecture Proposal Using Feature Models
As an architectural proposal, we use a feature model (FM) to appropriately represent the relationships among the components involved in data lake (DL) data ingestion.
To make the contribution explicit, the elements shown in Figure 6, Figure 7, Figure 8, Figure 9, Figure 10 and Figure 11 should be read as follows: the identification of the architectural elements themselves (type, source, collector, integrator, ETL, data processing, intermediate storage, and final storage) originates from the systematic mapping and the authors’ prior work [28]; the novel contribution of the present study is their formalization as an operational feature model in VariaMos, including the mandatory/optional classification and group relationships that enable automated analysis and the derivation of valid configurations, as illustrated in Figure 12.
4.2.1. Architectural Elements
Data Ingestion
The focus of the proposed solution is data ingestion, i.e., how data are acquired from a source and stored in the raw zone of the previously described data lake. To better understand the elements of a data ingestion process, Figure 6 shows a diagram of the model in VariaMos, which indicates mandatory and optional components for data ingestion.
Figure 6.
FM for data ingestion (proposed model, built in VariaMos as part of this work).
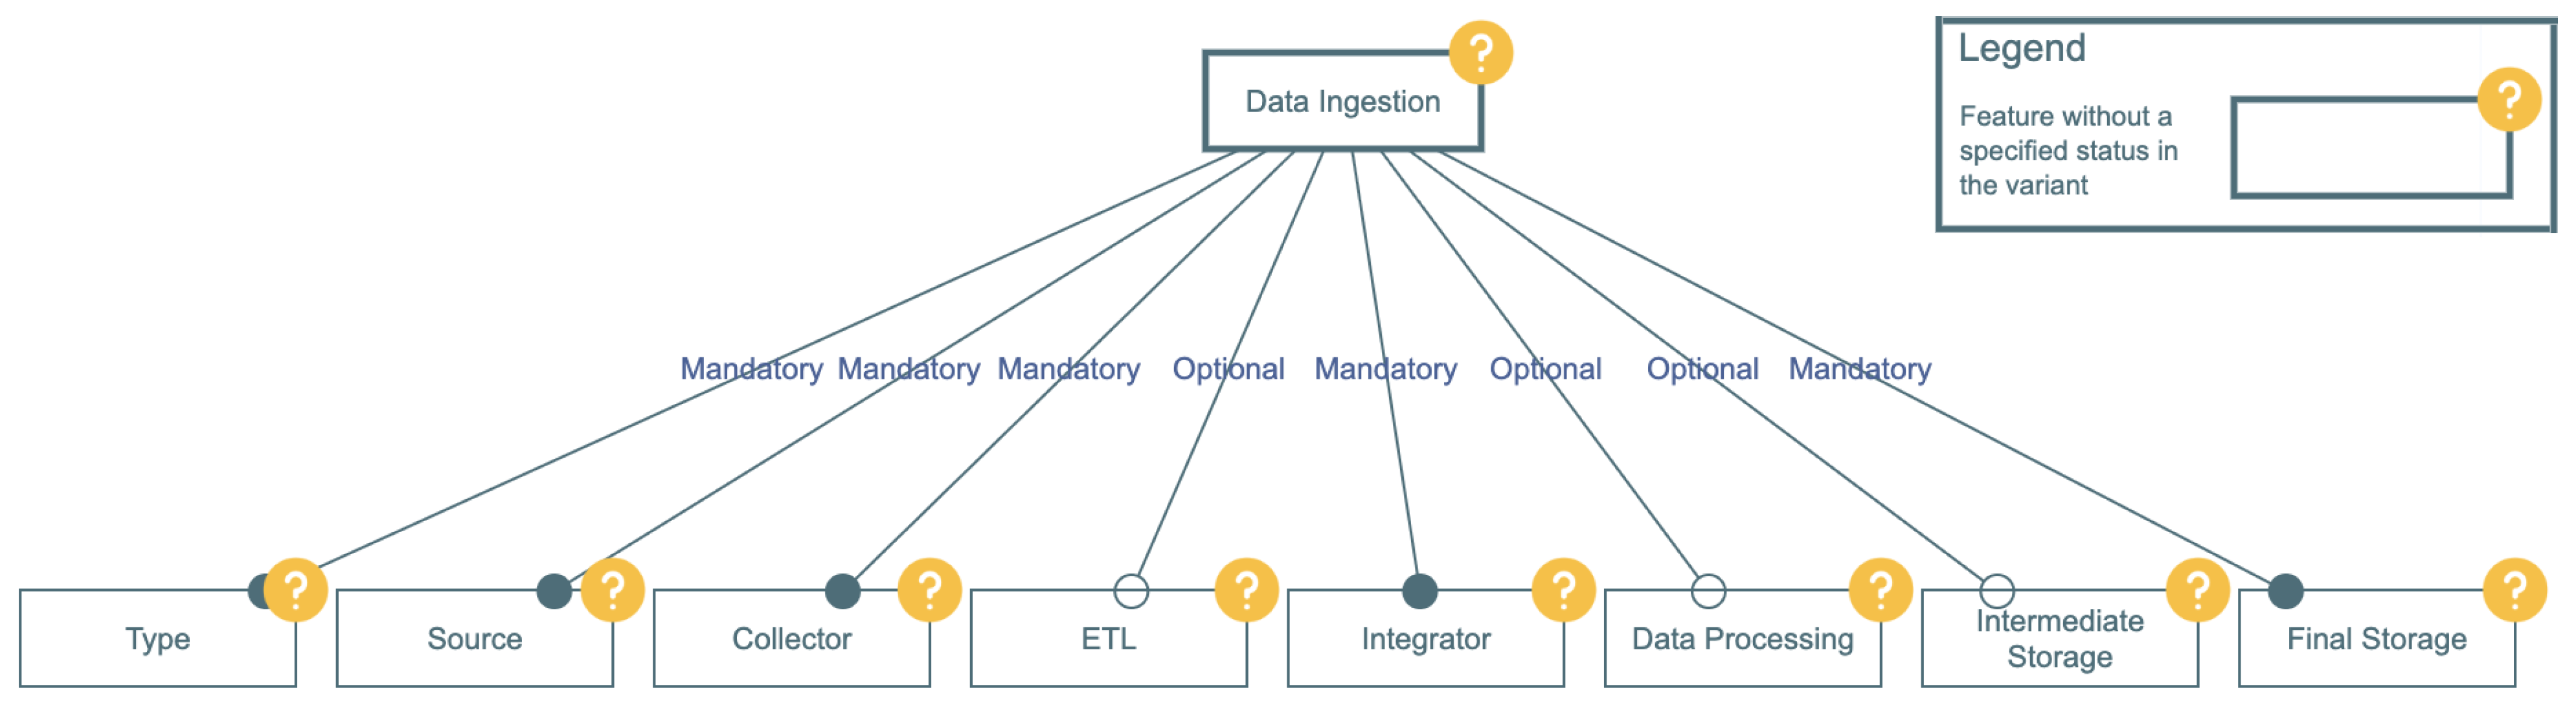
Next, we review each element indicated above to describe them and clarify potential questions. Each data ingestion process is considered an atomic process that transfers data from a single source A to a single destination B. In our context, there is no ‘composite’ ingestion with, for example, two sources; such a case corresponds to two separate ingestions.
This assumption of atomicity is considered in the context of scenarios involving multiple sources, fan-in/fan-out pipelines, and reprocessing and is based on two approaches.
First, it reflects the unit of work actually assigned, implemented, and maintained in the industrial context studied: as described in Section 2.2.5, the execution interval, triggering, and repetition of an ingestion are handled by a higher-level macrostructure (e.g., scheduling or triggers) that is external to the ingestion itself, so the atomic one-source-to-one-destination process is the natural granularity at which variability decisions are made.
Second, it keeps the feature model compositional: a multi-source or fan-in scenario is represented as a set of atomic ingestions converging on a common destination, a fan-out scenario as a set of atomic ingestions sharing a source, and reprocessing as the re-execution of an atomic ingestion under the control of the external orchestration layer.
The main implication is that cross-ingestion concerns, such as ordering, synchronization among converging flows, and end-to-end orchestration, are outside the scope of the current model and must be addressed at that higher level. Extending the model toward these composite ingestion workflows—a direction also raised by the practitioners in the open-ended feedback (Section 4.3.4)—is identified as future work.
The features shown in Figure 6 are described in greater detail in the following sections. For clarity, each of these features is illustrated in the following Figure 7, Figure 8, Figure 9, Figure 10 and Figure 11 with examples of values for the attributes that they represent. The cropped images are based on an extended version of Figure 6, partially shown in Figure 12, which cannot be fully presented due to its size and level of detail.
Type
Each ingestion process has a type associated with how data are moved from the source to the destination.
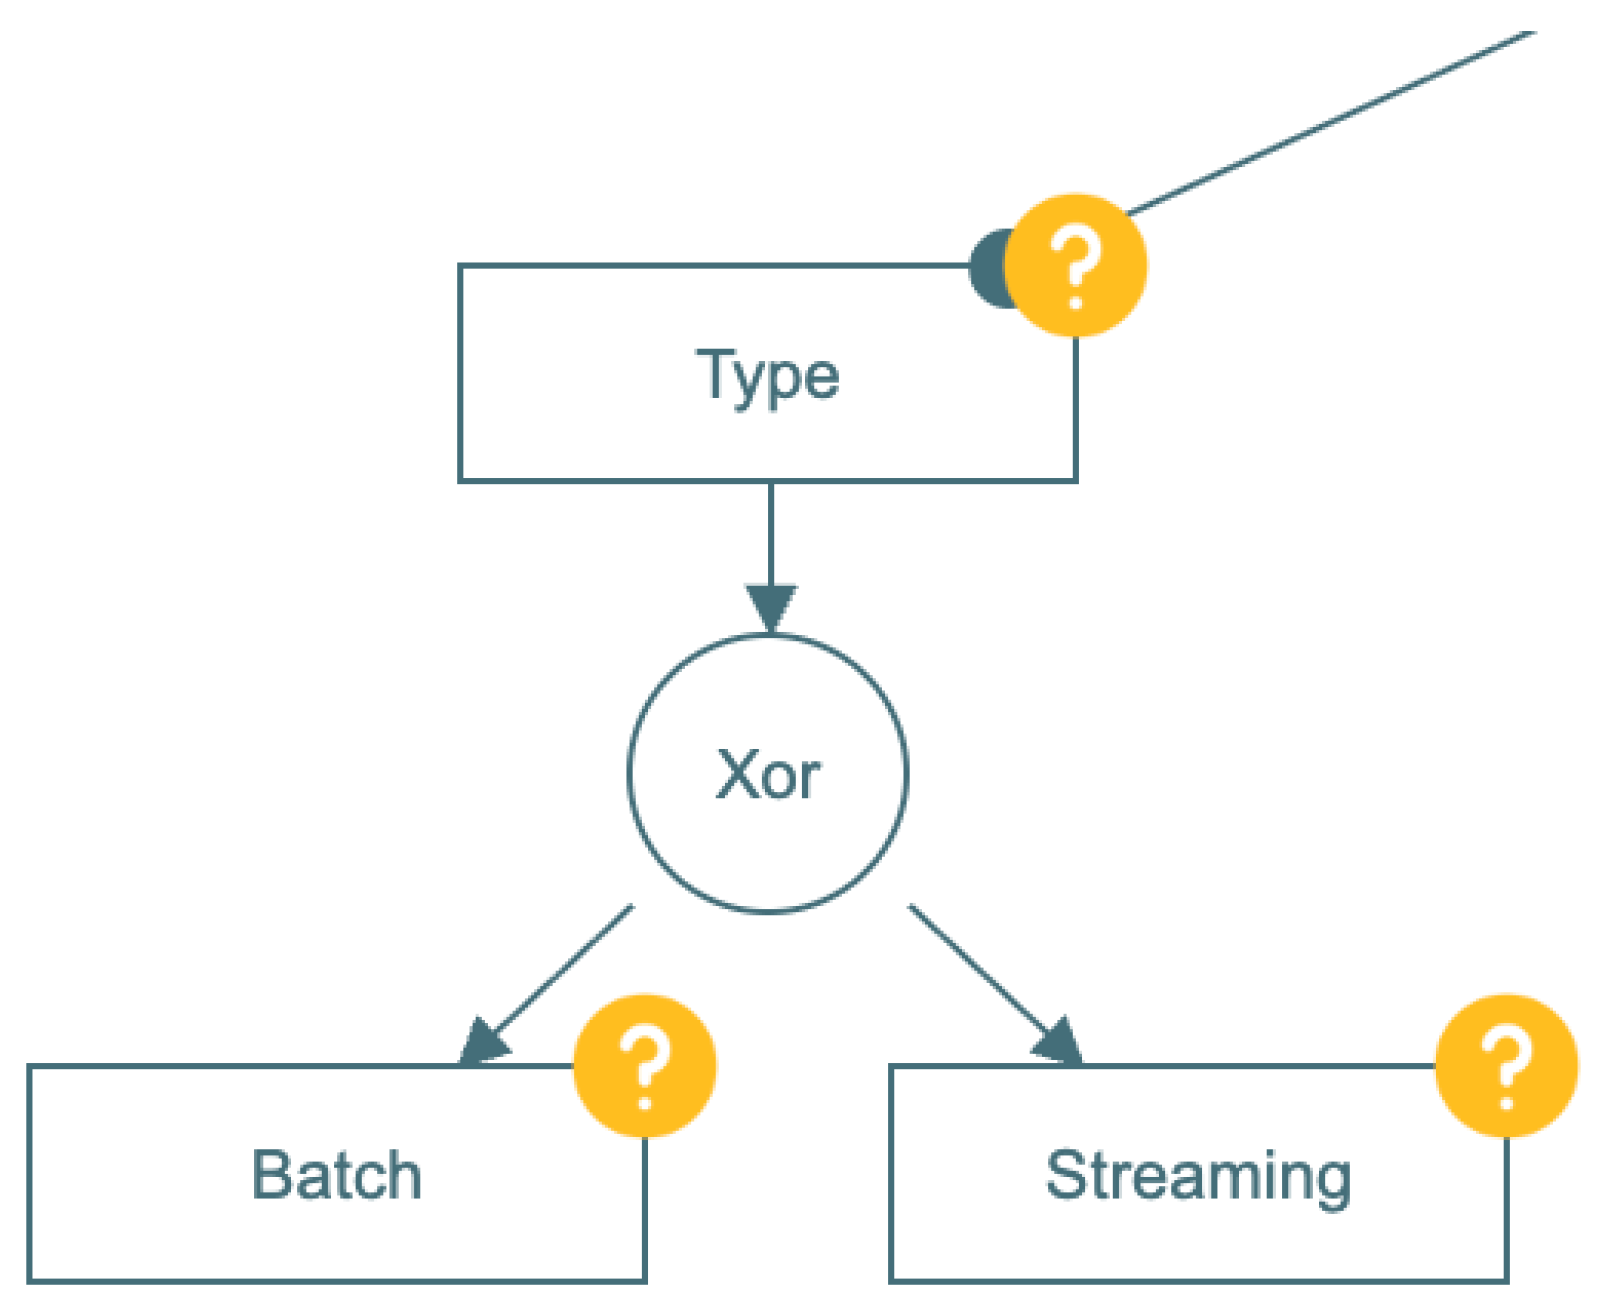
Batch ingestion refers to cases in which data are ‘accumulated’ at the source and are moved together according to some periodicity. It is important to note that the execution interval is external to the ingestion itself. The ingestion process is unitary; other components in a higher-level macrostructure (e.g., scheduling or triggers) define and repeatedly execute it. Streaming ingestion refers to cases in which data are generated and moved in real time, or near-real time, through constant micro-batches that are independent of the data volume.
Both types of ingestion are shown in Figure 7.
Figure 7.
FM for ingestion type (XOR group of the proposed model; detail of Figure 6).
Source
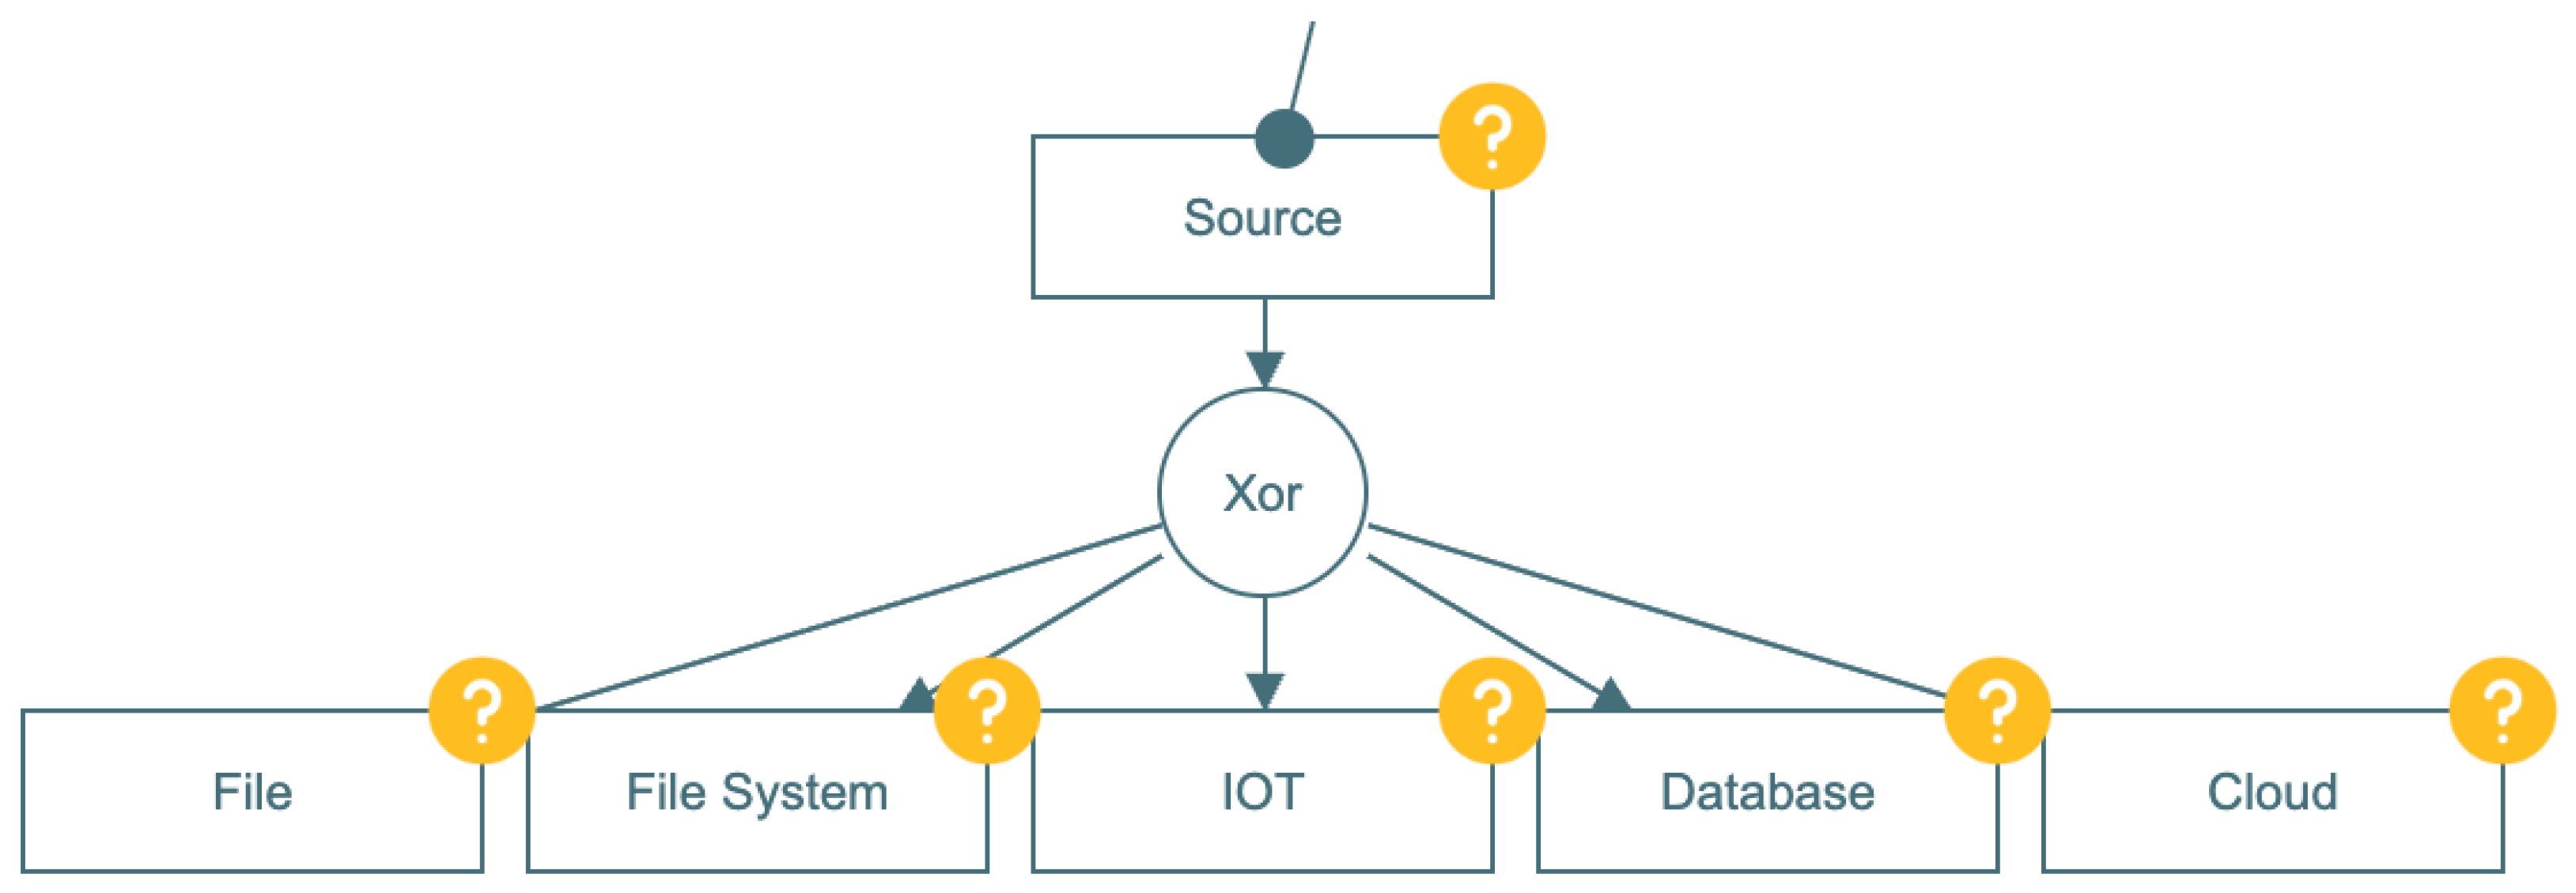
Each data ingestion process has exactly one data source. The sources vary by case and are largely classified into the categories proposed in Figure 8 based on the reviewed documents.
Figure 8.
FM examples of ingestion sources, categorized from the reviewed documents and instantiated in the proposed VariaMos model (detail of Figure 6).
Collector
To address how data are accessed from the listed sources, the collector is defined as the tool or technology that allows us to ’connect’ to a data source in order to access data. Figure 9 shows a set of collectors identified in the literature and industry; clearly, additional collectors may exist. Importantly, the collector enables access to data but does not necessarily move them.
Figure 9.
FM examples of ingestion collectors.
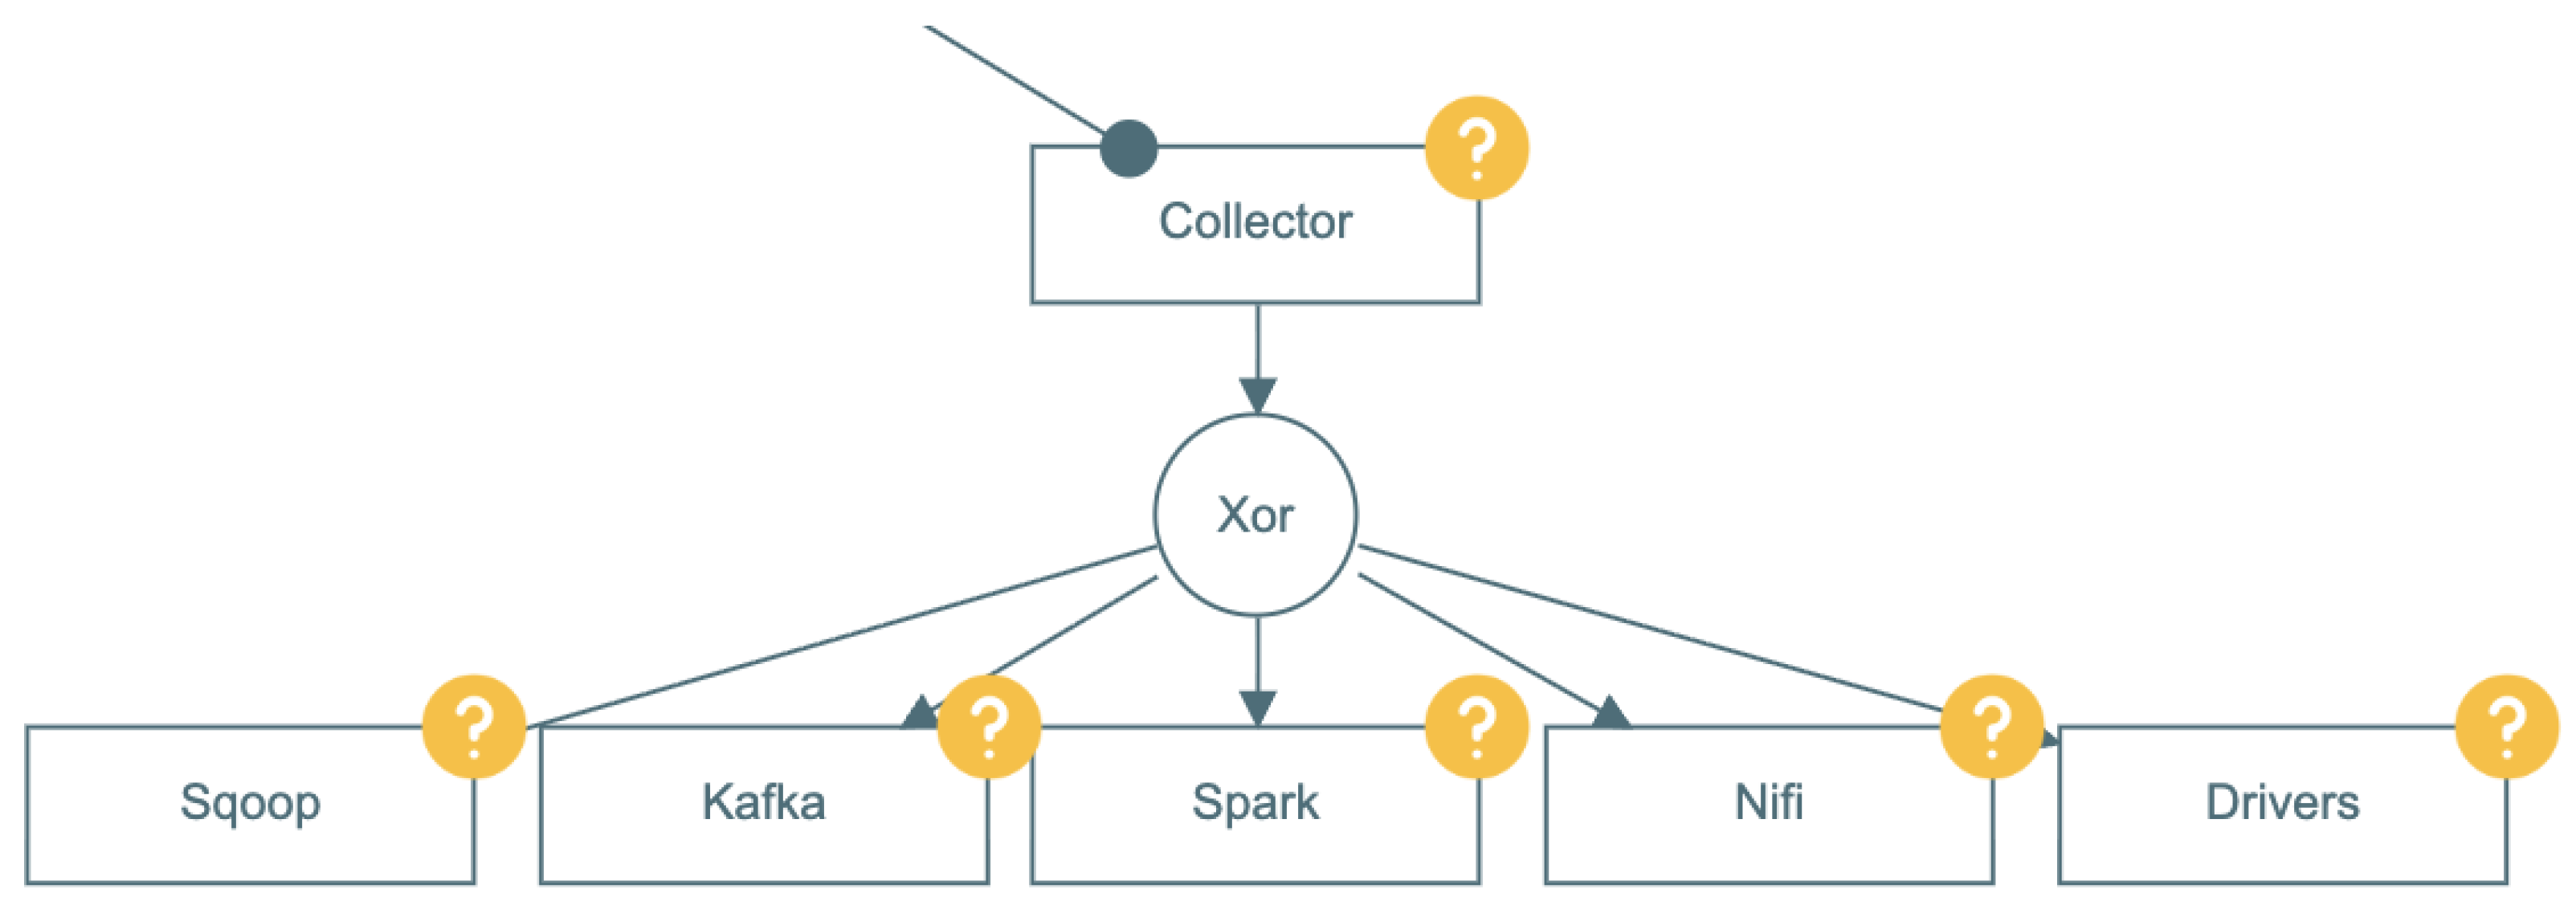
Integrator
Once data are accessed, they must be transferred to the destination, either final or intermediate. For this purpose, a set of tools/technologies may be employed, which are presented in Figure 10. It is not uncommon for some technologies to appear as both collectors and integrators, as several are robust enough to fulfill both roles.
Figure 10.
FM examples of ingestion integrators.
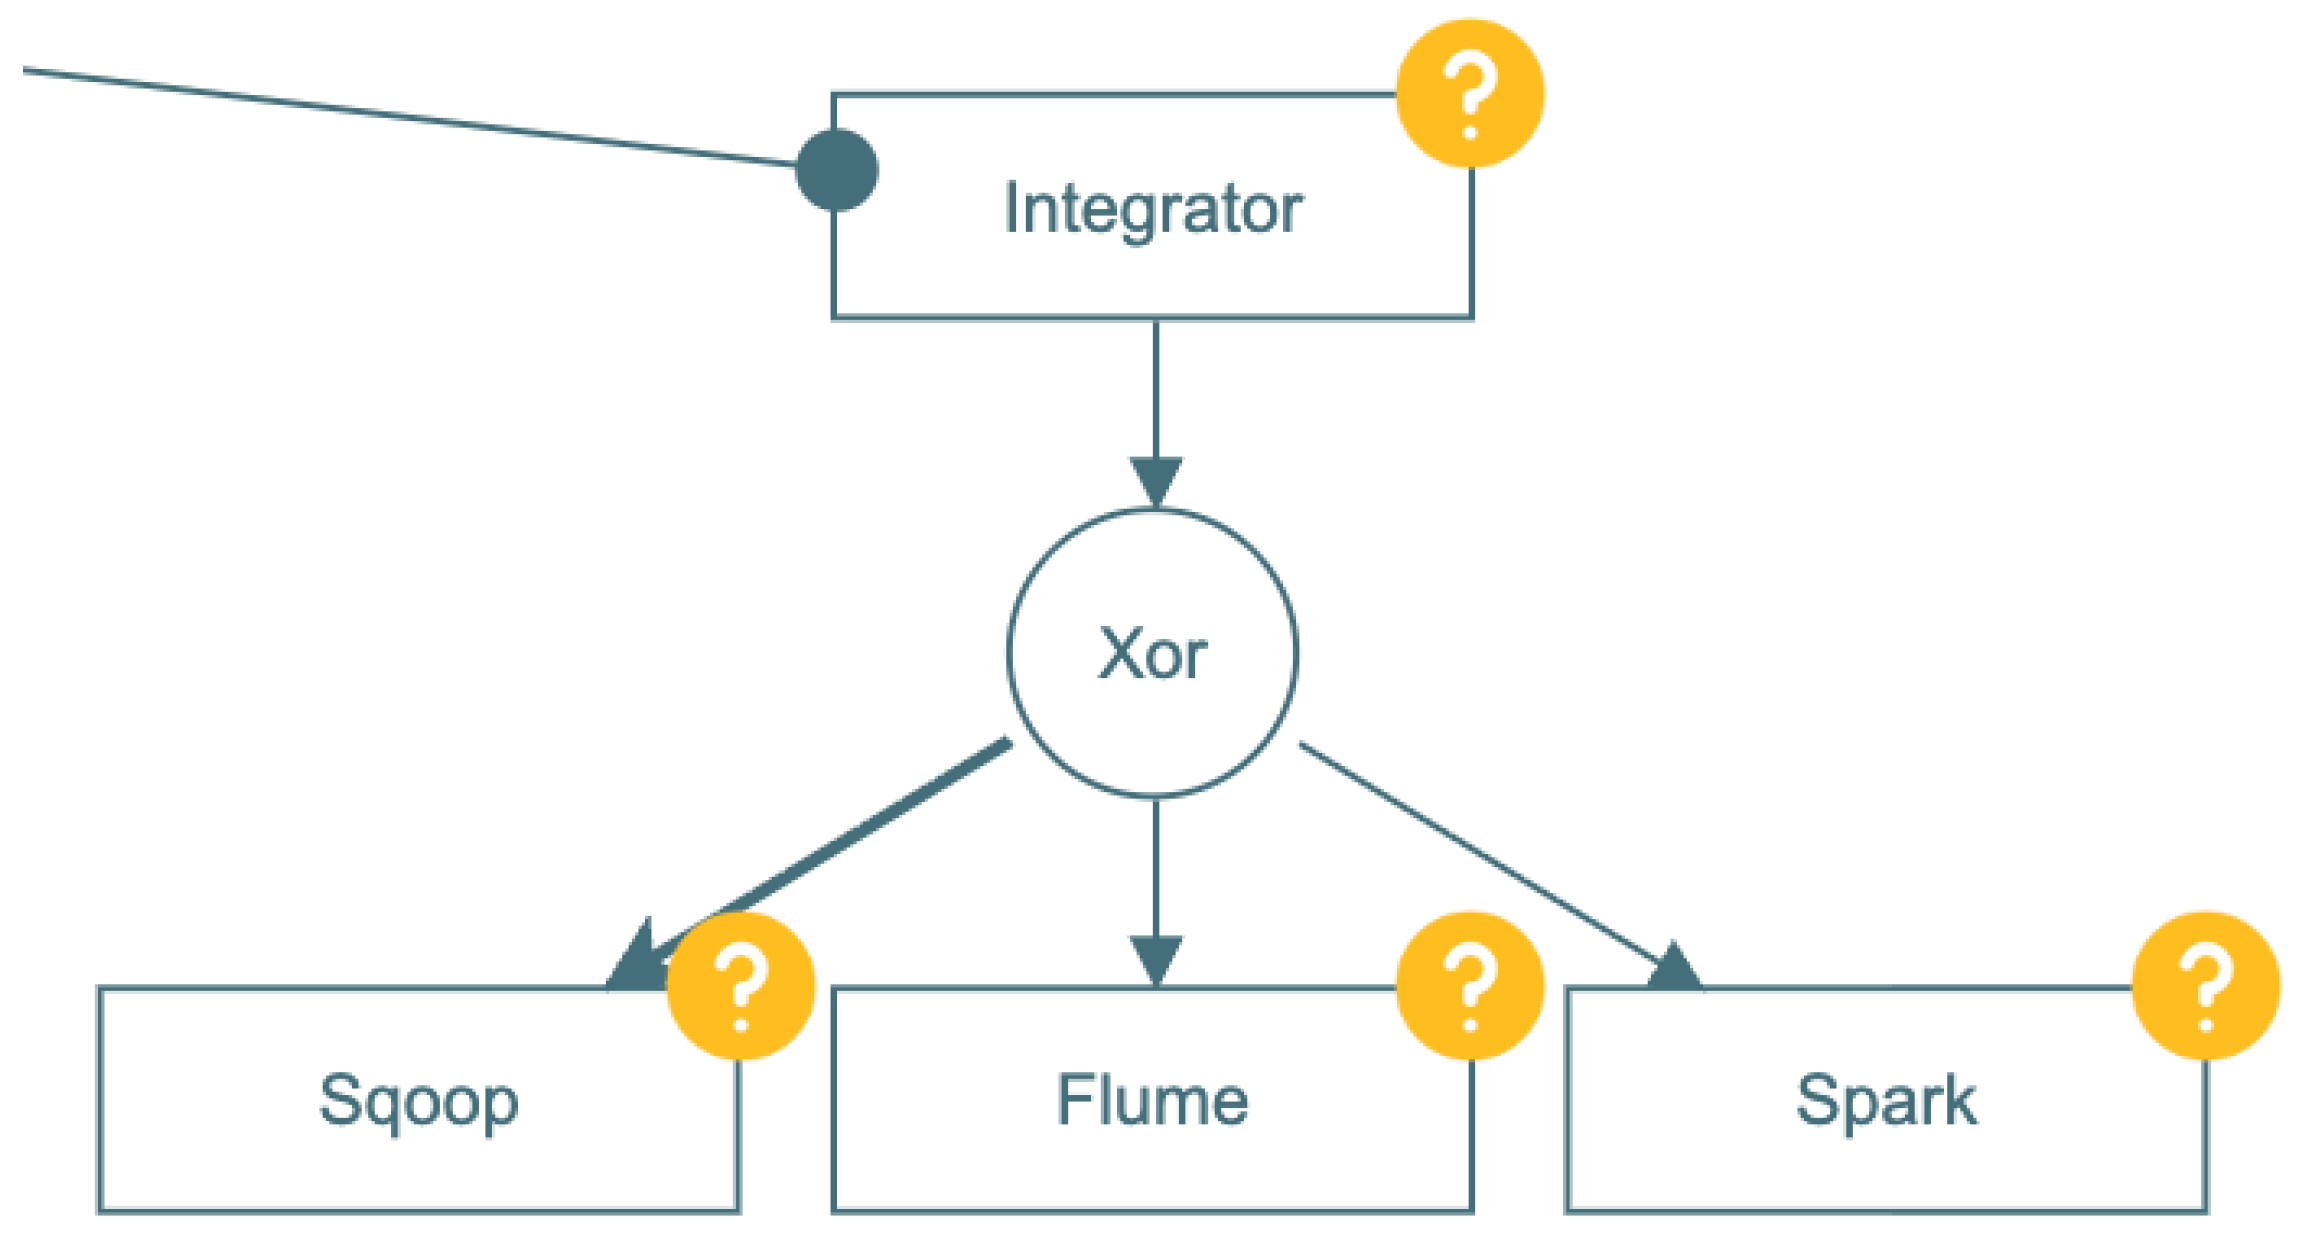
Final Storage
Completing the chain of mandatory ingestion elements, we reach final storage, i.e., how information is maintained in the raw zone of the data lake. This is often associated with high-capacity storage such as HDFS; however, depending on the specific needs, a range of data destinations may be appropriate as is shown in Figure 11.
Figure 11.
FM examples of final storage options in data ingestion.
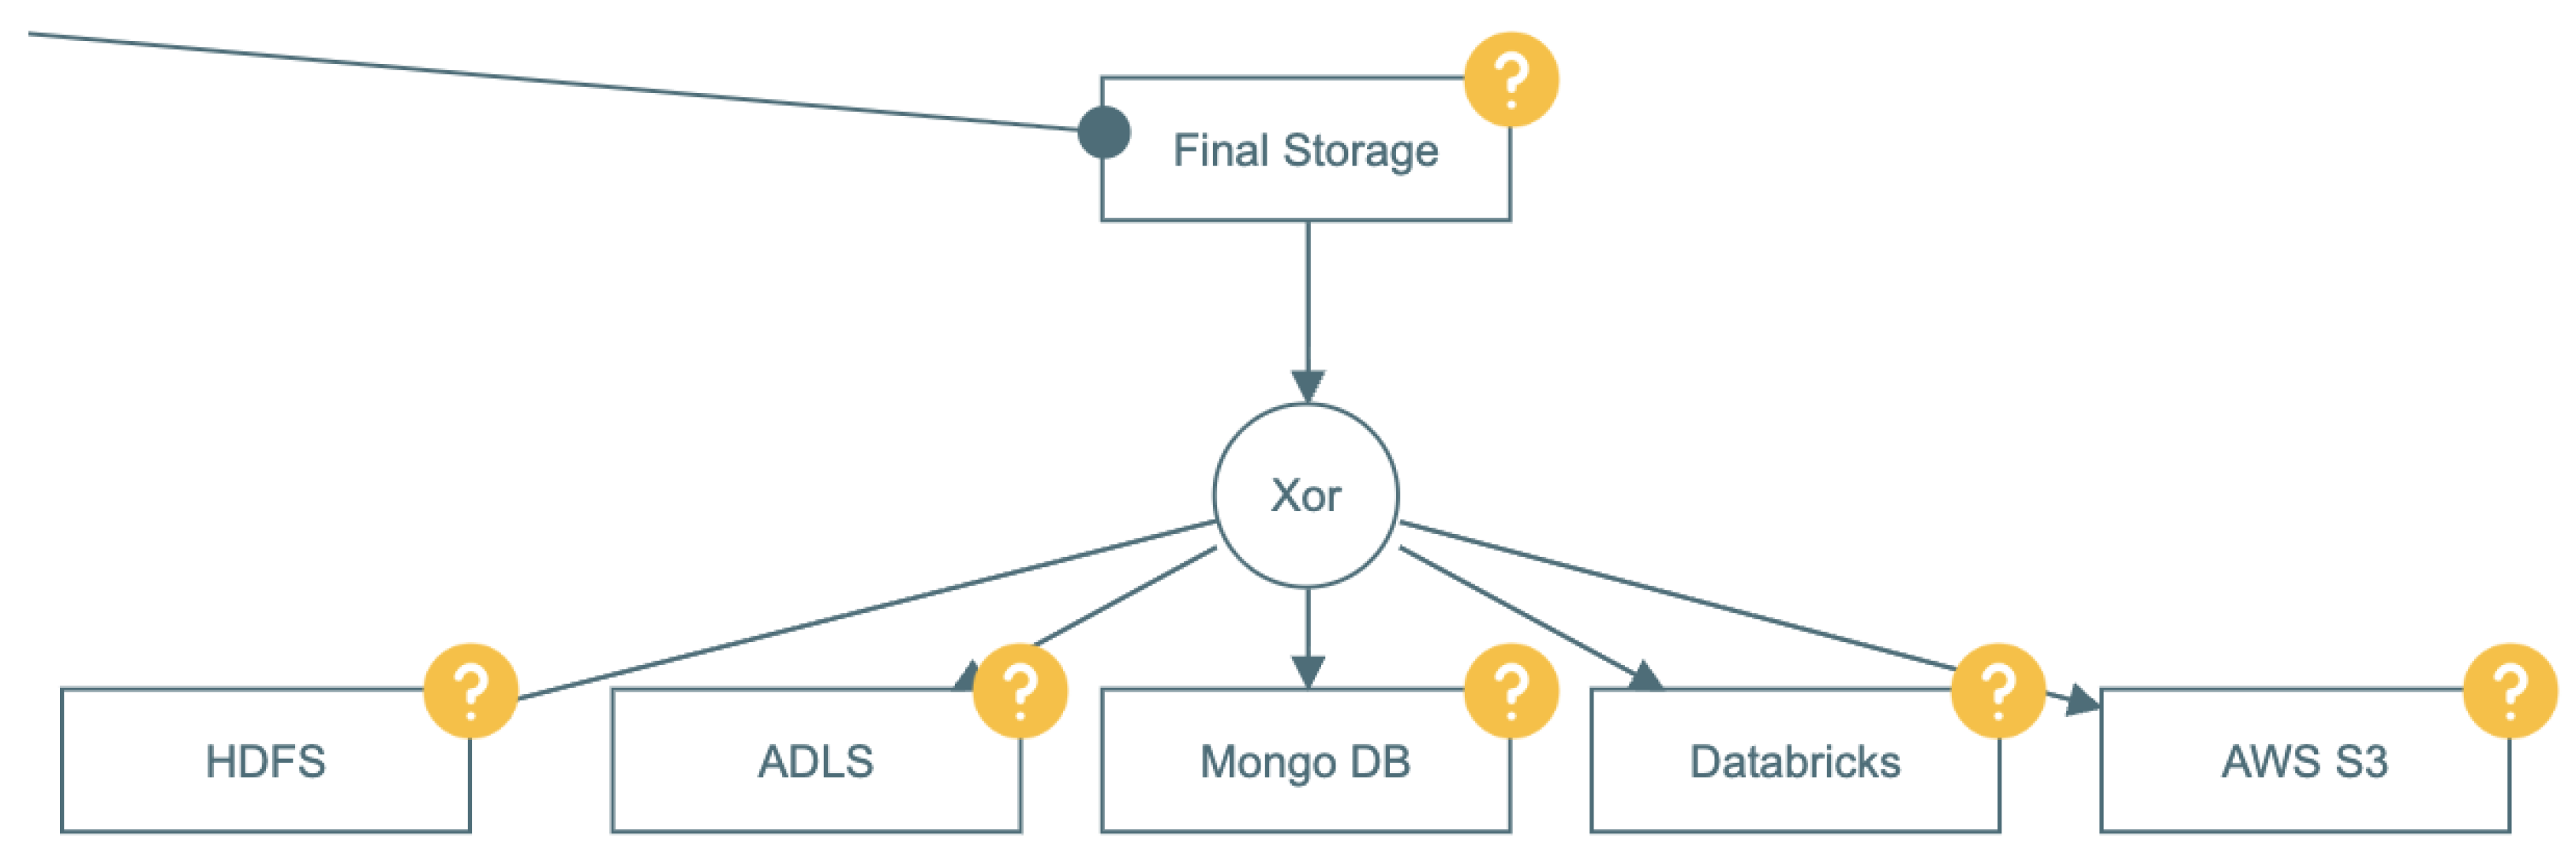
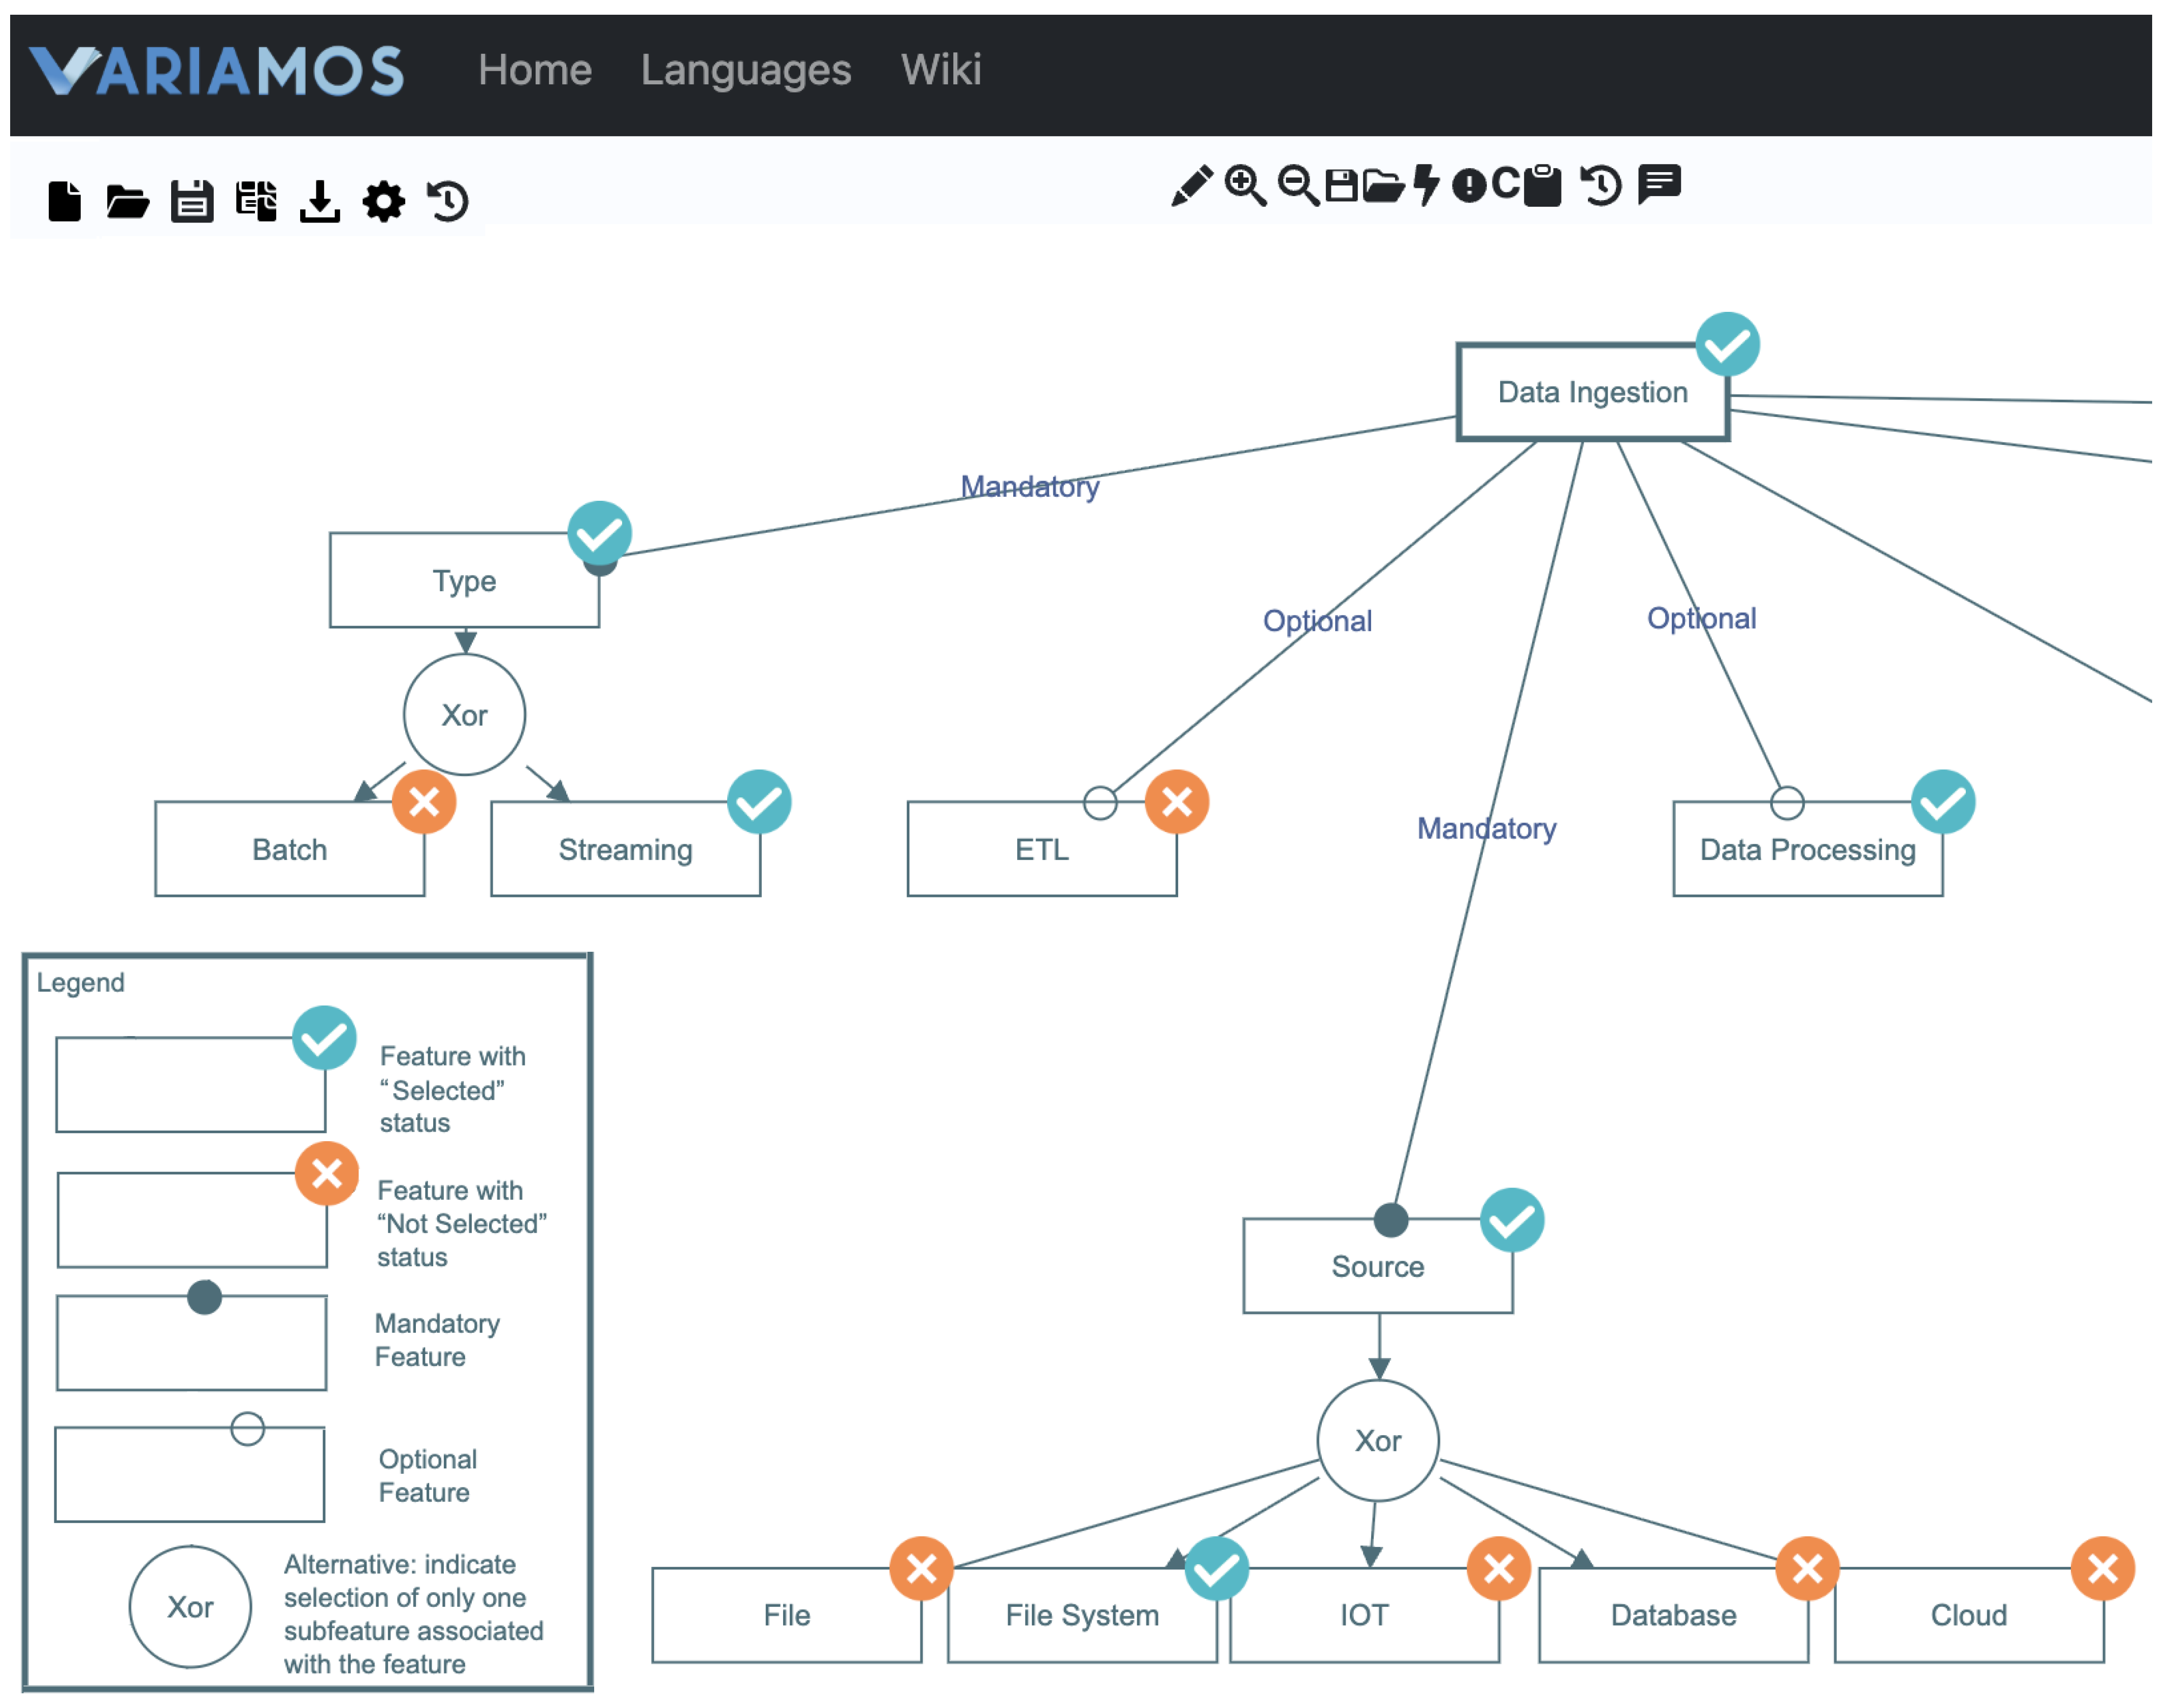
With the elements described above, it is possible to describe, plan, analyze, and implement an ingestion process for virtually any case, using the mapped tools/technologies or others that fit the context and client constraints and, most importantly, the architectural role that they represent. Additionally, optional elements may be considered, such as those described below Figure 12, which shows an example of the architecture.
Figure 12.
Example architecture for data ingestion using an FM and VariaMos.
ETL
It is essential to clarify that ingestion is not ETL; rather, ETL may be embedded within an ingestion process. This occurs when source data, in their original form, are not fully satisfactory. In such cases, a valid strategy is to access the data (collector), modify them as needed (transform), and transfer them to the destination. This is common when data can be collected under specific business rules.
Data Processing
In scenarios where the data lake does not include a transient loading zone but critical manipulation is required (e.g., anonymization of sensitive data), ingestion-level processing can be applied to ensure that the data reach the destination with the required transformations already applied.
Intermediate Storage
Some ingestion processes temporarily store data in an intermediate system that enables manipulation or processing prior to transfer to the final destination. For example, certain technologies allow working with data in a DataFrame between the collector and the integrator.
Feature Model Configuration Semantics
To complement the graphical presentation, Table 12 summarizes the configuration semantics of the proposed feature model, making explicit the decomposition of the root feature, i.e., data ingestion, the mandatory or optional nature of each first-level feature, and the group relationships that constrain valid configurations. A configuration is valid when it includes all mandatory features, satisfies every group cardinality, and complies with the cross-tree constraints of the model. The complete, machine-readable model is maintained in VariaMos, which is also the engine used to verify configuration validity and to automatically derive the solution variants illustrated in Figure 12.
Table 12.
Configuration semantics of the proposed feature model.
Traceability of Architectural Features
To make explicit the connection between the methodological streams described in Section 3 and the final architectural elements, Table 13 links each feature of the proposed model to the literature evidence, the industrial requirement, and, where applicable, the validation feedback that justifies its inclusion.
Table 13.
Traceability of the features of the proposed model to their originating evidence.
Architecture Example and Variations in VariaMos
Based on the elements described above, a concrete example of an ingestion architecture can be constructed. Thanks to VariaMos’s feature combination functionality, Figure 12 shows an example of one of many variants automatically generated according to the rules graphically described in the FM. This specific example of variability management is important because an architecture enriched with context-specific information yields concrete implementation variants that can then be evaluated for adoption.
In this example, one can see some of the features described in Figure 6 and specified as subfeatures in Figure 7, Figure 8, Figure 9, Figure 10 and Figure 11, represented as a variant in VariaMos with the graphical feature labeling either selected or unselected. One can see that mandatory features are always selected, while optional features may not be. One can also see that, within a group of alternatives (XOR), only one of the options is selected, while the others are not.
4.3. Validation
This subsection summarizes the survey results. The analysis is organized into (i) respondent profiling, (ii) usability responses, (iii) quality responses, and (iv) open-ended feedback.
The survey was answered by 29 respondents, grouped into two distinct cohorts that are reported separately throughout this section: an enterprise cohort of 15 practitioners (corresponding to 60% of the company’s employees) and a prospective cohort of 14 engineering interns. The enterprise cohort provides the main evidence for the industrial acceptance of the proposal, whereas the intern cohort provides complementary, prospective evidence.
Additionally, two distinct populations are considered when comparing the survey with the complementary activities: the structured survey was answered by the enterprise cohort ( practitioners) and intern cohort (), whereas the complementary feedback meeting (Section 3.3.5) involved a voluntary, self-selected subgroup of of the same enterprise respondents.
4.3.1. Respondent Profiling
Among the 29 respondents, five profiles can be identified according to the roles explained in Table 14: four correspond to the enterprise cohort (15 practitioners) and one corresponds to the prospective cohort (14 interns).
Table 14.
Respondent profiles.
4.3.2. Usability Results
For the usability section, the scores (on a scale) and anonymized individual results are as follows in Table 15, and they are associated with Bangor’s adjective rating scale in Table 16. Moreover, Table 15 reports the number of respondents (N) and the standard deviation (SD) per role. For the enterprise cohort, the overall individual average (, , ) is the value used as evidence for acceptance. The intern cohort obtained an individual average of (, ), and the global condensed view over the 29 respondents is reported in the ‘global’ row.
Table 15.
Usability results by role, including the number of respondents (N) and standard deviation (SD) per role.
Table 16.
Observed group average results for usability associated with Bangor’s adjective rating scale.
Table 17 reports the per-item results of the usability (SUS) instrument, combining both cohorts for a global condensed view (). For each item, it lists the desired value, the AVG, and the standard deviation.
Table 17.
Per-item usability (SUS) results.
4.3.3. Quality Results
For the quality section, the scores (on a scale) and anonymized individual results are as follows in Table 18, and they are associated with Bangor’s adjective rating scale in Table 19. As with usability, for the enterprise cohort, the overall individual average (, , ) is the value used as evidence for acceptance. The intern cohort obtained an individual average of (, ), and the global condensed view over the 29 respondents is reported in the ‘global’ row.
Table 18.
Quality results by role, including the number of respondents (N) and standard deviation (SD) per role.
Table 19.
Observed group average results for quality associated with Bangor’s adjective rating scale.
Table 20 reports the per-item results of the quality instrument, combining both cohorts for a global condensed view (). For each item, it lists the desired value, the AVG, and the standard deviation.
Table 20.
Per-item quality results.
4.3.4. Open-Ended Feedback
As mentioned above, the survey included an optional open-ended feedback section where respondents could provide perceptions, questions, or recommendations regarding the proposed architecture.
The six responses were grouped into the following themes:
- Conceptual doubts—Some respondents were unfamiliar with engineering terms that the authors assumed to be trivial and that were not defined in the document. This supports the recommendation to define, clarify, or briefly recall key concepts in the proposal.
- Zone usage—Respondents discussed perspectives on data lake zone usage and potential data redundancy across zones and between development and production environments. These remarks do not directly affect the proposal.
- Clarity regarding the work—Respondents reported that the proposal document helped them to better understand the activities that they currently performed.
- Potential expansion of the architecture—Respondents suggested future work in which the architecture could be scaled to a ’broader picture’ that includes orchestration and ingestion reprocessing.
4.3.5. Feedback Meeting Results
As described in Section 3.3.5, a focused discussion session was held with seven respondents who voluntarily agreed to participate following an open call issued after the quantitative results were processed.
The meeting was held to further explore two SUS items that yielded non-ideal results, with strong concentration around the Likert value 3.
Items 4 and 10 in Section 3.3.2 relate to the need for technical support and technical knowledge to use the architecture. The conclusions derived from the participant interventions focused on the following:
- Questions on how to operationally relate the architecture to deliverable products. The discussion considered an ideal of automatically generating software components or artifacts from metamodeling and the architectural representation. The meeting reiterated that the architecture is primarily a representation and a means to standardize technical ingestion information.
- Practical questions about how to draw the architecture. The meeting collected the idea of providing a base template, stored in the cloud and embedded in the architectural documentation for easy access and reuse.
4.3.6. Engineering Metrics: Before/After Comparison
This subsection reports the results for the indicators defined in Table 5, following the design described in Section 3.3.6. Results are reported separately for the two cohorts, the enterprise practitioners (retrospective) and the engineering interns (prospective), as the AVG per code. The ‘before’ and ‘after’ values related to time are those reported by respondents as the effort required to design a data ingestion process. As for ‘description completeness’, it was assessed by comparing the respondents’ detailed responses against a reference solution.
Table 21 summarizes, for each indicator, the aggregate value in the ‘before’ (ad hoc) condition and in the ‘after’ (architecture in VariaMos) condition, together with the observed change.
Table 21.
Before/after results for the cohort of enterprise practitioners (retrospective).
Table 22 reports the same indicators for the 14 engineering interns, who executed the paired protocol prospectively (each intern completed one case without the architecture and an equivalent case with the architecture in VariaMos). Because both conditions were measured at execution time on the same participant, this cohort provides the prospective, paired evidence of the study.
Table 22.
Before/after results for the cohort of enterprise interns (prospective).
Across both cohorts, the three indicators move in the same direction: design time (M1) and documentation workload (M2) drop by roughly half in the ‘after’ condition, while description completeness (M3) increases for practitioners and interns. The consistency of this pattern across retrospective and prospective cohorts strengthens the plausibility that the reduction in effort and the improvement in documentation completeness are associated with the use of the architecture in VariaMos rather than with a single measurement setting.
5. Discussion
This work addresses a recurrent and practical engineering problem: the absence of a formalized reference architecture—in this case, for data lake ingestion processes in a consulting firm operating under governance constraints defined by BFSI-sector clients. The proposal combines a feature model-based reference architecture with a variability management mechanism implemented in VariaMos, and it was evaluated through a structured survey administered to two cohorts (15 enterprise practitioners and 14 engineering interns) directly or analogously involved in the ingestion processes that the architecture seeks to formalize, complemented by a before/after task-based comparison.
The systematic mapping provided academic grounding for a domain that, despite its industrial relevance, has received limited attention in the literature. Only seven papers focusing specifically on data lake ingestion were identified as architecturally relevant, and none proposed a variability-oriented representation that explicitly distinguished elements of the ingestion process. This gap is not trivial: the absence of such a representation means that commonalities and variabilities across ingestion initiatives remain implicit, which hinders reuse, documentation, training, and systematic decision-making. The proposed FM addresses this gap by making the variability space explicit and manageable through a supporting tool.
For the enterprise cohort, the architecture achieved an individual average usability score of 76 and an individual average quality score of 85.71; the intern cohort yielded individual averages of 70.18 for usability and 74.74 for quality; and the global condensed view over the 29 respondents yielded 73.19 for usability and 80.42 for quality. Under Bangor’s adjective rating scale, these values position the proposal in the ‘acceptable’ range and reach the self-imposed minimum threshold of ‘marginal high’. The quality result in particular suggests that practitioners perceive the architecture as directly applicable to their work. Notably, within the enterprise cohort, no role group scored below 69 on usability or below 81 on quality, indicating consistency across profiles with different levels of technical exposure; the intern cohort scored somewhat lower, which is consistent with their junior, supervised profile.
The open-ended feedback and the feedback meeting reinforced these quantitative signals. Respondents rapidly connected the architectural representation with scenarios that they had previously addressed in an unstructured manner, and several identified extension directions that suggested that the proposal was understood not as a closed artifact but as an evolving framework. The two SUS items whose scores were concentrated around the midpoint—those related to the need for technical support and prior technical knowledge—were clarified in the feedback meeting as concerns about operationalization rather than comprehension, a distinction that is relevant for the architecture’s future development.
The evaluation was conducted within the organization where the architecture was developed, which introduced potential bias because the respondents knew that the architecture had been developed by a colleague; however, two factors attenuate this concern in the present case. The survey was anonymous, and the respondents had no prior familiarity with the architecture or with the concept of variability management as applied to their work. The architecture was specifically designed to address a problem that the respondents experienced but had no formal representation for. The architecture was presented to them for the first time at the communication session immediately preceding the survey.
Another concern is related to external validity, because the evaluation was conducted in a single firm, operating in a specific sector and national context. The results are therefore valid as evidence of acceptance and perceived utility within this context. This is an acknowledged limitation of DSR evaluations at this stage of the research cycle, and external replication with practitioners from comparable firms remains an explicit direction for future work.
More specifically, the enterprise evaluation was based on 15 questionnaires, corresponding to 60% of the surveyed firm’s staff, complemented by 14 interns, and all responses originated from a single Chilean consulting firm. No cross-firm, cross-regional, or cross-industry comparisons are available at this stage, so the conclusions cannot be claimed to be externally generalizable. To address this, an extended validation plan has been defined as future work, involving additional enterprises in the same domain and the collection of cross-organizational comparative data, including a BFSI versus non-BFSI comparison.
Beyond the perception-based instruments, a before/after comparison against the previous ad hoc workflow was carried out to obtain task-based evidence (Section 3.3.6 and Section 4.3.6). Each participant completed one ingestion case without the architecture and an equivalent case with the architecture in VariaMos, and the indicators in Table 5 were recorded in both conditions. Two observations temper the analysis. First, the effort indicators (M1, M2) exhibit large dispersion in the ‘before’ condition (e.g., for M1 in the practitioner cohort), consistent with the heterogeneity of ad hoc practice, so the reported averages should be read as indicative of a trend rather than as precise effect sizes. Second, the practitioner ‘before’ values were recovered and systematized retrospectively, whereas the intern values were measured prospectively under paired conditions; the agreement between both cohorts is therefore reassuring. A fully controlled, prospective replication within the enterprise remains desirable, and the ablation and multi-firm plans described below are intended to consolidate this evidence.
From a practical standpoint, the proposal demonstrated immediate applicability. After the evaluation, the architecture began to be used to represent selected ingestion cases within the organization, suggesting that knowledge transfer occurred at a sufficient level for independent adoption.
The FM-based representation, implemented in VariaMos, also demonstrated that variability management tooling can be introduced in an industrial data engineering context without requiring prior expertise in software product line engineering, provided that the notation is accompanied by adequate documentation and communication. This connection between architectural choices and resource efficiency is consistent with recent evidence in event-driven data orchestration: comparing a parallel-consumer against a unified-consumer architecture for high-volume real-time ingestion, ref. [51] report substantially lower CPU and memory consumption for the unified variant at near-equivalent throughput. Such results reinforce the motivation for making ingestion variability explicit and analyzable, so that configuration decisions with a measurable operational impact can be reasoned about systematically rather than left implicit.
From a research standpoint, the work contributes evidence that feature models are a viable and well-received mechanism for representing variability in data ingestion architectures, extending prior applications of FM-based representations in adjacent big data domains. The industrial validation, while limited in scope, provides a grounded starting point for more controlled evaluations that could include task-based measures, external populations, or comparative conditions against alternative representations.
The flexibility of the FM-based approach also supports future evolution as new technologies emerge or constraints change; the model can be updated incrementally without redesigning the architecture from scratch. This property, which is inherent to the FM formalism, is particularly relevant in a domain characterized by rapid technological change and heterogeneous client requirements.
6. Conclusions
This work proposed and evaluated a feature model-based reference architecture for data lake ingestion processes, developed in response to a practical and recurrent engineering problem identified in a consulting firm operating in the BFSI sector. The absence of a formalized ingestion process, combined with the implicit and unmanaged variability across ingestion initiatives, motivated the design of an artifact intended to support engineering teams in communication, documentation, training, and solution definition.
The systematic mapping established that data ingestion in the data lake context has received limited academic attention relative to its industrial relevance and that no prior work has proposed a variability-oriented representation explicitly distinguishing between mandatory, optional, and alternative elements at the level of granularity required for practical configuration. This gap provided the scientific motivation for the proposed FM, whose elements (type, source, collector, integrator, ETL, data processing, intermediate storage, and final storage) were derived from and traceable to the reviewed literature and validated against industrial practice.
The evaluation produced usability and quality scores that exceeded the self-imposed acceptance threshold under Bangor’s adjective rating scale, with consistency across respondent profiles ranging from management to junior developers. The immediate post-evaluation adoption of the architecture for representing active ingestion cases within the organization provides additional evidence of practical utility beyond the survey responses.
Four directions are identified for future work: (i) external replication with practitioners from comparable firms is required to assess the generalizability of the results beyond the current organizational context; (ii) the formalization of cross-tree constraints within the FM, particularly those derived from governance and BFSI-sector regulatory requirements, would strengthen the model’s analytical capabilities and allow the automatic detection of invalid configurations; (iii) the integration of the FM with code generation or documentation automation mechanisms, building on VariaMos’s modeling capabilities, represents a natural extension toward reducing the manual effort currently required to translate architectural decisions into implementation artifacts; and (iv) an ablation study is planned to isolate the contributions of each component of the proposal by comparing three groups: (1) plain-text documentation without FM modeling, (2) FM modeling without automated tooling support, and (3) the complete integrated solution combining FM modeling with VariaMos tool support, analyzing differences in questionnaire feedback and engineering metrics across the three groups.
The proposal demonstrates that feature model-based variability management—a technique established in software product line engineering—can be successfully transferred to the data engineering domain with measurable acceptance and immediate practical uptake, even in the absence of prior familiarity with the underlying formalism among the target practitioners.
Author Contributions
Conceptualization, J.L.-O., O.A. and R.M.; methodology, J.L.-O. and O.A.; software, J.L.-O.; validation, J.L.-O., O.A. and R.M.; formal analysis, J.L.-O.; investigation, J.L.-O.; resources, J.L.-O. and R.M.; data curation, J.L.-O.; writing—original draft preparation, J.L.-O.; writing—review and editing, O.A. and R.M.; visualization, J.L.-O.; supervision, R.M.; project administration, J.L.-O.; funding acquisition, J.L.-O. and O.A. All authors have read and agreed to the published version of the manuscript.
Funding
Oscar Aguayo is funded by Universidad de La Frontera, Vicerrectoría de Investigación y Postgrado, research project PAT24-0007.
Institutional Review Board Statement
Not applicable.
Informed Consent Statement
Informed consent was obtained from all participants at the beginning of the survey. Participants took part voluntarily, and their anonymity is preserved in accordance with the confidentiality agreement with the consulting firm.
Data Availability Statement
The data presented in this study are available on request from the corresponding author. The data are not publicly available due to a confidentiality agreement with the consulting firm.
Acknowledgments
During the preparation of this manuscript, the author(s) used Asta (web-based scientific research assistant; version Olmo 2 1B), Anara (version 3.0), Consensus (version 2.0), and Elicit (version 3.0) for the purpose of gathering information as described in the methodology and Grammarly (Desktop version 1.2) for the purpose of improving the translation and style of the text. The authors have reviewed and edited the output and take full responsibility for the content of this publication.
Conflicts of Interest
The authors declare no conflicts of interest.
Abbreviations
The following abbreviations are used in this manuscript:
| BFSI | Banking, Financial Services, and Insurance |
| DL | Data Lake |
| DW | Data Warehouse |
| DSR | Design Science Research |
| ETL | Extract, Transform, and Load |
| ELT | Extract, Load, and Transform |
| FM | Feature Model |
| FODA | Feature-Oriented Domain Analysis |
| HDFS | Hadoop Distributed File System |
| MDE | Model-Driven Engineering |
| OVM | Orthogonal Variability Model |
| RDBMS | Relational Database Management System |
| RQ | Research Question |
| SPL | Software Product Line |
| SUS | System Usability Scale |
Appendix A. Detailed Outputs of the AI-Assisted Literature Exploration
This appendix reports the detailed outputs of the exploratory study on AI-based research support tools summarized in Section 4.1.3. For reproducibility, the exploration was conducted as follows: the prompt submitted to every tool was exactly the research question RQ9, ‘How is software variability addressed in the data domain?’, with no additional instructions; all four tools (Asta, Anara, Consensus, and Elicit) were used in their free versions through their public web interfaces; the steps reported by each tool, the references retrieved, and the key ideas produced were recorded and analyzed as presented below; and the references cited by the tools were manually verified by the authors before being considered in the analysis. To minimize redundancy, the main text reports only the cross-tool synthesis pertinent to RQ9. This appendix preserves tool-specific search traces, intermediate outputs, and extracted key ideas exclusively to ensure methodological transparency, reproducibility, and auditability. These materials are provided for documentation purposes and are not construed as independent evidentiary support for the architectural claims.
Appendix A.1. Asta
On its landing page, Asta offers three options: ‘Find papers’, for conducting a broader search for documents; ‘Analyze data’, for uploading datasets and querying them; and, finally, the ‘Generate a report’ section, which we used because it is based on submitting a research question.
The application describes several steps, with the tasks detailed in Table A1.
Table A1.
Steps performed by Asta.
The tool then generates a report that can be viewed online and downloaded as a PDF, containing structured text that addresses the research question. After review, the following key ideas are identified, as presented in Table A2.
Table A2.
Key ideas on how software variability is addressed in the data domain according to Asta.
Appendix A.2. Anara
On its landing page, the Anara tool prominently features elements related to working with and interacting with files, such as a file management library and a chat feature for interacting with them. Using the ‘Create Agent’ option, the research question is submitted. The tool then states that it performs the following steps described in Table A3.
Table A3.
Steps performed by Anara.
The tool then generates a report that can be viewed online and downloaded as a LaTeX document, containing structured text that addresses the research question. After review, the following key ideas are identified, as presented in Table A4.
Table A4.
Key ideas in software variability for data management according to Anara.
Appendix A.3. Consensus
The tool on the landing page of Consensus is immediately visible and features a chat box for research inquiries. It allows users to specify whether they wish to work with a general-knowledge base or a medical specialty database. It also allows users to perform an in-depth search.
The application describes the following steps, with the tasks detailed in Table A5. These steps focus primarily on research topics and the number of papers identified. At the start of the search, the tool indicates a pool of 438 million papers, narrowed down to 1500 eligible papers, with 50 of these included in the generation of its response.
Table A5.
Search queries on software variability in the data domain performed by Consensus.
The tool then generates a report that can be viewed online and downloaded as a PDF, containing structured text that addresses the research question, as well as a variety of additional resources that enrich the analysis of the response, such as comparative tables, bibliometric data, and the methodology used, among others.
After the review of the report, the key ideas identified are as presented in Table A6.
Table A6.
Key ideas on software variability in data lake ingestion according to Consensus.
Appendix A.4. Elicit
The tool on the landing page of Elicit is immediately visible and features a chat box for research inquiries. Among the main free options are ‘Find Papers’, ‘Chat with Papers’, ‘Report’, and ‘Research Agent’, which is the option used to provide the research question to answer.
The tool outlines the steps described in Table A7 for reasoning through the answer.
Table A7.
Reasoning steps performed by Elicit.
The tool then generates a report that can be viewed online, saved in a library, or downloaded in MarkDown. The bibliography used in the analysis can be downloaded in various formats as well. The analysis performed by Elicit stated the key ideas presented in Table A8.
Table A8.
Key ideas on data variability management in software product lines.
Appendix A.5. An Overview of the Use of AI-Based Research Tools
The four AI-based tools used in this section, Asta, Anara, Consensus, and Elicit, all demonstrated the capacity to retrieve academically relevant material and produce structured responses to the posed research question. Despite addressing the same query, the tools exhibited notable differences in their search strategies, the depth of the concepts identified, and the formats in which the results were delivered.
Asta and Consensus operated primarily through large-scale corpus retrieval and multi-pass ranking, while Anara adopted an iterative web reading approach, progressively expanding its source pool. Elicit, in contrast, focused on a smaller curated set of academic papers and emphasized reasoning transparency.
These differences are not merely procedural; they translate into substantive divergences in the conceptual landscape that each tool constructs. From the perspective of the research question itself, the results confirm that software variability in the data domain is a recognized concern, addressed through a range of techniques derived from software product line engineering. Feature modeling emerges as the most widely reported representational mechanism, employed to capture mandatory, optional, and alternative elements of data schemas, warehouse structures, and ingestion pipelines. This aligns with the architectural foundation adopted in the present work, where the feature model serves as the primary notation for representing ingestion variability.
However, the integration of formal variability management tools, such as VariaMos, within data-intensive engineering contexts remains largely underexplored in the reviewed material, indicating a gap that the present proposal contributes to addressing.
Regarding the utility of AI-based tools for supporting academic research, the experience documented here suggests both positive and negative perspectives.
On the positive side, all four tools accelerated the initial literature exploration, surfaced relevant works beyond the scope of manual database searches, and produced organized summaries that served as useful starting points for deeper analysis. The transparency mechanisms offered by most tools, detailing search queries, paper counts, and reasoning steps, are a notable improvement over opaque retrieval systems and facilitate a critical assessment of the generated content.
On the other hand, the evaluated tools are not exempt from limitations inherent to current AI-assisted research systems: the inability to guarantee coverage of paywalled literature, the risk of hallucinated or misattributed references, and the absence of methodological rigor comparable to a formal systematic review.
References
- Azzabi, S.; Alfughi, Z.; Ouda, A. Data Lakes: A Survey of Concepts and Architectures. Computers 2024, 13, 183. [Google Scholar] [CrossRef] [Scilit]
- Stach, C. Data Is the New Oil–Sort of: A View on Why This Comparison Is Misleading and Its Implications for Modern Data Administration. Future Internet 2023, 15, 71. [Google Scholar] [CrossRef] [Scilit]
- Kozmina, N.; Niedrite, L.; Zemnickis, J. Information Requirements for Big Data Projects: A Review of State-of-the-Art Approaches. In Communications in Computer and Information Science; Springer International Publishing: Berlin/Heidelberg, Germany, 2018; pp. 73–89. [Google Scholar] [CrossRef] [Scilit]
- Sawadogo, P.; Darmont, J. On Data Lake Architectures and Metadata Management. J. Intell. Inf. Syst. 2021, 56, 97–120. [Google Scholar] [CrossRef] [Scilit]
- Khine, P.P.; Wang, Z.S. Data lake: A new ideology in big data era. ITM Web Conf. 2018, 17, 03025. [Google Scholar] [CrossRef] [Scilit]
- Salma, C.A.; Tekinerdogan, B.; Athanasiadis, I.N. Domain-Driven Design of Big Data Systems Based on a Reference Architecture. In Software Architecture for Big Data and the Cloud; Elsevier: Amsterdam, The Netherlands, 2017; pp. 49–68. [Google Scholar] [CrossRef] [Scilit]
- Kang, K.C.; Cohen, S.G.; Hess, J.A.; Novak, W.E.; Peterson, A.S. Feature-Oriented Domain Analysis (FODA) Feasibility Study; Technical report; Software Engineering Institute, Carnegie Mellon University: Pittsburgh, PA, USA, 1990. [Google Scholar]
- Pohl, K.; Böckle, G.; Van Der Linden, F. Software Product Line Engineering: Foundations, Principles, and Techniques; Springer: Berlin/Heidelberg, Germany, 2005; Volume 1. [Google Scholar]
- Metzger, A.; Pohl, K. Software product line engineering and variability management: Achievements and challenges. In Proceedings of the Future of Software Engineering Proceedings, New York, NY, USA, 31 May–7 June 2014; pp. 70–84. [Google Scholar] [CrossRef] [Scilit]
- Berger, T.; Rublack, R.; Nair, D.; Atlee, J.M.; Becker, M.; Czarnecki, K.; Wąsowski, A. A survey of variability modeling in industrial practice. In Proceedings of the 7th International Workshop on Variability Modelling of Software-Intensive Systems, New York, NY, USA, 23–25 January 2013. [Google Scholar] [CrossRef] [Scilit]
- Bashroush, R.; Garba, M.; Rabiser, R.; Groher, I.; Botterweck, G. CASE Tool Support for Variability Management in Software Product Lines. ACM Comput. Surv. 2017, 50, 14. [Google Scholar] [CrossRef] [Scilit]
- Salma, C.A.; Tekinerdogan, B.; Athanasiadis, I.N. Feature Driven Survey of Big Data Systems. In Proceedings of the International Conference on Internet of Things and Big Data—IoTBD, Rome, Italy, 23–25 April 2016; pp. 348–355. [Google Scholar] [CrossRef] [Scilit]
- Abirami, K.; Punitha, S. A Hybrid ETL Framework for Optimized Data Ingestion and Real-Time Processing in Data Lakehouse Architectures using AI-Driven Orchestration and Contextual Data Partitioning. In Proceedings of the 2025 7th International Conference on Signal Processing, Computing and Control (ISPCC), Solan, India, 6–8 March 2025; pp. 1014–1020. [Google Scholar] [CrossRef] [Scilit]
- Li, Z.; Peng, B.; Huang, Q.; Weng, C. Karst: Transactional Data Ingestion Without Blocking on a Scalable Architecture. IEEE Trans. Knowl. Data Eng. 2022, 34, 2241–2253. [Google Scholar] [CrossRef] [Scilit]
- Rucco, C.; Longo, A.; Saad, M. Efficient Data Ingestion in Cloud-based architecture: A Data Engineering Design Pattern Proposal. arXiv 2025, arXiv:2503.16079. [Google Scholar] [CrossRef] [Scilit]
- Vásquez, F.; Lagos, J.; Gutiérrez, F.; Escobar, F.; Hochstetter-Diez, J. From an On-Premises-Centered to a Cloud Ecosystems: Lessons Learned from a Success Story in the Chilean Financial Sector. In Proceedings of the HCI International 2025—Late Breaking Papers (HCII 2025); Nah, F.F.H., Siau, K.L., Eds.; Lecture Notes in Computer Science; Springer: Cham, Switzerland, 2026; Volume 16343. [Google Scholar] [CrossRef] [Scilit]
- Khan, W.; Kumar, T.; Zhang, C.; Raj, K.; Roy, A.M.; Luo, B. SQL and NoSQL Database Software Architecture Performance Analysis and Assessments—A Systematic Literature Review. Big Data Cogn. Comput. 2023, 7, 97. [Google Scholar] [CrossRef] [Scilit]
- Hakami, T.A.; Alginahi, Y.M.; Sabri, O. Exploring the Evolution of Big Data Technologies: A Systematic Literature Review of Trends, Challenges, and Future Directions. Future Internet 2025, 17, 427. [Google Scholar] [CrossRef] [Scilit]
- Badshah, A.; Daud, A.; Alharbey, R.; Banjar, A.; Bukhari, A.; Alshemaimri, B. Big Data Applications: Overview, Challenges and Future. Artif. Intell. Rev. 2024, 57, 290. [Google Scholar] [CrossRef] [Scilit]
- Ravat, F.; Zhao, Y. Data Lakes: Trends and Perspectives. In Proceedings of the Database and Expert Systems Applications: 30th International Conference, DEXA 2019, Linz, Austria, 26–29 August 2019; pp. 304–313. [Google Scholar] [CrossRef] [Scilit]
- Wibowo, M.; Sulaiman, S.; Shamsuddin, S.M. Machine Learning in Data Lake for Combining Data Silos. In Data Mining and Big Data; Springer International Publishing: Berlin/Heidelberg, Germany, 2017; pp. 294–306. [Google Scholar] [CrossRef] [Scilit]
- Gupta, S.; Giri, V. Practical Enterprise Data Lake Insights; Apress: New York, NY, USA, 2018. [Google Scholar] [CrossRef] [Scilit]
- Aguayo, O.; Sepúlveda, S. Variability Management in Dynamic Software Product Lines for Self-Adaptive Systems—A Systematic Mapping. Appl. Sci. 2022, 12, 10240. [Google Scholar] [CrossRef] [Scilit]
- Chen, L.; Ali Babar, M. A systematic review of evaluation of variability management approaches in software product lines. Inf. Softw. Technol. 2011, 53, 344–362. [Google Scholar] [CrossRef] [Scilit]
- Deelstra, S.; Sinnema, M.; Bosch, J. Experiences in Software Product Families: Problems and Issues During Product Derivation. In Proceedings of the Software Product Lines (SPLC 2004); Nord, R.L., Ed.; Lecture Notes in Computer Science; Springer: Berlin/Heidelberg, Germany, 2004; Volume 3154, pp. 165–182. [Google Scholar] [CrossRef] [Scilit]
- Van der Linden, F.J.; Schmid, K.; Rommes, E. Software Product Lines in Action: The Best Industrial Practice in Product Line Engineering; Springer Science & Business Media: Berlin/Heidelberg, Germany, 2007. [Google Scholar]
- Schmid, K.; de Almeida, E.S. Product Line Engineering. IEEE Softw. 2013, 30, 24–30. [Google Scholar] [CrossRef] [Scilit]
- Lagos, J.; Cravero, A. Reference architecture for data ingestion in Data Lake. In Proceedings of the 2023 18th Iberian Conference on Information Systems and Technologies (CISTI), Aveiro, Portugal, 20–23 June 2023; pp. 1–9. [Google Scholar] [CrossRef] [Scilit]
- Tunjić, A. The Automation of the Data Lake Ingestion Process from Various Sources. In Proceedings of the 2019 42nd International Convention on Information and Communication Technology, Electronics and Microelectronics (MIPRO), Opatija, Croatia, 20–24 May 2019; pp. 1276–1281. [Google Scholar] [CrossRef] [Scilit]
- Mazo, R. A Generic Approach for Automated Verification of Product Line Models. Ph.D. Thesis, Université Paris 1 Panthéon, Sorbonne, France, 2011. [Google Scholar]
- Riebisch, M. Towards a more precise definition of feature models. In Modelling Variability for Object-Oriented Product Lines; Springer: Berlin/Heidelberg, Germany, 2003; pp. 64–76. [Google Scholar]
- Lee, K.; Kang, K.C.; Lee, J. Concepts and Guidelines of Feature Modeling for Product Line Software Engineering. In Proceedings of the Software Reuse: Methods, Techniques, and Tools (ICSR 2002); Gacek, C., Ed.; Lecture Notes in Computer Science; Springer: Berlin/Heidelberg, Germany, 2002; Volume 2319. [Google Scholar] [CrossRef] [Scilit] [PubMed]
- Mazo, R.; Salinesi, C.; Diaz, D. VariaMos: A Tool for Product Line Driven Systems Engineering with a Constraint Based Approach. In Proceedings of the CAiSE Forum 2012, Gdańsk, Poland, 25–26 June 2012; Volume 855, pp. 147–154. [Google Scholar]
- Aguayo, O.; Lagos-Obando, J.; Sepúlveda, S.; Mazo, R. Collaborative Support for Software Product Line Modeling and Project Management: A Generative AI-Enhanced Approach with Real-Time Synchronization. Appl. Sci. 2026, 16, 8466. [Google Scholar] [CrossRef] [Scilit]
- Mazo, R.; Muñoz Fernández, J.C.; Rincón, L.; Salinesi, C.; Tamura, G. VariaMos: An extensible tool for engineering (dynamic) product lines. In Proceedings of the 19th International Conference on Software Product Line, New York, NY, USA, 20–24 July 2015; pp. 374–379. [Google Scholar] [CrossRef] [Scilit]
- Aguayo, O.; Sepúlveda, S.; Mazo, R.; Calfunao, S.; Candia, S. Collaborative Management of Software Product Lines: Lessons Learned from the Development of Real-Time Variability Models. In Proceedings of the 2024 43rd International Conference of the Chilean Computer Science Society (SCCC), Temuco, Chile, 28–30 October 2024; pp. 1–7. [Google Scholar] [CrossRef] [Scilit]
- Lagos, J.; Cravero, A. Process Formalization Proposal for Data Ingestion in a Data Lake. In Proceedings of the 2022 41st International Conference of the Chilean Computer Science Society (SCCC), Santiago, Chile, 21–25 November 2022; pp. 1–8. [Google Scholar] [CrossRef] [Scilit]
- Wieringa, R.J. Design Science Methodology for Information Systems and Software Engineering; Springer: Berlin/Heidelberg, Germany, 2014. [Google Scholar] [CrossRef] [Scilit]
- Lagos-Obando, J.; Aillapán, G.; Fenner-López, J.; Bustamante-Mora, A.; Burgos-López, M. A Secure-by-Design Approach to Big Data Analytics Using Databricks and Format-Preserving Encryption. Appl. Sci. 2025, 15, 10356. [Google Scholar] [CrossRef] [Scilit]
- Petersen, K.; Feldt, R.; Mujtaba, S.; Mattsson, M. Systematic Mapping Studies in Software Engineering. In Proceedings of the Electronic Workshops in Computing; BCS Learning & Development: Swindon, UK, 2008. [Google Scholar] [CrossRef] [Scilit]
- Bangor, A.; Kortum, P.; Miller, J. Determining what individual SUS scores mean: Adding an adjective rating scale. J. Usability Stud. 2009, 4, 114–123. [Google Scholar]
- Brooke, J. SUS: A ‘Quick and Dirty’ Usability Scale. In Usability Evaluation in Industry; Jordan, P.W., Thomas, B., McClelland, I.L., Weerdmeester, B., Eds.; CRC Press: London, UK, 1996; pp. 189–194. [Google Scholar] [CrossRef] [Scilit]
- Easterbrook, S.; Singer, J.; Storey, M.A.; Damian, D. Selecting Empirical Methods for Software Engineering Research; Springer: Berlin/Heidelberg, Germany, 2008; pp. 285–311. [Google Scholar] [CrossRef] [Scilit] [PubMed]
- Nadal, S.; Herrero, V.; Romero, O.; Abelló, A.; Franch, X.; Vansummeren, S.; Valerio, D. A software reference architecture for semantic-aware Big Data systems. Inf. Softw. Technol. 2017, 90, 75–92. [Google Scholar] [CrossRef] [Scilit]
- ISO/IEC 25010:2011; Systems and Software Engineering—Systems and Software Quality Requirements and Evaluation (SQuaRE)—System and Software Quality Models. Technical Report 25010; International Organization for Standardization: Geneva, Switzerland, 2011.
- Villanustre, F.; Chala, A.; Dev, R.; Xu, L.; LexisNexis, J.S.; Furht, B.; Khoshgoftaar, T. Modeling and tracking Covid-19 cases using Big Data analytics on HPCC system platform. J. Big Data 2021, 8, 33. [Google Scholar] [CrossRef] [Scilit] [PubMed]
- Derakhshannia, M.; Gervet, C.; Hajj-Hassan, H.; Laurent, A.; Martin, A. Data Lake Governance: Towards a Systemic and Natural Ecosystem Analogy. Future Internet 2020, 12, 126. [Google Scholar] [CrossRef] [Scilit]
- Sellami, R.; Zalila, F.; Nuttinck, A.; Dupont, S.; Deprez, J.C.; Mouton, S. FADI—A Deployment Framework for Big Data Management and Analytics. In Proceedings of the 2020 IEEE 29th International Conference on Enabling Technologies: Infrastructure for Collaborative Enterprises (WETICE), Bayonne, France, 10–13 September 2020; pp. 153–158. [Google Scholar] [CrossRef] [Scilit]
- Sha M, M.; Rahamathulla, M.P. Cloud-based Healthcare data management Framework. KSII Trans. Internet Inf. Syst. 2020, 14, 1014–1025. [Google Scholar] [CrossRef] [Scilit]
- Wullink, M.; Muller, M.; Davids, M.; Moura, G.C.M.; Hesselman, C. ENTRADA: Enabling DNS big data applications. In Proceedings of the 2016 APWG Symposium on Electronic Crime Research (eCrime), Toronto, ON, Canada, 1–3 June 2016; pp. 1–11. [Google Scholar] [CrossRef] [Scilit]
- Dakov, S.; Dakova, M. Event-Driven Data Orchestration: A Modular Approach for High-Volume Real-Time Processing. Eng. Proc. 2025, 100, 48. [Google Scholar] [CrossRef] [Scilit]
- Gamzayev, R.; Tkachuk, M.; Shevkoplias, D. Knowledge-Oriented Information Technology to Variability Management at the Domain Analysis Stage in Software Development. Adv. Inf. Syst. 2020, 4, 39–47. [Google Scholar] [CrossRef] [Scilit]
- Haider, U. Representing Variability in Software Architecture: A Systematic Literature Review. Int. J. Softw. Eng. Comput. Syst. 2018, 4, 19–37. [Google Scholar] [CrossRef] [Scilit]
- Nascimento, N.; Tavares, C.; Alencar, P.; Cowan, D. GPT in Data Science: A Practical Exploration of Model Selection. arXiv 2023, arXiv:2311.11516. [Google Scholar] [CrossRef] [Scilit]
- Nešić, D.; Krüger, J.; Stănciulescu, S.; Berger, T. Principles of Feature Modeling; Gesellschaft für Informatik e.V.: Bonn, Germany, 2020; p. 77. [Google Scholar] [CrossRef]
- Tavares, C.; Nascimento, N.; Alencar, P.; Cowan, D. Extending Variability-Aware Model Selection with Bias Detection in Machine Learning Projects. In Proceedings of the 2023 IEEE International Conference on Big Data (BigData), Sorrento, Italy, 15–18 December 2023; pp. 2441–2449. [Google Scholar] [CrossRef] [Scilit]
- Nascimento, N.; Alencar, P.; Lucena, C.; Cowan, D. An IoT Analytics Embodied Agent Model based on Context-Aware Machine Learning. In Proceedings of the 2018 IEEE International Conference on Big Data (Big Data), Seattle, WA, USA, 10–13 December 2018; pp. 5170–5175. [Google Scholar] [CrossRef] [Scilit]
- Ndjodo, M.F.; Ngoumou, A. Transformational Variability Modeling Approach to Configurable Business System Application. In Software Product Line—Advanced Topic; Elfaki, A.O., Ed.; IntechOpen: London, UK, 2012; Chapter 3. [Google Scholar] [CrossRef] [Scilit] [PubMed]
- Elfaki, A.O.; Fong, S.L.; Vijayaprasad, P.; Johar, M.G.M.; Fadhil, M.S. Using a Rule-based Method for Detecting Anomalies in Software Product Line. Res. J. Appl. Sci. Eng. Technol. 2014, 7, 275–281. [Google Scholar] [CrossRef] [Scilit]
- Shahin, R. Towards Modal Software Engineering. arXiv 2021, arXiv:2102.02966. [Google Scholar]
- Khalfallah, N.; Ouali, S.; Kraiem, N. Approach for Managing Variability in Database Schema. J. Asian Sci. Res. 2018, 8, 221–236. [Google Scholar] [CrossRef] [Scilit][Green Version]
- Khalfallah, N.; Kraiem, N.; Ouali, S. VariaLBD: Approach for Modeling and Implementing Variability in the Databases Inherent to Software Product Lines. J. Softw. 2020, 15, 1–11. [Google Scholar] [CrossRef] [Scilit][Green Version]
- Khalfallah, N.; Ouali, S.; Kraiem, N. Case Tool Support for Variability Managing in Database Schemas. J. Softw. 2018, 13, 600–612. [Google Scholar] [CrossRef] [Scilit]
- Coz, J.R.; Gil, R.H.; Somolinos, J.A.C.; Ruiz, J.C.L. A Generative Approach to Improve the Abstraction Level to Build Applications Based on the Notification of Changes in Databases. ICEIS 2008, 1, 421–424. [Google Scholar] [CrossRef] [Scilit]
- Muslah, E.; Ghoul, S. Requirements Variability Specification for Data Intensive Software. Int. J. Softw. Eng. Appl. 2019, 10, 23–34. [Google Scholar] [CrossRef] [Scilit]
- Allian, A.P.; Silva, L.F.; OliveiraJr, E.; Nakagawa, E.Y. VMTools-RA: A Reference Architecture for Software Variability Tools. J. Univers. Comput. Sci. 2023, 29, 649–690. [Google Scholar] [CrossRef] [Scilit]
- Horcas, J.M.; Galindo, J.A.; Benavides, D. Variability in data visualization: A software product line approach. In Proceedings of the 26th ACM International Systems and Software Product Line Conference, Graz, Austria, 12–16 September 2022; pp. 55–66. [Google Scholar] [CrossRef] [Scilit]
- Brault, Y.; El Amraoui, Y.; Blay-Fornarino, M.; Collet, P.; Jaillet, F.; Precioso, F. Taming the Diversity of Computational Notebooks. In Proceedings of the 27th ACM International Systems and Software Product Line Conference, Tokyo, Japan, 28 August–1 September 2023; pp. 27–33. [Google Scholar] [CrossRef] [Scilit]
- Managing Variability in Relational Databases by VDBMS. Available online: https://ar5iv.labs.arxiv.org/html/1911.11184 (accessed on 25 May 2026).
- Building Information System Variants with Tailored Database Schemas Using Features. Available online: https://www.se.cs.uni-saarland.de/publications/docs/BTW2009er.pdf (accessed on 5 May 2026).
- Towards Managing Data Variability in Multi Product Lines. Available online: https://www.scitepress.org/papers/2015/52270/52270.pdf (accessed on 20 May 2026).
- Bartholdt, J.; Ag, S.; Oberhauser, R.; Rytina, A. Addressing Data Model Variability and Data Integration within Software Product Lines. Int. J. Adv. Softw. 2009, 2, 84–100. [Google Scholar]
- Tavva, G. Adaptive Data Pipeline Framework for Unified Ingestion Patterns for Diverse Data Ecosystems. Int. J. Sci. Technol. 2025, 16. [Google Scholar] [CrossRef] [Scilit]
- Zhao, Y.; Megdiche, I.; Ravat, F. Data Lake Ingestion Management. arXiv 2021, arXiv:2107.02885. [Google Scholar]
- Nadal, S.; Jovanovic, P.; Bilalli, B.; Romero, O. Operationalizing and Automating Data Governance. J. Big Data 2022, 9, 117. [Google Scholar] [CrossRef] [Scilit] [PubMed]
- Foidl, H.; Golendukhina, V.; Ramler, R.; Felderer, M. Data pipeline quality: Influencing factors, root causes of data-related issues, and processing problem areas for developers. J. Syst. Softw. 2024, 207, 111855. [Google Scholar] [CrossRef] [Scilit]
- Madabathula, L. Reusable Streaming Pipeline Frameworks for Enterprise Lakehouse Analytics. Int. J. Eng. Ext. Technol. Res. 2024, 6, 8444–8451. [Google Scholar] [CrossRef] [Scilit]
- Rucco, C.; Longo, A.; Saad, M. Enhancing Data Ingestion Efficiency in Cloud-Based Systems: A Design Pattern Approach. Data Sci. Eng. 2026, 11, 287–302. [Google Scholar] [CrossRef] [Scilit]
- Hai, R. Data Integration and Metadata Management in Data Lakes. Ph.D. Thesis, RWTH Aachen University, Aachen, Germany, 2020. [Google Scholar] [CrossRef]
- Gopaluni, J. Metadata Driven Optimization of Distributed ETL Pipelines in Cloud Native Data Warehouses. Int. J. Comput. Exp. Sci. Eng. 2025, 11, 10145–10155. [Google Scholar] [CrossRef] [Scilit]
- Dandolu, S. Automating Data Quality in Cloud Data Lakes: A Metadata-Driven Approach. J. Inf. Syst. Eng. Manag. 2025, 10. [Google Scholar] [CrossRef] [Scilit]
- Sreepathy, H.V.; Dinesh Rao, B.; Kumar Jaysubramanian, M.; Deepak Rao, B. Data Ingestions as a Service (DIaaS): A Unified Interface for Heterogeneous Data Ingestion, Transformation, and Metadata Management for Data Lake. IEEE Access 2024, 12, 156131–156145. [Google Scholar] [CrossRef] [Scilit]
- Garg, V. Mitigating Data Quality and Consistency Challenges in Multi-Source Ingestion through Schema Validation and Transformation Techniques. J. Eng. Appl. Sci. Technol. 2024, 6, 1–3. [Google Scholar] [CrossRef] [Scilit]
- Murarka, S.; Jain, A.; Singh, L. Advanced Techniques in Data Ingestion and Pipelining for Scalable Big Data Platforms: A Comprehensive Review. In Proceedings of the 2024 IEEE 4th International Conference on ICT in Business Industry & Government (ICTBIG), Indore, India, 13–14 December 2024; pp. 1–6. [Google Scholar] [CrossRef] [Scilit]
- Kukkuhalli, S.H. Building a Dynamic Data Ingestion Framework to Manage Schema Evolution for an Enterprise. Int. J. Multidiscip. Res. 2022, 4, 1–5. [Google Scholar] [CrossRef]
- Shojaee Rad, Z.; Ghobaei-Arani, M. Data Pipeline Approaches in Serverless Computing: A Taxonomy, Review, and Research Trends. J. Big Data 2024, 11, 82. [Google Scholar] [CrossRef] [Scilit]
- Gurp, J.V.; Bosch, J.; Svahnberg, M. Managing Variability in Software Product Lines. IEEE Softw. 2010, 27, 89–91+94. [Google Scholar] [CrossRef] [Scilit]
- Zaid, L.A.; Troyer, O.D. Towards Modeling Data Variability in Software Product Lines. In Enterprise, Business-Process and Information Systems Modeling; Springer: Berlin/Heidelberg, Germany, 2011. [Google Scholar] [CrossRef] [Scilit]
- Khedri, N.; Khosravi, R. Incremental Variability Management in Conceptual Data Models of Software Product Lines. In Proceedings of the 2015 Asia-Pacific Software Engineering Conference (APSEC), New Delhi, India, 1–4 December 2015. [Google Scholar] [CrossRef] [Scilit]
- Khedri, N.; Khosravi, R. Handling Database Schema Variability in Software Product Lines. In Proceedings of the 2013 20th Asia-Pacific Software Engineering Conference (APSEC), Bangkok, Thailand, 2–5 December 2013. [Google Scholar] [CrossRef] [Scilit]
- Ataei, P.; Termehchy, A.; Walkingshaw, E. Managing Structurally Heterogeneous Databases in Software Product Lines. In Heterogeneous Data Management, Polystores, and Analytics for Healthcare; Springer: Cham, Switzerland, 2018. [Google Scholar] [CrossRef] [Scilit]

Disclaimer/Publisher’s Note: The statements, opinions and data contained in all publications are solely those of the individual author(s) and contributor(s) and not of MDPI and/or the editor(s). MDPI and/or the editor(s) disclaim responsibility for any injury to people or property resulting from any ideas, methods, instructions or products referred to in the content. |
© 2026 by the authors. Licensee MDPI, Basel, Switzerland. This article is an open access article distributed under the terms and conditions of the Creative Commons Attribution (CC BY) license.