


Abstract
Pressure losses in centralized valve-controlled hydraulic systems limit hydraulic efficiency in electric excavators. This study examined boom-cylinder extension on a 4.3 t electric excavator using a 40-point matrix of main-spool opening and motor speed. For each retained response, the steady propulsion stage (S2) was identified, and repeated-response averages formed a pressure-loss-ratio map; independent reprocessing gave a mean absolute difference of 0.40 percentage points. The ratio generally increased with motor speed at fixed opening and with decreasing opening at fixed speed. Across the 40–100% openings, the speed-induced span was 5.30–7.47 percentage points; at the nominal 15% opening, the ratio converged within 67.21–68.20%. The measured return-to-supply pressure-drop ratio increased from 0.56 to 0.60 at 40–100% to 3.41 at 15%, indicating a shift toward return-path dominance. A calibrated 16.3% simulation input represented the nominal 15% setting. Across the full map, including this calibrated correspondence, the model yielded a mean absolute relative error of 4.83% and a root mean square error of 2.54 percentage points. Simulation decomposition showed the speed-averaged combined pressure-drop share of four valve-related restrictions increasing from 26.12% at full opening to 96.50% at the calibrated small opening. The case-specific benchmark supports pump-speed/spool-opening co-calibration and future matched-boundary comparison with distributed pump-controlled systems.
1. Introduction
Driven by carbon-neutrality targets and the demand for low-noise operation with zero local emissions in municipal maintenance, landscaping, tunneling, and indoor applications, excavator electrification has become an important pathway for reducing local emissions and improving the environmental profile of construction machinery [1]. For high-power-density construction machinery with strongly coupled multi-actuator hydraulics, electrification does more than replace the prime mover; it also reshapes how hydraulic energy is organized and where the efficiency boundary is set [2]. Accordingly, system-level pathways for loss reduction and efficiency improvement—especially energy-regeneration arrangements [3,4] and key component configurations [4,5]—tend to differ from those emphasized in conventional valve-controlled diesel platforms. A key distinction lies in actuation regulation: variable-speed electric drives make pump-speed-based flow control more feasible and allow the pump to serve as a primary control element rather than relying mainly on valve throttling [6]. In contrast, turbocharged diesel engines are constrained by slower transient response during speed changes [7]. In the centralized valve-controlled architecture investigated in this study, actuator motion is still regulated through the main spool opening, while motor-speed control provides an additional degree of freedom for matching flow supply with actuator demand. Against this background, hydraulic pressure losses influence efficiency and operating range [8], and system-level loss accounting identifies their role in hydraulic-system energy dissipation [9]. Such losses also contribute to thermal loading in high-pressure hydraulic systems [10] and affect control characteristics [11]. Therefore, pressure-loss behavior must be characterized in an operationally relevant control space.
In recent years, extensive research on efficient hydraulics for electric construction machinery has addressed system layout and architecture comparisons [8,12], pump-controlled and electro-hydrostatic actuation [6], energy regeneration [4,5], and control robustness and monitoring [13]. System-level comparisons indicate that conventional centralized valve-throttling architectures can exhibit pronounced energy dissipation in representative operating cycles [8], while pump-control studies have reported energy-consumption improvements for electric excavator arms [11]. Electro-hydraulic/mechanical drive-network and electro-hydraulic variable-speed drive-network studies have also shown potential for improving implement efficiency and system-level performance [14,15]. For actuator drive solutions, pump-controlled differential-cylinder drives [6] and engineering-oriented pump-controlled actuation/electro-hydrostatic actuators [8,12] can reduce throttling losses by shifting the primary regulation from valve throttling to pump/motor speed control or actuator-level flow control, and by reducing or, in some configurations, eliminating energy-dissipative directional valves and pressure compensators. These approaches are promising routes to reduce valve throttling losses (i.e., pressure drops across valve orifices) and have demonstrated improved energy efficiency in excavator applications [11]. Meanwhile, studies on potential/hydraulic energy regeneration indicate that properly organizing regeneration and energy storage, such as storage branches and energy management [16,17,18], together with multi-chamber cylinders and secondary control strategies [19], can improve system efficiency while maintaining acceptable operating characteristics [5,20]. In addition, energy-flow-down methodologies provide reusable, boundary-explicit frameworks for loss accounting [9]. Combined with case-level itemized quantification of throttling losses and regeneration- or storage-related energy terms [16,19], these frameworks make comparisons among topologies and circuit concepts more transparent [8,12]. In this context, establishing a boundary-consistent, calibration-oriented benchmark for the conventional centralized architecture is essential before meaningful cross-architecture comparisons can be made.
However, from the perspective of calibration practice and cross-condition comparison, several limitations remain that hinder a unified understanding of loss behavior across operating conditions, circuits, and architectures. First, although prior studies have evaluated efficiency for selected motions or specific operating conditions [21,22], calibration-oriented experimental maps covering the key two-dimensional space of main spool opening and motor speed remain scarce. Recent studies on electric-excavator load-sensing systems and variable-pressure-margin control have demonstrated the importance of coordinating pump speed, pressure margin, and flow demand under different operating conditions [23,24]. Nevertheless, this gap still constrains the use of existing intelligent control and variable-speed pump-control studies for calibration-oriented flow-response optimization in the pump-speed/spool-opening operating space [25]. Second, differences in system definitions, operating boundaries, and comparison procedures across hydraulic architectures may reduce cross-condition comparability. Return-line pressure drops, regeneration branches, and storage-related circuit elements can alter the defined energy-flow and loss-accounting boundaries [16,19], while cross-machine and cross-topology comparisons further require consistent evaluation boundaries and comparable operating conditions [26]. Benchmarking based on key performance indicators and standardized energy-comparison approaches has also been proposed to improve the comparability of mobile-machine energy-efficiency evaluations across different machines and operating conditions [27].
Therefore, a system-level evaluation approach with consistent and boundary-defined metrics is required to support calibration-oriented pressure-loss assessment and future cross-architecture benchmarking.
To address these needs, this paper investigates the centralized valve-controlled hydraulic system in an electric excavator, using boom-cylinder extension as a representative operating condition. Multi-condition experiments were conducted over the joint space of main spool opening × motor speed, and consistent definitions of pressure loss and pressure-loss ratio were established for the investigated operating condition. A time-domain segmentation approach identifies the quasi-steady pressure-evaluation stage (S2), from which a two-dimensional pressure-loss-ratio map is constructed for calibration-oriented use. The experimental results quantify how the pressure-drop distribution between the supply and return paths changes with spool opening and motor speed. The operationally defined banded and convergent features are interpreted using the governing pressure-drop relations, whereas the allocation among individual valve-related restrictions is evaluated separately by simulation. The resulting case-specific benchmark supports pump-speed/spool-opening co-calibration and future matched-boundary hydraulic-system comparison.
The qualitative directions of the observed trends—pressure loss increasing with flow velocity and with reduced valve opening—are consistent with classical hydraulic theory and are not claimed as new. The contribution of this study lies in establishing a calibration-oriented 40-point measured loss map with quantified processing robustness; identifying the measured redistribution of pressure drop between the supply and return paths, using bounded simulation evidence to assess the pressure-drop distribution across four selected valve-related restrictions; and providing a boundary-consistent baseline for pump-speed/spool-opening co-calibration and future architecture comparison. The main contributions of this study are summarized as follows:
- A calibration-oriented pressure-loss-ratio map is established in the two-dimensional operating space of main spool opening and motor speed for boom-cylinder extension in a centralized valve-controlled electric excavator.
- A steady-stage-based and repeated-response-averaged pressure-loss evaluation method is established to reduce sensitivity to individual-response fluctuations and support comparison across operating conditions; its inter-operator processing dependence is quantified over all 40 operating conditions.
- A shift in the measured pressure-drop distribution between the supply and return paths is identified and quantified: using the full 40-point experimental matrix, the arithmetic mean of the ten speed-specific return-to-supply pressure-drop ratios is 0.56–0.60 across the 40–100% openings and 3.41 at the nominal 15% opening. Separately, at two representative simulation points at 1800 rpm, the model-internal pressure-drop decomposition across the four selected valve-related restrictions shows that the B-port groove is dominant at the calibrated 16.3% small-opening input (76.30% of the four-restriction sum), whereas the compensator assembly is dominant at full opening (74.02%).
- A boundary-consistent pressure-loss benchmark is provided for pump-speed/spool-opening co-calibration and for future architecture-level comparison, while the implications for distributed pump-controlled hydraulic systems are discussed within the evidence boundary of the centralized valve-controlled baseline.
2. Experimental Methods and Apparatus
The experimental framework combines a controlled boom-cylinder-extension test, time-domain identification of the quasi-steady evaluation stage, and pressure-based definitions of pressure loss and pressure-loss ratio. The platform and test procedure are described first, followed by the signal segmentation method and the definitions used in the subsequent analysis.
2.1. Experimental Object and Test Procedure
The test platform is a modified SANY SY35E (SANY Group, Changsha, China) small electric excavator with an operating mass of approximately 4.3 t. The hydraulic system adopts a single-pump, centralized valve-controlled architecture, in which a motor-driven axial piston pump supplies hydraulic power to a pressure-compensated multi-way directional valve. Because the hydraulic pump is directly driven by the electric motor, motor speed is used in this study as the control variable corresponding to pump speed. The valve distributes the flow to multiple actuators, including the boom cylinder, arm cylinder, and bucket cylinder. In this study, only the boom-cylinder extension process is investigated.
In this study, boom-cylinder extension was selected as the representative operating condition for three reasons. First, it is a pump-driven positive-load motion with a clear energy-input boundary, because the hydraulic system lifts the working device against gravity. Second, unlike boom lowering, it does not introduce a gravity-driven potential-energy-release or regeneration process, allowing the pressure-loss pathway to be examined directly within the defined circuit boundary. Third, to reduce the influence of transient dynamics, including motor-driven acceleration and end-of-stroke hydraulic constraints, the analysis is limited to the quasi-steady pressure-evaluation stage (S2), during which the pressure signals are quasi-steady in an averaged sense. The selected condition therefore supports a bounded steady-stage analysis and is not intended to represent all excavator actuator motions.
The tests were conducted with no external payload in the bucket. The hydraulic load during boom extension was therefore the gravitational resistance of the excavator working device itself. This unloaded-bucket condition was selected as a controlled and repeatable baseline for comparing the effects of main-spool opening and motor speed under a consistent no-payload boundary.
Figure 1 illustrates the hydraulic system architecture and the locations of the pressure measurement points. The hydraulic pump outlet pressure is defined as the main line pressure, pmain. Two additional pressure sensors are installed at the boom cylinder ports to measure the rodless-chamber pressure and rod-side chamber pressure, denoted as pcap and prod, respectively.
Figure 1.
Schematic of the centralized valve-controlled hydraulic system and pressure measurement locations during boom-cylinder extension. pmain—pump outlet pressure; pcap—rodless-chamber pressure; prod—rod-side chamber pressure.
The pressure signals are converted into voltage signals and acquired through the analog-to-digital conversion channels of the vehicle control unit (VCU). The VCU executes data acquisition and controller area network (CAN) communication tasks at a control cycle frequency of 100 Hz, and the acquired pressure data are transmitted via the CAN bus to the data acquisition system for storage and post-processing. Prior to testing, the sensors and acquisition channels were calibrated to ensure good linearity and measurement consistency. The test machine forms part of a fully instrumented experimental platform.
The instrumented test rig, pressure-tapping locations, and data-acquisition chain are shown in Figure 2.
Figure 2.
Instrumented test rig. (a) The 4.3 t electric excavator; the boom, arm, and bucket are labeled. (b) Pressure tapping points at the pump outlet (pmain) and the rodless (cap-end) chamber of the boom cylinder (pcap). (c) Pressure tapping point at the rod-side chamber of the boom cylinder (prod); the two arm-cylinder and two bucket-cylinder pressure sensors are also labeled but are not used in this analysis. (d) Data-acquisition chain, with the vehicle control unit (VCU) and controller area network (CAN) logger labeled.
In addition to the three boom pressure signals used here (pmain, pcap, and prod), the rig includes two pressure sensors on the arm cylinder and two on the bucket cylinder; these four additional sensors are visible beside prod in Figure 2c. These four additional sensors are shown to document the actual measurement architecture, but their signals are not analyzed in this study. The present work focuses exclusively on boom-cylinder extension; arm and bucket motions, boom lowering, and multi-actuator compound operations are outside the scope of this paper and are addressed as future work in Section 5.2.
The experiments were conducted in a two-dimensional operating space defined by the main spool opening and the motor speed. Four representative spool openings (15%, 40%, 70%, and 100%) were selected to cover small, medium, and large opening conditions. For each opening, the motor speed was varied from 1300 rpm to 2200 rpm using 10 discrete speed levels, resulting in a two-dimensional matrix of four spool openings × 10 motor speeds, i.e., 40 operating points. At each operating point, the spool opening was held constant while the motor speed was regulated to drive the boom cylinder through a complete extension stroke.
During the experiments, pressure data were acquired at a frequency of 100 Hz. To minimize the influence of oil temperature on hydraulic characteristics, the system was preheated before testing, and the oil temperature was maintained within 40 ± 5 °C.
The four spool openings were set by adjusting the operating handle of the excavator, whose angular displacement governs the main spool opening. The handle angle was measured with a protractor of 1° resolution. The maximum handle angle, specified as 22.5° in the manufacturer’s manual and confirmed by measurement, was defined as the nominal 100% opening, whereas the rest position was defined as the nominal 0% opening. The nominal 15%, 40%, and 70% handle-angle-based openings were then obtained proportionally from this range. Because the handle angle corresponding to the small-opening condition is small in absolute terms, the relative uncertainty of the manual angular setting is larger under this condition than under the medium-to-large opening conditions.
For each operating point, defined by a specific combination of motor speed and main spool opening, the boom-cylinder extension process was repeatedly tested until three consecutive pressure responses with consistent stage-wise profiles were obtained. The retained responses were required to show the same start-up, quasi-steady, and deceleration-and-stop pressure-evolution pattern, no abnormal pressure spikes, and comparable pressure levels during the quasi-steady portion. These three consecutive responses were retained for the subsequent steady-stage segmentation and pressure averaging. If the continuity of consistent pressure responses was interrupted, the repeated-test sequence was continued until a new set of three consecutive consistent responses was obtained. Each pressure record covered one complete boom-cylinder-extension response, beginning before motor start and continuing through the end-of-stroke deceleration and stop. Because the total response duration varied with motor speed, the analysis did not use a fixed-length record window; the quasi-steady interval was identified independently for each retained response using the segmentation criteria described in Section 2.2. The main technical parameters of the experimental platform are summarized in Table 1.
Table 1.
Main technical parameters of the experimental platform.
2.2. Time-Domain Segmentation and Steady-Stage Identification
During boom-cylinder extension, the hydraulic pressure signals exhibit distinct stage-wise characteristics in the time domain. With the hydraulic pump driven by the electric motor and the main valve spool opening held constant, a complete boom-cylinder-extension cycle can be divided into three consecutive stages based on the pressure evolution: the start-up acceleration stage (S1), the quasi-steady pressure-evaluation stage (S2), and the deceleration-and-stop stage (S3). A representative pressure–time profile is illustrated in Figure 3.
Figure 3.
Representative measured pressure–time profile during boom-cylinder extension at a motor speed of 1300 rpm and the nominal 100% main-spool opening. S1—start-up acceleration stage; S2—quasi-steady pressure-evaluation stage; S3—end-of-stroke deceleration-and-stop stage.
The start-up acceleration stage (S1) corresponds to the period in which the motor starts and accelerates from zero to the target speed. During this stage, the main line pressure and the cylinder-chamber pressures rise rapidly from zero or from the residual pressure of the previous cycle, and the boom-cylinder piston accelerates from rest. Pressure signals in S1 exhibit pronounced transient fluctuations and do not satisfy steady-state conditions.
The quasi-steady pressure-evaluation stage (S2) corresponds to the period in which the motor operates at the target speed and the measured pressures vary slowly within a limited range. The pressure signals can therefore be treated as quasi-steady for time-averaged pressure evaluation. All pressure-loss and pressure-loss-ratio calculations in this study are based on the time-averaged pressure values extracted from S2.
The deceleration and stop stage (S3) occurs when the boom cylinder approaches the end of its stroke. At this stage, terminal hydraulic and mechanical constraints cause the flow and pressure states to change rapidly, leading to a sharp increase in the main line pressure and the rodless-chamber pressure. Subsequently, the motor is stopped according to the machine control strategy, and the system pressure decays rapidly to a static level. Similar to S1, this stage is dominated by transient effects and is excluded from the S2-based pressure-loss analysis.
Each record captured one complete boom-cylinder-extension response, from before motor start to the end-of-stroke stop; the total record duration therefore varied with motor speed, and only the S2 window was used for the reported averages. For data processing, the fixed quantitative rules described below were manually applied to each pressure–time signal. The rodless-chamber pressure was the primary segmentation signal, with the main line pressure serving as an auxiliary reference.
The S1|S2 boundary was placed at the first local maximum of pcap with a prominence of at least 5 bar following the start-up build-up. The S2|S3 boundary was placed at the first instant at which dpcap/dt exceeded 20 bar/s and remained above this threshold for at least 0.2 s (20 consecutive first-difference intervals). The derivatives dpcap/dt and dpmain/dt used during boundary inspection were calculated by first-order differences between adjacent samples at 100 Hz (Δt = 0.01 s), without smoothing or filtering. The quantitative S2–S3 boundary was determined solely from the dpcap/dt rule; dpmain/dt was inspected only as an auxiliary plausibility check and did not alter the boundary.
These thresholds are case-specific operational settings rather than universal constants. The 5 bar prominence criterion exceeds the conservative 2 bar error bound for the difference between two pressure readings when each channel has a maximum absolute error of 1 bar (Section 2.3), while remaining well below the principal start-up peak prominences of approximately 30.7 and 31.7 bar in the representative 1300 and 1800 rpm full-opening records, respectively. At 100 Hz, requiring dpcap/dt to exceed 20 bar/s for 0.2 s means that 20 consecutive first-difference intervals satisfy the derivative criterion, corresponding to a cumulative pcap rise greater than approximately 4 bar and therefore above the 2 bar endpoint-difference error bound. In a local data-based check using these two representative full-opening records, varying the derivative threshold from 16 to 24 bar/s and the persistence requirement from 0.16 to 0.24 s did not change the identified S2|S3 boundary sample. This check supports the selected settings for the present records but does not constitute statistical optimization or demonstrate universal applicability.
For the representative response in Figure 3, these criteria give an S1|S2 boundary at 1.25 s and an S2|S3 boundary at 4.12 s, corresponding to an S2 window of 2.87 s.
For each of the three retained consecutive pressure responses, S2 was identified independently. Therefore, the number of sampling points within S2 may differ slightly among repeated cycles at the same operating point. Because the pressure signals were sampled at 100 Hz, the segmentation boundaries were assigned to the nearest sampling point, corresponding to a temporal resolution of 0.01 s. Independent S2 identification accommodated cycle-specific variation in stage timing, whereas averaging across the three retained responses reduced cycle-to-cycle fluctuations. The operator dependence of the complete processing procedure was evaluated over all 40 operating conditions using the independent reprocessing protocol described in the following paragraph.
To evaluate inter-operator processing dependence, a second operator independently reprocessed all 40 operating conditions. At each condition, each operator independently selected three consecutive responses satisfying the same acceptance criteria from the pool of repeated measurements; the two selected triplets were not required to be identical. Each operator then independently identified S2 for the selected responses and calculated the repeated-response-averaged pressures and pressure-loss ratio. The comparison therefore quantifies the combined operator dependence of valid-response selection, S2-window identification, and averaging, rather than S2 boundary placement alone. The corresponding inter-operator results are reported after the pressure-loss ratio is defined in Section 2.3.
2.3. Definition of Pressure Loss and Pressure-Loss Ratio
Based on the time-domain segmentation described in Section 2.2, the pressure signals from the three retained consecutive responses were processed by averaging within their respective S2 intervals. For each retained response, the S2-averaged pressure values were first calculated, and the final pressure values of the corresponding operating point were then obtained by averaging the three retained responses. Let N denote the number of retained consecutive pressure responses, where N = 3 in this study. For a retained response r, nr denotes the number of sampling points within S2. The instantaneous pump outlet pressure, rodless-chamber pressure, and rod-side chamber pressure are denoted as pmain,r(k), pcap,r(k), and prod,r(k), respectively.
For retained response r, the S2-averaged pressures are calculated as follows:
where r = 1, 2, …, N indexes the retained consecutive pressure responses, k is the sampling-point index within S2, and nr is the number of sampling points within S2 for retained response r.
The final pressure values at the corresponding operating point are obtained by averaging the S2-averaged pressures of the N retained consecutive responses:
where pmain, pcap, and prod are the repeated-response-averaged pressures of the corresponding operating point.
To maintain consistency with system-level loss-accounting studies, the pressure-loss boundary in this study is defined at the circuit level rather than at the component-only level [9]. This definition allows the inlet-side pressure drop and the return-side pressure drop to be evaluated within the same operating boundary, thereby supporting boundary-consistent comparison of pressure-loss characteristics across different operating conditions and future benchmark studies [27].
For the investigated centralized valve-controlled hydraulic system, the S2-based total pressure loss during boom-cylinder extension consists of two parts: (i) the pressure drop from the pump outlet to the rodless chamber and (ii) the pressure drop from the rod-side chamber to the tank return circuit. During boom-cylinder extension, the rodless chamber acts as the inlet chamber and the rod-side chamber acts as the return-side chamber. Because the measured pressures are gauge pressures and the tank pressure is taken as the reference pressure, the total pressure loss at each operating point is defined as follows:
Based on this physical reference, the pressure-loss ratio is defined as follows:
where λp denotes the pressure-loss ratio. In Equations (1)–(8), all pressure quantities and pressure differences are expressed in bar, while the pressure-loss ratio is reported as a percentage; the sampling-point index, response index, number of samples, and number of retained responses are dimensionless.
Two complementary sources of variation in the resulting pressure-loss ratio were evaluated: inter-operator processing differences and pressure-measurement uncertainty. Across the 40 operating conditions, the mean absolute inter-operator differences were 1.08 bar for pmain, 1.11 bar for pcap, and 0.84 bar for prod. For the pressure-loss ratio, the mean signed difference (operator 2 minus operator 1) was +0.29 percentage points, the mean absolute difference was 0.40 percentage points, the root-mean-square difference was 0.47 percentage points, and the maximum absolute difference was 1.10 percentage points. Thirty-eight of the 40 conditions differed by no more than 1 percentage point, and all differed by less than 2 percentage points. The opening-specific mean absolute differences were 0.30, 0.56, 0.40, and 0.34 percentage points at the nominal 100%, 70%, 40%, and 15% openings, respectively. These results indicate limited inter-operator dependence of the final pressure-loss-ratio map under the specified response-selection, S2-identification, and averaging procedure, while the constituent pressures show small operator-dependent differences.
Separately, the specified sensor accuracy is 0.25% FS (full scale) over the 0–400 bar range, corresponding to a maximum absolute error of 1.0 bar for each pressure channel. From Equation (8), a first-order conservative estimate of the pressure-measurement contribution to the error in λp is obtained by linearly summing the absolute sensitivity contributions:
Here, pmain, pcap, and prod are the S2-averaged pressures used in Equation (8), expressed in bar; δpmain, δpcap, and δprod are their maximum absolute channel errors, each set to 1.0 bar; and δλp is the resulting first-order conservative error estimate, expressed in percentage points. The numerical factor 100 converts the dimensionless ratio to its percentage value. Applying Equation (9) to the 40 operating conditions gives an estimated pressure-loss-ratio error-bound range of 1.44–2.06 percentage points.
This estimate characterizes only the pressure-measurement contribution to the reported S2-averaged ratio. The combined operator dependence of response selection, S2 identification, and averaging is characterized separately by the full-matrix inter-operator comparison above. Because S1 and S3 are excluded from the reported evaluation, no claim is made regarding full-transient dynamic measurement accuracy.
The pressure-loss ratio was selected because it can be formed directly from the three measured pressures on the production machine. In contrast, hydraulic efficiency, total hydraulic power loss, and energy efficiency require synchronized flow measurement and, depending on the boundary, actuator-motion, load-force, or electrical-power measurements that were not available on the test machine.
The proposed ratio is therefore a pressure-based indicator within the defined hydraulic circuit boundary, not a substitute for a full power- or energy-efficiency index. It does not apply flow weighting and ranks the pressure-drop distribution within that boundary rather than quantifying energy-conversion efficiency.
Comparisons are meaningful only under explicitly defined and matched pressure boundaries. Application to another hydraulic architecture requires system-specific selection of the measurement points and definition of the calculation boundary. The reported indicator applies to the single-actuator boom-extension tests over the spool-opening–motor-speed matrix defined in Section 2.1; the arm and bucket branches remained inactive. Under compound operation, shared-pump and valve-section interactions would require the indicator to be recalculated.
3. Experimental Results and Mechanism Analysis
The experimental results are first reported as a pressure-loss-ratio map over the tested range of main spool openings and motor speeds. The subsequent analysis examines how the measured pressure drop is redistributed between the supply and return paths, interprets the associated mechanisms, and consolidates the principal experimental findings.
3.1. Pressure-Loss-Ratio Map During Boom-Cylinder Extension
At each operating point, the pressure-loss ratio was calculated from the repeated-response-averaged pressures obtained over S2 for three consecutive responses with consistent stage-wise profiles. The resulting map spans the operating space defined by main spool opening and motor speed. The corresponding numerical values are summarized in Table 2.
Table 2.
Measured pressure-loss ratio during boom-cylinder extension (values in %).
The resulting pressure-loss-ratio map is visualized in Figure 4. For clarity, the 100% and 70% cases are referred to as large openings, the 40% case as a medium opening, the combined 40–100% range as the medium-to-large opening range, and the nominal 15% case as the small-opening condition.
Figure 4.
Pressure-loss ratio during boom-cylinder extension under different main spool openings and motor speeds.
For this 40-point map, the descriptors are operational rather than universal classifications. An opening group is termed speed-sensitive when its pressure-loss-ratio span across 1300–2200 rpm exceeds 5 percentage points; the measured spans are 5.30, 7.47, and 7.30 percentage points at the 100%, 70%, and 40% openings, respectively. The medium-to-large-opening curves are described as banded when they remain mutually separated; at a given motor speed, the cross-opening vertical spread, calculated as the maximum minus the minimum pressure-loss ratio among the 100%, 70%, and 40% curves, ranges from 2.07 to 4.26 percentage points. An opening group is termed convergent when its span is below 1 percentage point. At the nominal 15% opening, the measured span is 0.99 percentage points; the corresponding spans at the 40%, 70%, and 100% openings are 5.4–7.5 times larger. At 1800 rpm, the 15% curve lies 25.01 percentage points above the medium-to-large-opening band.
Using these definitions, the pressure-loss-ratio map reveals five main observations.
- At a given main spool opening, the pressure-loss ratio shows a speed-dependent increasing trend.
Viewed along the motor-speed direction at a fixed main spool opening, the pressure-loss ratio shows an overall upward tendency as motor speed increases. At the 100% opening, the pressure-loss ratio increases from 35.57% at 1300 rpm to 40.87% at 2200 rpm. At the 70% opening, it increases from 36.45% to 43.92% over the same speed range, while at the 40% opening, it increases from 37.64% to 44.94%. Under the severely restricted 15% opening, the pressure-loss ratio shows minor local fluctuations, but still exhibits a slight overall increase from 67.24% at 1300 rpm to 68.20% at 2200 rpm. Therefore, the speed-direction trend is generally upward across the tested openings, although the magnitude of this increase is much weaker under the small-opening condition.
- 2.
- In the medium-to-large opening range (40–100%), the pressure-loss ratio is more sensitive to motor speed than under the small-opening condition (15%).
Taking the 70% opening as an example, the pressure-loss ratio increases from 36.45% at 1300 rpm to 43.92% at 2200 rpm, showing a more pronounced speed-dependent increase than that observed under the small-opening condition. Similar speed-sensitive trends are observed at the 100% and 40% openings. This comparison indicates that motor-speed variation has a stronger influence on the pressure-loss ratio within the tested medium-to-large opening range.
- 3.
- Under the small-opening condition (15%), the pressure-loss ratio converges to a high and narrow range across different motor speeds.
Under this condition, the pressure-loss ratio remains within 67.21–68.20% over the tested motor-speed range, with the minimum of 67.21% occurring at 1400 rpm. This indicates that, under the small-opening condition, the pressure-loss ratios at different motor speeds no longer separate noticeably but instead cluster at a similar high level.
- 4.
- The pressure-loss-ratio curves show an overall opening-dependent banded distribution over the tested motor-speed range.
The pressure-loss-ratio curves corresponding to different main spool openings occupy different pressure-loss-ratio bands. The 100%, 70%, and 40% openings form lower and upward-trending bands, whereas the 15% small-opening condition forms a clearly separated high-loss band. This map-level feature indicates that the main spool opening determines the baseline level of the pressure-loss ratio, while motor speed affects the pressure-loss ratio within each opening-dependent band.
- 5.
- At a given motor speed, the pressure-loss ratio generally increases as the main spool opening decreases.
Taking 1800 rpm as an example, the pressure-loss ratio is 39.10% at the 100% opening, 41.69% at the 70% opening, 42.97% at the 40% opening, and 67.98% under the 15% small-opening condition. Similar opening-dependent trends are observed at other motor speeds, indicating that a reduction in main spool opening elevates the overall pressure-loss-ratio level.
Overall, these five observations define the main experimental features of the pressure-loss-ratio map and provide the basis for the mechanism analysis in the following section.
3.2. Measured Redistribution of Pressure Drop Between the Supply and Return Paths and Mechanism Interpretation
During boom-cylinder extension, the system operates in a motor-driven mode, and the pressure losses evaluated over S2 include friction-related losses along the flow path and local losses across valve restrictions. Similar system-level pressure losses and valve-induced energy dissipation have been reported in load-sensing and valve-controlled hydraulic systems, where system-inherent pressure losses, compensator throttling, and auxiliary-valve settings can affect the overall energy behavior [28,29]. The experimental measurements separate pressure-drop contributions by flow path; attribution to individual physical mechanisms is an interpretation supported by the governing relations and the simulation-based component decomposition in Section 4.3, not a direct experimental isolation of friction and each valve restriction.
The three measured pressures define a supply-side pressure drop, pmain − pcap, and a rod-side return back-pressure, prod. These two pressure-domain quantities are obtained directly at the measurement-point level and do not depend on the simulation model. However, each quantity aggregates pipeline friction, valve-port losses, and other local losses within its respective path; the experiment therefore does not isolate friction from individual restriction losses. The arithmetic mean of the ten speed-specific ratios of return-side back-pressure to supply-side pressure drop is 0.56, 0.60, and 0.59 at the nominal 100%, 70%, and 40% openings, respectively. At the nominal 15% opening, the corresponding mean ratio rises to 3.41; over the same ten motor speeds, the mean supply-side pressure drop is 24.29 bar and the mean return-side back-pressure is 82.77 bar. Thus, the dominant measured pressure-drop contribution shifts from the supply path to the return path as the opening decreases. The completely processed 40-point matrix and derived terms are provided in Appendix A, Table A1.
From an energy perspective, friction losses along the flow path and throttling losses across valve restrictions are irreversible processes in which hydraulic energy is dissipated primarily as heat rather than converted into useful actuator work. Pressure and flow variations can therefore support interpretation of energy conversion and dissipation in hydraulic-cylinder systems [30]. Within the present measurement boundary, the observed pressure-loss characteristics provide pressure-domain evidence for the following mechanism interpretations; the individual valve-related pressure-drop shares are evaluated separately by simulation in Section 4.3. Across a dissipative element or a defined loss path under the present pressure-domain boundary, the pressure drop can be interpreted as dissipated hydraulic energy per unit fluid volume, whereas loss power additionally requires the volumetric flow rate through that same boundary. Because synchronized branch-flow measurements were not available, the present analysis is intentionally limited to pressure-domain evidence and does not claim a complete power or energy balance.
- At a given main spool opening, the pressure-loss ratio shows a speed-dependent increasing trend.
When the valve spool opening is fixed and motor speed increases, the measured pressure-loss ratio generally rises. For trend interpretation, an increase in pump flow and average velocity with motor speed under the tested control condition would increase flow-path pressure losses. The Darcy–Weisbach relation is as follows:
where f is the friction factor, L is the pipe length, D is the inner diameter of the pipe, ρ is the hydraulic oil density, and v is the average flow velocity across the flow cross-section. In Equation (10), Δpf is expressed in Pa; L and D in m; ρ in kg·m−3; v in m·s−1; and f is dimensionless. Equation (10) is used only to interpret the flow-velocity dependence of frictional pressure loss. For a fixed passage, the Darcy friction factor is governed by the Reynolds number and relative roughness; the Reynolds number, in turn, depends on fluid density, viscosity, flow velocity, and hydraulic diameter. Because flow rate was not measured experimentally, the equation is not used to calculate an absolute pipeline-friction loss or to separate friction from individual valve-restriction losses. In the simulation model, frictional pressure losses are evaluated using the local Reynolds number and are included in the model-internal pressure-drop balance discussed in Section 4.3.
- 2.
- In the medium-to-large opening range (40–100%), the pressure-loss ratio is more sensitive to motor speed than under the small-opening condition (15%).
Within the medium-to-large opening range (40–100%), the effective valve-orifice area is larger than under the small-opening condition, and the measured pressure-loss-ratio curves show stronger speed dependence. This behavior is consistent with a greater influence of flow-velocity-dependent pressure drops when the metering restriction is less severe. However, no flow rate was measured, and the experiment does not determine the quantitative contributions of friction and individual throttling elements. The simulation-derived component shares are assessed separately in Section 4.3.
- 3.
- Under the small-opening condition (15%), the pressure-loss ratio converges to a high and narrow range across different motor speeds.
When the nominal experimental opening is reduced to 15%, the effective valve-orifice area is expected to decrease significantly, leading to a rapid increase in the local throttling pressure drop. This behavior is consistent with the nonlinear flow characteristics of pressure-compensated valve orifices, in which the effective flow area and compensator dynamics can strongly influence the pressure drop across the valve [31]. The local throttling pressure drop can be expressed as follows:
where Q is the flow rate through the valve orifice, Cd is the discharge coefficient, and A is the effective orifice area. In Equation (11), Δpt is expressed in Pa; ρ in kg·m−3; Q in m3·s−1; A in m2; and Cd is dimensionless.
Equation (11) indicates that a smaller effective orifice area A requires a larger pressure drop for a given flow rate Q. The high and narrow pressure-loss-ratio range at the nominal 15% opening is therefore consistent with a strong small-opening metering restriction. Because branch flow was not measured, the experiment alone does not establish how Q changed or prove component dominance; component-level dominance is reported only for the calibrated 16.3% simulation case.
- 4.
- The pressure-loss-ratio curves show an overall opening-dependent banded distribution over the tested motor-speed range.
Experimentally, the banded distribution shows that opening changes the baseline pressure-loss-ratio level, while the speed dependence within each opening group differs. The experiment does not identify the individual loss components responsible for this distribution. Section 4 separately assesses the simulation-derived pressure-drop shares of the four valve-related restrictions.
- 5.
- At a given motor speed, the pressure-loss ratio generally increases as the main spool opening decreases.
At small valve spool openings, the reduced effective metering area increases the pressure drop required for a given through-flow. The observed high pressure-loss ratio is consistent with this mechanism, but it cannot be converted into a component share or a complete energy-loss fraction without synchronized flow information and the separate simulation analysis.
3.3. Summary of the Experimental Findings
In summary, the 40-point experiment shows clear opening- and speed-dependent pressure-loss-ratio patterns. The medium-to-large openings are operationally banded and speed-sensitive, whereas the nominal 15% opening is convergent and weakly speed-sensitive. The measured pressure-drop distribution also shifts from a supply-side-dominated path at 40–100% openings to a return-side-dominated path at the nominal 15% opening. The governing pressure-drop relations provide a mechanism-consistent interpretation of these observations, while the individual valve-related pressure-drop shares are evaluated separately by simulation in Section 4.
4. Simulation Model Assessment and Pressure-Drop Decomposition
The coupled electromechanical–hydraulic model provides a complementary basis for assessing the measured pressure responses and examining model-internal pressure-drop components under the tested conditions. Model development and experiment–simulation comparison are presented first, followed by the decomposition across four selected valve-related restrictions and a summary of the simulation findings.
4.1. Model Development
Coupled electromechanical–hydraulic models have been used to represent construction-machinery hydraulic behavior, actuator dynamics, and pressure responses under controlled conditions [18,32,33]. In this study, a coupled electromechanical–hydraulic model of the excavator boom system was established using the geometry of the test machine and available machine- and component-level technical documents. The model contains mechanical and hydraulic subsystems and is used to assess S2-based pressures, pressure-loss ratios, and major model-internal pressure-drop components under the tested conditions.
The working-device geometry was established from on-machine measurements and available dimensional references, and a three-dimensional CAD model was then constructed from these inputs. Component geometry, center-of-mass locations, and rotational inertias were retained from the model developed in Creo Parametric 9.0.12.0 (PTC Inc., Boston, MA, USA) and assigned to the corresponding rigid bodies. The mechanical subsystem was represented as a planar boom–arm–bucket linkage; the boom-cylinder submodel simulated a 283 mm extension within its 500 mm maximum physical stroke, with an initial dead volume of 20 cm3 in each chamber.
As the working device moved during boom-cylinder extension, the multibody solver updated the position and orientation of each body; the corresponding global center-of-mass locations and inertia-tensor orientations therefore changed, while the local rigid-body mass properties remained fixed. Because the reported comparison uses S2-averaged pressures, the start-up and stopping transients, where inertial effects are strongest, remain outside the evaluation window.
The hydraulic subsystem was parameterized using the measured valve-spool groove geometry, measured major pipeline lengths, available pressure-setting information, manufacturer pump pressure–flow–torque (PQT) data, and standard hydraulic material properties from hydraulic engineering references or simulation-library component definitions.
As shown in Figure 5, the hydraulic system simulation model represents the single-pump, load-sensing, centralized valve-controlled architecture of the experimental excavator. Similar modeling strategies for load-sensitive hydraulic excavators have been used to capture system dynamics and support experiment-based verification of control and trajectory behavior [34].
Figure 5.
Hydraulic system simulation model: 1—motor–pump supercomponent; 2—multi-way directional valve; 3—boom hydraulic cylinder; 4—pressure-compensator/load-check-valve assembly; 5—flow-control valve in the inlet section of the multi-way valve; 6—pressure-limiting valve in the boom section of the multi-way valve.
The numbered modules identify the motor–pump supercomponent, the multi-way directional valve, the boom cylinder, the pressure-compensator/load-check-valve assembly, the flow-control valve in the inlet section, and the pressure-limiting valve in the boom section. In the simulations, the boom directional-valve spool opening was commanded and motor speed was varied from 1300 to 2200 rpm as the second model input to reproduce the experimental matrix; the arm and bucket branches remained inactive. The model nevertheless retains the shared pump and load-sensing network, multi-way valve, boom cylinder, compensator/load-check assembly, inlet-section flow-control valve, and boom-section pressure-limiting branch; it is therefore a bounded representation of the actual centralized architecture rather than an isolated ideal directional valve.
The throttling characteristics of the boom directional control valve and the flow-regulation behavior of the variable pump are directly relevant to the pressure-loss calculation. The boom directional valve was therefore represented using an equivalent model based on the measured spool geometry rather than an idealized valve, so the individual metering-notch areas vary with the common spool-displacement input.
For the variable pump, a customized motor–pump coupled model was employed. Pump volumetric efficiency was parameterized using manufacturer pressure–flow–torque (PQT) data as a function of pump pressure difference and rotational speed. Pump flow was calculated from volumetric efficiency, rotational speed, and displacement. The nominal pump load-sensing (LS) pressure-margin setting in the simulation model was 18 bar.
Table 3 consolidates the numerical settings and modeling assumptions, including the simulation environment, adaptive-step error-control settings, fluid properties, spool settings, pump parameterization basis, boom-cylinder movement, compensator parameters, and multibody assumptions. The hydraulic fluid is modeled as compressible at a constant 40 °C and spool-land leakage is included. After each complete simulation run, S2 was identified using the same rule as in the experiment, and the reported pressure quantities were averaged over that interval.
Table 3.
Numerical settings and modeling parameters of the simulation model.
The component-level metering-notch configuration and edge geometry used in the simulation model are summarized in Table 4.
Table 4.
Component-level valve-spool metering-notch configuration and edge geometry used in the simulation model.
The corresponding region-by-region notch geometry is reported in Table 5.
Table 5.
Measured region-by-region metering-notch geometry implemented in the simulation model.
Because clearance leakage is represented in the valve model, the effective port areas remain non-zero at zero spool opening: 0.716 mm2 at the P port, 0.135 mm2 at the A port, and 0.506 mm2 at the B port. The resulting effective flow-area characteristics over the spool-opening range are shown in Figure 6.
Figure 6.
Modeled effective flow-area characteristics of the P-, A-, and B-port metering grooves as functions of spool opening: (a) full opening range; (b) enlarged small-opening region.
Together, Table 1, Table 3, Table 4 and Table 5 document the key physical, numerical, and subsystem inputs used in the present calculations.
Among the variables available from the model, only the pump-outlet pressure, cylinder-chamber pressures, simulated pressure-loss ratio, major pressure-drop components, and combined pressure-drop share of the four selected valve-related restrictions were used in the analyses reported here. Correspondence in system configuration and model inputs does not by itself establish agreement with measured behavior; that agreement is assessed in Section 4.2. The model is therefore used for bounded S2-based trend assessment and model-internal pressure-drop decomposition rather than full-transient hydraulic validation.
4.2. Comparison Between Simulation and Experimental Results
For each map position, one deterministic simulation run was conducted at the corresponding experimental motor speed. The experimental map values were obtained by repeated-response averaging, whereas each simulated value came from a single run. The 40%, 70%, and 100% groups used their nominal opening inputs without adjustment; the nominal 15% experiment was paired with the calibrated 16.3% simulation input described below. The assessment focuses on S2-averaged pressures and pressure-loss-ratio trends. The medium-to-large-opening groups therefore provide model-assessment evidence without opening adjustment, while the small-opening pair is a calibrated correspondence rather than an independent validation pair.
The experimental and simulated openings were defined differently. In the experiment, 15% denotes a nominal operating-handle angle; spool displacement was not measured directly. In the model, K is the scalar command used to impose the spool-position input. After accounting for the 1 mm initial overlap adopted in the opening definition, x = (K − 1) mm denotes the effective displacement used for opening normalization rather than the raw model-input displacement. Using the 7.0 mm spool-displacement normalization span adopted from the nominal boom-control valve spool travel specified in Table 1, the normalized simulated opening is αsim = [x/(7.0 mm)] × 100% = [(K − 1)/7] × 100%. Thus K = 2.05 corresponds to x = 1.05 mm and 15.0%, whereas K = 8 corresponds to x = 7.0 mm and 100%. This normalization describes the common mechanically linked effective opening displacement; each P-, A-, and B-port metering component retains its own underlap and notch geometry, as listed in Table 4 and Table 5.
Near the nominal 15% condition, the B-port effective area remains close to its clearance-leakage floor and is sensitive to small changes in the model spool-displacement command. This motivated a quantitative search for an equivalent model input. The experiment defined opening by nominal handle angle, whereas the model input was normalized spool displacement; actual spool displacement on the machine was not measured. The nominal 15% handle setting was therefore not assumed to be identical to a 15% model input.
The equivalent model input was selected from the evaluated discrete candidates using the measured pressures rather than from the geometric threshold alone. For each candidate K, an objective J(K) was calculated as the mean of 30 absolute relative pressure errors: three pressures (pump outlet, rodless chamber, and rod-side chamber) at each of the 10 motor speeds from 1300 to 2200 rpm:
where psim,q,j(K) and pmea,q,j are the simulated and measured S2-averaged pressures for channel q ∈ {main, cap, rod} at the j-th motor speed (j = 1, …, 10), and J(K) is their mean absolute relative error over the 30 comparisons.
In Equation (12), the simulated and measured S2-averaged pressure quantities are expressed in bar; their ratio, the model command K, and the motor-speed index j are dimensionless; the pressure-channel label q is categorical; and the objective function J(K) is reported as a percentage.
The initial screening used K = 2.05, 2.12, and 2.40 (15%, 16%, and 20%, respectively) to locate a low-objective region near 16%. A local search then covered K = 2.12–2.16 at 0.01 increments, corresponding to a 0.01 mm spool-displacement step. The seven candidate-objective pairs were K = 2.05, J = 116.09%; K = 2.12, J = 21.16%; K = 2.13, J = 6.89%; K = 2.14, J = 3.75%; K = 2.15, J = 11.92%; K = 2.16, J = 18.35%; and K = 2.40, J = 36.78%. Among the seven evaluated candidates, K = 2.14 gave the lowest objective value, corresponding to x = 1.14 mm and αsim = 16.29%, reported as 16.3%.
The selected input K = 2.14 was therefore used for the calibrated small-opening simulation group, whereas the 40%, 70%, and 100% groups retained their nominal opening inputs.
Table 6 lists the simulated pressure-loss-ratio values over the 40-point matrix based on the comparison design and opening mapping described above. The model captures the opening-dependent ordering and the general increase with motor speed. However, the distribution of speed dependence is not fully consistent with the measurements, particularly at the 40% and 70% openings.
Table 6.
Simulated pressure-loss ratio during boom-cylinder extension (values in %).
The corresponding measured and simulated pressure-loss-ratio curves are compared in Figure 7.
Figure 7.
Comparison of the measured and simulated pressure-loss ratio during boom-cylinder extension over the 40-point map (four opening groups × ten motor speeds): (a) all four opening groups; (b) enlarged view of the medium-to-large openings (40%, 70%, 100%). Line styles and opening groups follow the legend. The “15% exp./16.3% sim.” label denotes the calibrated small-opening correspondence.
To quantify map-level agreement between the simulation and experiment, the mean absolute relative error (MARE) and root mean square error (RMSE) were calculated over the four opening groups and ten motor speeds. These metrics include the calibrated small-opening correspondence and are defined as follows:
where λmea(i,j) denotes the measured pressure-loss ratio at the i-th experimental opening group and the j-th motor speed, and λsim(i,j) denotes the paired simulation value. For the small-opening group, the nominal 15% experimental handle setting is paired with the calibrated 16.3% simulated spool input; the other three groups use identical nominal percentages. In Equations (13) and (14), λmea(i,j) and λsim(i,j) are expressed numerically on a 0–100 percentage scale. The dimensionless MARE is multiplied by 100 and reported as a percentage. RMSE is the square root of the mean squared differences between values on this scale and is therefore reported in percentage points.
The overall MARE is 4.83% and the RMSE is 2.54 percentage points. Because these map-level metrics include the calibrated small-opening correspondence, they describe aggregate agreement rather than an independent 40-point validation statistic. The 40–100% groups were evaluated without opening adjustment and have MAREs of 5.7–6.7%, providing additional model-assessment evidence. The larger local deviations occur mainly in the 40–70% range, especially at low motor speeds. The results are therefore interpreted as a bounded S2-based trend assessment rather than point-by-point predictive accuracy or validation of full-transient hydraulic behavior.
A further difference concerns speed dependence within the medium-to-large opening range. Experimentally, the pressure-loss ratio at the 40%, 70%, and 100% openings increases by 7.30, 7.47, and 5.30 percentage points from 1300 to 2200 rpm, respectively. In the simulation, the corresponding spans are 1.10, 1.91, and 6.79 percentage points. The model therefore captures the opening-dependent ordering but underestimates the measured speed dependence at the 40% and 70% openings. The model is used for bounded trend assessment and pressure-drop decomposition; this local shortfall in representing speed dependence is acknowledged as a limitation.
Because pressure-loss-ratio agreement could in principle arise from offsetting errors in its constituent pressures, the three measured pressures were also compared for two representative 1800 rpm cases. At the 100% opening evaluated without adjustment, the simulated pump outlet, rodless-chamber, and rod-side chamber pressures differ from the measured values by +6.41%, +2.28%, and +8.02%, respectively. For the calibrated small-opening correspondence, the differences are −3.14%, −4.43%, and −5.50%; the mean absolute relative difference over the six quantities is 4.96%, calculated from unrounded source values. For these two representative cases, the comparison does not indicate that ratio agreement results solely from error cancelation. The small-opening three-pressure comparison remains a calibration check, while the 100% comparison was evaluated without opening adjustment. Cylinder velocity, displacement, flow rate, and full-transient waveforms were not compared because the required measurements were unavailable.
4.3. Pressure-Drop Decomposition Across Four Selected Valve-Related Restrictions
To further analyze the modeled pressure-drop distribution, the pressure drops across four selected valve-related restrictions during boom-cylinder extension were quantified using the pipeline layout and restriction configuration represented in the simulation model. Previous excavator energy-flow studies have treated main control valve losses as a key component of hydraulic-system energy dissipation [9]. In load-sensing and valve-controlled systems, pressure-compensator throttling and valve-induced energy consumption have also been identified as important sources of system-level losses [28,29].
As illustrated in Figure 8, four selected valve-related restrictions are quantified in the centralized multi-way-valve circuit. Three are the P-, A-, and B-port metering grooves, and the fourth is the pressure-compensator/load-check-valve assembly. The flow-control valve and pressure-limiting valve are shown to explain the intermediate flow split, but their branch losses are not included as additional terms in Equation (15). The four quantified restrictions are:
- The throttling pressure drop across the P-port metering groove, from the groove inlet to the internal supply passage, is denoted as Δpth,1.
- The throttling pressure drop across the A-port metering groove, from the internal supply passage to the boom-cylinder cap-end line, is denoted as Δpth,2.
- The throttling pressure drop across the B-port metering groove, from the boom-cylinder rod-side return line to the internal tank-return gallery, is denoted as Δpth,3.
- The combined throttling pressure drop along the A-port supply path from p1 at the pressure-compensator inlet to p2 at the load-check-valve outlet, encompassing the pressure compensator and the load check valve, is denoted as Δpth,4.
Figure 8.
Four valve-related restrictions and pressure boundaries used in the boom-extension decomposition. 1—P-port metering groove; 2—A-port metering groove; 3—B-port metering groove; 4—pressure-compensator/load-check-valve assembly. pmain, pcap, and prod are the pump-outlet, cap-end, and rod-side pressure points, respectively. p1 is located at the compensator inlet and p2 at the load-check-valve outlet, so p1 − p2 is the combined pressure drop across the assembly. LS denotes load-sensing.
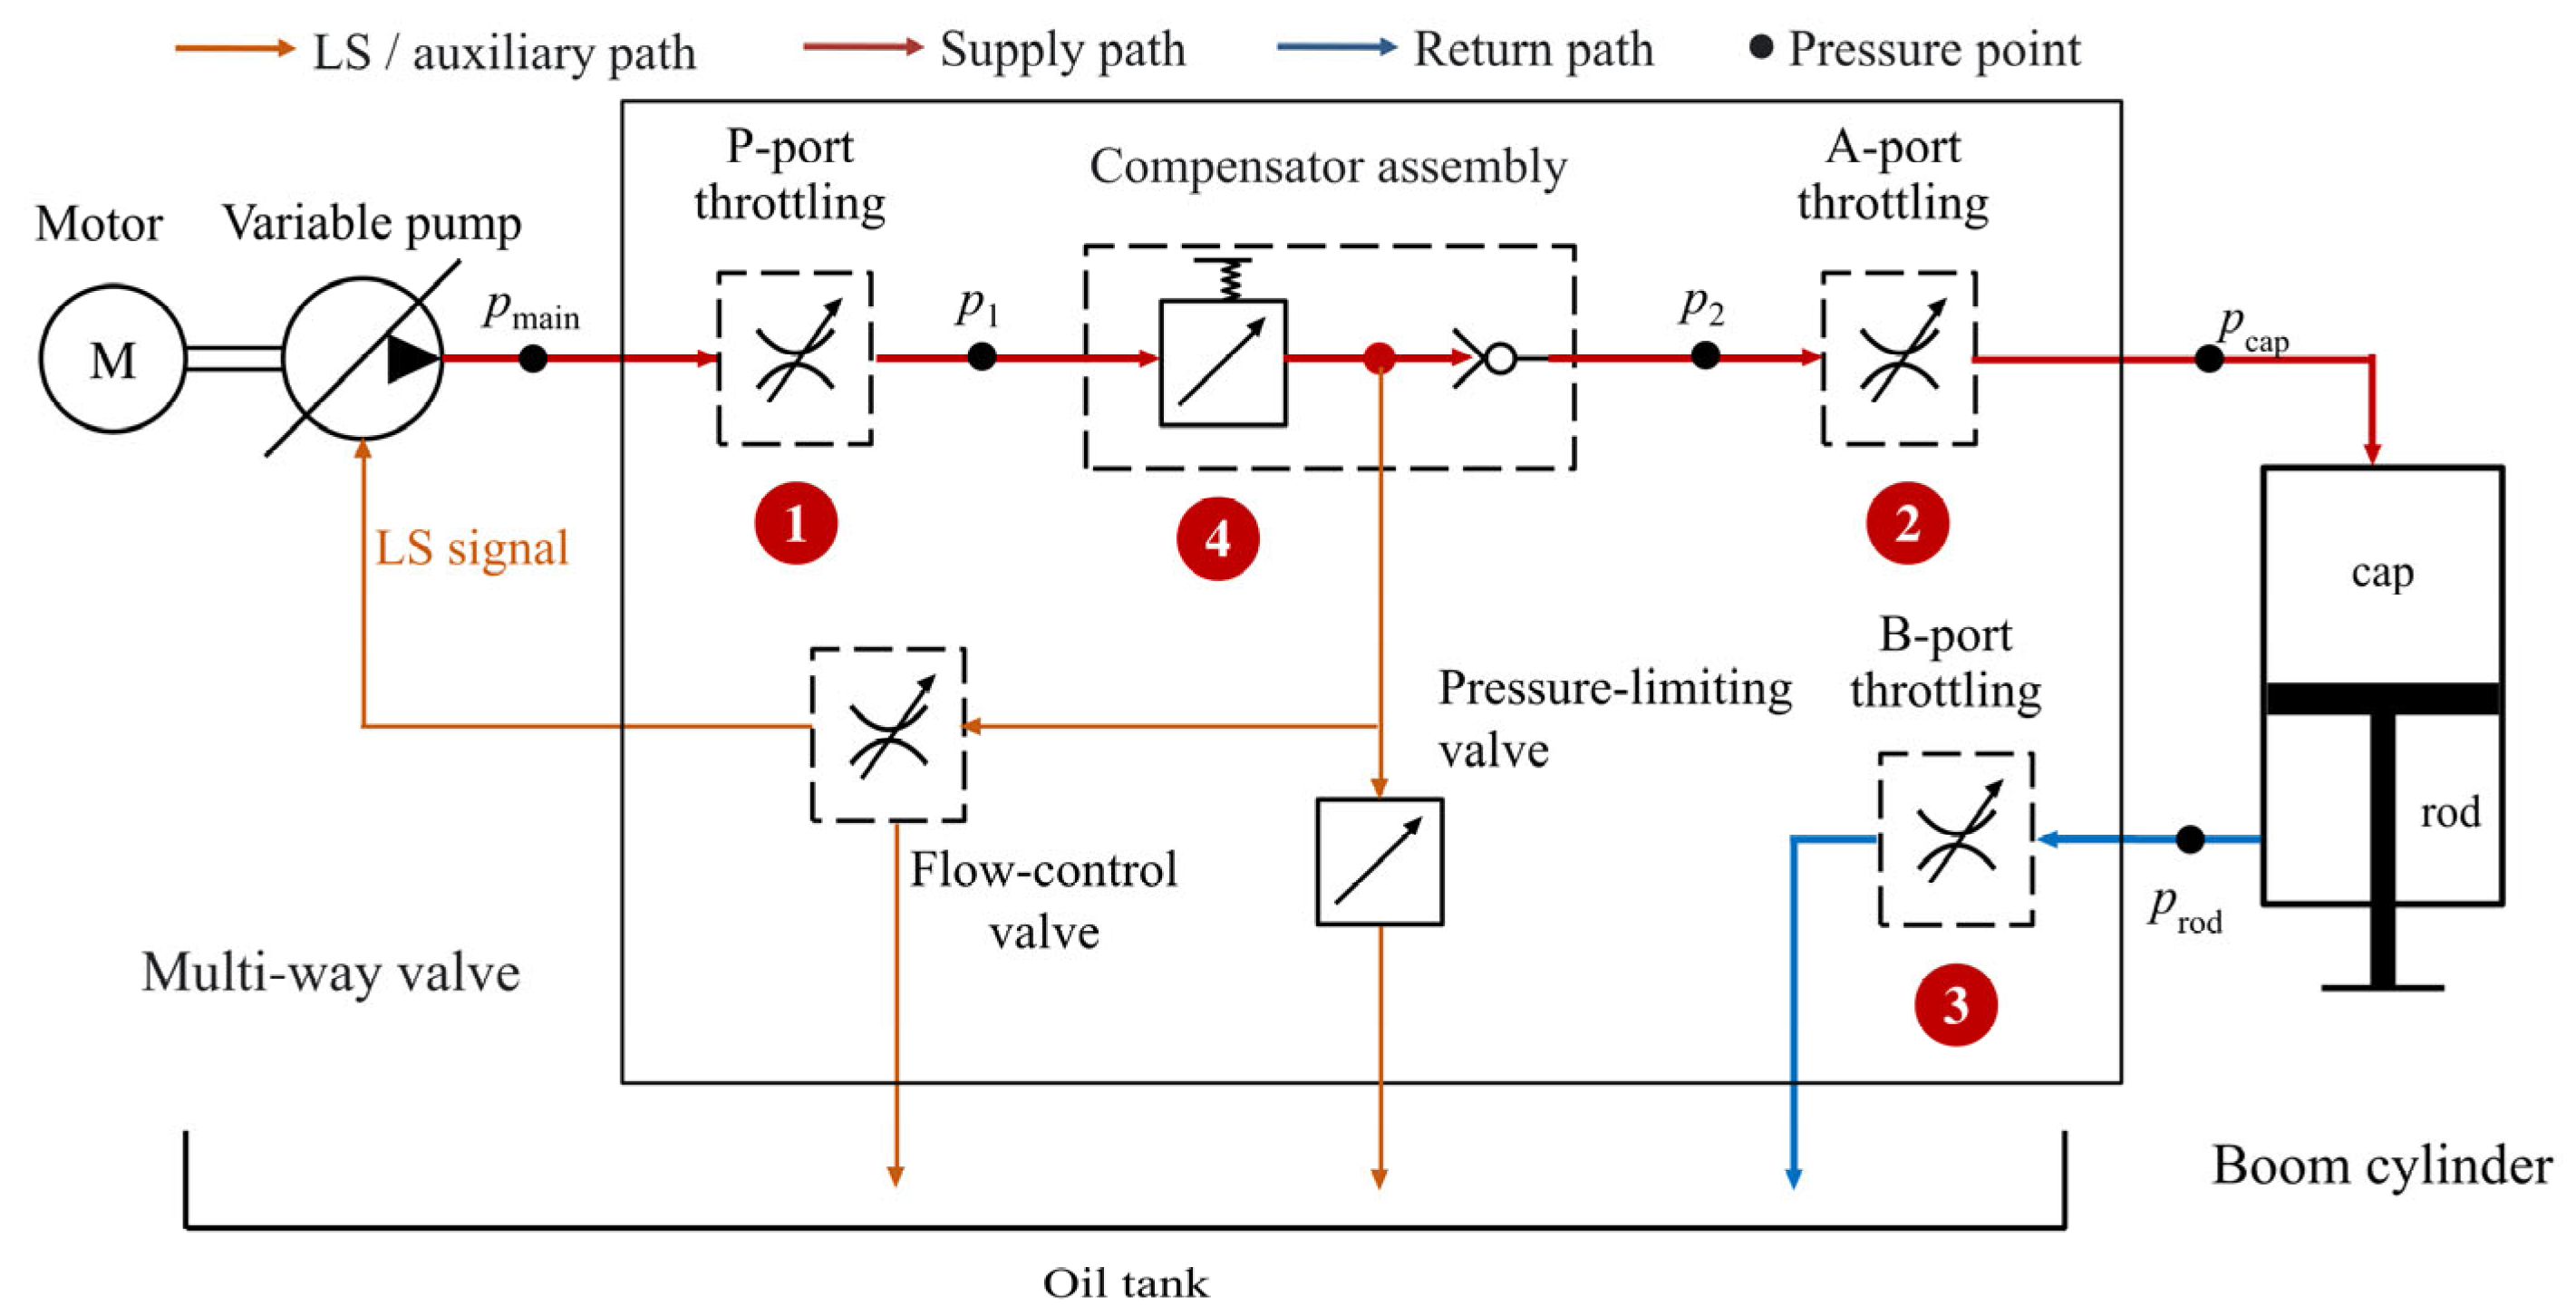
Downstream of the compensator, the internal flow divides among the load-check/A-port branch, the flow-control-valve branch, and the pressure-limiting-valve branch. Consequently, the flow through the compensator need not equal the A-port flow, while the pressure-drop boundary between p1 and p2 remains well-defined.
For the decomposition, the pressure signals across the four selected restrictions were extracted from the simulation model over S2. The S2-averaged pressure drop at each location was calculated first, and the four-restriction pressure-drop sum was then obtained by adding the four averaged pressure drops. The resulting share is therefore a simulation-based quantity derived from internal model variables, rather than a directly measured experimental quantity.
Accordingly, the four-restriction pressure-drop sum is defined as the sum of the pressure drops across the P-port groove, compensator assembly, A-port groove, and B-port groove.
On this basis, the combined pressure-drop share of the four selected restrictions is defined as the ratio of this summed pressure drop to the S2-based total pressure loss under the same boundary:
In Equations (15) and (16), all pressure-drop terms are expressed in bar and the four-restriction ratio is reported as a percentage. Here, loss denotes the modeled pressure drop across the specified restrictions; it is not a power- or energy-loss fraction.
The simulation-derived four-restriction pressure-drop shares are summarized in Table 7. Their speed dependence is opening-specific: the spans across 1300–2200 rpm are 4.45, 1.12, 0.96, and 0.01 percentage points at the 100%, 70%, 40%, and 16.3% openings, respectively. The change is negligible in the calibrated small-opening case but remains non-negligible numerically at full opening; the four curves are therefore not treated as parallel or uniformly insensitive to motor speed.
Table 7.
Simulated combined pressure-drop share of the four selected valve-related restrictions (values in %).
As the opening increases, the speed-averaged simulation-derived four-restriction pressure-drop share decreases monotonically from 96.50% in the calibrated small-opening case to 58.82%, 51.10%, and 26.12% at the 40%, 70%, and 100% openings, respectively. The four listed restrictions therefore account for most of the modeled total pressure drop at the small opening and for more than half at the 40% and 70% openings. The residual under this four-restriction pressure-drop accounting includes unenumerated pipeline and other circuit pressure drops but was not further decomposed. The corresponding opening- and speed-dependent trends are visualized in Figure 9.
Figure 9.
Simulated combined pressure-drop share of the four selected valve-related restrictions during boom-cylinder extension under different main spool openings and motor speeds. The 16.3% curve represents the calibrated simulated small-opening case corresponding to the nominal 15% experimental condition.
The two representative 1800 rpm component decompositions are reported in Table 8.
Table 8.
Four-restriction pressure-drop decomposition at 1800 rpm for two representative simulation cases.
Table 8 shows that the dominant restriction changes between the two representative cases. At the calibrated 16.3% small-opening simulation input, the B-port groove contributes 76.30% of the four-restriction sum, followed by the compensator assembly (13.09%) and P-port groove (10.00%). At full opening, the compensator assembly contributes 74.02%, followed by the A-port groove (11.47%), P-port groove (8.19%), and B-port groove (6.32%). These component-dominance results are limited to the two representative 1800 rpm points and are not generalized to the 40% and 70% openings.
Model-internal pressure and flow consistency were checked for the two representative 1800 rpm cases. Along the A-port supply chain, the summed pipeline, P-port, compensator-assembly, and A-port pressure drops reconstruct the simulated cap-end pressure to within 0.051 bar. At the intermediate flow-split node, the flow-balance residuals are 0.006 and 0.024 L/min for the 16.3% and 100% cases, respectively; compensator flow is therefore not equated directly with A-port flow.
At the calibrated small-opening correspondence and 1800 rpm, the measured supply-side pressure drop pmain − pcap is 24.54 bar, compared with 25.50 bar in the model, a difference of 3.9%. This comparison constrains the aggregate supply-side loss rather than its model-internal partition.
Across 1300–2200 rpm, the standard deviations of the four-restriction pressure-drop share are approximately 0.005 percentage points at the calibrated small opening and 1.53 percentage points at full opening. At 1800 rpm, a bounded post-processing sensitivity check was performed by perturbing the extracted compensator-assembly pressure-drop term by ±20% while holding the other three pressure-drop terms and the total pressure-loss denominator fixed. The recalculated share ranges from 93.97% to 99.02% at the small opening and from 21.44% to 28.89% at full opening, compared with the corresponding baseline values of 96.50% and 25.17%. This arithmetic check is not a parameter-level model rerun or a measurement-uncertainty analysis. The full-opening single-point value of 25.17% remains distinct from the speed-averaged 26.12%; all component shares remain model-internal results under the stated boundary.
4.4. Summary of Simulation Findings
The S2-based model assessment captures the opening-dependent ordering of the pressure-loss ratio across the 40-point map, with an overall MARE of 4.83% and an RMSE of 2.54 percentage points. The whole-map metrics include the calibrated correspondence between the nominal 15% experiment and the 16.3% simulation input; the 40%, 70%, and 100% groups were evaluated without opening adjustment. The model captures the overall speed-increasing trend but underestimates the measured motor-speed dependence at the 40% and 70% openings. These results support a bounded S2-based trend assessment rather than independent or full-transient hydraulic validation.
The speed-averaged, simulation-derived pressure-drop share of the four valve-related restrictions increases from 26.12% at full opening to 96.50% in the calibrated small-opening case. Its motor-speed dependence is opening-specific: the spans over 1300–2200 rpm are 0.01, 0.96, 1.12, and 4.45 percentage points at the 16.3%, 40%, 70%, and 100% openings, respectively. At the two representative 1800 rpm points, the B-port groove is the dominant restriction at the calibrated small opening, whereas the compensator assembly is dominant at full opening. These dominance results are internal to the model and are not generalized to the 40% and 70% openings or interpreted as complete power- or energy-loss fractions.
5. Discussion: Architectural Implications and Future Work
Taken together, the measured pressure-loss behavior and model-internal decomposition provide a basis for examining the role of restricted metering in the investigated centralized valve-controlled baseline. These findings motivate a bounded discussion of distributed pump-controlled architectures, followed by the limitations of the present study and priorities for future work.
5.1. Architectural Implications for Distributed Pump-Controlled Hydraulic Systems
The 40-point experiment shows that the pressure-loss ratio rises as opening decreases and that the measured pressure-drop distribution shifts from the supply path at 40–100% openings toward the return path at the nominal 15% opening. These are pressure-domain experimental results; they do not separate individual restrictions.
The simulation complements the experiment by evaluating the combined pressure-drop share of four valve-related restrictions across the opening groups. At the calibrated 16.3% small-opening input, the speed-averaged combined share is 96.50%; component dominance is identified only at the two representative 1800 rpm points. Within this boundary, pump-speed adjustment alone does not remove the small-opening metering restriction when actuator motion remains valve-controlled.
From an architectural perspective, the results indicate a limitation of pump-speed/spool-opening co-calibration in the investigated centralized valve-controlled baseline when motion remains regulated through restricted metering orifices. Distributed pump-controlled systems offer a possible structural route to reduce throttling-based speed regulation by shifting primary control toward the pump-motor unit. Studies of pump-controlled differential-cylinder and electro-hydraulic architectures support this general direction [6,12,15,35]. Electronic load-sensing pressure-margin regulation, by contrast, represents an efficiency-oriented optimization within centralized hydraulics [36]. The present data do not determine the loss distribution of a distributed architecture.
However, the present study does not experimentally or numerically validate a distributed pump-controlled hydraulic architecture. The discussion above should therefore be interpreted as an architectural implication derived from the pressure-loss characteristics of the centralized valve-controlled baseline system, rather than as a verified performance comparison between centralized and distributed architectures.
5.2. Limitations and Future Work
This study focuses on the quasi-steady pressure-evaluation stage (S2) of boom-cylinder extension in a centralized valve-controlled hydraulic system. Transient stages, boom lowering, arm and bucket motions, and multi-actuator compound operations were not included.
The controlled oil temperature of 40 ± 5 °C represents a stabilized warmed-oil condition rather than the full thermal range of excavator service. No temperature-sweep experiment was conducted; the quantitative results therefore do not establish temperature-dependent loss behavior.
The 40-point experimental map applies to the tested 4.3 t single-pump centralized valve-controlled machine, boom-cylinder extension, an unloaded bucket without external payload, motor speeds of 1300–2200 rpm, nominal openings of 15%, 40%, 70%, and 100%, the stated thermal condition, and S2 averaging. The small-opening simulation result uses the calibrated 16.3% input, and the individual shares of the four valve-related restrictions are reported only for the two representative 1800 rpm cases.
The measurement and evaluation framework may be transferred to another machine or actuator only after the measurement points and calculation boundary have been defined for that system and matched to the comparison; the numerical values are not universal.
Cavitation was not monitored, and no cavitation-specific instrumentation was installed. Restricting the analysis to S2, using a positive-load boom-extension motion, and observing pressurized port-level signals reduces the likelihood that cavitation materially affected the reported S2 averages, but does not eliminate that possibility. In particular, local cavitation within a metering orifice at the smallest opening cannot be excluded from the available port-level measurements.
The simulation model was used to assess S2-based pressure-loss trends and to decompose model-internal pressure-drop components in the centralized valve-controlled circuit, not to evaluate a distributed pump-controlled system. Experimental openings were defined by nominal handle-angle settings rather than direct spool-displacement measurement. The 16.3% simulation input for the nominal 15% experiment was selected from the evaluated discrete candidates using the three-pressure objective over ten motor speeds and is a calibrated correspondence, not independent validation. The 40%, 70%, and 100% groups were evaluated without opening adjustment and provided additional model-assessment evidence. However, the model underestimates the measured motor-speed dependence at the 40% and 70% openings, so the map-level agreement should not be interpreted as a uniformly accurate representation of speed sensitivity across all opening groups. The assessment is limited to S2-averaged pressures and ratios and does not establish transient waveform accuracy.
Future work should extend the pressure-loss evaluation to gravity-driven and compound conditions, including boom lowering, arm and bucket motions, and multi-actuator operations.
A fully parameterized distributed pump-controlled model could support a preliminary matched-boundary assessment against the centralized baseline. Any claimed pressure-loss reduction should ultimately be validated experimentally under comparable loads, operating matrices, pressure boundaries, and evaluation metrics.
A subsequent full energy-efficiency assessment should include synchronized flow rate, actuator displacement, load force, and electrical power. Energy regeneration, thermal behavior, and controllability can then be compared within explicitly matched system boundaries.
6. Conclusions
This study investigated the pressure-loss characteristics and energy-dissipation mechanisms of a centralized valve-controlled hydraulic system during boom-cylinder extension in a 4.3 t electric excavator. A two-dimensional experimental matrix was established by varying the main spool opening and motor speed, and S2 pressure values averaged across the three retained responses were used for pressure-loss evaluation. Independent reprocessing of all 40 operating conditions by a second operator showed limited inter-operator dependence of the resulting pressure-loss-ratio map, with a mean absolute difference of 0.40 percentage points and a maximum absolute difference of 1.10 percentage points under the specified procedure. The main conclusions are as follows:
- Under the centralized multi-way directional valve throttling control architecture, the pressure-loss ratio during boom-cylinder extension varies systematically across the two-dimensional space defined by main spool opening × motor speed. At a given main spool opening, the pressure-loss ratio generally increases with motor speed, while at a given motor speed, it shows an overall increasing trend as the valve spool opening decreases.
- Within the medium-to-large opening range (40–100%), the pressure-loss ratio is more sensitive to motor-speed variation than under the small-opening condition, and the curves exhibit an overall opening-dependent banded structure. In contrast, under the nominal 15% small-opening experimental condition, the pressure-loss ratio remains within a narrow, relatively high range across motor speeds and shows weak speed sensitivity.
- Experimentally, the mean ratio of rod-side return back-pressure to supply-side pressure drop is 0.56–0.60 at the 40–100% openings and 3.41 at the nominal 15% opening, indicating that the measured pressure-drop distribution shifts from the supply path toward the return path as the opening decreases. The experiment does not separate flow-path friction from individual valve restrictions. The governing pressure-drop relations provide a mechanism-consistent interpretation of this observation, while the individual valve-related pressure-drop shares are evaluated separately by simulation.
- The S2-based model captures the opening-dependent ordering and overall speed-increasing trend across the 40-point map, with an overall MARE of 4.83% and an RMSE of 2.54 percentage points; these metrics include the calibrated correspondence between the nominal 15% experiment and the 16.3% simulation input. The 40%, 70%, and 100% groups were evaluated without opening adjustment, but the model underestimates the measured motor-speed dependence at the 40% and 70% openings. The model evidence therefore supports bounded S2-based trend assessment and the subsequent model-internal pressure-drop decomposition, rather than independent or full-transient validation.
- The simulation-derived speed-averaged combined pressure-drop share of the P-port groove, compensator assembly, A-port groove, and B-port groove increases from 26.12% at full opening to 96.50% at the calibrated 16.3% small-opening input corresponding to the nominal 15% experiment. Its speed dependence is opening-specific: the span is 4.45 percentage points at full opening and 0.01 percentage points at the calibrated small opening. At 1800 rpm, the B-port groove is dominant in the calibrated small-opening case, whereas the compensator assembly is dominant at full opening; these dominance results are limited to the two representative simulation points.
- As an architectural implication of these findings, reducing throttling-based speed regulation is a relevant design objective within the investigated centralized valve-controlled system. Distributed pump-controlled systems provide one possible pathway, but any performance advantage must be assessed under matched operating and evaluation boundaries and ultimately validated experimentally against the centralized baseline before broader comparisons of energy regeneration, thermal behavior, and controllability are made.
Author Contributions
Conceptualization, P.L. and S.A.; methodology, P.L., S.A., W.M.F.W.M. and Y.H.; resources, Y.H. and J.P.; investigation, P.L., X.F., J.P. and L.Z.; software, Q.Z.; data curation, P.L., J.P. and K.M.; formal analysis, P.L. and K.M.; validation, P.L., J.P. and Q.Z.; writing—original draft preparation, P.L.; writing—review and editing, S.A., W.M.F.W.M. and J.P.; supervision, S.A., W.M.F.W.M. and Y.H.; project administration, Y.H. All authors have read and agreed to the published version of the manuscript.
Funding
This research was funded by the Sci&Tech Program of Huai’an (Grant No. HAG202506), the Scientific Research Project of Jiangsu Vocational College of Electronics and Information (Grant No. JSEIZZD202403), the Huai’an “533 Talent Project”, the Jiangsu Higher Education Qinglan Project, and the Sixth Phase of the Jiangsu Province Vocational Education Teaching Reform Research Project (Grant No. ZDZC113).
Institutional Review Board Statement
Not applicable.
Informed Consent Statement
Not applicable.
Data Availability Statement
The processed data supporting the findings of this study are contained within the article. Further inquiries can be directed to the corresponding author.
Acknowledgments
The authors would like to acknowledge Jiangsu Vibo Hydraulic Joint Stock Co., Ltd. for support with the experimental platform and technical discussions.
Conflicts of Interest
Jiawei Pan was employed by Jiangsu Vibo Hydraulic Joint Stock Co., Ltd. Kai Men was employed by Shandong Weimeng Engineering Machinery Co., Ltd. The remaining authors declare that the research was conducted in the absence of any commercial or financial relationships that could be construed as a potential conflict of interest. The funders had no role in the design of the study; in the collection, analysis, or interpretation of data; in the writing of the manuscript; or in the decision to publish the results.
Abbreviations
The following abbreviations are used in this manuscript:
| CAN | Controller area network |
| LS | Load sensing |
| MARE | Mean absolute relative error |
| PQT | Pressure–flow–torque |
| RMSE | Root mean square error |
| VCU | Vehicle control unit |
Appendix A
The complete processed experimental matrix used for the pressure-loss-ratio map and the measured supply-side/return-side path comparison is provided in Table A1.
Table A1.
Processed experimental pressures and derived pressure-loss indicators for all 40 operating conditions.
References
- Khan, A.U.; Huang, L. Toward Zero Emission Construction: A Comparative Life Cycle Impact Assessment of Diesel, Hybrid, and Electric Excavators. Energies 2023, 16, 6025. [Google Scholar] [CrossRef] [Scilit]
- Cheng, M.; He, J.; Mu, H.; Yan, X.; Yang, J.; Ou, J.; Ding, R.; Zhang, J.; Xu, B. Opportunities and challenges of electrohydraulic control systems in the electrification era of non-road mobile machinery. J. Adv. Manuf. Sci. Technol. 2024, 4, 2024001. [Google Scholar] [CrossRef] [Scilit]
- Lin, T.; Chen, Q.; Ren, H.; Huang, W.; Chen, Q.; Fu, S. Review of boom potential energy regeneration technology for hydraulic construction machinery. Renew. Sustain. Energy Rev. 2017, 79, 358–371. [Google Scholar] [CrossRef] [Scilit]
- Yue, D.; Gao, H.; Liu, Z.; Wei, L.; Liu, Y.; Zuo, X. Potential Energy Recovery and Direct Reuse System of Hydraulic Hybrid Excavators Based on the Digital Pump. Energies 2023, 16, 5229. [Google Scholar] [CrossRef] [Scilit]
- Nguyen, V.H.; Do, T.C.; Ahn, K.K. Hybrid powertrain with dual energy regeneration for boom cylinder movement in a hydraulic excavator. Autom. Constr. 2025, 171, 105974. [Google Scholar] [CrossRef] [Scilit]
- Ketelsen, S.; Padovani, D.; Andersen, T.O.; Ebbesen, M.K.; Schmidt, L. Classification and Review of Pump-Controlled Differential Cylinder Drives. Energies 2019, 12, 1293. [Google Scholar] [CrossRef] [Scilit]
- Liu, S.; Cui, Y.; Wang, Y.; Deng, K.; Liu, S. An evaluation method for transient response performance of turbocharged diesel engines. Energy 2019, 182, 852–863. [Google Scholar] [CrossRef] [Scilit]
- Casoli, P.; Scolari, F.; Minav, T.; Rundo, M. Comparative Energy Analysis of a Load Sensing System and a Zonal Hydraulics for a 9-Tonne Excavator. Actuators 2020, 9, 39. [Google Scholar] [CrossRef] [Scilit]
- An, K.; Kang, H.; An, Y.; Park, J.; Lee, J. Methodology of Excavator System Energy Flow-Down. Energies 2020, 13, 951. [Google Scholar] [CrossRef] [Scilit]
- Li, D.; Dong, S.; Wang, J.; Li, Y. State-of-the-art and some considerations on thermal load analysis and thermal management for hydraulic system in MEA. J. Eng. 2018, 2018, 399–405. [Google Scholar] [CrossRef] [Scilit]
- He, A.; Wei, L.; Lu, Q.; He, P. An Investigation of Energy Consumption Characteristics of the Pump-Control System for Electric Excavator Arms. Appl. Sci. 2024, 14, 10791. [Google Scholar] [CrossRef] [Scilit]
- Casoli, P.; Scolari, F.; Vescovini, C.M.; Rundo, M. Energy Comparison between a Load Sensing System and Electro-Hydraulic Solutions Applied to a 9-Ton Excavator. Energies 2022, 15, 2583. [Google Scholar] [CrossRef] [Scilit]
- Ding, R.; Cheng, M.; Zheng, S.; Xu, B. Sensor-Fault-Tolerant Operation for the Independent Metering Control System. IEEE/ASME Trans. Mechatron. 2021, 26, 2558–2569. [Google Scholar] [CrossRef] [Scilit]
- Schmidt, L.; van Binsbergen-Galán, M.; Knöll, R.; Riedmann, M.; Schneider, B.; Heemskerk, E. Energy Efficient Excavator Implement by Electro-Hydraulic/Mechanical Drive Network. Int. J. Fluid Power 2024, 25, 413–438. [Google Scholar] [CrossRef] [Scilit]
- Schmidt, L.; van Binsbergen-Galán, M. Electro-Hydraulic Variable-Speed Drive Network Technology—First Experimental Validation. Energies 2024, 17, 3192. [Google Scholar] [CrossRef] [Scilit]
- Liang, T.; Quan, L.; Ge, L.; Xia, L.; Wang, C. An Energy-Saving Scheme to Reduce Throttling Losses in Hydraulic Excavators Based on Electro-Hydraulic Energy Storage. IEEE Access 2024, 12, 125043–125056. [Google Scholar] [CrossRef] [Scilit]
- Yao, J.; Wang, P.; Yin, Y.; Li, M.; Li, Y. Power management of multi-source network hydraulic system with multiple actuators. Energy Convers. Manag. 2020, 223, 113247. [Google Scholar] [CrossRef] [Scilit]
- Rudzki, C.; Bartnicki, A.; Rubiec, A.; Muszyński, T.; Przybysz, M. Experiment Driven Co-Simulation Model of Wheel Loader Attachment Hydraulics System for Influence Assessment of Hydraulic Accumulator Parameters on Energy Recuperation Efficiency. Energies 2025, 18, 4208. [Google Scholar] [CrossRef] [Scilit]
- Heybroek, K.; Sahlman, M. A hydraulic hybrid excavator based on multi-chamber cylinders and secondary control—Design and experimental validation. Int. J. Fluid Power 2018, 19, 91–105. [Google Scholar] [CrossRef] [Scilit]
- Hao, Y.; Quan, L.; Qiao, S.; Ge, L.; Li, Z.; Zhao, B. Energy and Operation Characteristics of Electric Excavator With Innovative Hydraulic-Electric Dual Power Drive Boom System. IEEE Access 2023, 11, 107265–107275. [Google Scholar] [CrossRef] [Scilit]
- Yuan, Z.; Ma, W.; Yin, C.; Ma, S.; Cao, D. Research on Control and Energy Consumption Characteristics of Distributed Independent Electrical-Hydraulic Actuator Control System Used on Excavators. IEEE Sens. J. 2024, 24, 34070–34082. [Google Scholar] [CrossRef] [Scilit]
- Fu, W.; Yuan, X.; Li, Y.; Zhang, L. Research on Optimal Control of Excavator Negative Control System Based on Secondary Controllable Main Valve. IEEE Access 2022, 10, 7566–7573. [Google Scholar] [CrossRef] [Scilit]
- Lin, T.; Lin, Y.; Ren, H.; Chen, H.; Li, Z.; Chen, Q. A double variable control load sensing system for electric hydraulic excavator. Energy 2021, 223, 119999. [Google Scholar] [CrossRef] [Scilit]
- Lin, Y.; Lin, T.; Fu, S.; Ren, H.; Chen, Q.; Zhao, H.; Shi, J. Pre-compensated load sensing system based on speed sensitive variable pressure margin control. Energy 2025, 322, 135577. [Google Scholar] [CrossRef] [Scilit]
- Ming, Q.; Wang, Y. Research on Integrated Intelligent Control and Energy Saving Technology of Electro-Hydraulic Excavator. Eng. Rep. 2025, 7, e70280. [Google Scholar] [CrossRef] [Scilit]
- Fassbender, D.; Brach, C.; Minav, T. Energy-Efficiency Comparison of Different Implement Powertrain Concepts to Each Other and Between Different Heavy-Duty Mobile Machines. Int. J. Fluid Power 2024, 25, 127–144. [Google Scholar] [CrossRef] [Scilit]
- Roquet, P.; Raush, G.; Berne, L.J.; Gamez-Montero, P.-J.; Codina, E. Energy Key Performance Indicators for Mobile Machinery. Energies 2022, 15, 1364. [Google Scholar] [CrossRef] [Scilit]
- Siebert, J.; Wydra, M.; Geimer, M. Efficiency Improved Load Sensing System—Reduction of System Inherent Pressure Losses. Energies 2017, 10, 941. [Google Scholar] [CrossRef] [Scilit]
- Ritelli, G.F.; Vacca, A. Energetic and dynamic impact of counterbalance valves in fluid power machines. Energy Convers. Manag. 2013, 76, 701–711. [Google Scholar] [CrossRef] [Scilit]
- Arai, R.; Sakai, S.; Tatsuoka, A.; Zhang, Q. Analytical, Experimental, and Numerical Investigation of Energy in Hydraulic Cylinder Dynamics of Agriculture Scale Excavators. Energies 2021, 14, 6210. [Google Scholar] [CrossRef] [Scilit]
- Wu, D.; Burton, R.; Schoenau, G.; Bitner, D. Analysis of a Pressure-Compensated Flow Control Valve. J. Dyn. Syst. Meas. Control Trans. ASME 2007, 129, 203–211. [Google Scholar] [CrossRef] [Scilit]
- Casoli, P.; Pompini, N.; Riccò, L. Simulation of an Excavator Hydraulic System Using Nonlinear Mathematical Models. Stroj. Vestn./J. Mech. Eng. 2015, 61, 583–593. [Google Scholar] [CrossRef] [Scilit][Green Version]
- Park, C.-G.; Yoo, S.; Ahn, H.; Kim, J.; Shin, D. A coupled hydraulic and mechanical system simulation for hydraulic excavators. Proc. Inst. Mech. Eng. I J. Syst. Control Eng. 2019, 234, 527–549. [Google Scholar] [CrossRef] [Scilit]
- Song, H.; Li, G.; Li, Z.; Xiong, X. Trajectory Control Strategy and System Modeling of Load-Sensitive Hydraulic Excavator. Machines 2023, 11, 10. [Google Scholar] [CrossRef] [Scilit]
- Li, L.; Zhang, T.; Wu, K.; Lu, L.; Lin, L.; Xu, H. Design and Research on Electro-Hydraulic Drive and Energy Recovery System of the Electric Excavator Boom. Energies 2022, 15, 4757. [Google Scholar] [CrossRef] [Scilit]
- Cheng, M.; Sun, B.; Ding, R.; Xu, B. A Multi-mode Electronic Load Sensing Control Scheme with Power Limitation and Pressure Cut-off for Mobile Machinery. Chin. J. Mech. Eng. 2023, 36, 29. [Google Scholar] [CrossRef] [Scilit]
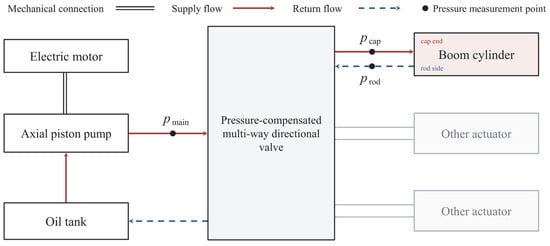
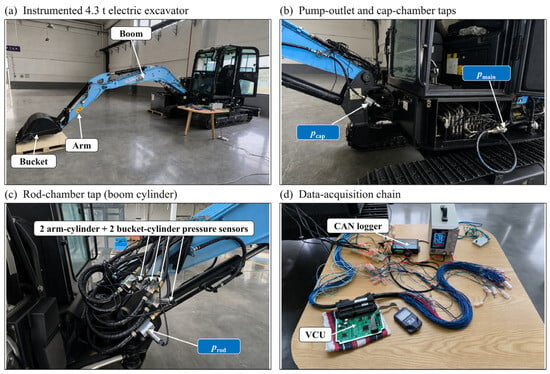
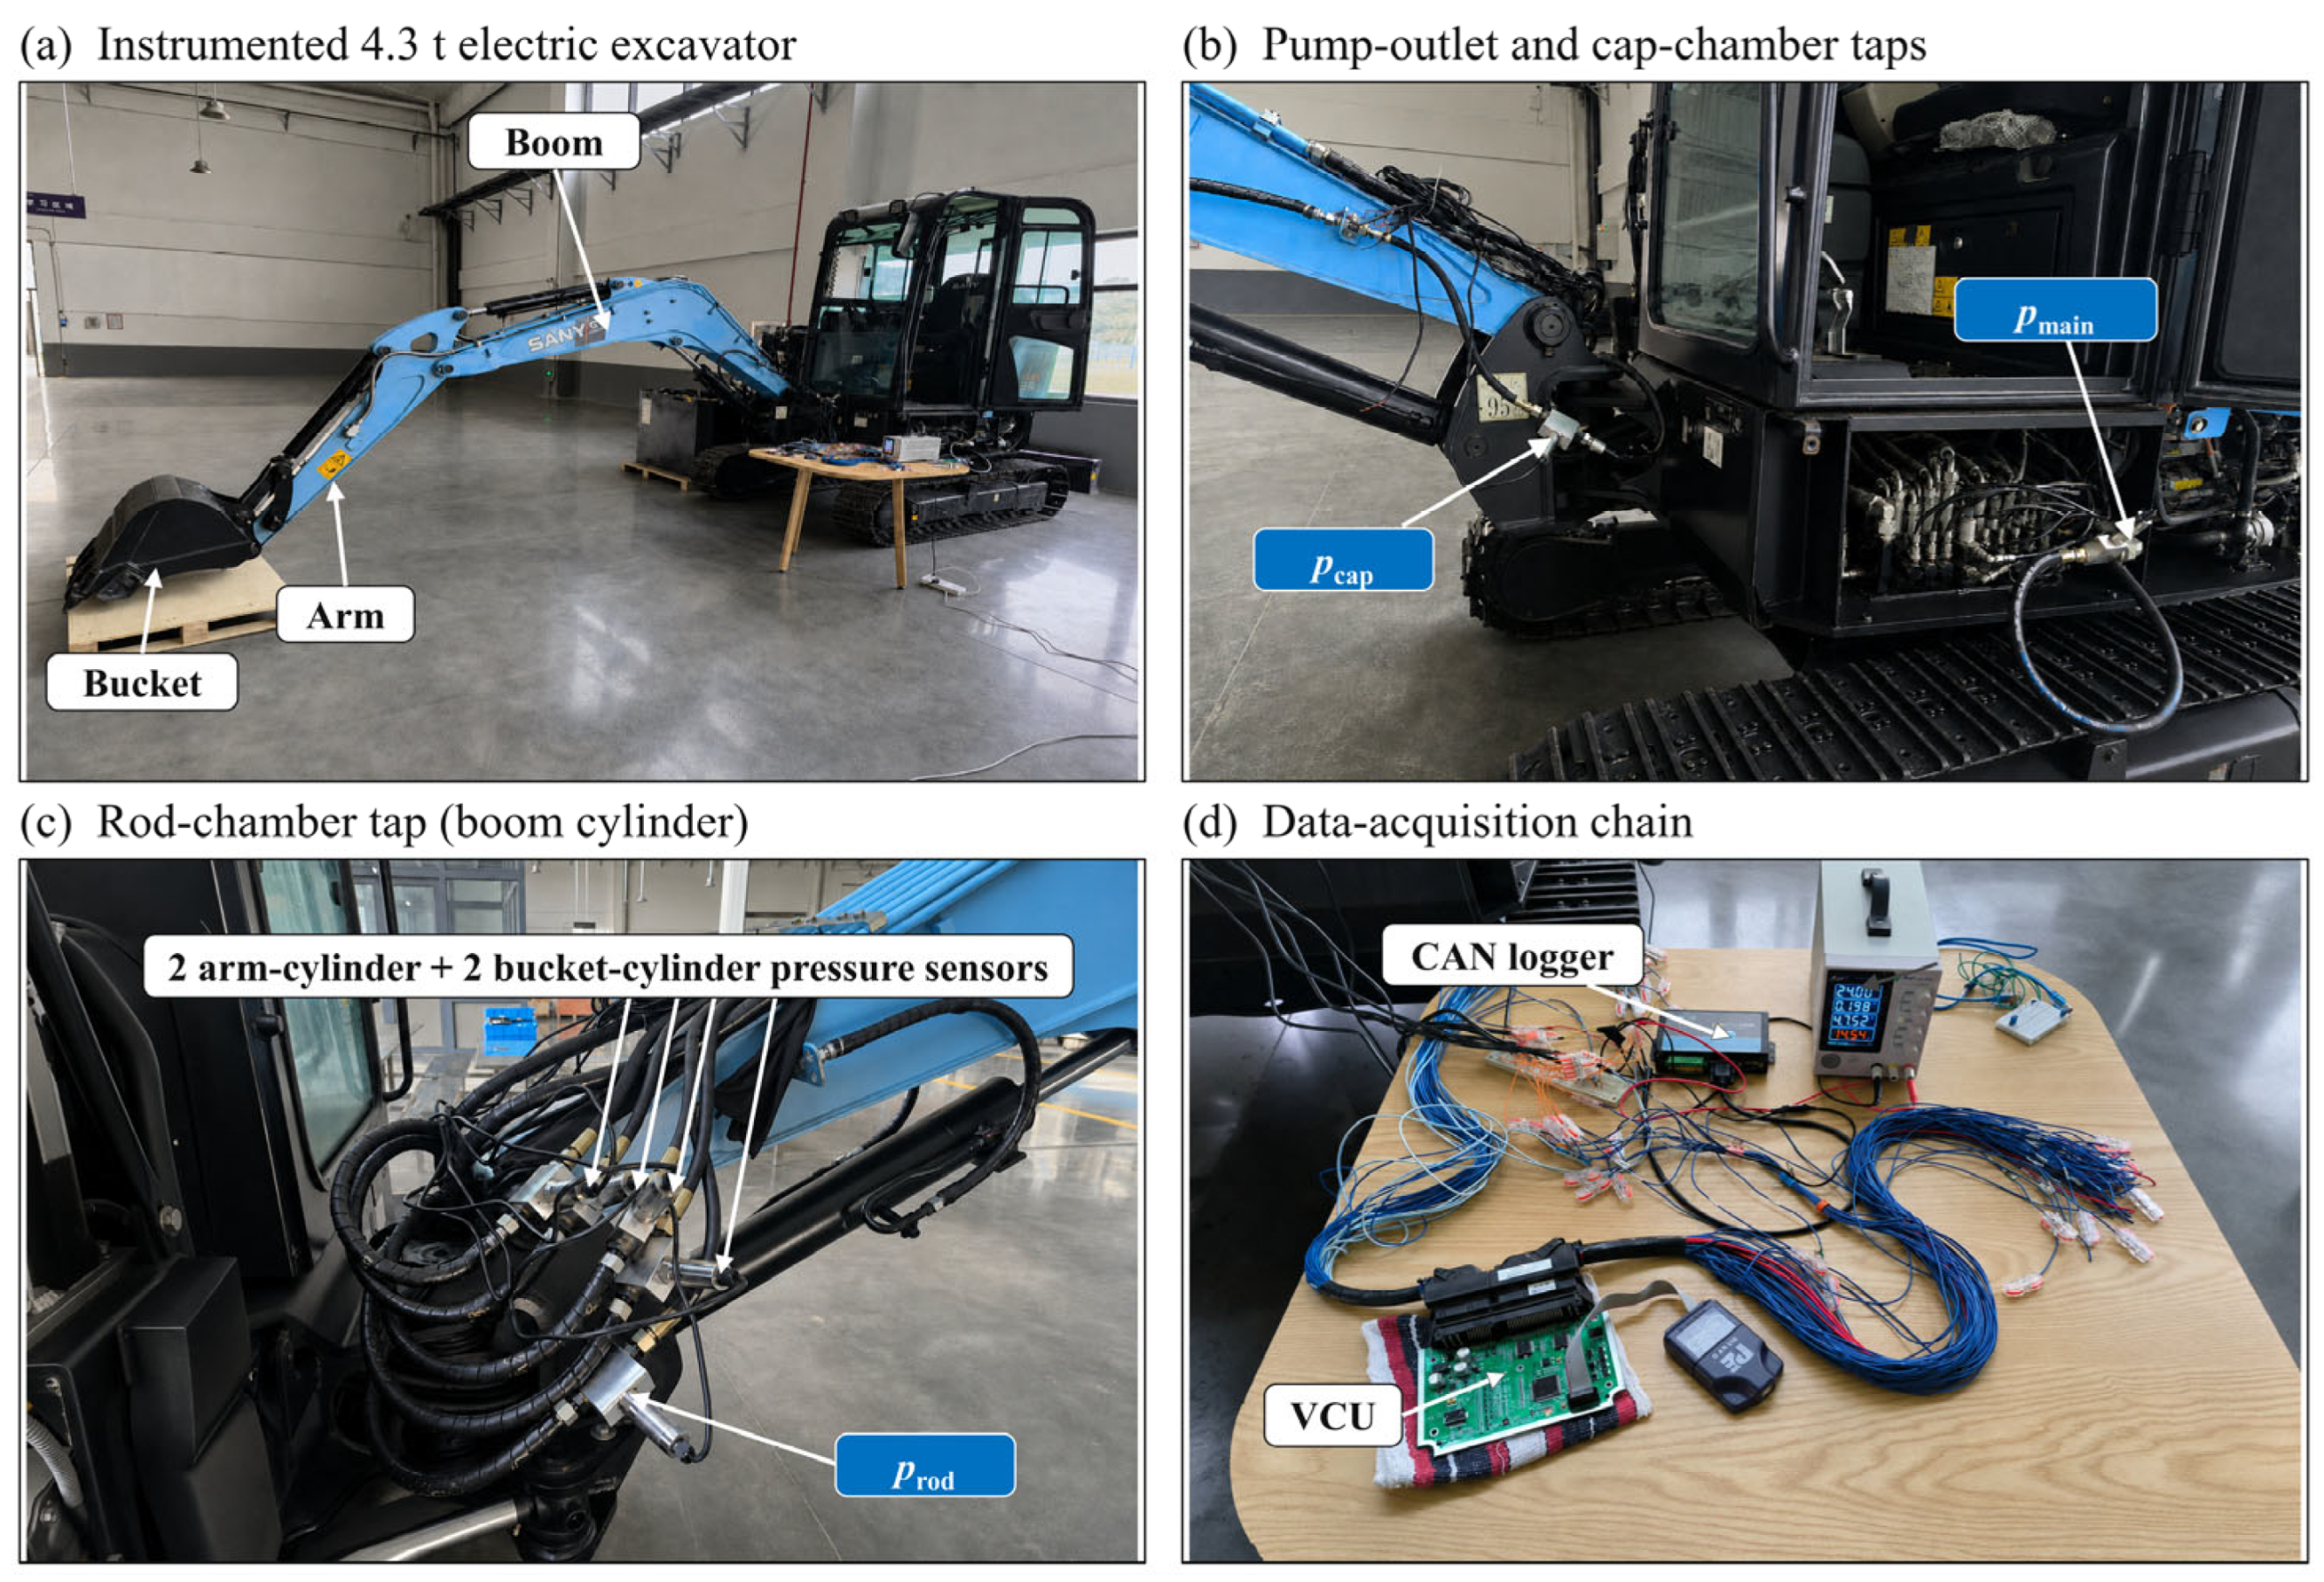
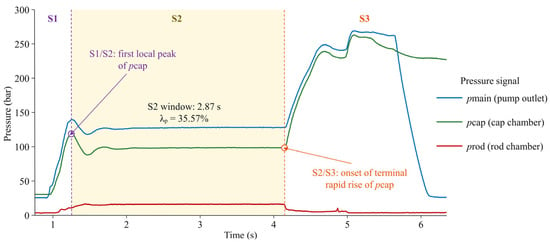
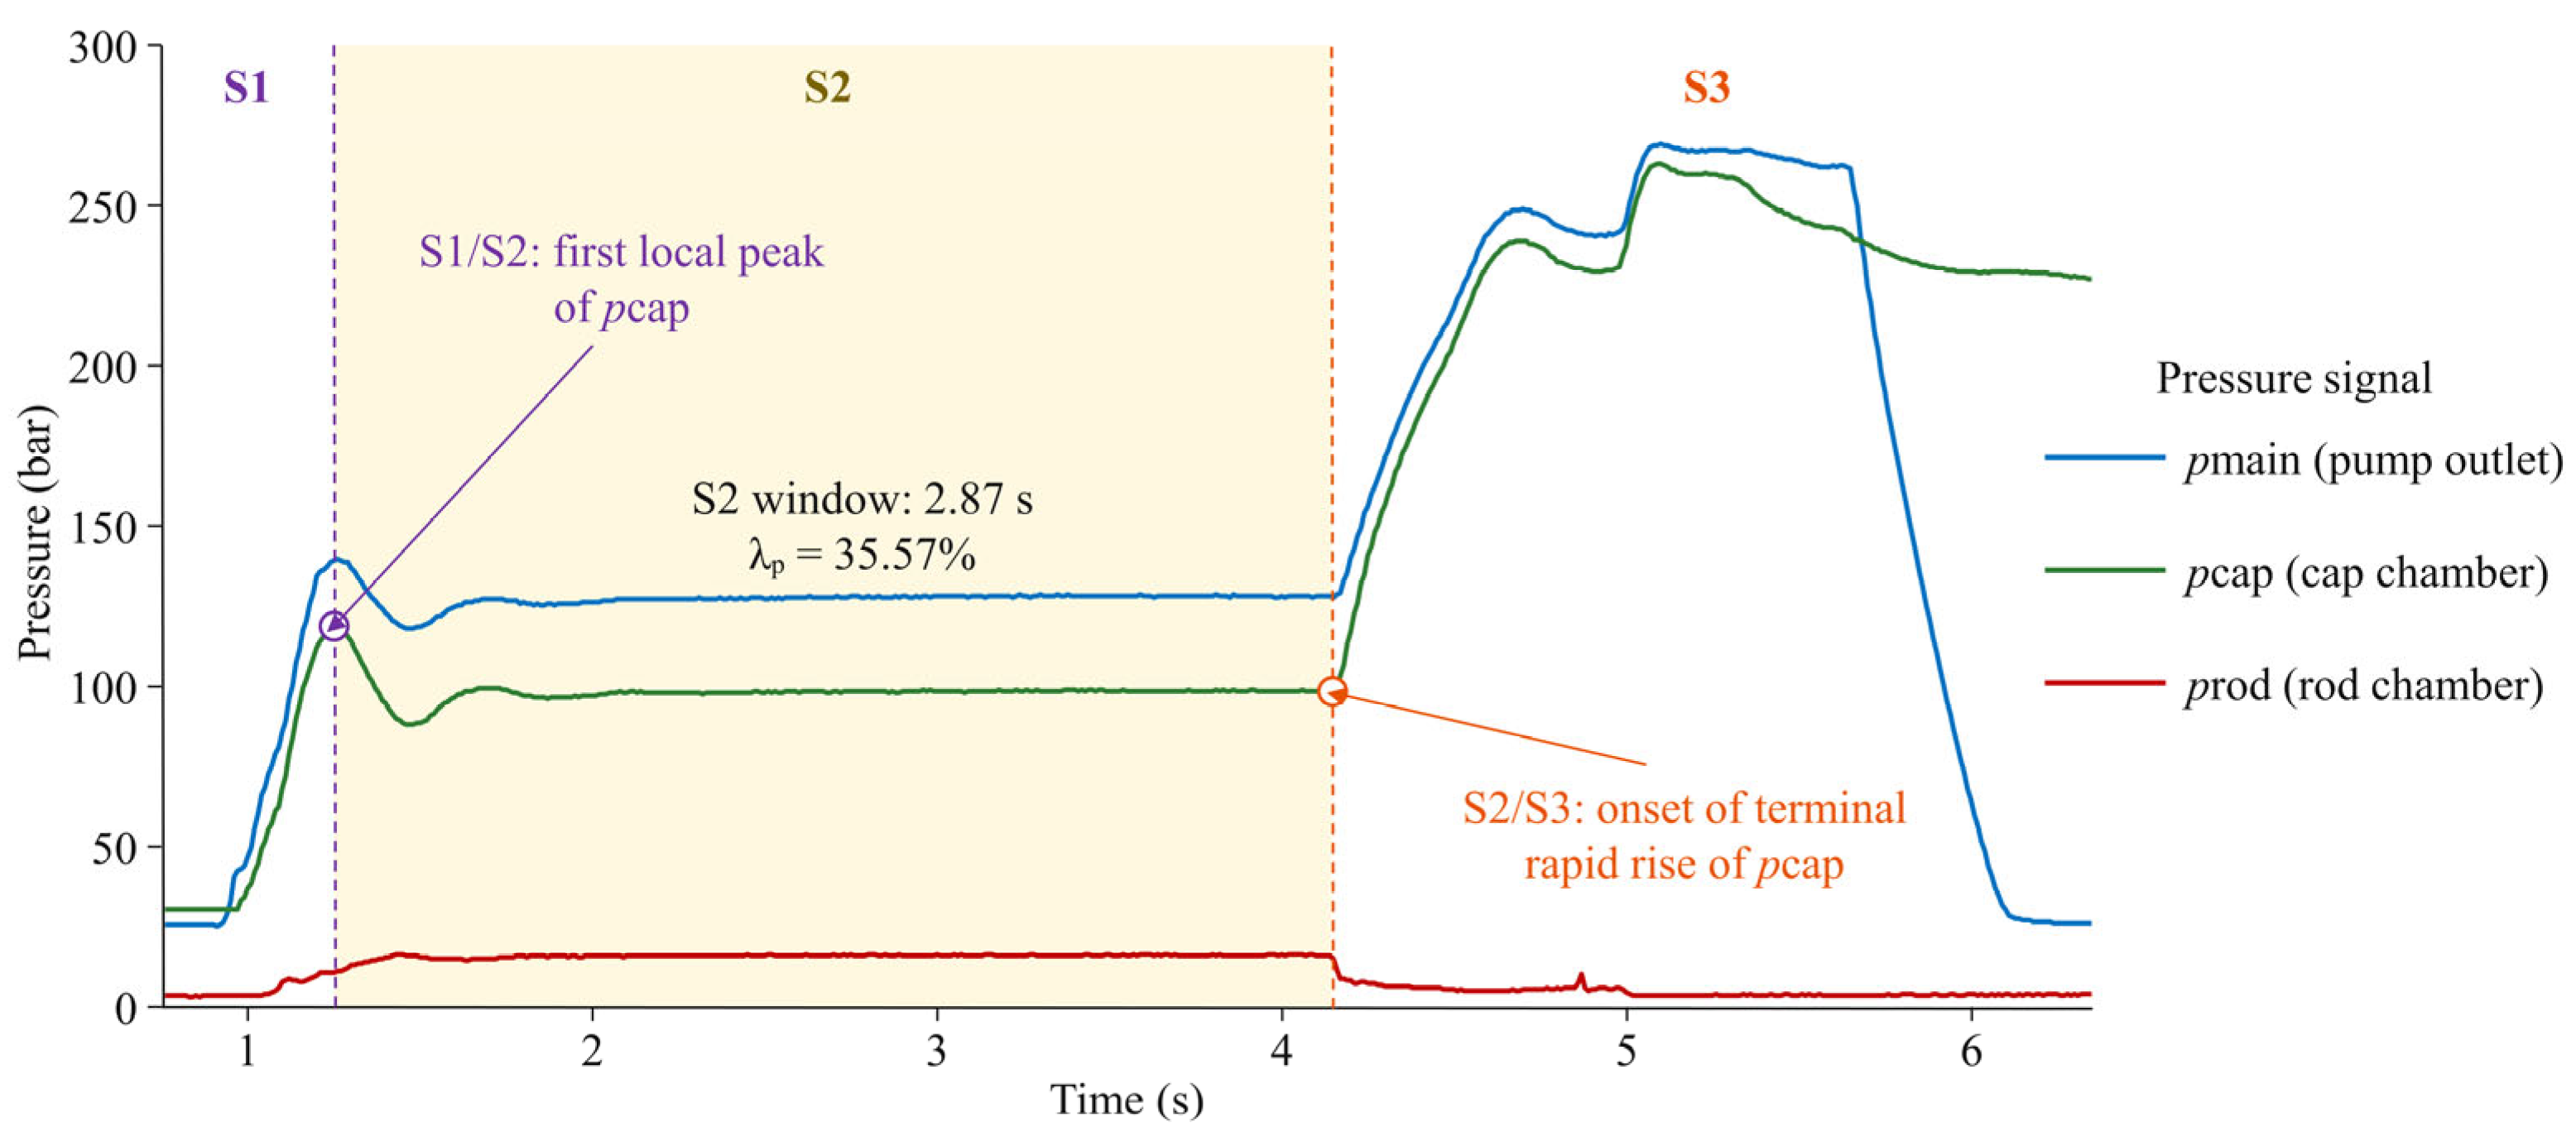
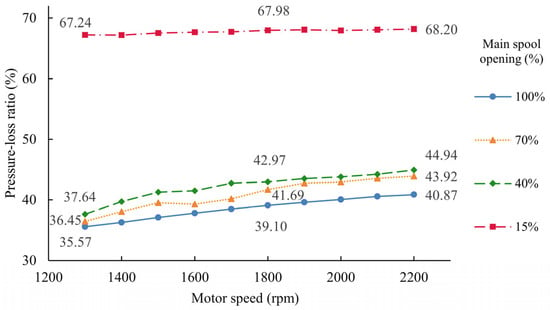
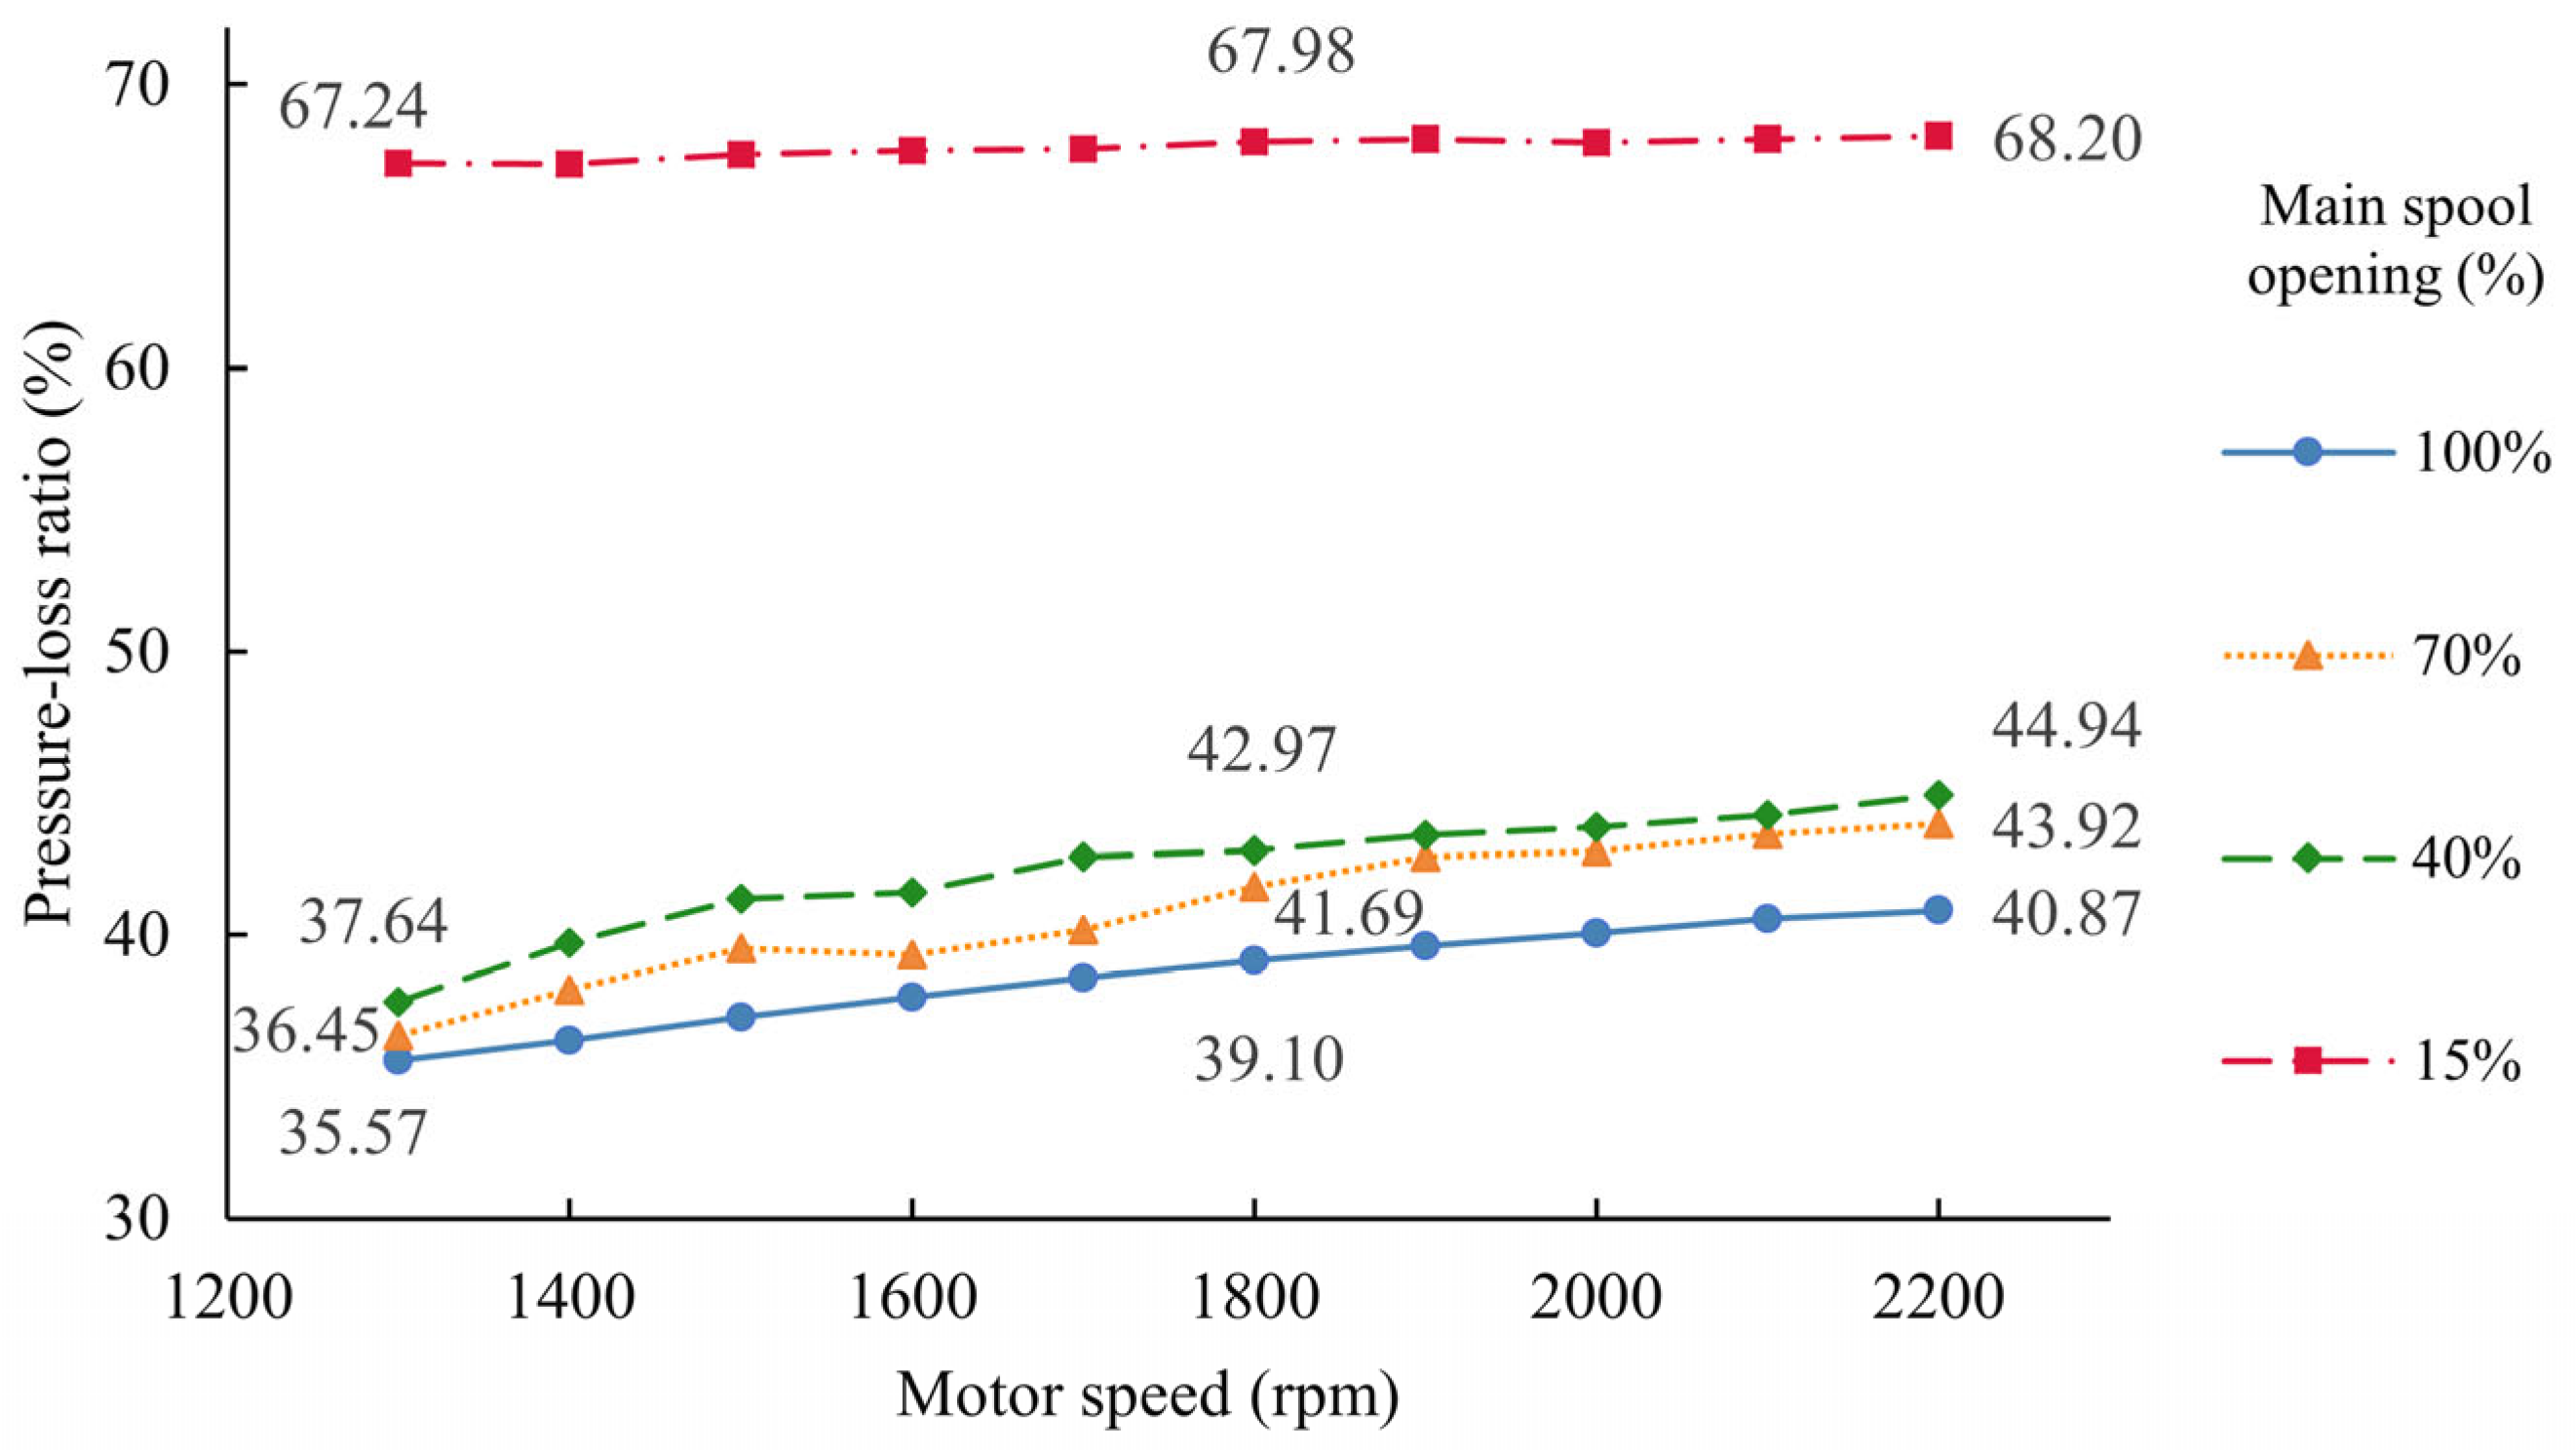
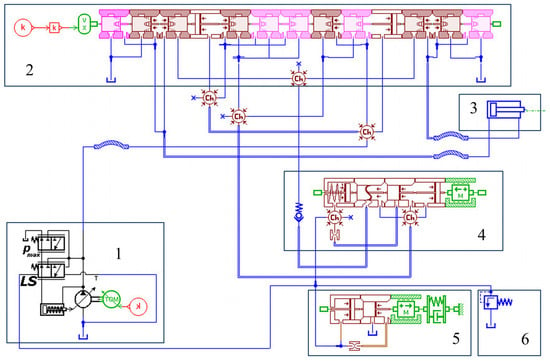
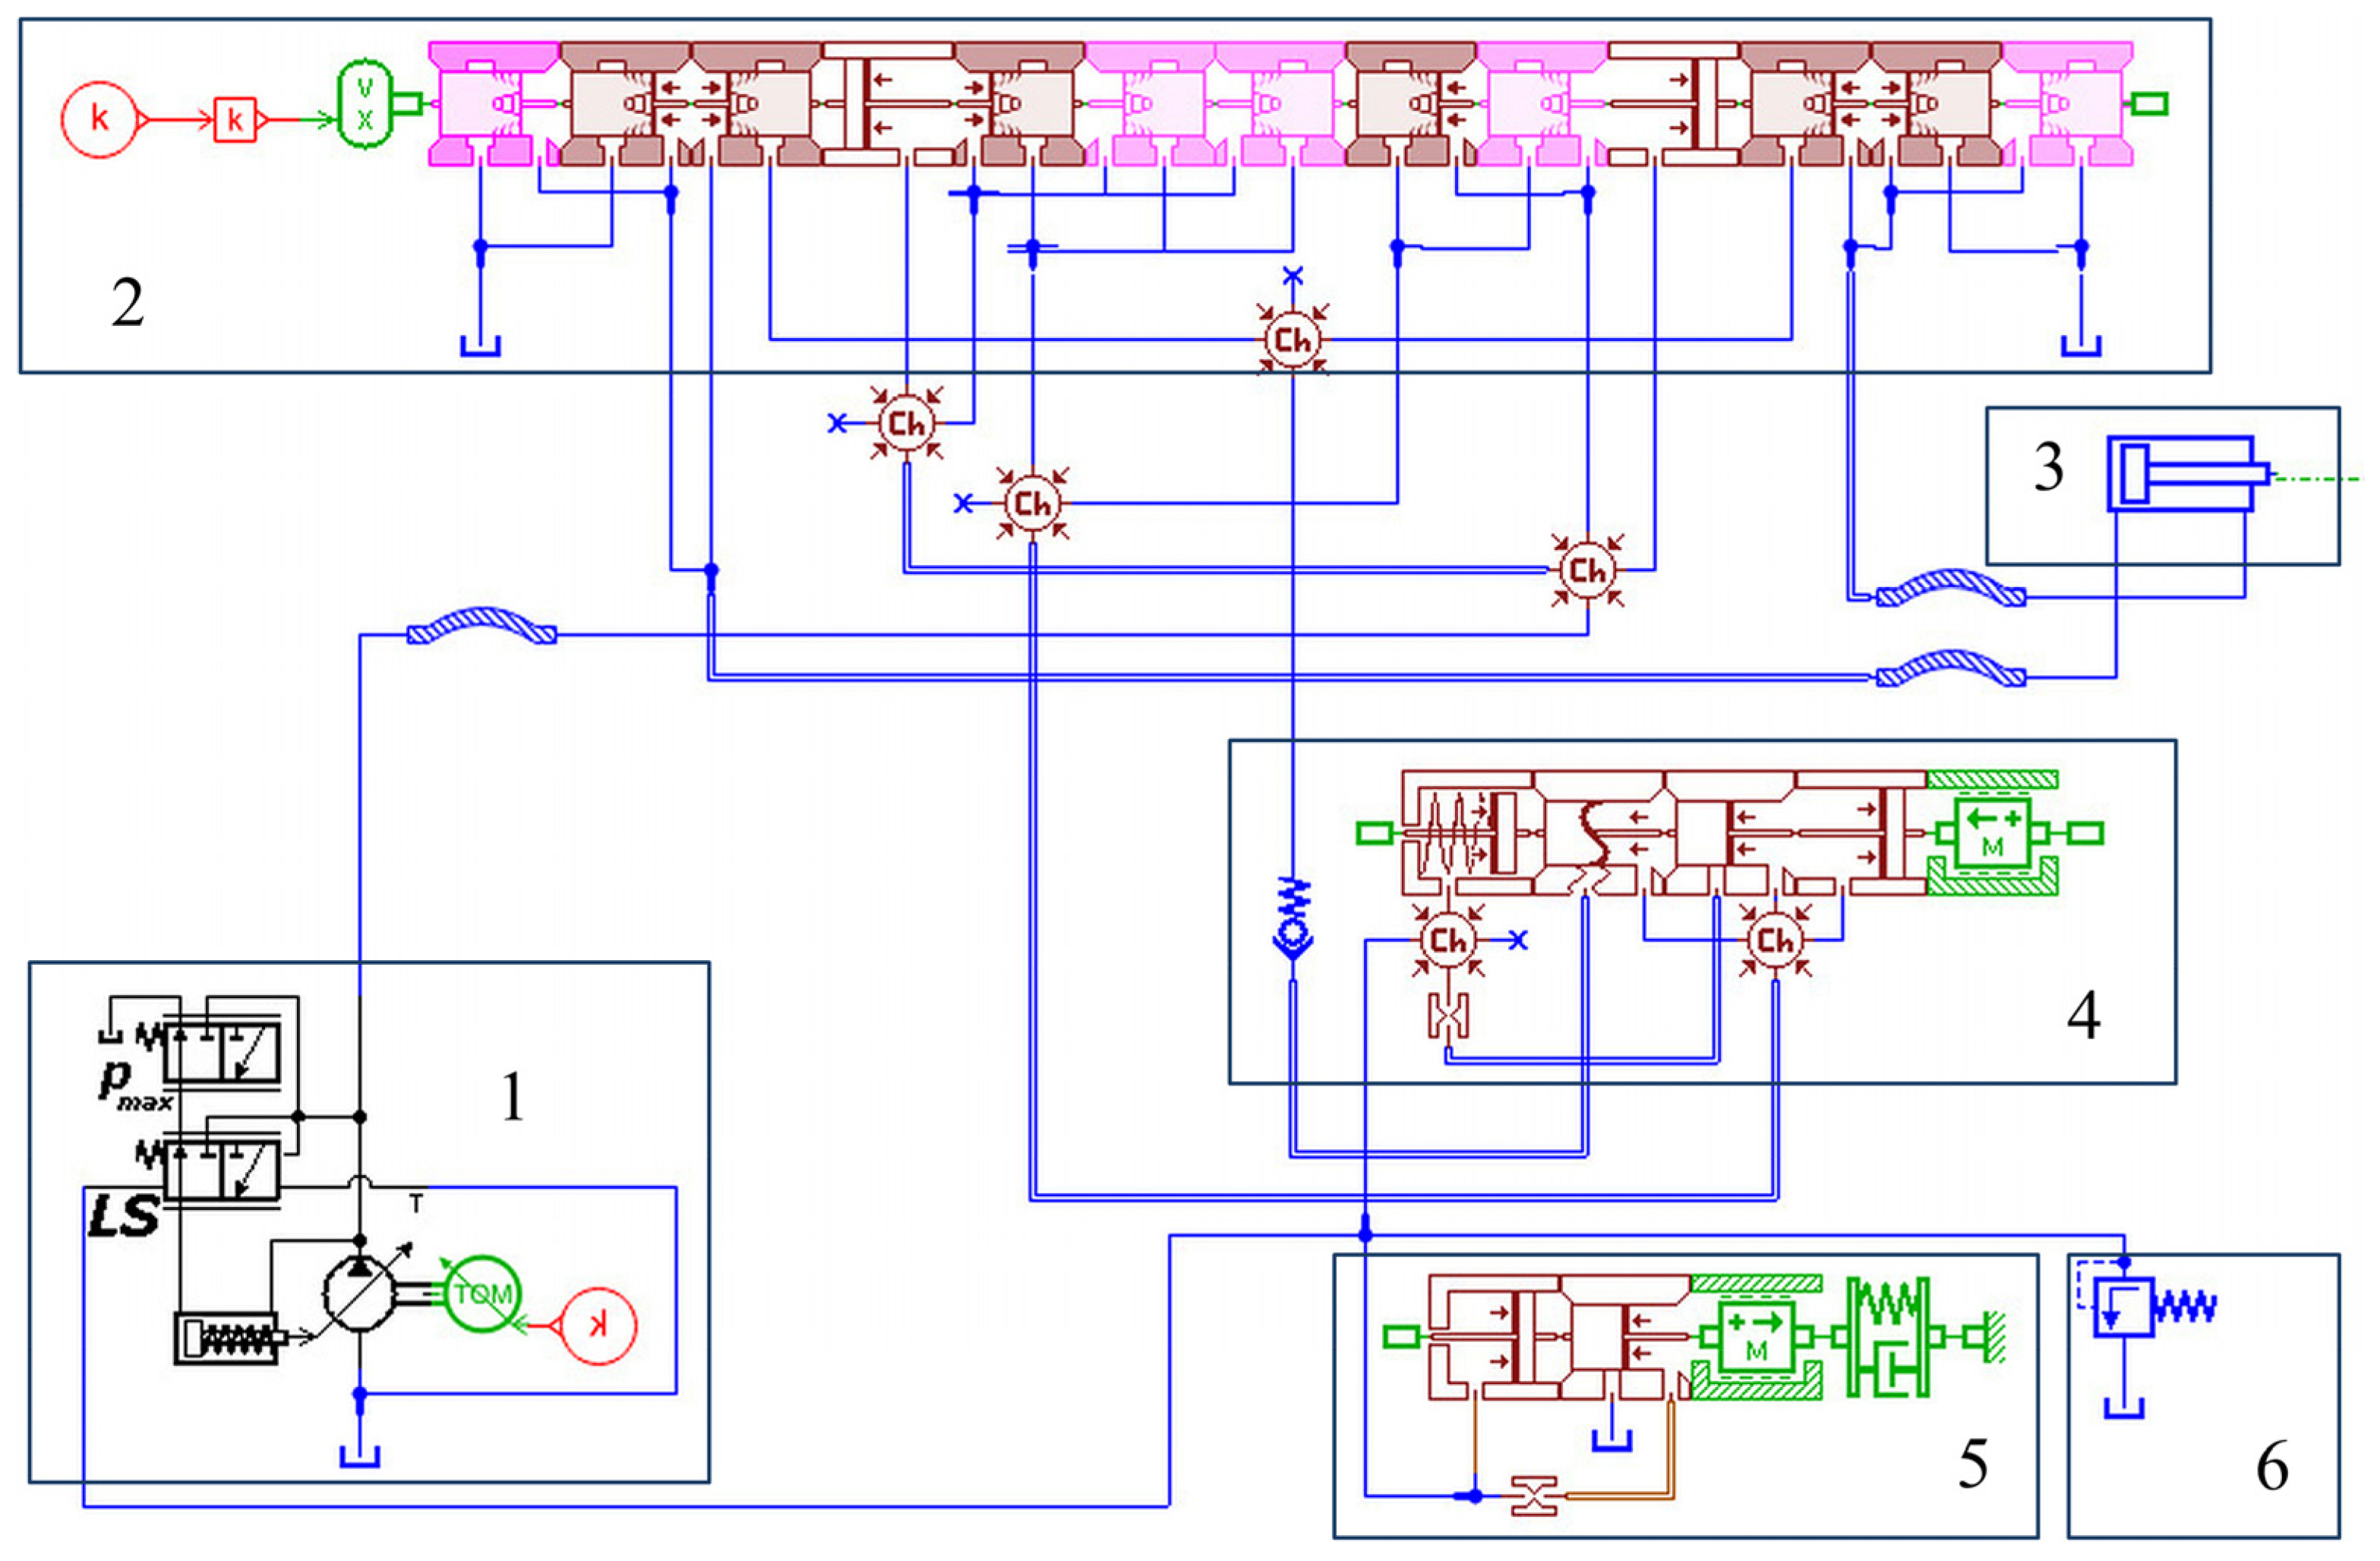
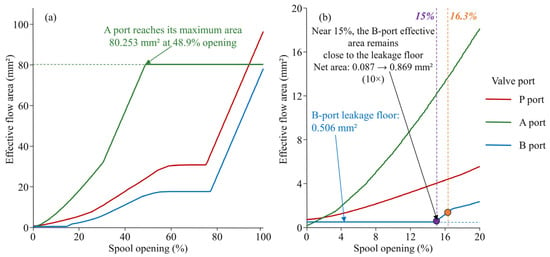
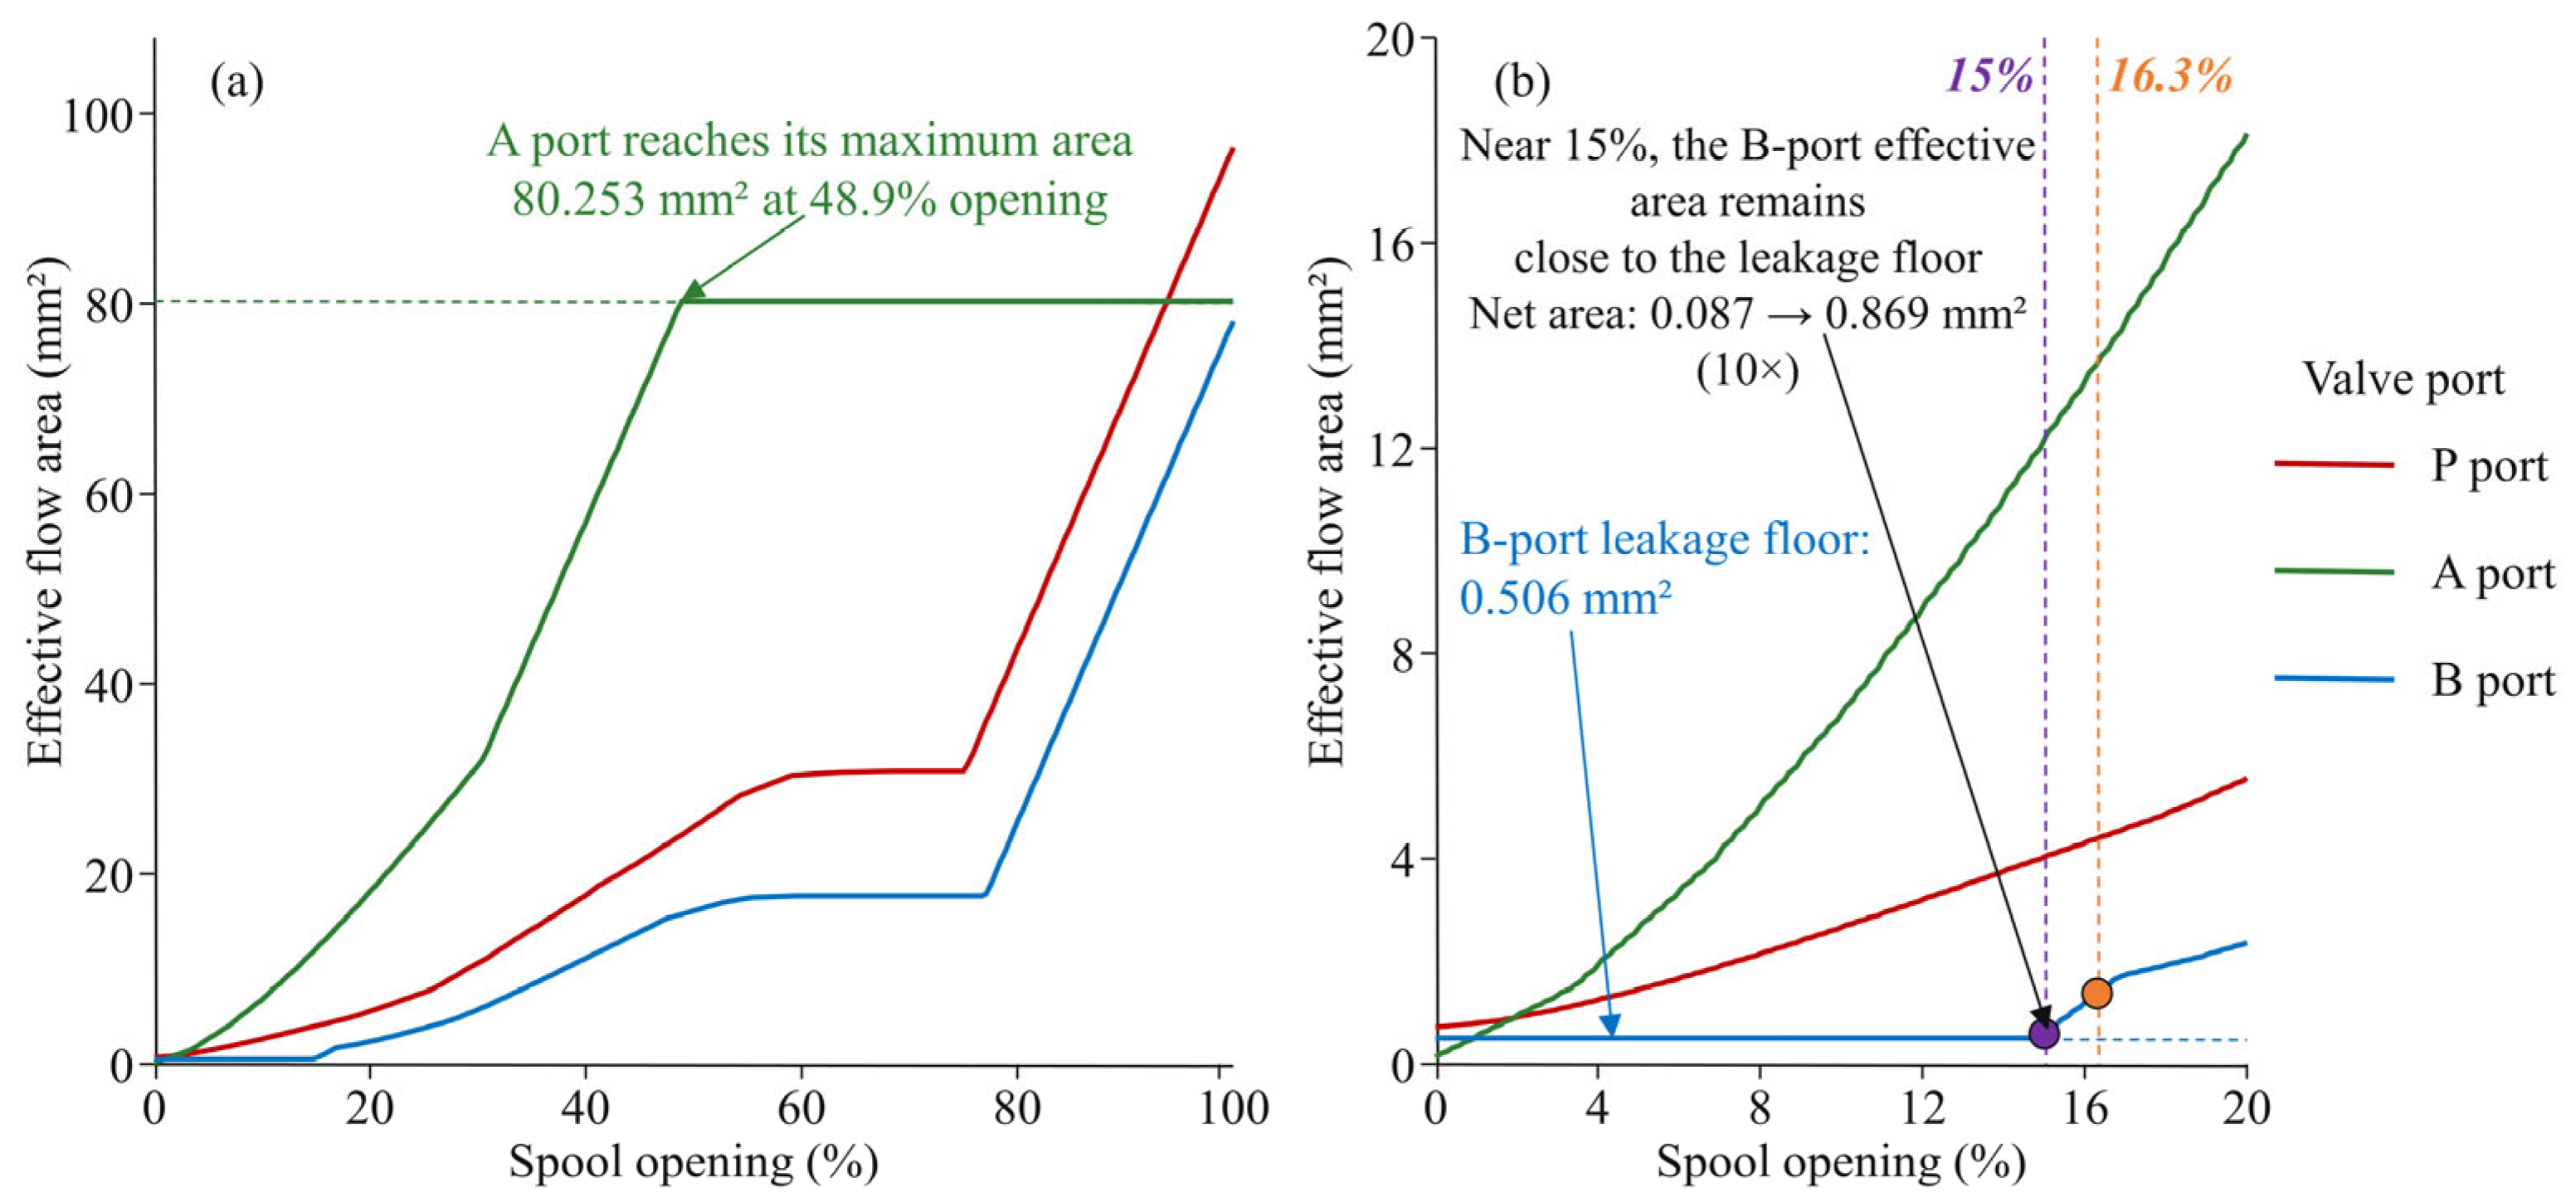
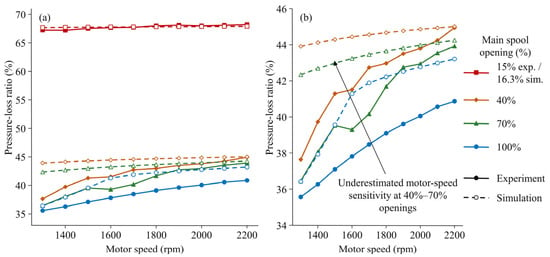
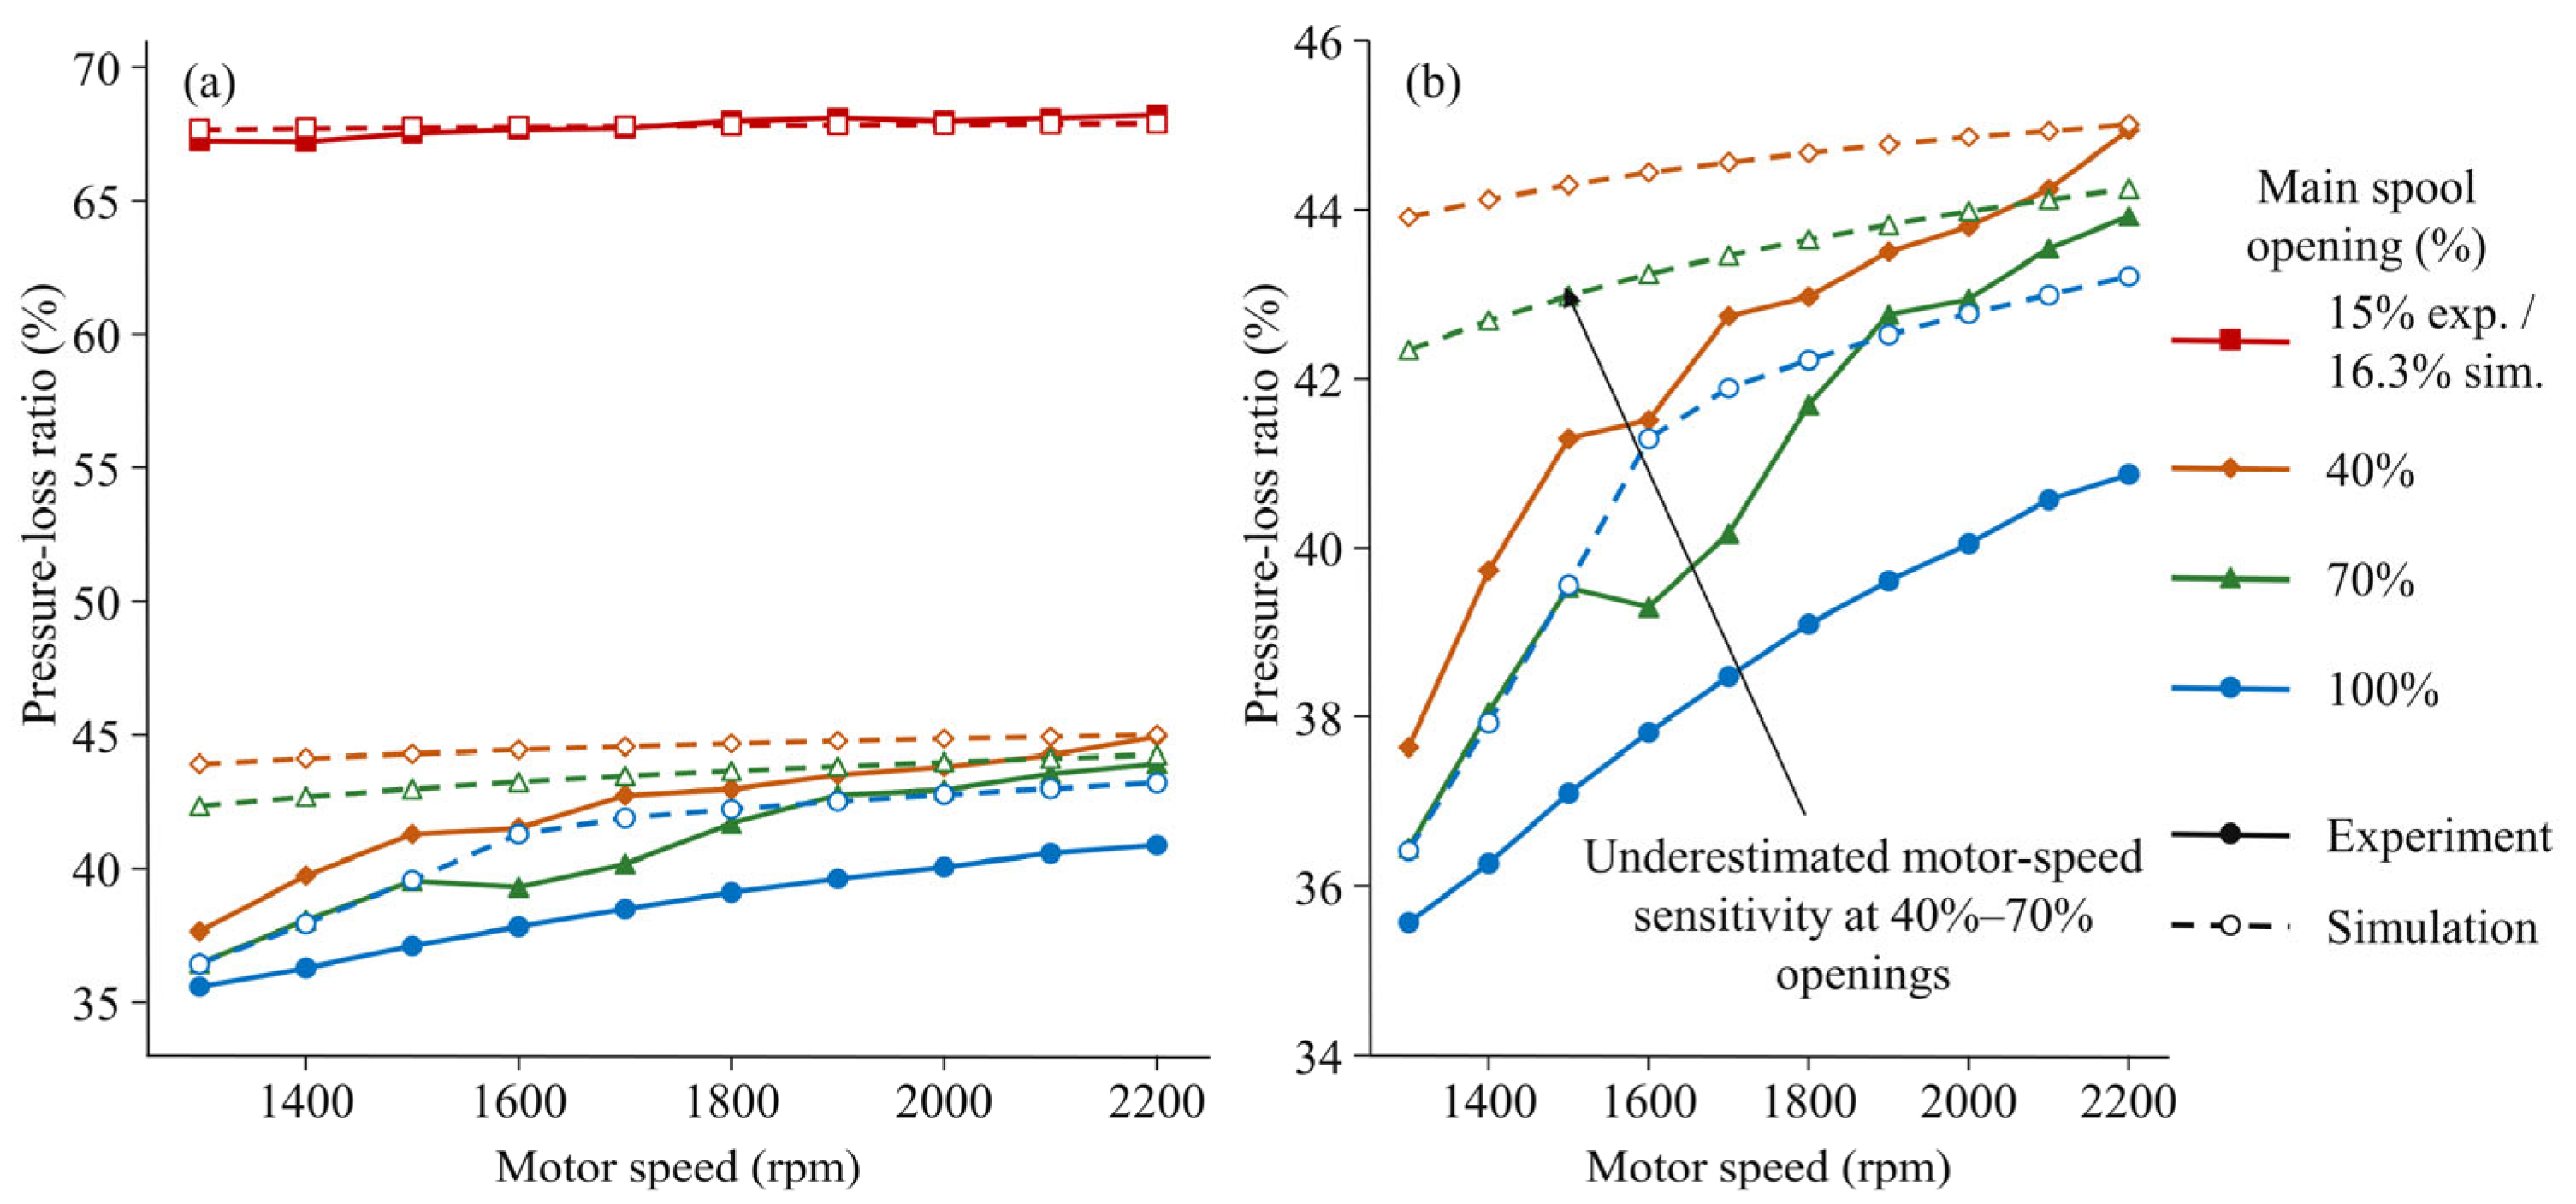
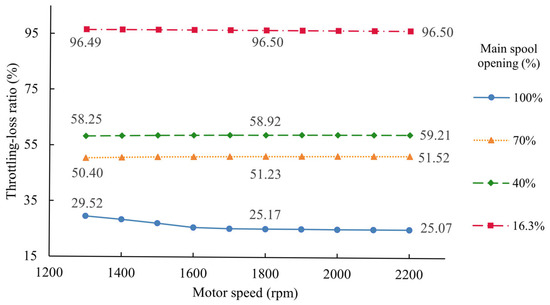
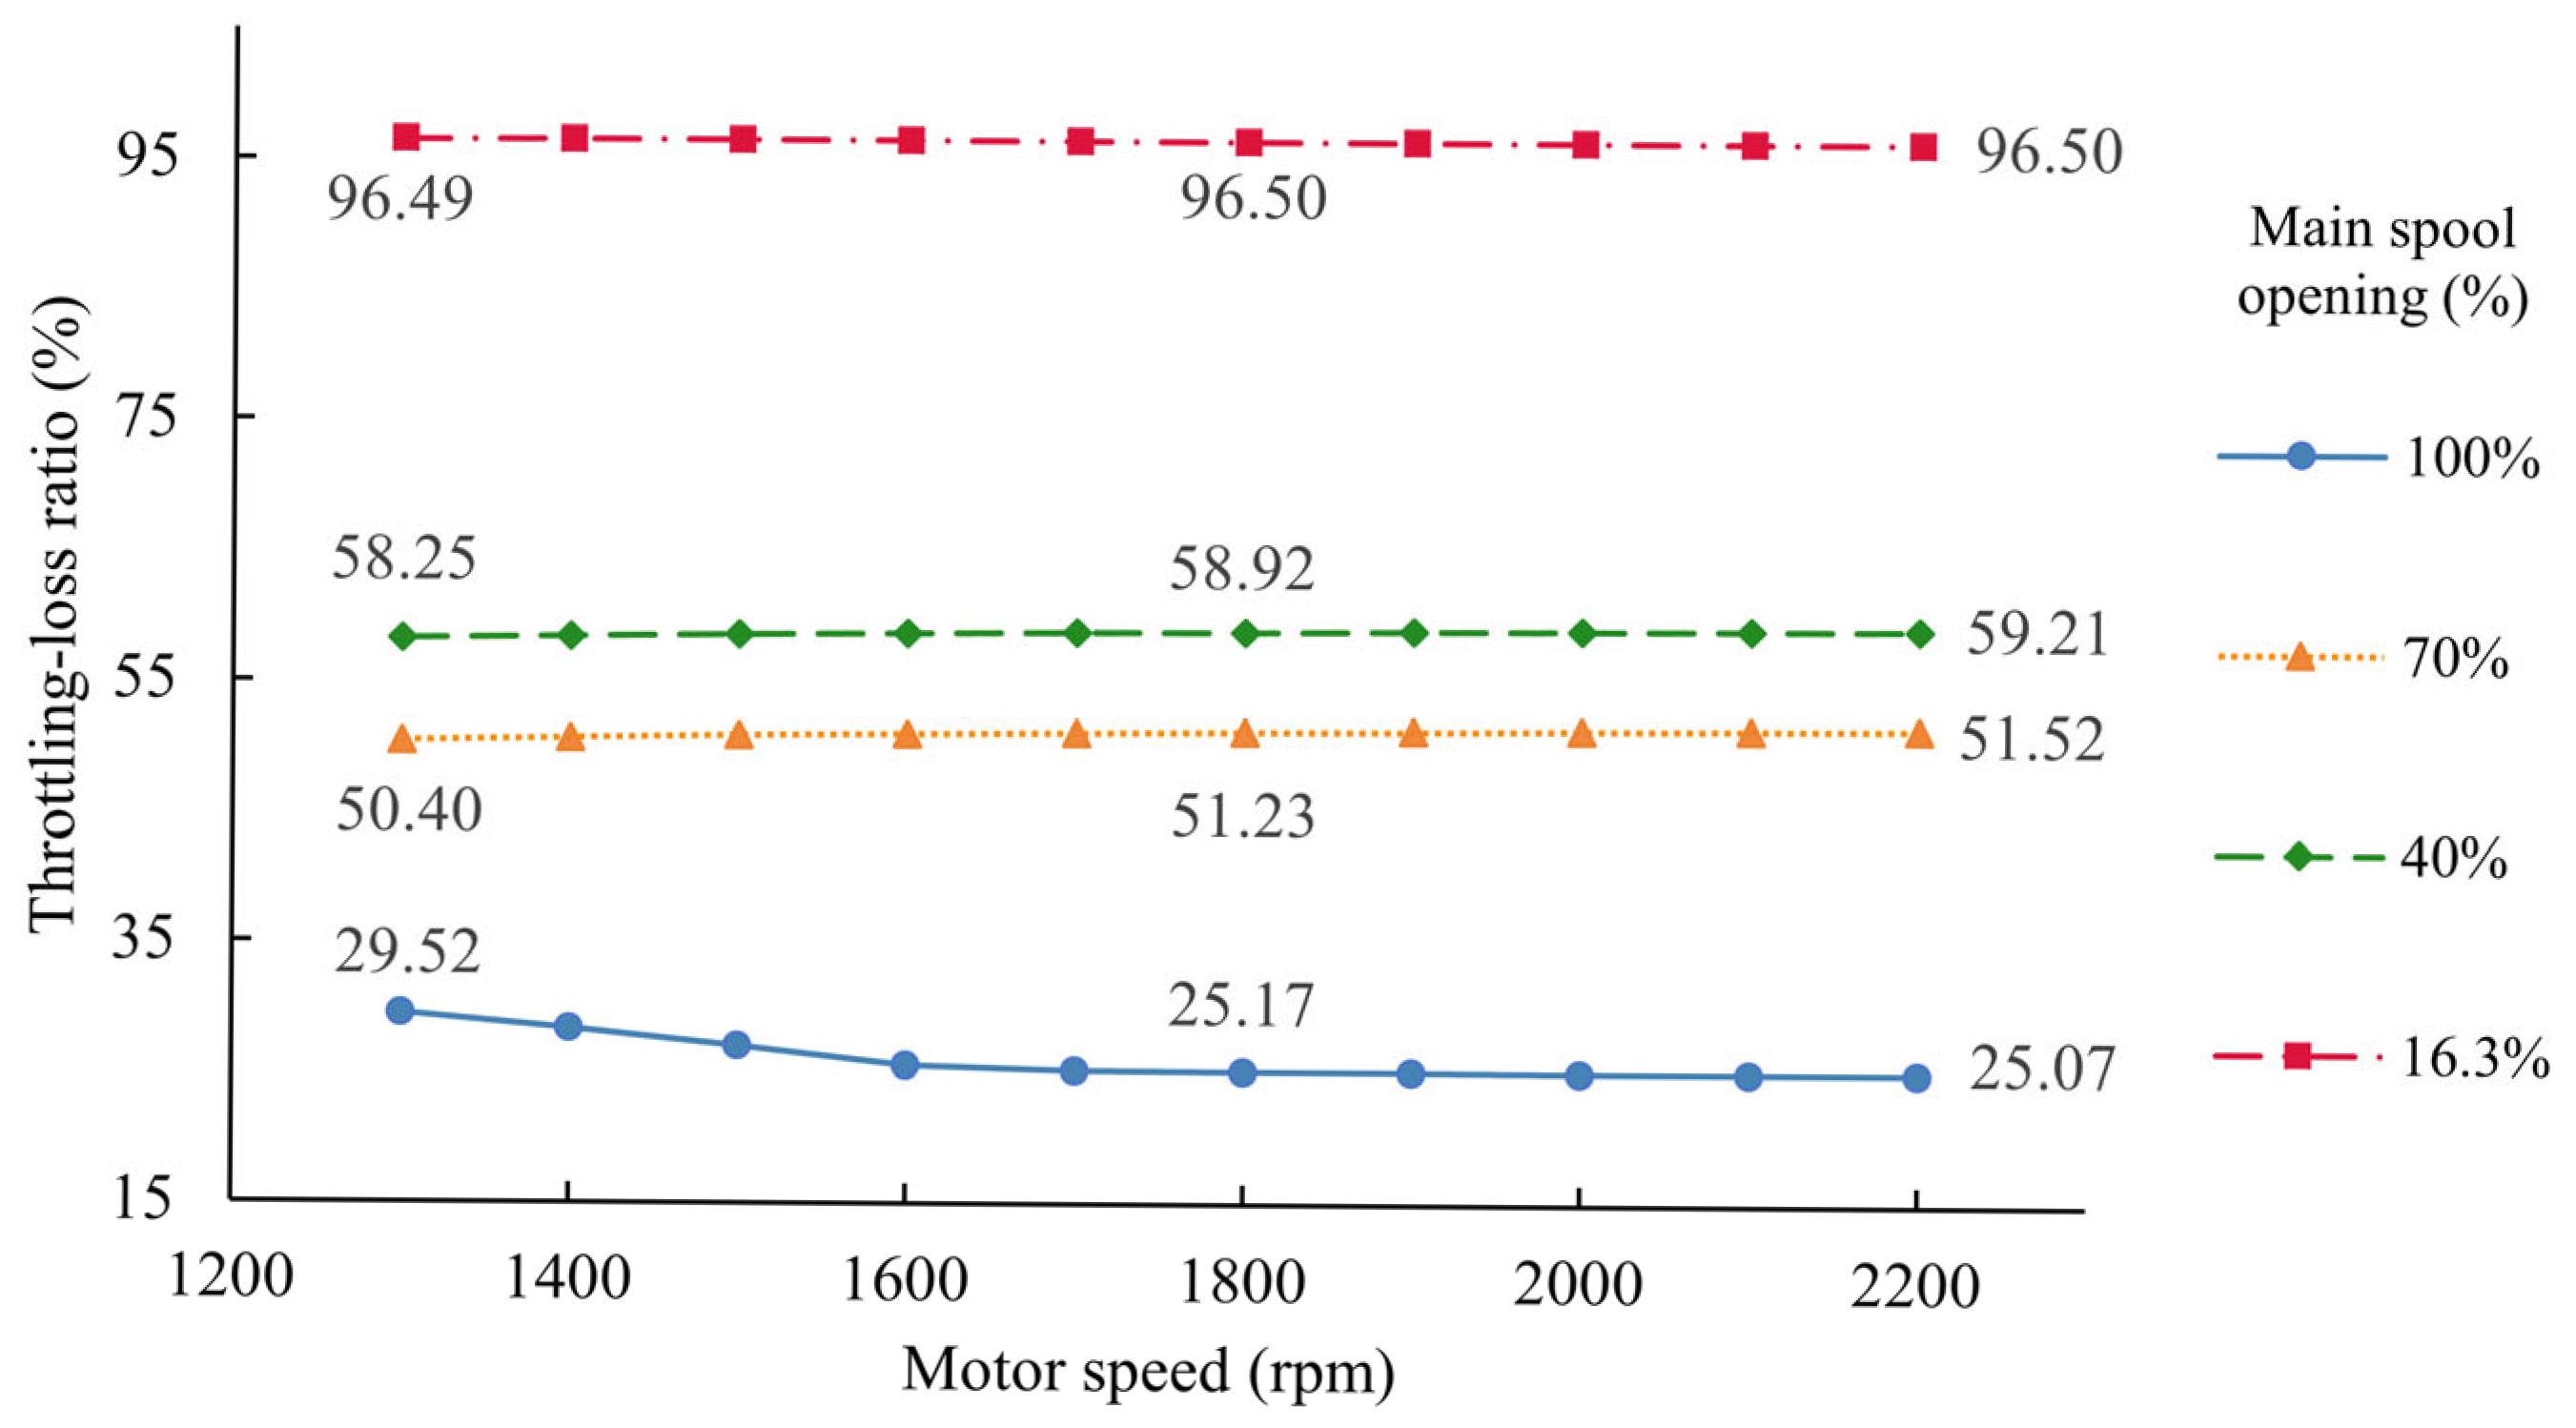

Disclaimer/Publisher’s Note: The statements, opinions and data contained in all publications are solely those of the individual author(s) and contributor(s) and not of MDPI and/or the editor(s). MDPI and/or the editor(s) disclaim responsibility for any injury to people or property resulting from any ideas, methods, instructions or products referred to in the content. |
© 2026 by the authors. Licensee MDPI, Basel, Switzerland. This article is an open access article distributed under the terms and conditions of the Creative Commons Attribution (CC BY) license.