


Abstract
This study addresses the challenge of the mechanical behavior of fractured rock masses in cold regions under freeze–thaw-fatigue coupling. Uniaxial step-incremental cyclic loading tests were conducted on double-cracked red sandstone subjected to different numbers of freeze–thaw cycles to reveal the damage evolution laws. Based on the variable-order fractional derivative theory, the traditional Nishihara model was improved by replacing the Abel dashpot in the viscoplastic component with a variable-order fractional dashpot, thereby establishing a fatigue deformation constitutive model that accounts for freeze–thaw damage. The novelty of the model lies in coupling the variable-order fractional viscoplastic element with stepwise cyclic loading equivalence, fatigue-threshold-controlled deformation, and freeze–thaw damage degradation, rather than merely replacing the dashpot in the classical Nishihara framework. The experimental results indicate that freeze–thaw cycles accelerate macroscopic damage of the rock mass. As the number of freeze–thaw cycles increases, the crack initiation stress, dilatancy stress, and peak stress decrease in a stepwise manner. The rock specimens exhibit significant softening characteristics, accompanied by intensified dilatancy, propagation of secondary cracks at the tips of pre-existing flaws, and a transition of the failure mode towards shear failure. By analyzing the mean stress versus axial deformation curves of the last two stages of cyclic loading, the fatigue threshold stress ratio of freeze–thaw damaged double-cracked sandstone was determined, confirming that freeze–thaw damage reduces the fatigue strength of the rock mass.
1. Introduction
Freeze–thaw damage of rock and soil is one of the key factors threatening the safety of railway engineering, tunnel construction, and slope protection in cold regions [1]. Zhang et al. [2] investigated the mesostructural damage and shear failure mechanism of tailings under freeze–thaw cycles. Lu et al. [3] analyzed the influence of anisotropy on the freeze–thaw mechanical properties of sandstone. Zhang et al. [4] proposed a statistical damage model to describe the deterioration of sandstone under freeze–thaw loading. Murton et al. [5], Zhang et al. [6], and Jia et al. [7] further confirmed that freeze–thaw cycles significantly reduce rock strength, elastic modulus, and deformation resistance. These studies provide important insights into freeze–thaw damage mechanisms, but most of them focus on intact materials or static loading conditions.
For fractured rock, pore-water freezing may induce frost-heave pressure around pre-existing fissures, promoting crack initiation, propagation, and mechanical degradation [8,9,10,11]. In cold-region engineering, rock masses are also subjected to cyclic disturbances induced by construction activities and traffic loads [12]. Therefore, constitutive models considering freeze–thaw damage are useful for quantitatively describing the long-term damage evolution of fractured rock [13,14,15,16]. Yang et al. [17] investigated the deformation field of granite after cyclic pre-damage under different confining pressures Xiao et al. [18] established fatigue damage models for rock under cyclic loading. Xu et al. [19] studied the effect of crack geometry on the cyclic mechanical behavior of red sandstone.
Recent studies have shown that freeze–thaw damage significantly affects the fatigue response of fractured sandstone. Shi et al. [20,21] reported that freeze–thaw damage accelerates fatigue fracture development and stiffness degradation. Liu et al. [22,23] showed that pore structure evolution, cyclic stress level, and crack propagation jointly control mechanical deterioration. Li and Huang [24] demonstrated that fissure geometry influences frost-heave damage, crack growth, and rheological behavior in fissured red sandstone. However, the coupled fatigue behavior of double-fissured sandstone under freeze–thaw and stepwise cyclic loading remains insufficiently understood [25,26]. In particular, existing studies are still limited in describing the progressive transition from initial compaction to stable strain accumulation and accelerated fatigue failure using a unified constitutive model.
To address this gap, this study conducts freeze–thaw cycle tests and uniaxial stepwise cyclic loading tests on double-fissured red sandstone. The objectives are to (1) reveal the degradation laws of peak stress, elastic modulus, crack initiation stress, and dilatancy stress under different freeze–thaw cycles; (2) clarify the influence of freeze–thaw damage on fatigue strength and failure modes; and (3) establish and verify a freeze–thaw-fatigue constitutive model based on variable-order fractional derivative theory. The proposed model decomposes cyclic loading into static and alternating components and introduces freeze–thaw damage into the constitutive equation, enabling the fatigue deformation evolution of damaged double-fissured sandstone to be described more effectively.
Unlike previous variable-order fractional Nishihara-type models, which mainly improve the rheological element, this study develops a fatigue-oriented constitutive framework for freeze–thaw damaged double-fissured sandstone under stepwise cyclic loading. Its novelty lies in three aspects: the variable fractional order is used to describe the transition from initial compaction and stable strain accumulation to accelerated fatigue failure; the cyclic load is decomposed into static and alternating components to describe both irreversible and dynamic strain responses; and freeze–thaw damage is introduced into the fatigue constitutive equation to reflect degradation under different freeze–thaw histories. Therefore, the proposed model is not only an extension of the Nishihara model, but a coupled freeze–thaw-fatigue constitutive model for fractured sandstone.
2. Experimental Materials and Methods
2.1. Specimen Preparation
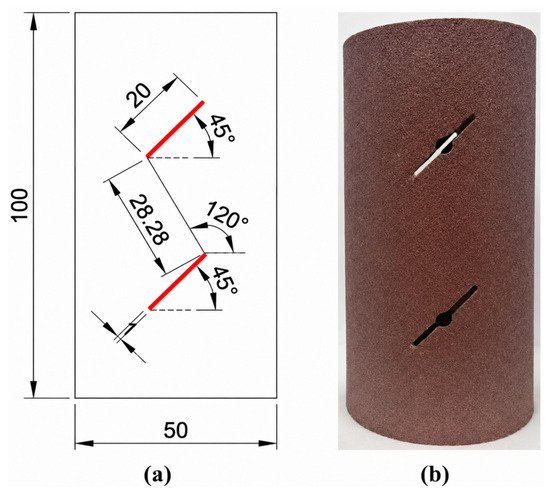
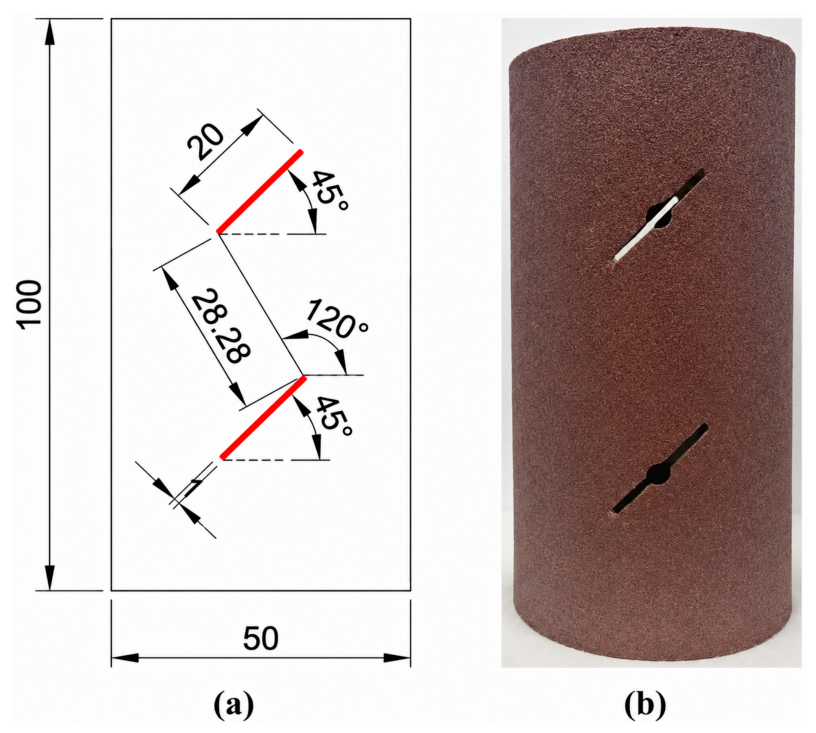
The red sandstone used in this study was collected from the same rock block to reduce material variability. The specimens were processed into standard cylinders with a diameter of 50 mm and a height of 100 mm. Before testing, the basic physical properties, including dry mass, saturated mass, natural water content, effective porosity, and P-wave velocity, were measured. The jointed rock mass was simulated by artificially prefabricating fissures. The fissure dip angle is 45°, fissure length is 20 mm, fissure width is 1 mm, rock bridge dip angle is 120°, and rock bridge length is 28.28 mm. The basic geometric parameters of rock specimens are shown in Figure 1. Before testing, all samples are tested for ultrasonic longitudinal wave velocity (2532–2858 m/s), and samples with abnormal wave velocity are removed to ensure specimen uniformity.
Figure 1.
Basic geometric parameters of the rock specimen. (a) Schematic of the rectangular cross-section. (b) Photograph of the specimen.
2.2. Test Method
Considering the inherent heterogeneity of natural rock materials, three replicate specimens were prepared for each testing condition to evaluate the repeatability of the mechanical response. Before testing, all specimens were screened based on ultrasonic longitudinal wave velocity, and specimens with abnormal wave velocity were excluded to reduce the influence of initial defects and improve specimen consistency. Although the number of specimens was limited due to the destructive nature and long duration of freeze–thaw cyclic loading tests, the repeated tests showed consistent deterioration trends in mechanical parameters with increasing freeze–thaw cycles. The specific steps are as follows:
(1) Measure physical indices such as mass, diameter, and height of rock samples in dry, natural, and saturated states.
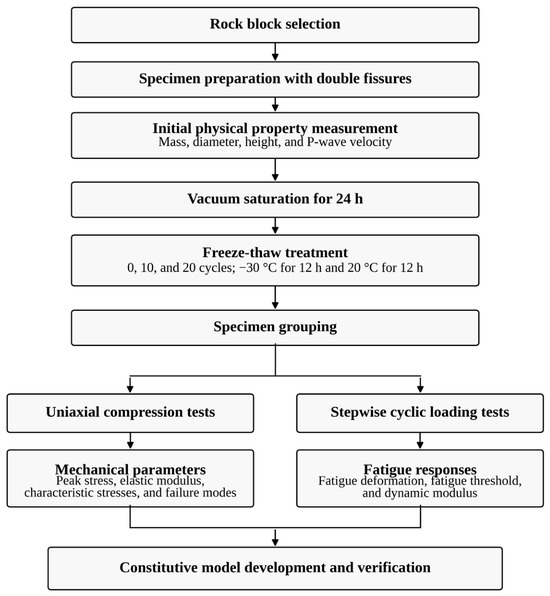
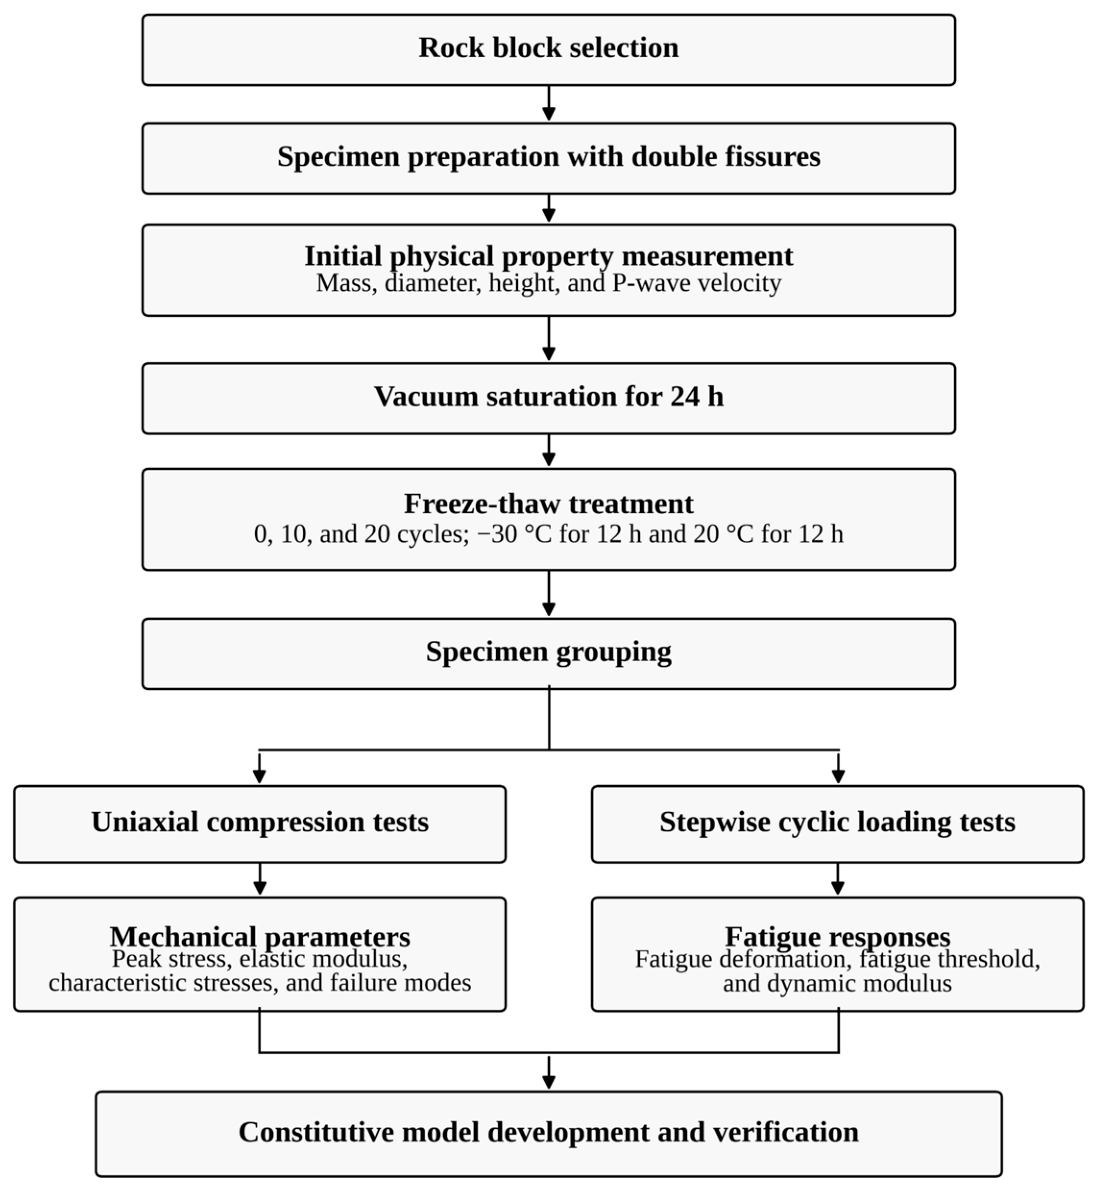
(2) Before freeze–thaw treatment, the specimens were vacuum saturated for 24 h. One freeze–thaw cycle consisted of freezing at −30 °C for 12 h and thawing at 20 °C for 12 h. The specimens were subjected to 0, 10, and 20 freeze–thaw cycles. After the designated number of cycles was completed, the specimens were taken out, wiped to remove surface water, and then used for subsequent uniaxial compression and cyclic loading tests.
(3) Uniaxial cyclic loading test: Graded cyclic loading fatigue failure tests were carried out on double-cracked sandstone after 0, 10, and 20 freeze–thaw cycles on a rock uniaxial dynamic testing system with a confining pressure of 0 MPa.
(4) Conventional uniaxial compression tests are conducted on rock samples after different freeze–thaw cycles. Double-cracked red sandstone is fixed on the loading pedestal, with axial and circumferential strain gauges installed. The whole test is controlled by strain at a rate of 0.001 mm/s (0.06 mm/min) until specimen failure. Mechanical indexes and failure laws of rock samples before and after freeze–thaw cycles are obtained to provide a control group for cyclic loading tests. The test grouping is shown in Table 1. The detailed procedure is shown in Figure 2.
Table 1.
Measured physical properties of double-cracked red sandstone under uniaxial compression before freeze–thaw cycles.
Figure 2.
Flowchart of the experimental procedure.
2.3. Macro-Meso Fracture Characteristics of Double-Cracked Red Sandstone Under Freeze–Thaw Cycles
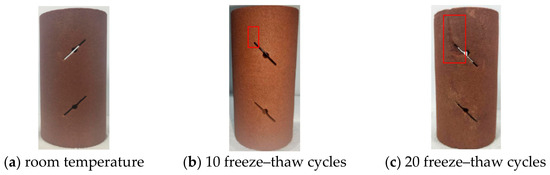
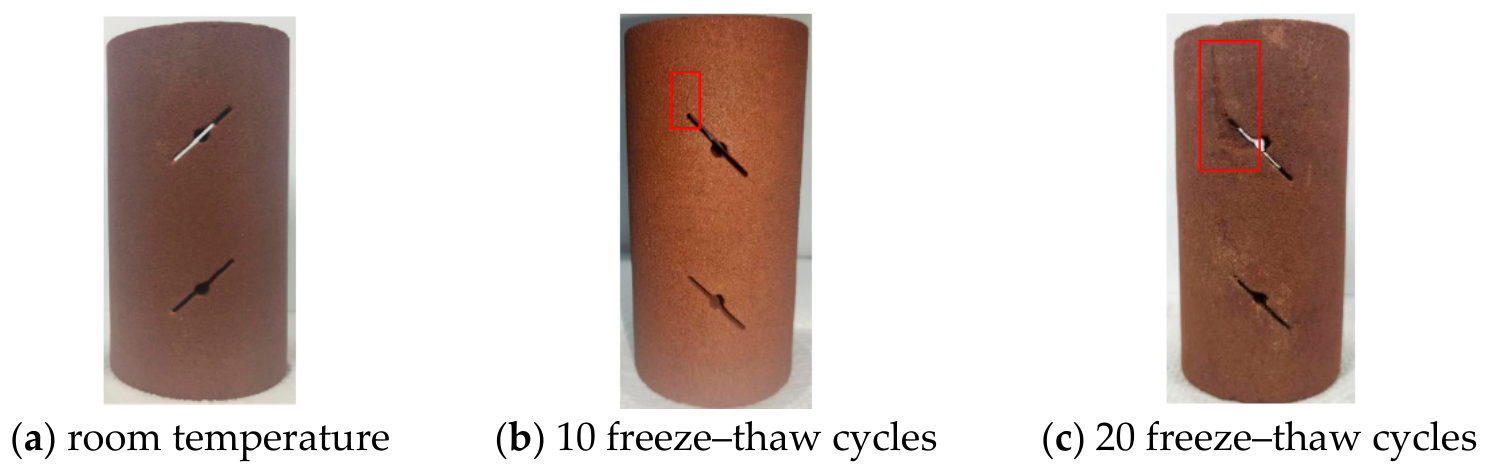
As shown in Figure 3, the freeze–thaw induced damage and failure mode of the double-cracked red sandstone specimens consistently develop from the surface towards the interior. From the unfrozen state to 10 freeze–thaw cycles, new micro-cracks at the tips of the pre-existing flaws become visible to the naked eye, but they appear only on the specimen surface and do not cause significant internal damage. However, spalling at the junction between the top and bottom surfaces and the cylindrical side surface is relatively severe. After 20 freeze–thaw cycles, macro-cracks have been generated at all four tips of the pre-existing flaws, with propagation directions generally along the inclination angle of the pre-existing flaws and the height direction of the specimen. The cracks propagate in a network-like pattern at stress concentration zones and structurally weak areas, and after the cracks interconnect, block spalling occurs on the surface.
Figure 3.
Surface conditions of double-cracked red sandstone after different freeze–thaw cycles.
3. Analysis of Test Results
3.1. Uniaxial Compressive Strength Characteristics of Double-Cracked Red Sandstone Under Different Freeze–Thaw Cycles
(1) Peak Stress and Peak Strain
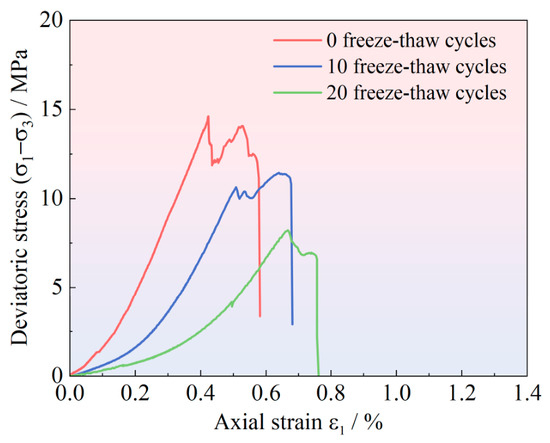
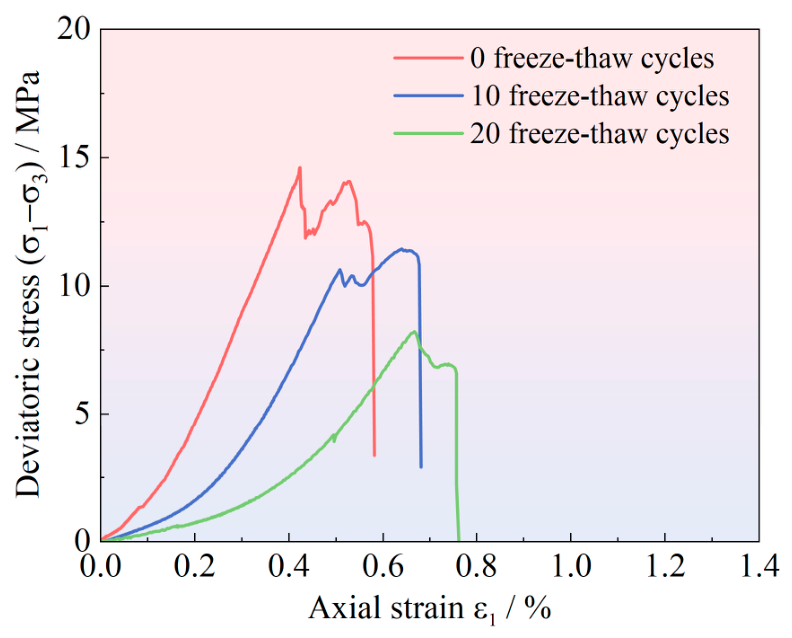
As shown in Figure 4, with an increasing number of freeze–thaw cycles, the peak stress of the double-cracked red sandstone exhibits a significant decreasing trend, while the axial peak strain shows an increasing trend. This indicates that freeze–thaw cycles not only significantly weaken the load-bearing capacity of the rock specimens but also enable them to undergo larger deformation prior to failure, i.e., the rock gradually transitions from brittle to ductile behavior, further confirming the deteriorating effect of freeze–thaw damage on the mechanical properties of red sandstone. The uniaxial compressive stress–strain curves provide parameters for the establishment of constitutive equations and particle flow simulation, as well as strength parameters of high-porosity soft red sandstone for rock mass engineering design in cold regions. The test results are listed in Table 2.
Figure 4.
Uniaxial compressive stress–strain curves of double-cracked red sandstone under different freeze–thaw cycles.
Table 2.
Mechanical properties of double-cracked red sandstone under uniaxial compression.
Table 2 shows that freeze–thaw cycles exert a significant deteriorating effect on the mechanical properties of red sandstone. With an increasing number of freeze–thaw cycles, microcracks within the rock specimen continuously initiate and propagate, resulting in a reduction in load-bearing capacity and a decrease in stiffness. Meanwhile, the continuous increase in Poisson’s ratio reflects an enhancement in the lateral deformation capacity of the specimen, indicating a weakening of brittle characteristics and a strengthening of plastic behavior. The increase in axial peak strain further demonstrates that freeze–thaw action gradually softens the rock and enhances its deformability. Therefore, the mechanical properties of double-cracked red sandstone under freeze–thaw cycles exhibit a certain regularity.
Based on Table 2 and Table 3, the degradation rates of peak stress and elastic modulus were calculated to quantitatively evaluate the freeze–thaw deterioration of double-fissured red sandstone. The peak stress decreased from 14.62 MPa before freeze–thaw treatment to 11.44 MPa and 8.22 MPa after 10 and 20 freeze–thaw cycles, corresponding to degradation rates of 21.75% and 43.78%, respectively. The elastic modulus decreased from 4.39 GPa to 3.65 GPa and 1.73 GPa, corresponding to degradation rates of 16.86% and 60.59%, respectively. These results indicate that the stiffness of double-fissured red sandstone is more sensitive to freeze–thaw damage than its peak strength, especially when the number of freeze–thaw cycles increases from 10 to 20.
Table 3.
Degradation rates of mechanical parameters of double-fissured red sandstone subjected to different freeze–thaw cycles.
Compared with published results for similar sandstone materials, the deterioration observed in this study is within a reasonable range but shows stronger stiffness degradation. Chen et al. [27] reported that the peak strength and elastic modulus of sandstone decreased by 7.28–37.96% and 6.38–40.87%, respectively, after freeze–thaw cycling. Lan et al. [28]. found that the uniaxial compressive strength of saturated red sandstone after 10, 30, 70, and 100 freeze–thaw cycles decreased to 0.68, 0.53, 0.26, and 0.17 of the initial value, respectively. Liu et al. [22]. reported that the peak strength of fractured sandstone under freeze–thaw and cyclic loading–unloading conditions decreased almost linearly from 49.95 MPa to 31.17 MPa after 80 freeze–thaw cycles, corresponding to a reduction of 37.6%. For filled fractured sandstone [29], the peak strength and elastic modulus reductions after 15 freeze–thaw cycles reached 56.19% and 62.45%, respectively, which are close to the degradation magnitude of the double-fissured red sandstone in the present study.
The relatively high degradation rate in this study can be attributed to the combined influence of freeze–thaw damage and prefabricated double fissures. Repeated water–ice phase transition promotes pore expansion and microcrack propagation, while the tips of the pre-existing fissures act as stress concentration zones. Therefore, freeze–thaw-induced microstructural deterioration is more likely to develop into connected cracks around the rock bridge, resulting in a rapid reduction in deformation resistance. This explains why the elastic modulus degradation after 20 freeze–thaw cycles is more pronounced than the peak stress degradation.
(2) Characteristic Stresses of Fracture for Double-cracked Sandstone
Characteristic stress parameters representing the rock fracture evolution process are obtained through uniaxial compression tests of double-cracked red sandstone, and the calculated results are summarized in Table 4. Crack initiation stress, as the boundary between elastic deformation stage and stable crack propagation stage in the stress–strain curve, marks the stress threshold for the initiation of internal microcracks. This parameter is important for predicting the fatigue strength threshold under cyclic loading. The ratio of dilatancy stress to peak stress reflects the evolution rate from volume dilatancy initiation to final failure: a larger ratio means the rock enters the irreversible dilatancy stage later, and the dilatancy initiation point is closer to the peak strength point. With the increase in freeze–thaw cycles, the absolute values of crack initiation stress and dilatancy stress decrease systematically, and their normalized stress levels also decrease synchronously. This shows that freeze–thaw damage significantly weakens the crack initiation resistance and dilatancy resistance of rock.
Table 4.
Characteristic stresses of double-cracked red sandstone under uniaxial compression.
3.2. Analysis of the Uniaxial Compressive Failure Behavior of Double-Cracked Red Sandstone Subjected to Varying Numbers of Freeze–Thaw Cycles
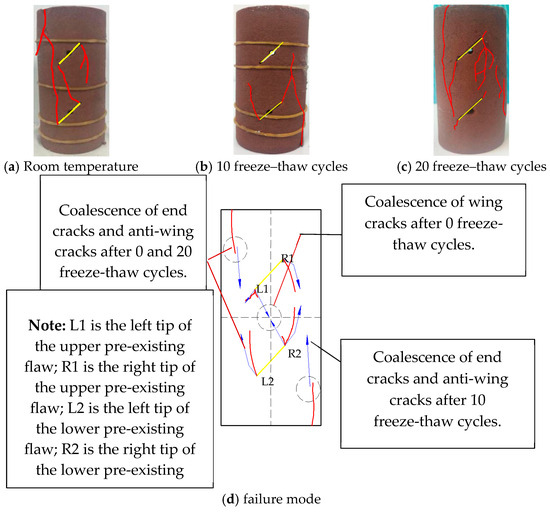
Figure 5 presents the uniaxial compression failure characteristics of double-cracked red sandstone subjected to different freeze–thaw cycles. A comparison between Figure 5a,d reveals that after 0 freeze–thaw cycles, the double-cracked red sandstone specimen under a confining pressure of 0 MPa develops two macroscopic fracture surfaces upon compressive failure. One fracture surface is formed by the coalescence of the wing crack originating from the upper pre-existing flaw L1 and that from the lower pre-existing flaw R2, propagating through the rock bridge. The second fracture surface results from the connection between the anti-wing crack at the tip of the lower pre-existing flaw and the end crack. The propagation direction of these cracks is nearly parallel to the height direction of the first fracture surface. Therefore, it can be inferred that the failure mode of the specimen is predominantly characterized by tensile splitting-induced fracture coalescence.
Figure 5.
Failure patterns of double-cracked red sandstone under uniaxial compression after different freeze–thaw cycles.
It is worth noting that under different numbers of freeze–thaw cycles, all rock specimens exhibit coalescence between anti-wing cracks and end cracks, with crack propagation consistently oriented along the height direction of the specimens. Therefore, under a confining pressure of 0 MPa, the failure mode of double-cracked red sandstone is dominated by tensile splitting, accompanied by significant dilatancy. However, after 10 freeze–thaw cycles, shear-type secondary cracks appear, indicating that freeze–thaw cycling tends to induce damage near the tips of the pre-existing flaws, and the resulting structurally weak planes are often coplanar with the pre-existing flaws. According to fracture mechanics theory, under a confining pressure of 0 MPa, the tips of the pre-existing flaws in the rock specimen first reach the ultimate tensile strength of the material, leading to the initiation of wing cracks. As the number of freeze–thaw cycles increases, the accumulated damage at the flaw tips results in the formation of both wing cracks and secondary cracks within the rock specimen even before loading. Upon stress redistribution, this explains why rock specimens subjected to more freeze–thaw cycles exhibit an increased number of secondary cracks upon crushing.
3.3. Mechanical Properties of Fatigue Strength of Double-Cracked Red Sandstone Subjected to Freeze–Thaw and Cyclic Loading
In this study, the axial compression is first loaded to a specified deviatoric stress level, followed by stepwise cyclic loading until fatigue failure of the rock specimen occurs. By comparing the peak strength obtained under static loading, the stress level at which fatigue failure takes place is determined, thereby allowing investigation of the deterioration law of the peak strength of double-cracked red sandstone under cyclic loading, as well as the relationship between the number of loading cycles and the degree of rock damage. Extensive experimental evidence has demonstrated that there exists a threshold value for fatigue failure of rock; below this threshold, fatigue failure does not occur. Therefore, the upper limit of cyclic stress is the dominant factor governing fatigue failure of rock, which constitutes the fundamental rationale for adopting the stepwise cyclic loading fatigue test scheme in this study.
Since a stepwise cyclic loading scheme was used, damage accumulated during earlier loading stages may influence the estimated fatigue threshold. Unlike constant-amplitude fatigue tests, the specimens in this study experienced several lower stress levels before failure. These stages may induce irreversible axial strain, microcrack development, and stiffness degradation, causing the estimated threshold to be slightly conservative. Therefore, the fatigue threshold obtained here should be regarded as an apparent threshold under stepwise cyclic loading rather than an absolute fatigue limit. However, because the same loading protocol was applied to all freeze–thaw conditions, the results remain valid for comparing the relative effect of freeze–thaw damage on fatigue resistance.
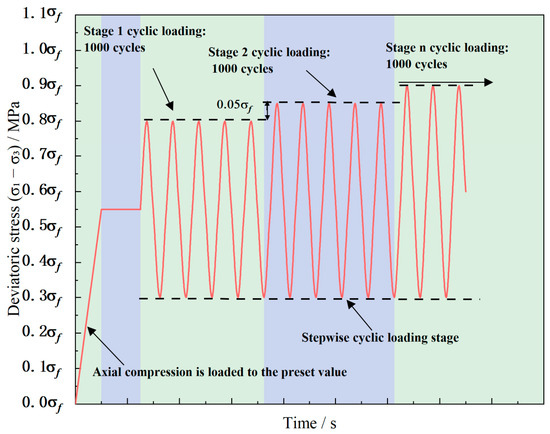
Based on previous similar experimental experience and the results of uniaxial compression tests, the upper limit load of the first stage in the test scheme was set as 0.8, and the lower limit load for each stage was set as 0.3, After every 1000 cycles, the upper limit stress in Test Scheme I was increased by 0.05, until the rock specimen failed during a certain cycle of a given stage. Throughout the entire test process, variations in longitudinal wave velocity were recorded. Figure 6 presents a schematic diagram of the stepwise cyclic loading process.
Figure 6.
Schematic of the stepped cyclic loading pattern.
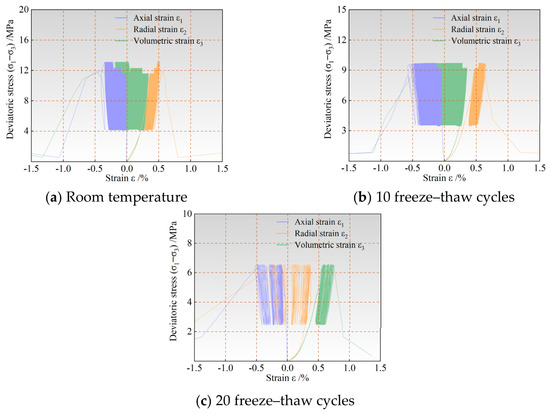
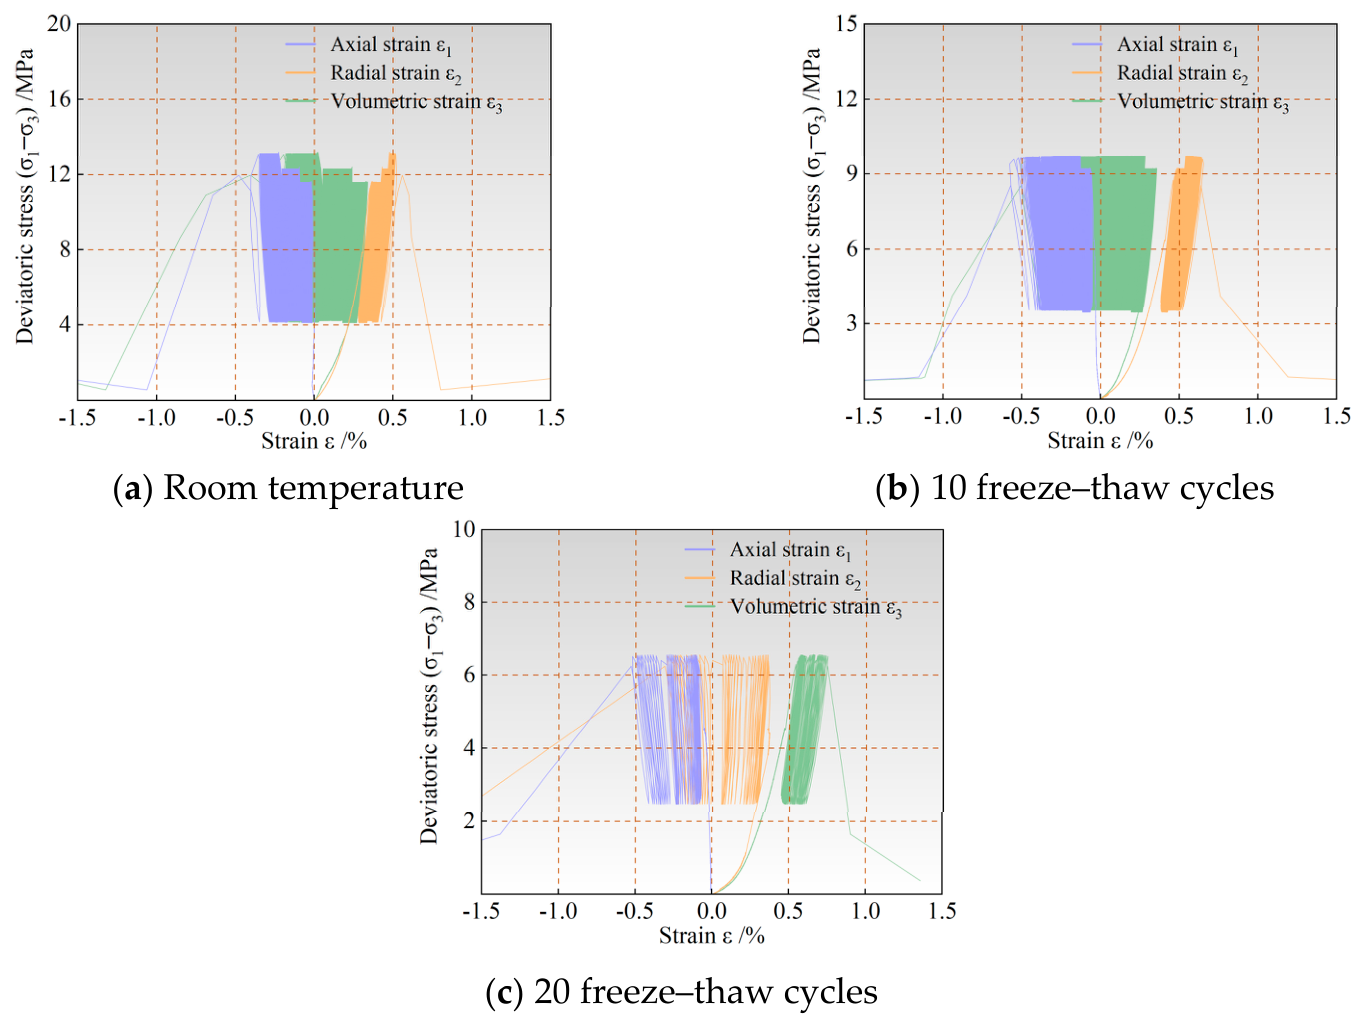
Table 5 presents the uniaxial stepwise cyclic loading test results of double-cracked red sandstone subjected to room temperature, 10 freeze–thaw cycles, and 20 freeze–thaw cycles using different stepwise loading schemes. Figure 7 shows the corresponding stress–strain curves.
Table 5.
Fatigue characteristics of double-cracked red sandstone under uniaxial stepped cyclic loading.
Figure 7.
Stress–strain curves of double-cracked red sandstone under uniaxial stepped cyclic loading.
In this study, the fatigue threshold stress ratio was determined based on the stepwise cyclic loading results. The upper stress ratio of each loading stage was defined as where is the upper limit stress of the cyclic loading stage and is the uniaxial compressive strength of the specimen under the same freeze–thaw condition. During the test, the lower stress ratio was kept at 0.30, while the upper stress ratio was increased step by step after every 1000 cycles until fatigue failure occurred.
The fatigue threshold was identified according to the deformation response of the last two loading stages. If the specimen completed 1000 cycles at a given upper stress ratio and the axial strain showed only stable or approximately linear accumulation, this stress level was regarded as being lower than the fatigue threshold. When the axial strain entered an accelerated accumulation stage and the specimen failed before completing 1000 cycles, the corresponding upper stress ratio was regarded as higher than the fatigue threshold. Therefore, the fatigue threshold stress ratio was considered to lie between the last non-failure stress level and the failure stress level. For quantitative comparison, the midpoint of this interval was used as the apparent fatigue threshold stress ratio.
Analysis of Figure 7 reveals that the cyclic loading test can be divided into three stages: the initial deformation stage, the constant-rate deformation stage, and the accelerated deformation stage. The initial deformation stage corresponds to the first cycle of each stress level. During this stage, the deviatoric stress increases abruptly, resulting in a relatively large hysteresis loop area, indicating that the first cycle induces significant deformation of the rock specimen and consumes a considerable amount of energy. In the constant-rate deformation stage, the deformation of the rock specimen is relatively stable, the hysteresis loop area is small, and the overlapping area between successive hysteresis loops is large, indicating that the irreversible deformation of the specimen increases slowly with the number of cycles. In the accelerated deformation stage, as the number of cycles increases, the area of the hysteresis loop enlarges and the spacing between successive hysteresis loops becomes looser, indicating that the rate of increase in irreversible deformation of the rock specimen grows rapidly with the number of cycles, and the energy consumed gradually increases. When the irreversible deformation reaches the limit deformation, the rock ultimately undergoes fatigue failure. The characteristics of the stress–strain curves for different stepwise loading schemes are essentially consistent.
3.4. Deformation Characteristics Analysis of Double-Cracked Red Sandstone Subjected to Uniaxial Cyclic Loading Under Varying Freeze–Thaw Cycles
Ge et al. [30], borrowing the concept of creep, classified the development of irreversible axial deformation throughout the entire fatigue process of rock. The axial deformation development curve of rock is categorized as type a, type b, or type c. For type a, the deformation first increases, and after a certain number of cycles, the deformation no longer increases with further cycles or increases extremely slowly; under such conditions, fatigue failure may not occur. When the upper limit stress is slightly higher than the fatigue strength threshold, the axial deformation development curve becomes type b. The three-stage development law of the type b curve is generally applicable and is commonly observed in fatigue tests. When the upper limit stress approaches the peak strength determined from compression tests, the axial deformation development curve becomes type c; in this case, the rock fails after experiencing very few cycles, a phenomenon typically seen in brittle rocks subjected to high upper limit stress levels.
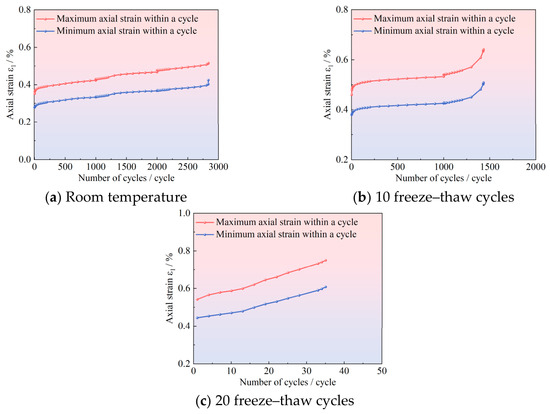
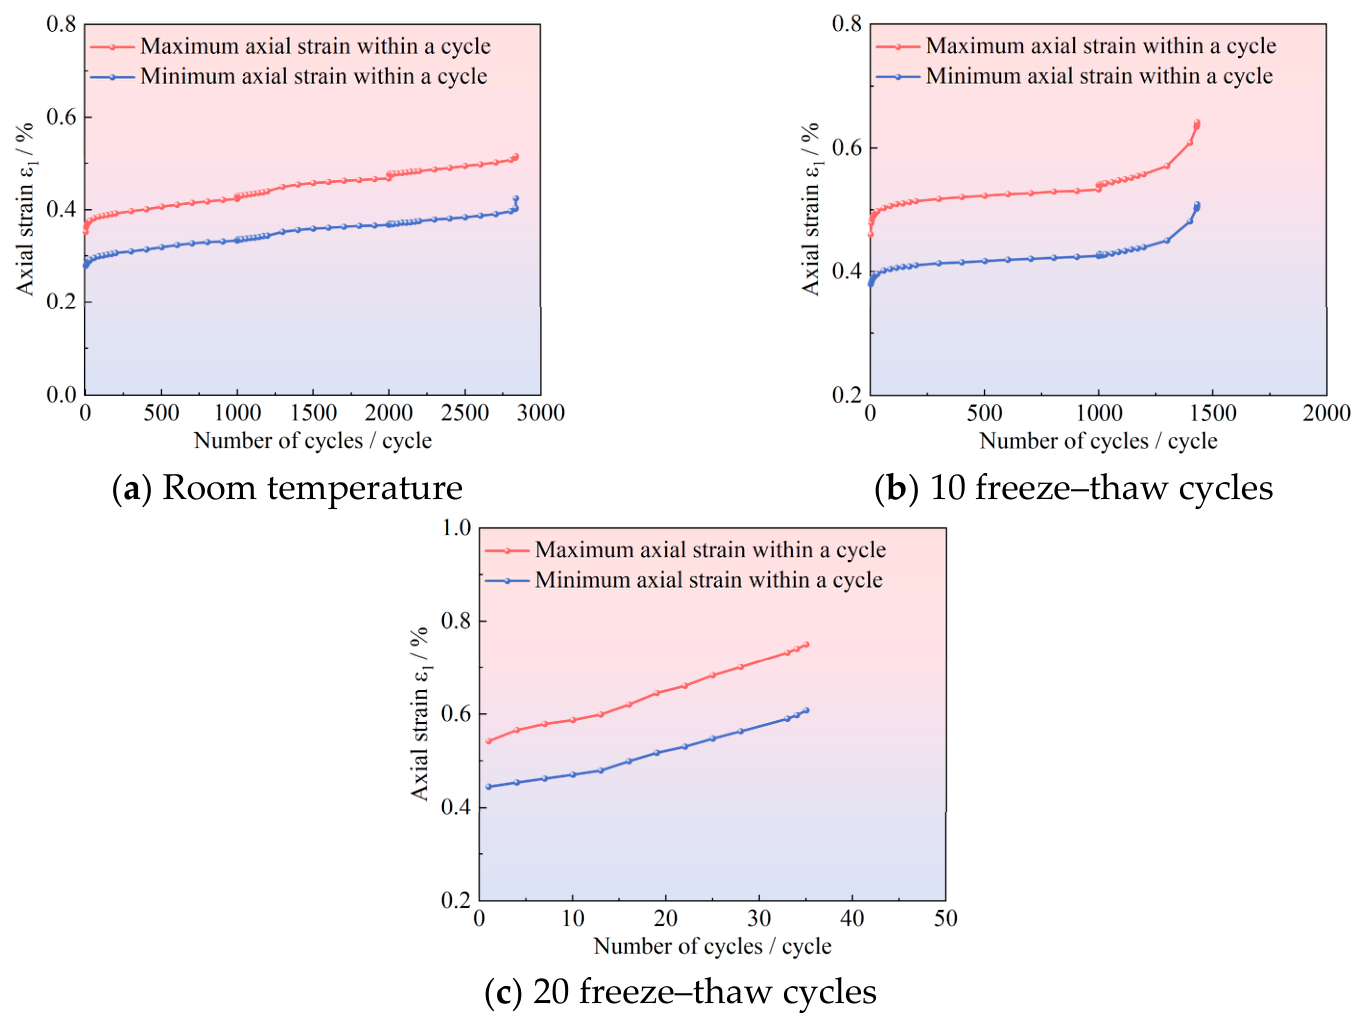
From the stress–strain curves of the cyclic loading tests, it can be observed that the radial strain of the rock specimen is significantly influenced by factors such as lithology and the data acquisition of the testing apparatus. In contrast, the axial strain values exhibit relatively low dispersion, and the curves can effectively reflect the various stages of fatigue failure in the rock specimen. Therefore, this study focuses on using axial strain as an indicator for evaluating the stability of fractured rock masses. Figure 8 presents the curves of maximum (and minimum) axial strain as a function of the number of cycles for double-cracked red sandstone under cyclic loading at room temperature, after 10 freeze–thaw cycles, and after 20 freeze–thaw cycles.
Figure 8.
Evolution of axial strain with cycle number for double-cracked red sandstone under uniaxial stepped cyclic loading after freeze–thaw cycles.
As shown in Figure 8, the axial strain of the rock specimen increases notably during the first 100 cycles of the first-stage cyclic loading. After 100 cycles, the axial deformation increases at an approximately linear rate. Subsequently, with each increase in stress level, the deformation of the rock specimen first increases abruptly and then continues to increase linearly, until the final stage, when it enters the accelerated phase at the 500th cycle and reaches the failure point at the 837th cycle. This indicates that before freeze–thaw, under a stress level of 80%, the axial deformation development curve is of type b; if the number of cycles was increased, failure could occur at the 80% stress level.
Using the same method to analyze Figure 8b,c, the axial deformation development curves after 10 to 20 freeze–thaw cycles exhibit a combination of types b and c, or are purely type c. As the number of freeze–thaw cycles increases, the proportion of the linear increase segment in the curve gradually decreases. With increasing freeze–thaw cycles, the transition between fatigue deformation stages becomes faster. This is mainly because freeze–thaw damage weakens the cementation between mineral particles and promotes the development of initial microcracks around the pre-existing fissures. During cyclic loading, these defects are first compacted, then gradually propagate, and finally rapidly coalesce when the accumulated damage reaches a critical level. Therefore, the stable deformation stage becomes shorter, and the specimen enters the accelerated deformation stage earlier. Therefore, for fractured rock mass engineering in cold regions, monitoring the axial deformation characteristics and evolution patterns at different locations of the rock mass can enable more scientific prediction and forecasting of the time and location of instability and failure.
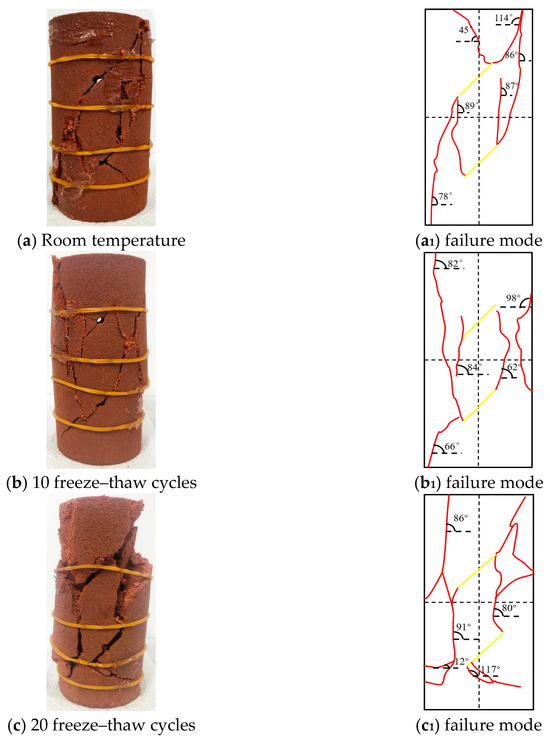
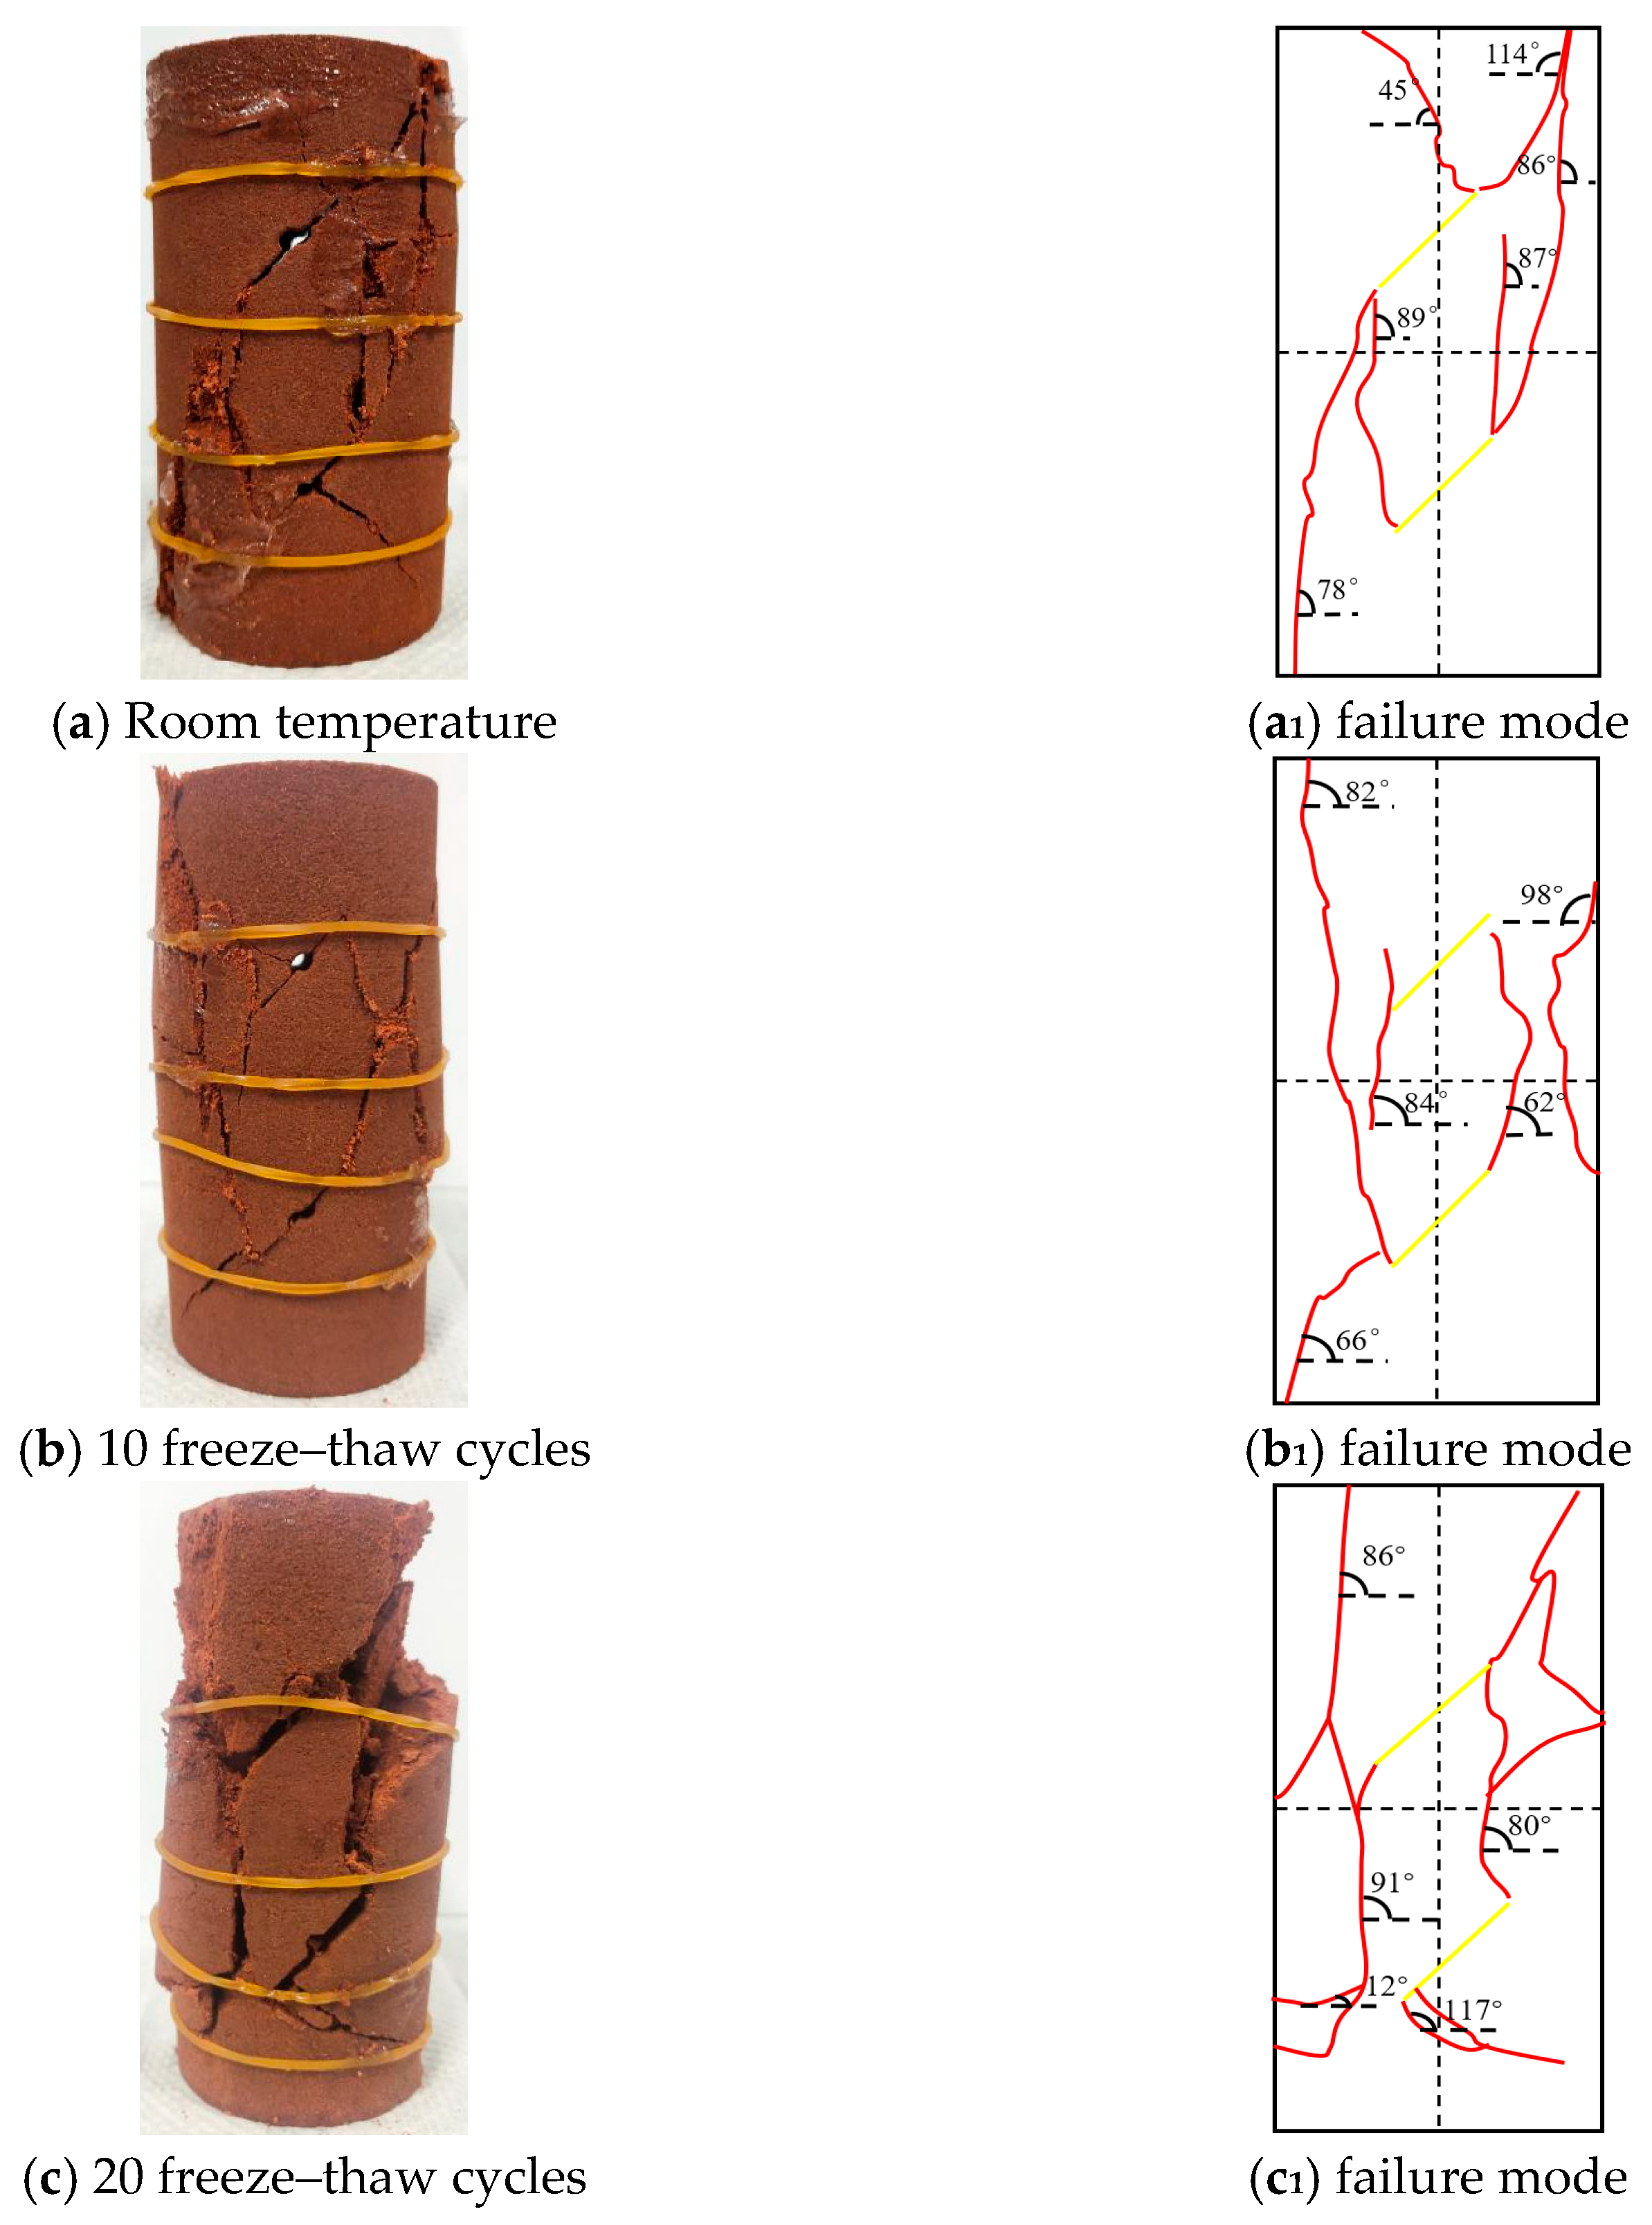
Figure 9 presents the failure conditions of double-cracked red sandstone subjected to stepwise cyclic loading tests after freeze–thaw.
Figure 9.
Failure patterns of double-cracked red sandstone under cyclic loading tests with different freeze–thaw cycles.
MATLAB R2021a software (version 9.10; The MathWorks Inc., Natick, MA, USA) was used to binarize the failure images and extract crack parameters, as summarized in Table 6.
Table 6.
Image-based quantitative fracture parameters of double-fissured red sandstone after different freeze–thaw cycles.
As the number of freeze–thaw cycles increases, the crack number, total crack length, maximum crack length, crack area ratio, and crack density all show an increasing trend. The total crack length increases from approximately 145 mm at 0 freeze–thaw cycles to 215 mm at 20 freeze–thaw cycles, while the crack area ratio increases from 3.4% to 8.6%. This indicates that freeze–thaw damage promotes the initiation, propagation, and coalescence of cracks in double-fissured red sandstone.
3.5. Analysis of Dynamic Elastic Modulus Variation in Double-Cracked Red Sandstone Subjected to Freeze–Thaw and Cyclic Loading
The formula for calculating the dynamic elastic modulus is shown in Equation (1).
where and are the maximum and minimum axial deviatoric stresses of a given hysteresis loop in the cyclic loading test, respectively, and are the maximum and minimum axial deviatoric strains of a given hysteresis loop in the cyclic loading test, respectively.
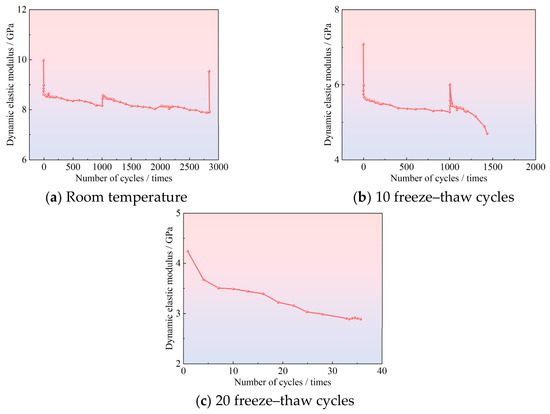
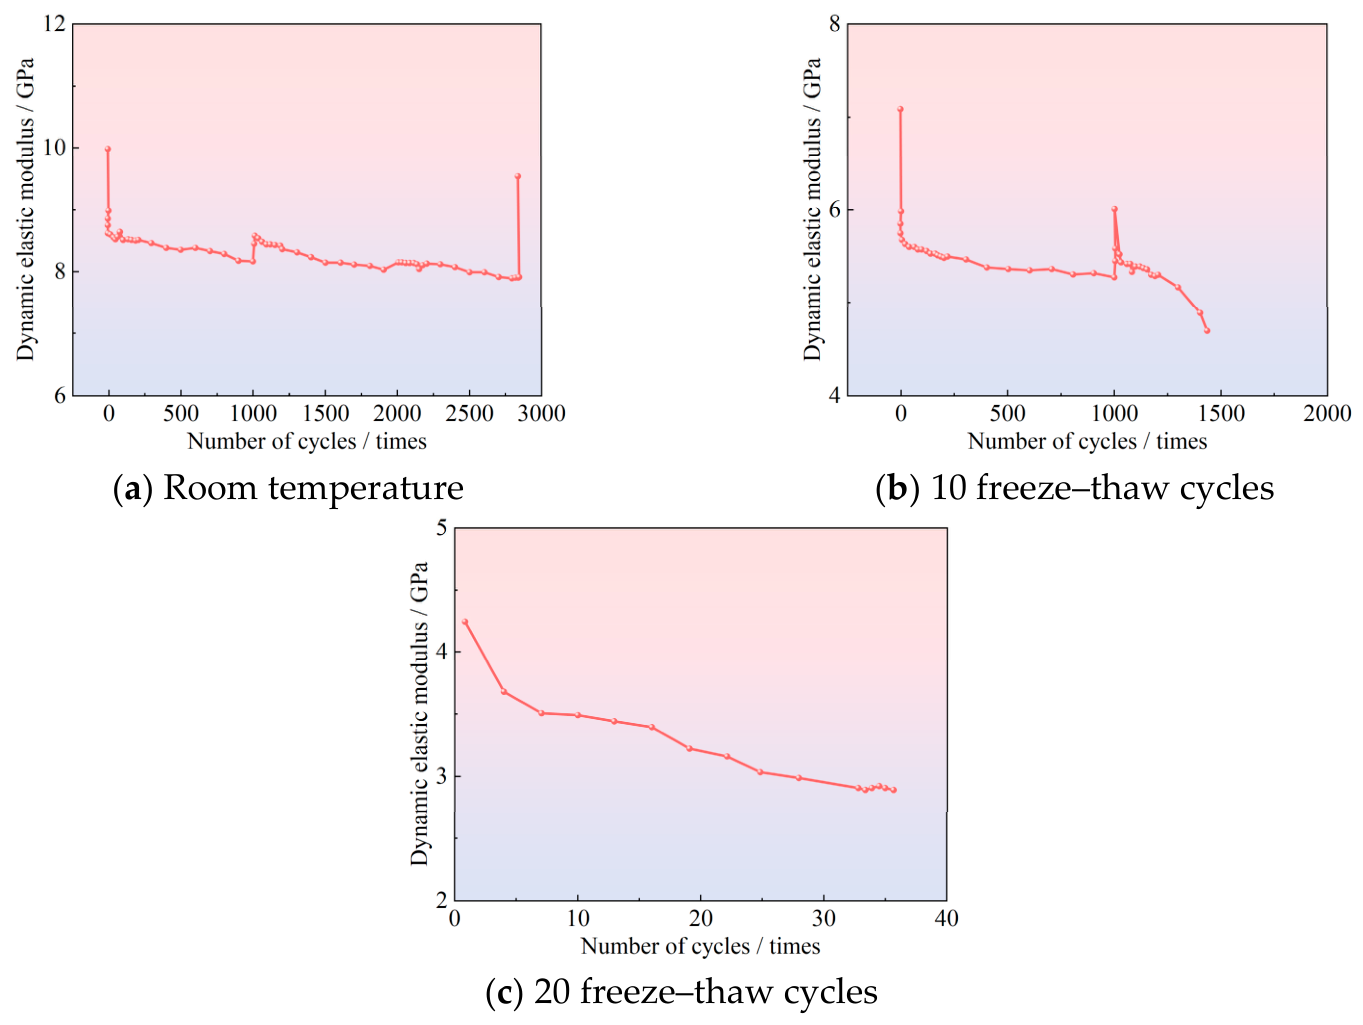
As shown in Figure 10, the dynamic elastic modulus is generally higher than the static elastic modulus, which may be related to the relatively high loading rate during cyclic loading. However, the decreasing trend of dynamic elastic modulus with increasing cycle number and freeze–thaw cycles is mainly attributed to the progressive accumulation of internal damage, including pore compaction, microcrack propagation, and degradation of interparticle cementation. Although some fluctuations exist in the numerical values, the overall trend of the dynamic elastic modulus gradually decreases with an increasing number of loading–unloading cycles in the cyclic loading test. This indicates that prolonged cyclic loading can cause cumulative damage to the rock specimen, crack development, and degradation of its mechanical properties. The observed numerical fluctuations may be attributed to factors such as the repeated compaction of internal pores and fissures within the rock due to cyclic loading and unloading. As the number of freeze–thaw cycles increases, the dynamic elastic modulus decreases, indicating that after freeze–thaw, internal cracks develop within the rock specimen, cohesion is reduced, and its capacity to withstand cyclic loading diminishes.
Figure 10.
Dynamic elastic modulus versus cycle number curves for double-cracked red sandstone under graded cyclic loading tests with different freeze–thaw cycles.
4. Fatigue Constitutive Model of Double-Cracked Red Sandstone Under Freeze–Thaw and Cyclic Loading
4.1. Establishment of the Nonlinear Creep Constitutive Model Prior to Equivalence to Cyclic Loading
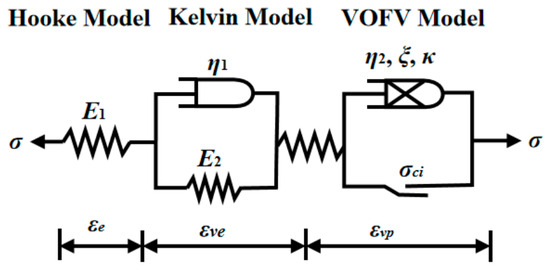
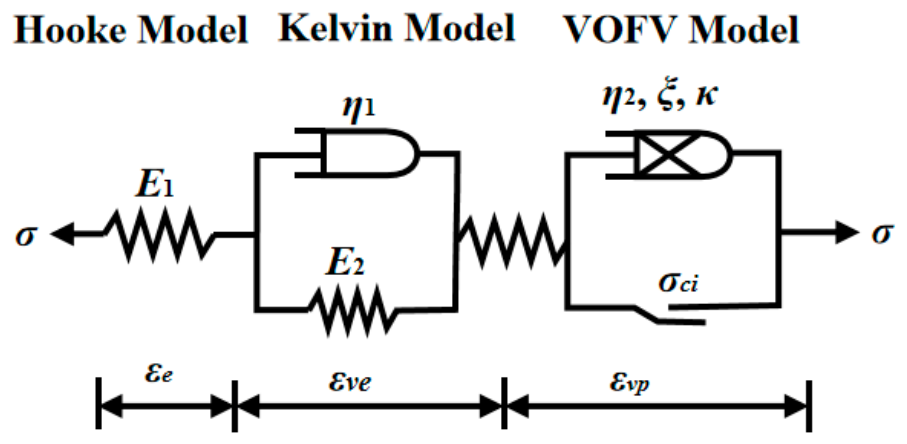
Compared with the Abel dashpot model, Han et al. [31] argued that the variable-order fractional dashpot can more accurately describe the relationship between the viscosity coefficient and the variation in the fractional order, and the deformation rate of the model is more consistent with the characteristics of dynamic changes, as shown in Figure 11.
Figure 11.
Schematic representation of the nonlinear creep constitutive model prior to equivalence to cyclic loading.
Previous variable-order fractional Nishihara-type models mainly improve the description of nonlinear creep by introducing a fractional dashpot whose order varies with time or deformation state. These models are effective for describing nonlinear rheological behavior, but they are usually established under monotonic or creep loading conditions and do not explicitly consider the coupled effects of freeze–thaw deterioration, pre-existing fissures, and stepwise cyclic fatigue loading. In the present study, the Nishihara framework is retained as the mechanical basis because it can represent elastic, viscoelastic, and viscoplastic deformation components. However, the methodological contribution is not limited to replacing the Abel dashpot with a variable-order fractional dashpot. The model is further reformulated for cyclic loading by decomposing the cyclic stress into static and alternating components, deriving the corresponding storage and loss compliance, and introducing freeze–thaw damage into the fatigue constitutive equation. This enables the model to characterize the progressive fatigue deformation of double-fissured sandstone after different freeze–thaw cycles. The variable fractional order in the proposed model is regarded as a phenomenological parameter reflecting the evolution of internal damage rather than only a mathematical fitting coefficient. From a microstructural perspective, freeze–thaw cycles promote pore expansion and microcrack development, especially near the tips of pre-existing fissures. During the initial stage of cyclic loading, crack closure and compaction dominate, and the fractional order changes slowly, corresponding to a relatively stable viscoelastic response. With increasing loading cycles, microcracks gradually initiate and propagate, leading to enhanced irreversible deformation and energy dissipation; accordingly, the evolution of the fractional order reflects the transition from stable strain accumulation to progressive damage growth. In the accelerated deformation stage, crack coalescence and rock-bridge deterioration become dominant, and the rapid change in the fractional order represents the transformation from stable damage accumulation to unstable fatigue failure.
The Nishihara model [32,33] can originally be regarded as a series combination of three components: a Hooke elastic body, a Kelvin viscoelastic body, and a variable-order fractional viscoplastic body. On this basis, the Adel dashpot used in the third part (viscoplastic part) of the original Nishihara model was replaced by a variable-order fractional dashpot, thereby constructing a nonlinear creep constitutive model under one-dimensional stress conditions. This replacement enables the model to more flexibly describe the evolution characteristics of the creep rate of materials at different times or strain stages, enhancing its ability to describe the entire complex creep process (especially the accelerated creep stage). Overall, the modified model still retains the series structure of the Nishihara model, but by introducing the variable-order fractional dashpot, the viscoplastic response exhibits fractional derivative characteristics whose order varies with the state, thereby better fitting the mechanical behavior of actual geomaterials, coal rock, salt rock, and other materials in nonlinear creep.
where is the total strain; is the pure elastic strain; is the viscoelastic strain; is the viscoplastic strain; is the total stress; is the elastic modulus of the Hooke elastic body; is the elastic modulus of the Kelvin viscoelastic body; is the viscosity coefficient of the Kelvin viscoelastic body; is the total creep time; is the viscosity coefficient of the variable-order fractional viscoplastic body; is the critical time marking the transition from the viscoelastic stage (steady-state creep stage) to the viscoplastic stage (accelerated creep stage); is the critical time marking the transition from the viscoplastic stage (accelerated creep stage) to final failure; is the value of corresponding to time , i.e., the order of the fractional derivative; is the dashpot variable of the variable-order fractional viscoplastic body; and is the Mittag-Leffler function.
4.2. Establishment of a Fatigue Constitutive Model Under Freeze–Thaw and Cyclic Loading
A cyclic load can be equivalently decomposed into a static load and an alternating load, and its expression is as follows:
where and are the upper and lower limit stresses of the cyclic load, is the angular frequency, with ; is the cyclic loading frequency, which is 1 Hz in this paper, and . The static load is given by , and the alternating load is given by .
According to the cyclic load decomposition method in Equation (3), the strain of red sandstone under cyclic loading can be decomposed into static strain and dynamic strain , as shown in Equation (4):
Under cyclic loading, sandstone is not an ideal elastic material; therefore, strain lags behind stress, with a phase difference of . The closer the material properties approach ideal elasticity, the closer the phase difference tends to zero. Under cyclic loading, the oscillatory stress experienced by the sandstone is given by Equation (5):
where is the amplitude of the oscillatory stress; is the imaginary unit. The strain value corresponding to the oscillatory stress is given by Equation (6).
where is the strain influence amplitude, expressed in Equation (7); is the complex response strain amplitude; and is the complementary angle of the energy dissipation angle, expressed in Equation (8).
where is the storage compliance of the model, is the loss compliance of the model. According to the theory of viscoelastic mechanics [34,35,36], the storage (and loss) compliance can be calculated from the parameters of the constitutive equation.
(1) The expression for the elastic stage under an alternating load is:
Therefore, the storage compliance in the elastic stage , and the loss compliance is .
(2) The expression for the viscoelastic stage under an alternating load is:
Therefore, the storage compliance in the viscoplastic stage is , The loss compliance is .
(3) Expression for the viscoplastic stage under an alternating load:
For a fractional-order dashpot, the expression under cyclic loading is given as follows:
According to Euler’s formula, . Equation (11) can be rearranged to obtain:
Therefore, the storage compliance in the viscoplastic stage is , and the loss compliance is .
From Equations (6)–(8), the dynamic strain response of the constitutive model is given as follows:
where is the critical stress amplitude of the rock mass, which is determined by the fatigue strength threshold. Therefore, the expressions for the storage compliance and loss compliance of the constitutive model are as follows:
In summary, the fatigue constitutive model of double-cracked red sandstone under cyclic loading is as follows:
Introducing the freeze–thaw damage of the double-cracked red sandstone prior to cyclic loading, i.e., , where is the freeze–thaw damage variable, the fatigue constitutive model for double-cracked red sandstone under freeze–thaw and cyclic loading is obtained as follows:
4.3. Verification of the Fatigue Constitutive Model of Double-Cracked Red Sandstone Under Freeze–Thaw and Cyclic Loading
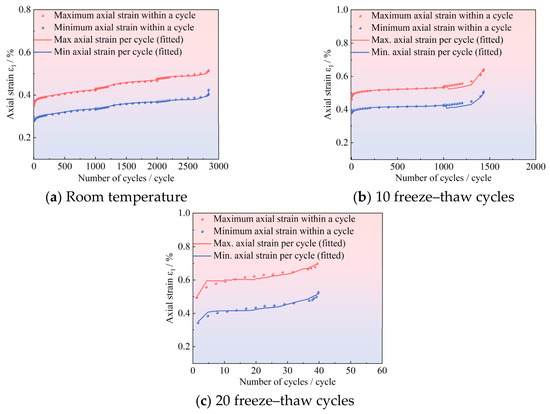
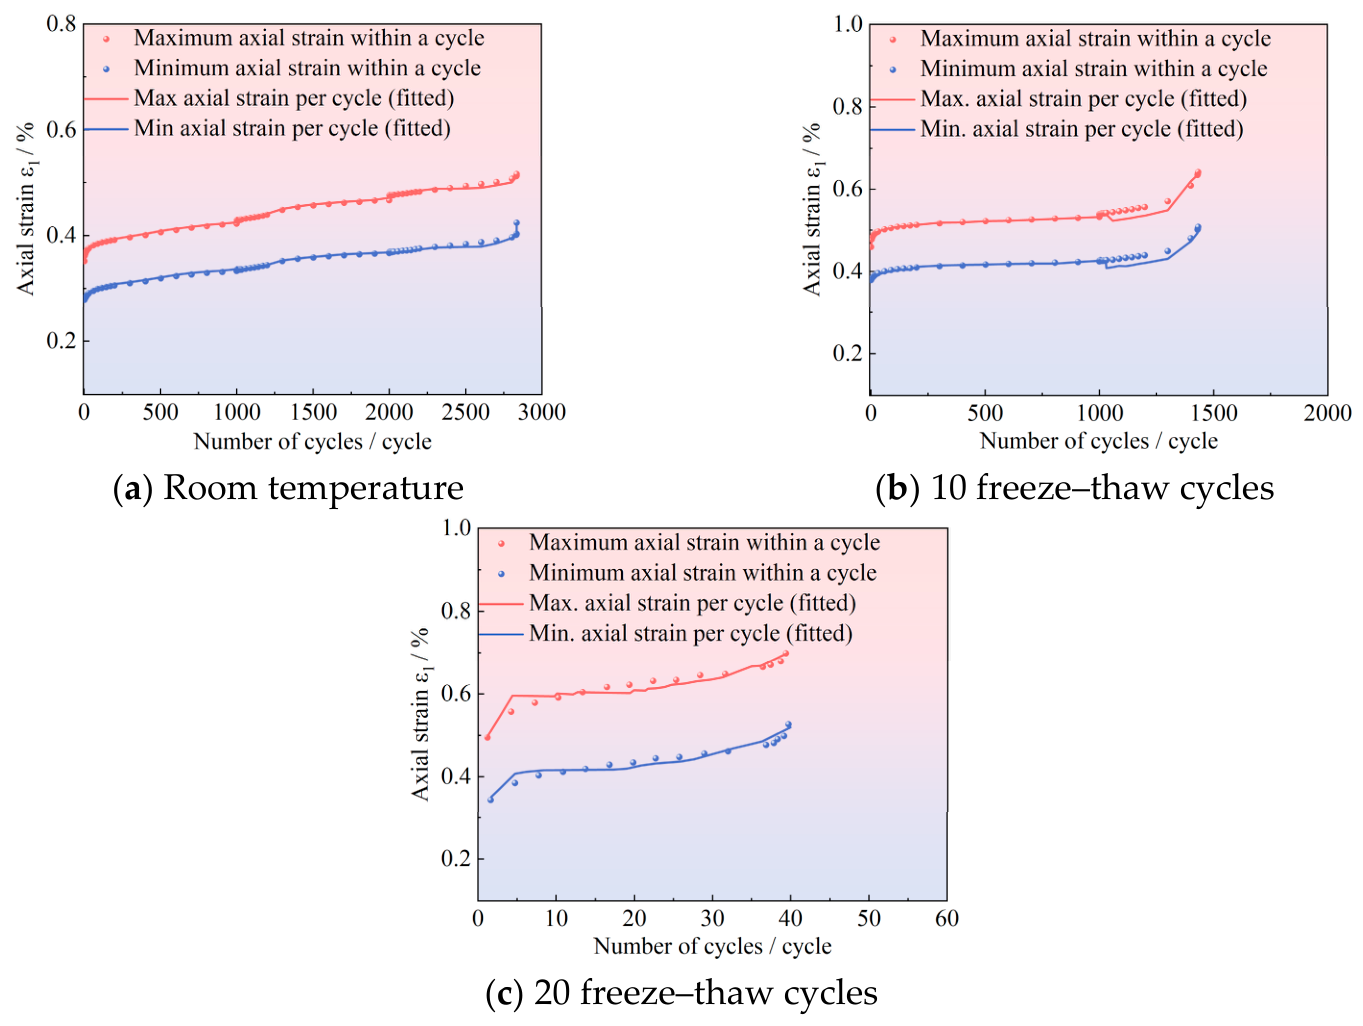
Using the least squares method, parameter fitting was performed for the established fatigue constitutive model of double-cracked red sandstone under freeze–thaw and cyclic loading. The fitting was carried out using the 1stOpt15PRO software (7D-Soft High Technology Inc., Beijing, China), which is widely applied in nonlinear curve fitting, regression analysis, and related fields. In the cyclic loading tests, the maximum axial strain within a cycle and the minimum axial strain within a cycle (i.e., the irreversible axial strain) can clearly reflect the three stages of the entire fatigue process of rock under cyclic loading. Therefore, parameter inversion was conducted on the cyclic loading test results, and the experimental results under various working conditions were compared with the fitted results, as shown in Figure 11. The obtained model parameters are listed in Table 7 and the fitted model parameters under stepped cyclic loading at a confining pressure of 0 MPa are listed in Table 8. To evaluate the influence of model parameters on the predicted fatigue deformation, each fitted parameter was independently increased and decreased by 5%, while the other parameters remained unchanged. The corresponding variation in the predicted axial strain was then compared with the original fitting result. It should be noted that the present model verification is mainly based on parameter fitting using the experimental data obtained in this study. Therefore, the current results demonstrate the descriptive capability of the proposed model for the observed fatigue deformation process, rather than a fully independent predictive validation. Under independent experimental conditions, the predictive performance of the model is expected to be reliable when the rock type, fissure geometry, freeze–thaw procedure and cyclic loading path are similar to those used in this study. For different lithologies, crack geometries, confining pressures or loading frequencies, the model parameters should be recalibrated before application. Further validation using independent fatigue test data will be necessary in future work.
Table 7.
Sensitivity analysis of key parameters in the fatigue constitutive model.
Table 8.
Model parameters fitted under stepped cyclic loading with 0 MPa confining pressure.
In this study, double-cracked red sandstone specimens subjected to three environmental conditions, namely room temperature (unfrozen), 10 freeze–thaw cycles, and 20 freeze–thaw cycles, were selected for parameter fitting investigation based on the data obtained from stepwise cyclic loading tests. The tests were conducted under a stress-controlled mode, with an increment of 5% in the upper limit stress level for each loading stage. By comparing the model-predicted curves with the experimental results in Figure 12, it can be observed that under the coupled effect of freeze–thaw and cyclic loading, the proposed fatigue constitutive model for double-cracked red sandstone accurately captures the deformation development law of the specimens, and the model curves show a high degree of consistency with the experimental values over the entire evolution trend. Quantitative analysis presented in Table 8 further indicates that the correlation coefficients of model fitting under different freeze–thaw conditions all exceed 0.90. Combined with the low RMSE and MAE values, these results demonstrate good agreement between the model predictions and experimental results, indicating that the proposed model can effectively describe the fatigue deformation evolution of double-fissured red sandstone under different freeze–thaw conditions. The small RMSE and MAE values indicate that the proposed model can accurately describe the axial strain evolution under different freeze–thaw conditions. Compared with the correlation coefficient alone, RMSE and MAE provide a more direct evaluation of the absolute fitting error. The model successfully characterizes the typical three-stage evolution of axial strain with the number of cycles under cyclic loading (i.e., initial compaction stage, linear accumulation stage, and accelerated failure stage), validating its reliability in describing the progressive damage process of rock. The research findings can provide a theoretical basis for the long-term stability assessment of fractured rock mass engineering in cold regions and possess certain engineering application value.
Figure 12.
Fitting results under cyclic loading tests.
5. Conclusions
(1) With an increase in the number of freeze–thaw cycles, the crack initiation stress, dilatancy stress, and peak stress all show a decreasing trend. As the rock specimens become softer due to freeze–thaw action, cracks become more prone to initiation and propagation, and the dilatancy phenomenon becomes more severe. Moreover, secondary cracks appear more frequently at the tips of the pre-existing flaws, indicating that the damage induced by freeze–thaw cycles at the flaw tips makes the rock specimens more susceptible to shear failure under compression.
(2) The average fatigue strength of the rock specimens decreases as the number of freeze–thaw cycles increases. The fewer freeze–thaw cycles the specimens experience, the better their internal structure, the higher their strength, the higher the degree of cementation, and the fewer the cracks, resulting in a higher fatigue limit.
(3) By equivalently decomposing the cyclic load into a static load and an alternating load, and based on a variable-order fractional creep constitutive model, the creep time is replaced by the number of cycles and frequency conversion. A freeze–thaw damage variable is introduced to obtain a fatigue constitutive model for double-cracked red sandstone under freeze–thaw and cyclic loading. Using uniaxial cyclic loading test data with different numbers of freeze–thaw cycles and different stress level increments, the parameters of the fatigue constitutive model are fitted. A comparative analysis of the fitted curves and the experimental curves shows that the correlation coefficients all exceed 0.9. The model effectively describes the three stages of initial, low-rate, and accelerated deformation in the cyclic loading tests, thereby verifying the applicability of the model. The proposed model should be regarded as a freeze–thaw-fatigue coupled constitutive framework for double-fissured sandstone, in which the variable fractional order, fatigue threshold and freeze–thaw damage variable jointly describe the progressive transition from stable deformation accumulation to accelerated fatigue failure.
(4) It should be noted that the proposed constitutive model is currently calibrated and verified based on double-fissured red sandstone under uniaxial cyclic loading after freeze–thaw cycles. Therefore, its applicability is mainly limited to the tested rock type, fissure geometry, freeze–thaw conditions, and uniaxial stress state. For other rock types, different fissure arrangements, confining pressures, or complex three-dimensional stress conditions, further experimental validation and parameter recalibration are still required.
Author Contributions
J.R.: Conceived and designed the overall research framework and served as the corresponding author. Leveraging his profound expertise in rock mechanics, Ren identified key scientific questions regarding the changes in mechanical properties of frost-thawed double-fractured red sandstone under freeze–thaw conditions. He also supervised the entire research process, ensuring experimental procedures met international standards and provided scientific support for engineering stability in cold regions. Z.J.: Primarily responsible for experimental implementation and initial data collection, he conducted meticulous freeze–thaw cycle tests, completing both freeze–thaw cycling tests on red sandstone specimens and uniaxial stepwise cyclic loading fatigue tests. He was also in charge of organizing raw data, plotting stress–strain curves, and generating various experimental charts. M.T.: Conducted measurements of specimen physical properties, including tracking mass loss and longitudinal wave velocity after designated cycles. M.Y.: Focused on overall quality control and refinement of the manuscript. He provided comprehensive suggestions and revisions to ensure logical consistency and accurate academic expression throughout the paper. His rigorous review ensured coherence in the arguments presented in the discussion and conclusions, significantly enhancing the manuscript’s readability and scientific rigor. K.Z. (Kun Zhang): Analyzed rock failure patterns and changes in elastic modulus under different numbers of freeze–thaw cycles, obtaining mechanical parameters and failure characteristics of specimens before and after freeze–thaw cycling. K.Z. (Kechen Zhang): Based on the variable-order fractional derivative theory, derived constitutive models and performed formula calculations, conducted model parameter fitting and experimental validation, and carried out linear fitting and correlation analysis of peak strength and elastic modulus data, quantifying the degradation patterns of red sandstone under various freeze–thaw cycles. H.W.: Collected and organized literature and references, proofread the English abstract and paper formatting, assisted in cross-validation of experimental data, and contributed to refining the methodology. All authors have read and agreed to the published version of the manuscript.
Funding
This research was funded by the College of Architecture and Civil Engineering, Xi’an University of Science and Technology. This study was supported by the National Natural Science Foundation of China (No. 42377187 and No. 12072259) and the National Science Foundation for Young Scientists of China (No. 42507282).
Institutional Review Board Statement
Not applicable.
Informed Consent Statement
Not applicable.
Data Availability Statement
The data that support the findings of this study are available from the corresponding author upon reasonable request. This research project is still ongoing, and the relevant data have not yet been made fully available.
Conflicts of Interest
The authors declare no conflict of interest.
References
- Feng, Z.; Wu, J.; Hu, D.; Zhao, L. Uniaxial compressive behavior and unified damage constitutive model of various types of recycled coarse aggregate concrete under freeze-thaw action. Mater. Today Commun. 2024, 41, 110976. [Google Scholar] [CrossRef] [Scilit]
- Zhang, H.; Li, Z.; Jin, J. Mesostructural damage evolution and shear failure mechanism of tailings under freeze–thaw cycles. Measurement 2026, 280, 121890. [Google Scholar] [CrossRef] [Scilit]
- Lu, Y.N.; Li, X.P.; Han, Y.H. Study on freeze-thaw mechanical properties of anisotropic sandstone. J. Glaciol. Geocryol. 2020, 42, 889–898. [Google Scholar]
- Zhang, E.F.; Liu, H.; Kang, Y.M.; Yang, J.H. Study on deterioration of mechanical properties and statistical damage model of freeze-thaw loaded sandstone. Coal Sci. Technol. 2024, 52, 84–91. [Google Scholar]
- Murton, J.B.; Kuras, O.; Krautblatter, M.; Cane, T.; Tschofen, D.; Uhlemann, S.; Schober, S.; Watson, P. Monitoring rock freezing and thawing by novel geoelectrical and acoustic techniques. J. Geophys. Res. Earth Surf. 2016, 121, 2309–2332. [Google Scholar] [CrossRef] [Scilit]
- Zhang, H.; Yuan, C.; Yang, G.; Wu, L.; Peng, C.; Ye, W.; Shen, Y.; Moayedi, H. A novel constitutive modelling approach measured under simulated freeze–thaw cycles for the rock failure. Eng. Comput. 2019, 37, 779–792. [Google Scholar] [CrossRef] [Scilit]
- Jia, H.; Xiang, W.; Krautblatter, M. Quantifying Rock Fatigue and Decreasing Compressive and Tensile Strength after Repeated Freeze-Thaw Cycles. Permafr. Periglac. Processes 2015, 26, 368–377. [Google Scholar] [CrossRef] [Scilit]
- Song, Y.; Lu, Y.; Wang, S.; Xie, L.; Cao, J.; An, X. Evolution characteristics of unfrozen water content and its influence on mechanical properties of rock during freeze-thaw process. Rock Soil Mech. 2025, 46, 1049–1059+1121. [Google Scholar]
- Wang, X.; Mu, W.; Li, L.; Yang, T.; Bai, M.; Du, S. Study on freeze-thaw damage and mechanical properties of fractured rock mass grouting reinforcement in alpine region open-pit mines. Int. J. Rock Mech. Min. Sci. 2025, 192, 106143. [Google Scholar] [CrossRef] [Scilit]
- Jiang, Z.; Liu, F.; Cai, G.; He, H.; Shi, W.; He, Y. Fractal characterization of pore structure evolution in pre-fractured sandstone under cyclic freeze-thaw. Geoenergy Sci. Eng. 2025, 247, 213649. [Google Scholar] [CrossRef] [Scilit]
- Sun, L.; Lou, P.; Pan, C.; Ji, P. A study on microscopic damage characteristics of freeze-thaw sandstone cyclic loading and unloading based on DEM. Front. Mater. 2024, 11, 1521874. [Google Scholar] [CrossRef] [Scilit]
- Zeng, L. Research on Rock Fatigue Deformation Characteristics and Calculation Method of Fatigue Threshold Value. Railw. Constr. Technol. 2021, 8, 6–9+23. [Google Scholar]
- Wen, D.Y.; Jiang, N.S.; Liu, C.K.; Lv, Z.Q.; Li, Y.X. Experimental study on the influence of temperature rise on the vibration settlement of frozen soil in cold region. Saf. Environ. Eng. 2023, 30, 84–91. [Google Scholar]
- Zhao, X.; Yuan, Y.; Xu, T. Study on Damage Evolution of Rock Under Freeze-thaw Action. Min. Res. Dev. 2022, 42, 112–118. [Google Scholar]
- Hou, Z.; Liu, X.; Wang, T.; Zhang, J.; Yuan, S. Mechanical Properties and Damage Constitutive Model of Freeze-Thaw Damaged Quartzite. J. Yangtze River Sci. Res. Inst. 2025, 42, 177–185. [Google Scholar]
- Zhang, H.; Zhang, H.; Chen, S.; Li, Z.; Qin, X.; Guo, S.; Meng, X. Dynamic mechanical behavior and damage constitutive model of sandstone with various fracture inclinations under impact loading after different freeze–thaw cycles. Theor. Appl. Fract. Mech. 2026, 141, 105318. [Google Scholar] [CrossRef] [Scilit]
- Yang, D.; Hu, J.; Wen, G.; Zeng, P. Analysis of fracture deformation field and energy evolution of granite after high confining pressure cyclic load pre-damage. R. Soc. Open Sci. 2021, 8, 201966. [Google Scholar] [CrossRef] [Scilit] [PubMed]
- Xiao, J.Q.; Ding, D.X.; Jiang, F.L.; Xu, G. Fatigue damage variable and evolution of rock subjected to cyclic loading. Int. J. Rock Mech. Min. Sci. 2010, 47, 461–468. [Google Scholar] [CrossRef] [Scilit]
- Xu, Y.; Ren, F.; Ahmed, Z.; Wang, K.; Wang, Z. Mechanical Characteristics and Damage Evolution Law of Sandstone with Prefabricated Cracks Under Cyclic Loading. Arab. J. Sci. Eng. 2021, 46, 10641–10653. [Google Scholar] [CrossRef] [Scilit]
- Shi, Z.; Li, J.; Wang, J.; Chen, J.; Lin, H.; Cao, P. Experimental and numerical study on fracture characteristics and constitutive model of sandstone under freeze-thaw-fatigue. Int. J. Fatigue 2023, 166, 107236. [Google Scholar] [CrossRef] [Scilit]
- Shi, Z.; Li, J.; Wang, M.; Chen, J.; Lin, H.; Cao, P. Fatigue fracture behaviour and constitutive model of freeze-thaw sandstone under multilevel fatigue loads. Bull. Eng. Geol. Environ. 2023, 82, 319. [Google Scholar] [CrossRef] [Scilit]
- Liu, T.; Cai, W.; Sheng, Y.; Huang, J. Experimental Study on the Microfabrication and Mechanical Properties of Freeze–Thaw Fractured Sandstone under Cyclic Loading and Unloading Effects. Materials 2024, 17, 2451. [Google Scholar] [CrossRef] [Scilit] [PubMed]
- Liu, T.; Li, H.; Dong, L.; Cao, P. Mechanical Properties and Failure Mechanisms of Sandstone Under Combined Action of Cyclic Loading and Freeze–Thaw. Appl. Sci. 2025, 15, 7942. [Google Scholar] [CrossRef] [Scilit]
- Li, Y.; Huang, D. Damage Properties and Rheological Model of Spatial-Rotation Fissured Red Sandstone Subjected to Freeze–Thaw and Loading. Rock Mech. Rock Eng. 2024, 57, 8993–9017. [Google Scholar] [CrossRef] [Scilit]
- Tao, W.; Ye, T.; Zhang, W.; Wang, X.; Liu, C. Experimental Study on Uniaxial Compressive Fatigue Property of Cracked Rock-like Materials. Geotech. Eng. Tech. 2022, 36, 389–394. [Google Scholar]
- Song, Z.; Cheng, Y.; Yang, T.; Yang, P.; Pan, H. Experimental study on fatigue damage evolution mechanism of hard layered sandstone under cyclic loading. Chin. J. Geotech. Eng. 2024, 46, 490–499. [Google Scholar]
- Chen, L.; Li, K.; Song, G.; Zhang, D.; Liu, C. Effect of freeze–thaw cycle on physical and mechanical properties and damage characteristics of sandstone. Sci. Rep. 2021, 11, 12315. [Google Scholar] [CrossRef] [Scilit] [PubMed]
- Lan, Y.; Gao, H.; Zhao, Y. Pore Structure Characteristics and Strength Variation of Red Sandstone under Freeze–Thaw Cycles. Materials 2022, 15, 3856. [Google Scholar] [CrossRef] [Scilit] [PubMed]
- Ren, J.; Shen, Y.; Yun, M.; Wang, R.; Qin, F.; Huo, X.; Feng, J. Experimental study on the damage and failure mechanism of freeze-thaw filled fractured sandstone under uniaxial compression. Sci. Rep. 2026, 16, 17603. [Google Scholar] [CrossRef] [Scilit] [PubMed]
- Ge, X.R.; Jiang, Y.; Lu, Y.D.; Ren, J.X. Testing study on fracture deformation law of rock under cyclic loading. Chin. J. Rock Mech. Eng. 2003, 22, 1581–1585. [Google Scholar]
- Han, C.; Liu, X.; Li, D.; Shao, Y. Constitutive modeling of rock materials based on variable-order fractional theory. Mech. Time-Depend. Mater. 2021, 26, 485–498. [Google Scholar] [CrossRef] [Scilit]
- Shi, S.; Zhu, F.; Zhu, J. Investigation on damage creep constitutive model of rock under the coupled effect of freeze–thaw cycles and loading. Fatigue Fract. Eng. Mater. Struct. 2024, 47, 1281–1299. [Google Scholar] [CrossRef] [Scilit]
- Wu, D.; Chen, G.; Xia, Z.; Peng, J.; Mao, J. Fractional creep model and experimental study of unsaturated silty clay in Fuyang. Front. Earth Sci. 2023, 10, 1029420. [Google Scholar] [CrossRef] [Scilit]
- Huang, C.; Wang, F.; Gao, D. A New Viscoelastic Mechanics Model for the Creep Behaviour of Fibre Reinforced Asphalt Concrete. Fract. Struct. Integr. 2018, 12, 108–120. [Google Scholar] [CrossRef] [Scilit]
- Nikan, O.; Avazzadeh, Z. Numerical simulation of fractional evolution model arising in viscoelastic mechanics. Appl. Numer. Math. 2021, 169, 303–320. [Google Scholar] [CrossRef] [Scilit]
- Prieto-Muñoz, P.A.; Yin, H.M.; Testa, R.B. Mechanics of an Adhesive Anchor System Subjected to a Pullout Load. II: Viscoelastic Analysis. J. Struct. Eng. 2014, 140, 4013053. [Google Scholar] [CrossRef] [Scilit]

Disclaimer/Publisher’s Note: The statements, opinions and data contained in all publications are solely those of the individual author(s) and contributor(s) and not of MDPI and/or the editor(s). MDPI and/or the editor(s) disclaim responsibility for any injury to people or property resulting from any ideas, methods, instructions or products referred to in the content. |
© 2026 by the authors. Licensee MDPI, Basel, Switzerland. This article is an open access article distributed under the terms and conditions of the Creative Commons Attribution (CC BY) license.