


Abstract
Accidental oil spills in estuarine ports pose a significant environmental threat. Confined waterways, complex hydrodynamics, and proximity to protected ecosystems limit the time available for effective emergency response. The PISCES II oil spill simulator used for this study assesses the environmental consequences of accidental oil spills in one of the polish ports, Port of Szczecin. The analysis was conducted for the spill of two petroleum products (IFO300 and Diesel Fuel Oil (DFO)) under various wind directions and speed. Numerical simulations were combined with a comparative Environmental Consequence Index based on shoreline contact time, stranded oil, contamination of Natura 2000 habitats and shoreline contamination extent; emergency-response implications were evaluated separately from the composite index. The results indicate that wind direction, wind speed, spill location and the geometry of the port basin were the main factors controlling the simulated spill trajectories under the adopted modeling assumptions. South and south-westerly winds produced the greatest impacts by transporting oil towards the Lower Odra Valley Natura 2000 protected area, whereas spills within confined industrial basins caused rapid shoreline contamination but lower ecological exposure. The type of oil primarily affected the chemical processes occurring in a specific spill such as dispersion and evaporation, rather than the trajectory of the spill. Although the simulations were not validated against historical spill data, the proposed methodology provides a documented scenario-based methodology for identifying environmentally critical spill scenarios and supporting contingency planning in estuarine ports adjacent to protected ecosystems.
1. Introduction
Maritime transport is the dominant mode of global freight transport, accounting for around 80–90% of world trade. Despite substantial improvements in ship design, navigation systems and international regulations aimed at preventing marine pollution, accidental oil spills continue to represent one of the most significant environmental hazards associated with shipping activities. Although catastrophic tanker accidents become less frequent, smaller spills occurring during cargo handling, bunkering operations, collisions or machinery failures remain common, particularly in ports and estuarine waterways. In such environments, even relatively small releases may rapidly contaminate shorelines and ecologically valuable habitats before effective response measures can be implemented [1,2].
The results of the oil spill on the ecosystem depend not only on the released volume but also on local hydrometeorological factors, type of shoreline and the physicochemical properties of the spilled oil. Movement and transformation processes, including advection, turbulent diffusion, evaporation, emulsification, natural dispersion and shoreline interaction, determine both the trajectory of the spill and the extent of environmental contamination. Consequently, numerical modeling became an essential tool supporting oil spill emergency response planning and preparing environmental risk assessment [2].
There are several operational and research models used to conduct simulations of oil spills and their trajectories under various environmental conditions. Among the most widely applied are GNOME, OILMAP, OSCAR, MEDSLIK-II, OpenDrift/OpenOil and PISCES II [2,3,4]. These models are generally based on Lagrangian particle-tracking techniques coupled with hydrodynamic and meteorological impacts, successfully applied to offshore waters, coastal zones and estuarine environments [3,5]. Studies show that reliable prediction of flood trajectories requires not only accurate data on the weather factors affecting the simulation, but also consideration of local hydrodynamic characteristics.
The objective of the research presented in this article is to apply a validated operational oil spill model as part of an environmental impact assessment for a river-estuary port adjacent to Natura 2000 protected wetland areas, with no comparison of numerical models available.
Recent studies increasingly focus on modeling oil spills in ports, estuaries, and other semi-enclosed bodies of water, where spill trajectories differ significantly from those in open waters. Navigation channels, turning basins, restricted water exchange operations, river flow and port infrastructure generate complex circulation patterns that may strongly influence spill trajectories and significantly reduce the time available for emergency response. Simulations show that, under such conditions, the location of the spill and the wind direction often have a greater impact on shoreline contamination than the volume of the spill itself [6,7,8,9]. Investigations conducted in Tarragona Harbour showed that harbor geometry and local circulation significantly influence spill trajectories and shoreline contamination [10]. Similar conclusions were reported for Vancouver Harbour, where even relatively small spills could contaminate environmentally valuable shorelines because of restricted circulation within enclosed port waters [9]. De Dominicis et al. [11] proved that the rapid contamination of the shoreline in the Port of Taranto significantly limited the effectiveness of regional rescue resources, highlighting the importance of the location of emergency response services.
In parallel with the development of trajectory models, increasing attention has been devoted to integrating numerical simulations with environmental risk assessment. Contemporary studies combine oil spill modeling with shoreline sensitivity mapping, ecological vulnerability analyses and contingency planning in order to identify priority protection areas and optimize emergency response strategies. This approach is particularly important for estuarine wetlands and Natura 2000 sites, where relatively small spills may cause disproportionately large ecological impacts because of the high sensitivity of protected habitats and species [12,13].
Despite considerable advances in oil spill modeling, several important research gaps remain. Most published works focus on open waters or major offshore accidents, while relatively few studies have addressed river-estuary ports located in the vicinity of protected wetland ecosystems. Only a limited number of publications combine numerical trajectory modeling with environmental risk assessment and the evaluation of the effectiveness of response operations within a single analytical framework. This gap is particularly noticeable in the case of Baltic estuarine ports, including the Port of Szczecin, where intensive shipping coexists with the Lower Odra Valley Natura 2000 protected area.
The Port of Szczecin constitutes a complex river–estuarine port connected with the lower Odra River and Zalew Szczecinski through an interconnected network of navigation channels and turning basins. Its proximity to internationally protected wetlands makes accidental oil spills a significant ecological problem. At the same time, the limited hydrodynamic conditions of the port can significantly affect the response time before emergency response teams can reach environmentally sensitive areas. Although hydrodynamic conditions in the Odra estuary were previously studied, comprehensive analyses combining modeled oil spill simulations with an environmental risk assessment for the Port of Szczecin remain few.
For this reason, the objective of this study is to assess the potential contamination of Natura 2000 habitats resulting from representative scenarios of accidental oil spills in the Port of Szczecin using the PISCES II simulation model [14]. Three spill locations representing different operational sectors of the port were analyzed, under various wind directions and speeds, for two petroleum products with different physicochemical parameters. The simulation results were then combined with an environmental risk assessment focusing on shoreline contamination and the effectiveness of emergency response operations.
The contribution of this study is significant in three ways. First, it provides a systematic scenario-based analysis of oil spill dynamics in a river–estuarine port directly bordering Natura 2000 protected areas. Second, it evaluates the combined influence of spill location, oil type and meteorological conditions on spill trajectories, shoreline contamination and available response time under identical simulation assumptions. Third, it integrates numerical oil spill modeling with environmental risk assessment to support contingency planning and environmental management in enclosed port waters. The results contribute to a better understanding of oil spill dynamics in estuarine ports and may support preparedness planning in similar environmentally sensitive coastal systems.
2. Simulation Studies—Methods and Materials
2.1. Study Area
The study was conducted in the Port of Szczecin, located in north-western Poland within the lower Odra River estuary, approximately 65 km from the Baltic Sea. The port forms part of the Szczecin–Świnoujście port complex and is connected to the Zalew Szczecinski through an interconnected system of navigation channels, which subsequently discharge into the Pomeranian Bay via the Świna, Dziwna and Peenestrom straits. This river–estuarine setting distinguishes the port from typical coastal seaports and creates complex trajectories for the transport of floating contaminants. Water circulation in the estuary is mainly controlled by river flow, wind-driven circulation, and water exchange with the Zalew Szczecinski; the influence of tides is not taken into consideration.
The port is located adjacent to the Lower Odra Valley Natura 2000 protected area, which comprises extensive wetlands, floodplain meadows, reed beds and shallow-water habitats of high ecological value. The ecosystems provide a habitat for numerous protected birds, fish, and reptiles, and are particularly sensitive to oil pollution due to the high vulnerability of coastal and wetland habitats and the potential for petroleum products to persist for long periods in sediments and vegetation.
From the perspective of oil spill simulations, the Port of Szczecin constitutes a complex hydrodynamic system consisting of narrow navigation channels, turning basins, and industrial quays with varying connections. Previous studies indicate that water circulation in the Odra estuary is influenced, among other factors, by wind conditions, river flow, and water exchange with Zalew Szczecinski. This results in spatial variations in the direction of water flow, which may be significant for the movement of pollutants. In this study, water currents were not included as an input parameter for the simulations. Listed characteristics make the Port of Szczecin an appropriate case study for evaluating oil spill trajectories and environmental risk in confined river–estuarine waters.
2.2. Oil Spill Simulation Model
Numerical simulations were performed using PISCES II (version 2.93), a scenario-based oil spill simulator developed by Transas Ltd. The PISCES II software uses a Lagrangian approach to track the movement of an oil spill under environmental conditions specified by the user [2,15]. In this study, the analysis was conducted for defined scenarios that differed in spill location, type of petroleum product, and wind direction and speed.
Several operational oil spill models are currently available, including GNOME, MEDSLIK-II, OSCAR, OILMAP and OpenDrift [10]. PISCES II was selected because it enables controlled comparison of hypothetical accident scenarios by modifying spill location, oil type and meteorological conditions while maintaining identical environmental settings throughout all simulations [16,17,18,19,20]. In the present study, hydrodynamic current fields were not included in the simulations. Oil spill trajectory was determined under identical environmental conditions, with defined wind direction and speed, to allow for a direct comparison of the simulated spill scenarios. Consequently, the results should be interpreted as comparative scenario analyses rather than deterministic forecasts of actual spill dynamics. Such functionality is particularly suitable for comparative analyses conducted within confined port waters.
As with other numerical oil spill models, simulation results depend on environmental conditions and assumptions describing oil evaporating processes. Therefore, the obtained results should be interpreted as scenario-based analyses supporting contingency planning rather than deterministic predictions of future spill dynamics.
2.3. Selection of Spill Scenarios
Three spill locations were selected following an analysis of navigational traffic, petroleum handling operations and hydrodynamic characteristics of the Port of Szczecin. Selected locations represent various operating conditions and potential environmental consequences.
Scenario A represents an accidental spill in the Industrial Canal, characterized by restricted water exchange and rapid shoreline contact.
Scenario B represents a spill in the Parnica Channel adjacent to petroleum handling infrastructure, where contaminants may be transported towards Natura 2000 wetlands.
Scenario C represents a collision within the Parnica turning basin, where several navigation channels intersect, creating the most complex hydrodynamic conditions.
Two petroleum products with contrasting physicochemical properties were analyzed: IFO300, representing heavy fuel oil, and Diesel Fuel Oil (DFO), representing light distillate fuel. Wind directions (S, SW, W, NW and N) and wind speeds (7 and 10 knots) were selected according to prevailing meteorological conditions in the Szczecin area [21].
2.4. Simulation Setup
To ensure direct comparability, all simulations were performed using identical environmental conditions. Each scenario represented a continuous release of 500 kg of petroleum over 30 min, followed by a 24 h simulation period. The spill mass was selected as a representative medium-scale operational spill associated with bunkering operations or minor ship collisions within port waters. Constant environmental conditions included an air temperature of 15 °C, water temperature of 10 °C and sea state 0. The principal simulation parameters are summarized in Table 1.
Table 1.
Numerical simulation parameters.
In the simulations analyzed, it was assumed that the regions under study are free of currents. Consequently, spill trajectories reflected the combined influence of wind direction and speed, shoreline geometry and spill location under simplified environmental conditions.
To ensure maximum methodological transparency and simplify the replication of the modeling process in the PISCES II system, all simulation parameters were defined, and environmental factors and scenario assumptions were clearly specified. Simulation outputs included spill trajectory, first shoreline contact time, stranded oil mass, evaporated oil and dispersed oil.
Based on an analysis of the loading operations and vessel traffic in the port, the following positions for the experimental variants of studies were selected:
- -
- Scenario A—spill in the Industrial Canal, Quay 114;
- -
- Scenario B—spill within the Parnica area;
- -
- Scenario C—spill in the turning area of the Parnica Canal.
The characteristics of the simulated types of oil substances used during the experiment are presented in Table 2.
Table 2.
Characteristics of the types of oil used during simulations.
- Scenario A
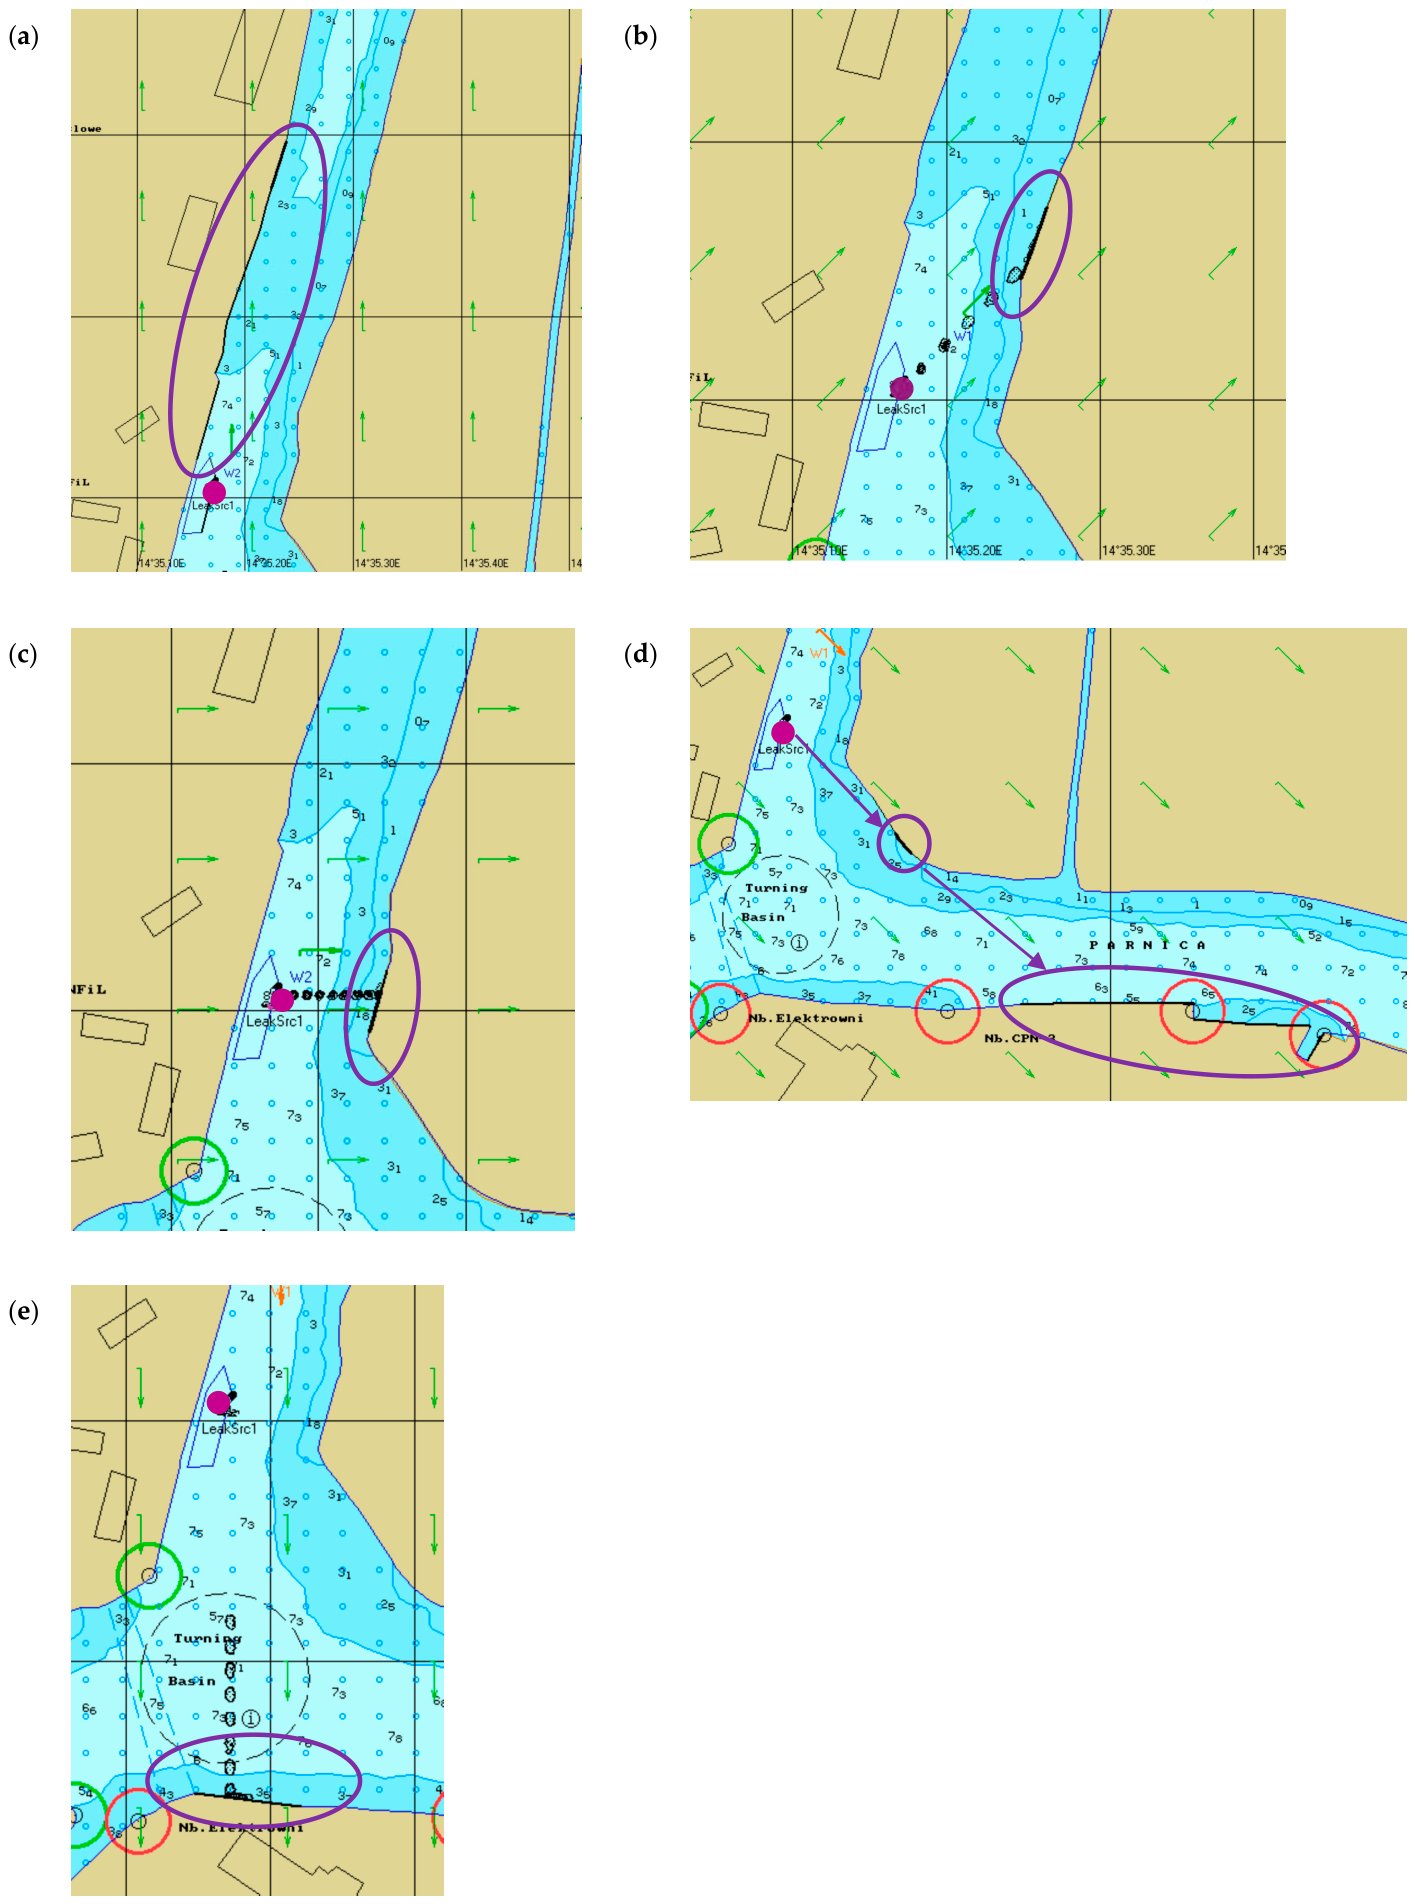
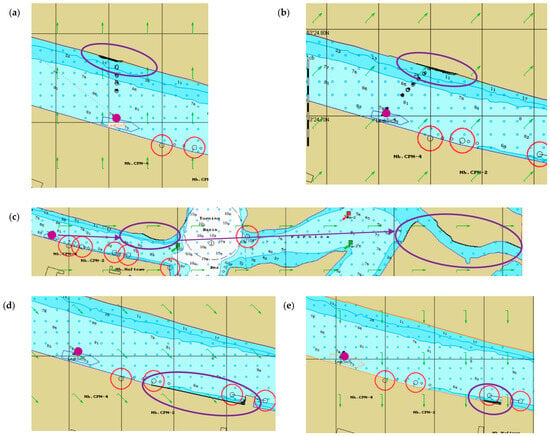
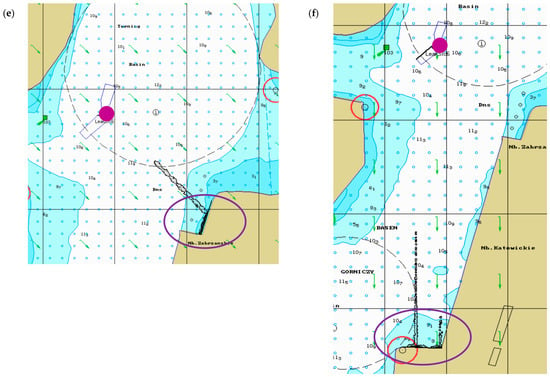
The ship’s position was simulated in the Industrial Canal at Quay 114 (Farblak Quay) (Figure 1). The simulations were carried out over a 24 h period, with the total oil spill occurring within 30 min. Over the following hours, the movement, evaporation and dispersion of the oil slick were observed, and above all, the time taken to reach the shore and the amount of sand mixed with oil. Data recording of the spill was carried out automatically every 5 min for the first hour, and then every 60 min. In all variants of Scenario A of the spill, it was found that no significant changes occurred from the 5th hour of the study onwards.
Figure 1.
Trajectories of simulated oil spills recorded for different wind directions and speeds in Scenario A: (a) south wind; (b) south-west wind; (c) west wind; (d) north-west wind; (e) north wind (purple dots—spill point; purple arrows—spill trajectory; purple ovals—polluted area). Source: own study.
In this experiment, due to the position of the vessel, Quay 115, Mieleński Ostrów Island, the CPN Quay and the Power Station Quay were affected by the pollution; wind strength was not a factor. In this scenario, five variants were carried out for wind directions S, SW, W, NW and N, and each of these were carried out for wind speeds of 7 and 10 knots for light oil and the same for heavy oil (a total of 20 simulations).
During the simulation, several parameters related to the spread of pollution were recorded, such as the volume of spilled oil, floating oil, oil deposited on the shore, and the portion that evaporated and dispersed. However, the focus was on the amount of oil deposited on the shore and the time at which it first came into contact with the shoreline, as shown in Table 3. The abbreviations used for the individual columns of the table denote the direction and speed of the simulated wind (e.g., S10 denotes a southerly wind at a speed of 10 knots).
Table 3.
Time to first shoreline contact and percentage of stranded oil for Scenario A under different wind conditions.
- Scenario B
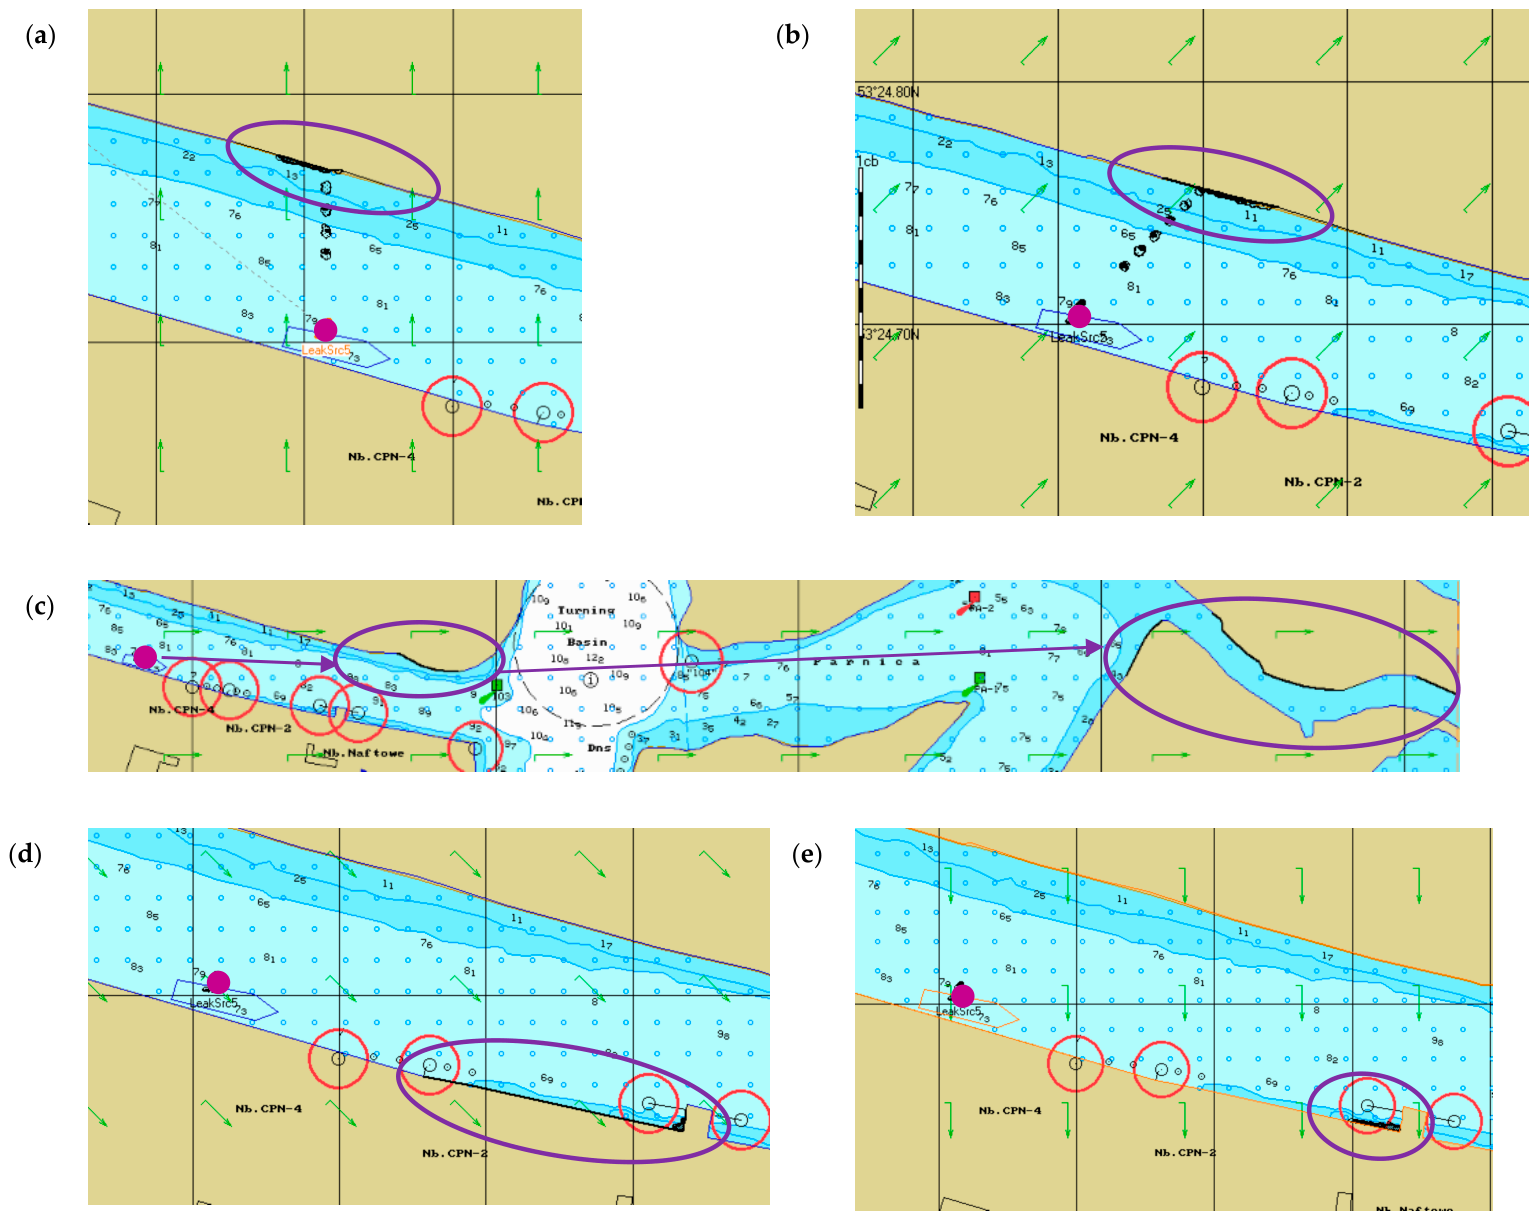
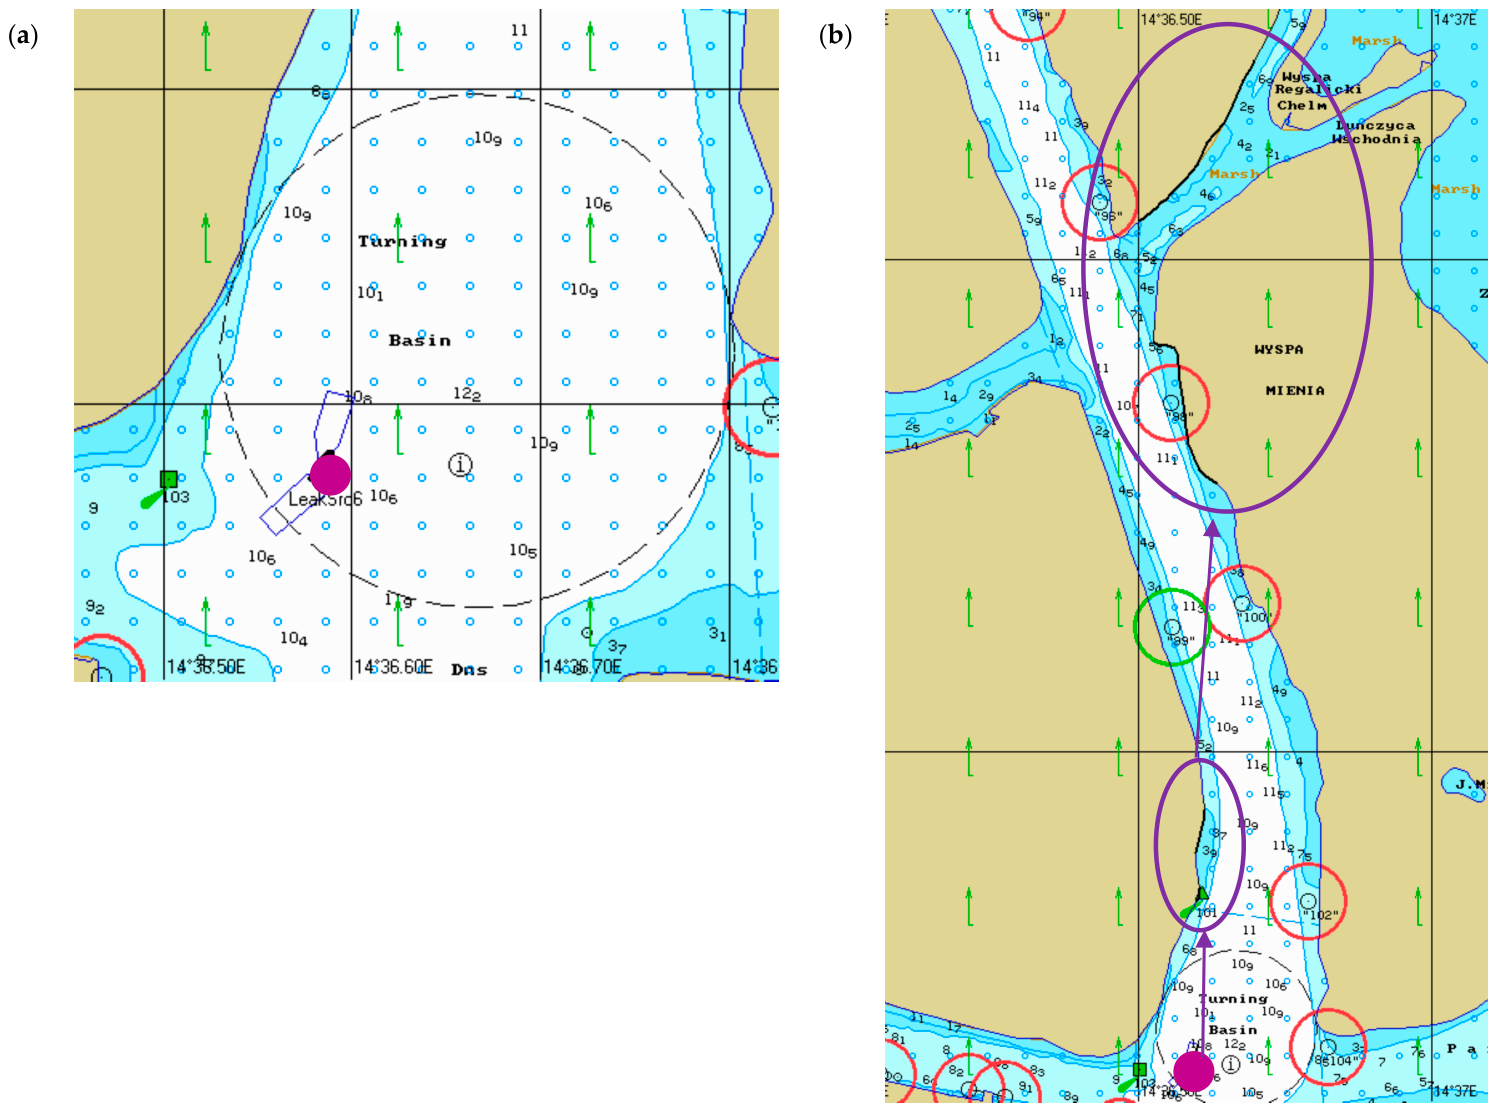
In this scenario, the spill was simulated at the CPN Quay, from which 500 kg of oil leaks and drifts in the direction of the S, SW, W, NW and N winds (Figure 2). The simulations were conducted over 24 h, as in the scenario discussed above, although the first contact of the oil with the shore was recorded as early as 20 min into the spill.
Figure 2.
Trajectories of simulated oil spills recorded for different wind directions and speeds in scenario B: (a) south wind; (b) south-west wind; (c) west wind; (d) north-west wind; (e) north wind (purple dots—spill point; purple arrows—spill trajectory; purple ovals—polluted area). Source: own study.
The experiment demonstrated that, with a southerly wind, the spill completely contaminated the island of Mieleński Ostrów, regardless of whether the oil was light or heavy.
With a south-westerly wind, the oil, regardless of type and wind speed, settled on the island of Mieleński Ostrów (283 kg IFO300; 283 kg DFO) and on Mieleńska Łąka (195 kg IFO; 175 kg DFO), which is now part of the Lower Odra Valley Natura 2000 site. When the wind direction changed to westerly (W), the oil partially contaminated the island of Mieleński Ostrów; moved along the Parnica Canal towards the island of Czapli Ostrów, where a small amount reached it; to the island of Sadlińskie Łąki (contaminating the shoreline); and reached Lake Małe Dąbie via the Dąbski Nurt Canal.
The conditions for the next simulation scenario were identical; the only change was the wind direction to NW (north-west). This spill moved in line with the wind direction regardless of its speed and settled at the CPN-2 Quay.
When the wind direction changed to N (north), all the oil from the spill reached the CPN-2 Quay, where it settled on the concrete quay and mixed with the water. The data in Table 4 show the amount of oil that settled on the shore and the minute of the simulation at which the oil first came into contact with the shoreline.
Table 4.
Time to first shoreline contact and percentage of stranded oil for Scenario B under different wind conditions.
- Scenario C
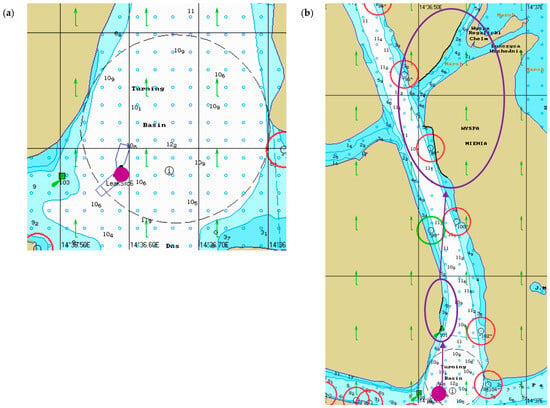
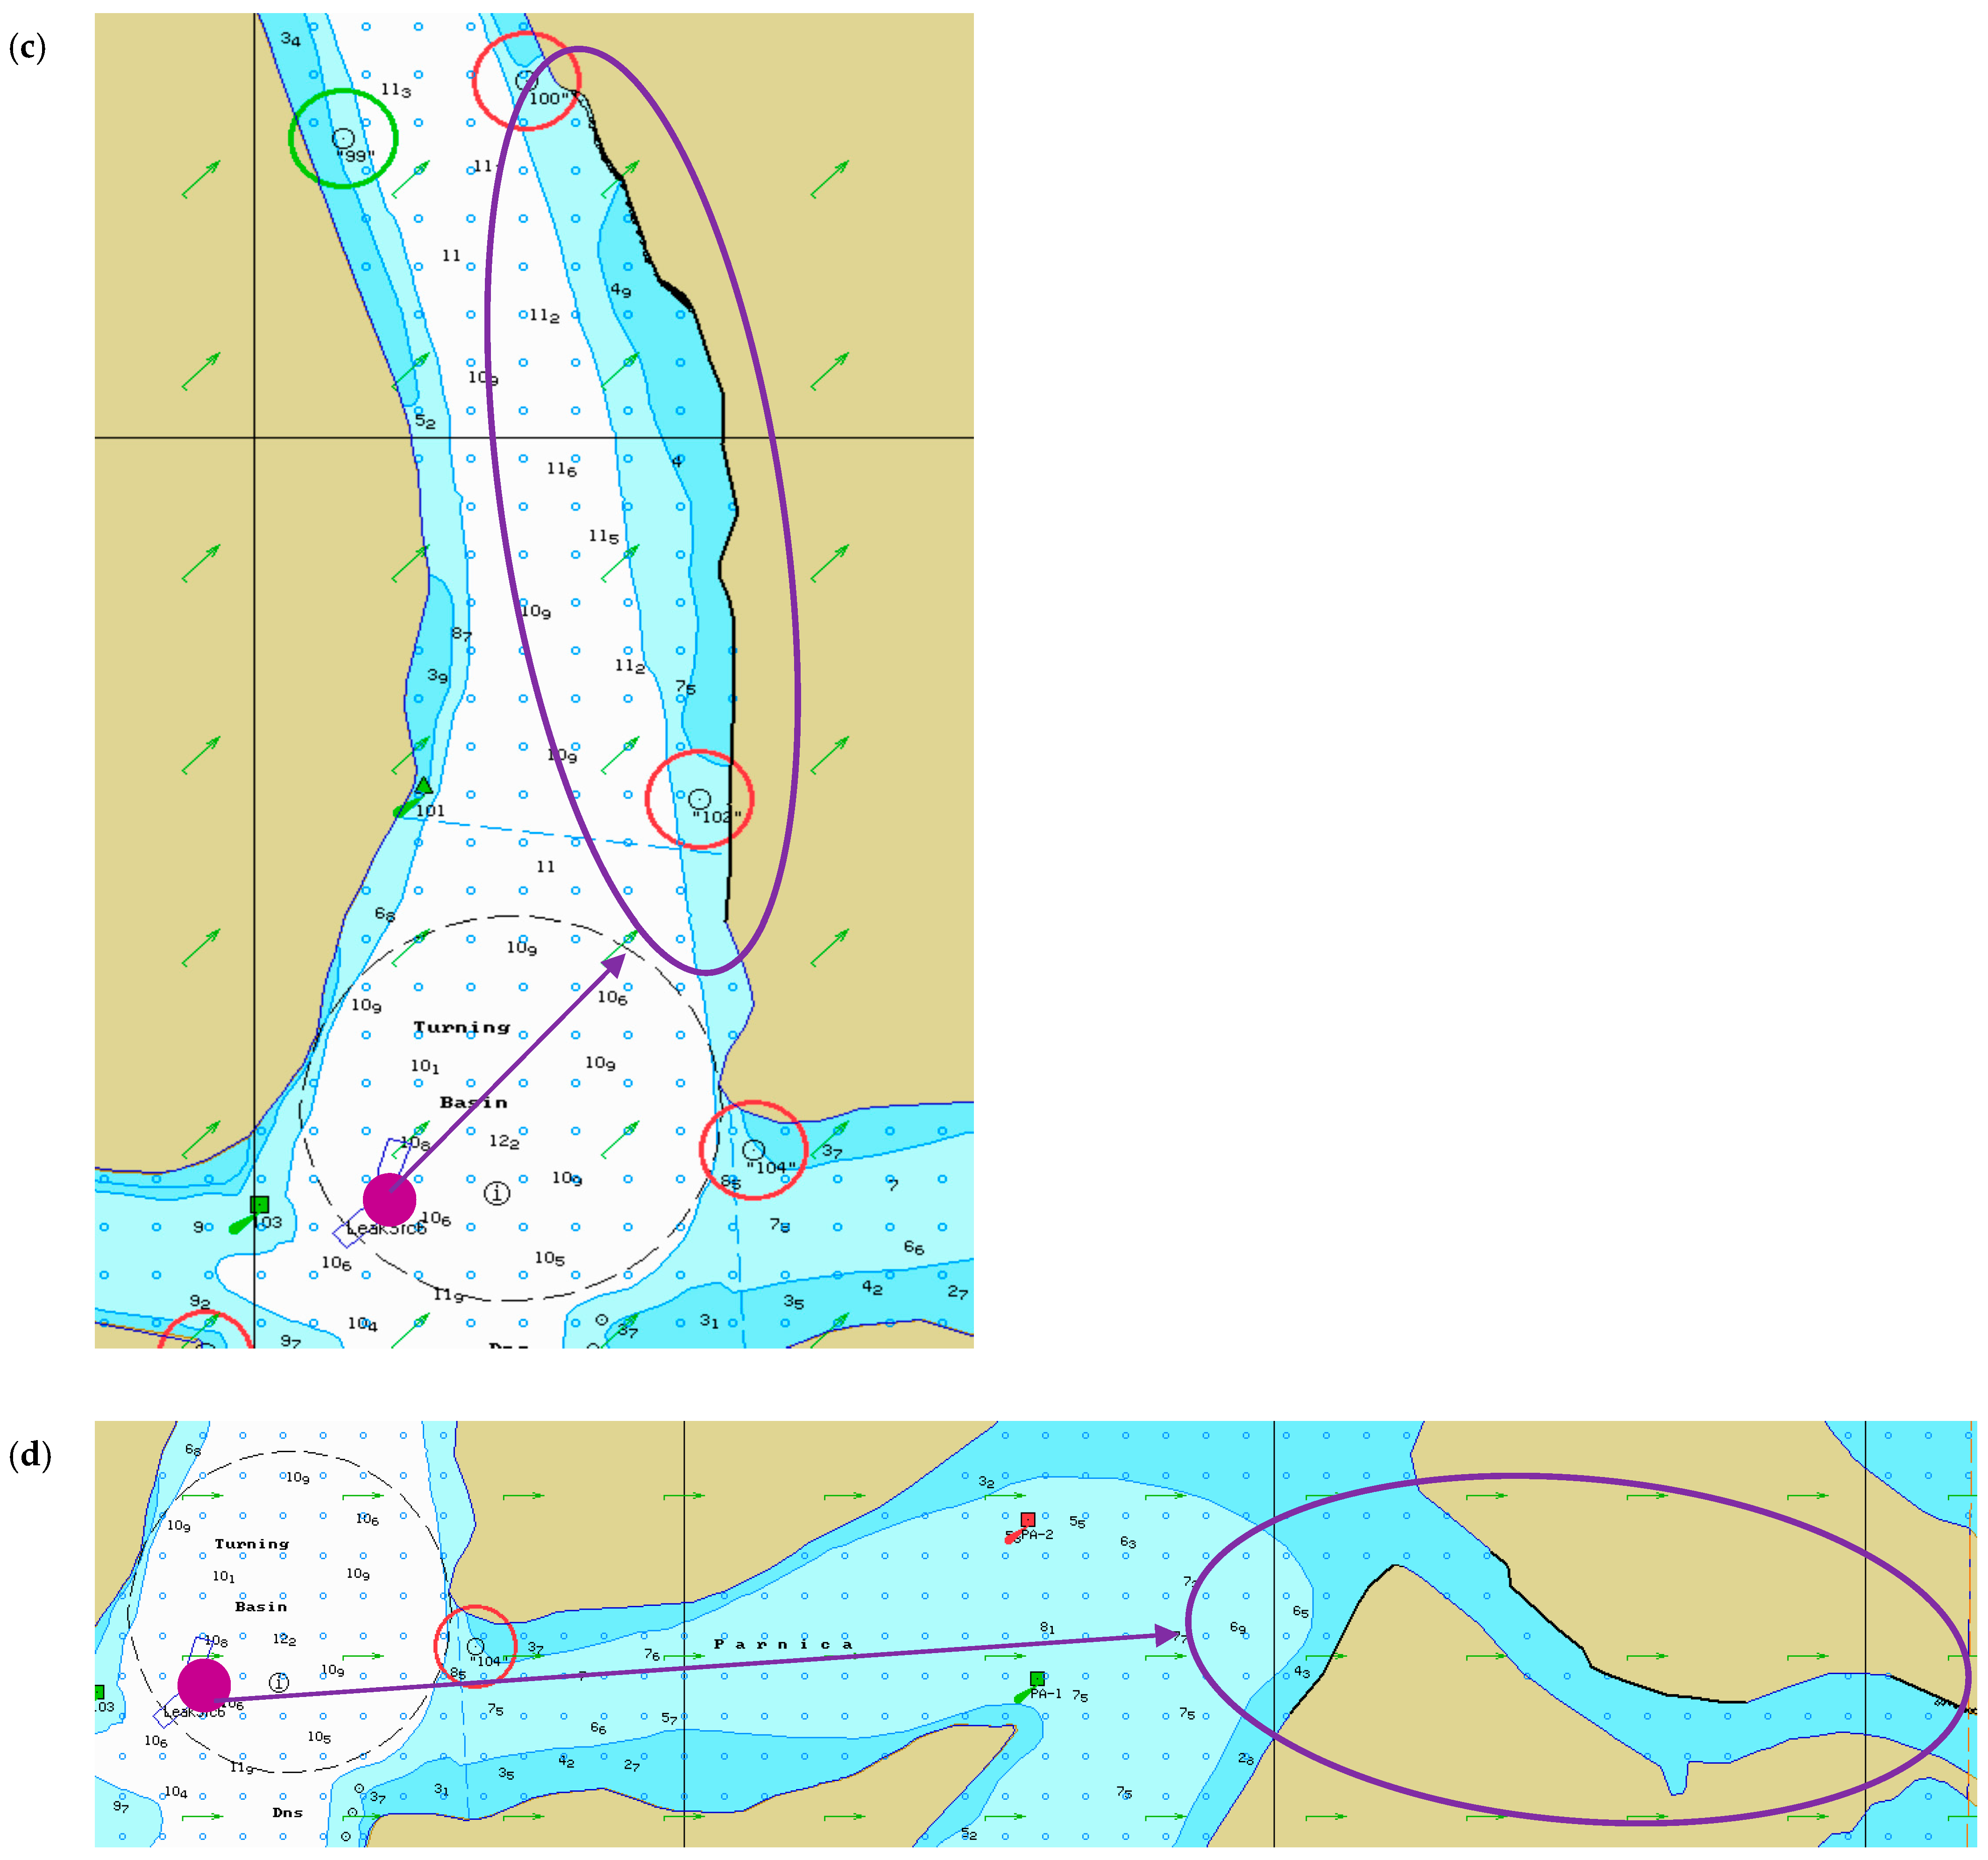
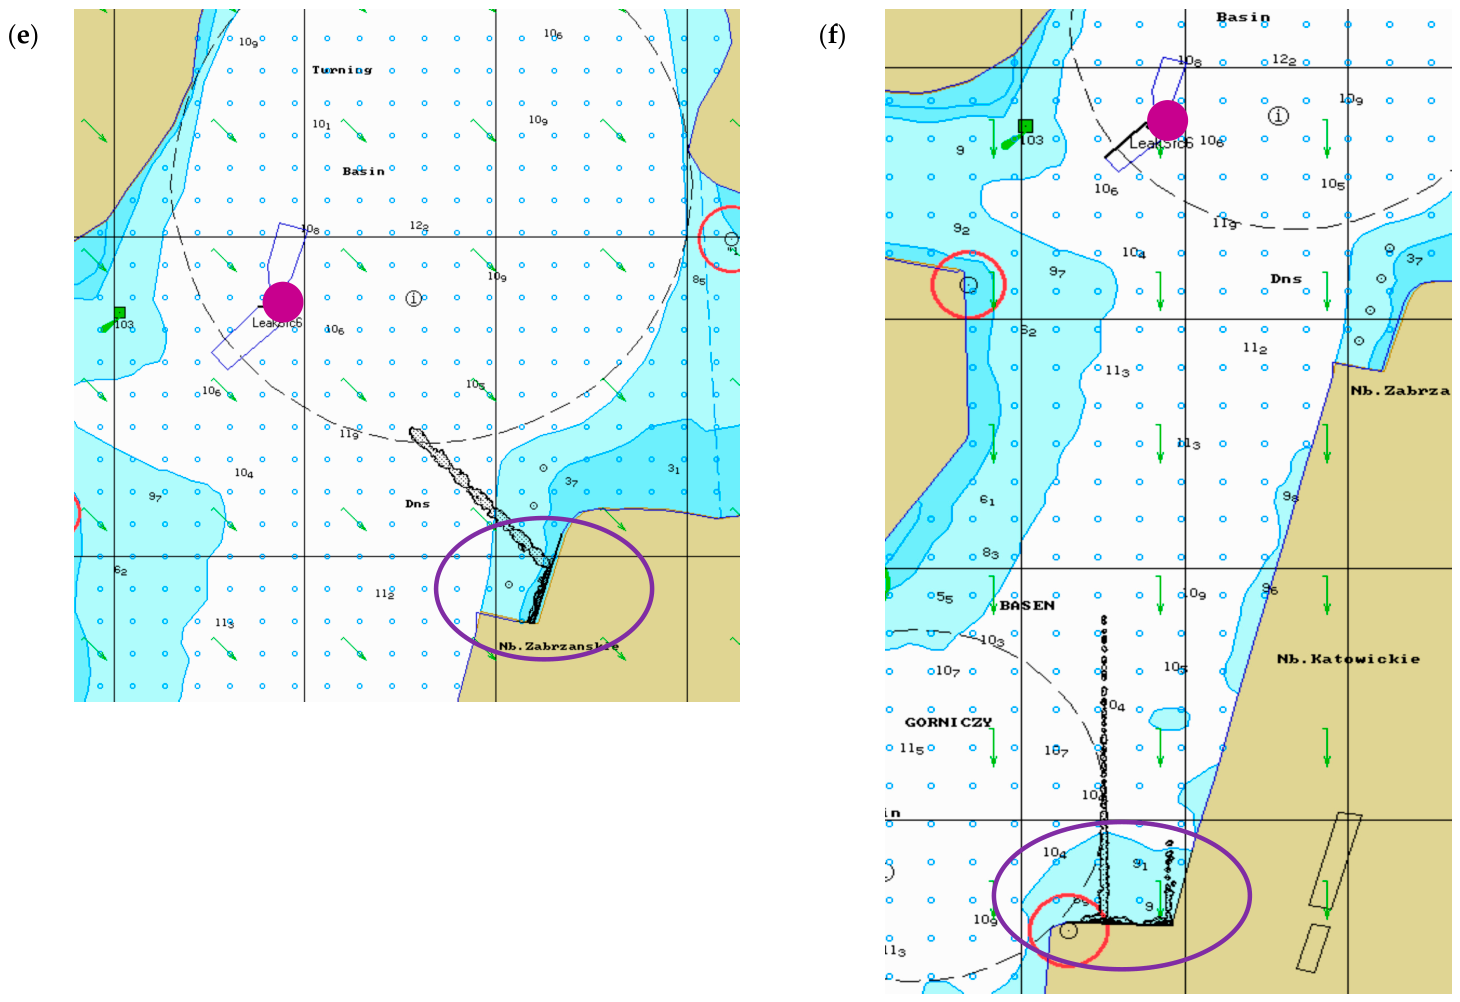
A collision between two vessels was simulated at the turning basin of the Parnica Canal (Figure 3). The simulations were carried out over a 24 h period, with the total volume of oil spilling within 30 min. Over the following hours, the movement, evaporation and dispersion of the oil slick were observed, and, above all, the time taken to reach the shore and the amount of oil stranded on the shore were also observed. Data recording of the spill was carried out automatically every 5 min for the first hour, then every 15 min, and after 6 h of observation no significant changes were observed. Depending on the wind direction and wind speed, the first shoreline contact occurred between 30 and 150 min for IFO300 and between 30 and 95 min for Diesel Fuel Oil, as summarized in Table 5. A spill of 500 kg of oil occurs from one of the ships positioned on the turntable and moves in accordance with the wind direction S (south) and SW; as can be seen, the spill moves and reaches the Natura 2000 protected area of the Lower Odra Valley on the island of Mieleńska Łąka, regardless of whether it is light or heavy oil. With a westerly wind, the oil moves through the Parnica Channel towards Czapli Ostrów Island, where a small amount remains; to Sadlińskie Łąki Island (polluting the shoreline); and reaches Lake Małe Dąbie via the Dąbski Nurt Channel. This entire area is part of the Lower Odra Valley protected zone (Figure 3).
Figure 3.
Trajectories of simulated oil spills recorded for different wind directions and speeds in Scenario C: (a) simulated ship collision; (b) south wind; (c) south-west wind; (d) west wind; (e) north-west wind; (f) north wind (purple dots—spill point; purple arrows—spill trajectory; purple ovals—polluted area). Source: own study.
Table 5.
Time to first shoreline contact and percentage of stranded oil for Scenario C under different wind conditions.
A change in wind direction to the NW (north-west) resulted in the contamination of the Zabrzańskiego Quay, whilst from the N direction all the oil from the spill reached the Mining Basin at the Katowice Quay, where it settled on the concrete quay and mixed with the water.
The data in Table 5 show the amount of oil deposited on the shore and the time at which the oil first came into contact with the shoreline.
2.5. Environmental Consequence Assessment Environmental Consequence Index (ECI) Methodology
The Environmental Consequence Index (ECI) was used to conduct a comparative assessment of the environmental consequences of the analyzed spill scenarios. The spills analyzed were hypothetical but realistic emergency scenarios. Due to the lack of reliable data to determine the probability of specific spills and their associated meteorological conditions, the ECI was used only as a relative measure to compare potential environmental consequences, rather than as a quantitative measure of risk. To achieve full quantitative risk assessment, reliable data on the probability of each scenario occurring needs to be available. This approach is consistent with the principles of contingency planning for oil spills, in which the analysis of reliable scenarios, the predicted directions of oil trajectory, the identification of threatened environmental resources, and the establishment of protection priorities are used to prepare response operations [22,23]. The purpose of the ECI was to identify the scenarios with the greatest potential environmental consequences within a defined set of simulation variants.
Oil contact with sensitive areas and the coastline is considered an indicator of environmental impacts and is aligned with the approaches used in assessing the consequences of oil spills. The Environmental Sensitivity Index (ESI) methodology, developed by NOAA, is used to identify sections of the coastline, biological resources, and areas used by humans that are particularly sensitive to oil pollution [24]. Similarly, recent studies indicate the usefulness of integrating oil spill trajectory modeling with coastal sensitivity analysis to identify the most vulnerable sectors and support planning and response actions [25,26].
Each spill scenario (A–C) comprised 20 individual simulation runs generated from five wind directions (S, SW, W, NW and N), two wind speeds (7 and 10 kn), and two petroleum products (IFO300 and DFO). Four criteria that can be traced directly to the reported simulation outputs were retained in the revised ECI:
- C1, time to first shoreline contact;
- C2, percentage of oil settled on the shore;
- C3, frequency of direct Natura 2000 shoreline/wetland contact among the 20 runs;
- C4, scenario-level spatial extent expressed as the number of distinct shoreline/receptor sectors contacted across the 20-run ensemble.
In model studies of oil spills, the time it takes for oil to reach the shoreline, the amount of oil deposited on the shore, and the spatial extent of the contamination are often used as indicators of potential environmental consequences. Hughes et al. (2023) combined numerical spill modeling with an assessment of shoreline vulnerability, highlighting the importance of the time oil takes to reach the shoreline and the location of vulnerable shoreline sections for planning response measures [26,27].
The response time criteria previously used were removed from the composite index because this study lacked an independent quantitative dataset on the mobilization, arrival, or deployment times of SAR/PSR vessels. Including this criterion requires the adoption of assumptions not supported by data and, moreover, would partially duplicate the temporal information already represented by criterion C1. This distinction is compliant with emergency planning procedures, in which the assessment of a spill’s trajectory and potential consequences is considered separately from the operational aspects of mobilizing and deploying rescue resources [22]. The implications for rescue operations were therefore discussed separately and were not included as a separate component of the ECI.
C1 (time to first shoreline contact) and C2 (percentage of stranded oil) were determined for each individual simulation run and subsequently aggregated at the scenario level. In contrast, C3 (frequency of direct Natura 2000 contact) and C4 (spatial extent) were determined directly at the scenario level across the complete set of 20 simulation runs. Specifically, C3 was calculated as the proportion of the 20 runs in which direct contact with a Natura 2000 shoreline or wetland receptor was confirmed, whereas C4 was determined as the total number of distinct shoreline sections and environmental receptors contacted across the 20-run ensemble for a given scenario. Contact with a Natura 2000 area was recorded only when the simulated oil spill directly reached the shoreline or a wetland area belonging to the Lower Odra Valley Natura 2000 area. The movement of oil toward a protected area without direct contact was not considered pollution. If, within a single simulation, the oil reached the same receptor multiple times, contact was recorded in a single occurrence. A section of the shoreline or an environmental receptor was defined as a separately located and clearly identified unit indicated in the simulation results, such as a pier, the shore of an island, a wetland, or the shore of a harbor basin or lake. This approach is compliant with the principles of environmental sensitivity assessment, in which the potential consequences of a spill are determined based on its impact on specific, sensitive shoreline segments and natural resources, rather than solely on the basis of the spill’s total spatial extent [24].
The operational definitions used in Table 6 were formulated in such a way that all criteria could be directly determined based on the results of the PISCES II simulation. The use of parameters that were directly reported or unambiguously identified in the model results was intended to increase methodological transparency and the repeatability of the assessment. In the case of criterion C3, the calculations used 20 simulation runs assigned to each scenario. The value of this criterion can therefore be repeated by determining the number of runs in which direct contact between the spill and the Natura 2000 area was observed. Criterion C4 is defined in terms of the total number of distinct, unambiguously identified sections of the shoreline and environmental receptors with which the oil came into contact across the entire set of 20 runs for a given scenario. The consideration of specifically identified receptors is consistent with approaches used in environmental sensitivity assessment and emergency planning, in which particular importance is attached to the identification of natural resources potentially exposed to oil contamination [22,24,25]. The values of the criteria at the scenario stage were determined on the results of individual simulation runs, using aggregation rules appropriate to the nature of each criterion (Table 7). These rules were adopted to preserve information about the most significant potential environmental consequences within the set of 20 runs. For criterion C1 (time to first oil contact with the shoreline), the shortest contact time recorded among the 20 runs was adopted as the representative value for the scenario, as it corresponds to the variant providing the narrowest time window for taking protective actions. For criterion C2 (percentage of oil settlement on the shoreline), the highest percentage of oil settled on the shoreline among the 20 runs was adopted, representing the scenario with the greatest potential impact on the shoreline. In C1 and C2, the principle of maximum consequences was applied. For criterion C1, it corresponds to the minimum time value, and for C2, to the maximum percentage of oil settled on the shore. Criterion C3 is determined on the basis of the number of confirmed direct spills in a Natura 2000 area across 20 runs, while C4 is determined on the basis of the total number of different sections of the shoreline and environmental receptors with which the oil came into contact across the entire set of simulations for a given scenario. All four criteria were assigned equal weights (w = 0.25). The use of equal weights was a methodological assumption applied in this study, as there was no reliable empirical data to justify differentiating the importance of individual criteria. This approach made it possible to avoid arbitrarily assigning different weights based on expert assessments, which, in the case of the Port of Szczecin, would not have been sufficiently justified. The equal weights adopted should therefore not be treated as a standard method for weighting criteria in the assessment of oil spill consequences.
Table 6.
Environmental consequence scoring system and operational definitions used for the ECI assessment.
Table 7.
Traceability of scenario-level criterion scores obtained using criterion-specific aggregation rules.
The scenario-level Environmental Consequence Index was calculated as
where:
- ECIs—Environmental Consequence Index for scenario (A, B or C);
- Ci,s—score for criterion i for scenario s, on a scale of 1–5.
The resulting ECI ranges from 1 to 5 and is classified as low (1.00–1.99), moderate (2.00–2.99), high (3.00–3.99), or very high (4.00–5.00) (Table 8). These classes are used only for relative comparison within the present scenario set. The scoring framework is study-specific and is not presented as a standardized or externally validated probabilistic risk scale. In particular, the ECI quantifies relative environmental consequences within the tested scenario space; it does not incorporate occurrence probabilities.
Table 8.
Scenario-level Environmental Consequence Index calculated using criterion-specific aggregation rules.
Application of the described procedure provided ECI values of 3.50 for Scenario A (high), 4.50 for Scenario B (very high), and 4.25 for Scenario C (very high). Scenario A is characterized by a very short time to the first contact of the oil with the shoreline and a very high proportion of oil settled on the shore; however, in the analyzed simulations, no direct contact between the spill and the Lower Oder Valley Natura 2000 area was observed. The highest ECI value occurred in Scenario B, in which the most unfavorable variants were characterized by a relatively short time to first contact with the shoreline, a very high proportion of oil settled on the shore, and repeated direct contact with a Natura 2000 area. Furthermore, across the entire set of 20 simulations, the oil reached at least five different sections of the shoreline or environmental receptors. Scenario C was also classified as having very high environmental consequences. Direct contact with the Natura 2000 site occurred under wind conditions from the S, SW, and W directions, in a total of 12 out of 20 runs, and involved at least five different sections of the coastline or environmental receptors. At the same time, the shortest time to first contact shoreline occurred in Scenario C and lasted longer than in Scenarios A and B. The resulting ranking can be repeated on clearly defined quantitative operational rules and should be interpreted as a comparative assessment of the relative environmental impacts of the analyzed scenarios, rather than as a probabilistic risk assessment that takes into account the likelihood of their occurrence.
2.6. Study Limitations
The simulations represent hypothetical accident scenarios and should therefore be interpreted as comparative analyses rather than deterministic forecasts. Because no historical large-scale oil spill has occurred in the Port of Szczecin, direct validation against observed spill trajectories was not possible. A limitation of this study is that the simulations did not take currents into account. Consequently, the influence of river flow and estuarine circulation on oil transport was not evaluated. The simulations therefore represent comparative scenario analyses under simplified environmental conditions. These limitations are common to scenario-based oil spill modeling and should be considered when interpreting the results [2,3].
3. Analysis of the Simulation Results
3.1. Oil Spill Trajectories
The simulated spill trajectories demonstrated that the direction of the spill depended primarily on wind direction and, to a lesser extent, on spill location and oil type. Although both analyzed petroleum products followed similar trajectories, heavy fuel oil (IFO300) exhibited greater shoreline persistence, whereas Diesel Fuel Oil (DFO) showed increased evaporation and dispersion during the early stages of the simulation. The response of individual spill locations differed primarily because of spill location, shoreline configuration and wind direction under the adopted simulation assumptions. In Scenario A, the spill remained largely confined to the Industrial Canal, resulting in rapid shoreline contact but limited transport towards environmentally sensitive areas. In contrast, Scenarios B and C allowed oil to migrate through interconnected navigation channels towards the Lower Odra Valley Natura 2000 area under southerly, south-westerly and westerly wind conditions (Figure 1, Figure 2 and Figure 3).
Wind direction proved to be the dominant factor controlling spills. Southern and south-western winds moved oil towards protected wetlands, whereas northern winds redirected contaminants towards industrial quays, thereby reducing the likelihood of Natura 2000 contamination.
3.2. Shoreline Contamination
The level of pollution along the shoreline depends mainly on the direction and force of the wind. The highest shoreline contamination occurred in the confined Industrial Canal (Scenario A), where more than 95% of the released oil reached the shoreline under strong wind. The first contact with the shoreline frequently occurred within 5–30 min, indicating a very limited time available for emergency response.
Scenario B exhibited greater variability owing to the geometric connectivity of the navigation channels of the Parnica Channel. Under south-western winds, shoreline contamination exceeded 90% of the released oil and extended to protected wetland areas. Conversely, northern winds resulted primarily in contamination of industrial quays with substantially lower environmental consequences.
Scenario C produced the greatest spatial extent of contamination. Depending on wind direction, oil was moved simultaneously towards several navigation channels, resulting in contamination of both industrial shorelines and Natura 2000 habitats. Although the total stranded mass was generally lower than in Scenario A, the larger contaminated area increased the overall environmental impact.
3.3. Oil Transformation
Processes connected to transformation of oil substances differed substantially between the two analyzed petroleum products. As expected, the light fuel (DFO) exhibited considerably greater evaporation and natural dispersion throughout the simulation period, whereas heavy fuel oil (IFO300) remained largely on the water surface and subsequently accumulated along shorelines.
The greatest differences between both oils were observed during the first hours after the spill occurred. Evaporation of DFO reduced the floating oil mass, while IFO300 maintained high persistence and produced substantially larger stranded quantities. Consequently, heavy fuel oil represented the greater long-term shoreline contamination hazard despite its lower weathering rate (Figure 4, Figure 5, Figure 6, Figure 7, Figure 8 and Figure 9).
- Scenario A
In the analyzed scenario, the first contact between the oil IFO300 and the Industrial Quay in amounts of 69 kg (7 kn) and 64 kg (10 kn) was recorded at the 15 min mark, with a southerly (S) wind. In subsequent variants of this scenario, heavy oil (IFO300) pollution from the SW and W wind directions reached Mieleński Ostrów island in quantities of 491 kg (7 kn) and 496 kg (10 kn) respectively; from the NW direction, the oil also contaminated Mieleński Ostrów Island—231 kg (7 kn) and 259 kg (10 kn)—and the CPN-3 Quay—130 kg (at wind force of 7 kn) and 100 kg (10 kn). Meanwhile, with an N wind, the oil settled on the Power Plant Quay in an amount of approximately 102 kg (at wind forces of 7 and 10 kn). The situation was similarly observed for light DFO for wind from:
- S—Mieleński Ostrów—63 kg (7 kn) and 59 kg (10 kn).
- SW—Mieleński Ostrów—490 kg (7 kn) and 486 kg (10 kn).
- W—Mieleński Ostrów—492 kg (7 kn) and 487 kg (10 kn).
- NW—Mieleński Ostrów—229 kg (7 kn) and 56 kg (10 kn); CPN-3 Quay—103 kg (7 kn) and 154 kg (10 kn).
- N—Power Plant Quay—102 kg (at wind speeds of 7 and 10 kn).
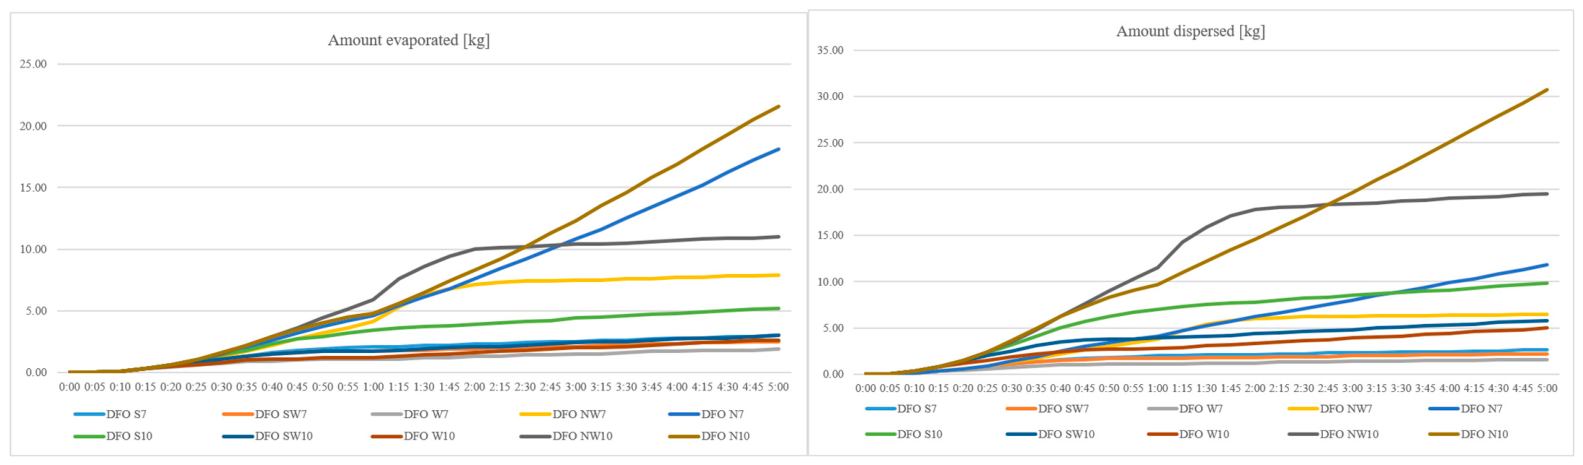
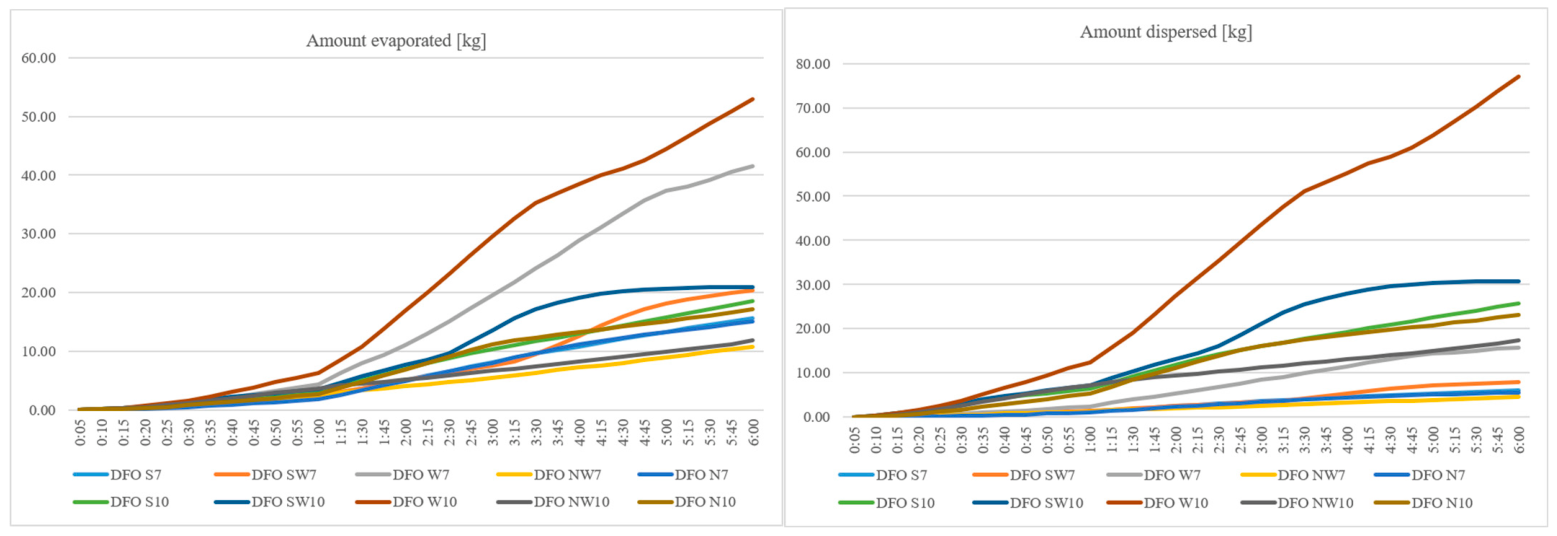
The figures present data up to 5 h into the study, as subsequent data do not show statistically significant changes. Figure 4 shows the time taken for light and heavy oil to settle on the shore and the quantities involved. The results indicate that dispersion and evaporation were only evident with light oil (DFO), as its lighter fractions have a greater capacity for evaporation and dispersion (Figure 5). Analysis of the results in this scenario showed that a spill in the Industrial Canal would not affect the Lower Odra Valley protected area, whilst the SAR service’s activities should focus on containing the spill from the rest of the area using booms and removing the pollution.
Figure 4.
Amount of heavy (IFO300) and light (DFO) oil stranded on the shore in Scenario A. Source: own study.
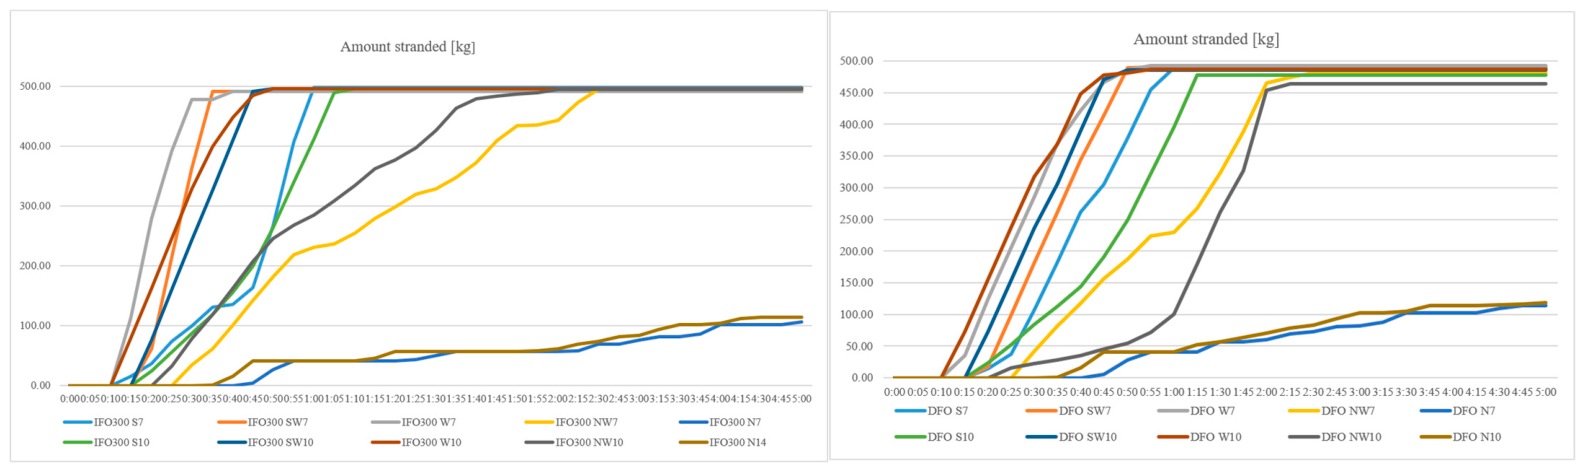
Figure 5.
Amount of dispersed and evaporated light oil (DFO) in Scenario A. Source: own study.
- Scenario B
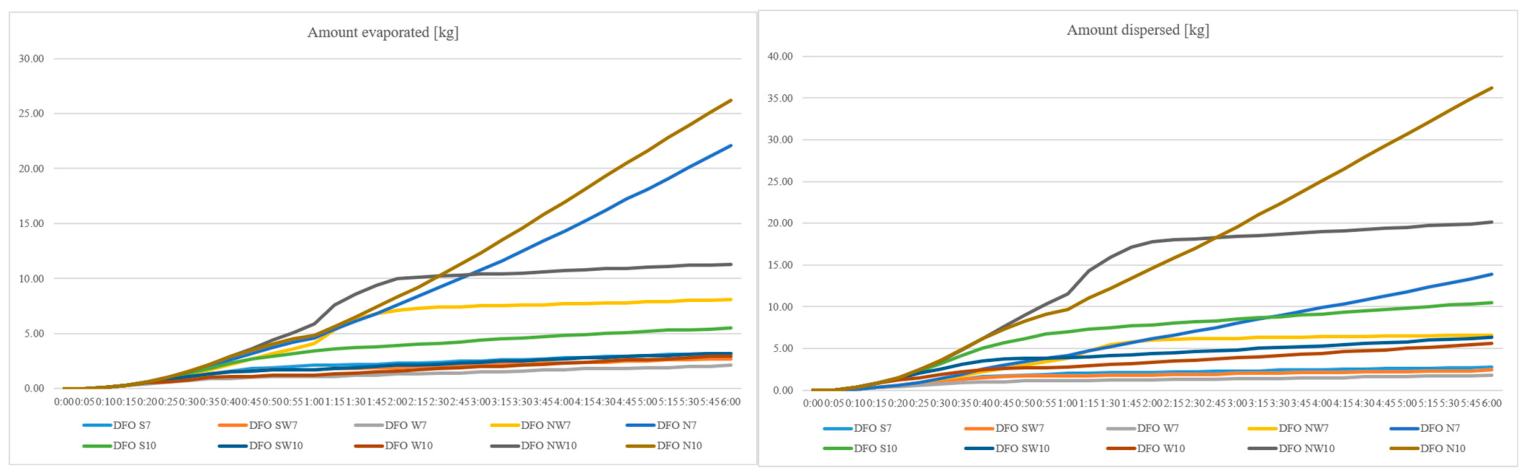
The meteorological and hydrological conditions were identical to those in the previous scenario, whilst the vessel was simulated at the CPN Quay in the Parnica Channel. The oil first made contact with the shoreline as early as 15–20 min into the study; however, with winds from the west (W) and north (N), this contact occurred much later, only 90 min after the spill. This was due to the westerly (W) and northerly (N) wind directions, and in this case, the response time for SAR services was by far the longest. As can be seen in Figure 6, the rate of oil deposition was higher for light oil, as were evaporation and dispersion (Figure 7). With a southerly (S) wind, IFO300 oil settled on Mieleński Ostrów with 219 kg (7 kn) and 240 kg (10 kn), whilst DFO settled with 259 kg (7 kn) and 258 kg (10 kn). From the SW, IFO300 oil settled on Mieleński Ostrów with 283 kg (at wind speeds of 7 and 10 kn) and on Mienia Island with 184 kg (7 kn) and 203 kg (10 kn), while DFO settled on Mieleński Ostrów with 283 kg (at wind speeds of 7 and 10 kn) and on Mienia Island with 186 kg (7 kn) and 165 kg (10 kn). With a westerly wind direction (W), IFO300 oil settled on protected areas with 231 kg (7 kn) and 220 kg (10 kn), and DFO settled with 225 kg (7 kn) and 212 kg (10 kn). From the NW and N directions, IFO300 and DFO settled on the CPN-4 with approximately 102 kg (at wind speeds of 7 and 10 kn). This simulation demonstrated that such a spill location affects the ecosystem of the Lower Odra Valley protected area, which includes, amongst others, the islands of Mieleńska Łąka, Ostrów Czapli, and Łąki Sadlińskie, as well as the Dąbski Nurt Canal and Lake Małe Dąbie. In this scenario, under certain conditions, SAR services were able to act before the protected area was polluted, setting up booms, whilst in other scenarios they secured the polluted area and collected the oil.
Figure 6.
Amount of heavy (IFO300) and light (DFO) oil stranded on the shore in Scenario B. Source: own study.
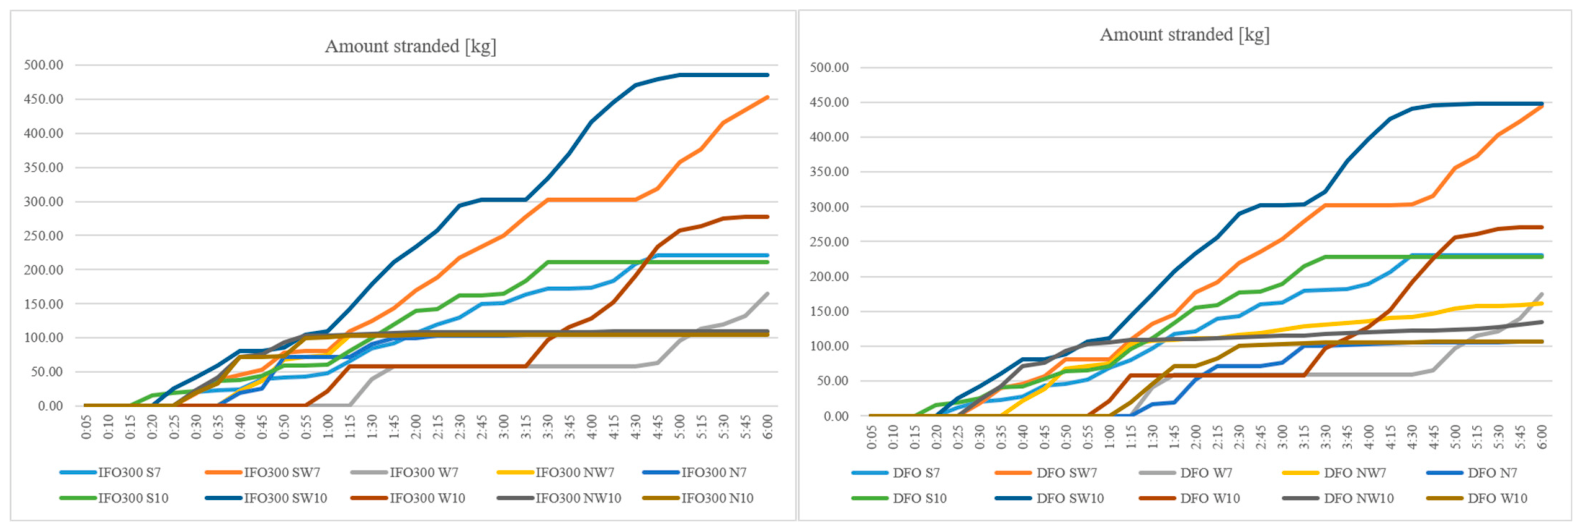
Figure 7.
Amount of dispersed and evaporated light oil (DFO) in Scenario B. Source: own study.
- Scenario C
Scenario C showed that simulating a collision between ships at the turning area in the Parnica Canal leads to contamination of the Lower Odra Valley Natura 2000 area, with S, SW and W winds. With a southerly wind, the protected area was polluted with heavy oil in quantities of 414 kg (7 kn) and 410 kg (10 kn); with a SW wind, 266 kg (7 kn) and 261 kg (10 kn); and with a westerly (W) wind, 258 kg (7 kn) and 249 kg (10 kn). In the case of light oil (DFO), the situation was similar: from the south (S)—361 kg (7 kn) and 329 kg (10 kn); from the south-west (SW)—348 kg (7 kn) and 344 kg (10 kn); and from the west (W)—254 kg (7 kn) and 242 kg (10 kn). For NW and N winds, the oil reached the Basen Gorniczy and did not affect the protected area. Figure 8 shows the dynamics of oil deposition on the shores of islands belonging to the Natura 2000 area. Figure 9 shows a comparison of dispersed and evaporated light oil.
In this simulation, SAR or PSR (Port Rescue Services) would have sufficient time to carry out preventive measures, e.g., deploying booms, before the Lower Odra Valley Natura 2000 area is polluted.
Figure 8.
Amount of heavy (IFO300) and light (DFO) oil stranded on the shore in Scenario C. Source: own study.
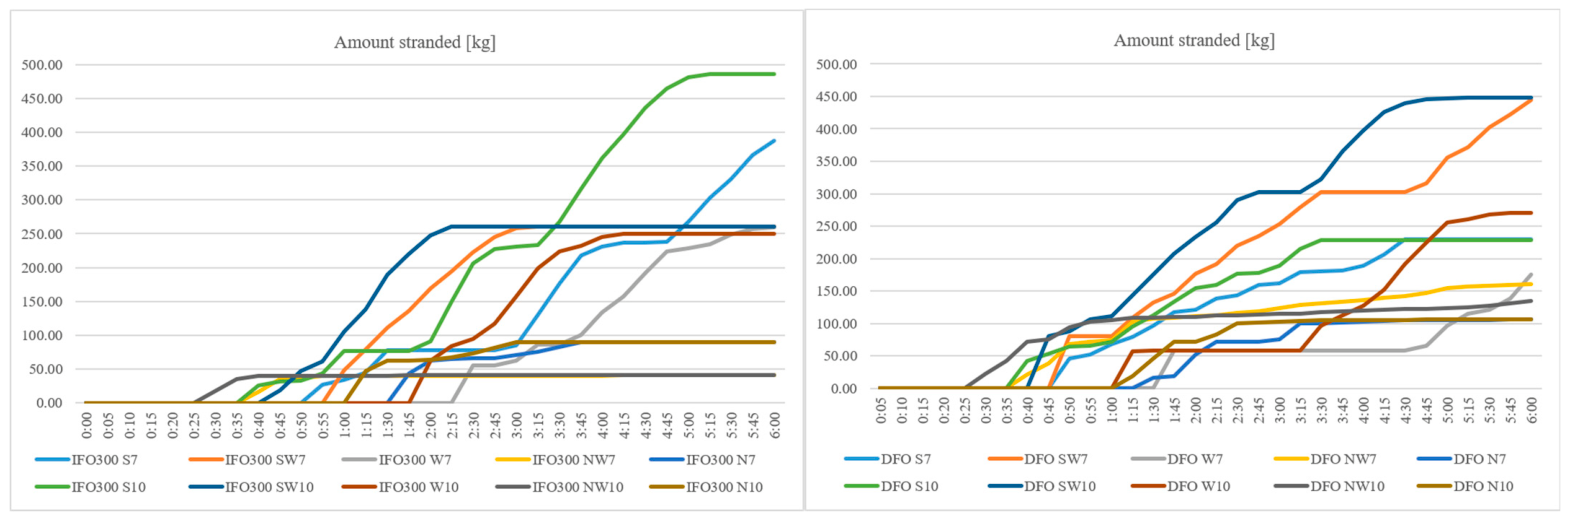
Figure 9.
Amount of dispersed and evaporated light oil (DFO) in Scenario C. Source: own study.
3.4. Environmental Consequence Assessment Results
The revised environmental consequence assessment demonstrated considerable differences between the analyzed oil spill scenarios.
Scenario A was characterized by the shortest shoreline contact time, typically less than 30 min, resulting in limited opportunities for external emergency response. Nevertheless, pollution remained largely confined to industrial shorelines, and no significant impact on Natura 2000 habitats was predicted.
Scenario B represented the greatest environmental consequence under the revised ECI (4.50). Its ranking reflects the combination of relatively rapid shoreline contact, a high proportion of oil settled on the shore, confirmed contact with a Natura 2000 area in at least eight of the 20 simulation runs, and contamination of at least five distinct sectors of sensitive areas across the entire set of scenarios.
Scenario C exhibited the greatest spatial variability. Depending on meteorological conditions, contaminants were transported either towards industrial areas or towards environmentally sensitive wetlands. Southerly, southwesterly, and westerly winds consistently generated the highest environmental consequences owing to contamination of protected habitats, whereas northern winds restricted oil movement to port infrastructure.
Overall, the results indicate that spill location and wind direction were the dominant factors determining environmental consequences, whereas differences between the two analyzed petroleum products primarily affected oil dispersion and evaporation rather than the general oil spill trajectories.
4. Discussion
This study shows that the environmental consequences of accidental oil spills in the Port of Szczecin are determined primarily by the interaction of wind direction and speed, the configuration of transport channels, and the location of the spill. Differences among the petroleum products analyzed mainly affect the persistence of the oil and the course of its transformation processes. These results are consistent with the general understanding of the mechanisms of oil spill trajectory, according to which the horizontal movement of oil on the water’s surface is controlled primarily by surface currents and wind effects, while the physicochemical properties of the product mainly determine its transformation processes, including evaporation, emulsification, and persistence after contact with the shoreline [2,3].
4.1. Oil Spill Trajectories in Confined Estuarine Waters
The simulations confirmed that wind direction is the dominant factor determining spill trajectories within the Port of Szczecin. Southern and south-western winds transported oil towards hydraulically connected waterways leading to the Lower Oder Valley Natura 2000 protected area, whereas northern winds generally redirected spills toward industrial quays. Similar observations have been reported in studies using MEDSLIK-II and other Lagrangian particle-tracking models, where changes in wind direction resulted in substantial differences in shoreline pollution despite identical spill volumes [4,7].
In contrast to the open sea, where oil trajectory is often dominated by regional circulation, estuarine ports are characterized by short transport routes, a modified coastline, and a complex grid of channels. Previous studies show that these characteristics significantly reduce the time available for response operations and increase the importance of local hydrodynamic conditions [2]. The rapid contact with the shoreline observed in this study, particularly in Scenario A, is consistent with the expected movement of the spill in confined waterways and is not a unique characteristic of the Port of Szczecin.
4.2. Comparison with Alternative Oil Spill Models
Despite the fact this study used the PISCES II model, the relationships identified for the Port of Szczecin are qualitatively consistent with the results obtained using other recognized oil spill modeling systems. A direct quantitative comparison is not possible, as the published studies differ in terms of hydrodynamic conditions, spatial resolution, spill characteristics, and model configurations. A qualitative comparison allows us to assess whether the observed relationships correspond to the mechanisms described in the literature.
Similar correlations were found in model studies conducted in confined port environments. Model simulations of the M/V Marathassa oil spill in the Port of Vancouver showed that local environmental conditions and the geometry of the harbor significantly influenced the predicted oil trajectory and the extent of shoreline exposure to contamination [27]. Regardless of different hydrodynamic conditions and model setups, both the Vancouver study and this analysis highlight the critical importance of the spill location and local environmental conditions, particularly in areas where the distance between the oil spill area and sensitive receptors is small.
The strong influence of wind direction and speed observed in the simulations for the Port of Szczecin is also consistent with the results obtained using other Lagrangian models. In MEDSLIK-II, oil trajectory is simulated considering advection and diffusion processes that depend on environmental conditions. Validation studies showed that the accuracy of spill trajectory predictions depends primarily on the quality and resolution of the environmental data used by the model [7,28]. MEDSLIK-II separates the processes responsible for oil trajectory from those responsible for its transformation, which allows for a separate interpretation of the factors determining the trajectory and lifetime of the contamination.
The GNOME model uses a similar approach, in which the oil is represented by Lagrangian particles moving in accordance with specified flow fields and other environmental factors [29]. OpenDrift employs a modular Lagrangian structure that allows for the use of data on currents, atmospheric conditions, and wave conditions obtained from external models or observations [30]. These examples confirm the importance of the scale and quality of environmental data used as input in spill trajectory simulations.
The results obtained for the Port of Szczecin are in line with these observations in terms of quality; in the adopted PISCES II configuration, wind direction and the location of the spill largely determined whether the pollution remained within the port’s industrial sectors or reached environmentally sensitive areas. However, this comparison should be interpreted with caution, as externally supplied hydrodynamic currents were not taken into account in these simulations. The results for Szczecin primarily present a scenario-based assessment of the oil’s trajectory under specified wind conditions and the assumed model configuration, rather than a complete representation of estuarine circulation. For this reason, the applicability of the quantitative results to other estuarine ports is limited, whereas the identified correlations can be compared on a qualitative level.
4.3. Influence of Oil Properties
Simulations showed that IFO300 and Diesel Fuel Oil (DFO) followed similar trajectories but differed significantly in terms of their degradation processes. DFO exhibited greater evaporation and natural dispersion in the early stages of the simulations, while IFO300 remained on the water’s surface longer and resulted in greater amounts of oil settling on the shore. The higher content of oil settled on the shoreline observed for IFO300 should be interpreted primarily because of its greater resistance and slower rate of degradation, rather than as evidence of stronger or faster movement toward the shoreline. These observations are in line with laboratory and outdoor studies indicating that heavy fuels generally exhibit greater persistence and cause greater shoreline contamination than lighter distillate fuels due to their lower evaporation rates and higher viscosity [1,15]. Although the type of oil affected the stability of the contamination, its impact on the spill’s trajectory was secondary compared to wind direction and strength, as well as the port’s geometry. Similar conclusions were presented by Keramea et al. [3], who identified environmental conditions as the primary factor controlling oil movement, while oil properties primarily determine the extent and duration of environmental exposure.
4.4. Implications for Natura 2000 Protected Areas
One of the most important outcomes of this study is the identification of spill scenarios capable of affecting the Lower Odra Valley Natura 2000 protected area. Under selected meteorological conditions, particularly southerly and south-westerly winds, oil was transported through interconnected channels towards environmentally protected areas. These findings are in line with previous investigations showing that estuarine wetlands are especially vulnerable to petroleum contamination because restricted water circulation and dense vegetation favor long-term oil retention and slow natural recovery [15,31].
The results also support the principles of the Environmental Sensitivity Index (ESI), according to which ecologically valuable wetlands constitute priority protection areas during oil spill response operations [13]. Although the present study did not quantify ecological damage directly, the simulations identify environmental conditions under which protected habitats are most likely to be exposed, thereby providing information that may support contingency planning and prioritization of response measures.
4.5. Emergency Response Implications
Simulations showed that pollution of the shoreline often occurred within less than one hour of the spill occurring, leaving only a limited amount of time for rescue operations. Similar response time windows exist for other confined port systems, where short transport distances and limited water exchange significantly reduce the effectiveness of rescue operations [2]. These results indicate that local rescue resources permanently stationed in the Port of Szczecin may be more effective in the initial phase of an incident than outside vessels that require a longer mobilization time. This observation is in line with the recommendations of the International Maritime Organization [32], which emphasize that quickly limiting the spread of an oil spill before it reaches the shoreline is the most effective strategy for reducing environmental damage.
4.6. Study Limitations and Future Research
The results should be interpreted within the limitations of the adopted methodology. First, the analyzed scenarios represent hypothetical but realistic operational accidents and were not validated against observations from historical oil spills, because no suitable datasets are available for the Port of Szczecin. Consequently, simulations should be regarded as comparative scenario analyses rather than deterministic predictions of future spill trajectories.
Second, this study did not quantify uncertainty associated with meteorological and hydrodynamic conditions or model parameterization. Recent reviews consistently identify uncertainty analysis and model validation as important research priorities in oil spill simulations [2,3]. Future work should therefore include sensitivity analyses for the wind conditions, spill volume, and oil properties specified in the simulation, as well as comparisons with observations of historical spills or alternative numerical models once relevant data become available.
A key limitation of this study is that hydrodynamic currents were not directly accounted for in the numerical simulations. As a result, the oil’s trajectory was driven primarily by wind conditions and interactions with the coastline. This simplification was adopted to ensure a consistent comparison of the simulated oil spill scenarios; however, it may lead to an underestimation or overestimation of oil movement in areas where local circulation associated with river flow or estuarine water exchange significantly affects surface flow. Previous studies show that combined wind and current conditions generally increase the realism of simulated oil spill trajectories, particularly in estuarine and semi-enclosed waters [2,3,7]. Therefore, these results should be interpreted as comparative simulation analysis rather than a deterministic forecast.
4.7. Scientific Contribution
In contrast to many previous studies focusing on the open-sea environment or major oil tanker accidents, this study analyzes the trajectory of oil spills in a river-estuary port directly adjacent to internationally protected wetlands. While previous studies in ports and semi-enclosed waters focused mainly on predicting spill trajectories, hydrodynamic conditions, or the exposure of the shoreline to oil pollution, this study expands on that approach by providing a comprehensive assessment of spill trajectories, the exposure of protected wetlands to oil pollution, environmental consequences, and the response time of emergency response services within a single scenario for a river-estuary port directly adjacent to Natura 2000 habitats. The main contribution of this study is not the application of the PISCES II model itself, but the integration of simulated trajectory modeling with a transparent assessment of environmental consequences under representative operating conditions. This approach enables the identification of emergency scenarios posing the greatest threat to Natura 2000 habitats and provides information directly useful for emergency planning in estuarine ports.
5. Conclusions
This study does not propose new physical mechanisms to describe oil spill trajectory but rather presents the application of an integrated approach that combines spill trajectory modeling with an assessment of its potential environmental consequences in the complex system of a river-estuary port. The main contribution of this work is the development of an assessment adjusted to the specific characteristics of the Port of Szczecin, including numerical simulations of spill trajectories, the identification of environmentally sensitive areas, and an analysis of the time it takes for the spill to reach the shoreline and protected areas. The results obtained can support emergency response planning and environmental management in estuarine ports located in the vicinity of protected ecosystems. The simulations showed that, in the analyzed scenarios, the direction of the spill’s trajectory and the point of contact with the shoreline depended primarily on wind direction, the location of the spill, and the spatial configuration of the basins, channels, and shoreline. Differences between the analyzed petroleum products were evident mainly in their transformation processes, particularly evaporation and dispersion.
The results indicate that spills occurring in waterways connected to surrounding water may pose a greater threat to the adjacent Natura 2000 area of the Lower Odra Valley than spills occurring in more enclosed industrial basins. In some of the analyzed scenarios, oil reached the shoreline relatively soon after the spill occurred, highlighting the importance of taking quick action to limit the further spread of the spill.
Combining numerical spill simulations with a comparative assessment of environmental consequences made it possible to identify scenarios that could cause the greatest potential environmental impacts. This approach can support emergency planning by identifying particularly sensitive areas that require priority protection and by highlighting conditions under which the time window available to take measures to reduce the effects of a spill may be particularly tight.
The study results should be interpreted with the acknowledged limitations in mind. The analyzed scenarios represent hypothetical but realistic emergency scenarios and have not been validated based on observations of actual oil spills in the Port of Szczecin, due to a lack of relevant historical data. The simulations did not account for spatially and temporally variable water current fields. The analysis focused on specified wind conditions, the location of the spill, the type of petroleum product, and the localization of the water area. Uncertainties related to meteorological conditions and model parameters were also not directly quantified. For this reason, the results obtained should be treated as a comparative assessment of the analyzed scenarios, rather than as accurate predictions of actual oil trajectory in the estuary.
Despite these limitations, the study provides information on the potential consequences of oil spills in a river-estuary port system located in the proximity of protected areas. The methodology used can be adapted to other estuary ports with a similar layout. Future studies should consider local, spatially and temporally variable data on water currents and compare results obtained using different oil spill simulators. This would allow for determining the impact of estuarine water circulation on spill trajectories and for better assessing the accuracy of simulation results.
Author Contributions
Conceptualization, W.J.; methodology, W.J.; validation, D.J., W.J. and K.D.; formal analysis, D.J.; investigation, D.J.; resources, D.J.; data curation, D.J.; writing—original draft preparation, D.J.; writing—review and editing, K.D.; visualization, D.J.; supervision, D.J.; project administration, D.J. All authors have read and agreed to the published version of the manuscript.
Funding
This research received no external funding.
Institutional Review Board Statement
Not applicable.
Informed Consent Statement
Not applicable.
Data Availability Statement
The raw data supporting the conclusions of this article will be made available by the authors on request. The datasets presented in this article are not available because due to technical. Requests to access the datasets should be directed to Dorota Jarząbek.
Acknowledgments
The authors have reviewed and edited the output and take full responsibility for the content of this publication.
Conflicts of Interest
The authors declare no conflicts of interest.
References
- International Tanker Owners Pollution Federation (ITOPF). Oil Tanker Spill Statistics 2023; ITOPF Ltd.: London, UK, 2024. [Google Scholar]
- Spaulding, M.L. State of the art review and future directions in oil spill modeling. Mar. Pollut. Bull. 2017, 115, 7–19. [Google Scholar] [CrossRef] [Scilit] [PubMed]
- Keramea, P.; Spanoudaki, K.; Zodiatis, G.; Gikas, G.; Sylaios, G. Oil Spill Modeling: A Critical Review on Current Trends, Perspectives, and Challenges. J. Mar. Sci. Eng. 2021, 9, 181. [Google Scholar] [CrossRef] [Scilit]
- Reed, M.; Johansen, Ø.; Brandvik, P.J.; Lewis, P.D.A.; Fiocco, R.; Mackay, D.; Prentki, R. Oil Spill Modeling towards the Close of the 20th Century: Overview of the State of the Art. Spill Sci. Technol. Bull. 1999, 5, 3–16. [Google Scholar] [CrossRef] [Scilit]
- Liubartseva, S.; Coppini, G.; Lecci, R.; Creti, S. Regional approach to modelling oil spill hazard in the Mediterranean Sea. Mar. Pollut. Bull. 2015, 92, 247–259. [Google Scholar] [CrossRef] [Scilit] [PubMed]
- Barker, C.H.; Kourafalou, V.H.; Beegle-Krause, C.; Boufadel, M.; Bourassa, M.A.; Buschang, S.G.; Androulidakis, Y.; Chassignet, E.P.; Dagestad, K.-F.; Danmeier, D.G.; et al. Progress in Operational Modeling in Support of Oil Spill Response. J. Mar. Sci. Eng. 2020, 8, 668. [Google Scholar] [CrossRef] [Scilit]
- De Dominicis, M.; Pinardi, N.; Zodiatis, G.; Lardner, R. MEDSLIK-II, a Lagrangian marine surface oil spill model for short-term forecasting—Part 1: Theory. Geosci. Model Dev. 2013, 6, 1851–1869. [Google Scholar] [CrossRef] [Scilit]
- Zainul, F.M.A.; Akmal, F.; Setyawan, F.O.; Sartimbul, A. Oil spill trajectory simulation and environmental sensitivity index mapping: A case study of Tanjung Priok, Jakarta. J. Environ. Eng. Sustain. Technol. 2021, 8, 47–54. [Google Scholar] [CrossRef] [Scilit]
- Zodiatis, G.; Lardner, R.; Alves, T.M.; Krestenitis, Y.; Perivoliotis, L.; Sofianos, S.; Spanoudaki, K. Oil spill forecasting (prediction). J. Mar. Res. 2017, 75, 923–953. [Google Scholar] [CrossRef] [Scilit]
- Morell, M.; Espino, M.; Grifoll, M.; Mestres, M. Environmental Management System for the Analysis of Oil Spill Risk Using Probabilistic Simulations. Application at Tarragona Monobuoy. J. Mar. Sci. Eng. 2020, 8, 277. [Google Scholar] [CrossRef] [Scilit]
- De Dominicis, M. Stochastic Oil Spill Modelling for Environmental Protection at the Port of Taranto (Southern Italy). Mar. Pollut. Bull. 2021, 171, 112744. [Google Scholar] [CrossRef] [Scilit] [PubMed]
- European Commission. Managing Natura 2000 Sites; The Provisions of Article 6 of the Habitats Directive 92/43/EEC; European Commission: Brussels, Belgium, 2019. [Google Scholar]
- White, M.; Boring, C.; Horsman, J.; Szathmary, L.; Beckham, K.; Michel, J.; Wright, R.; Rutherford, N. Environmental Sensitivity Index Guidelines, Version 5.0; NOAA Technical Memorandum, NOS OR&R 57; National Oceanic and Atmospheric Administration: Brussels, Belgium, 2026. [CrossRef]
- Transas Ltd. PISCES II Manual, Version 2.93; Transas Ltd.: Cork, Ireland, 2008.
- Fingas, M. Handbook Oil Spill Science and Technology: Prevention, Response and Clean-Up, 2nd ed.; Gulf Professional Publishing: Oxford, UK, 2017. [Google Scholar] [CrossRef] [Scilit]
- Łazuga, K.; Gucma, L.; Perkovic, M. M/t “Baltic Carrier” accident. The reconstruction of oil spill with PISCES II simulator application. Sci. J. Marit. Univ. Szczec. 2013, 36, 110–115. [Google Scholar]
- Juszkiewicz, W. Potential oil spills in the TSS Słupska Bank area—Case study using the PISCES II simulator. Sci. J. Marit. Univ. Szczec. 2020, 133, 71–80. [Google Scholar] [CrossRef] [Scilit] [PubMed]
- Jarząbek, D.; Juszkiewicz, W. Analysis of the impact of selected hydrometeorological conditions on the accuracy of oil spill simulations on the PISCES II simulator. Annu. Navig. 2017, 24, 315–326. [Google Scholar] [CrossRef] [Scilit][Green Version]
- Toz, A.C.; Buber, M. Performance evaluation of oil spill software systems in early fate and trajectory of oil spill: Comparison analysis of OILMAP and PISCES 2 in Mersin bay spill. Environ. Monit. Assess. 2018, 190, 551. [Google Scholar] [CrossRef] [Scilit] [PubMed]
- Toz, A.C.; Koseoglu, B. Trajectory prediction of oil spill with Pisces 2 around Bay of Izmir, Turkey. Mar. Pollut. Bull. 2018, 126, 215–227. [Google Scholar] [CrossRef] [Scilit] [PubMed]
- IMGW-PIB. Klimat Polski 2023; Instytut Meteorologii i Gospodarki Wodnej—Państwowy Instytut Badawczy: Warszawa, Poland, 2024; Available online: https://imgw.pl/wp-content/uploads/2024/11/imgw-pib_klimat_polski_2023_raport.pdf (accessed on 15 June 2026).
- ITOPF. Contingency Planning for Marine Oil Spills; Technical Information Paper No. 16; International Tanker Owners Pollution Federation Ltd.: London, UK, 2011. [Google Scholar]
- IPIECA–IOGP. Contingency Planning for Oil Spills on Water: Good Practice Guidelines for the Development of an Effective Spill Response Capability; IPIECA/IOGP: London, UK, 2015. [Google Scholar]
- Petersen, J.; Nelson, D.; Marcella, T.; Michel, J.; Atkinson, M.; White, M.; Boring, C.; Szathmary, L.; Weaver, J. Environmental Sensitivity Index Guidelines, Version 4.0; NOAA Technical Memorandum NOS OR&R 52; National Oceanic and Atmospheric Administration’s Office of Response and Restoration: Silver Spring, MD, USA, 2019.
- Flores-Medina, P.W.; Sepp, A.; Coppini, G.; Morales-Caselles, C. Strategic environmental sensitivity mapping for oil spill contingency planning in the Peruvian marine-coastal zone. Sci. Total Environ. 2022, 852, 158356. [Google Scholar] [CrossRef] [Scilit] [PubMed]
- Hughes, S.; Alves, T.M.; Hales, T.C. Combined oil spill modelling and shoreline sensitivity analysis for contingency planning in the Irish Sea. Mar. Pollut. Bull. 2023, 193, 115154. [Google Scholar] [CrossRef] [Scilit] [PubMed]
- Zhong, X.; Niu, H.; Wu, Y.; Hannah, C.; Li, S.; King, T. A Modeling Study on the Oil Spill of M/V Marathassa in Vancouver Harbour. J. Mar. Sci. Eng. 2018, 6, 106. [Google Scholar] [CrossRef] [Scilit]
- De Dominicis, M.; Pinardi, N.; Zodiatis, G.; Archetti, R. MEDSLIK-II, a Lagrangian marine surface oil spill model for short-term forecasting—Part 2: Numerical simulations and validations. Geosci. Model Dev. 2013, 6, 1871–1888. [Google Scholar] [CrossRef] [Scilit]
- Beegle-Krause, C.J. General NOAA Oil Modeling Environment (GNOME): A new spill trajectory model. Int. Oil Spill Conf. Proc. 2001, 2001, 865–871. [Google Scholar] [CrossRef] [Scilit]
- Dagestad, K.-F.; Röhrs, J.; Breivik, Ø.; Ådlandsvik, B. OpenDrift v1.0: A generic framework for trajectory modelling. Geosci. Model Dev. 2018, 11, 1405–1420. [Google Scholar] [CrossRef] [Scilit]
- Michel, J.; Rutherford, N. Impacts, recovery rates, and treatment options for spilled oil in marshes. Mar. Pollut. Bull. 2014, 82, 19–25. [Google Scholar] [CrossRef] [Scilit] [PubMed]
- International Maritime Organization (IMO). Manual on Oil Pollution: Section IV—Combating Oil Spills (2005 Edition); International Maritime Organization: London, UK, 2006. [Google Scholar] [CrossRef] [Scilit]

Disclaimer/Publisher’s Note: The statements, opinions and data contained in all publications are solely those of the individual author(s) and contributor(s) and not of MDPI and/or the editor(s). MDPI and/or the editor(s) disclaim responsibility for any injury to people or property resulting from any ideas, methods, instructions or products referred to in the content. |
© 2026 by the authors. Licensee MDPI, Basel, Switzerland. This article is an open access article distributed under the terms and conditions of the Creative Commons Attribution (CC BY) license.