


Abstract
Pavement deterioration poses substantial technical-economic burdens and brings notable social-environmental risks: degraded road surfaces increase vehicle maintenance expenditures, raise traffic accident probabilities, lower transportation operational efficiency, and produce extra carbon emissions caused by aggravated fuel consumption. Automatic pavement defect detection is therefore a vital technical prerequisite for timely road maintenance and mitigating those adverse consequences. However, existing methods suffer from two prominent limitations: missed detection of subtle defects under complex scenarios and high model complexity. To tackle the above limitations, this paper proposes CAR-YOLO, a lightweight pavement defect detection algorithm built upon an improved YOLOv11n. First, a convolution-based context-guided module is incorporated to enhance the exploitation of defect contextual information, thus improving the feature representation quality and detection accuracy of subtle defects. Second, the original neck network is replaced with the attention scale sequence fusion framework (ASF), which fuses multi-scale features to boost detection performance for subtle, complex-texture pavement defects. Finally, the lightweight RepViT network is introduced into the backbone network to streamline the model architecture and reduce model complexity while maintaining detection precision. Experimental results demonstrate that the CAR-YOLO model achieves an of 63.8% on the RDD2022 Chinese UAV dataset, approximately 5% higher than the baseline YOLOv11n. The parameter count is reduced from 2.58 M to 1.71 M, corresponding to a compression ratio of 33.6%; the computational load drops from 6.3 G to 4.4 G, a reduction of around 30.2%. While delivering higher detection accuracy, the proposed algorithm effectively reduces the parameter scale and computational overhead.
1. Introduction
With the rapid advancement of global urbanization, the scale of highway road networks has expanded continuously. Exposed to factors such as increasing traffic volume and environmental stresses, pavement surfaces are susceptible to defects including cracks and potholes, which not only compromise vehicle ride smoothness and accelerate pavement wear, but may also trigger traffic accidents [1]. Accordingly, strengthening pavement maintenance plays a critical role in safeguarding property and life safety. In addition, adopting practical technical methods to find and fix road surface problems quickly and correctly is a necessary way to keep highway systems operating steadily in the long term [2].
Pavement defect detection technology has gone through an initial manual inspection stage in its development process. In the early stage, technical staff completed road defect investigation through walking patrols or low-speed vehicle inspections. All pavement damage data were measured and recorded manually, and image acquisition results were stored in the form of film and magnetic tape. Nevertheless, manual pavement inspection suffers from fundamental methodological limitations: subjective annotation criteria lead to inconsistent ground-truth references, while human visual perception imposes bottlenecks in detection sensitivity for fine, low-contrast road damages [3]. Although deep-learning-based convolutional neural networks have become the dominant technical paradigm for automated pavement defect detection driven by advances in computer vision [4,5], existing CNN-based detectors still face non-trivial computational and structural challenges. These include insufficient feature-representation capability for subtle small-scale defects under complex road backgrounds, as well as the unavoidable trade-off between model inference overhead and detection precision in real-world deployment scenarios. According to different working principles, mainstream CNN detection algorithms can be divided into two technical branches: one-stage detection algorithms and two-stage detection algorithms. The one-stage detection framework, represented by YOLO series [6] and SSD models [7], adopts an end-to-end detection mode. It omits the region proposal generation link and directly completes the prediction of defect categories and coordinate positions based on feature maps. In contrast, the two-stage detection method represented by Faster R-CNN series [8] follows a two-step detection logic. It first generates candidate regions that may contain defects, and then conducts secondary fine classification and positioning, which effectively improves detection precision. Despite the accuracy advantages of two-stage algorithms, they still face two key technical bottlenecks: poor detection performance for subtle, complex-texture pavement defects and excessive model structural complexity. To solve the above problems and optimize the practical application effect of pavement defect detection models, domestic and foreign scholars have carried out targeted improvements based on mainstream YOLO series models. Yang’s research team [9] optimized the YOLOv5s model and proposed the SCB-AF-Detector. By embedding the BoT structure after the SPD-Conv convolution unit and optimizing the AFPN structure with a subtraction-based optimization strategy after SPPF, the model can effectively retain fine-grained defect features and eliminate background noise interference. An et al. [10] put forward a modified algorithm on the basis of YOLOv7-Tiny. This method removes the original ELAN-Tiny module and incorporates a multi-scale DBB module instead. Such structural optimization strengthens feature extraction performance for diverse pavement damage types and effectively lowers the missed detection rate. Based on the YOLOv8 basic framework, Zhao et al. [11] developed the improved SEA-YOLOv8 model. The SBS module designed in the model realizes the lightweight optimization of parameters and computation. Meanwhile, the introduction of EMA_Faster_C2f and AE-FPN modules optimizes the model’s multi-scale detection performance and strengthens the feature attention mechanism for key defect targets. For the problem of insufficient crack feature learning of traditional models, Zhang et al. [12] designed the YOLOv8-DGS model. The study replaces the traditional convolution in YOLOv8’s backbone and neck networks with DWConv and GSConv structures, which reduces computational overhead and greatly improves the model’s feature learning ability for pavement cracks. Focusing on the detection accuracy under complex road environments, He et al. [13] proposed the innovative LMD_YOLO model. The researchers embedded the DBB structure into the detection head for reinforcement, aiming to promote the model’s detection accuracy under complex environmental conditions. In addition, they substituted original convolution layers with mg_conv modules and applied the LeYOLO architecture to further enhance overall model efficiency. Qi et al. [14] proposed a novel algorithm named PWDR-YOLO. It employs the WTConv module to expand the receptive field, replaces standard convolutions with dynamic convolutions, and incorporates the REMA attention mechanism to optimize multi-scale feature fusion, thereby enhancing recognition accuracy under complex backgrounds.
Numerous valuable module-level innovations have been proposed in the above-mentioned studies to advance pavement defect-detection pipelines. Nevertheless, these existing solutions still suffer from unavoidable performance trade-offs when handling complex scenes full of small-scale pavement defects. On the one hand, incorporating enhanced feature extraction modules can improve detection accuracy, but at the cost of increased parameters and computational load. On the other hand, adopting lightweight networks can reduce computational overhead, yet it leads to a sharp rise in missed detection rate due to compromised detection precision. Aiming at the existing defects and limitations mentioned above, this work puts forward a novel lightweight model for pavement defect detection tasks. Targeting the contextual dependency characteristics of pavement defects, an explicit modeling approach is introduced into multi-scale contexts, thereby enhancing the feature representation capability of subtle defects and the recall rate of defect detection in complex scenarios; Considering the network’s multi-dimensional feature fusion capability for both large-scale crack targets and subtle defect features in pavement defect detection, this paper introduces the attention scale sequence fusion framework into the neck network, and adopts a cross-scale attention mechanism to realize dynamic weighted feature fusion, so as to improve the recognition accuracy of subtle, low-contrast and complex-texture pavement defects, particularly for the challenging D20 alligator-crack category. To explore a network architecture with reduced computational overhead that offers theoretical potential for resource-constrained devices, this paper introduces the lightweight backbone network RepViT. It substantially reduces the number of model parameters and computational complexity while maintaining detection performance.
2. Background and Baseline Model
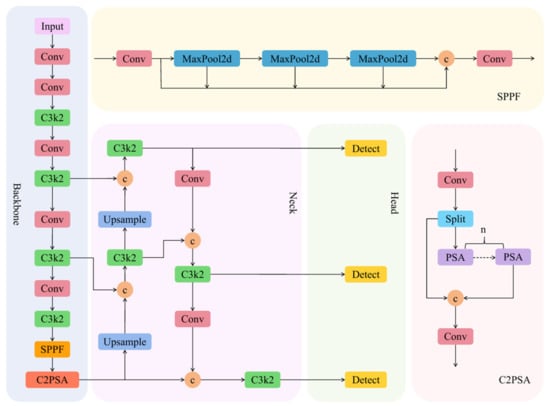
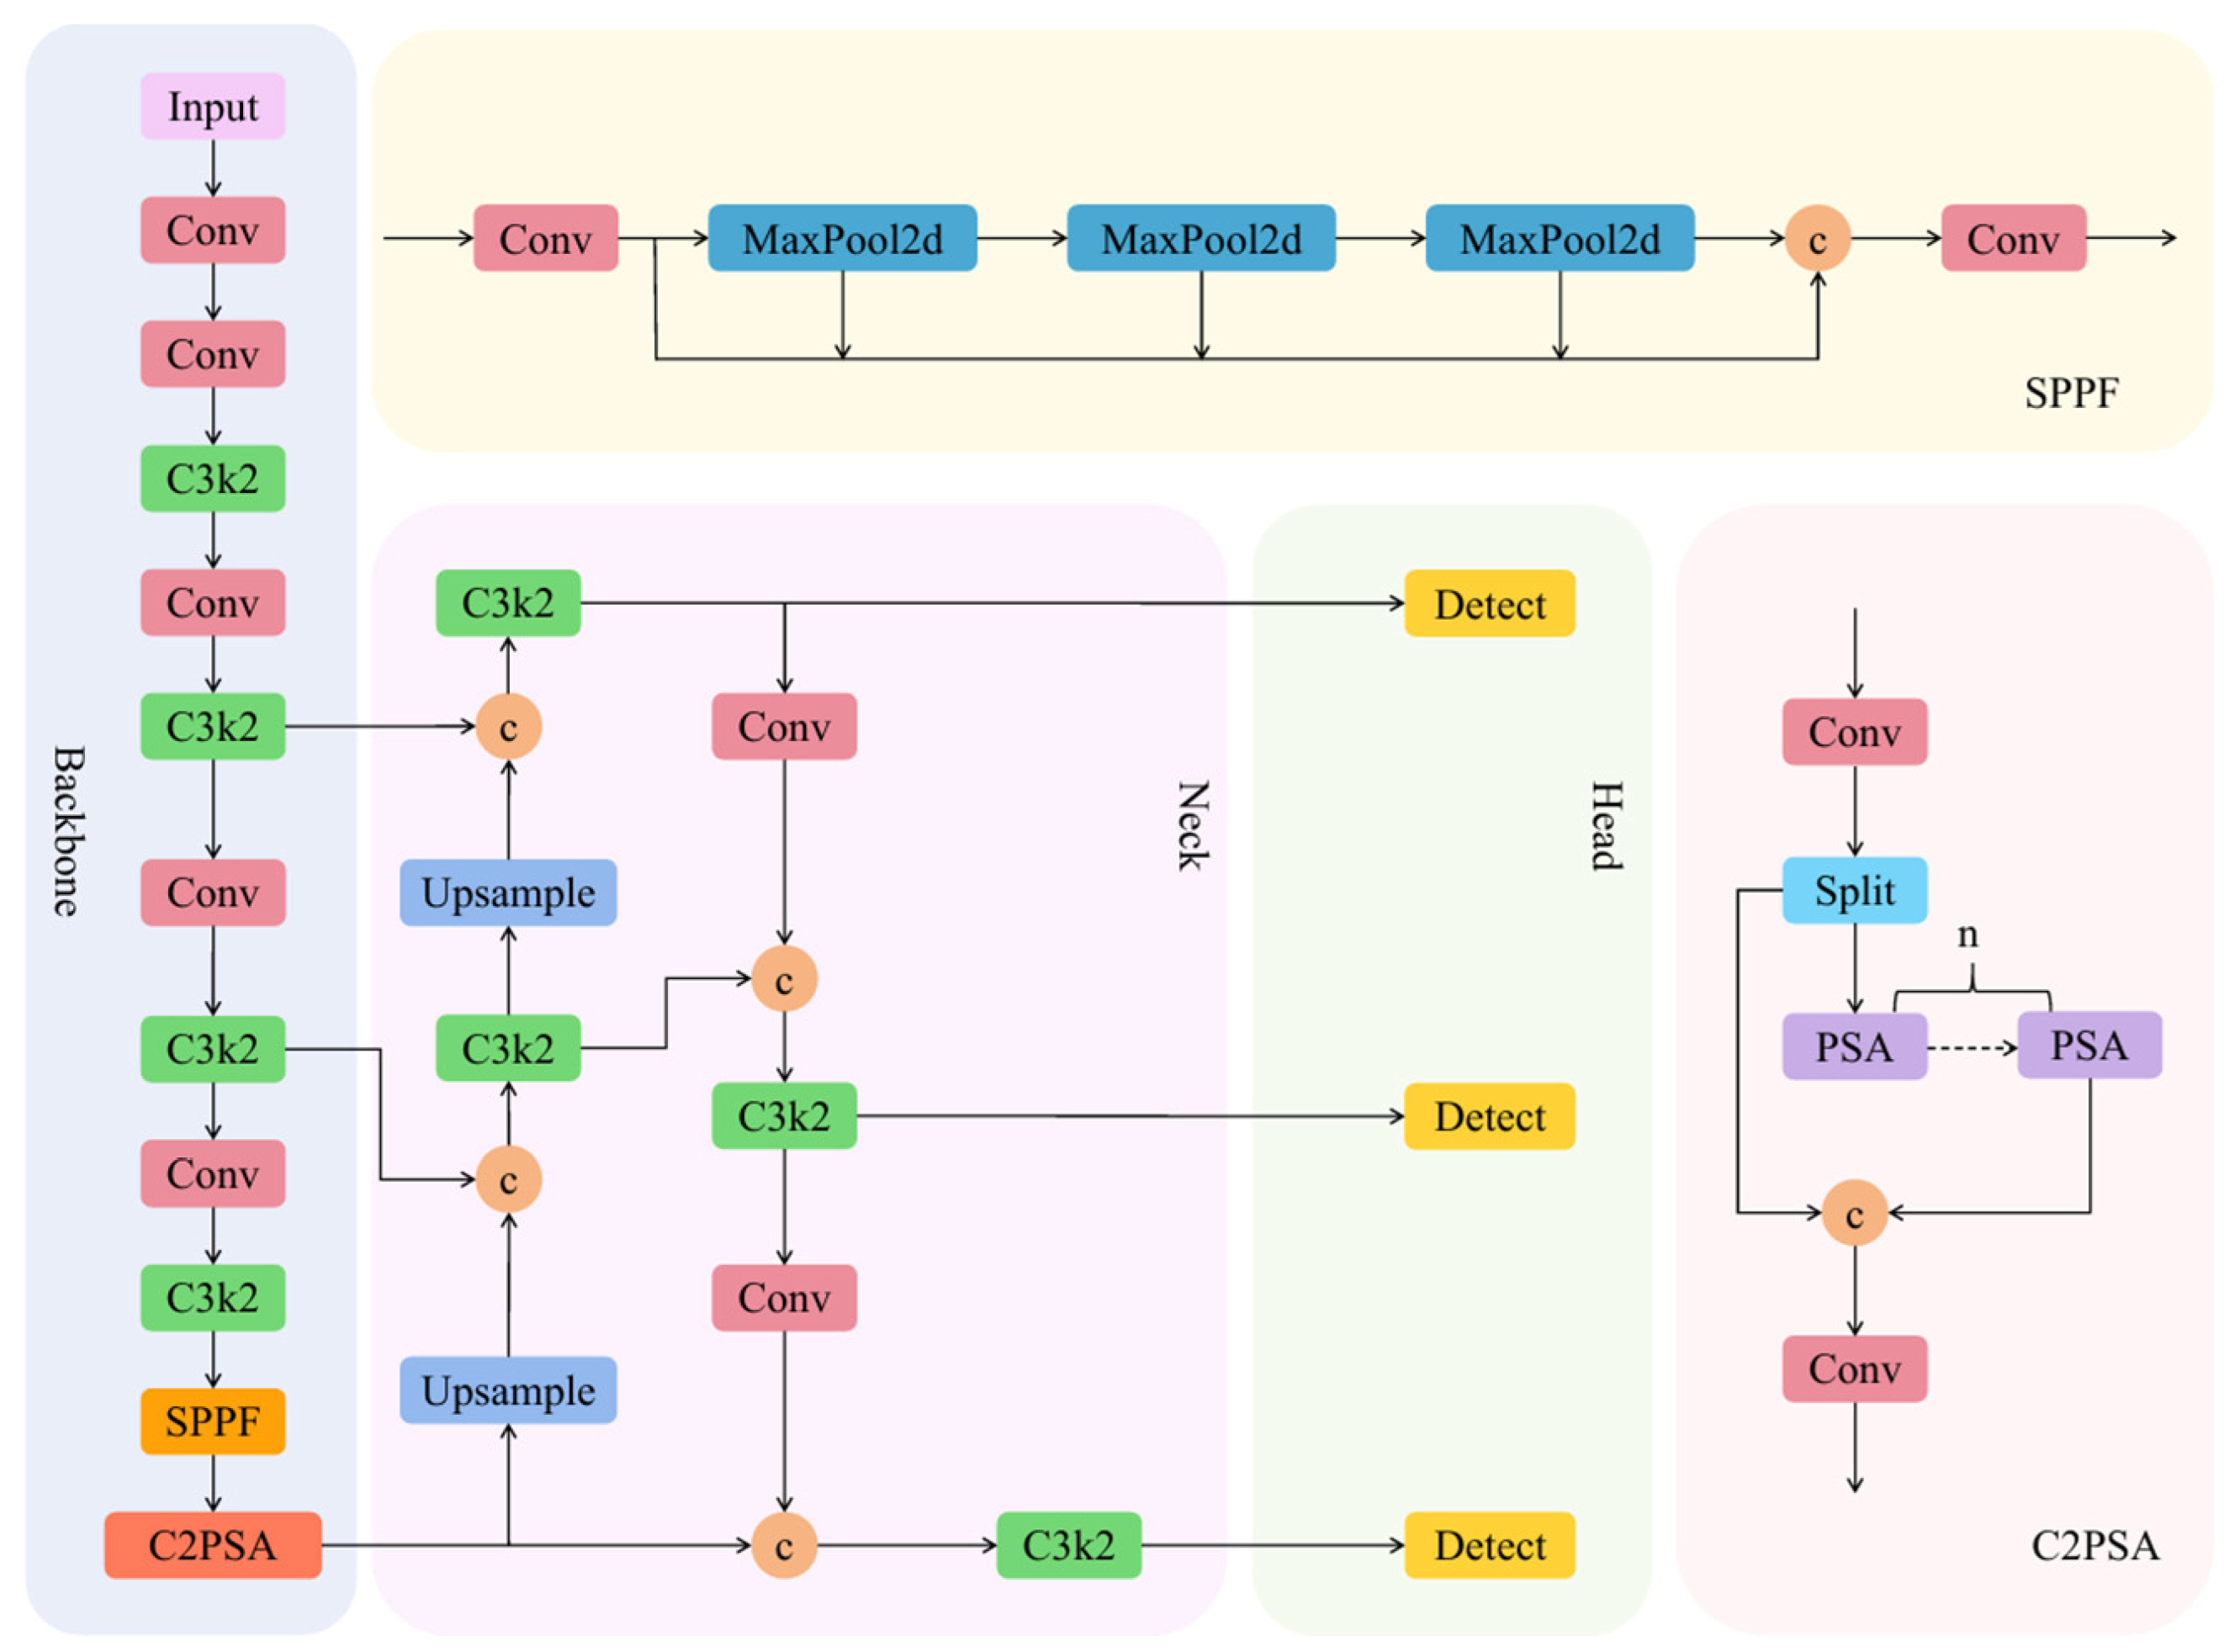
YOLOv11 belongs to the family of one-stage object detection algorithms, with a core structural system composed of input layer, backbone network, neck network and detection head modules. Figure 1 presents the complete overall structure of the proposed YOLOv11 model [15]. Researchers implement image preprocessing and data augmentation operations in the input layer to effectively boost the generalization capability of the detection model. Responsible for critical feature extraction work, the YOLOv11 backbone utilizes the C3k2 structure to substitute the original C2f module from the YOLOv8 model. The expansion of the network receptive field achieved by this modification significantly optimizes the model’s feature capturing performance for medium and long-range object targets.
Figure 1.
YOLOv11 structure.
Feature representation ability gets extra optimization after integrating the newly proposed C2PSA unit and position-sensitive attention (PSA) mechanism. To balance computation cost and detection precision, extra two depthwise separable convolution layers are embedded inside the neck network’s feature fusion channel. The official Ultralytics YOLOv11n Detect head is adopted in this paper. Non-maximum suppression (NMS) is preserved in the inference process. No structural modifications are performed for the baseline network. All ablation experiments and comparative experiments are conducted on this official baseline (Ultralytics repository, release version 8.3.0) to ensure fair comparison and reproducibility.
3. Method and Experimental Setup
3.1. Model Design Rationale
Road damage detection tools meet many technical problems when used in real work. First, it is hard to extract discriminative features for subtle defects under complicated road surfaces. Second, the model frequently produces missed detections for complex-texture pavement defects, many of which are small-sized. Third, big model parameters and heavy calculation make it hard to put the model into real devices [16]. YOLOv11 cannot find a good balance between high detection accuracy and fast running speed to solve all these problems. Improvements that enhance feature extraction capability are usually accompanied by increases in parameter count and computational load, while lightweight designs often come at the cost of detection accuracy. This contradiction is particularly prominent in deployment scenarios on resource-constrained edge devices, and has become a key bottleneck restricting the practicality of pavement defect detection technologies [17].
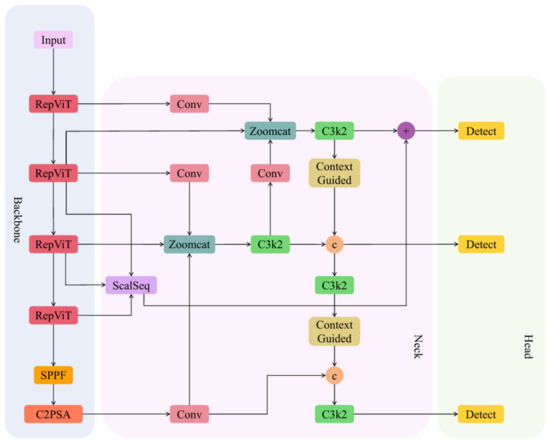
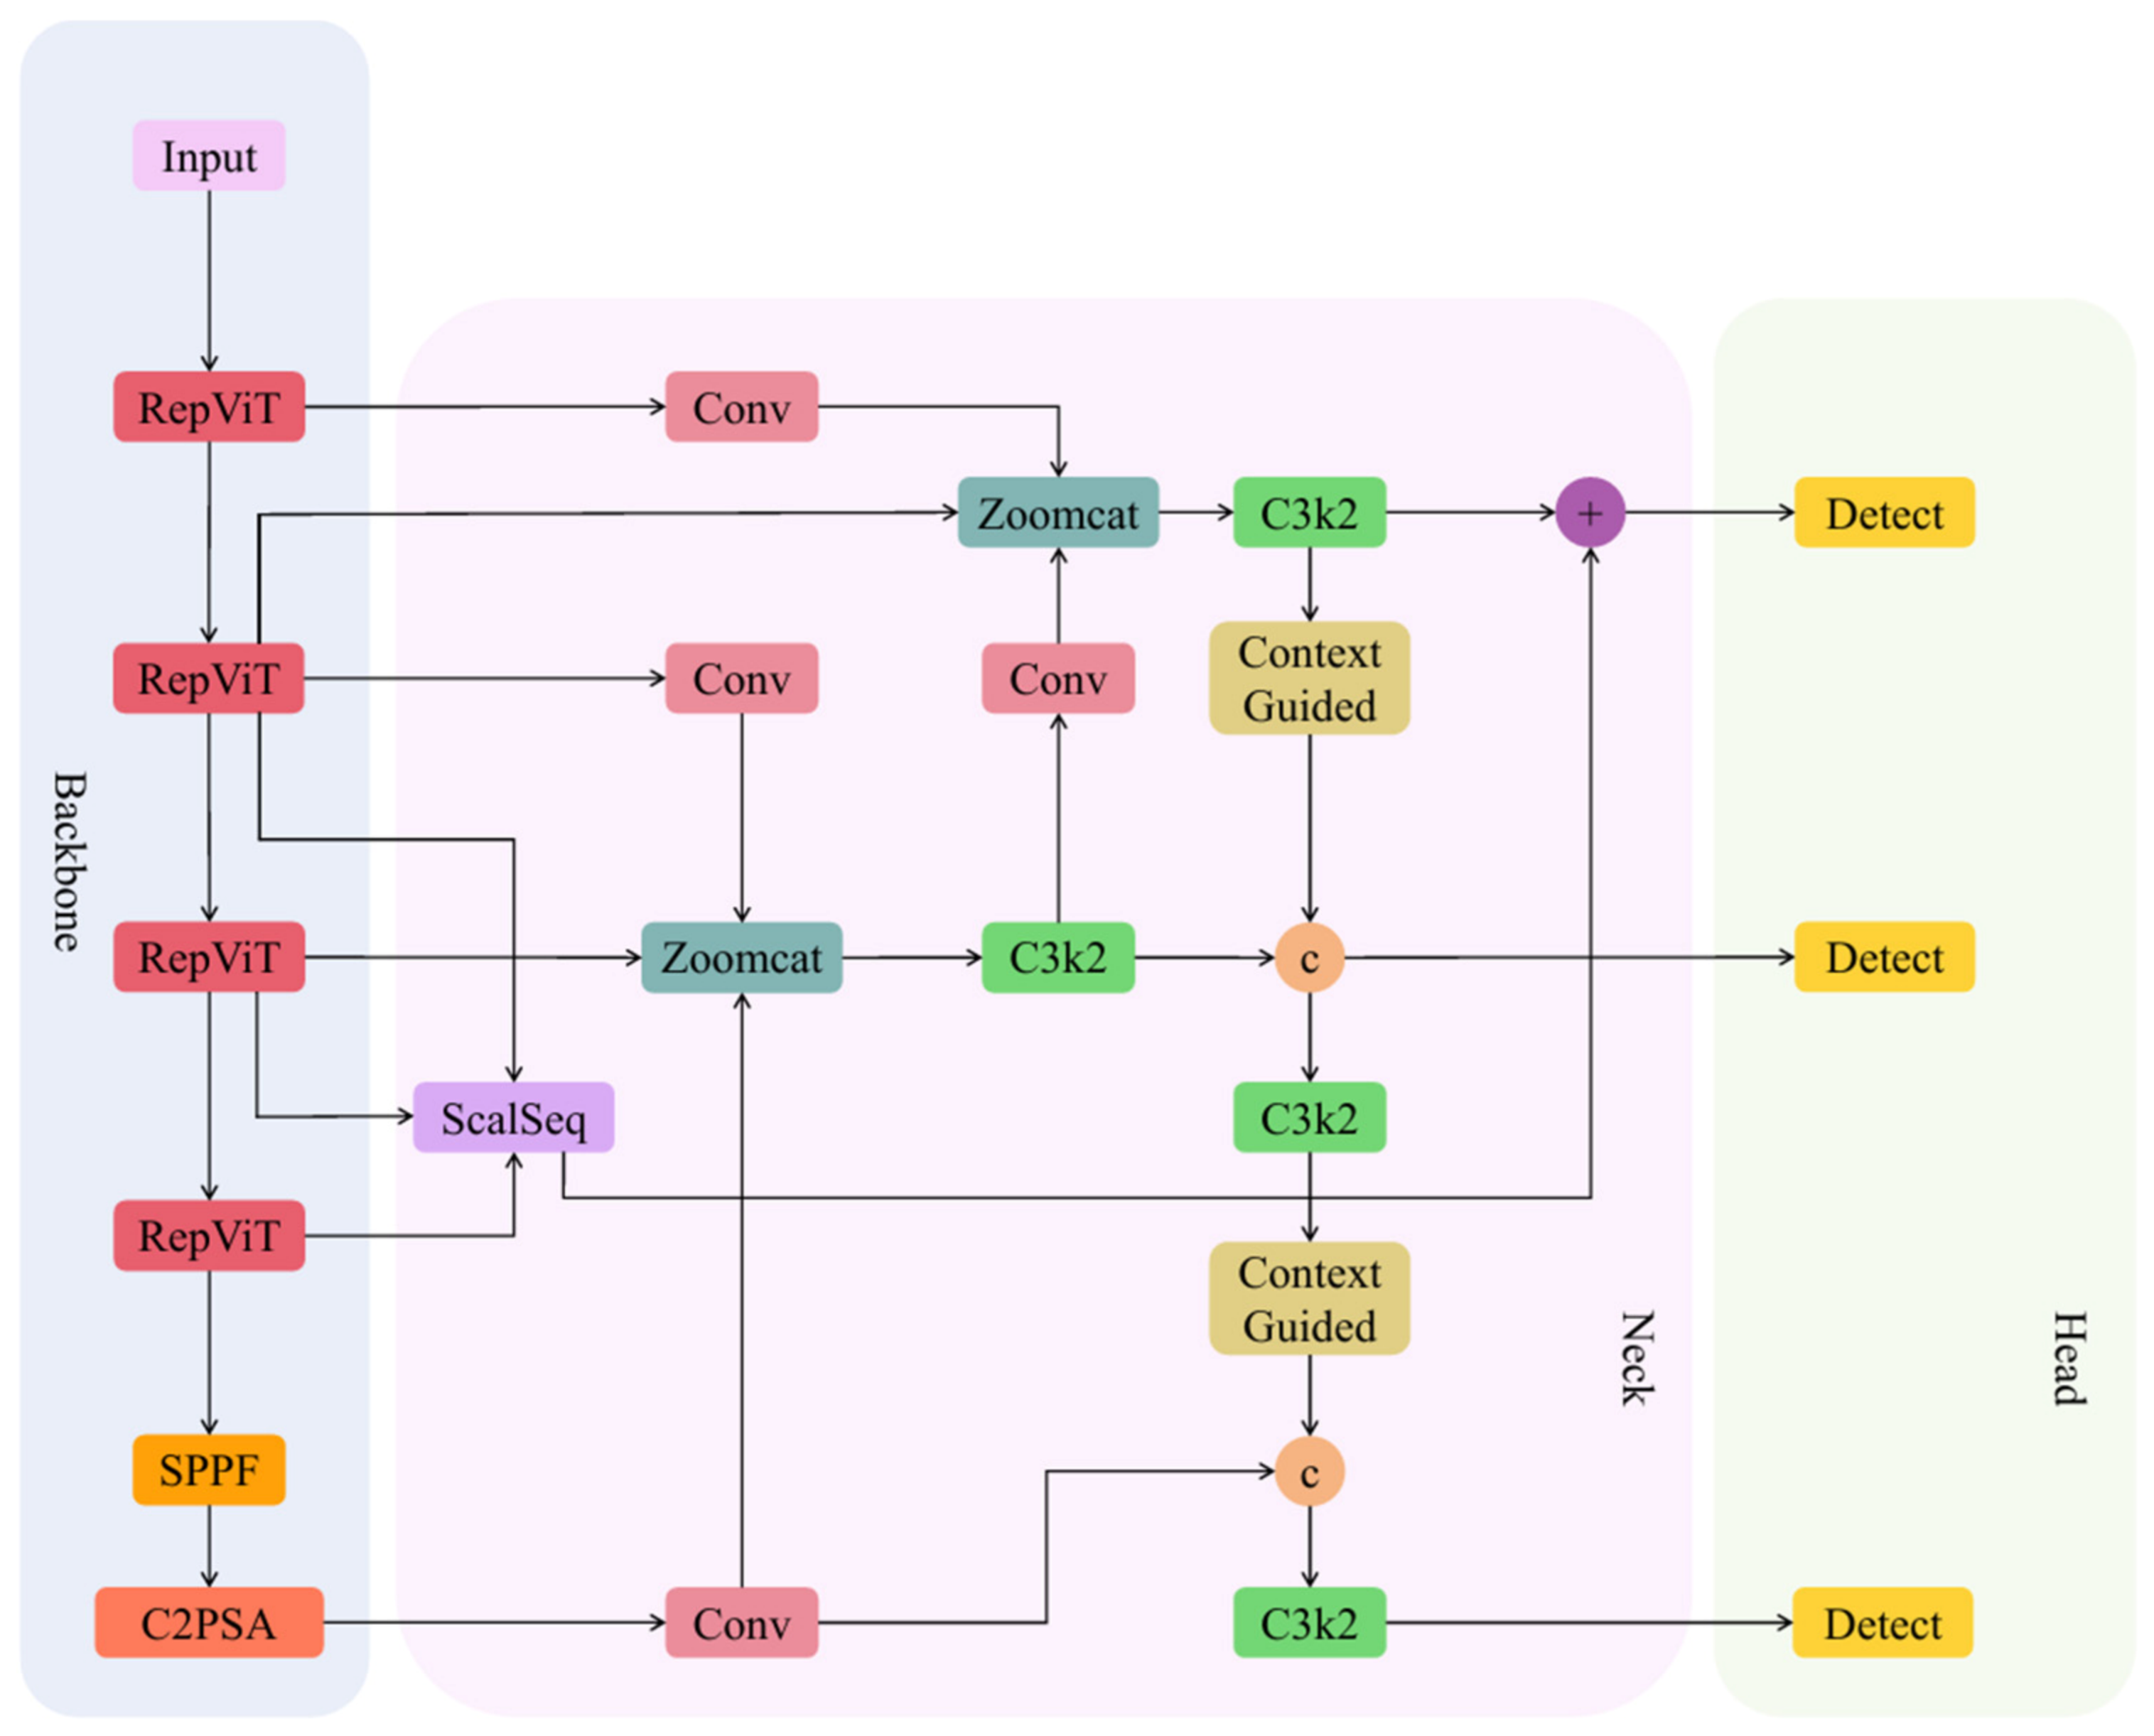
To address the aforementioned limitations, this paper conducts systematic improvements on the base architecture of YOLOv11n. By integrating a lightweight backbone network, a context-enhanced feature extraction layer, and a multi-scale attention fusion neck network, we develop a novel pavement defect detection model named CAR-YOLO (Context-Guided Module, Attentional Scale Sequence Fusion Framework-YOLO, Re-parameterized Vision Transformer), whose overall architecture is depicted in Figure 2.
Figure 2.
Structure of CAR-YOLO. Notation: Zoomcat = zoom-and-concat module for multi-scale feature alignment and concatenation; ScalSeq = scale-sequence feature-processing sub-unit belonging to the Attentional Scale Sequence Fusion Framework; symbol c denotes channel-wise feature concatenation; symbol + denotes element-wise feature addition (residual summation). The architecture consists of the RepViT-based backbone, the ASF-modified neck network, and three Detect detection heads.
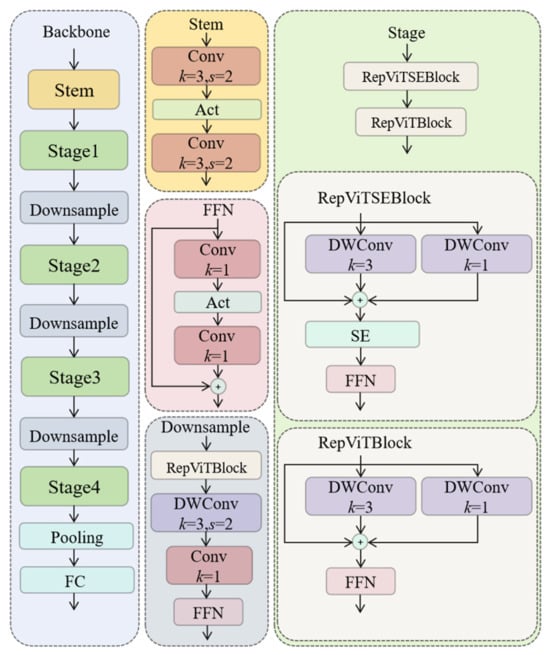
In terms of architectural design, CAR-YOLO adopts a bottom-up hierarchical optimization approach, and mainly improves YOLOv11n in three core components: the backbone, the neck, and the detection head. First, we modify the original backbone network of YOLOv11n by adopting the Re-parameterized Vision Transformer (RepViT) module. Although RepViT draws design inspiration from Vision Transformer paradigms, it is essentially a pure lightweight convolutional neural network. It combines depthwise separable convolution (DWConv) with a lightweight feed-forward network (FFN) to realize dynamic interaction between local and global information while maintaining efficient inference speed. Specifically, DWConv captures local texture features of defects via convolution kernels, while the FFN establishes global feature correlations through convolutions and GELU activation. Subsequently, this paper introduces the Attentional Scale Sequence Fusion Framework (ASF) to replace the original neck network. It adopts a cross-scale attention mechanism to dynamically weight feature responses of different scales, and captures dependencies among multi-scale features through scale sequence modeling, so as to improve detection performance for subtle, complex-texture pavement defects such as D20 alligator cracks. Also, pavement damage has links with surrounding road information. We introduce the ContextGuided module and integrate it into the feature-extraction layers. This module adopts a dual-branch structure with a 3 × 3 depthwise convolution and a 3 × 3 dilated depthwise convolution (dilation = 2) to extract local fine-grained features and surrounding contextual information simultaneously. A channel attention mechanism is further embedded to recalibrate feature channels, which helps the model capture the association between local tiny defects and the global road background, thus improving the recognition of subtle pavement defects.
3.2. Use Light Main Network to Make Model Structure Easier
This work uses RepViT as the main feature extraction network [18]. RepViT is a light-weight image model. The biggest advantage of this network is that it can combine two good points well. One is CNN’s ability to capture local image details, and the other is Vision Transformer’s power to learn global image relations. Despite the excellent feature extraction ability provided by the native CSP structure of YOLOv11n, this structural design brings about parameter redundancy and heavy computational burdens, making it difficult to deploy the model on resource-limited terminal devices. RepViT uses re-parameterization methods and layered structure design. It can keep good detection results and greatly cut down the model’s complex parts.
RepViT has five main parts: the first feature extraction stem, several stage blocks, downsample layers, one pooling layer and a fully connected layer. Figure 3 shows its full structure. There are four stage modules inside the network, and every module has many RepViT Blocks. When data goes through each stage one by one, feature maps get smaller in size but gain more feature channels. This pyramid-shaped structure helps the model get features of different sizes well. So it works well on pavement defects that come in many different sizes. Depthwise separable convolution (DWConv) and feed-forward network (FFN) are the two key building blocks of the RepViT Block. Local spatial information extraction is realized through the DWConv structure. Different from standard convolution methods, this technique divides traditional convolution calculations into two independent and consecutive steps: depthwise convolution and pointwise convolution (PWConv). The FFN enhances feature representation capability and models cross-channel correlations, effectively constraining parameter count while boosting feature expressive performance. In this work, multiply-accumulate operations (MACs) are adopted as the fundamental theoretical metric for computational complexity, where one multiply-accumulate operation (one multiplication plus one addition) is counted as 1 MAC. For practical measurement, the THOP (torch-opcount) library is used to obtain the raw MAC values of each model. Since THOP natively outputs MACs, we convert these values to FLOPs using the relation and further scale to giga-units to obtain GFLOPs, which are consistently reported in Table 1, Table 2 and Table 3, following the common reporting convention within the YOLO-object-detection community [19].
Figure 3.
Structure of the RepViT Network.
Table 1.
Ablation Results of Various Improved Modules Based on YOLOv11n.
Table 2.
Detection Performance Comparison Across Various Defect Categories.
Table 3.
Comparative Experimental Results.
The calculation formula for standard convolution is defined as:
where H and W denote the height and width of the input feature map, represent the channel numbers of input and output features, and K is the convolution kernel size. The “” term corresponds to the element-wise bias addition for each output channel.
The CSP backbone structure of conventional YOLOv11n relies on standard convolutions for feature extraction. Its FLOPs increase linearly with the growth of multiplication operations, resulting in high overall model computational complexity and poor compatibility with resource-constrained deployment scenarios. In contrast, RepViT decouples standard convolution into two consecutive sub-processes. First, it independently applies convolution to each channel of input features via DWConv to extract single-channel local features. Then, it accomplishes fusion and transformation in the channel dimension using convolution kernels through pointwise convolution. The total computational load of depthwise separable convolution (DSConv) is the sum of two sub-processes: depthwise convolution and pointwise convolution, and the corresponding formula is:
Compared with standard convolution, the total computational load of depthwise separable convolution is only of that of standard convolution, which greatly reduces the computational overhead. Specifically, depthwise convolution alone accounts for only of the computational cost of standard convolution, which fully reflects the efficiency advantage of the depthwise separable architecture. This design greatly reduces the computational overhead.
3.3. Constructing Attentional Scale Sequence Fusion Framework to Enhance Multi-Scale Feature Fusion Performance
To fully account for the network’s multi-dimensional scale feature fusion capability for large-scale crack targets and small-scale features in pavement defect detection, this study introduces the ASF-YOLO (Attentional Scale Sequence Fusion Framework, ASF) module. This module incorporates effective information from different scales and adaptively aggregates multi-scale feature information [21].
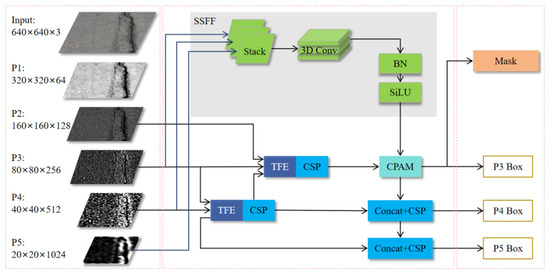
Built upon the Scale Sequential Feature Fusion (SSFF) module, the ASF-YOLO attentional scale sequence fusion framework enhances the network’s capability to extract and represent multi-scale information. Subsequently, a Triple Feature Encoder (TFE) is introduced to perform joint encoding and fusion of feature maps at different scales, thereby supplementing richer detailed feature information. Building on this foundation, the Channel and Position Attention Mechanism (CPAM) is further integrated. By effectively bridging SSFF and TFE, it enable the network to simultaneously enhance the response capability of key channels and the processing capability of spatial features associated with subtle complex-texture pavement defects [22]. The architecture of this module is depicted in Figure 4.
Figure 4.
Structure of the ASF-YOLO Model.
The adopted SSFF module is designed based on improvements to the conventional FPN structure. In standard feature pyramids, unidirectional top-down transmission tends to cause loss of detailed shallow-layer features. By introducing bidirectional connection paths, SSFF enables sufficient interaction between deep semantic features and shallow spatial features. This module takes feature data from three backbone stages P3, P4 and P5. It uses convolution to change the number of feature channels first. Then it mixes features of different sizes step by step from shallow layers to deep layers. The mixed feature of one stage will be sent into the next stage for further calculation. This connected structure can collect multi-size feature information little by little without making the model calculate too much.
The SSFF module takes three hierarchical feature maps from the backbone, denoted as and . First, convolutions are applied to unify the channel dimension of all features to C:
Then scale-sequential feature fusion is performed in a bottom-up manner. The fused feature from the shallower stage is downsampled to match the spatial size of the deeper stage, and then fused element-wisely:
where denotes 2× downsampling implemented via stride-2 convolution, which compresses the spatial size of feature maps by half while preserving feature semantics. are the final fused feature outputs at the three scales. This progressive bottom-up aggregation pattern injects fine-grained spatial details from shallow layers into deep semantic features step by step, with a low computational cost.
After feature maps are stacked along the channel dimension, a lightweight 3D convolution is applied to model inter-scale correlations across stacked feature tensors, followed by BN and SiLU activation for nonlinear mapping.
Pavement defects have very different shapes. To fix this problem, the TFE module sets three separate convolution paths, and each path can capture different ranges of image information. This multi-branch structure adopts different convolution kernels to achieve diverse feature extraction effects. The 3 × 3 convolution kernel focuses on mining local edge information, the 5 × 5 convolution kernel learns medium-distance texture distribution features, and dilated convolution realizes receptive field expansion while maintaining a constant parameter quantity. After completing feature extraction for all branches, the model integrates all branch outputs using the Concat function. The 1 × 1 convolution operation is then applied to reduce channel dimensionality and output high-quality fused feature representations.
The TFE module adopts three parallel convolution branches to extract multi-scale receptive field information from the input feature map
where captures local edge information via 3 × 3 standard convolution, learns medium-range texture features via 5 × 5 convolution, and expands the receptive field via 3 × 3 dilated convolution with dilation rate 2. The outputs of the three branches are concatenated along the channel dimension, and a 1 × 1 convolution is used for channel dimensionality reduction:
We add the CPAM unit to reduce missing small damage targets. This tool calculates how important each feature is in two ways: channel direction and space direction. The channel part uses global pooling to get data features of every channel. The space part uses convolution layers to learn weight values for different positions. Multiply results from the two parts to get attention weights. Then use these weights on original feature data. This way can make feature signals of damaged areas stronger and cut down useless signals from road background.
The CPAM module performs dual attention recalibration along both channel and spatial dimensions. Given the input feature , the channel attention branch generates channel-wise weight vectors via global average pooling and two fully connected layers:
The spatial attention branch generates spatial weight maps via stacked convolution layers to learn position-wise feature importance:
The final attention weight is obtained by element-wise multiplication of the two attention maps via broadcasting, which realizes adaptive scale weighting:
The output refined feature is computed by applying the joint attention weight to the original input:
where denotes element-wise multiplication. The output feature maintains the same spatial size and channel number as the input.
3.4. Embedding Context-Guided Module to Mine Contextual Information
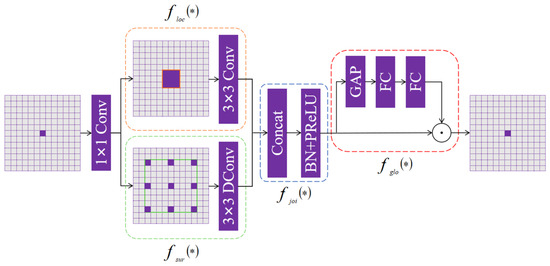
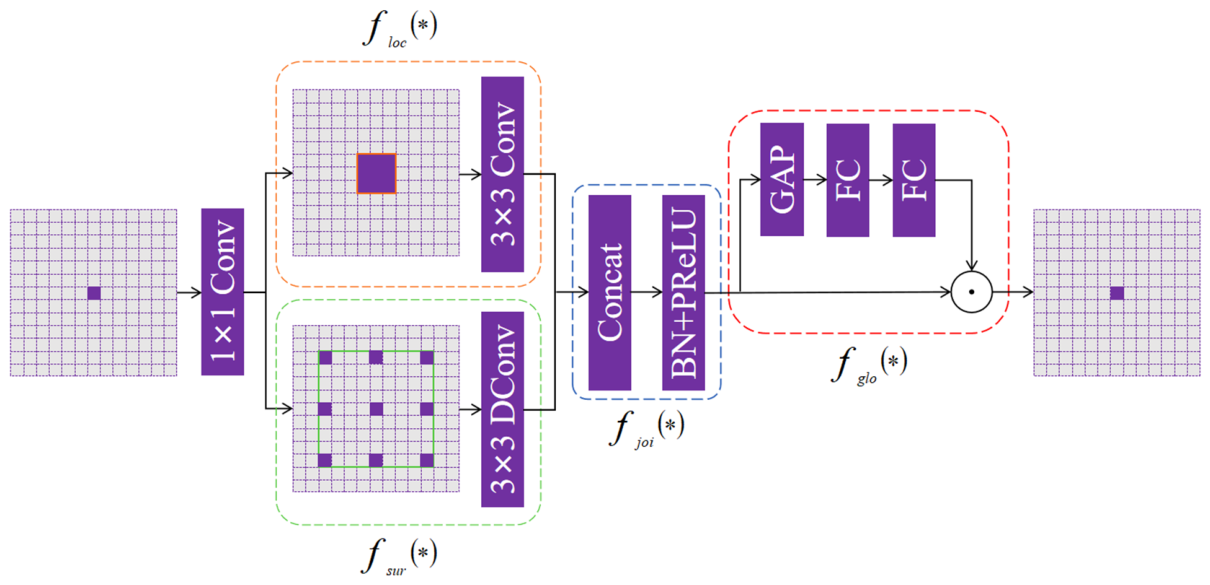
When finding road damage, features of only one size cannot capture both small target details and whole background information at the same time. Cracks are long and thin. People need continuous feature data along their length to tell what they are. Potholes are different. To recognize them clearly, we have to compare their texture with the road surface around them. For the purpose of addressing the aforementioned challenge, we adopt the ContextGuided module in this work to optimize and boost the feature extraction ability of the detection network [23]. The functional structure of this module covers four independent sub-modules: for local feature extraction, for surrounding context extraction, for joint feature generation, and for global context modeling. The comprehensive internal structure of the ContextGuided module is demonstrated in Figure 5.
Figure 5.
Structure of the ContextGuided Model.
Given an input feature map , where H, W and denote the height, width and channel number of the input respectively, the complete forward pass of the ContextGuided module is mathematically defined as follows. First, a 1 × 1 convolution with batch normalization and PReLU activation is applied to adjust the channel dimension, yielding an intermediate feature , where and is the output channel number of the module.
- (1)
- Local feature extraction
The local branch employs a 3 × 3 depthwise convolution to capture fine-grained local texture features of defects:
where denotes depthwise convolution with kernel size . The output feature maintains the spatial size and channel number .
- (2)
- Surrounding context extraction
The context branch adopts a 3 × 3 dilated depthwise convolution with dilation rate to expand the receptive field without increasing parameter count:
with padding set to 2, the output feature keeps the same spatial dimension and channel number as the input.
- (3)
- Joint feature generation
The outputs of the two branches are concatenated along the channel dimension, followed by batch normalization and PReLU activation to generate fused joint features:
where denotes channel-wise concatenation. The concatenated feature has channels, and the output .
- (4)
- Global context modeling
A channel attention mechanism is introduced for feature recalibration. Global average pooling is first performed to obtain channel-wise descriptors, then two fully connected layers with a Sigmoid function generate channel attention weights:
where is global average pooling, are fully connected layers with a channel reduction ratio of 16, denotes ReLU activation, denotes Sigmoid activation, and denotes channel-wise element-wise multiplication.
Residual connection
To preserve abundant feature information and stabilize gradient propagation, a residual path is introduced. If the input channel equals the output channel , the final output of the module is computed as:
Otherwise, an additional 1 × 1 convolution is added on the residual path to align the channel dimensions.
3.5. Experimental Results and Analysis
3.5.1. Dataset
All experimental data in this research originate from the public RDD2022 Road Damage Detection Dataset [24]. A total of 47,420 road surface pictures are integrated within this dataset, whose shooting sources cover six nations: Japan, India, Czech Republic, Norway, the United States and China. These six-country samples constitute the complete public release of the RDD2022 dataset; annotated pavement-damage data from other countries are not provided in this open dataset.
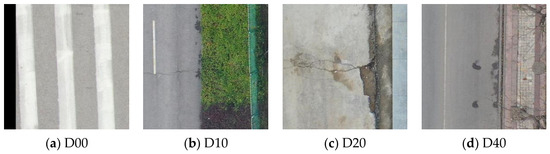
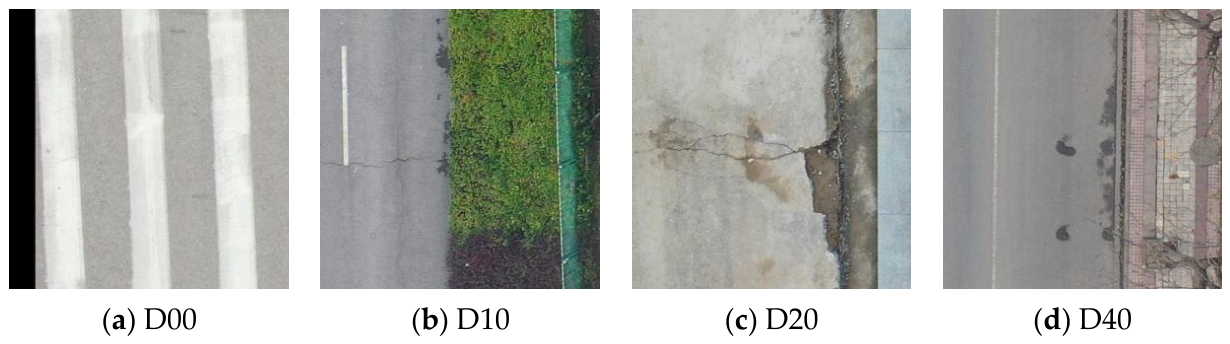
For model evaluation, the China_Drone sub-dataset is singled out as experimental material. It consists of 2401 drone-captured pavement defect images from China, each maintaining a uniform 512 × 512 pixel resolution. Four standard pavement damage labels are specified in the dataset, namely longitudinal cracks D00, transverse cracks D10, alligator cracks D20 and potholes D40, and their visual samples are displayed in Figure 6. To complete model training and performance testing, we partition the whole data pool into training, validation and test subsets following a 7:2:1 allocation ratio. The split is implemented using a stratified random sampling strategy based on defect categories with a fixed random seed of 0, which ensures consistent category distribution across the training, validation and test sets and avoids data distribution bias. The training, validation and test sets contain 1681, 480 and 240 images respectively. The China_Drone subset consists of independently sampled images from different road sections and viewpoints, with no highly similar consecutive frames, so the image-level split does not introduce data leakage risk.
Figure 6.
Categories of Pavement Defects.
3.5.2. Experimental Environment and Hyperparameters
All experiments are conducted under the above unified configuration to avoid randomness and ensure reproducibility. All experiments are conducted on a Linux server with an x86_64 architecture CPU. The server is equipped with 48 physical CPU cores, 503 GB of system memory, and an NVIDIA Tesla T4 GPU with 16 GB of video memory. All code is implemented in Python 3.8.20 based on the PyTorch 1.8.1 deep learning framework, with CUDA 10.2 used for GPU acceleration. The number of data loader workers is set to 0.
For training configurations, all models are trained for a maximum of 300 epochs with a batch size of 16, and the input image resolution is uniformly set to 640 × 640. The SGD optimizer is adopted with a momentum of 0.937 and a weight decay coefficient of 0.0005. The initial learning rate is set to 0.01, and a linear learning rate decay strategy is applied, with the final learning rate being 0.01 times the initial value. A 3-epoch warm-up phase is configured at the beginning of training to stabilize the early training process: during warm-up, the learning rate increases linearly to the initial value, and the optimizer momentum rises from 0.8 to the preset value.
All models are initialized with the official YOLOv11n pre-trained weights on the COCO dataset, which is automatically loaded by the Ultralytics framework when the pretrained option is enabled. This transfer learning strategy accelerates model convergence and improves feature generalization on the pavement defect dataset. A fixed random seed of 0 is set for all experiments, and the deterministic training mode is enabled to eliminate random interference and ensure the reproducibility of experimental results. An early stopping strategy with a patience of 100 epochs is applied: if the validation does not improve for 100 consecutive epochs, the training process will be terminated early. The checkpoint achieving the highest on the validation set is selected as the final model for subsequent testing and analysis.
During training, standard data augmentation strategies consistent with the official YOLO training pipeline are applied, including Mosaic augmentation, HSV color space perturbation, random horizontal flip, random translation and scaling, random erasing, and RandAugment auto-augmentation. MixUp augmentation is not employed in this work. For evaluation, the NMS IoU threshold is set to 0.7, and the confidence threshold for average precision calculation follows the default configuration of the YOLO framework. All ablation experiments and comparative experiments are carried out under exactly the same hardware environment, training hyperparameters and data augmentation settings to ensure fair comparison and reliable experimental conclusions. The official YOLOv11n detection head implemented in Ultralytics v8.3.0 is adopted as our baseline without any modification. The composite loss function of the baseline consists of three components: binary cross-entropy for classification, CIoU loss for bounding-box regression, and Distribution Focal Loss (DFL) for discrete coordinate distribution learning, from the official GitHub repository of Ultralytics v8.3.0. (https://github.com/ultralytics/ultralytics, accessed on 25 July 2026) The default loss weight hyper-parameters from the official configuration are kept: box = 7.5, cls = 0.5, dfl = 1.5.
3.5.3. Evaluation Metrics
To comprehensively evaluate the detection performance and deployment efficiency of the proposed model, this work adopts four canonical accuracy metrics for object detection tasks: Precision (), Recall (), Average Precision (), and mean Average Precision () [25]. To quantitatively analyze model complexity in this study, we adopt two core evaluation indicators, which are total model parameters and FLOPs.
Precision refers to the proportion of true positive samples among all samples predicted as positive by the model, and its calculation formula is defined as:
Recall denotes the proportion of ground-truth positive samples that are correctly predicted, with the corresponding formula given below:
Here, stands for the number of true positives, represents false positives, and indicates false negatives.
Average Precision () is the integral of Precision over all Recall values for a single category, which characterizes the overall detection performance of this category. Its computational formula is:
All results corresponding to individual dataset categories are averaged to compute the metric. The variable is defined in this work to indicate the total count of categories included in the adopted dataset. The corresponding calculation formula is shown below:
As a core comprehensive metric for measuring detection accuracy in object detection tasks, can fully quantify the model’s precision under multi-class scenarios. All subsequent experiments in this paper adopt as the primary criterion to evaluate detection performance. Meanwhile, two metrics, namely parameter count and computational complexity, are adopted to quantitatively assess the operational efficiency of the model. The parameter count refers to the total number of learnable parameters in the model, measured in millions of parameters , corresponding to the table notation . It directly determines the storage cost and memory consumption of the model. Computational complexity is reported as GFLOPs (Giga FLOPs) across all tables. Raw computational statistics are calculated via the THOP library (outputs MACs), which are converted to GFLOPs with . This uniform metric is used to characterize the computational load during the forward inference process. Together, these two metrics determine the deployment feasibility and real-time inference capability of the model on edge devices.
4. Results and Discussion
4.1. Ablation Experiments
To deeply analyze how each key component of CAR-YOLO affects model performance, a set of ablation experiments are conducted with identical training configurations to quantitatively measure the contribution of each proposed improvement strategy. Systematic analyses are carried out from three perspectives: lightweight feature extraction, contextual semantic enhancement and adaptive multi-scale fusion. Herein, R, C and A represent the lightweight backbone network, ContextGuided module and Attentional Scale Sequence Fusion Framework (ASF) respectively. The detailed experimental outcomes are presented in Table 1.
As shown in Group 1 and Group 2, after embedding Module R into the baseline YOLOv11n, the metric increases by 3.3%, Precision rises by 5.2% and Recall improves by 2.5%. Meanwhile, the parameter count and GFLOPs are both reduced. This phenomenon verifies that the lightweight RepViT backbone can retain powerful feature representation capability while cutting down model complexity. Comparing Group 1 and Group 3, the is elevated by 4.5%, accompanied by gains in Precision and Recall. Besides, there is no obvious growth in parameters and GFLOPs. It demonstrates that contextual information modeling introduces slight structural overhead yet exerts a positive effect on reducing missed detections. A comparison between Group 1 and Group 4 reveals a 4.9 percentage-point increment together with improved Precision and Recall. Nevertheless, the computational cost rises further. This indicates that multi-scale fusion strengthens detection capacity for subtle complex-texture pavement defects at the cost of heavier computational burden. The comparison of Group 1 and Group 5 shows a 3.2% gain in , accompanied by reductions in parameter quantity and GFLOPs. When comparing Group 1 and Group 6, the model complexity increases dramatically relative to the baseline, whereas achieves a notable improvement of 6.1%. Comparing Group 1 and Group 7, the increases by 5.2%, Precision and Recall are boosted by 0.6% and 3.9% respectively. Meanwhile, the model parameter count and GFLOPs drop by 20.9% and 15.9%. Group 8 corresponds to the lightweight algorithm proposed in this paper. Compared with the baseline model, it achieves a 4.9% gain, along with further increases of 6.1% in Precision and 6.8% in Recall. Meanwhile, the parameter count and GFLOPs are compressed by approximately 33.6% and 30.2%. These results indicate that the proposed algorithm drastically cuts model complexity while delivering competitive detection performance. These observations suggest the potential effectiveness of our improvement strategies.
Notably, Group 6 (A+C) yields the highest of 65.0%, yet it comes with substantially increased overhead: its parameter count reaches 3.155 M and GFLOPs equals 8.2. By introducing the lightweight RepViT backbone (Module R), Group 8 (A+R+C, our final CAR-YOLO) sacrifices a modest 1.2-percentage-point drop in , but reduces parameters by 45.7% and GFLOPs by 46.3% relative to Group 6. From a Pareto-optimality perspective, A+R+C achieves a favourable accuracy-complexity trade-off, which fits the target scenario of UAV-borne pavement-defect inspection with resource-constrained hardware.
4.2. Comparison Experiment
A set of mainstream lightweight detection networks are chosen for contrast experiments to fully validate the overall performance advantages of the newly designed CAR-YOLO model, including YOLOv6n, YOLOv8n, YOLOv9n-tiny, YOLOv10n and YOLOv11n. The China_Drone sub-dataset derived from RDD2022 acts as the unified test data source for all comparative trials. Detection accuracy, parameter quantity and computational complexity are selected as the evaluation indicators for comparison. Table 3 comprehensively presents all the experimental data and results obtained in this study.
Within our consistent experimental setup, compared with the baseline YOLOv11n, the proposed CAR-YOLO achieves a 2.5-percentage-point improvement in mean and a 1.7-percentage-point improvement in mean . This internal controlled comparison provides the most reliable evidence that our modifications enhance feature representation for diverse pavement defects and yield promising performance for subtle cracks and complex-texture pavement defects. For contextual reference, Table 3 also lists results of other lightweight models (YOLOv6n, YOLOv8n, YOLOv9n-tiny, YOLOv10n) from Ref. [20]. Since these external results were acquired under different experimental conditions (possible differences in dataset split, augmentation, software and optimization settings), they cannot be treated as fully controlled head-to-head comparisons. We therefore focus our primary conclusion on the pairwise comparison between YOLOv11n and CAR-YOLO under our unified protocol.
It can be observed that CAR-YOLO cuts storage overhead and forward inference computation while boosting detection accuracy, and exhibits appealing characteristics for prospective resource-constrained UAV-on-board deployment, while actual hardware-level latency and memory metrics remain unmeasured in this work. It only contains 1.714 M parameters. The parameter count is reduced by approximately 33.6% compared with the baseline YOLOv11n, and GFLOPs decrease from 6.3 G to 4.4 G (a 30.2% reduction). Compared with YOLOv9n-tiny, which is designed for extreme lightweight performance, CAR-YOLO achieves comparable parameter scale with higher reported values quoted from Ref. [20].
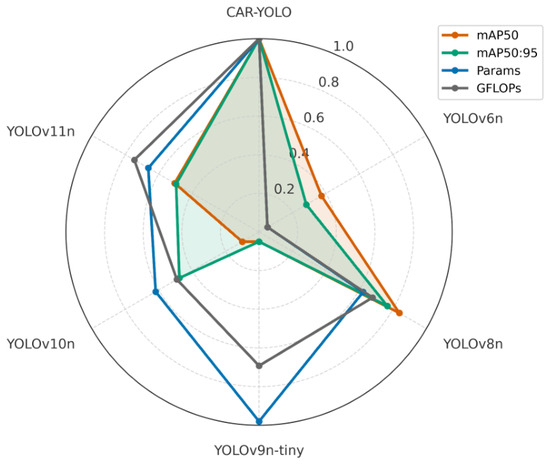
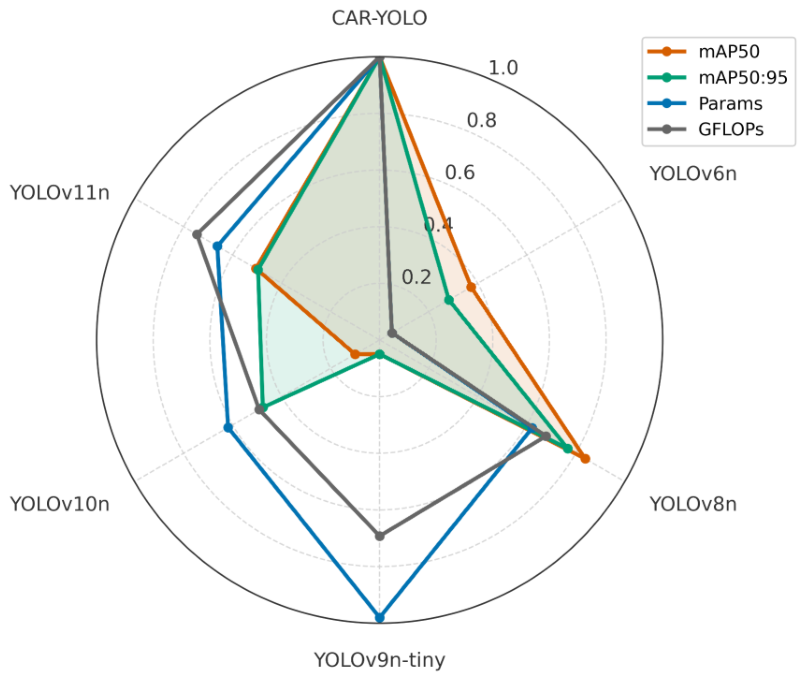
On the basis of quantitative comparisons among all lightweight detection models, Figure 7 is further adopted to analyze the overall distribution characteristics of various models from a two-dimensional perspective of detection accuracy and model complexity. As illustrated in the figure, YOLOv6n, YOLOv10n and YOLOv9n-tiny are distributed on the low-accuracy side of the plot. Although YOLOv9n-tiny achieves lighter parameters and lower GFLOPs, it ranks last among all comparative models in terms of both and . This reveals its insufficient feature representation ability for subtle cracks and small-scale pits under complex pavement conditions. YOLOv6n and YOLOv10n bring no matching accuracy gains despite high computational costs, which leads to an obvious imbalance between detection precision and computational overhead. As a widely deployed lightweight detection framework, YOLOv8n achieves a relatively balanced trade-off between detection accuracy and model size. Its and are substantially higher than those of YOLOv6n, YOLOv10n and YOLOv9n-tiny, while its parameter count and GFLOPs remain at a moderate level, placing it at an intermediate position in the radar chart. Compared with other methods, our presented CAR-YOLO network exhibits competitive overall performance, delivering a favourable trade-off between detection performance and computational complexity. On one hand, CAR-YOLO yields better average-precision metrics than the compared models and shows consistent performance gains relative to YOLOv11n and YOLOv8n. These observations suggest that the proposed modifications can strengthen the feature-representation capability for diverse pavement defects. On the other hand, the parameter count and FLOPs of CAR-YOLO are lower than those of YOLOv11n and YOLOv8n, and remain comparable to YOLOv9n-tiny, which is designed for extreme lightweight deployment.
Figure 7.
CAR-YOLO Performance Comparison with Other Lightweight Detection Models.
In summary, considering both quantitative indicators and graphical distribution, CAR-YOLO achieves simultaneous improvements in detection accuracy and inference efficiency for pavement defect detection tasks under the present experimental setting. The model keeps good precision and recall for all kinds of road damage like cracks and potholes on complicated roads. At the same time, it greatly lowers the model’s parameter number and calculation cost.
4.3. Visualization Result Analysis
Ablation tests and comparison experiments show CAR-YOLO can balance detection accuracy and model complexity better. We take YOLOv11n as the basic model. CAR-YOLO lifts from 58.9% to 63.8% and from 30.8% to 33.4%. At the same time, its total parameters drop to 1.714 M and GFLOPs fall to 4.4 G.
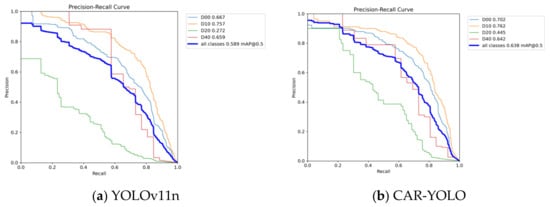
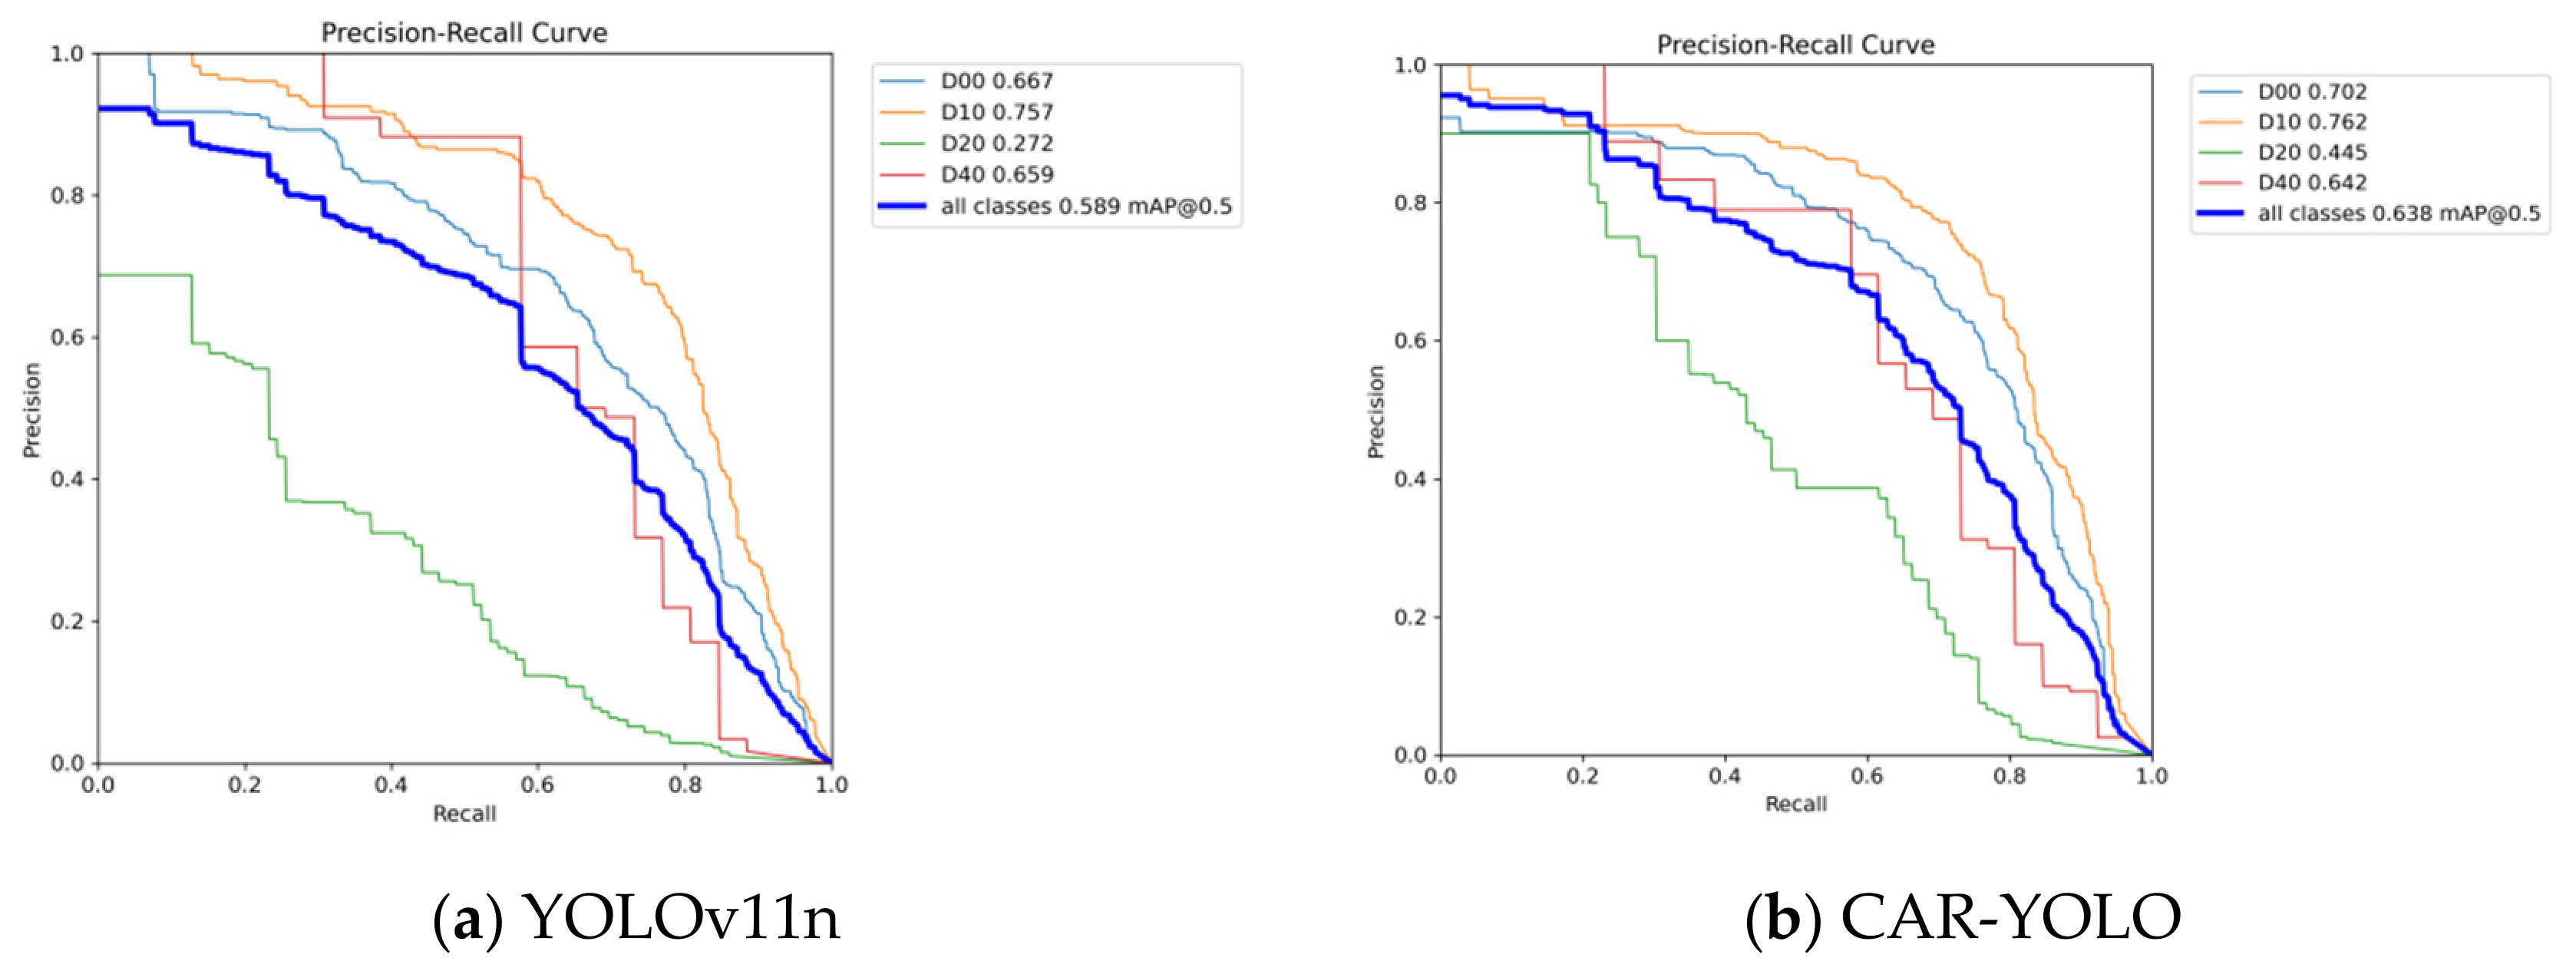
Figure 8 draws Precision–Recall curves of the two models using test data. Figure 8a belongs to YOLOv11n and Figure 8b is CAR-YOLO’s curve. From the overall curve shape, CAR-YOLO keeps higher precision under most recall values. It means when the model detects more targets, wrong prediction numbers do not rise fast. When recall value is medium or high, CAR-YOLO’s curve covers a bigger area. This tells us the model works steadily no matter how we change thresholds and fits new unknown data better. We also check results of every single defect type. CAR-YOLO gets stable better results on D00; D10 and D40 only have small performance changes. D20 gains the largest improvement. This proves our model can effectively capture features for subtle, complex-texture and low-contrast pavement defects such as D20 alligator cracks.
Figure 8.
Comparison of - Curves of YOLOv11n and CAR-YOLO on the Test Set.
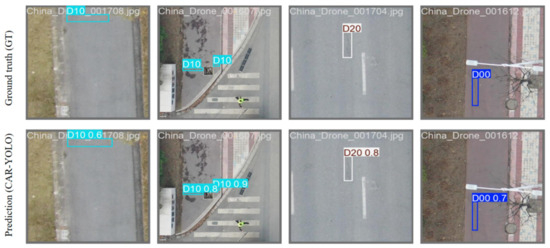
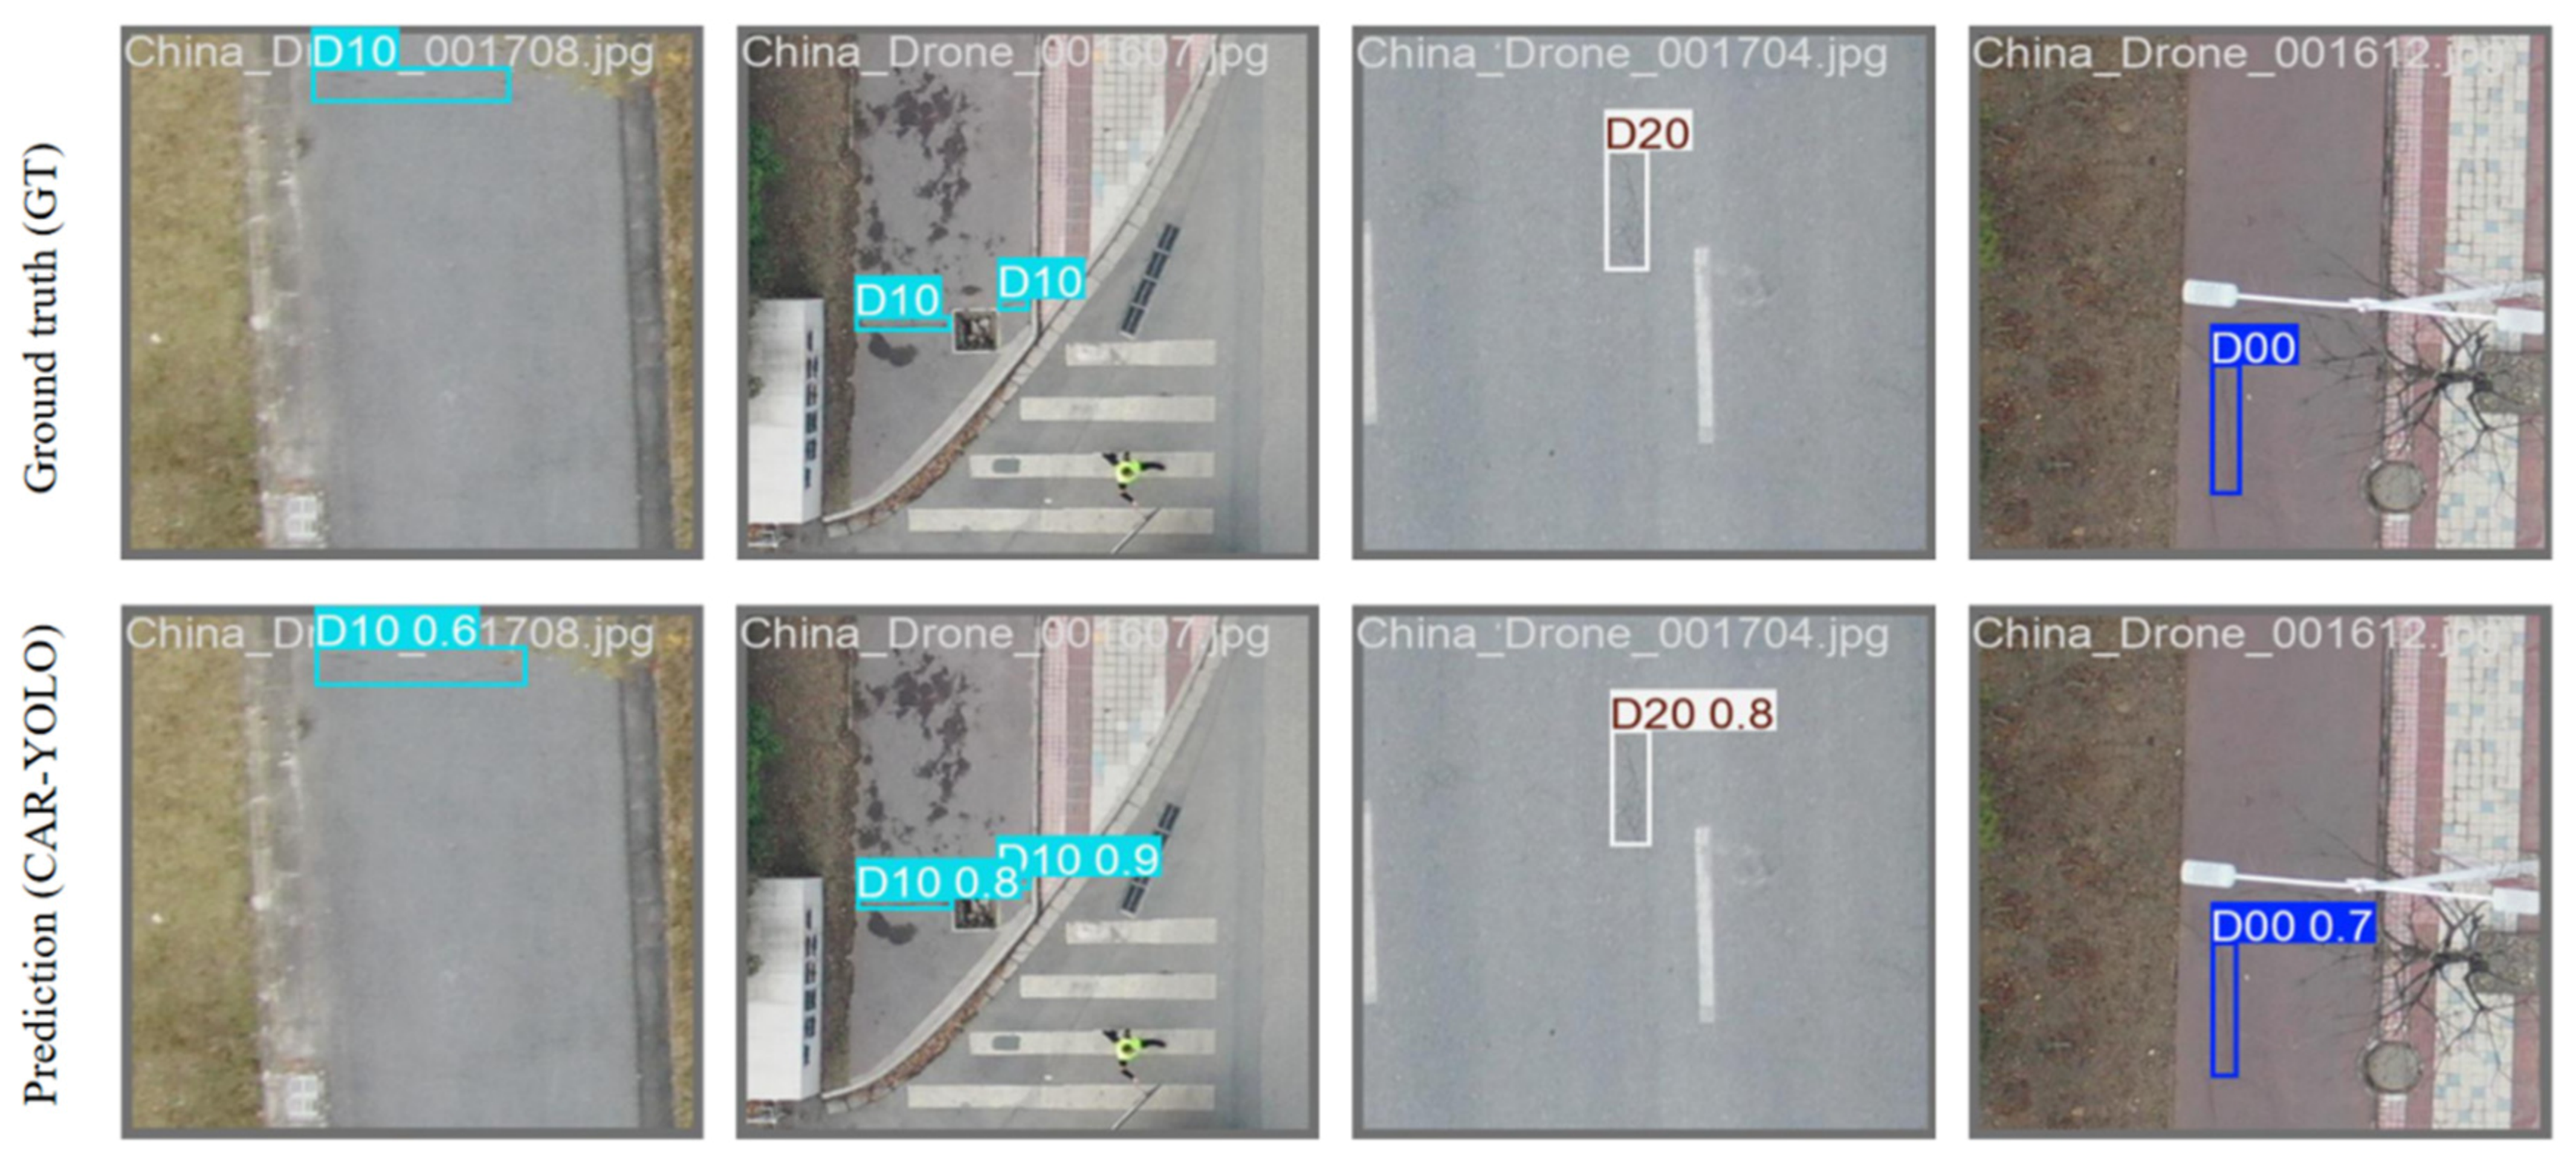
Figure 9 shows detection pictures picked randomly from test data. The pictures let us clearly compare YOLOv11n and CAR-YOLO. We check how well they find and classify targets in different road scenes. We set the same display rules for all pictures to avoid confusion. The first line shows real defect labels (Ground Truth). Other lines show the detection results made by the two models. A prediction box spatially matched with GT yet assigned an incorrect category label is defined as misclassification. A missed detection occurs when ground-truth targets exist in the image without any corresponding predicted bounding boxes.
Figure 9.
Visualization results of randomly sampled test images.
Two typical error patterns of YOLOv11n can be summarized from sample comparisons. First, missed detections frequently occur under complex pavement textures, blurred defect boundaries or tiny target scales. Second, when defects share similar shapes or the scene suffers severe background interference, the model may output bounding boxes with approximate positions yet incorrect category labels, leading to misclassification false positives. In contrast, CAR-YOLO tends to generate bounding boxes that precisely align with actual defect regions on identical test samples, and maintains more reliable detection performance for subtle complex-texture pavement defects represented by D20 alligator cracks.
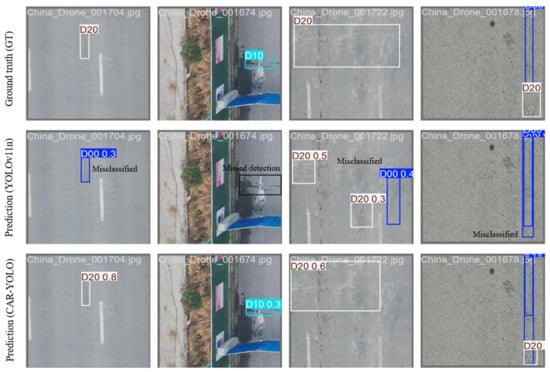
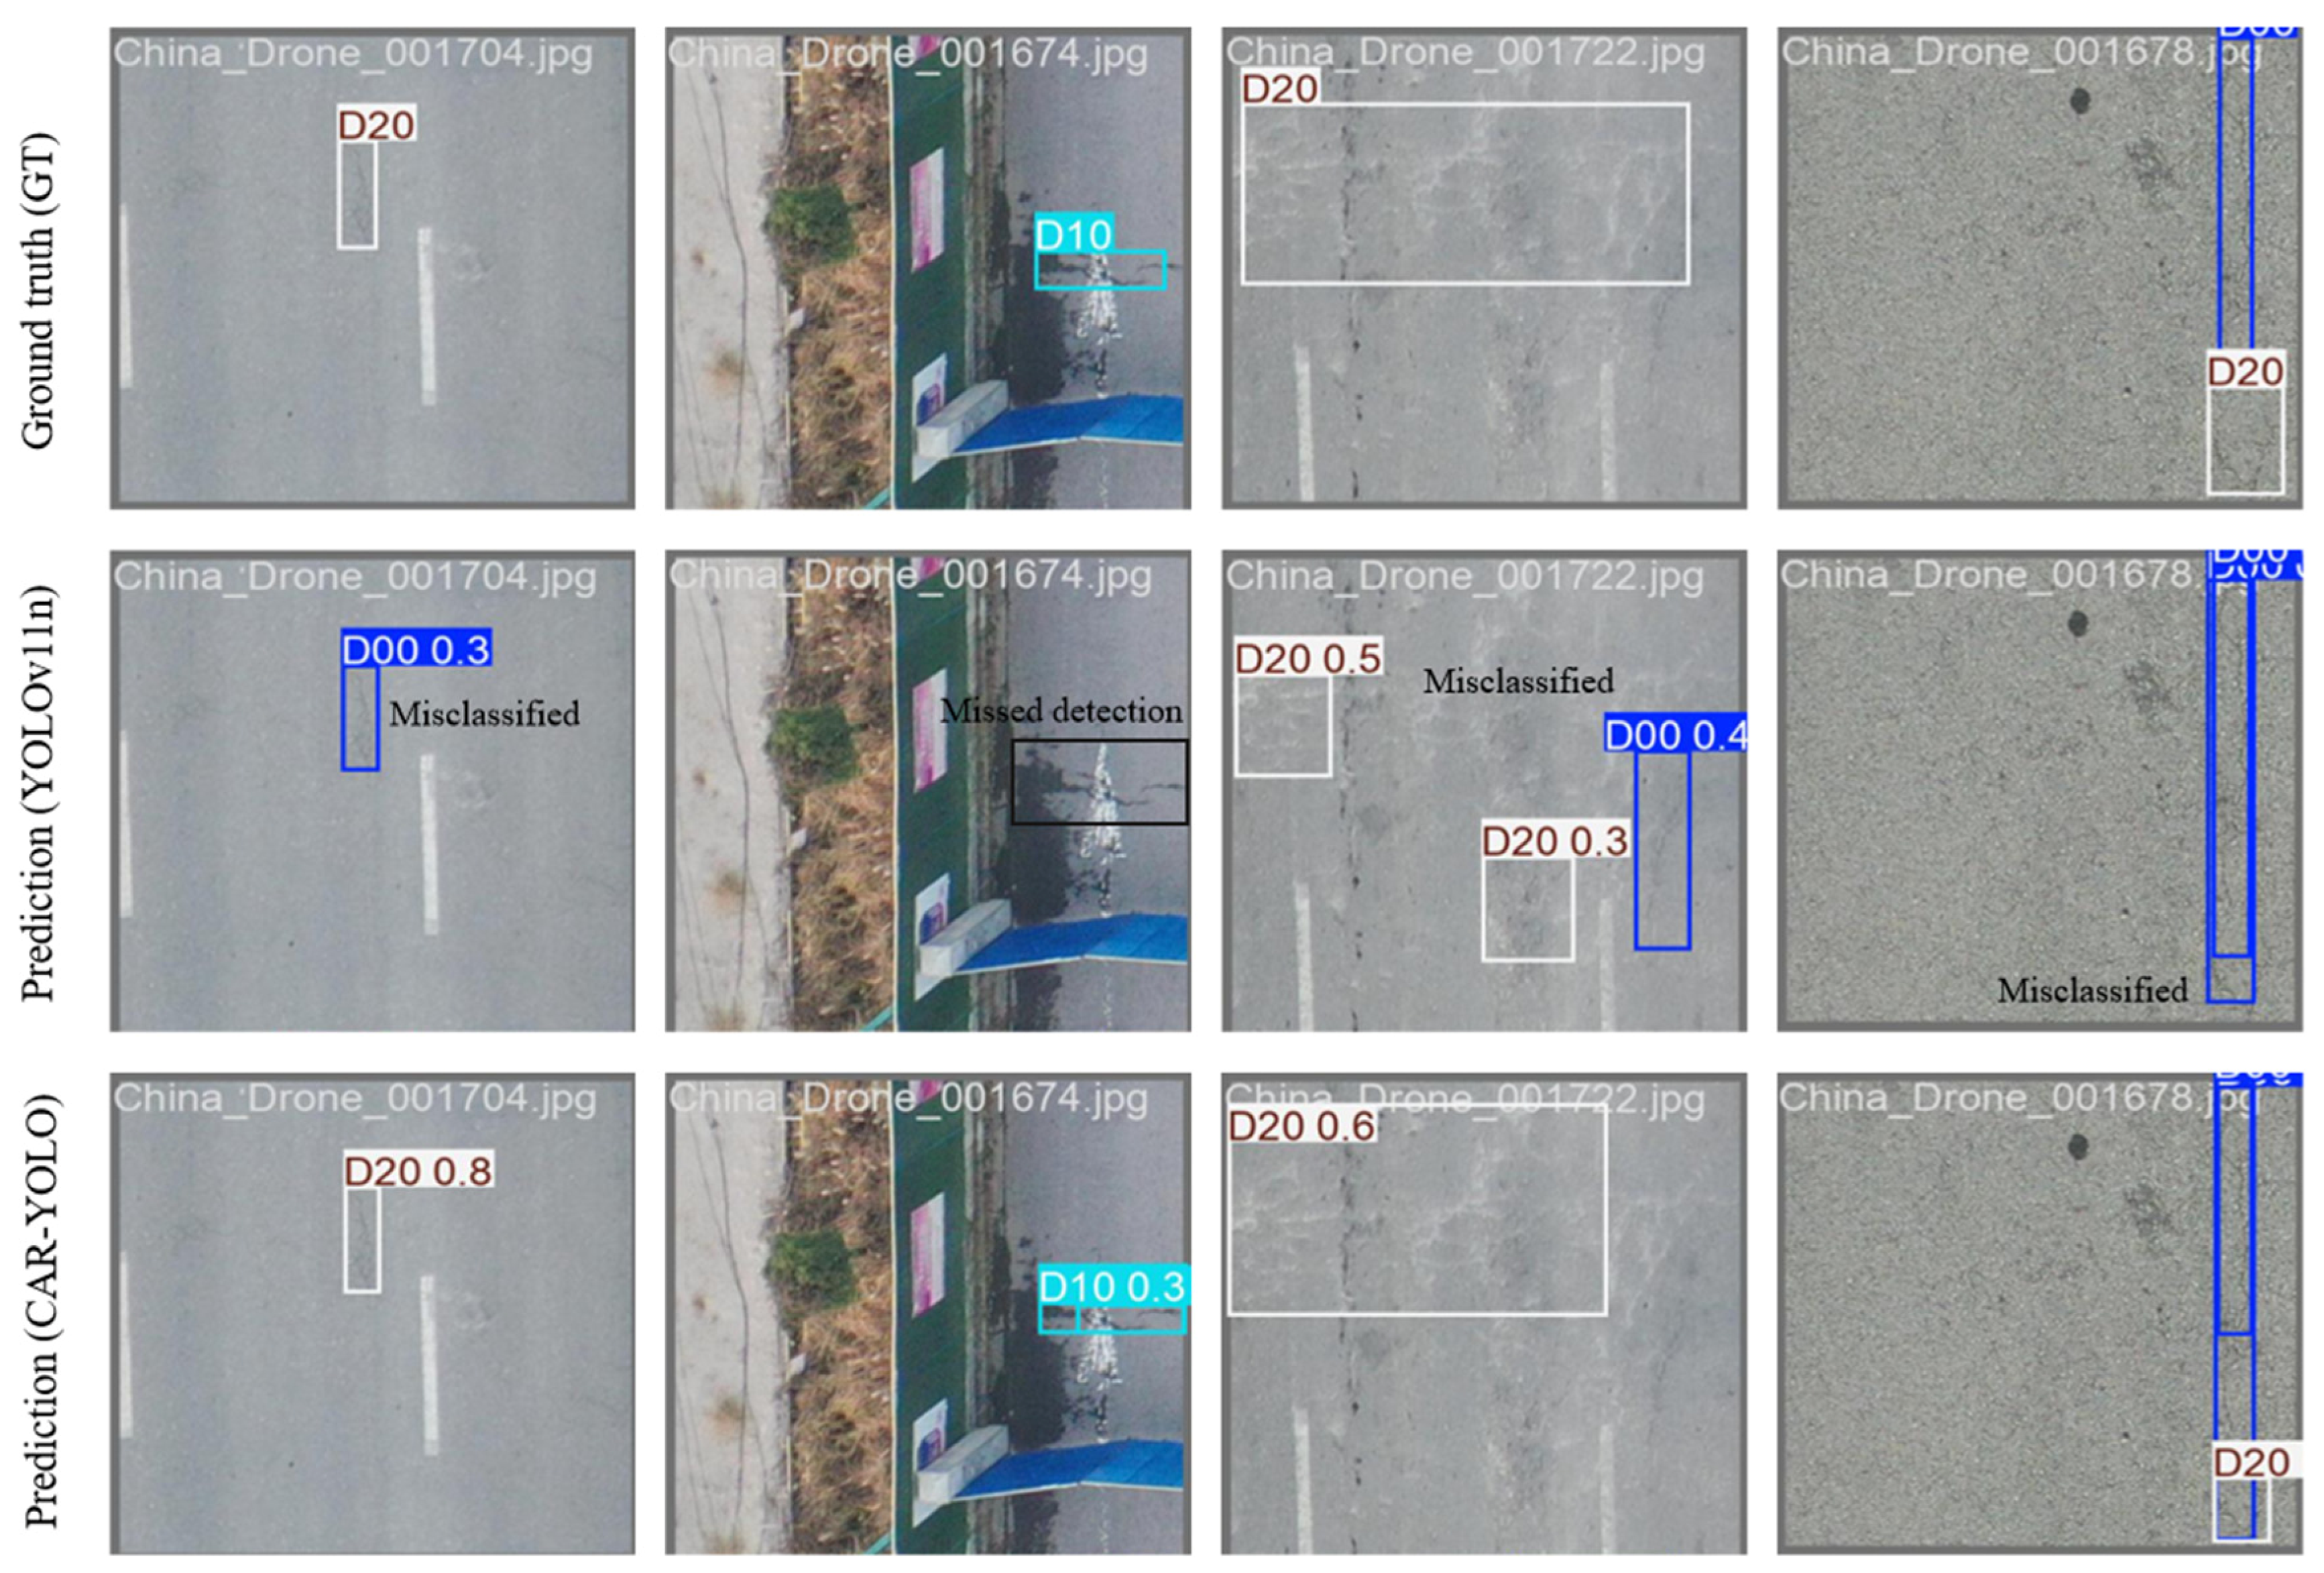
To further demonstrate the advantages of CAR-YOLO over the baseline and their distinct error patterns at the sample level, Figure 10 presents visual comparison results of four randomly selected test samples. The first row shows real labels (GT). The second row gives YOLOv11n’s detection results, and the third row shows predictions of CAR-YOLO. For the first group of samples: the real D20 cracks are thin and look very similar to surrounding road textures. YOLOv11n wrongly marks nearby areas as D00. This means the original model cannot extract tiny texture features well and mixes up similar damage types easily. But CAR-YOLO’s predicted boxes match the real defect positions perfectly with correct labels. It proves our improved model can tell different defect types more steadily. The second group’s real targets are D10 cracks close to road edges. Complex background, changing light and partial blockage make the crack edges unclear. YOLOv11n cannot draw any correct boxes here and misses these defects entirely. It shows the baseline model responds weakly to defects with low contrast. However, CAR-YOLO can fully cover the target area with accurate detection boxes, which means it effectively reduces missed targets under messy background disturbance. The third sample’s real defect is D20, which covers a wide area with irregular textures. YOLOv11n makes two mistakes here: wrong classification and many extra useless boxes. It shows the baseline model cannot separate defect edges from background clearly, leading to both false detections and inaccurate location. On the contrary, CAR-YOLO outputs tight, precise boxes and removes those useless false responses. The fourth sample includes two kinds of damages: D00 and D20. YOLOv11n only detects D00, and mistakenly marks all D20 areas as D00. This cross-type confusion brings lots of false detection results. This demonstrates that the baseline model lacks sufficient category discrimination ability when multiple similar-shaped defects coexist within one image. In contrast, CAR-YOLO can reasonably distinguish different defect types; its predicted bounding boxes and labels are highly consistent with ground truth annotations in both spatial location and category, thereby reducing false positives induced by category confusion.
Figure 10.
Visual comparison of detection performance between the original YOLOv11n and the proposed CAR-YOLO. Note that only representative improved-performance cases are shown here; failure cases for shadow-obscured D40 potholes are not illustrated in this figure.
It is worth noting that the visual examples in Figure 9 and Figure 10 mainly illustrate improved detection cases of CAR-YOLO, while both models still exhibit typical detection defects including false negatives, false positives and inter-class confusion.
For the baseline YOLOv11n: it frequently produces false-negative missed detections for complex-texture D20 alligator cracks under cluttered road backgrounds. Besides, it suffers from class-confusion errors, easily mixing up D00 longitudinal cracks and D20 reticular cracks; it also generates occasional false-positive predictions on road scratches that are not actual pavement defects.
For the proposed CAR-YOLO: benefiting from context-guided and multi-scale fusion modules, it greatly alleviates missed detection and category confusion for D20 defects. Nevertheless, CAR-YOLO is not free of detection errors. Consistent with the slight AP drop of D40 (pothole) from 65.9% to 64.2% in Table 2, CAR-YOLO still yields false negatives for some shallow, shadow-obscured D40 potholes. It also occasionally produces false positives for dark road stains that resemble potholes, and partial inter-class confusion still exists between D10 transverse cracks and D40 potholes.
In summary, although CAR-YOLO achieves overall performance improvement over YOLOv11n, false-positive, false-negative and class-confusion problems are not completely eliminated for either model. Visual demonstration of representative failure samples will be considered in our future research. It should be noted that Figure 9 and Figure 10 only illustrate representative cases with improved detection performance achieved by CAR-YOLO. As reflected by the slight drop in from 65.9% to 64.2% in Table 2, CAR-YOLO still suffers from detection failures for shadow-obscured D40 potholes, including missed detection and false-positive responses on road stains. Representative failure cases are not included in the current figures and will be supplemented in future investigations.
5. Conclusions
This paper addresses the trade-off problem between frequent missed detection of subtle pavement defects under complex road scenarios and high computational overhead that hinders practical deployment, and proposes CAR-YOLO, an improved detection framework based on YOLOv11n that balances lightweight architecture and high detection accuracy. By embedding the Context-Guided module, the proposed method strengthens the context-modeling capability for defect regions. It achieves adaptive cross-scale feature fusion via the ASF, and reconstructs the backbone network using the RepViT to reduce redundant computations.
On the China_Drone UAV sub-dataset of RDD2022, CAR-YOLO achieves an of 63.8%, representing a 4.9-percentage-point improvement over the baseline YOLOv11n. Its parameter count is compressed from 2.58 M to 1.71 M (a 33.6% reduction), and GFLOPs decrease from 6.3 G to 4.4 G (a 30.2% reduction).
From an engineering perspective, the defect type, spatial location, and pixel-level extent of pavement defects output by CAR-YOLO can provide fundamental raw data support for pavement-condition assessment workflows. The automatically extracted defect information can feed into pavement-condition-related indicators, assisting road managers in preliminary screening of high-risk road segments. It should be highlighted that the reduced parameter count and GFLOPs reported in this work only reflect model-level computational characteristics and represent only theoretical potential for UAV-on-board deployment, rather than verified practical edge-device performance, since latency, memory-footprint and power consumption have not been measured on real embedded hardware. Nevertheless, it should be emphasized that this study is limited to visual defect detection and classification. Full pavement-condition scoring systems, quantitative damage-level grading standards, and automatic repair-or-rehabilitation decision-making rules are not implemented in the current work, and these engineering decision-making modules need to be combined with additional road-engineering domain knowledge in practical deployment.
Regarding the intended application scope and generalization potential: the model is primarily designed for UAV-aided rapid pavement-defect inspection of asphalt roads. Judging from the distribution of training samples, it can be reasonably expected to obtain acceptable detection performance for two-lane undivided roads and multilane divided asphalt highways with similar pavement textures. However, the training dataset contains very few samples dedicated to cycling-specific infrastructure. Therefore, its generalization reliability for cycling lanes remains uncertain. Real-world practical use for cycling-facility inspection will require further enrichment of corresponding training samples and targeted validation tests.
Nevertheless, the present study still has clear limitations. First, the training and test datasets are dominated by aerial images captured under sunny weather, and samples under adverse illumination conditions such as rain, snow, fog and low-light environments are insufficient. Second, although the parameter count and computational complexity have been optimized, all performance evaluations are conducted on a server platform. Inference latency, memory footprint and power consumption have not been measured on real embedded edge hardware. Third, even after model optimization, partial missed detections and category confusion still occur for shallow D40 pothole samples occluded by shadows.
Accordingly, future research will target these aforementioned limitations: (1) Expand the pavement-image dataset with samples collected under diverse adverse-weather and lighting conditions to further improve the environmental robustness of the model; (2) Carry out real-world embedded-hardware deployment and benchmark tests to measure practical inference latency and memory consumption, so as to further verify the practical usability for UAV on-board devices; (3) Explore targeted strategies to mitigate detection failures for shadow-occluded pothole targets and further reduce category confusion among pavement-defect classes; (4) In future studies, we will also attempt to generalize our model toward larger-scale, multi-regional real-world road networks and carry out more extensive comparative evaluations against alternative technical paradigms from pavement-engineering research, including hand-crafted image-processing approaches and hybrid CNN-Transformer architectures.
Author Contributions
Conceptualization, X.W. and Y.L.; methodology, X.W.; software, X.W.; validation, X.W. and Y.L.; formal analysis, X.W.; investigation, Y.L.; resources, Y.L.; data curation, X.W.; writing—original draft preparation, X.W.; writing—review and editing, Y.L.; visualization, X.W.; supervision, Y.L.; project administration, Y.L.; funding acquisition, Y.L. All authors have read and agreed to the published version of the manuscript.
Funding
This research was funded by the Natural Science Foundation of Jilin Province (No. 20240304097SF).
Institutional Review Board Statement
Not applicable.
Informed Consent Statement
Not applicable.
Data Availability Statement
Data used in this work were obtained from the public RDD2022 dataset.
Conflicts of Interest
The authors declare no conflict of interest.
References
- Singh, P.; Wijethunga, R.; Sadhu, A.; Samarabandu, J. Expert Evaluation System for Pothole Defect Detection. Expert Syst. Appl. 2025, 277, 127280. [Google Scholar] [CrossRef] [Scilit]
- El-Din Hemdan, E.; Al-Atroush, M.E. A Review Study of Intelligent Road Crack Detection: Algorithms and Systems. Int. J. Pavement Res. Technol. 2026, 19, 1704–1734. [Google Scholar] [CrossRef] [Scilit]
- Si, Y.; Lang, H.; Qian, J.; Zou, Z. LiDAR-Driven Innovations in Pavement Distress Detection: A Review. J. Comput. Civ. Eng. 2026, 40, 03125003. [Google Scholar] [CrossRef] [Scilit]
- Guo, Y.; Liu, Y.; Oerlemans, A.; Lao, S.; Wu, S.; Lew, M.S. Deep Learning for Visual Understanding: A Review. Neurocomputing 2016, 187, 27–48. [Google Scholar] [CrossRef] [Scilit]
- Khan, A.; Sohail, A.; Zahoora, U.; Qureshi, A.S. A Survey of the Recent Architectures of Deep Convolutional Neural Networks. Artif. Intell. Rev. 2020, 53, 5455–5516. [Google Scholar] [CrossRef] [Scilit]
- Redmon, J.; Divvala, S.; Girshick, R.; Farhadi, A. You Only Look Once: Unified, Real-Time Object Detection. In Proceedings of the IEEE Conference on Computer Vision and Pattern Recognition; IEEE: New York, NY, USA, 2016; pp. 779–788. [Google Scholar]
- Liu, W.; Anguelov, D.; Erhan, D.; Szegedy, C.; Reed, S.; Fu, C.-Y.; Berg, A.C. SSD: Single Shot MultiBox Detector. In Computer Vision—ECCV 2016; Leibe, B., Matas, J., Sebe, N., Welling, M., Eds.; Lecture Notes in Computer Science; Springer International Publishing: Cham, Switzerland, 2016; Volume 9905, pp. 21–37. [Google Scholar]
- Ren, S.; He, K.; Girshick, R.; Sun, J. Faster R-CNN: Towards Real-Time Object Detection with Region Proposal Networks. IEEE Trans. Pattern Anal. Mach. Intell. 2017, 39, 1137–1149. [Google Scholar] [CrossRef] [Scilit] [PubMed]
- Yang, L.; Deng, J.; Duan, H.; Yang, C. An Efficient Fusion Detector for Road Defect Detection. Sci. Rep. 2025, 15, 27959. [Google Scholar] [CrossRef] [Scilit] [PubMed]
- An, H.; Fan, Y.; Jiao, Z.; Liu, M. Research on Improved Bridge Surface Disease Detection Algorithm Based on YOLOv7-Tiny-DBB. Appl. Sci. 2025, 15, 3626. [Google Scholar] [CrossRef] [Scilit]
- Zhao, Y.; Shi, B.; Duan, X.; Zhu, W.; Ren, L.; Liao, C. Research on Road Surface Damage Detection Based on SEA-YOLO V8. PLoS ONE 2025, 20, e0324439. [Google Scholar] [CrossRef]
- Zhang, Z.; Zhang, H.; Zhang, T. Enhanced YOLOv8-Based Pavement Crack Detection: A High-Precision Approach. PLoS ONE 2025, 20, e0324512. [Google Scholar] [CrossRef] [Scilit] [PubMed]
- He, S.; Yuan, Y.; Yin, B. LMD_YOLO: A Lightweight and Efficient Model for Pavement Defects Detection. IEEE Access 2025, 13, 65510–65525. [Google Scholar] [CrossRef] [Scilit]
- Qi, H.; Gong, J.; Tang, Y. PWDR-YOLO: Road Defect Detection Based on Improved YOLO11n. Eng. Lett. 2025, 33, 4849–4858. [Google Scholar]
- Khanam, R.; Hussain, M. Yolov11: An Overview of the Key Architectural Enhancements. arXiv 2024, arXiv:2410.17725. [Google Scholar]
- Fan, L.; Wang, D.; Wang, J.; Li, Y.; Cao, Y.; Liu, Y.; Chen, X.; Wang, Y. Pavement Defect Detection with Deep Learning: A Comprehensive Survey. IEEE T. Intell. Veh. 2024, 9, 4292–4311. [Google Scholar] [CrossRef] [Scilit]
- Zhao, L.; Wu, Y.; Luo, X.; Yuan, Y. Automatic Defect Detection of Pavement Diseases. Remote Sens. 2022, 14, 4836. [Google Scholar] [CrossRef] [Scilit]
- Wang, A.; Chen, H.; Lin, Z.; Han, J.; Ding, G. Rep ViT: Revisiting Mobile CNN From ViT Perspective. In Proceedings of the 2024 IEEE/CVF Conference on Computer Vision and Pattern Recognition (CVPR), 16–22 June 2024; IEEE: New York, NY, USA, 2024; pp. 15909–15920. [Google Scholar]
- Wu, J.; Dong, J.; Nie, W.; Ye, Z. A Lightweight YOLOv5 Optimization of Coordinate Attention. Appl. Sci. 2023, 13, 1746. [Google Scholar] [CrossRef] [Scilit]
- Qian, Z.; Tang, W. Aerial Road Disease Detection Model Based on SD-YOLOv11. J. Hubei Minzu Univ. (Nat. Sci. Ed.) 2025, 43, 224–230. (In Chinese) [Google Scholar]
- Kang, M.; Ting, C.-M.; Ting, F.F.; Phan, R.C.-W. ASF-YOLO: A Novel YOLO Model with Attentional Scale Sequence Fusion for Cell Instance Segmentation. Image Vis. Comput. 2024, 147, 105057. [Google Scholar] [CrossRef] [Scilit]
- Yu, H.; Chen, J.; Yu, P.; Feng, D. A Lightweight Defect Detection Algorithm for Escalator Steps. Sci. Rep. 2024, 14, 23830. [Google Scholar] [CrossRef] [Scilit] [PubMed]
- Wu, T.; Tang, S.; Zhang, R.; Cao, J.; Zhang, Y. CGNet: A Light-Weight Context Guided Network for Semantic Segmentation. IEEE Trans. Image Process. 2021, 30, 1169–1179. [Google Scholar] [CrossRef] [Scilit] [PubMed]
- Arya, D.; Maeda, H.; Ghosh, S.K.; Toshniwal, D.; Sekimoto, Y. RDD2022: A Multi-National Image Dataset for Automatic Road Damage Detection. Geosci. Data J. 2024, 11, 846–862. [Google Scholar] [CrossRef] [Scilit]
- Davis, J.; Goadrich, M. The Relationship between Precision-Recall and ROC Curves. In Proceedings of the 23rd International Conference on Machine Learning, New York, NY, USA, 25 June 2006; pp. 233–240. [Google Scholar]

Disclaimer/Publisher’s Note: The statements, opinions and data contained in all publications are solely those of the individual author(s) and contributor(s) and not of MDPI and/or the editor(s). MDPI and/or the editor(s) disclaim responsibility for any injury to people or property resulting from any ideas, methods, instructions or products referred to in the content. |
© 2026 by the authors. Licensee MDPI, Basel, Switzerland. This article is an open access article distributed under the terms and conditions of the Creative Commons Attribution (CC BY) license.