


Abstract
Paraffin-rich organic deposits in the near-wellbore zone reduce pore space, increase the skin factor, and impair oil-well productivity, and frequently recur after conventional treatment. This study develops a coupled one-dimensional radial model of thermochemical treatment in which an activated aluminum alloy reacts with formation water in the wellbore, releasing heat that propagates into the formation and melts and dissolves paraffin deposits. The model combines two-phase oil–water flow; heat transfer with latent-heat effects; eight paraffin pseudo-components in dissolved, suspended, and deposited states; temperature-dependent solid–liquid equilibrium; and wax deposition, dissolution, melting, and redistribution coupled to porosity–permeability recovery. Hydrogen is treated as a wellbore reaction byproduct that segregates upward and accumulates below the closed packer, rather than as a mobile reservoir phase, and the reaction kinetics are based on experimental hydrogen-evolution data for three activated aluminum alloys of differing reactivity. Simulations show a rapid skin-factor reduction during the reaction, followed by partial recovery to approximately 80–90% of the initial value during prolonged shut-in because of cooling, recrystallization, and redeposition. Increasing reagent amount or reactivity, initial wax-induced damage, or oil saturation enhances the predicted treatment effect, whereas reservoir type has a comparatively minor influence.
1. Introduction
Oil production from waxy, resinous, and heavy crude oils is frequently complicated by the formation of organic deposits in the near-wellbore zone (NWZ), the wellbore, and the tubing string. These deposits reduce the effective flow area, increase the skin factor, lower well productivity, and require additional stimulation, cleaning, and maintenance operations. In petroleum-engineering practice, such deposits are commonly described as asphaltene–resin–paraffin deposits (ARPDs), although their composition and structure vary significantly from field to field and even from well to well. The problem is especially important for mature and heavy-oil reservoirs, where changes in pressure, temperature, gas–oil ratio, and phase composition during production disturb the thermodynamic equilibrium of the reservoir fluids and promote precipitation and accumulation of heavy organic components [1].
Among the constituents of ARPD, paraffin wax plays a particularly important role because of its strong temperature dependence. When the temperature of crude oil decreases below the wax appearance temperature, dissolved paraffin components crystallize and form solid particles that may remain suspended in the oil phase, adhere to solid surfaces, or become incorporated into more complex organic deposits together with resins and asphaltenes. The crystallization temperature and the intensity of wax formation depend not only on temperature but also on pressure, dissolved-gas content, and crude-oil composition. Therefore, a paraffin-dominated deposit is better represented as a multi-component system of paraffin pseudo-components than as a single-component wax phase.
Although paraffin deposition is often considered primarily a flow-assurance problem in tubing and pipelines, several studies have shown that it can also occur in the reservoir pore space and cause near-wellbore formation damage. Ring (1991) described reservoirs in which solid paraffin particles deposit in the pore space and cause recurring productivity impairment through three coupled mechanisms—paraffin solubility and precipitation, transport and deposition of precipitated particles, and permeability reduction caused by the deposited solids—and showed that heating treatments can restore productivity, although repeated treatment may be required because paraffin damage may recur [2]. Adeyanju and Oyekunle (2011) similarly concluded that paraffin deposition is mainly a near-wellbore phenomenon that reduces porosity, permeability, and productivity while increasing skin damage [3], and Sandyga et al. (2020) reported laboratory and modeling evidence of wax-induced formation damage in the near-wellbore region [4].
The physical basis for modeling paraffin precipitation and deposition has been developed in several directions. Weingarten and Euchner (1988) used ideal-solution theory to relate wax precipitation to temperature, wax concentration, solvent amount, melting point, and latent heat of fusion [5]. Wang et al. (1999) developed a one-dimensional, multi-pseudo-component model for simultaneous paraffin and asphaltene deposition in porous media, including static surface deposition, dynamic surface deposition, and pore-throat plugging [6]. These works provide an important basis for representing the transition of paraffin between dissolved, suspended, and deposited states and for relating deposit accumulation to porosity and permeability impairment.
Real deposits are chemically and structurally more complex than idealized paraffin-only systems. Ganeeva et al. (2016) detected n-alkanes over a wide carbon-number range in asphaltene fractions and in wax deposits formed in downhole equipment, indicating that high-molecular-weight paraffinic components may be associated with asphaltene-rich organic matter [7]. This supports the use of a paraffin-dominated formulation in which several paraffin pseudo-components are considered while the model remains focused on the thermal dissolution and removal of wax-rich deposits. Such a formulation is more realistic than a single-component wax model and, at the same time, avoids the unnecessary complexity of full compositional modeling of all heavy organic fractions.
Restoring permeability after organic-deposit removal requires a relation between the changing deposit volume, the porosity, and the permeability. In models of evolving pore space, power-law porosity–permeability relations are commonly used as a reasonable first choice when detailed pore-scale information is unavailable, provided that the exponent is treated as a calibration or sensitivity parameter [8]. Such an approach is suitable for engineering-scale modeling of permeability recovery during the removal of paraffin deposits from pore surfaces and pore throats.
Because paraffin-rich deposits are highly sensitive to temperature, thermal and thermochemical methods are attractive for near-wellbore stimulation: increasing the temperature can melt crystalline paraffin fractions, increase the solubility of heavy organic components in the oil phase, reduce oil viscosity, and enhance mass transfer from the deposited phase into the flowing oil phase. Rather than delivering heat from the surface, thermochemical treatment generates heat directly in the target zone. In the present work, the heat is produced by the reaction of an activated aluminum alloy with formation water, 2Al + 6H2O → 2Al(OH)3 + 3H2, which is strongly exothermic [9]. This reaction was selected because it provides in situ heat generation close to the paraffin-damaged NWZ, uses formation water as a reactant in the considered treatment configuration, and allows the heat-release intensity to be adjusted through the composition and reactivity of the activated aluminum alloy. Small alloying additions (Ga, In, Sn, Bi, Cd) depassivate the aluminum surface and allow the reaction to proceed at moderate temperatures [10]; moreover, the hydrogen-evolution kinetics of such activated aluminum alloys have been characterized experimentally by Sarmurzina et al. (2026) [11], providing an experiment-based description of the reaction kinetics for the present model. Lyubchenko et al. (2025) reviewed activated aluminum-alloy and solvent systems for removing ARPD from the NWZ and tubing strings in heavy and highly viscous Kazakhstani crude oils [1].
The reaction releases hydrogen as a byproduct. In the treatment configuration considered here, the reacting interval is isolated by a packer, and the low-density hydrogen segregates upward within the wellbore and accumulates below the packer rather than being driven radially into the formation. Accordingly, hydrogen is not modeled as a mobile reservoir phase; its role is confined to the wellbore heat- and gas-generation balance, while flow in the NWZ is treated as two-phase oil–water flow. This choice is consistent with the small hydrogen penetration obtained in exploratory three-phase calculations and keeps the formulation focused on the dominant thermal mechanism of deposit removal.
Dissolution of deposits from pore surfaces is controlled not only by equilibrium solubility but also by the rate at which dissolved components are transported away from the deposit–oil interface. Fan et al. (2021) emphasized the importance of wax molecular diffusion in crude oil and developed a diffusivity correlation based on cold-finger experiments [12], while Balakotaiah and West (2002) provided a Sherwood-number correlation suitable for surface-to-fluid mass transfer in pore-like channels [13]. Together these allow the dissolution rate of deposited paraffin to be linked to molecular diffusivity, pore size, oil velocity, and the concentration driving force.
Despite significant progress in wax-precipitation and deposition modeling, formation-damage modeling, and ARPD-removal technologies, these aspects have generally been considered separately. Reviews and synthesis studies are available for individual parts of the problem. For example, recent work has summarized compositional formulations and activated-aluminum-based approaches for ARPD removal in the near-wellbore zone and tubing strings [1]. However, such studies do not provide an integrated near-wellbore framework that directly couples the heat source generated by an activated aluminum–water reaction with transient two-phase oil–water transport, multi-component wax phase behavior, redistribution of wax among dissolved, suspended, and deposited states, and the resulting recovery of porosity, permeability, and well productivity. To the best of our knowledge, such a coupled formulation has not been previously reported for the thermochemical treatment of paraffin-induced near-wellbore formation damage. The development of this framework is also timely because recent experimental characterization of the temperature-dependent kinetics of activated aluminum–water systems [11] provides the data required to connect reagent reactivity directly with heat generation and the subsequent evolution of wax deposits in the formation.
The objective of the present study is to develop an integrated one-dimensional radial model of thermochemical treatment of the NWZ, in which the exothermic activated aluminum–water reaction in the wellbore drives coupled two-phase oil–water flow; temperature-dependent multi-component paraffin solid–liquid equilibrium; deposition, dissolution and melting of wax; heat transfer with latent-heat effects; and porosity–permeability recovery. Treatment efficiency is assessed through the evolution of the well skin factor and the corresponding flow-rate change factor for representative near-wellbore scenarios.
The main features of the proposed model are as follows: (i) the mobility of both the oil and the water phase is represented through evolving saturations during heating and the displacement of water from the wellbore into the formation; (ii) the multi-component composition of the wax deposits is taken into account by means of several paraffin pseudo-components; (iii) the dissolution, deposition, melting, and transport of wax are modeled together with their feedback on porosity and permeability; and (iv) the kinetics of the chemical reaction of the activated aluminum alloy with formation water are incorporated as the in situ heat source that drives the treatment.
2. Materials and Methods
2.1. Mathematical Model
The model couples three groups of processes. First, the exothermic reaction of the activated aluminum alloy with water in the wellbore supplies the heat flux and the water influx at the inner boundary of the NWZ (Equations (35)–(39) and boundary conditions (46)). Second, two-phase oil–water flow and heat transfer in the porous medium are described by Equations (1)–(5) and Equations (26)–(32). Third, the multi-component wax model—solid–liquid equilibrium and the deposition, dissolution, melting, and redistribution of the deposited wax (Equations (6)–(25))—feeds back on porosity and permeability (Equations (33) and (34)), and hence on the well skin factor and the flow-rate change factor (Equations (49)–(51)). The corresponding equations are presented below in this order.
2.1.1. Two-Phase Flow
The fluid flow in the porous medium was described by the standard equations of two-phase flow in porous media [14]:
where and are the porosity and absolute permeability of the NWZ; and are the phase saturations (hereafter, of water and oil, respectively); and are the phase densities; and are the phase Darcy velocities; and are the phase relative permeabilities; and are the phase dynamic viscosities; and are the phase pressures; is the time variable; and is the distance from the well axis in the radial direction into the NWZ. In this model, the capillary pressure between the oil and water phases is neglected, i.e., it is assumed that:
This assumption is related to the fact that the domain under consideration is limited to the NWZ within less than 5 m of the production well, while the main purpose of the model is to describe the thermal treatment, dissolution, crystallization, deposition, and removal of wax components with the oil phase. During the first and second stages, the well is not producing; therefore, no production-driven two-phase flow occurs, although reaction-induced displacement of wellbore water into the formation is represented by the inner boundary condition. During the third stage, after the well is put back on production, large radial pressure gradients and high flow velocities develop near the bottomhole, since the flow velocity is proportional to (). Therefore, the flow of oil and water in the NWZ is governed mainly by viscous forces and phase mobilities, and the contribution of capillary pressure is considered small compared with the viscous pressure drop. Gravity effects are neglected in the flow equations because the model considers a one-dimensional radial near-wellbore domain in which radial pressure gradients, heat transfer, and wax phase transitions are assumed to be dominant during thermochemical treatment.
A similar simplification is used in a number of flow and formation-damage models. For example, Adeyanju and Oyekunle (2011) modeled wax deposition in an oil reservoir considering radial flow and neglected the capillary pressure between the vapor and liquid phases [3]. Wang et al. (1999) also used a model in which gravitational and capillary effects were excluded when modeling formation damage by asphaltene and wax deposition [6]. In radial two-phase well-inflow problems, Bøe et al. (1989) likewise neglected gravitational and capillary effects in the analysis of the pressure transient response [15]. Therefore, in the present work, the adoption of Equation (4) is regarded as a standard engineering simplification for the NWZ problem, where the main interest is focused on heat transfer, wax dissolution/crystallization, permeability change, and the subsequent removal of wax by the oil flow.
In the present study, the representative NWZ reservoir types are treated as having mixed effective wettability. The mineral pore surface may conventionally be water-wet or approximately neutral, whereas pore-wall regions covered by wax deposits may have a more hydrophobic, oil-wet character. Wettability is represented only at an effective, phenomenological level and enters the model indirectly through the adopted oil–water relative-permeability formulation and the endpoint saturations ( and ). No separate wettability variable is introduced. Because capillary pressure is neglected in Equation (4), contact-angle-dependent capillary effects are not explicitly represented. Likewise, dynamic wettability alteration associated with heating, water displacement, or wax dissolution and redeposition is not represented in the present model and would require additional experimental wettability, relative-permeability, and capillary-pressure data for the specific rock–oil–water–wax system. Without assigning fixed wetting and non-wetting roles to the two fluid phases, a relatively simple Corey-type model, modified to account for residual oil, was adopted:
where is the normalized water saturation; is the critical water saturation, i.e., the minimum value of ; and is the residual oil saturation.
2.1.2. Multi-Component Multistate Wax Transport and Phase-Transition Model
In practice, n-alkanes may account for up to 95% of wax components [16]. It is known that short n-alkanes () have low melting temperatures: at reservoir temperatures of 40–100 °C, they are certainly in the liquid/dissolved state and do not form a stable solid wax phase. Accordingly, the following composition of the wax deposits is considered in this work: , , …, , while the short n-alkanes () are included in the oil solvent. The parameters of these wax components are given in Table A1 (Appendix A).
The eight selected n-alkanes are used as representative pseudo-components spanning a broad range of molecular weights and melting temperatures of the paraffinic fraction considered in the model. Their number represents a compromise between retaining the multi-component melting and dissolution behavior of wax and maintaining reasonable computational complexity. The procedure used to determine the initial component distribution is described in Appendix A. This representation is not intended to reproduce the complete composition of a specific crude-oil wax; branched and cyclic paraffins, resins, asphaltenes, and other heavy-organic constituents are not explicitly considered.
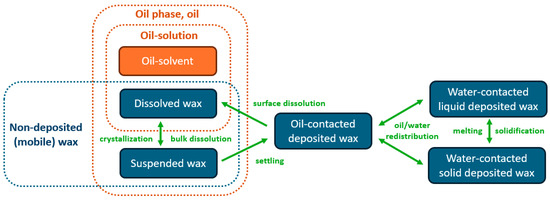
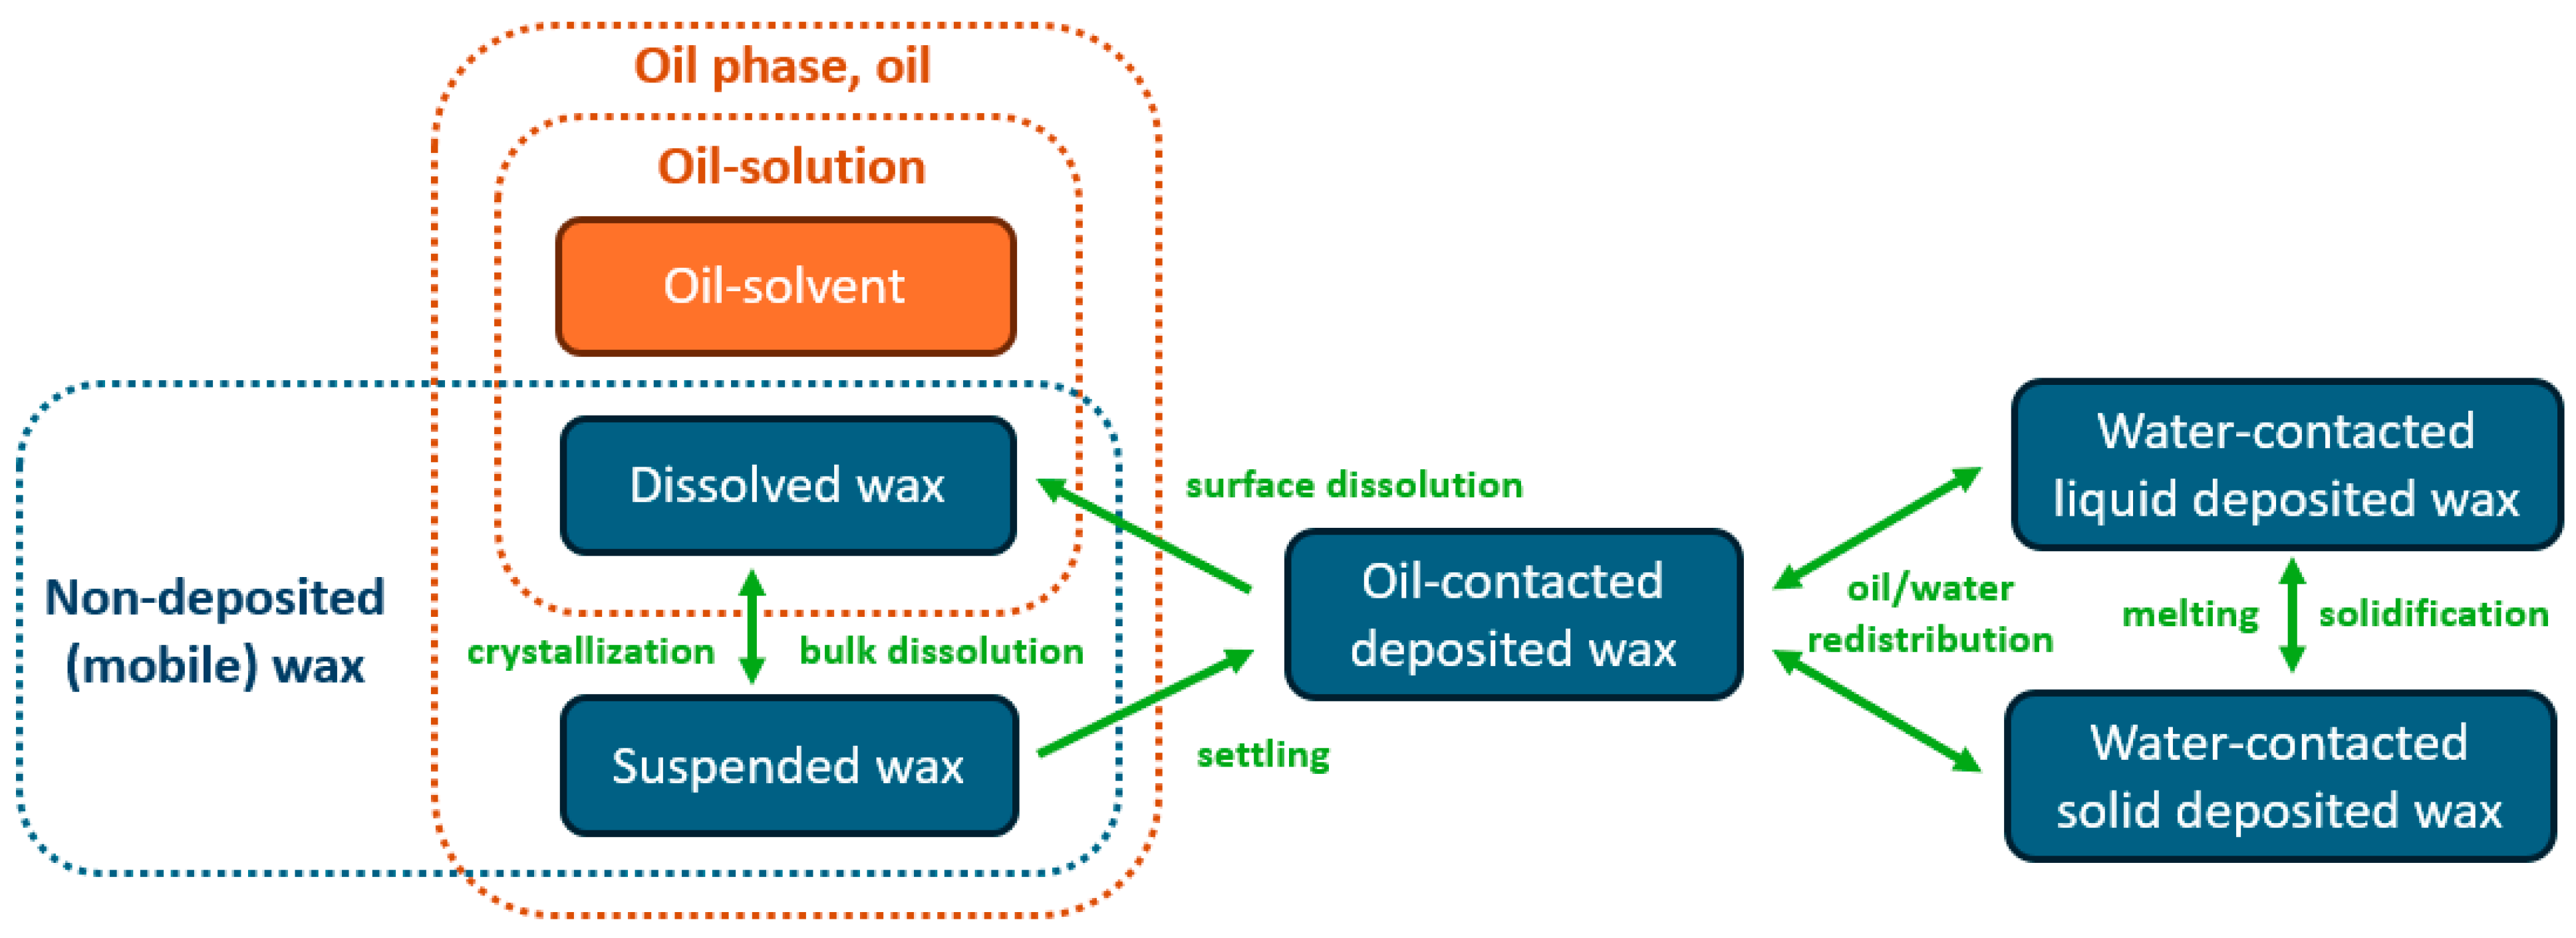
Wax does not dissolve in water and can exist in one of the following states: dissolved in oil, as crystallized particles in oil (in a suspended state), or in a deposited layer on the reservoir pore surface (see Figure 1). Wax is transported only within the oil phase. Accordingly, the mass balance of each wax component is written as follows:
where is the index of the wax component; is the mass fraction of dissolved wax component in the oil phase; is the mass fraction of suspended wax component ; is the density of solid wax component ; is the rate of change in the deposited-wax volume fraction due to dissolution of the deposited wax into oil; and is the rate of change in the deposited-wax volume fraction due to the deposition of suspended wax particles onto the pore surface.
Figure 1.
Schematic representation of the considered interactions between oil and the various states of wax. Green arrows denote considered transitions between the different wax states, whereas dotted outlines indicate the respective groupings corresponding to the oil phase, oil-solution, and non-deposited (mobile) wax.
Wang et al. (1999) [6] and Sandyga et al. (2020) [4] used wax-balance equations similar to Equation (6); however, these formulations do not include a term describing the dissolution of deposited wax, and the suspended wax particles are treated as a pseudo-phase separate from the oil.
Multi-component wax crystallization was described as thermodynamic solid–liquid equilibrium between the liquid oil phase and a single mixed solid wax phase. This approach corresponds to the well-known solid-solution models of wax precipitation used in the works of Won (1986) [17], Hansen et al. (1988) [18], and Coutinho and Stenby (1996) [19]. According to this approach, the ratio of dissolved to suspended wax has the following form:
where is the mole fraction of dissolved wax (component ) relative to the entire liquid phase (oil solution); is the mole fraction of suspended wax particles (component ) relative to the total amount of suspended wax; and are the values of the latent heat and of the absolute melting temperature of the wax component ; is the universal gas constant; and and are the activity coefficients of component in the liquid phase (oil solution) and in the solid phase (solid wax), respectively. An ideal solid–liquid equilibrium model is adopted in the present study; i.e., , . This assumption has also been used in previous studies to calculate the amounts of dissolved and suspended wax in oil, such as in Weingarten and Euchner (1988) [5], Fan and Llave (1996) [20], Wang et al. (1999) [6], Adeyanju and Oyekunle (2011) [3], Sandyga et al. (2020) [4] and others. In our model, the material balance of the wax components dissolved and suspended in the oil solution is written as follows:
where and are the mole fractions in the oil phase of the wax component and the oil solvent; is the mole fraction of the oil solvent in the oil solution; and is the mole fraction of all suspended wax particles relative to the oil phase, whose value was determined after successive elimination of the variables and from the system of Equations (7)–(10):
where is the root of the equation (in the right-hand side of Equation (11)). The criterion means that the non-deposited wax dissolves completely in the oil; otherwise, part of it crystallizes and transitions into the form of particles suspended in the oil.
The values of the mole fractions and and of the mass fractions and are related as follows:
where is the molar mass of the wax component ; and is the effective molar mass of the oil phase, whose value can be calculated using the molar mass of the oil solvent, as well as the mass fractions of non-deposited wax and of the oil-solvent in the oil phase:
The term in Equation (6), which describes the deposition of suspended wax particles onto the pore surface, was defined using the model of Civan (1996) [21] that was simplified by Wang et al. (1999) [6]:
where is the rate coefficient of static deposition of wax particles onto the pore surface; is the rate coefficient of dynamic deposition of wax particles onto the pore surface; and the third term represents the plugging of pore channels by wax deposits: is the rate coefficient of pore-channel plugging by wax deposits.
The dissolution of wax deposited on the pore walls was represented by a linear interphase mass-transfer model driven by a concentration driving force. This type of formulation is widely used for the dissolution of non-aqueous phase liquids (NAPLs) in porous media, where the dissolution rate is proportional to the mass-transfer coefficient, the specific interfacial area, and the difference between the equilibrium solubility and the bulk concentration [22,23,24]. Following this approach, the dissolution term in Equation (6) is written as follows:
where is the specific pore surface area (the ratio of the pore surface area per unit volume of the porous medium) in contact with the oil phase; is the mass-transfer coefficient from the surface of deposited wax component into the oil; is the saturated value of the mass fraction of the wax component dissolved in oil; and is the volume fraction of wax component on the pore surface that is in contact with oil, per total volume of the porous medium. If , the dissolution of the deposited wax into oil ceases. The ratio of the specific pore surface area in contact with the oil phase to the total specific pore surface area was defined as proportional to the oil saturation:
According to dissolution–diffusion theory (the Nernst–Lewis model), local thermodynamic equilibrium is assumed at the interface between deposited wax and the oil phase, so that the concentration of dissolved wax at the interface reaches its saturation value. Replacing the variables with , with (the saturated mole fraction of dissolved wax component relative to the oil solution), and with (the mole fraction of deposited wax component relative to the total deposited wax) in Equations (7)–(10), the same equilibrium relations can therefore be applied at the interface between deposited wax and the oil phase. Calculating the value of from the share of component in the composition of the wax deposit:
and using Equations (7) and (10), we obtain the expression for :
The value of can be found from the definition of the Sherwood number (), adapted for a porous medium [25]:
where is the mean pore diameter; and is the molecular diffusion coefficient of wax component of the wax deposit into the oil phase. The Sherwood number was calculated using the model developed by Balakotaiah and West (2002) [13]:
where is the particle Reynolds number; is the Schmidt number of wax component , which represents the ratio of momentum diffusivity to the molecular diffusivity of the substance; and is the limiting Sherwood number, whose value equals 3.66 for circular pore structures [13].
To date, the empirical Wilke–Chang and Hayduk–Minhas correlations are widely used for calculating the diffusion of solid wax molecules in various solvents [26,27,28]. In our work, we use the correlation obtained by Fan et al. (2021) [12], which, compared with the Wilke–Chang and Hayduk–Minhas correlations, is even more accurate for calculating the molecular diffusion of wax in crude oil [12]:
where is the absolute temperature; is the oil viscosity (in mPa∙s); and is the molar volume of the molecule of wax component (in cm3/mol).
In the present simulations, materially affects the dissolution kinetics only while the corresponding deposited wax component remains present. Since the modeled paraffin components = 3–8 (–) become completely dissolved before reaching their respective melting temperatures, the practically relevant temperature range over which Equation (22) affects the present dissolution calculations is approximately 40–78 °C; the experiments and supporting property data reported by Fan et al. covered approximately 34–50 °C, so the application of the correlation toward the upper part of the present interval represents an extrapolation and introduces additional uncertainty into the predicted dissolution kinetics.
As the NWZ heats up and water is displaced from the wellbore into the formation, phase saturations change, which may also lead to a change in the volume of deposited wax in contact with oil (in addition to the wax dissolution and deposition processes). Part of the pore wall that was previously in contact with water begins to be in contact with oil, or vice versa. Let us assume that the wax deposits are distributed more or less uniformly over that part of the pore surface which is in contact with the corresponding phase. Thus, we propose the following form of the balance of the amounts of deposited wax in contact with the oil and water phases:
where is the volume fraction of deposited wax component in contact with the water (non-dissolving) phase; and is the redistribution rate of the deposited-wax volume fractions between the oil-contact and non-oil-contact zones.
The density of the oil phase is determined from the mass fractions of the oil solvent and of the wax components in the oil phase:
where is the density of the oil-solvent.
2.1.3. Energy Balance
The following energy balance [29] was used to model the temperature evolution in the NWZ while accounting for heat absorption or release during wax melting and crystallization:
where is the temperature (common to all phases and the rock); and are the specific heat capacities of the water and oil phases; is the volumetric density of latent-heat release upon crystallization or dissolution of wax in the oil phase; and and are, respectively, the effective volumetric heat capacity and the coefficient of effective thermal conductivity, whose values are deduced from the volume fractions of the material composition at a given point in space and time:
where is the density of the reservoir rock; , , , , , and are the specific heat capacities of the reservoir rock, the water and oil phases, liquid wax, solid wax and the oil solvent, respectively; , , , , , and are the thermal conductivities of the corresponding substances; and is the liquid (molten) part of the component of the deposited wax. Moreover, for the oil phase, the values of and are calculated from the mass fractions of the oil solvent and of the wax components in the oil phase.
The value of is calculated using a function with a smooth transition from 0 to 1 at the melting temperature of the component of the deposited wax:
During changes in the aggregation state of wax, heat is absorbed or released, which can noticeably affect the temperature distribution in the NWZ and, as a consequence, the remaining amount of deposited wax. To account for these effects, the source term was introduced into Equation (26). The value of the term was determined from the amount of non-deposited wax undergoing the transition from the suspended or deposited state into the dissolved state (or vice versa), as well as from the amount of deposited wax that is in contact with the water (non-dissolving) phase and undergoes the transition from the solid to the liquid state. The balance of the mass of dissolving wax is determined by the change in the mass of dissolved wax, taking into account its convective transport. Using the specific (per unit mass) heat of fusion of the wax component, we obtain:
2.1.4. Porosity and Permeability
In our model, as the thickness of the wax deposits on the pore walls changes, the porosity and permeability of the NWZ change as well. The porosity is related to the wax deposits as follows:
where is the reservoir porosity in the absence of wax deposits.
Here, and denote the volume fractions of deposited wax component β, per unit bulk volume of the porous medium that are in contact with the oil and water phases, respectively. Thus, represents the total bulk-volume fraction physically occupied by deposited wax, and Equation (33) constitutes a direct volumetric pore-space balance. Both deposited-wax fractions reduce the pore volume available to the fluids. However, only the oil-contacted fraction can dissolve directly into the oil phase according to Equation (16); the water-contacted fraction remains non-dissolving while it is in contact with water. Changes in phase saturation may redistribute deposited wax between these two fractions according to Equations (23) and (24). Dissolved and suspended wax contained in the oil phase are not directly subtracted from the porosity. Similar volumetric relations between porosity and deposited-wax volume have been used in previous porous-media wax-deposition models [4,6]; the present formulation extends this concept by distinguishing oil-contacted and water-contacted deposited wax for each wax pseudo-component.
In the present model, the permeability restoration upon wax-deposit removal was described by a power-law relation [8]:
2.1.5. Aluminum–Water Reaction
The chemical reaction of activated aluminum with formation water in the wellbore is described by the following equation [10]:
Because hydrogen is much less dense than water and oil, the released hydrogen is assumed to segregate upward within the wellbore owing to buoyancy and accumulate below the closed packer. Aluminum hydroxide () is almost insoluble in water [11].
It is assumed that the well is initially partially watered and that, prior to the onset of reaction (35), it had been shut in for some time. Owing to the density difference and the immiscibility of water and oil, the water phase will occupy the lower part of the wellbore at the perforations, while the oil phase will be located above it.
Taking into account the mole ratios of the reactants and products of Reaction (35), and using the Sarmurzina et al. (2026) [11] experimental values of the volumetric rate of hydrogen generation per unit mass of aluminum, we write the kinetics of the chemical reaction as:
where , , , and are the linear mass densities of aluminum, water, aluminum hydroxide, and hydrogen along the wellbore height, respectively; , , , and are the molar masses of the corresponding reactants and reaction products, respectively; and is the molar volume of hydrogen at normal conditions. The value of is likewise defined for the hydrogen volume at normal conditions.
In the present simulations, the hydrogen evolution rate reported by Sarmurzina et al. (2026) [11] is interpreted on a per-minute basis, i.e., in dm3/(kg∙min), and converted to SI units accordingly. This interpretation corresponds to reagent consumption times on the order of tens of minutes for the loadings considered here, which is consistent with the timescale of the underlying experiments and with published data for comparable activated aluminum–water systems [9]. The regressions subsequently presented in Section 3 are based on this interpretation.
Based on the reaction kinetics described by Equations (36) and (37), the rate of change in the total reactant and product volume per unit wellbore height () is:
where and are the densities of aluminum and aluminum hydroxide, respectively.
Reaction (35) is exothermic. The linear density of the heat release rate of the reaction along the height of the perforated interval of the well is:
where is the heat effect of the reaction per 1 mole of released hydrogen.
2.1.6. Initial and Boundary Conditions
The initial conditions prior to the thermochemical treatment of the NWZ are:
where is initial mole fraction of the component in the wax deposit; is the initial volume fraction of the component in the total deposited wax; and is the initial radial distribution of the volume fraction of the total deposited wax.
At the outer boundary of the NWZ, , the standard conditions of an undisturbed reservoir were prescribed (for a sufficiently large ):
The boundary conditions at the inner boundary of the NWZ () during the active chemical reaction (35) of the activated aluminum alloy with formation water are:
Although hydrogen is not transported as a mobile phase in the porous formation, its volumetric generation is explicitly included in Equation (38), and the resulting net reaction-induced volume change determines the displacement of wellbore water into the NWZ through the inner boundary condition in Equation (46).
The boundary conditions at during the well shut-in period after the end of the chemical reaction and before the start of production are:
The initial deposited-wax profile was prescribed as follows:
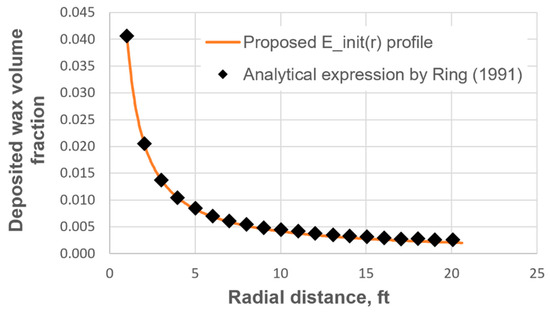
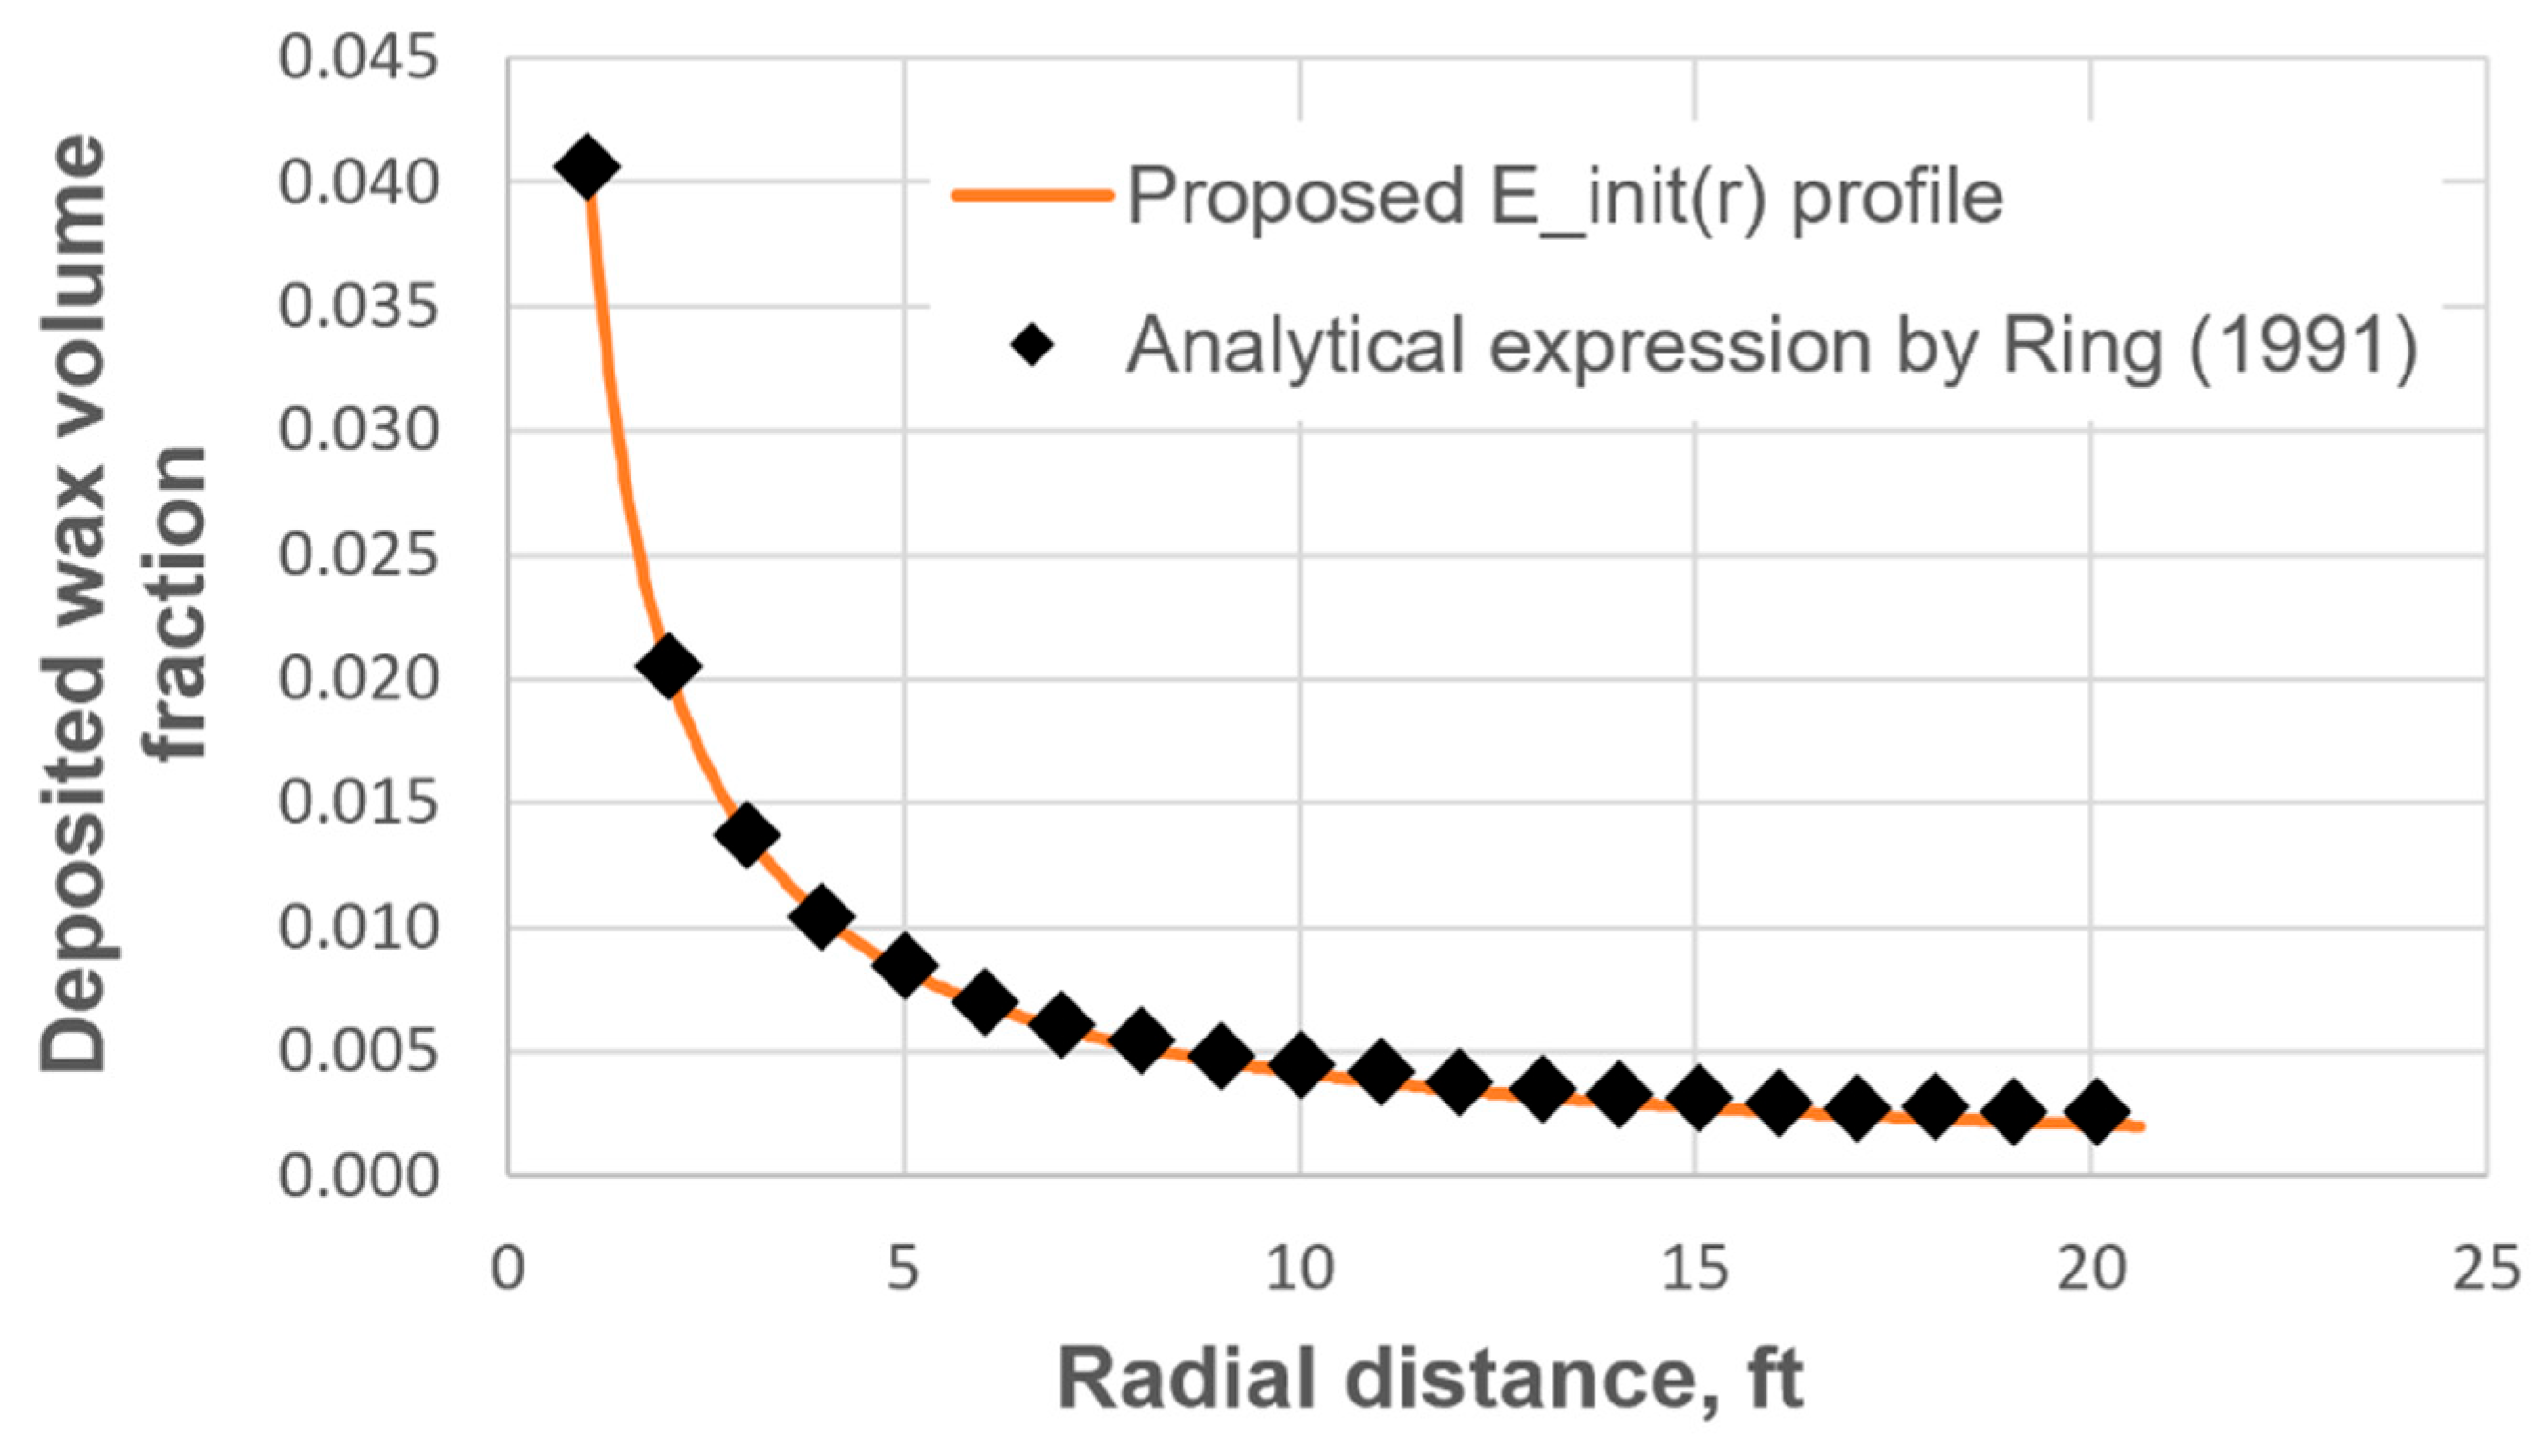
where is the initial value of the deposited-wax volume fraction in the NWZ at the well perforations. Distribution (48) was obtained from an assessment of Model (15), taking into account that, in the NWZ of a production well, the linear velocity of the oil phase is proportional to and that, near the entrance to the perforations, . For a given value of , Distribution (48) agrees well with the analytical solution of Ring (1991) [2] (see Figure 2).
Figure 2.
Comparison of the dependence with the analytical solution of Ring (1991) [2].
2.1.7. Skin Factor and Flow-Rate Change
The dependence of the well skin factor on the absolute-permeability distribution in the NWZ is described as follows [30]:
where is the current skin factor of the well; and is the radial distance at which (this is the effective radius of the area beyond which the effect of damage/treatment on permeability is considered negligible).
The flow-rate change factor of the production well is estimated from the change in its skin factor [30]:
where is the well skin factor at the initial time.
Using Equations (33), (34), (48) and (49), we obtain the relation between the prescribed initial well skin factor and the corresponding initial value of the deposited-wax volume fraction in the NWZ at the well perforations:
After the well is put back on production, the well performance is evaluated not by a separate production simulation, but through the change in the skin factor and the flow-rate change factor.
2.2. Numerical Implementation
The two-phase flow Equations (1)–(3) were solved using an IMPES scheme. Equations (6) and (26) were approximated by the finite-volume method as three-point implicit schemes. The resulting three-point implicit schemes defined systems of linear algebraic equations, which were solved by the Thomas algorithm. A staggered grid was used, in which the velocity variables were defined at the faces of the finite volumes, while the remaining variables (saturations, temperature, and the variables related to the amounts of the different wax components and states) were computed at the cell centers. The derivatives for the diffusive fluxes at the cell faces were approximated with a second-order-accurate scheme. In Equation (26), a central scheme was used for the convective terms because the absolute Péclet number was much smaller than unity during the explicitly simulated treatment and shut-in stages, indicating diffusion-dominated heat transfer. In Equation (6), an upwind scheme was used for the convective terms. Transient production restart was not explicitly simulated; post-treatment well performance was evaluated from the calculated skin-factor and flow-rate changes.
At each time step, inner iterations were performed according to a segregated scheme, consisting of the following steps:
- Calculation of and , using Equations (38) and (39);
- Calculation of the field , using Equations (26)–(32);
- Calculation of the fields , , , , and , using Equations (1)–(5);
- Calculation of and , using Equations (23) and (24), for ;
- Calculation of , using Equations (18) and (19), for ;
- Calculation of , using Equation (6), Equations (15)–(17), and Equations (20)–(22), for ;
- Calculation of and , using Equations (7)–(12), for ;
- Calculation of and , using Equations (33) and (34).
To improve the convergence and stability of the iterative process (the loop over steps 1–8), at each time step under-relaxation was applied to the variables , , , , , and .
A combined spatial-grid and time-step refinement study was performed to assess the numerical sensitivity of the solution. Five calculations were conducted using progressively finer spatial and temporal resolutions (, ): (5 mm, 10 s), (2 mm, 5 s), (1 mm, 2 s), (0.4 mm, 1 s), and (0.2 mm, 0.5 s). The solutions were compared in terms of the maximum wellbore temperature, the minimum skin factor, the skin factor after 10 h, and the radial distributions of temperature and deposited-wax volume fraction. Progressive refinement reduced the differences between consecutive solutions. The results obtained with and were nearly indistinguishable from those obtained with the finest resolution and . The relative differences in maximum of and minimum of at and value at were 0.6%, 0.2%, and 0.1%, respectively. Therefore, the resolution wherein and was considered sufficient for the parametric simulations.
For the numerical implementation of the model described above, a dedicated computational code was developed in C#.
3. Results and Discussion
Thermochemical treatment of the NWZ of a production well using the reaction of an activated aluminum alloy with formation water was simulated for several scenarios to evaluate the influence of the following input parameters:
- Reagent composition and chemical reaction rate;
- Amount of reagent;
- Initial oil saturation of the NWZ of the reservoir;
- Type of the NWZ of the reservoir;
- Initial level of wax-induced NWZ damage;
- Well shut-in time after the end of the chemical reaction.
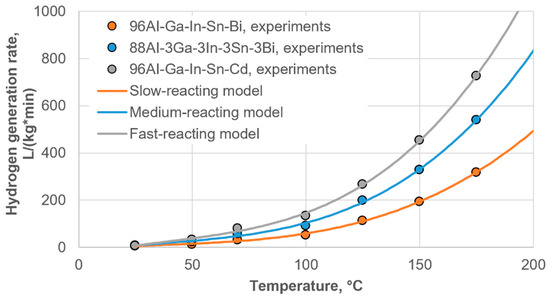
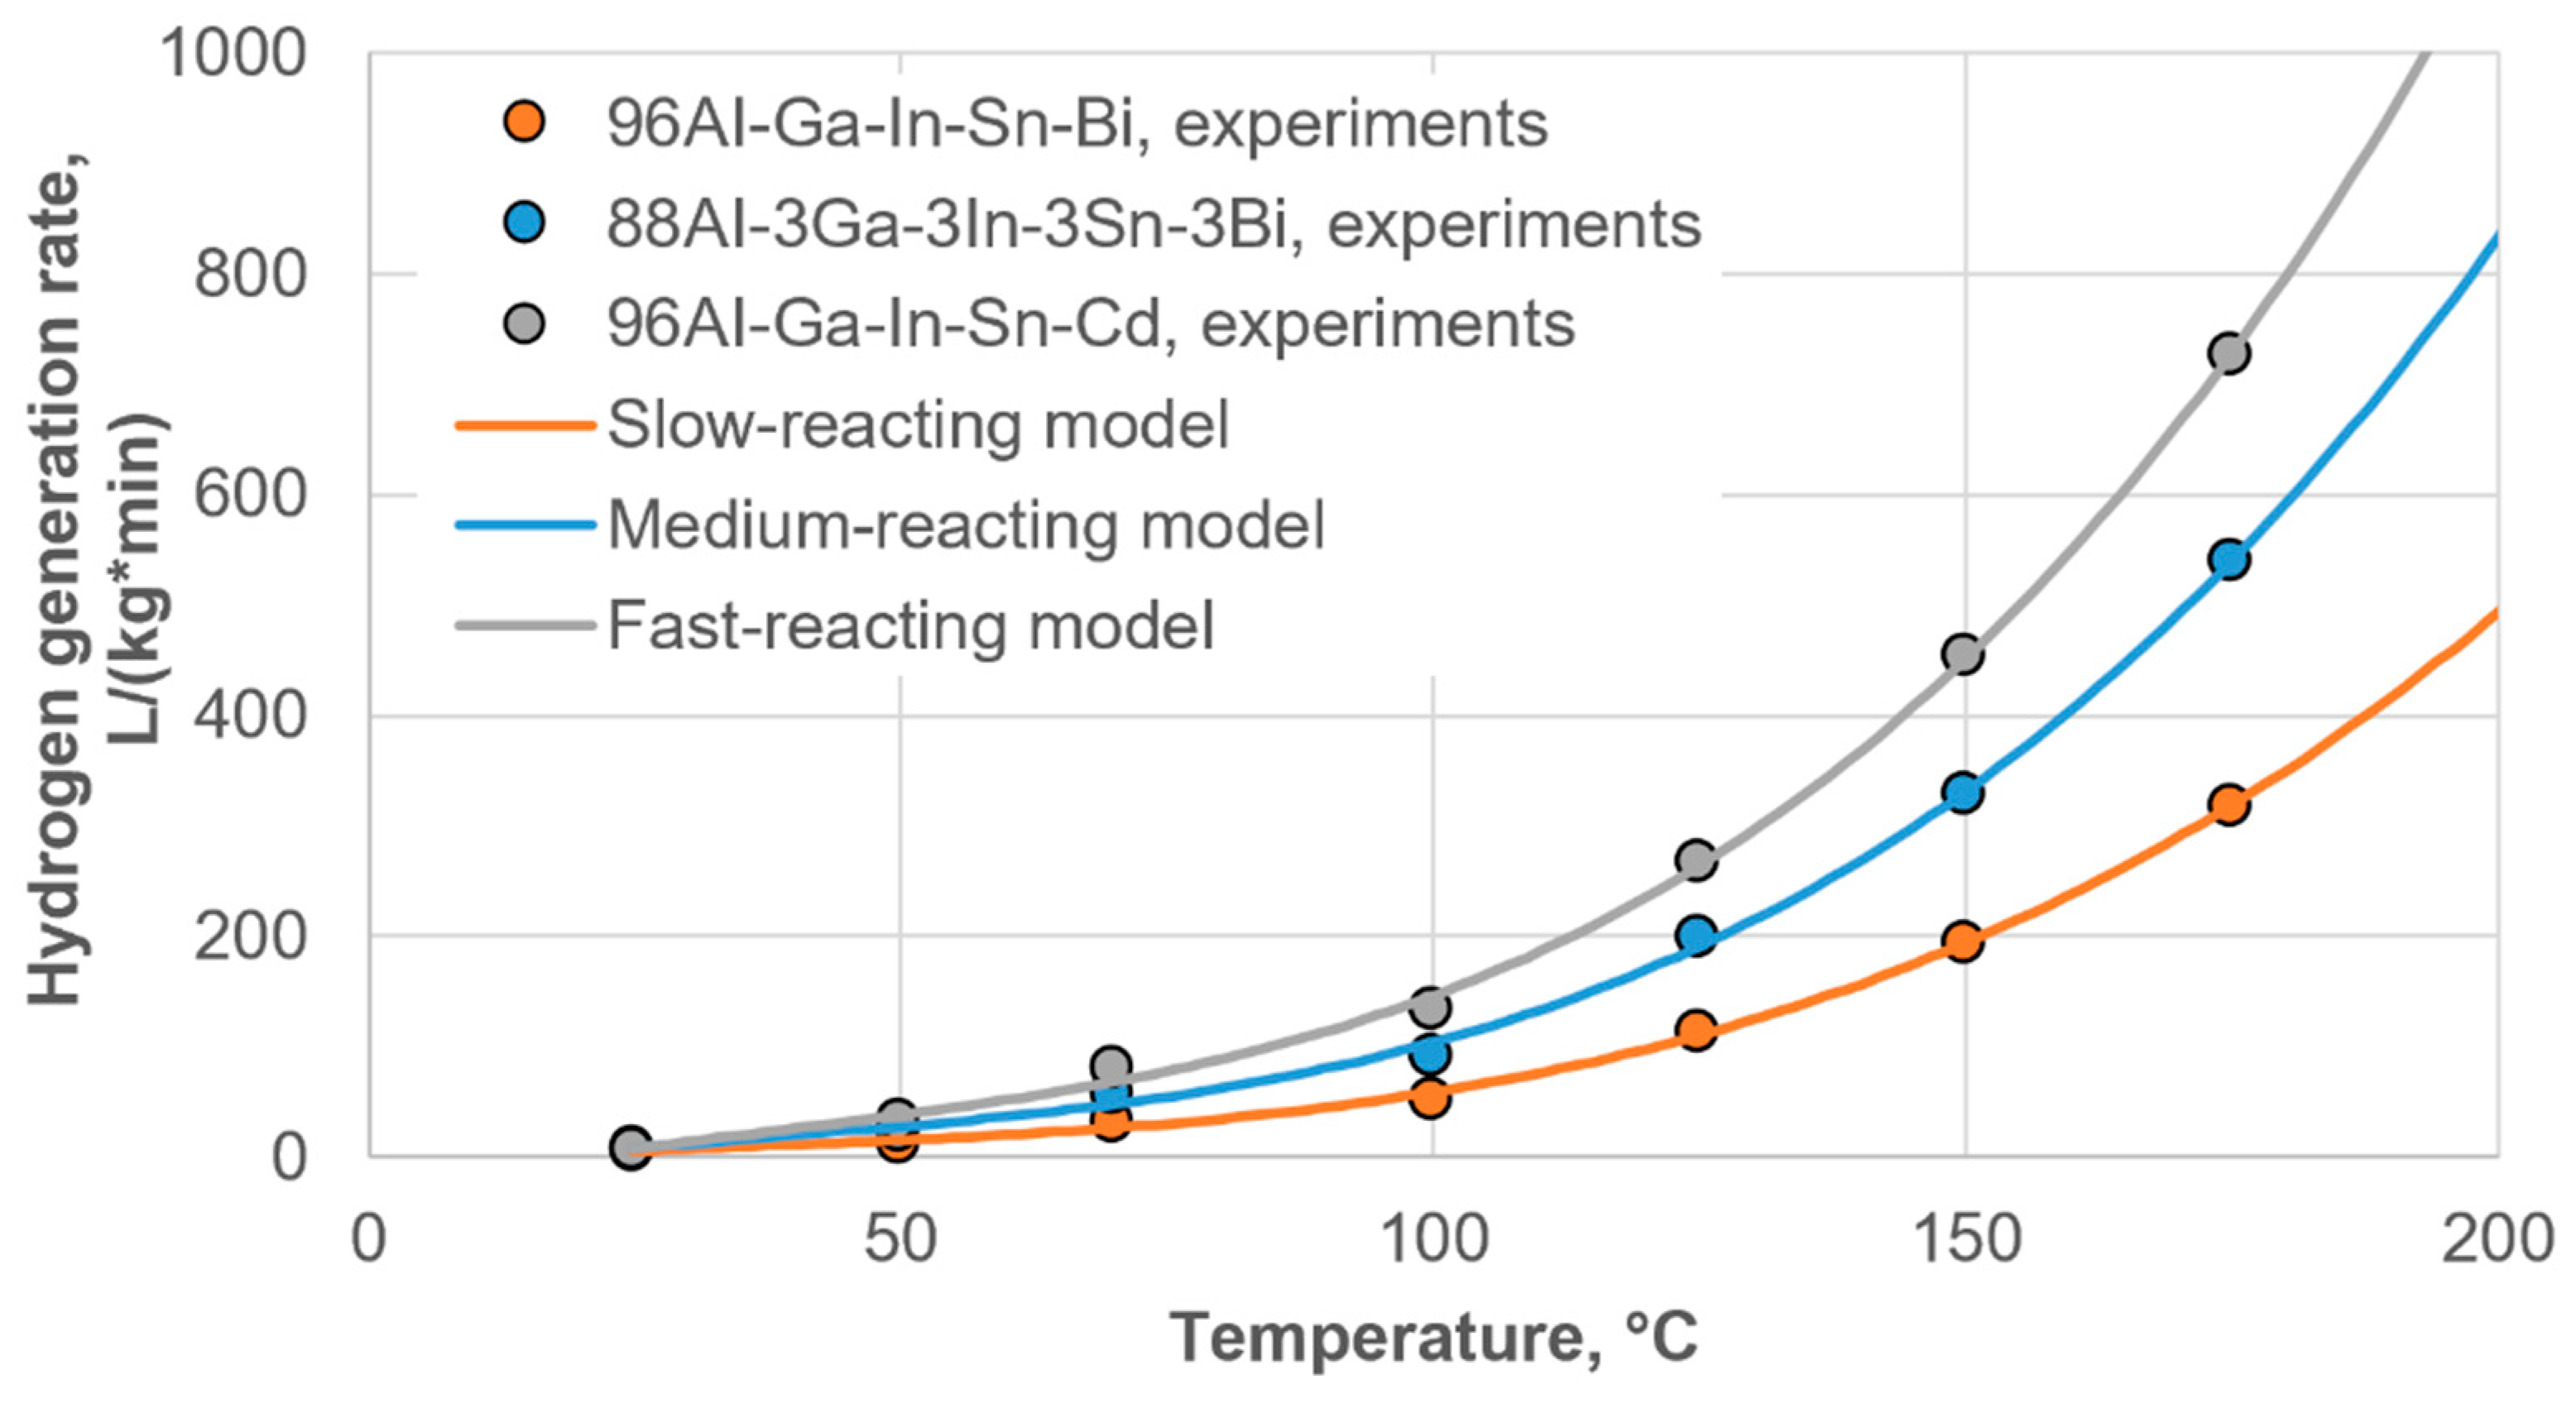
Three reagents based on activated aluminum alloys with different reaction rates were selected (see Figure 3): alloy 96Al-Ga-In-Sn-Bi as the slow-reacting reagent, alloy 88Al-3Ga-3In-3Sn-3Bi as the medium-reacting reagent, and alloy 96Al-Ga-In-Sn-Cd as the fast-reacting reagent. Using the experimental data of Sarmurzina et al. (2026) [11], the corresponding regression models of the dependence of on the temperature of the reacting medium were constructed (see Figure 3). The experimental data cover approximately 24–174 °C, and the temperatures reached in all simulations reported here remained within this range. The base-case dependence was taken for the medium-reacting reagent (alloy 88Al-3Ga-3In-3Sn-3Bi).
Figure 3.
Regression models for the temperature dependence of the hydrogen evolution rate, .
A total of three characteristic reservoir types were selected: a base-case reservoir (as the normal reference reservoir), a low-permeability reservoir (weak pressure relief, small treatment radius), and a high-permeability reservoir (the opposite limit: good flow connectivity). The parameters of these types are given in Table A2 (Appendix A). All three reservoir types are assumed to be sandstone formations.
The initial level of NWZ damage of the reservoir was specified through the initial skin factor of the production well. The following well skin-factor values were considered: 1, 3, 5, 7, 9, and 11—corresponding to wells from a moderate to a severe level of NWZ damage. From these values, Equations (51) and (48) were used to calculate the initial distribution of the deposited-wax volume in the NWZ.
During the simulation, the updated skin factor (as the NWZ porosity changes) was calculated using Equation (49).
The parameters of the wax components are given in Table A1 (Appendix A). Below, the main parameters used are indicated for each type of simulation. The remaining parameters, whose values are constant in all simulations, are given in Table A3 (Appendix A).
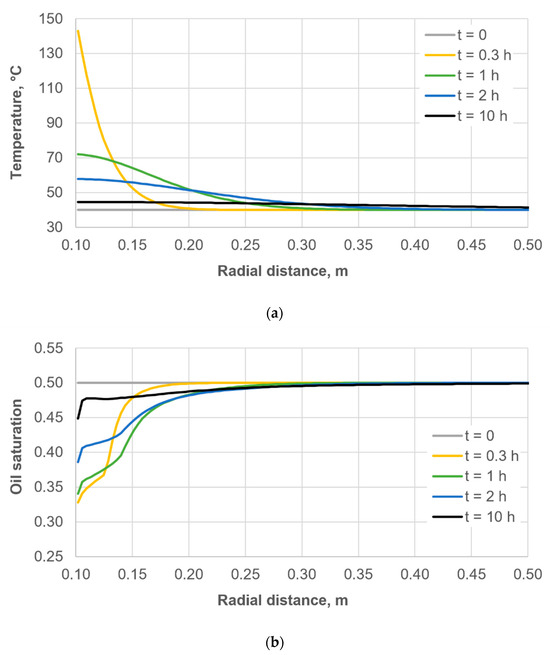
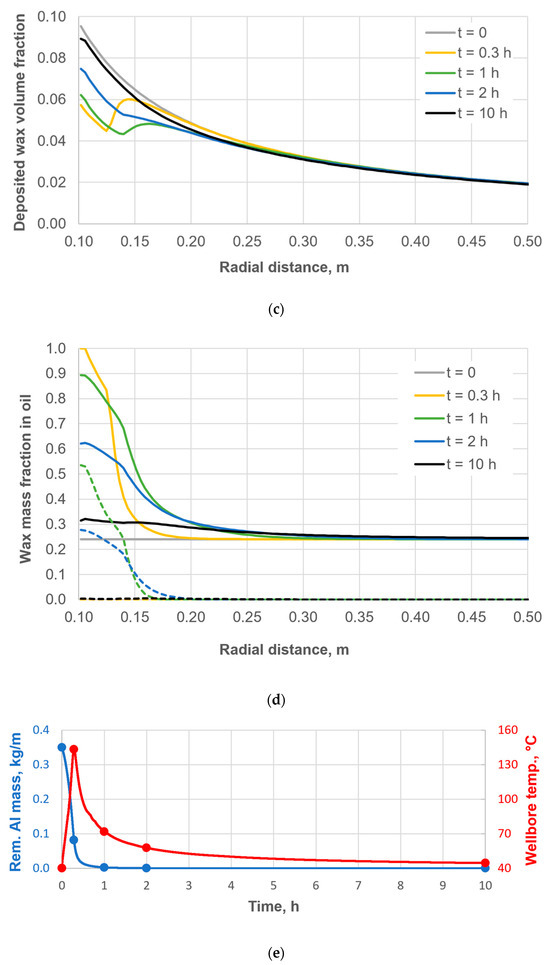
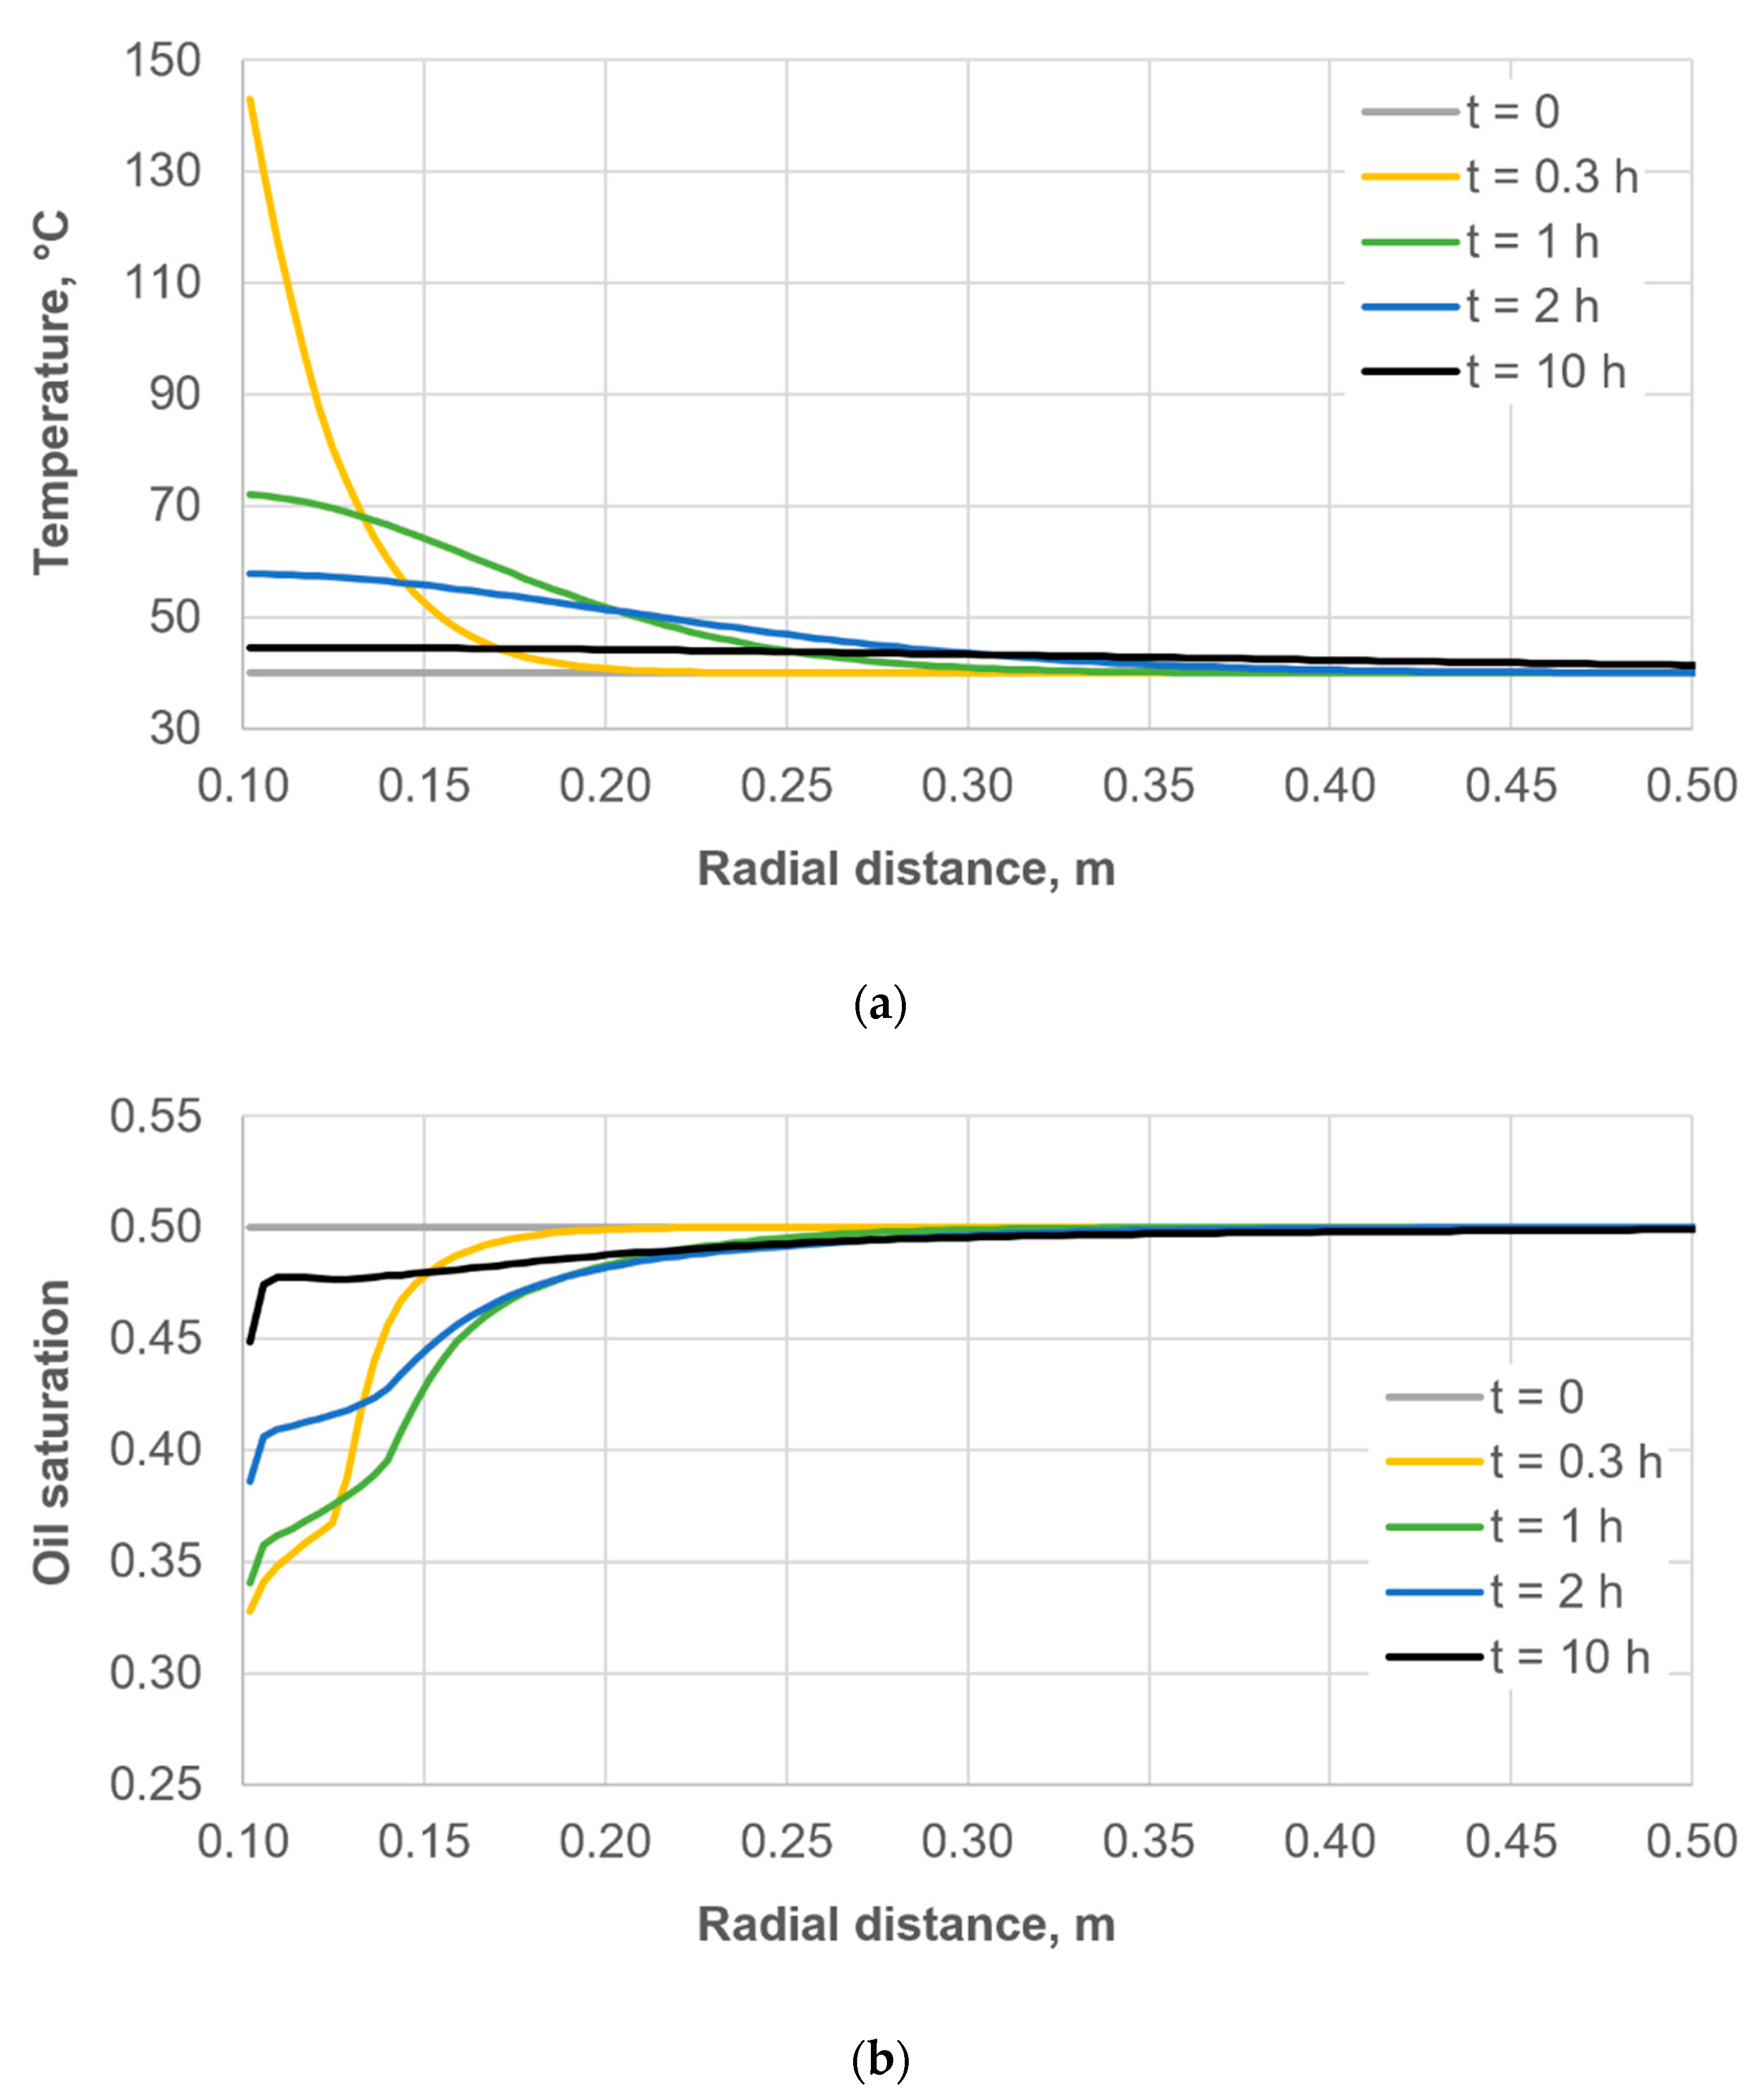
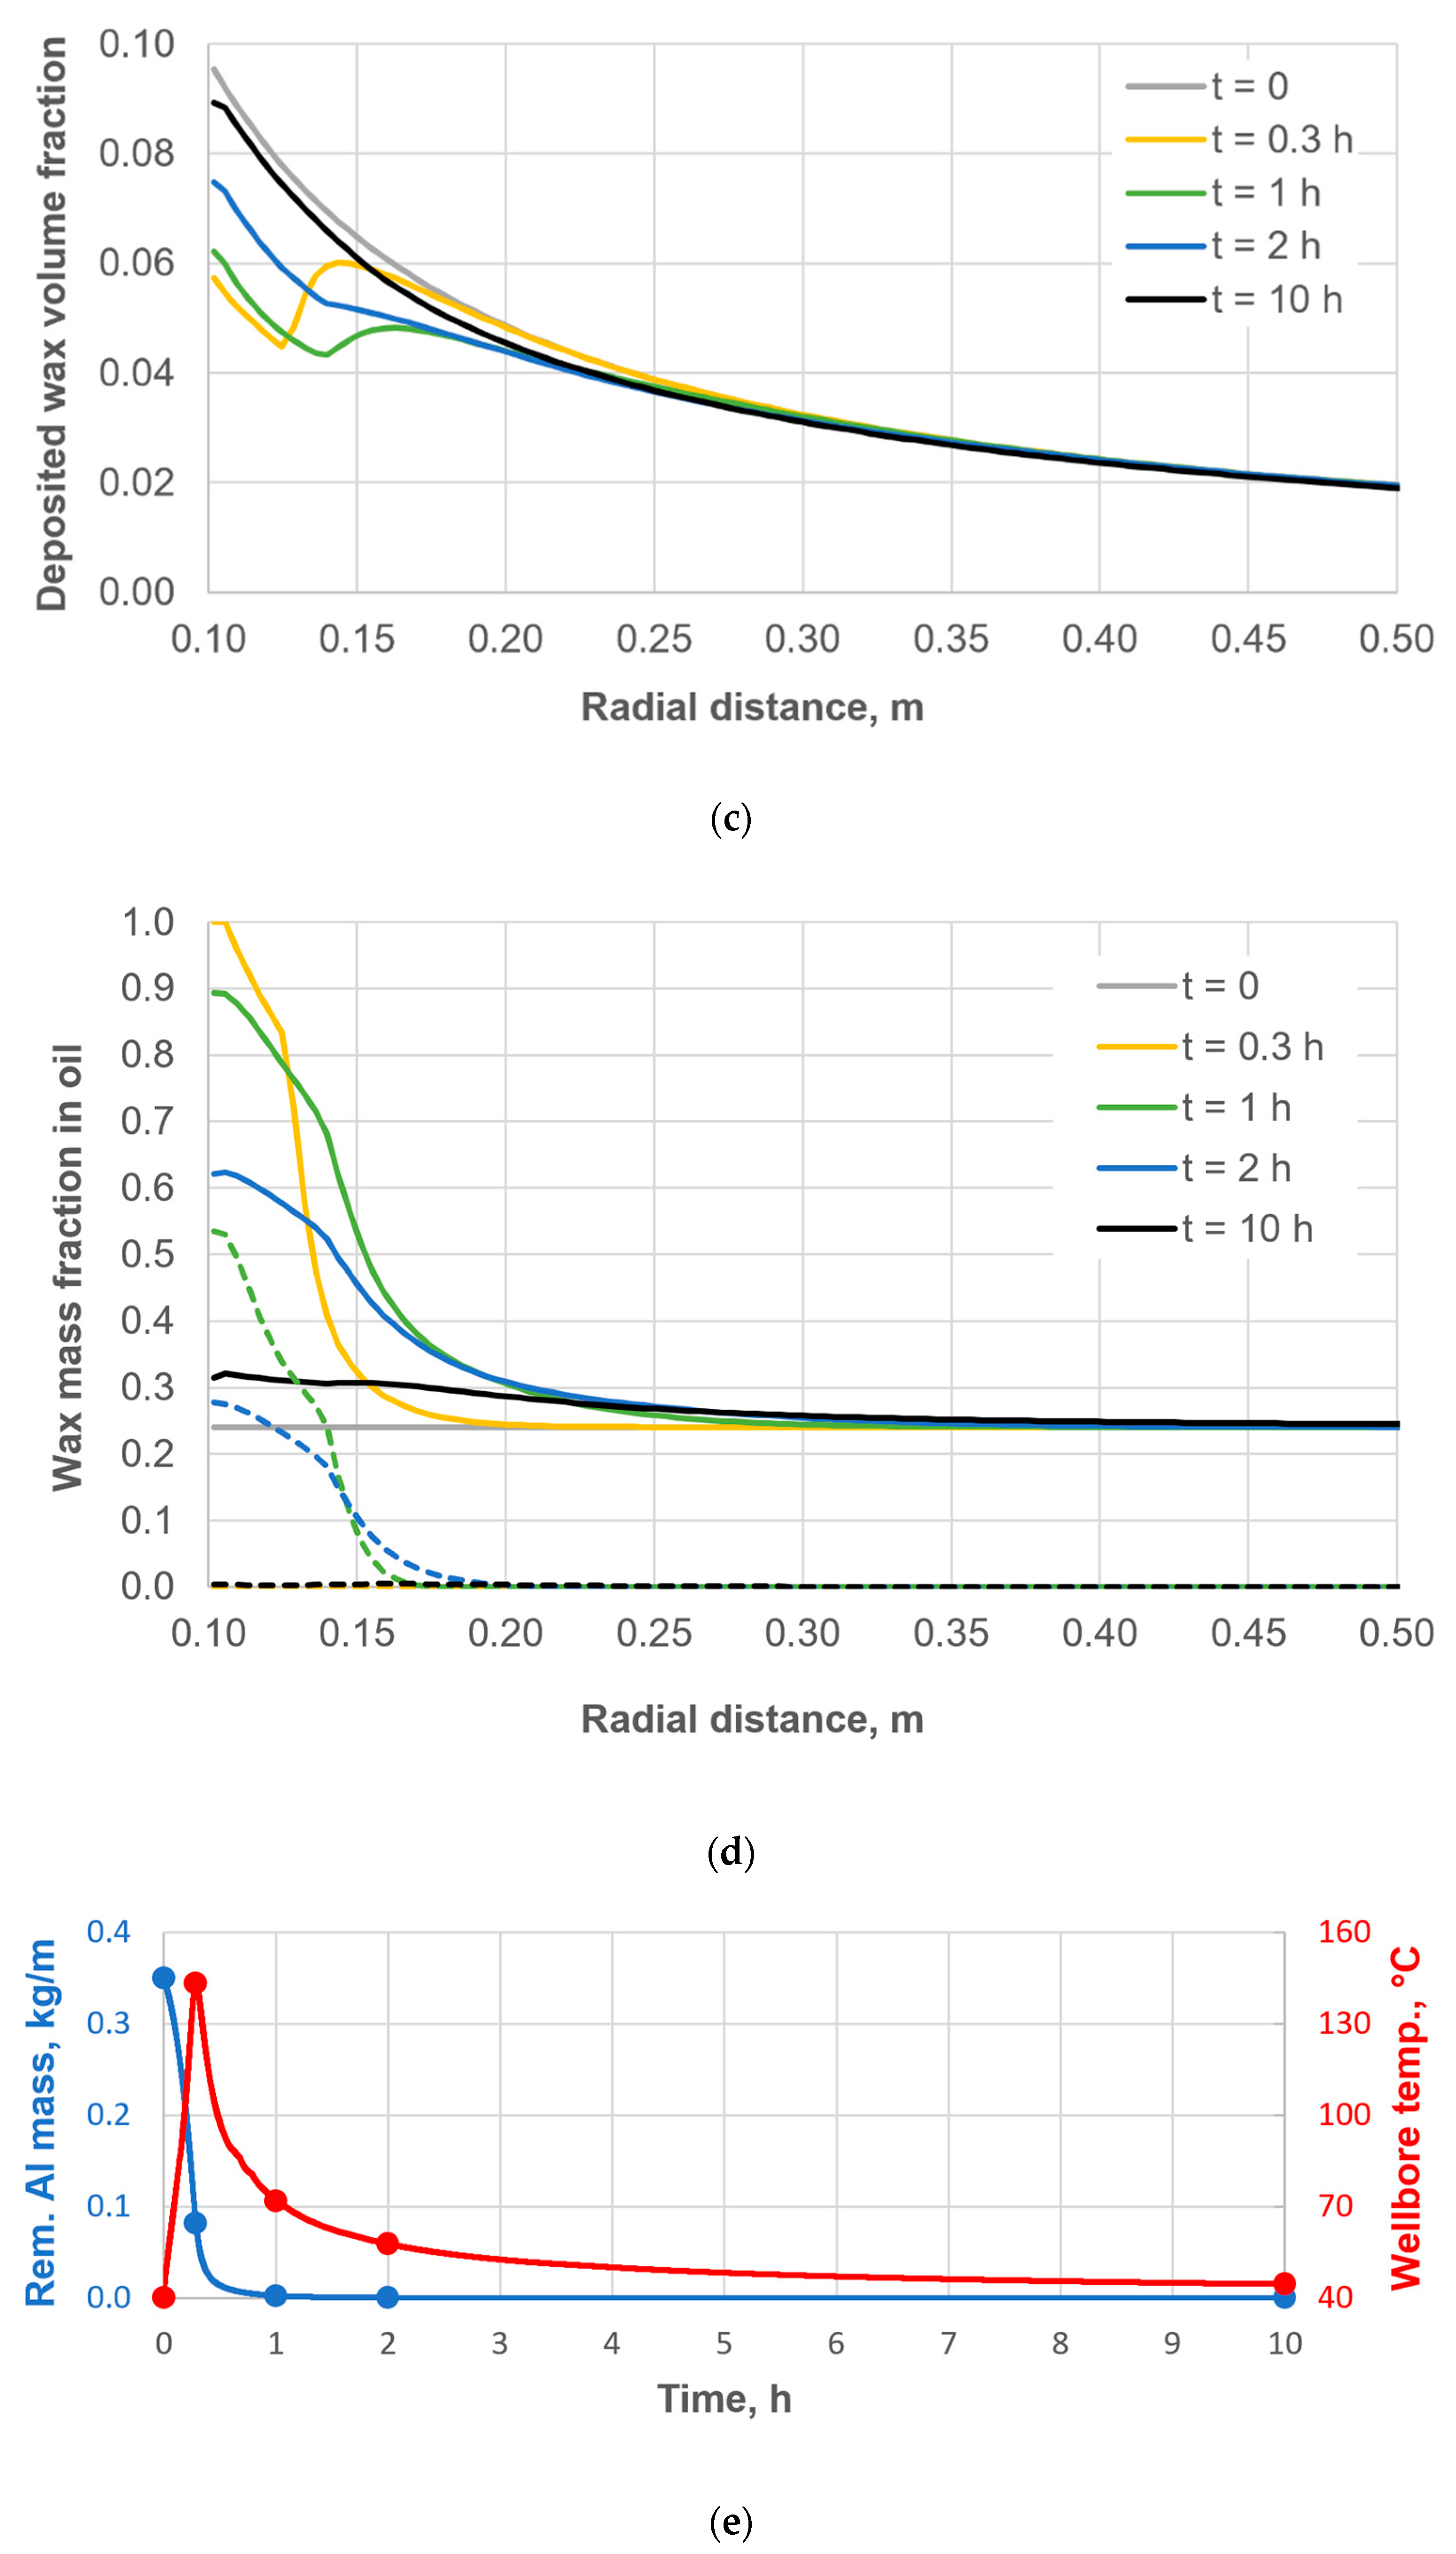
Figure 4 shows the evolution of the NWZ state in the radial direction at different time slices for the following parameters: the base-case reservoir, the medium-reacting reagent, , and . The time slices (Figure 4e) were selected so as to capture the peak-temperature moment (t = 0.3 h), the end of the chemical reaction (1 h), the period of active wax deposition (2 h), and a nearly steady state of the NWZ (10 h).
Figure 4.
Evolution of the NWZ state in the radial direction at different time slices for the following parameters: base-case reservoir, the medium-reacting reagent, , and . (a) Temperature. (b) Oil saturation. (c) Volume fraction of deposited wax in the NWZ. (d) Mass fraction of the total non-deposited wax in oil (solid lines) and mass fraction of suspended wax particles in oil (dashed lines). (e) Selected time slices (t = 0.3, 1, 2, 10 h) relative to the change in the reagent mass and the wellbore temperature.
As seen in Figure 4a, after the peak temperature is reached (during the chemical reaction), the heated region expands radially: the temperature decreases near the well while increasing farther into the NWZ.
As seen in Figure 4b, during the chemical reaction, water from the wellbore penetrates deep into the NWZ, lowering the oil saturation, which subsequently reduces the fraction of deposited wax that is in contact with oil and, consequently, able to dissolve in it. After the chemical reaction rate declines (after t = 1 h), the hydrogen generation rate decreases, and the oil saturation near the well begins to recover.
As seen in Figure 4c,d, during the active phase of the chemical reaction (t = 0.3 h) the deposited wax dissolves near the well. After the reaction activity declines (t = 1 h), the dissolution of deposited wax shifts deeper into the NWZ, while near the well crystallized suspended wax particles appear in the oil phase and then (t = 2 h and later) begin to actively deposit onto the pore surface. After a prolonged well shut-in (t = 10 h) and the flattening of the temperature profile, the wax fraction in the oil phase decreases, tending toward the equilibrium state that existed at the initial moment (t = 0).
Thus, as seen in Figure 4c, the distribution of deposited wax changes both during the active phase of the chemical reaction and after it. Accordingly, the well skin factor changes as well.
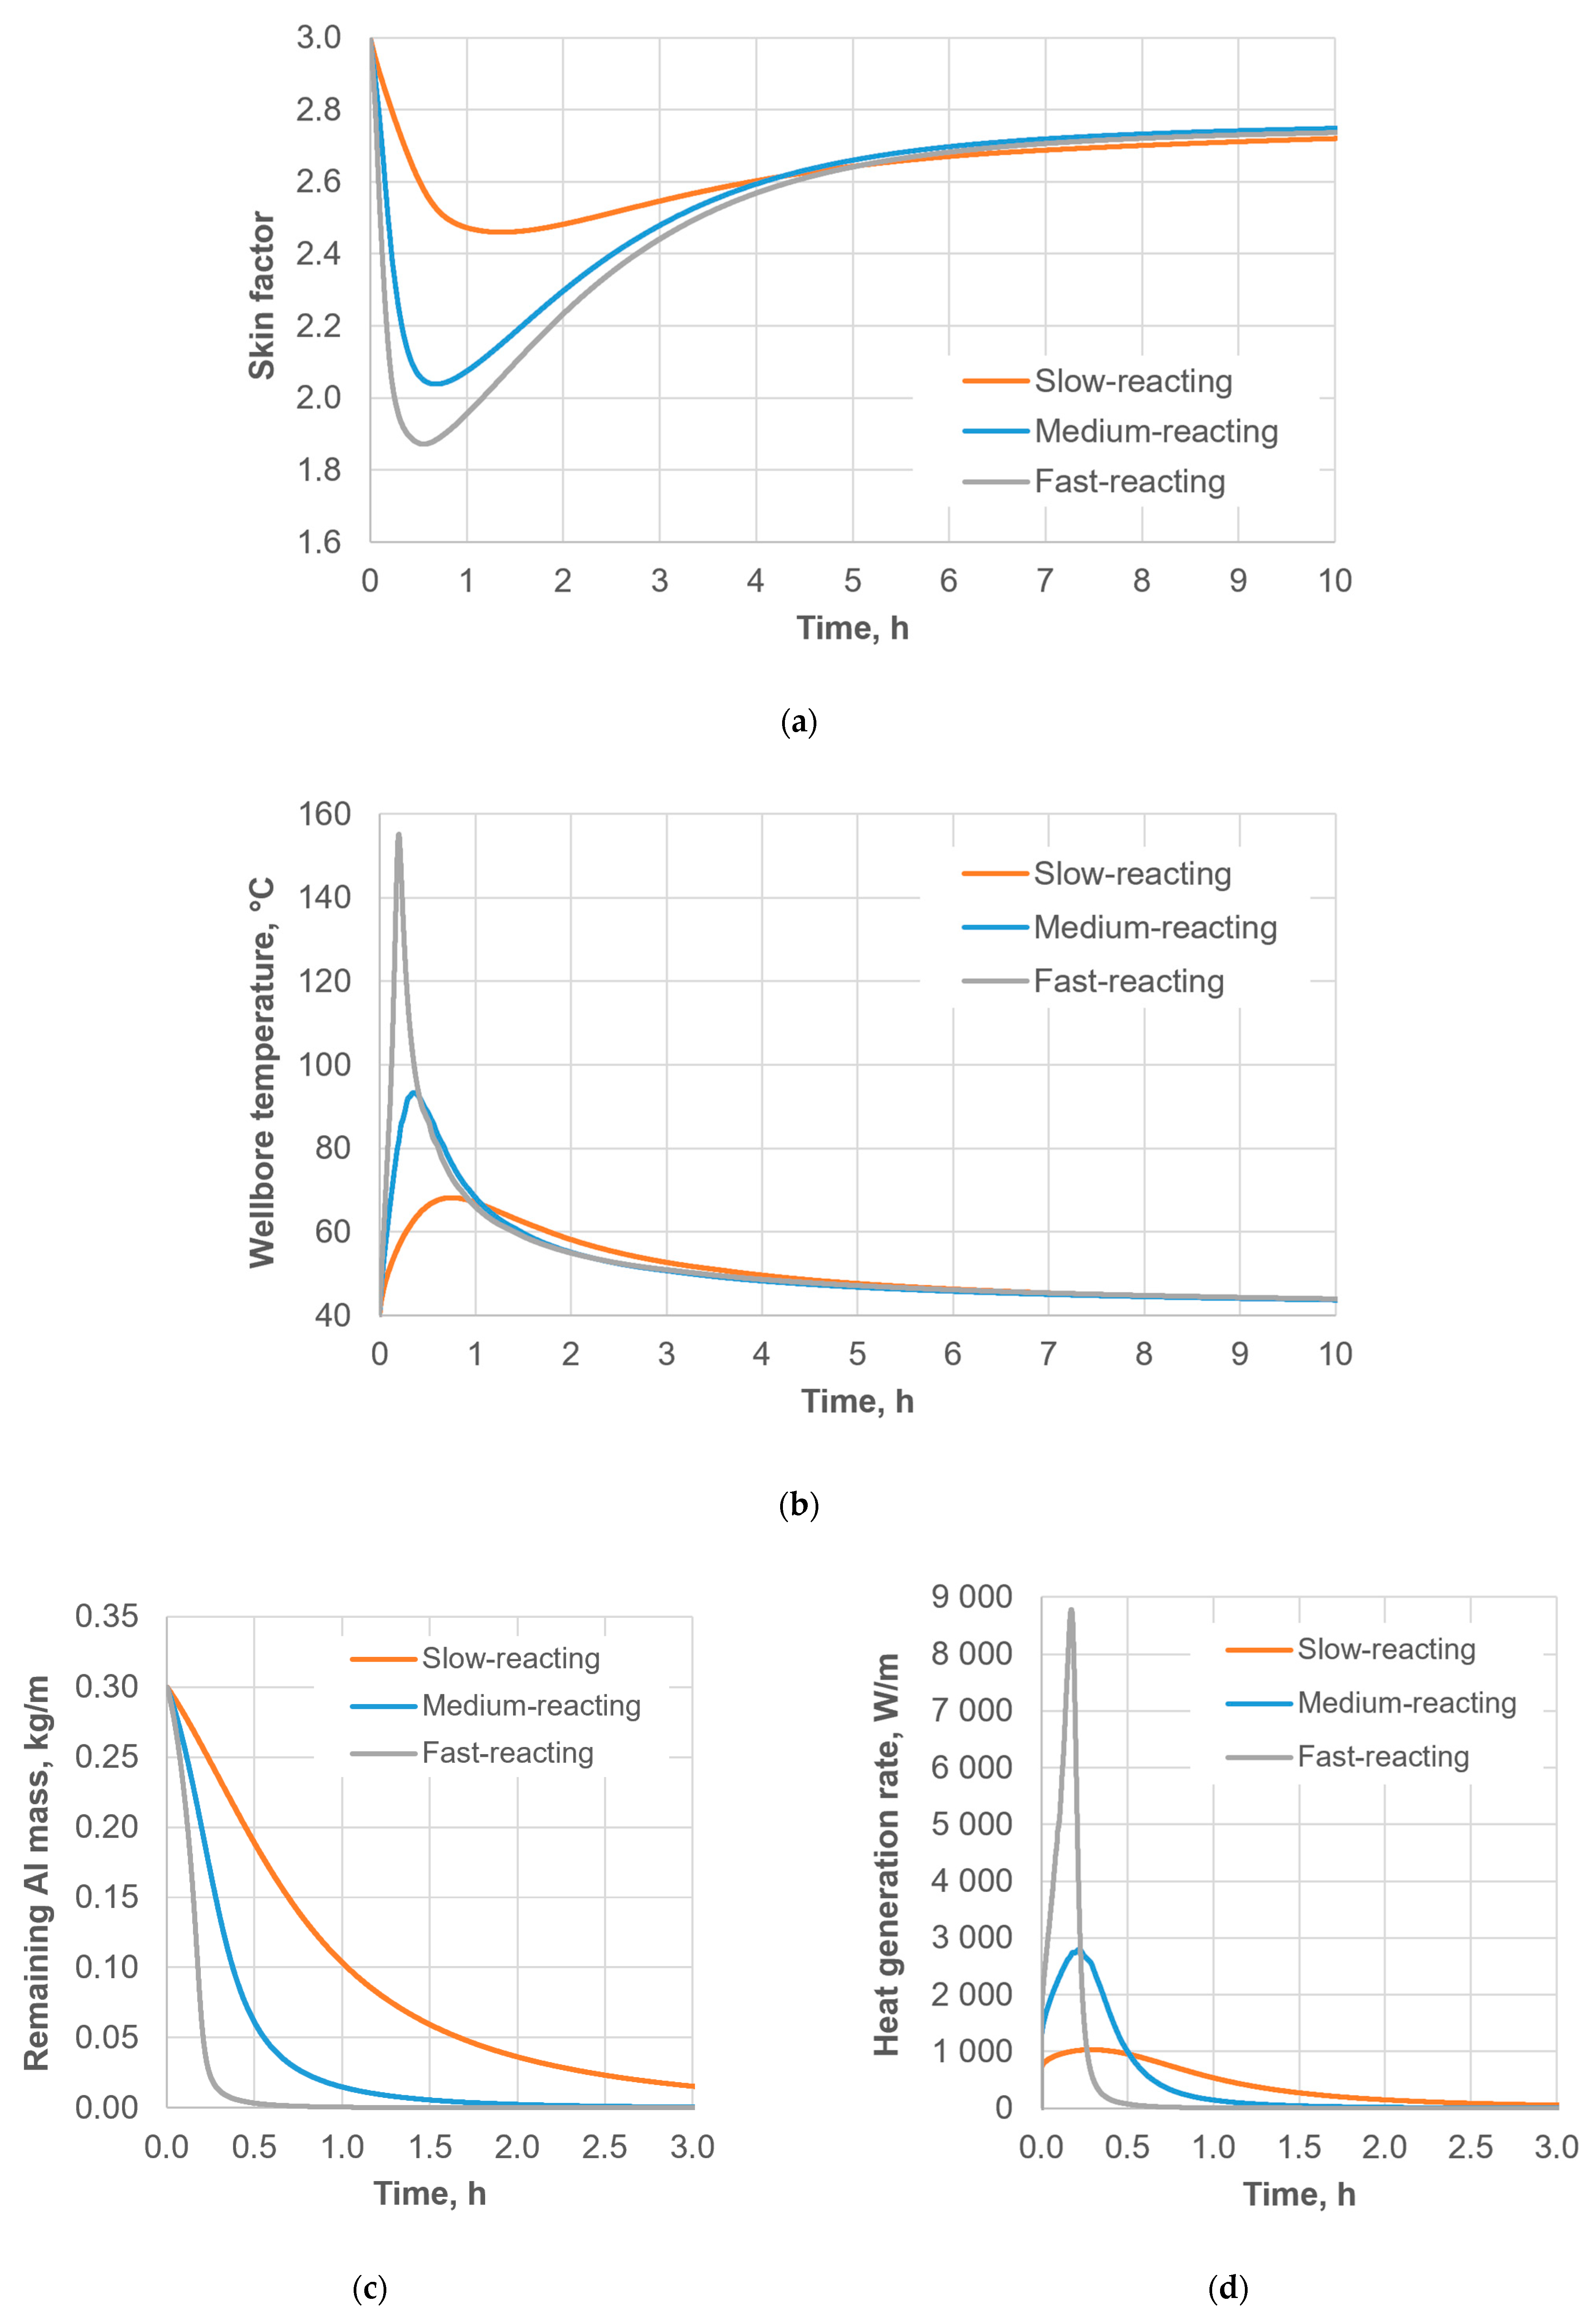
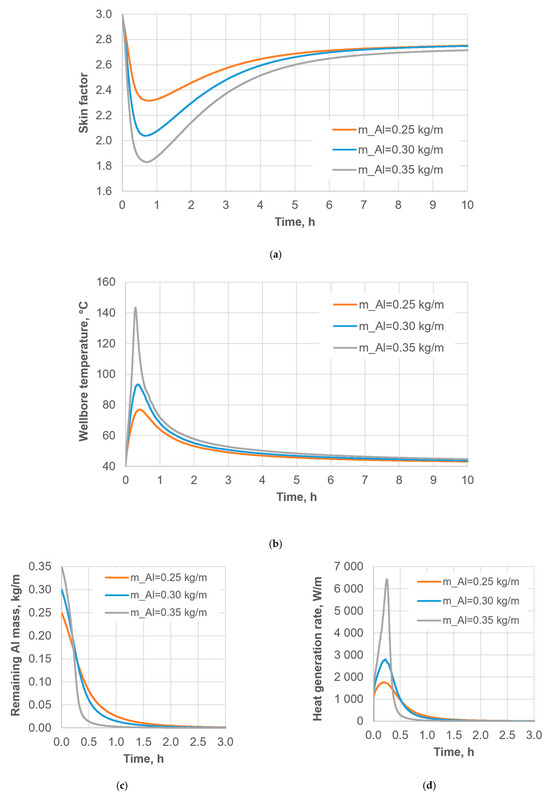
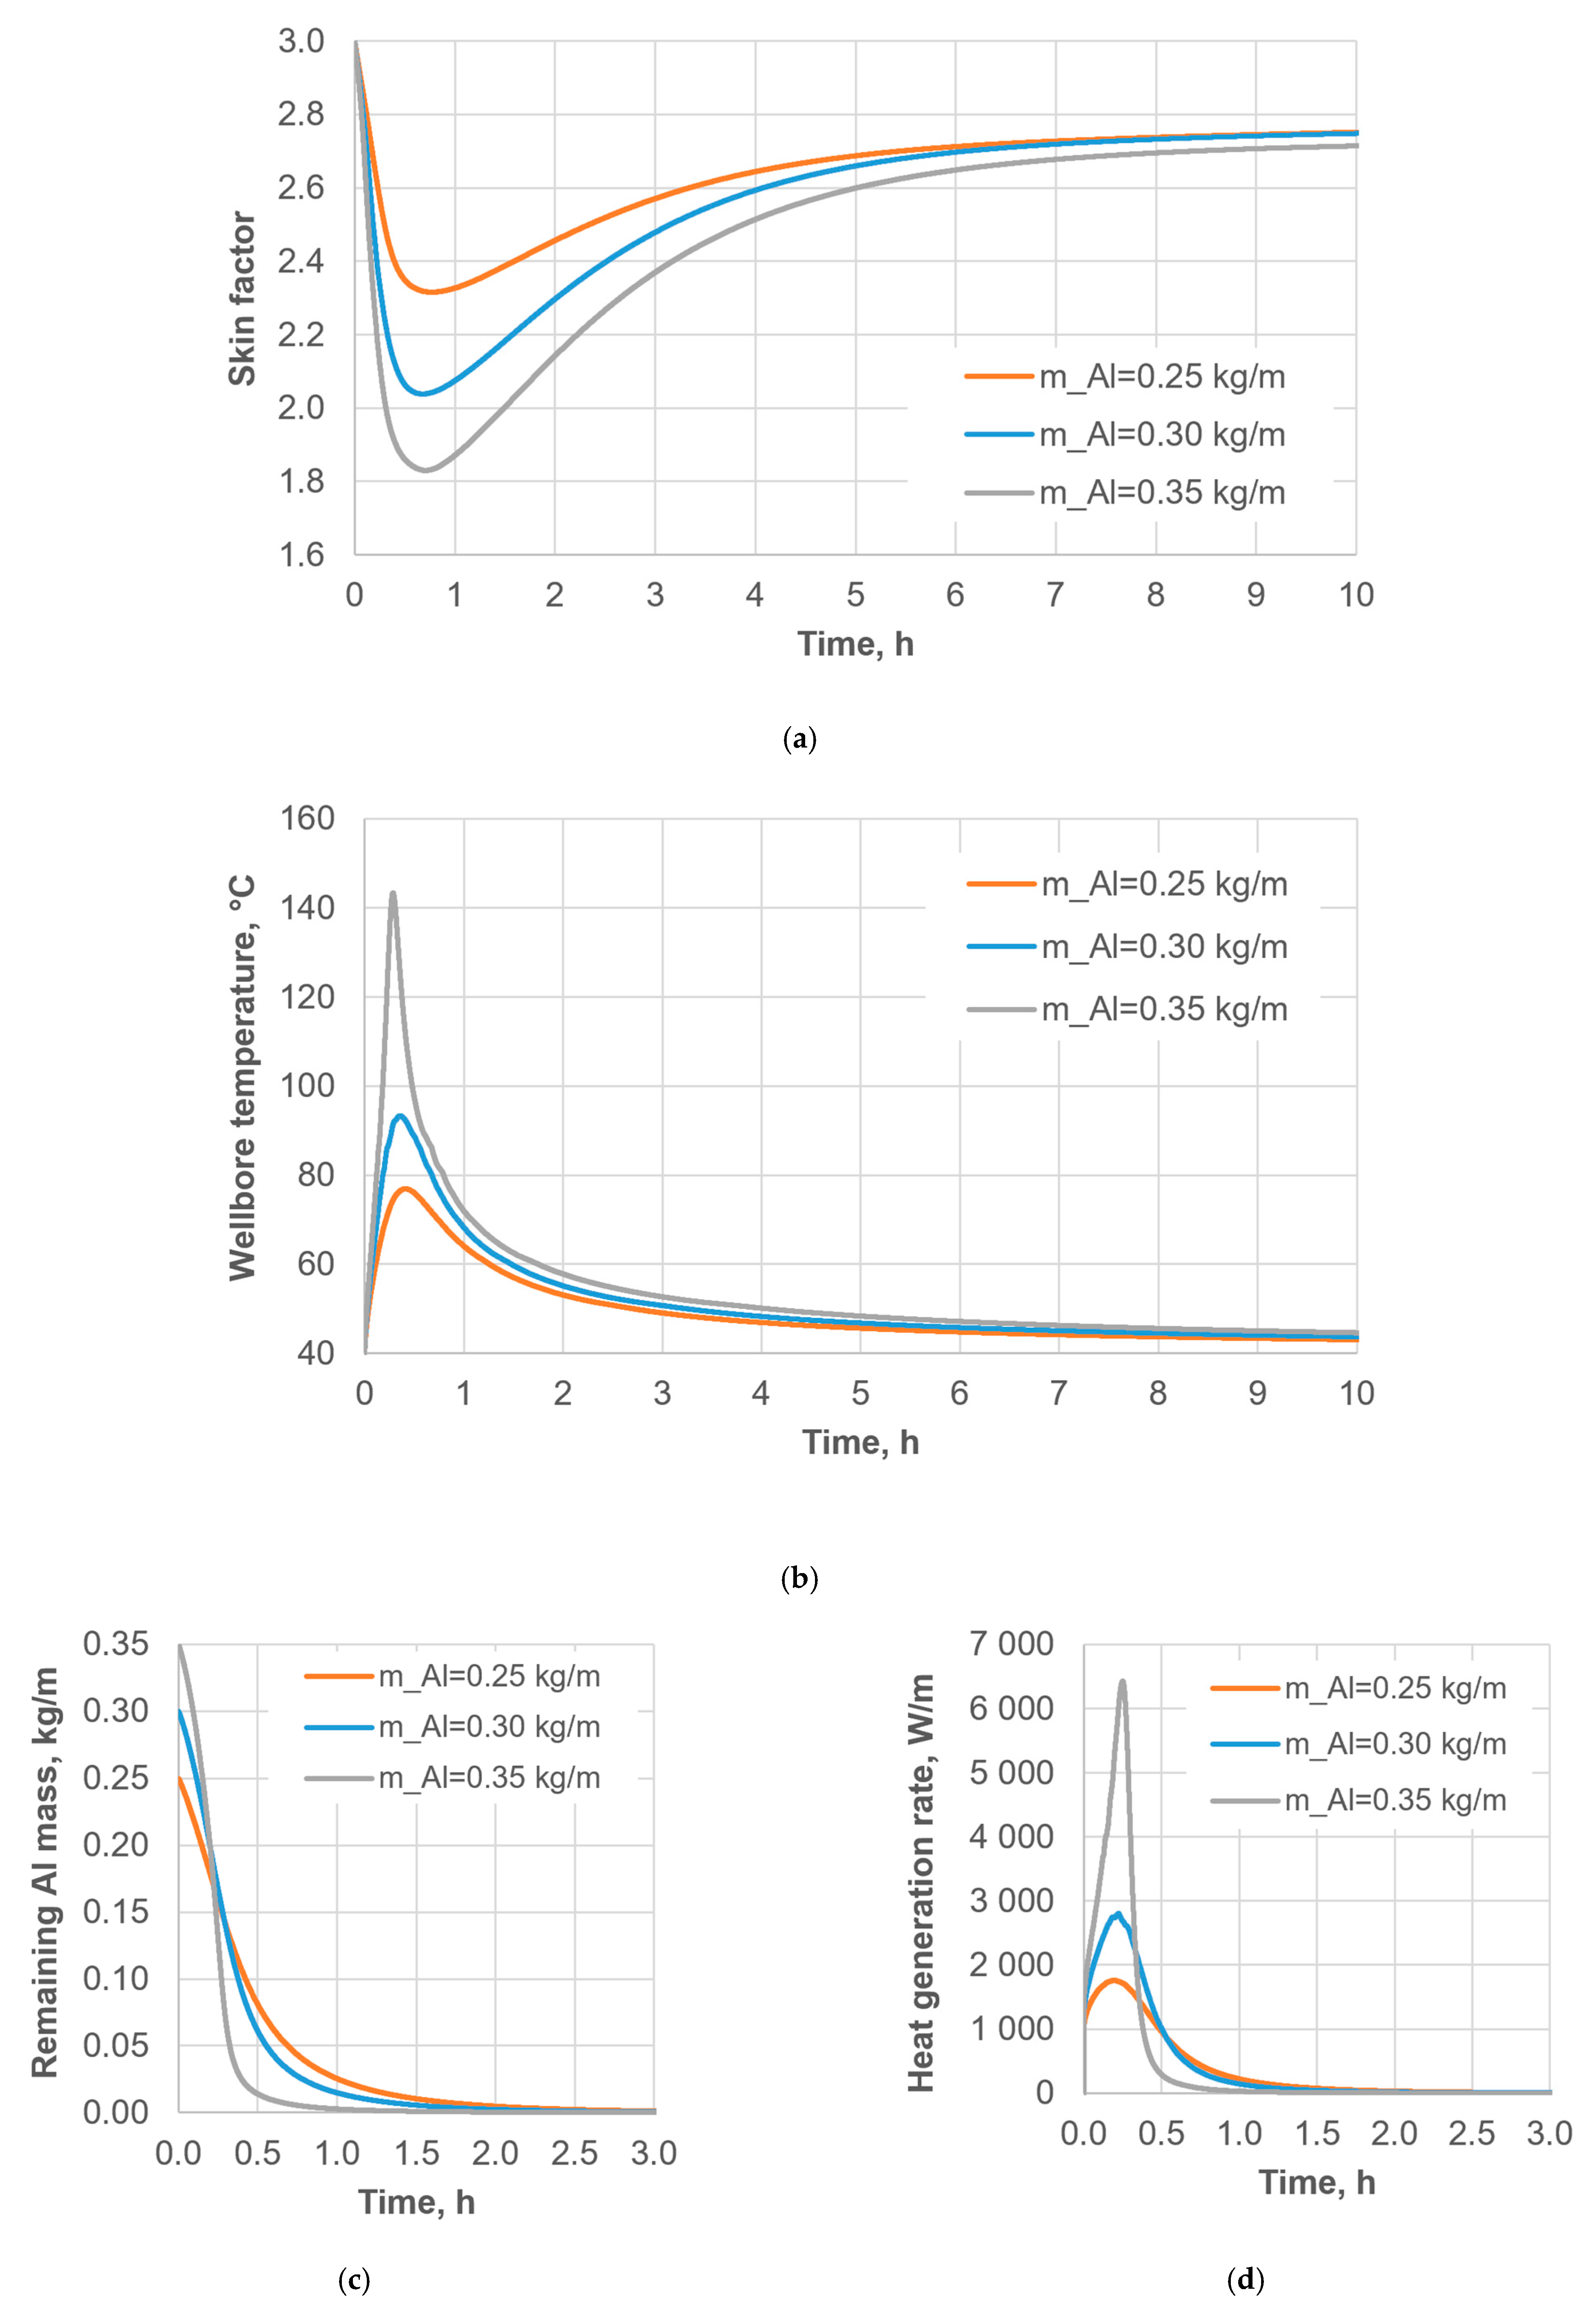
Figure 5 shows the time evolution of the skin factor, the wellbore temperature, the remaining aluminum mass, and the heat release rate for reagents with different reaction rates and the following common parameters: the base-case reservoir, , and . As seen in Figure 5a, the fast-reacting reagent achieves a noticeably larger reduction in the skin factor right after the end of the chemical reaction; however, after 4 h of well shut-in, the resulting skin factors become almost identical for all reagents. The peak wellbore temperature (Figure 5b) depends noticeably on the reaction rate. The peak heat generation rate is even more sensitive to the chemical activity of the reagent (Figure 5d).
Figure 5.
Time evolution of the parameters for reagents with different reaction rates and the following common parameters: the base-case reservoir, , and . (a) Skin factor. (b) Wellbore temperature. (c) Remaining aluminum mass. (d) Heat release rate.
Figure 6 shows the time evolution of the skin factor, the wellbore temperature, the remaining aluminum mass, and the heat release rate for different initial amounts of reagent () and the following common parameters: the base-case reservoir, , the medium-reacting reagent, and . The behavior of the curves in Figure 6a–c is qualitatively similar to that in Figure 5a–c, indicating that increasing the reagent amount produces an effect similar to that of increasing reagent reactivity. Note also from Figure 6d that an initially larger amount of reagent is consumed faster than an initially smaller amount, which can be explained by the greater heat release and, consequently, the higher temperature in the reaction medium, which enhances the chemical reaction rate (see Figure 3).
Figure 6.
Time evolution of the parameters for different initial amounts of reagent () and the following common parameters: the base-case reservoir, , the medium-reacting reagent, and . (a) Skin factor. (b) Wellbore temperature. (c) Remaining aluminum mass. (d) Heat release rate.
For a given reagent, varying the initial reagent amount does not shift the reaction peak in time (see Figure 6b,d). In contrast, at the same initial reagent amount, increasing the alloy reactivity shifts the reaction peak to earlier times (see Figure 5b,d).
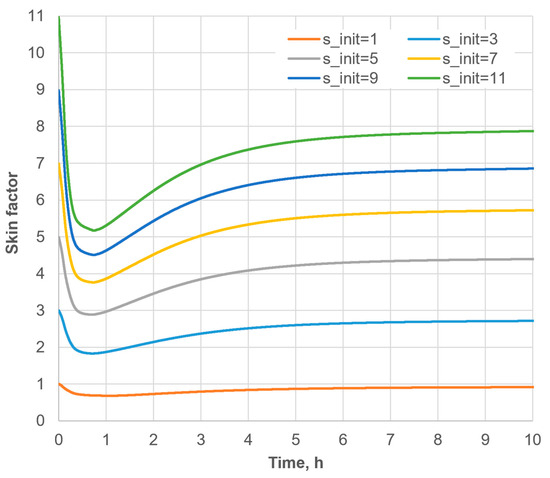
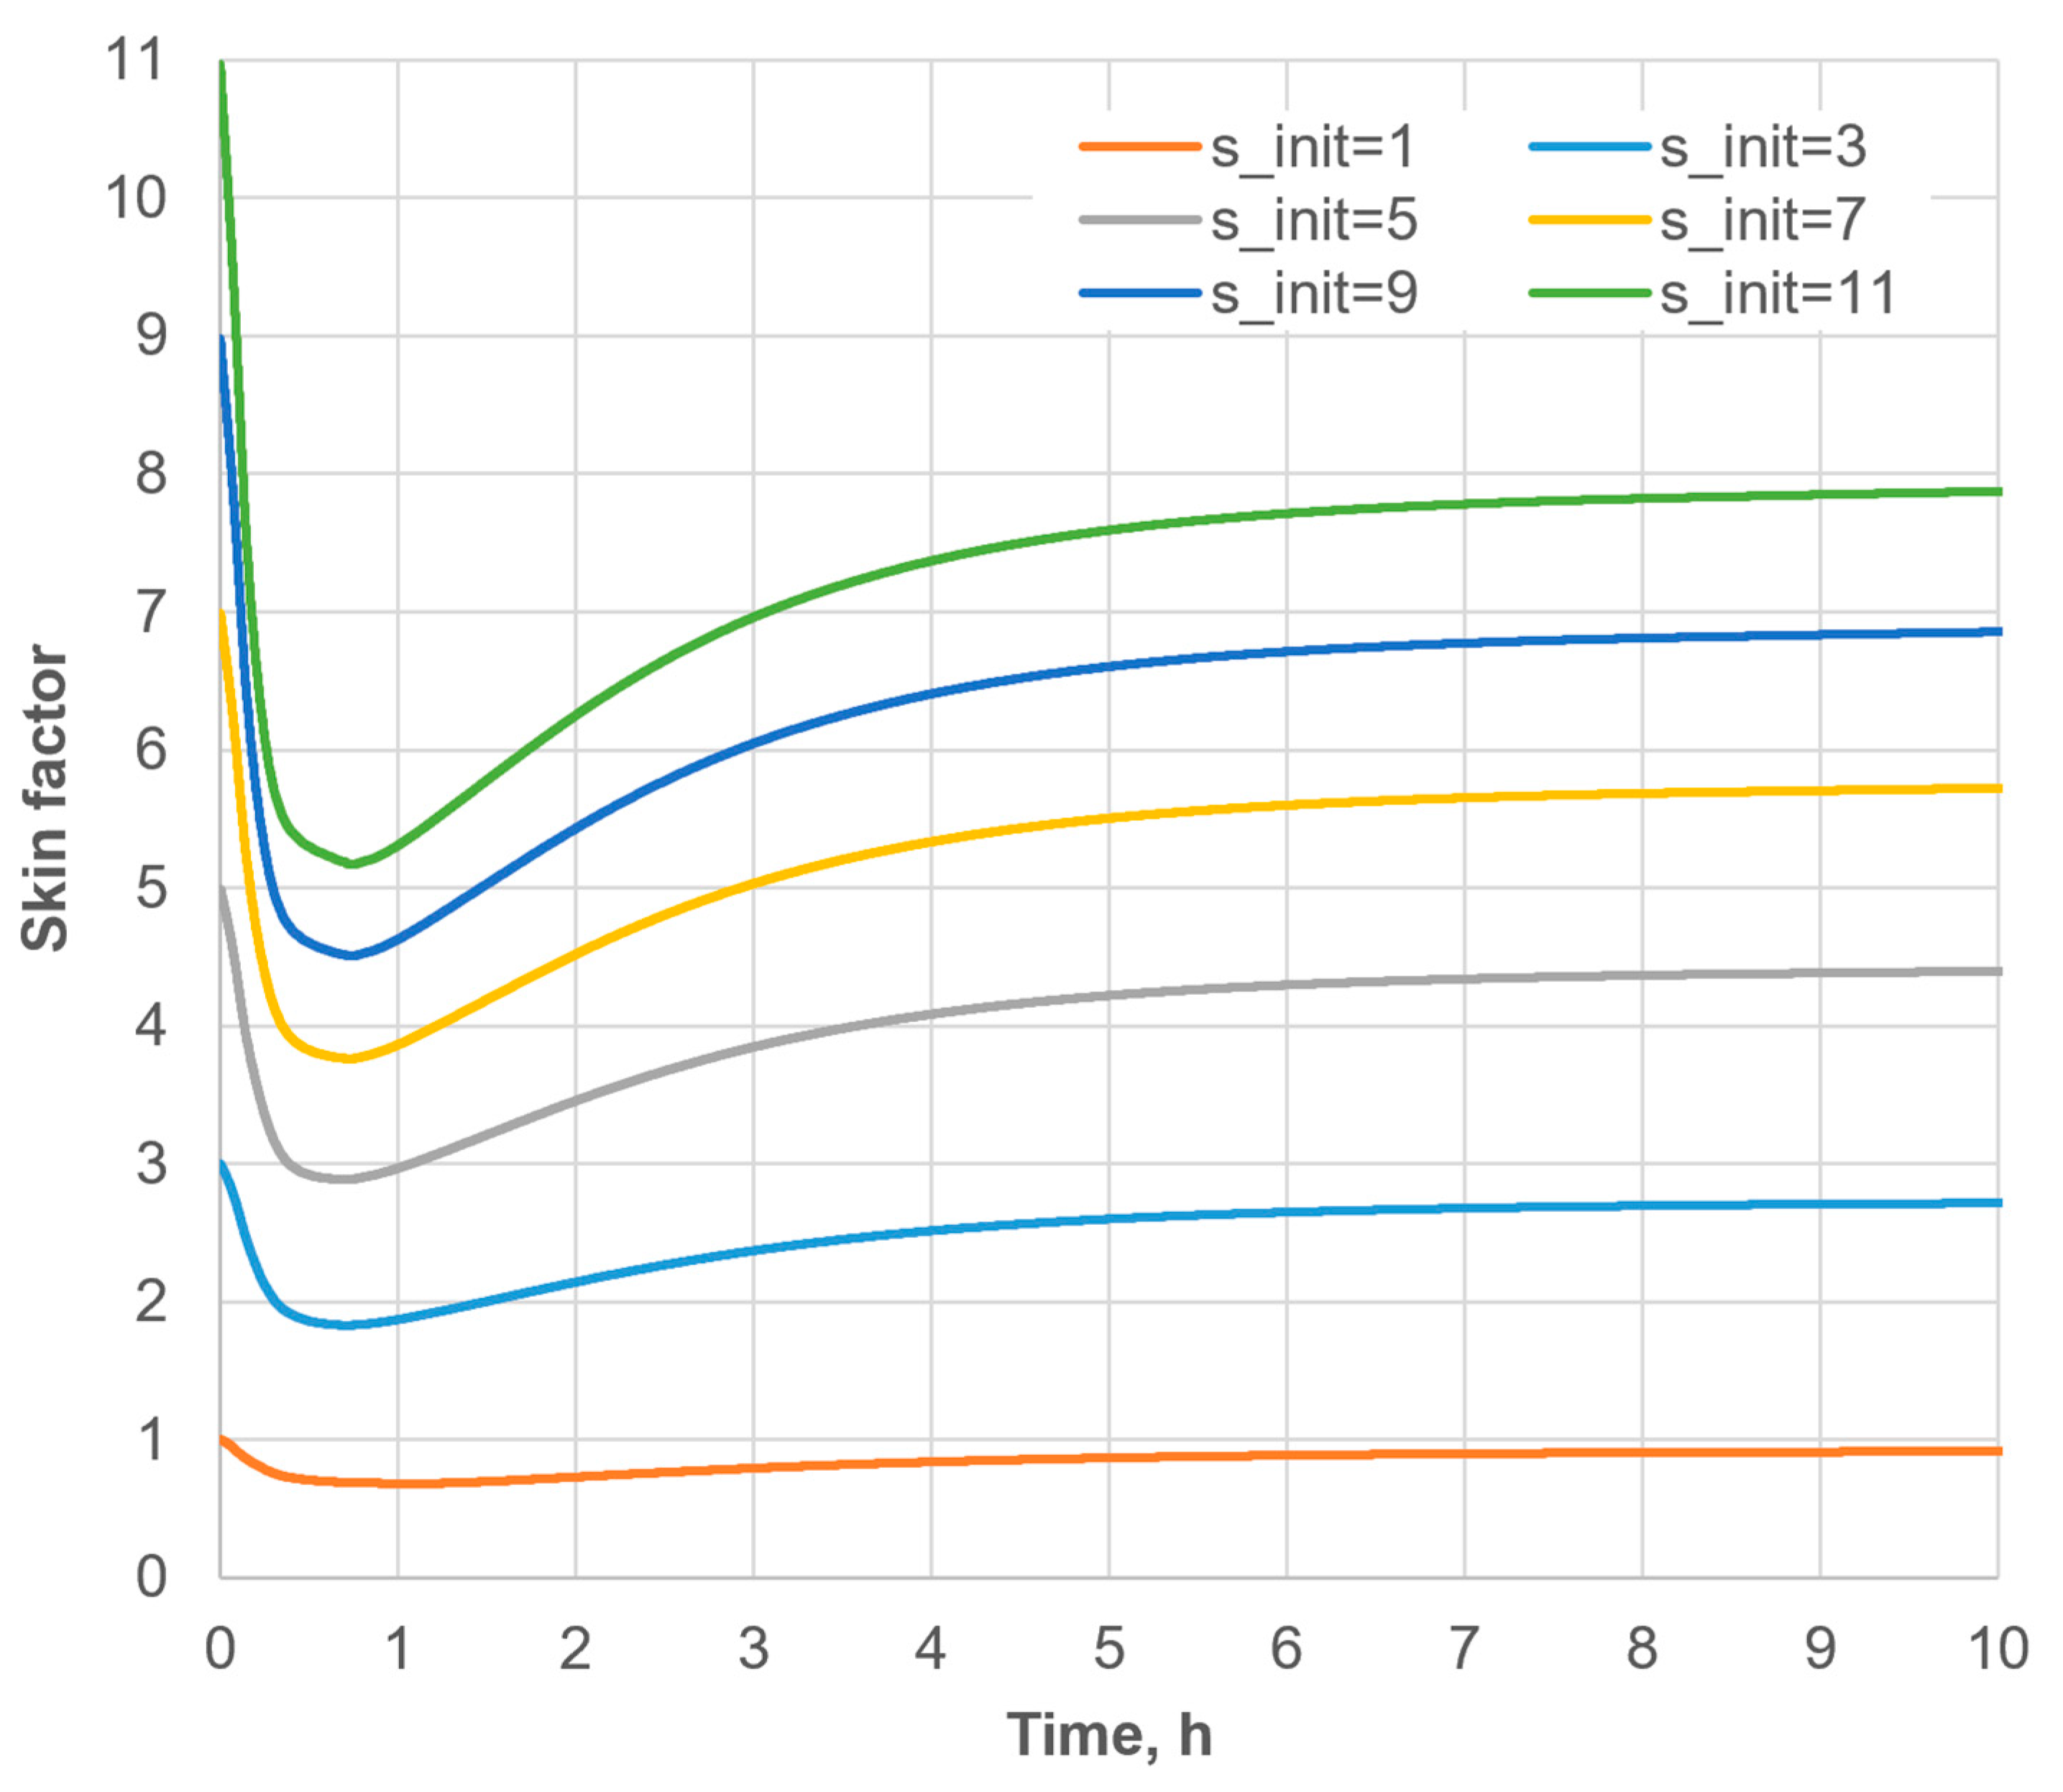
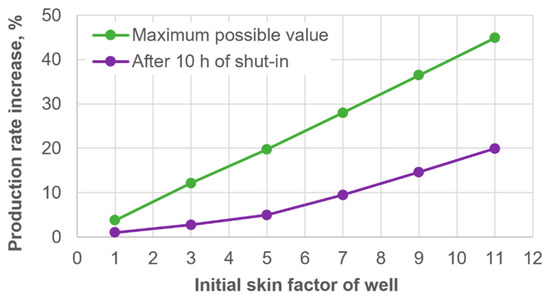
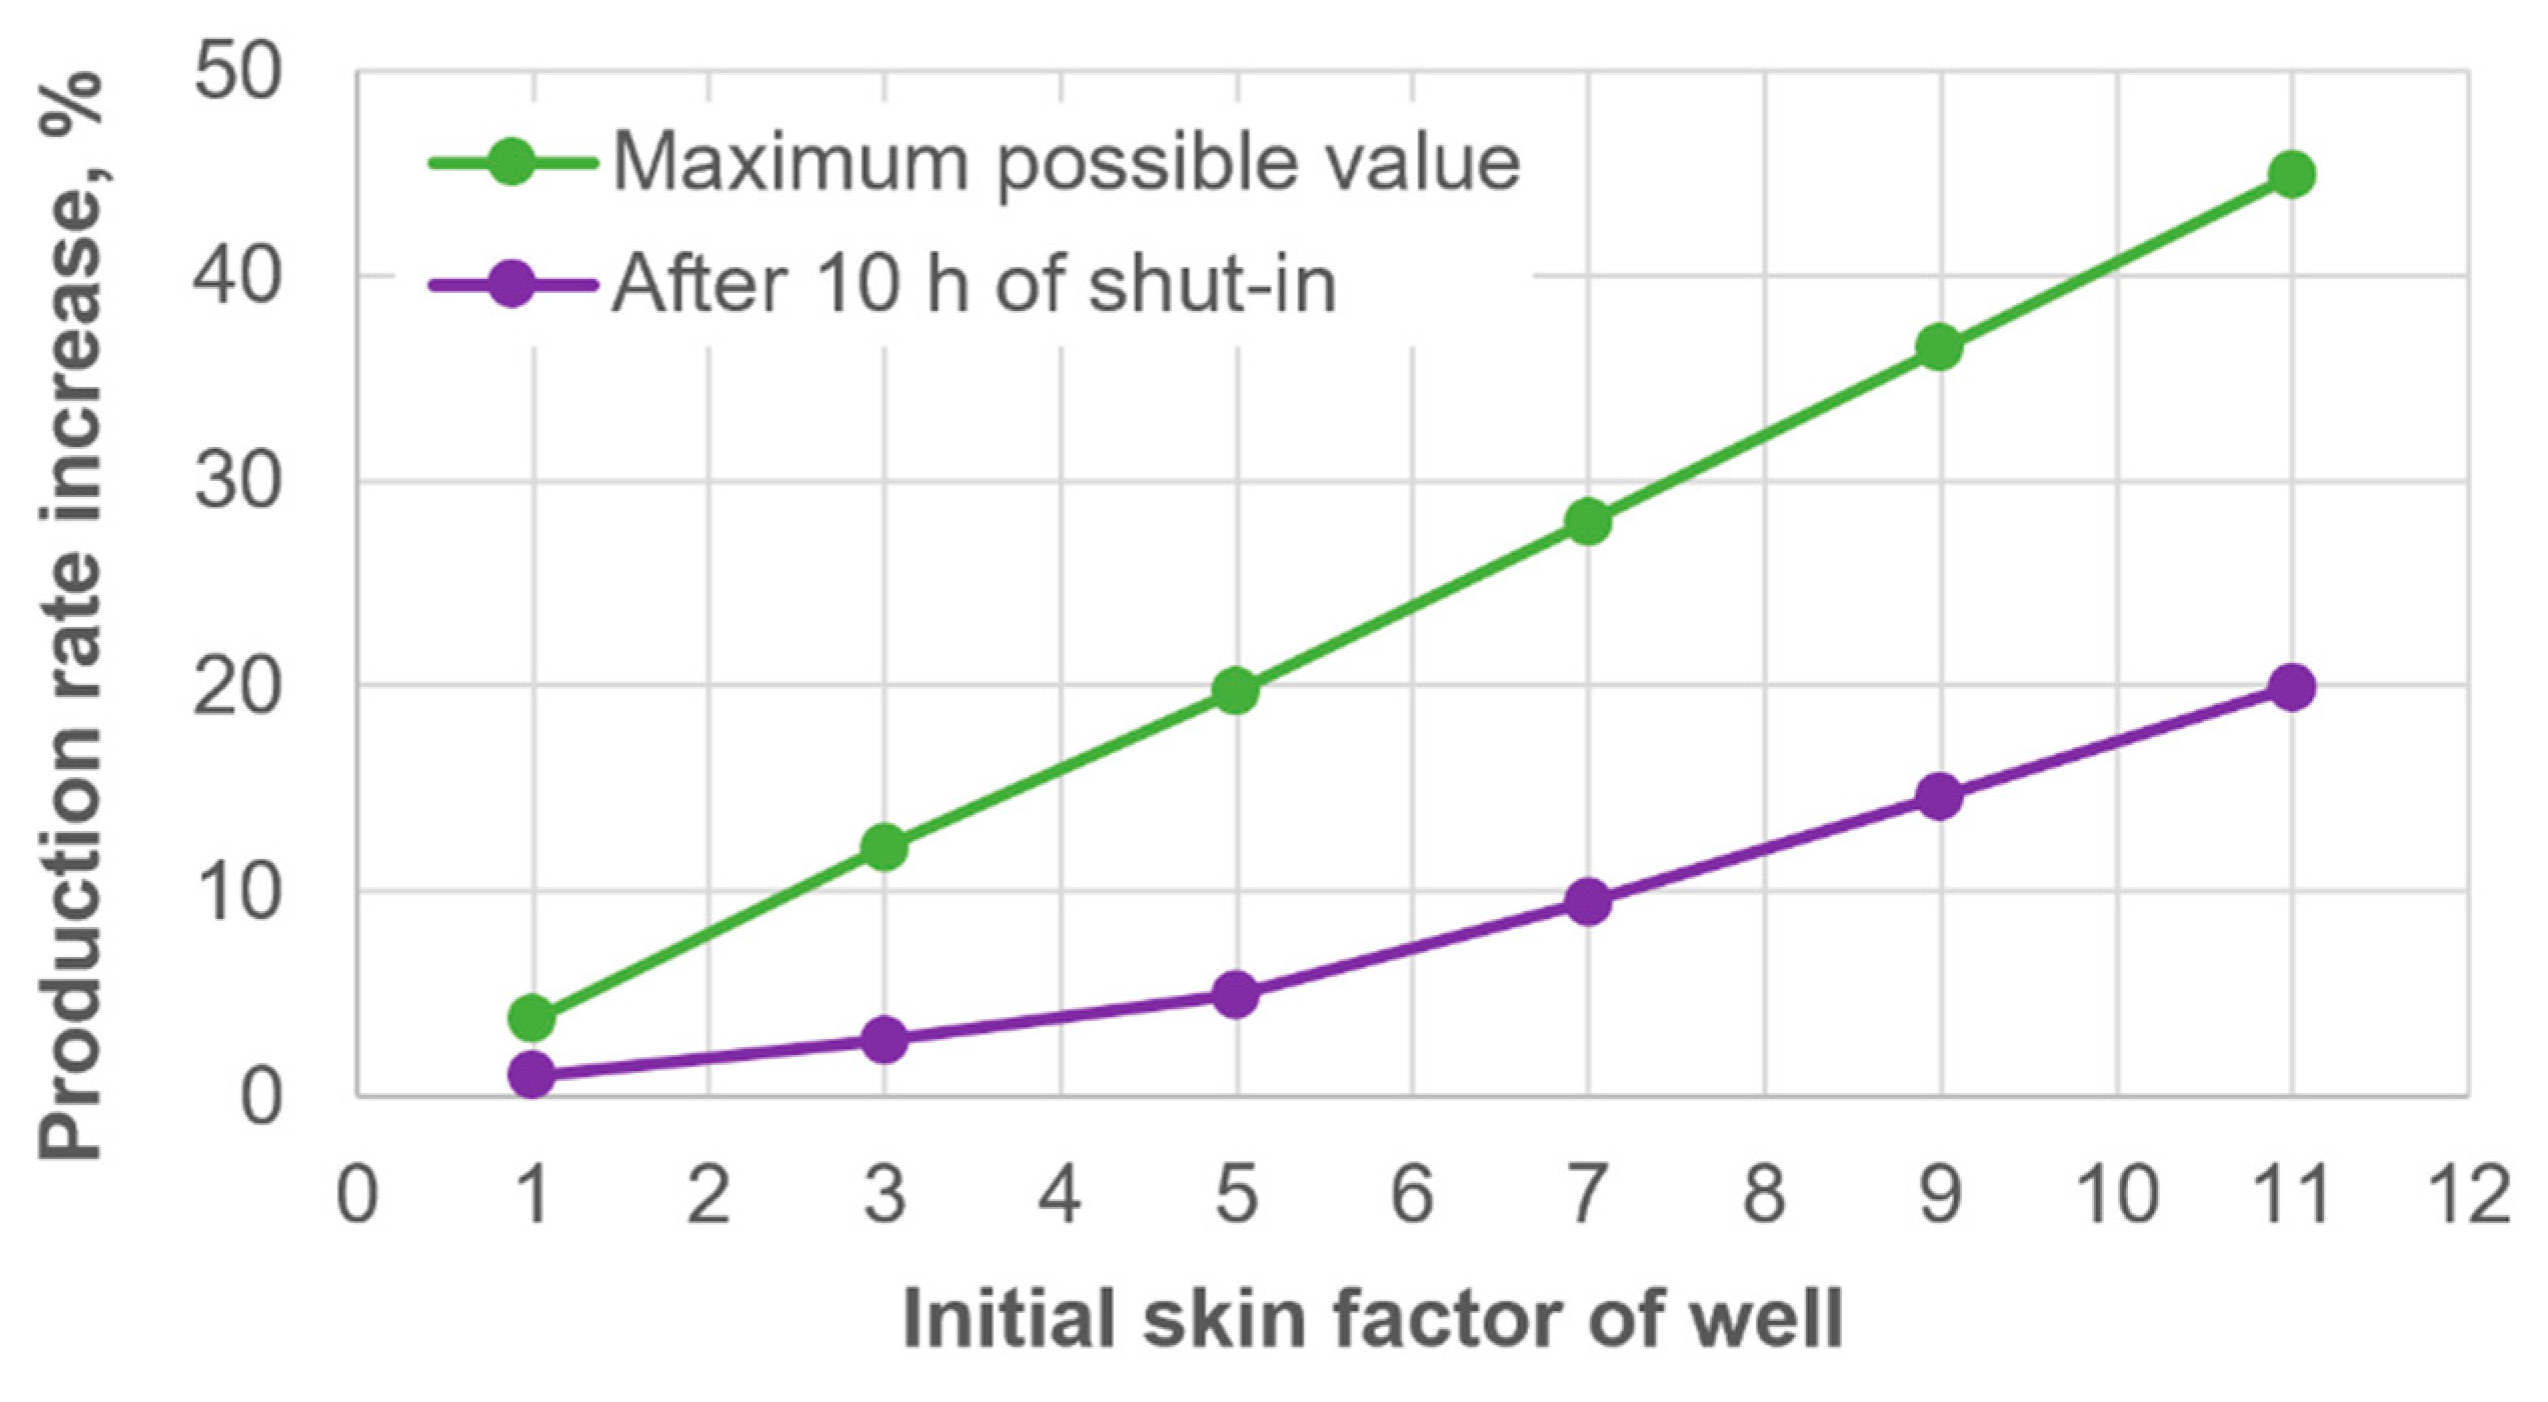
Figure 7 shows the time evolution of the skin factor for different initial levels of wax-induced NWZ damage () and the following common parameters: the base-case reservoir, the medium-reacting reagent, , and . As seen in Figure 7, a larger initial skin factor yields both a larger maximum skin-factor reduction during the active phase of the chemical reaction and a larger skin-factor reduction after a prolonged well shut-in. The resulting dependence of the well flow-rate increase on the initial skin factor was calculated using Equation (50) and is shown in Figure 8.
Figure 7.
Time evolution of the skin factor for different initial levels of NWZ damage () and the following common parameters: the base-case reservoir, the medium-reacting reagent, , and .
Figure 8.
Dependence of the well flow-rate increase on its initial skin factor.
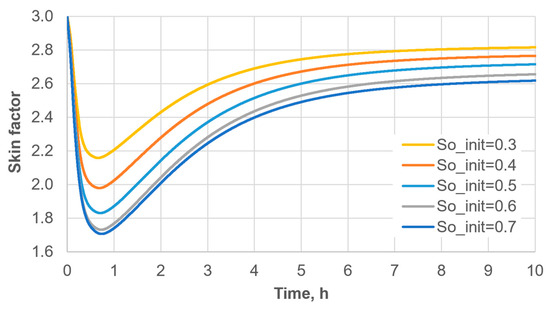
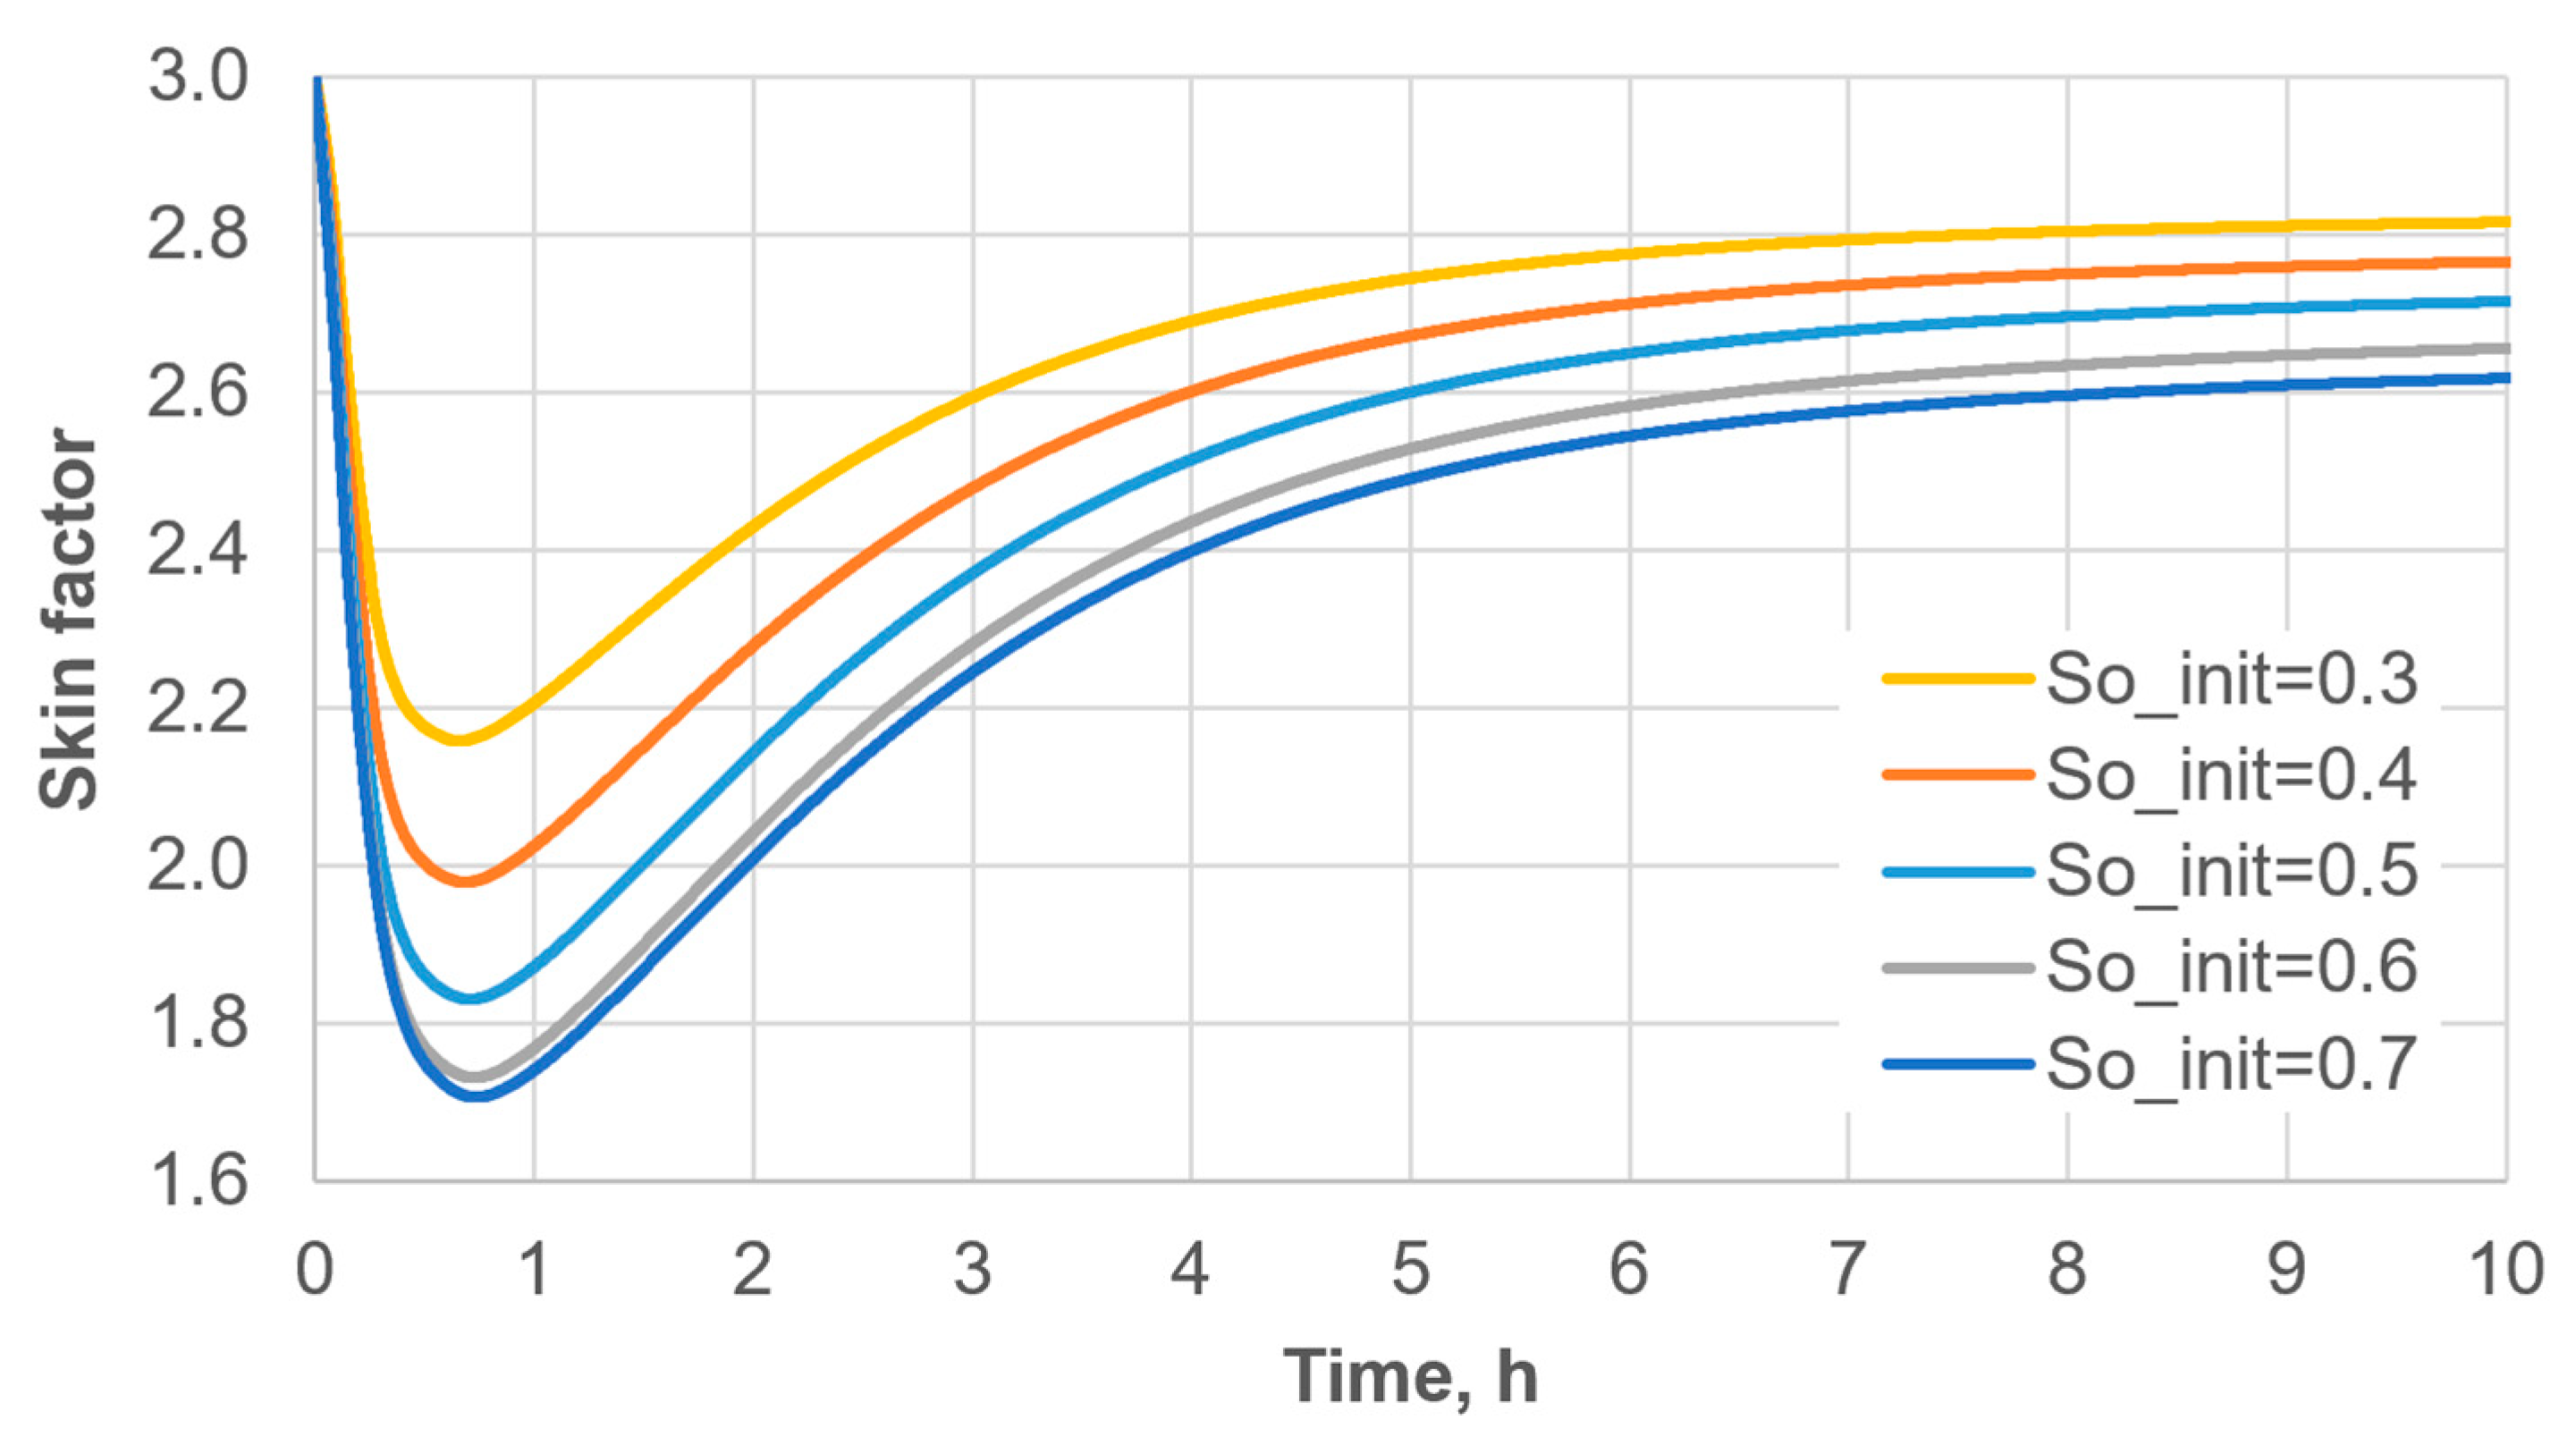
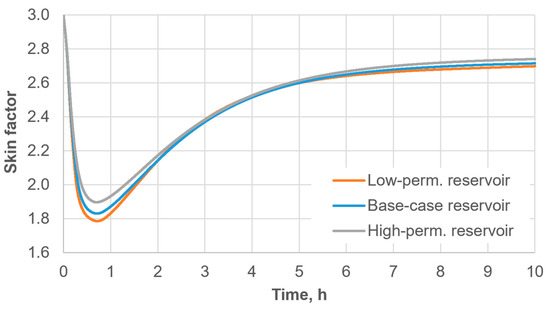
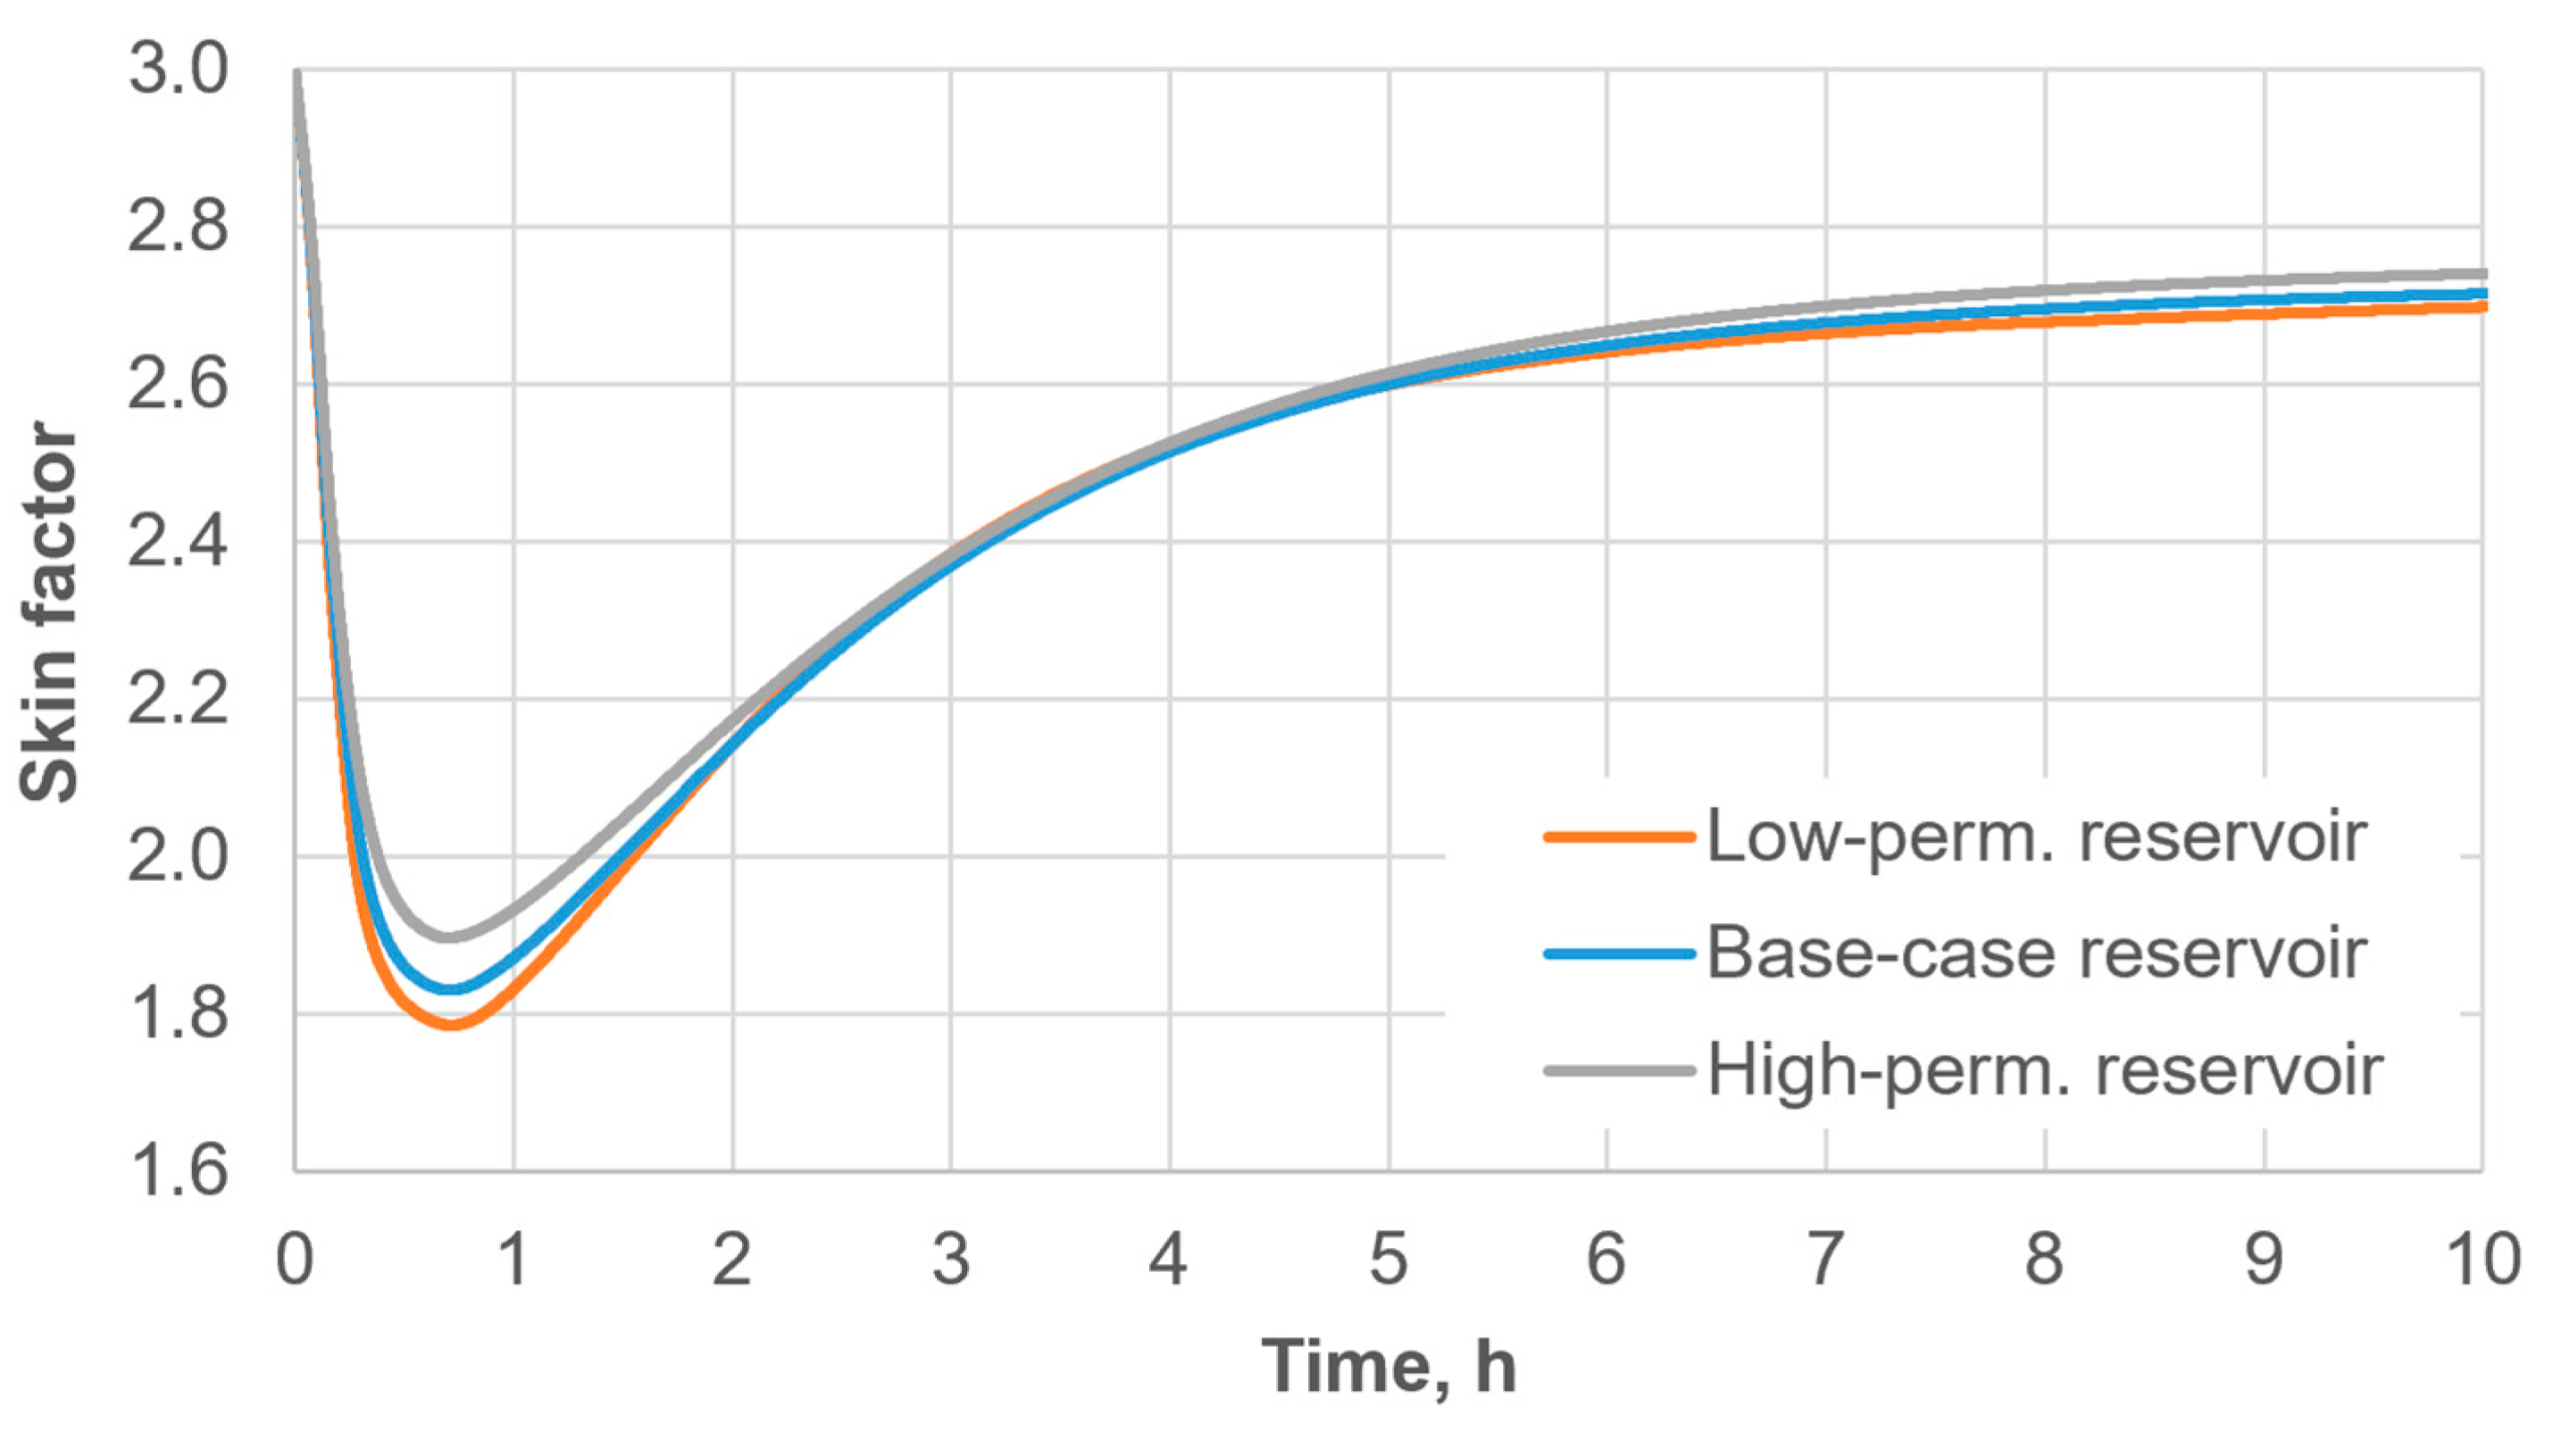
Figure 9 and Figure 10 demonstrate the influence of the initial oil saturation and of the reservoir type on the effectiveness of the thermochemical treatment of the NWZ of a production well. As seen in Figure 9, the achieved well skin-factor values are quite sensitive to the initial oil saturation of the NWZ. A higher oil saturation yields a larger skin-factor reduction, which can be explained by the larger amount of deposited wax that subsequently dissolves in the oil phase. Increasing the initial oil saturation beyond a certain threshold (in our case, ) no longer leads to a noticeable increase in the treatment effect. The reservoir type (porosity and permeability), by contrast, has a much weaker influence on the skin-factor reduction after the thermochemical treatment. The treatment effect decreases slightly as reservoir permeability increases.
Figure 9.
Time evolution of the skin factor for different initial values of the NWZ oil saturation () and the following common parameters: the base-case reservoir, , the medium-reacting reagent, and .
Figure 10.
Time evolution of the skin factor for different NWZ reservoir types and the following common parameters: , the medium-reacting reagent, , and .
The predicted redevelopment of wax deposits during post-reaction cooling also has an important operational implication. The results suggest that an unnecessarily prolonged shut-in period after completion of the thermochemical reaction should be avoided, because cooling promotes wax recrystallization and redeposition and therefore reduces the maximum permeability and skin-factor improvement achieved during heating. Accordingly, production may preferably be restarted as soon as operational and safety constraints permit after completion of the active treatment. Such an earlier restart may facilitate the removal of dissolved and suspended wax from the near-wellbore zone before extensive recrystallization and redeposition occur. A further possible mitigation strategy is to combine the thermochemical treatment with suitable solvents or wax-control additives. However, production restart and such combined chemical treatments are not explicitly simulated in the present model.
From a practical perspective, the proposed treatment is expected to be most attractive for wells with appreciable wax-induced near-wellbore damage and sufficient oil saturation, particularly when production can be restarted soon after completion of the reaction. Even after the prolonged 10 h shut-in considered here, the predicted production-rate increase reaches approximately 20% for the most severely damaged case (Figure 8). Direct in situ heat generation may also be advantageous where heat delivery from the surface is inefficient or operationally difficult. Conversely, for wells with minor wax-induced damage, low oil saturation, or unavoidable prolonged shut-in, conventional thermal or solvent-based treatments may be more appropriate. A quantitative economic comparison between these alternatives requires field-specific treatment costs, production-response data, and experimentally calibrated model parameters and is therefore beyond the scope of the present study.
The present parametric results do not define a unique optimum among reagent loading, alloy reactivity, and initial formation damage. In particular, initial wax-induced damage is an initial well condition rather than a controllable treatment parameter, whereas reagent loading and alloy reactivity are treatment-design variables. Figure 5 and Figure 6 indicate diminishing differences in the sustained skin-factor improvement as reagent loading or reactivity is increased, because part of the additional short-term benefit is subsequently lost through cooling and wax redeposition. Therefore, practical optimization would require selecting reagent loading and reactivity for the specific initial damage level while imposing operational, safety, and economic constraints. A formal constrained optimization was not performed in the present study.
4. Conclusions
A coupled one-dimensional radial model was developed to describe thermochemical removal of paraffin deposits from the near-wellbore zone using the exothermic reaction of activated aluminum alloys with formation water. The model integrates the reaction kinetics, two-phase oil–water flow, heat transfer with latent-heat effects, multi-component solid–liquid equilibrium of wax, dissolution and deposition of paraffin, and the resulting changes in porosity, permeability, and well skin factor. Within the assumptions and parameter ranges considered, the simulations led to the following conclusions:
- The heat generated by the activated aluminum–water reaction causes rapid melting and dissolution of paraffin deposits near the wellbore. Consequently, the skin factor reaches its minimum value during, or shortly after, the active phase of the chemical reaction. During the subsequent shut-in period, cooling, wax recrystallization, and redeposition cause the skin factor to increase again to approximately 80–90% of its initial value, indicating a substantial loss of the maximum treatment effect.
- The predicted treatment benefit increases with the initial level of wax-induced formation damage. A larger initial skin factor results in a greater absolute skin-factor reduction and, consequently, a larger predicted increase in the well flow rate.
- Increasing the reagent amount or using a more reactive activated aluminum alloy increases the peak heat-generation rate, the maximum wellbore temperature, and the short-term reduction in the skin factor. However, the influence of reagent amount and reactivity becomes considerably smaller after a prolonged shut-in because of cooling and wax redeposition.
- The initial oil saturation has a noticeable influence on the predicted treatment outcome. A higher oil saturation increases the volume of deposited wax available for dissolution in the oil phase, resulting in a larger skin-factor improvement.
- Among the three sandstone reservoir scenarios considered, the reservoir properties have a comparatively minor influence on the final skin factor after a prolonged shut-in, although some differences occur during the active heating stage.
Overall, the results indicate that the duration of the post-reaction shut-in period may be a key operational parameter. Minimizing unnecessary shut-in after completion of the reaction and restarting production as soon as operational and safety constraints permit may help reduce wax recrystallization and facilitate the removal of dissolved and suspended wax before extensive redeposition occurs, thereby preserving a larger part of the treatment effect.
5. Limitations and Outlook
The present model is intended as a mechanistic sensitivity-analysis framework and has yet to be validated against independent laboratory or field data. Accordingly, the numerical results are used primarily to assess process trends and parameter sensitivities rather than to provide quantitative predictions for a specific well. Several simplifying assumptions therefore define the scope of the results. The near-wellbore zone is represented by a one-dimensional radial domain with representative homogeneous reservoir properties, whereas spatial heterogeneity, anisotropy, fractures, and detailed completion geometry are not explicitly considered. Such heterogeneity may produce preferential fluid-displacement and transport pathways, while low-permeability, water-rich, or more strongly wax-damaged regions may remain comparatively undertreated. Consequently, the spatially averaged treatment response predicted by the present 1D model may differ from the local response of a heterogeneous formation. The wax dissolution, deposition, and porosity–permeability relations are based on phenomenological formulations and literature correlations and have yet to be calibrated against dedicated core-scale experiments for the specific rock–oil–water–wax system considered here. In addition, hydrogen generated by the aluminum–water reaction is not treated as a mobile reservoir phase, and the wellbore heat-transfer and gas-flow processes are represented in a simplified manner. The restart of production is also not explicitly simulated; instead, the potential production improvement is evaluated from the calculated change in the skin factor and the corresponding flow-rate change factor.
Further development should therefore focus first on experimental validation and parameter calibration. A staged validation procedure is envisaged. At the laboratory scale, controlled core-flood experiments should first be performed in which paraffin deposition is induced in representative reservoir core samples and the resulting initial porosity and permeability impairment is characterized. The damaged cores should then be subjected to thermochemical treatment under representative pressure and temperature conditions, while temperature, pressure drop, permeability recovery, and wax removal and redistribution are monitored. These measurements would allow calibration of the uncertain wax-dissolution, deposition, and porosity–permeability parameters. A separate set of experiments not used for parameter calibration should subsequently be used for independent validation of the coupled model. At the field scale, comparison with measured temperature and pressure responses, skin-factor evolution, and production rates before and after thermochemical treatment would ultimately be required before the model could be used for quantitative treatment design.
Future extensions should also include more detailed modeling of heat losses and hydrogen behavior in the wellbore, possible gas penetration into the formation, and reservoir heterogeneity through extension of the present framework to two-dimensional or fully three-dimensional geometries with spatially varying permeability, porosity, saturation, and initial wax distribution. Explicit simulation of production restart and the subsequent transport of dissolved and suspended wax out of the near-wellbore zone should also be considered. The latter is particularly important because the present results indicate that prolonged post-reaction shut-in promotes recrystallization and redeposition. Combined thermochemical treatment with suitable solvents or wax-control additives may provide an additional strategy for limiting redeposition and should be investigated explicitly. Ultimately, a validated model could be used to optimize reagent loading and reaction rate together with treatment duration and production-restart timing in order to maximize the sustained reduction in formation damage while satisfying operational and safety constraints.
Author Contributions
Conceptualization, T.B., B.B. and G.B.; methodology, T.B.; software, T.B.; validation, T.B.; formal analysis, T.B.; investigation, T.B.; resources, G.B.; data curation, T.B. and G.B.; writing—original draft preparation, T.B. and B.B.; writing—review and editing, T.B. and B.B.; visualization, T.B.; supervision, G.B.; project administration, G.B.; funding acquisition, G.B. All authors have read and agreed to the published version of the manuscript.
Funding
This research was funded by the Science Committee of the Ministry of Science and Higher Education of the Republic of Kazakhstan, grant number BR24992868.
Data Availability Statement
The data generated and analyzed during this study are available from the corresponding author upon reasonable request.
Acknowledgments
During the preparation of this manuscript, the authors used AI tools for the purposes of English translation and language editing. The authors have reviewed and edited the output and take full responsibility for the content of this publication.
Conflicts of Interest
The authors declare no conflicts of interest. The funders had no role in the design of the study; in the collection, analyses, or interpretation of data; in the writing of the manuscript; or in the decision to publish the results.
Nomenclature
| Abbreviations | |
| ARPD | Asphaltene–resin–paraffin deposit |
| NWZ | Near-wellbore zone |
| Parameters | |
| Latin symbols | |
| Specific fluid–pore interfacial area, m−1 | |
| Volumetric heat capacity, J/(m3∙K) | |
| Specific heat capacity, J/(kg∙K) | |
| Molecular diffusion coefficient of wax component in the oil phase, m2/s | |
| Mean diameter of the pores, m | |
| Initial volume fraction of the total deposited wax, dimensionless | |
| Volume fraction of oil-contacted deposited wax, dimensionless | |
| Volume fraction of water-contacted deposited wax, dimensionless | |
| Well flow rate improvement factor, dimensionless | |
| Molar latent heat of fusion, J/mol | |
| Molar chemical reaction enthalpy, J/mol | |
| Absolute permeability, m2 | |
| Absolute permeability without wax deposition, m2 | |
| Relative permeability, dimensionless | |
| Interphase mass transfer coefficient, m/s | |
| Molar mass, kg/mol | |
| Linear density of reactant’s mass, kg/m | |
| Pressure, Pa | |
| Linear density of heat release rate due to a chemical reaction, W/m | |
| Volumetric latent heat source term due to phase-change of wax, W/m3 | |
| Deposition rate of volume fraction of wax deposition, 1/s | |
| Dissolution rate of volume fraction of wax deposition, 1/s | |
| Oil contact redistribution rate of deposited wax, 1/s | |
| Universal gas constant, J/(K·mol) | |
| Particle Reynolds number, dimensionless | |
| Coordinate in radial direction from well axis, m | |
| Well radius, m | |
| Radius at which the effect of permeability damage is considered negligible, m | |
| Radius of undisturbed reservoir (for simulation), m | |
| Spatial grid size, m | |
| Phase saturation, dimensionless | |
| Residual oil saturation, dimensionless | |
| Critical water saturation, dimensionless | |
| Schmidt number, dimensionless | |
| Sherwood number, dimensionless | |
| Skin-factor of production well, dimensionless | |
| Temperature, K | |
| Melting point temperature, K | |
| Time, s | |
| Time step for simulation, s | |
| Velocity, m/s | |
| Molar volume, m3/mol | |
| Mass-specific volumetric hydrogen generation rate, m3/(kg∙s) | |
| Total volume change rate per unit wellbore height, m2/s | |
| Volume fraction of wax component in wax deposit | |
| Mole fraction | |
| Activity coefficients of wax components | |
| Greek symbols | |
| Liquid (molten) fraction of deposited wax, dimensionless | |
| Plugging deposition rate coefficient for wax, 1/m | |
| Static surface deposition rate coefficient for wax, 1/s | |
| Thermal conductivity, W/(m∙K) | |
| Dynamic viscosity, Pa∙s | |
| Density, kg/m3 | |
| Dynamic surface deposition rate coefficient for wax, 1/m | |
| Porosity, dimensionless | |
| Porosity without wax deposition, dimensionless | |
| Phase equilibrium constant for wax-component, dimensionless | |
| Mass fraction, dimensionless | |
| Mass fraction of dissolved wax-component in oil, dimensionless | |
| Saturated mass fraction of dissolved wax-component in oil, dimensionless | |
| Mass fraction of suspended wax-component in oil, dimensionless | |
| Superscripts and Subscripts | |
| Related to deposited wax | |
| Initial value | |
| Related to solid wax | |
| Related to oil-solvent | |
| Related to liquid wax | |
| Aluminum | |
| Aluminum hydroxide | |
| Effective value | |
| Hydrogen | |
| Oil phase | |
| Rock | |
| Water phase | |
| Related to all wax components | |
| -th wax component | |
Appendix A. Wax-Component Properties and Model Parameters
Table A1.
Parameters of the wax components.
Densities of wax components were adopted from the study by Yücel (2005) [31]. Values of and were adopted from NIST Chemistry WebBook [32] and the study by Domalski and Hearing (1996) [33]. For values of , were approximately estimated from the regression models of and versus the carbon number of the wax molecule.
The initial mole fractions of the wax components in the wax deposits were calculated using Equation (7) from the molar composition of crude oil reported by Kurniawan et al. (2022) [34]. The resulting values of are consistent with the wax-components distribution in wax deposits reported by Ganeeva et al. (2016) [7], which showed that the n-alkanes associated with asphaltenes isolated from wax deposits formed in downhole equipment cover the wide range C16–C60, in which the alkane fraction increases smoothly with carbon number, reaches a maximum approximately in the range C40–C48 and then falls off sharply. Although these data do not correspond to the total wax fraction in near-wellbore pore deposits, they confirm that organic deposits, once formed, can be enriched in n-alkanes of medium and high molecular weight.
Table A2.
Characteristic reservoir types.
The specific pore surface area was estimated from the porosity and permeability using the Kozeny–Carman relation [35]:
After determining the value of , the mean pore size was treated as an equivalent cylindrical pore diameter and was then estimated from the relation for cylindrical channels:
The values of and in Table A2 were selected based on the following considerations: practical ranges of are reported on the order of [36], depending on the permeability range and rock type. According to Gong et al. (2024) [37] for waterflooding of sandstone cores, about 25–50% of the oil remains undisplaced in the swept zone, which effectively corresponds to the range of 0.25–0.50. A trend is also observed: the higher the permeability, the lower the values of and [38,39].
Table A3.
Values of the model parameters that are common in all simulations.
References
- Lyubchenko, N.; Boiko, G.; Sarmurzina, R.; Panova, Y.; Kenzhaliyev, B.; Karabalin, U. Compositional Formulations for the Removal and Dissolution of Asphaltene–Resin–Paraffin Deposits in the Near-Wellbore Zone and Tubing Strings. Processes 2025, 13, 3328. [Google Scholar] [CrossRef] [Scilit]
- Ring, J.N., III. Simulation of Paraffin Deposition in Reservoirs. Ph.D. Thesis, Texas A & M University, College Station, TX, USA, 1991. [Google Scholar]
- Adeyanju, O.A.; Oyekunle, L.O. Simulation of Paraffin Deposition in Petroleum Reservoirs. ASPES 2011, 2, 79–92. [Google Scholar]
- Sandyga, M.S.; Struchkov, I.A.; Rogachev, M.K. Formation Damage Induced by Wax Deposition: Laboratory Investigations and Modeling. J. Pet. Explor. Prod. Technol. 2020, 10, 2541–2558. [Google Scholar] [CrossRef] [Scilit]
- Weingarten, J.S.; Euchner, J.A. Methods for Predicting Wax Precipitation and Deposition. SPE Prod. Eng. 1988, 3, 121–126. [Google Scholar] [CrossRef] [Scilit]
- Wang, S.; Civan, F.; Strycker, A.R. Simulation of Paraffin and Asphaltene Deposition in Porous Media. In Proceedings of the SPE International Symposium on Oilfield Chemistry; SPE: Houston, TX, USA, 1999; p. SPE-50746-MS. [Google Scholar]
- Ganeeva, Y.M.; Yusupova, T.N.; Romanov, G.V. Waxes in Asphaltenes of Crude Oils and Wax Deposits. Pet. Sci. 2016, 13, 737–745. [Google Scholar] [CrossRef] [Scilit]
- Civan, F.; Knapp, R.M.; Ohen, H.A. Alteration of Permeability by Fine Particle Processes. J. Pet. Sci. Eng. 1989, 3, 65–79. [Google Scholar] [CrossRef] [Scilit]
- Petrovic, J.; Thomas, G. Reaction of Aluminum with Water to Produce Hydrogen: A Study of Issues Related to the Use of Aluminum for On-Board Vehicular Hydrogen Storage; US Department of Energy: Washington, DC, USA, 2008; pp. 1–26.
- Senel, E.; Nisancioglu, K. Effect of Small Concentrations of Gallium and Lead on Anodic Activation of Aluminium in Chloride Solution. Corros. Sci. 2018, 131, 330–339. [Google Scholar] [CrossRef] [Scilit]
- Sarmurzina, R.; Boiko, G.; Lyubchenko, N.; Karabalin, U.; Khasenov, A.; Panova, Y.; Kenzhaliyev, B. Mechanism and Kinetics of the Interaction of Activated Aluminum with Water and Aqueous Electrolytes. Processes 2026, 14, 2048. [Google Scholar] [CrossRef] [Scilit]
- Fan, K.; Li, S.; Li, R. Development of Wax Molecular Diffusivity Correlation Suitable for Crude Oil in Wax Deposition: Experiments with a Cold-Finger Apparatus. J. Pet. Sci. Eng. 2021, 205, 108851. [Google Scholar] [CrossRef] [Scilit]
- Balakotaiah, V.; West, D.H. Shape Normalization and Analysis of the Mass Transfer Controlled Regime in Catalytic Monoliths. Chem. Eng. Sci. 2002, 57, 1269–1286. [Google Scholar] [CrossRef] [Scilit]
- Chen, Z.; Huan, G.; Ma, Y. Society for Industrial and Applied Mathematics. In Computational Methods for Multiphase Flows in Porous Media; Siam: Philadelphia, PA, USA, 2006; ISBN 978-0-89871-606-1. [Google Scholar]
- Bøe, A.; Skjaeveland, S.M.; Whitson, C.H. Two-Phase Pressure Test Analysis. SPE Form. Eval. 1989, 4, 604–610. [Google Scholar] [CrossRef] [Scilit]
- Pedersen, K.S.; Fredenslund, A.; Thomassen, P. Contributions in petroleum geology and engineering. In Properties of Oils and Natural Gases; Gulf Publishing: Houston, TX, USA, 1989; ISBN 978-0-87201-588-3. [Google Scholar]
- Won, K.W. Thermodynamics for Solid Solution-Liquid-Vapor Equilibria: Wax Phase Formation from Heavy Hydrocarbon Mixtures. Fluid Phase Equilibria 1986, 30, 265–279. [Google Scholar] [CrossRef] [Scilit]
- Hansen, J.H.; Fredenslund, A.; Pedersen, K.S.; Rønningsen, H.P. A Thermodynamic Model for Predicting Wax Formation in Crude Oils. AIChE J. 1988, 34, 1937–1942. [Google Scholar] [CrossRef] [Scilit]
- Coutinho, J.A.P.; Stenby, E.H. Predictive Local Composition Models for Solid/Liquid Equilibrium in n -Alkane Systems: Wilson Equation for Multicomponent Systems. Ind. Eng. Chem. Res. 1996, 35, 918–925. [Google Scholar] [CrossRef] [Scilit]
- Fan, Y.; Llave, F.M. Chemical Removal of Formation Damage From Paraffin Deposition Part I–Solubility and Dissolution Rate. In Proceedings of the SPE Formation Damage Control Symposium; SPE: Lafayette, LA, USA, 1996; p. SPE-31128-MS. [Google Scholar]
- Civan, F. Interactions of the Horizontal Wellbore Hydraulics and Formation Damage. In Proceedings of the Permian Basin Oil and Gas Recovery Conference; SPE: Midland, TX, USA, 1996; p. SPE-35213-MS. [Google Scholar]
- Geller, J.T.; Hunt, J.R. Mass Transfer from Nonaqueous Phase Organic Liquids in Water-saturated Porous Media. Water Resour. Res. 1993, 29, 833–845. [Google Scholar] [CrossRef] [Scilit] [PubMed]
- Bradford, S.A.; Abriola, L.M. Dissolution of Residual Tetrachloroethylene in Fractional Wettability Porous Media: Incorporation of Interfacial Area Estimates. Water Resour. Res. 2001, 37, 1183–1195. [Google Scholar] [CrossRef] [Scilit]
- Patmonoaji, A.; Hu, Y.; Zhang, C.; Suekane, T. Dissolution Mass Transfer of Trapped Phase in Porous Media. In Porous Fluids-Advances in Fluid Flow and Transport Phenomena in Porous Media; IntechOpen: London, UK, 2021; ISBN 978-1-83962-712-5. [Google Scholar]
- Jia, C.; Sepehrnoori, K.; Zhang, H.; Yao, J. Numerical Studies and Analyses on the Acidizing Process in Vug Carbonate Rocks. Front. Earth Sci. 2021, 9, 712566. [Google Scholar] [CrossRef] [Scilit]
- Zheng, S.; Fogler, H.S. Fundamental Investigation of Wax Diffusion Characteristics in Water-in-Oil Emulsion. Ind. Eng. Chem. Res. 2015, 54, 4420–4428. [Google Scholar] [CrossRef] [Scilit]
- Sousa, A.L.; Matos, H.A. Correlations for Prediction of Molecular Diffusivities in Liquids at Infinite Dilution for Normal Paraffin Solutions. Can. J. Chem. Eng. 2020, 98, 1031–1032. [Google Scholar] [CrossRef] [Scilit]
- Van Der Geest, C.; Melchuna, A.; Bizarre, L.; Bannwart, A.C.; Guersoni, V.C.B. Critical Review on Wax Deposition in Single-Phase Flow. Fuel 2021, 293, 120358. [Google Scholar] [CrossRef] [Scilit]
- Nield, D.A.; Bejan, A. Convection in Porous Media; Springer: Cham, Switzerland, 2017; ISBN 978-3-319-49562-0. [Google Scholar]
- Hawkins, M.F.J. A Note on the Skin Effect. J. Pet. Technol. 1956, 8, 65–66. [Google Scholar] [CrossRef] [Scilit]
- Yücel, H.G. Prediction of Molecular Weight and Density of N-Alkanes (C6–C44). Anal. Chim. Acta 2005, 547, 94–97. [Google Scholar] [CrossRef] [Scilit]
- Linstrom, P.J.; Mallard, W.G. NIST Chemistry WebBook, NIST Standard Reference Database 69; NIST: Gaithersburg, MD, USA, 1997.
- Domalski, E.S.; Hearing, E.D. Heat Capacities and Entropies of Organic Compounds in the Condensed Phase. Volume III. J. Phys. Chem. Ref. Data 1996, 25, 1. [Google Scholar] [CrossRef] [Scilit]
- Kurniawan, M.; Adiwar, A.; Mulia, K.; Anwar, C. Wax Precipitation in Crude Oil by Coutinho Model Based on Conventional Gas Chromatography Data. SCOG 2022, 36, 75–82. [Google Scholar] [CrossRef] [Scilit]
- Carman, P.C. Fluid Flow through Granular Beds. Chem. Eng. Res. Des. 1997, 75, S32–S48. [Google Scholar] [CrossRef] [Scilit]
- Widarsono, B. Imbibition Water-Oil Relative Permeability: Introduction of Wettability Strength for Enhancing Model Robustness. SCOG 2019, 42, 1–8. [Google Scholar] [CrossRef] [Scilit]
- Gong, W.; Liu, Y.; Xi, C.; Yang, G.; Ju, Y.; Wang, M. Dynamic Characterization of Residual Oil during Long-Term Waterflooding Experiments in Heterogeneous Porous Structures. Fuel 2024, 356, 129567. [Google Scholar] [CrossRef] [Scilit]
- Hu, B.; Fu, J.; Yan, W.; Chen, K.; Ding, J. Normalization of Relative-Permeability Curves of Cores in High-Water-Content Tight Sandstone Gas Reservoir. Energies 2025, 18, 2335. [Google Scholar] [CrossRef] [Scilit]
- Valenti, N.P.; Valenti, R.M.; Koederitz, L.F. A Unified Theory on Residual Oil Saturation and Irreducible Water Saturation. In Proceedings of the SPE Annual Technical Conference and Exhibition; SPE: San Antonio, TX, USA, 2002; p. SPE-77545-MS. [Google Scholar]
- Jin, Y.; Wunderlich, B. Heat Capacities of Paraffins and Polyethylene. J. Phys. Chem. 1991, 95, 9000–9007. [Google Scholar] [CrossRef] [Scilit]
- Robertson, E.C. Thermal Properties of Rocks; U.S. Geological Survey: Reston, VA, USA, 1988.
- Fleming, F.P.; Silva, L.d.A.; Lima, G.D.S.V.; Herzog, I.; Orlande, H.R.B.; Daridon, J.-L.; Pauly, J.; Azevedo, L.F.A. Thermal Conductivity of Heavy, Even-Carbon Number n-Alkanes (C22 to C32). Fluid Phase Equilibria 2018, 477, 78–86. [Google Scholar] [CrossRef] [Scilit]
Disclaimer/Publisher’s Note: The statements, opinions and data contained in all publications are solely those of the individual author(s) and contributor(s) and not of MDPI and/or the editor(s). MDPI and/or the editor(s) disclaim responsibility for any injury to people or property resulting from any ideas, methods, instructions or products referred to in the content. |
© 2026 by the authors. Licensee MDPI, Basel, Switzerland. This article is an open access article distributed under the terms and conditions of the Creative Commons Attribution (CC BY) license.