


Abstract
Large-scale administrative hospital discharge data is a key resource for secondary health systems research, yet reuse is constrained by barriers of access, quality, interoperability, and semantic comparability. This paper presents and validates a reproducible, declarative, loss-aware harmonization framework for public discharge data that avoids full migration to a comprehensive common data model. The framework comprises a lightweight 14-field canonical model, versioned JSON crosswalks, a shared execution engine, a resilient file reader, schema validation, idempotency tests, value-domain checks, and an information-loss map. It was evaluated on public record-level discharge data from five jurisdictions on three continents (Korea, Brazil, Mexico, Chile, and New York State), comprising 561,966,231 harmonized records from 2001 to 2025. Validation demonstrated conformance to the declared source profiles for 82 of 99 files and full canonical conformance for 39, idempotency across all 99 files, 99.99% conformance with permitted value domains under an explicitly stated aggregation, and detection of source-level defects such as truncated files, malformed rows, and completeness anomalies. A marker-condition query for ischemic stroke (ICD-10 I63) showed that a single case definition executes consistently on the four sources retaining raw ICD-10 codes. The results show that, for heterogeneous administrative data, the key value lies not in scale alone but in the auditability of transformations, explicit loss documentation, and reproducibility of the harmonization process.
1. Introduction
Advances in computing power and data storage have made large-scale administrative data a central resource for contemporary health systems research. In practice, however, the main constraint on secondary analysis is rarely the volume of available data. More often, the limiting factors are access, data quality, interoperability, and the difficulty of reconciling heterogeneous sources into an analyzable form. Routine hospital discharge data illustrate this challenge particularly well. They are generated as a by-product of billing, reporting, and benefits administration, cover large populations at regional or national scale, and include information on diagnoses, length of stay, ward type, and, in some systems, costs. They are widely used in research on health system performance, clinical epidemiology, health technology assessment, and policy. Their analytical value, however, is usually confined to a single jurisdiction, because each dataset is produced under a distinct specification, language, coding system, file format, and access regime [1,2].
The barriers to cross-jurisdictional reuse are organizational, semantic, and technical. Access regimes range from open microdata to tightly controlled repositories; coding systems differ in International Classification of Diseases (ICD) version and national modification; and translations between coding versions and changes in higher-level grouper systems introduce discontinuities that complicate time-series and cross-national comparisons [3,4,5,6,7]. Variable granularity also differs across sources, from exact age to age bands, from a single principal diagnosis to extended comorbidity lists, and from convertible cost fields to a complete absence of cost information. Anonymization rules may additionally suppress variables that are important for clinical classification. At the technical level, differences in character encoding, delimiters, header structure, filename conventions, and schema drift across annual files create further obstacles to reuse [8]. The difficulty of porting jurisdiction-specific tools is well documented: external validation of the Clinical Classifications Software Refined (CCSR), designed for the United States, against Canadian ICD-10-CA and Danish codes found that, without a dedicated mapping algorithm, a substantial proportion of diagnoses did not map to any CCSR category. For heart-failure hospitalizations, the proportion reached 96.6% [9]. These issues correspond to broader data-quality dimensions commonly discussed in secondary health data research, including completeness, consistency, schema conformance, plausibility, and fitness for purpose [10,11,12,13,14].
Two research traditions are directly relevant to this problem. International comparison initiatives, such as EuroHOPE [15,16,17] and the Global Comparators project [18], have demonstrated the value of administrative data for comparative health system research. However, they have typically relied on institutional partnerships, restricted-access data, or selected provider networks, which limits full independent reproducibility from public sources alone. In parallel, the common data model (CDM) paradigm, most prominently the OHDSI/OMOP vocabularies and CDM [2,19,20,21], has matured into a powerful route to interoperability and federated analysis. A complete extract–transform–load (ETL) process to OMOP is nevertheless resource-intensive, and its main bottleneck remains the source-level mapping of concepts, codes, and file structures. For targeted, publicly accessible, and reproducible reuse of discharge data, a lighter intermediate harmonization layer may therefore be useful that is formal enough to guarantee transformation transparency, but simpler than full migration to a comprehensive CDM. Such a layer complements rather than replaces OMOP and may serve as a first step toward later export to a more comprehensive model [22,23].
These requirements are consistent with the FAIR principles [24], health data FAIRification workflows [25], and the FAIR principles for computational workflows [26]. In this context, the present study addresses the following question: how can heterogeneous public hospital discharge datasets be transformed into a common, auditable, and reproducible structure while explicitly documenting the information that is preserved, transformed, reduced, or lost? To answer this question, we developed and evaluated a lightweight, discharge-specific harmonization framework based on a 14-field canonical model, declarative JSON crosswalks, a shared execution engine, schema validation, idempotency testing, value-domain checks, and an explicit information-loss map [12,22,27,28,29].
This article makes four contributions. First, it formalizes a taxonomy of recurring access and quality barriers affecting the reuse of public administrative hospital discharge data across jurisdictions. Second, it presents an implementable, declarative crosswalk model in which source-specific mapping rules are separated from a shared execution engine, reducing dependence on one-off ETL scripts. Third, it treats information loss as a measurable and auditable output of the harmonization process rather than as an undocumented side effect of transformation. Fourth, it evaluates the framework empirically at scale using five public record-level discharge datasets from three continents, covering 561,966,231 harmonized records from 2001 to 2025, and demonstrates analytical feasibility through a marker-condition query for ischemic stroke. The subject of this article is therefore the harmonization method and the barrier analysis it enables; substantive comparative epidemiology, which would require population denominators, standardization, and system-level interpretation, is beyond its scope.
2. Materials and Methods
2.1. A Taxonomy of Access and Quality Barriers
Before turning to the analysis of the selected sources, we organize the most common barriers encountered when reusing public discharge data into a five-class taxonomy.
- (A)
- Access and licensing barriers: Redistribution restrictions, provider-imposed conditions, and files that are listed but cannot be downloaded.
- (B)
- Structural and encoding barriers: Character encodings, BOM markers, delimiters, fixed-width padding, filename conventions, and schema drift across annual files.
- (C)
- Integrity barriers: Truncated files, structurally malformed rows, and near-total absence of a field in a single vintage.
- (D)
- Semantic barriers: Differences in coding systems (raw ICD-10 vs. grouper categories), variable granularity, and inconsistent field meanings.
- (E)
- Value-quality barriers: Out-of-domain values, non-standardized missingness sentinels, and cost fields expressed in different currencies or absent altogether [12,13,14,30].
2.2. Data Sources
The framework was evaluated on five publicly available, record-level hospital discharge datasets: Korea (National Health Insurance Service, NHIS), Brazil (DATASUS/SIHSUS), Mexico (SAEH, Secretaría de Salud), Chile (DEIS-MINSAL), and New York State (SPARCS, de-identified inpatient discharges). Together they comprise approximately 562 million source records spanning 2001–2025 across three continents. Each source is record-level—one row per discharge—and each is publicly obtainable, satisfying a single inclusion criterion: publicly available, record-level discharge microdata that a deterministic crosswalk can map to a common column model. Aggregated indicator tables were excluded. Table 1 summarizes the technical properties of each source. New York is a borderline case. Its diagnosis field carries Agency for Healthcare Research and Quality (AHRQ) grouper categories rather than the underlying diagnosis codes: CCS [31] for the 2009–2017 vintages and CCSR [9,32] for 2018–2024 (official AHRQ/HCUP mapping resources [33,34]). The New York series therefore spans more than one diagnostic classification regime. In addition to the transition from ICD-9-CM to ICD-10-CM during the study period, the public SPARCS files change from CCS to CCSR at the 2017/2018 boundary. These transitions are not treated as semantically neutral; diagnosis-based definitions are declared by source and vintage, and categories from different classification eras are not assumed to be directly interchangeable. New York was nevertheless retained as a full source because the remaining fields map to the model and each row corresponds to one discharge.
Table 1.
The five record-level sources and their crosswalks.
Candidate sources were identified by inspecting national open data portals rather than by working from a predefined list of countries, because public discharge microdata are published through general-purpose data catalogs rather than through any common health data channel. Portals inspected include dane.gov.pl for Poland, data.go.kr for Korea, and dati.gov.it for Italy, together with the national portals through which the five included sources are published. Screening applied a single criterion: whether a record-level file exposes fields that map deterministically onto the column model, in practice a diagnosis code, an age or age band, and sex.
Two classes of exclusion accounted for most rejections, and both remove the source from consideration entirely rather than making it harmonizable with loss. The first is aggregation. Many portals publish discharge information only as periodic summary statistics with no record-level file behind them. The Italian portal is representative, publishing monthly aggregates. The second is suppression of the clinical field. The Polish inpatient reporting dataset publishes record-level rows but masks the diagnosis code [35], which removes the field on which any case definition depends, so the file cannot support the analytical use the framework exists to enable. The third is insufficient field coverage or uncoded clinical content. The Peruvian record-level files carry too few of the model’s fields to populate it, in practice a year, a diagnosis, and a region, with no usable sex or age. The Uruguayan files carry a free-text description of the diagnosis rather than a coded value, so no deterministic mapping to a classification is possible, and no case definition can be expressed by code. Coarse age banding alone is not disqualifying, since two of the included sources publish age only as intervals; what disqualifies a source is the absence of a coded clinical field or of the demographic fields altogether. Because the inclusion criterion is compatibility with the column model, the resulting set is not a sample of public administrative discharge data, and we describe it as five case studies rather than as evidence of generality [23]. Nonetheless, the five span distinct regimes: a claims-based source and four hospital reporting or state-level de-identified sources; raw ICD-10 codes and grouper categories; files with and without monetary fields; and four different character encodings and delimiter conventions [2,8,29].
Output column counts include the CNTRY_CD column added during harmonization: Korea and Brazil 14 (CNTRY_CD + 13); Mexico 10 in most vintages (11 in 2010 only) and New York 10; Chile 7. Input column counts vary across annual files within a source (schema drift), which the crosswalk neutralizes by mapping on column name.
2.3. Canonical Column Model and Declarative Crosswalk
All five sources are harmonized to a common column model of 14 canonical fields—a country/source code (CNTRY_CD) plus 13 substantive fields: reference/vintage year (STND_Y), record identifier, sex, age or age group, admission date, form code, specialty/ward code, primary and secondary diagnosis, a treatment-days/length-of-stay measure, visit count, and native and USD monetary amounts. Target names follow the NHIS vocabulary, chosen because the Korean source provides the most complete input schema; the other four sources map their fields onto this set. Adopting NHIS-derived names fixes the target vocabulary only and carries no claim that the other sources share NHIS definitions. Column order is fixed and identical across sources, so harmonized outputs can be vertically concatenated (UNION) via CNTRY_CD; because sources cover different subsets of fields, alignment to the full schema uses a name-based reindex step that inserts missing values where a source does not provide a field.
Canonical field names are stable technical slots, not assertions of semantic equivalence. A single name may carry different source concepts across jurisdictions, and the framework does not resolve those differences. Each field is therefore assigned a comparability class stating how far cross-source pooling is supported: C1 for fields carrying the same concept, unit and coding system in every source producing them; C2 for fields carrying the same concept at a different granularity, unit or anchor, where pooling requires an explicit user-side transformation that the declaration names; and C3 for source-specific proxies, where the shared name indicates structural position only and pooling is not supported. Because a class is a property of the pair of sources being combined rather than of the column alone, it is evaluated over the sources actually being pooled. The Chilean primary diagnosis is a genuine ICD-10 code and is comparable with Korea, Brazil, and Mexico, and incomparable only with New York. Classes are declared in schema/canonical_fields.json, emitted in a sidecar metadata file alongside every output file, and enforced by the merge helper, which refuses to pool a C3 field across sources unless the caller passes an explicit override.
The secondary diagnosis field illustrates why the distinction matters. The Chilean crosswalk fills it with DIAG2, an external-cause code, because Chile publishes no comorbidity diagnosis; the Mexican crosswalk excludes the Mexican external-cause field and fills the same slot with a genuine second diagnosis. Both decisions are deliberate and documented, and both produce values under one column name that must not be pooled. Assigning the field to class C3 records that constraint in the output itself rather than leaving it to a footnote.
Each source’s harmonization is encoded as a declarative crosswalk (crosswalk/<source>.json) executed by a shared engine rather than as a per-source script [22,36]. For every source variable used by a crosswalk, its semantic interpretation was verified against the original provider’s data dictionary, record layout, descriptor, or technical specification; the complete variable-level provenance, including vintage-specific documentation, is reported in Supplementary Table S8. The crosswalk, together with auxiliary artifacts—a single non-trivial currency-conversion asset for Korea (assets/kr_krw.json), based on the annual KRW/USD FRED AEXKOUS series [37], an age-group dictionary, and per-file pre-steps—is versioned and published with a persistent identifier, making it the authoritative executable specification of the transformation from source files to harmonized data. No exchange rate conversion is applied to Mexico or Chile; Brazil retains the provider-supplied US_TOT field, while New York uses an identity factor of 1.0 because the source currency is already USD. Operations run in the fixed sequence rename → transform → convert → select → order. Names are unified before values are transformed, derived columns (the constant CNTRY_CD and the USD cost field) are created before selection, the selection whitelists columns to the model, and canonical ordering standardizes the output. The rules are idempotent—each rename list includes the canonical name itself and each transformation targets only the un-normalized form of a value—so re-running the pipeline on already-harmonized data yields no change, a property that supports reproducibility and is tested directly. The shared reader ingests files in chunks and is resilient to malformed rows. Each file is first scanned for field-count anomalies in a single tokenizing pass, and only files proven uniform are handed to the fast parser. A row whose field count differs from the header is never realigned. Rows with a trailing run of empty fields are trimmed to the header width, which cannot change the column any retained value falls into; every other deviating row is written to a quarantine file with its line number, a reason code, and its observed and expected field counts, and is excluded from the output. Row ledgers reconcile provider lines, parsed records, repaired rows, quarantined rows, and output records for every file. The full pipeline is summarized in Figure 1.
Figure 1.
Harmonization pipeline. Five sources enter a shared reader, followed by the fixed crosswalk operation chain (rename, transform, convert, select, order) with auxiliary artifacts, the canonical model, and assembly into the aggregate table.
2.4. Crosswalk Engine Architecture and Reproducibility Properties
The harmonization engine was designed as a shared execution layer independent of any specific data source. Jurisdiction-specific mapping logic is stored in a declarative crosswalk/<source>.json file, while the execution code remains shared across all sources. This separation reduces the risk of incomparable, one-off ETL scripts and allows the transformation rules to be audited without needing to analyze the full program code.
Each pipeline run can be described as a deterministic sequence of operations: reading the source file in chunks, applying file-specific pre-steps, normalizing column names, transforming values, computing derived columns, selecting canonical fields, ordering columns, and writing the output together with validation metadata. The idempotency property means that re-running the same rules on an already-harmonized file does not change the result. In this work, it is tested by comparing checksums after re-executing the pipeline.
The framework therefore has four core technical properties: deterministic transformation, separation of mapping rules from the execution engine, reader resilience to common structural defects, and auditability of information loss. Together, these properties support reproducible and transparent harmonization of heterogeneous administrative health data.
2.5. Validation Protocol and Information-Loss Methodology
Validation does not assess the clinical plausibility of the source data; it verifies that the pipeline produces a resource conforming to the declared model, is complete within the declared scope, and is reproducible. Four dimensions, consistent with the data quality literature [10,11], were assessed programmatically at file, source, and vintage levels: (i) schema conformance and internal consistency, including value-domain and completeness checks, plausibility checks, and character-encoding stability; (ii) comparison against an independent aggregate published by the provider, carried out for New York only; (iii) analytical fitness, demonstrated through a tracer-condition query. The fourth dimension is an explicit information-loss map. It records, for the transition from raw files to the canonical model, record loss, unavailable files, suspected truncations, intentionally excluded out-of-model columns, structurally absent fields, and reduced semantic resolution [25,29]. All validation scripts are part of the published repository, and results are reported per source, vintage, and input file.
Schema conformance is assessed at two levels, reported separately because a file may satisfy the first and not the second by design. Source-profile conformance is evaluated against the baseline output profile defined for each source, including the declared field set, canonical order, data types, nullability, and permitted coding systems. Vintage-specific departures from that baseline are classified separately as provider-side schema drift and documented in Supplementary Table S6. Full canonical conformance as delivered requires all 14 canonical fields to be present before optional reindexing. The optional reindex step can materialize structurally absent fields as explicit null columns when a rectangular schema is required, but it does not change the reported as-delivered conformance result. The baseline profiles, permitted domains, units, and vintage-specific field availability are declared in schema/canonical_fields.json and reproduced in Supplementary Tables S4 and S6.
Value-domain conformance is computed over cells defined as a field within a source and vintage. A cell is assessable when the source produces that field in that vintage and when a permitted domain is declared for that field. Fields for which no authoritative code list is available to us, namely the record identifier, the form code, and the department code, carry no declared domain: inventing one would appeal to a standard we cannot cite. Values in those fields are counted in a separate category and excluded from the denominator rather than counted as conforming. This exclusion covers 205 cells and 1,522,653,850 values, and leaves 864 assessable cells. Within a cell, conformance is the count of valid values divided by the count of valid plus invalid values. Four further categories of residual value are counted separately and appear in neither term: missingness, source-coded unknown values, values withheld at source, and category-level truncated prefixes. Two summaries are given throughout: a record-weighted mean over assessable cells and an unweighted mean over cells, because a single percentage can otherwise be dominated by the largest files.
The external comparison is deliberately narrow, and the rule governing its scope is stated before the result. A comparison of this kind is informative only where the provider publishes an aggregate derived from the same file that we process, because only then does a discrepancy indicate the behavior of the pipeline rather than a difference of definition. New York is the only source that meets this condition: the state publishes a summary of the same inpatient discharge file, giving discharge counts and average length of stay. The other four sources publish aggregates compiled on a different basis. Brazil counts by billing competence period, Korea by the date a claim is settled after review, and Chile and Mexico through system-level tabulations whose institutional scope is not identical to the record-level release. A discrepancy against those aggregates would measure the difference between two definitions, which is not the property under test. Practical access also differs: several of these aggregates are exposed only through interactive online tabulators rather than as downloadable series, which limits reproducibility of the comparison itself.
3. Results
3.1. Scale and Coverage
The harmonized resource comprises 99 annual files totaling 561,966,231 harmonized records across the five sources and the years 2001–2025 (Table 2). Coverage is uneven by design: sources span 16 to 25 annual files, and not every source covers every year. Two coverage facts are consequential for reuse and are treated as results of the barrier analysis rather than incidental notes: the Korean 2024 file is listed by the provider but is not downloadable and is therefore excluded, and the Korean 2020 and 2022 files are flagged for suspected source-file truncation (see Section 3.3).
Table 2.
Record counts (discharges) by year and source.
Counts in Table 2 are per-file output row counts taken from the released output files. The Mexican column has been corrected against those files. The values reported earlier came from an earlier processing run, and the differences fall almost entirely in the 2016 vintage, whose one-time pre-step is not idempotent, and in the 2011 and 2012 vintages, of which 204 short rows were previously padded and accepted and are now quarantined. Row counts and record counts differ by one header line per file, and the harmonized record total across the 99 files is 561,966,231. The per-file row ledger published with the release reconciles provider lines, parsed records, repaired rows, quarantined rows, and output records, and is the authoritative reconciliation. Korea 2020 and 2022 are flagged separately as suspected source-file truncations. Chile 2022 is not classified as structurally defective: the released row ledger shows 1,597,118 input and output records with zero quarantined rows. The Korean files remain part of the observed harmonized output total, but their counts must not be interpreted as complete provider/population counts.
3.2. Barrier Taxonomy Instantiated
Table 3 maps the taxonomy from Section 2.1 onto the five sources, recording the concrete manifestation of each barrier and the mechanism by which it is detected or handled. Structural and encoding barriers (class B) were ubiquitous and were absorbed by name-based mapping and per-file pre-steps. Integrity barriers (class C) were the most analytically significant, since they are invisible to a naive read and are revealed only by validation. Semantic barriers (class D) are irreducible and are therefore documented in the loss map rather than being superficially resolved [30,38,39].
Table 3.
Taxonomy of access and quality barriers instantiated on the five sources.
3.3. Data Quality Metrics
Programmatic validation across the 99 harmonized files returned source-profile conformance for 82 of the 99 files and full canonical conformance for 39, full crosswalk idempotency (identical checksums after re-running the crosswalk on its own output), 99.9933% of values within permitted domains when weighted by records and 99.9729% when weighted by cell, and clean character encoding on 97 of 99 files (Table 4). Range-plausibility and continuity checks surfaced the integrity barriers of class C directly. The Korean 2020 and 2022 files contain exactly 1,000,000 and 1,048,576 records; the latter equals 220, the spreadsheet row limit including the header line, and the former is exactly 106. Both counts are consistent with truncation at export, and both files are flagged as suspected source-file truncations that should not enter trend analyses without resolution. A row count does not establish the mechanism. Under the assumption that an undamaged vintage would fall between its neighbors, the missing records lie between 10,924,859 and 12,178,346 for 2020 and between 10,876,283 and 12,782,807 for 2022, so between 21.8 and 25.0 million in total, with a point estimate of 23.4 million. Evidence that would settle the mechanism, namely provider metadata, a stated file size, a download history, or an independent copy of the file, is not in our possession. For the 2022 vintage, a second estimate follows from an unrelated assumption. The Korean provider publishes an annual count of settled inpatient claims [40], against which the harmonized files represent 72.7% in 2021 and 76.4% in 2023. Applying that range to the published 2022 count gives an expected 12.6 to 13.3 million records, and, therefore, 11.6 to 12.2 million missing, which falls inside the interval derived above from the neighboring vintages. One estimate rests on continuity of our own series and the other on the stability of its ratio to a provider aggregate, so their agreement in order of magnitude is corroboration of scale rather than a measurement: the ratio is not constant, the aggregate is compiled on a settlement rather than an admission basis, and no comparable figure is available for the 2020 vintage. The same comparison shows that the harmonized files cover a subset of the settled inpatient claims reported by the provider, and the scope of that subset is not documented in the extract available to us. This is the barrier analysis functioning as intended: defects that would silently bias downstream results are detected at the harmonization stage. A separate integrity anomaly—near-total absence of the Mexican specialty/ward field in the 2015 vintage (completeness 0.0028 versus approximately 0.99 in adjacent years)—is documented as a source-level anomaly pending clarification.
Table 4.
Summary of internal consistency and schema conformance checks.
Residual value-domain deviations do not indicate a global data quality error; they concentrate in three fields, and each is attributable. Conformance is 99.9376% for the secondary diagnosis, 99.9552% for age, and 99.9999% for sex; every other assessable field is at 100.0000%. The largest deviations are Chilean age labels that the normalization rule does not match, Brazilian secondary diagnoses coded as zero in the 2006 vintage, and a small number of Korean secondary diagnosis values that are not ICD-10 codes at all. We note that these figures replace an earlier calculation. The domain module declared rules for five fields only and returned a passing verdict for every other field, so 617 of the cells assessed at that time could not fail. Correcting the module lowered the reported conformance and, more importantly, made the metric capable of detecting the defect described below. The framework deliberately does not automatically remove all atypical values, since some of them are informative for the end user because they indicate source-level gaps, local sentinel codes, or fields not present in a given system. In this sense, validation serves a diagnostic function rather than a purely filtering one.
Internal checks cannot detect a field mapped to the wrong concept, so we added a record-level audit that returns to the provider file and re-derives every canonical field from the rule written in the source documentation, without invoking the crosswalk engine. The audit covers 3500 field-level checks across the five sources. The Mexican sample matched the documentation on every check. Of the initial discrepancies, all but two were audit rules stated more narrowly than the crosswalk, where a documented recoding had been transcribed as a direct copy. The remaining two located a substantive finding. New York publishes monetary amounts with a variable number of decimal digits, and the conversion rule addressed the two-digit form, so amounts carrying a single digit remained non-numeric and their converted value was empty. This affected 834,360 records, 2.22% of the New York corpus, concentrated in the 2016, 2018, and 2019 vintages. The crosswalk was raised to version 1.1, New York was reprocessed, and the corrected files carry no such records. The cohort, the length-of-stay statistics, the completeness figures, and the record counts are unchanged, since only the two monetary columns were involved. We report the finding because it is what the audit was designed to surface: schema conformance, idempotency, and the value-domain metric are all insensitive to a value that is well formed for its column but wrong for its concept.
The 17 files that depart from the source-level baseline do so because of provider-side schema drift, not because of a defect in the pipeline. The Mexican source stops publishing its secondary diagnosis field from the 2011 vintage onward, which accounts for fifteen files, and the Brazilian source does not publish its daily count field in 2006 or 2007, which accounts for two. Both absences are vintage-level and are recorded in the field availability matrix. Structurally absent fields, meaning fields a source does not publish at all, account for the remainder of the gap to the full canonical schema: seven fields across all 25 Chilean vintages, four across 16 New York vintages, three across 16 Mexican vintages, and one across 2 Brazilian vintages. Drift also affects the content of a column and not only its presence. The Mexican admission date column appears in five notations across vintages, the New York monetary column in four, the New York diagnosis column changes grouper family at the 2017 to 2018 boundary, and the Chilean age labels take at least four forms. Full canonical conformance is a different and weaker property as delivered: 39 files carry all 14 fields without further processing, and the remaining 60 do not because their source does not publish the missing fields at all. The single exception that is not by design is the Korean 2020 file, which lacks KEY_SEQ in the released extract, consistent with the truncation already flagged for that vintage.
Temporal consistency is assessable only on the 58 files that carry a daily admission date, namely 22 Korean, 20 Brazilian, and 16 Mexican files; Chile and New York publish year-level information only and are excluded from the denominator by definition rather than for want of data. A record is temporally consistent when the year component of RECU_FR_DT equals STND_Y. Measured at record level, 96.47% of the 483,885,204 assessable records are consistent: 100% in Korea, 93.13% in Brazil, and 98.60% in Mexico. The deviations are not confined to individual vintages, and they are not errors. In Brazil, they occur in every vintage because ANO_CMPT denotes the billing competence period rather than the admission year, so admissions late in one year are billed in the next. In Mexico, the vintage is the discharge year, so an admission in December preceding a January discharge is correctly dated to the previous year. Almost all deviating records fall in the year preceding the vintage, which is what both mechanisms predict. Two residual anomalies are reported separately: 3926 Mexican 2017 records dated to the following year, and 19 records across the Mexican 2011 and 2012 files whose dates cannot be parsed.
Character encoding was assessed against three criteria rather than by successful decoding, because Latin-1 decodes any byte sequence without error: absence of replacement characters; absence of byte sequences characteristic of UTF-8 text read as Latin-1; and agreement between the non-ASCII character census and what the source language can produce. Two Chilean files, 2024 and 2025, fail the second criterion. Their age labels were damaged upstream, before the files reached us, and reading them as Latin-1 preserved the damage silently. The damaged labels are also the reason the age normalization rule does not match in those two vintages, which is where the largest residual value-domain deviations sit.
3.4. Information-Loss Map
Harmonization is row-preserving except where a source file is structurally defective, in which case the loss is quantified per file rather than absorbed into a general claim. Harmonization maps normalize and reorder columns without removing records, so output row counts match input counts except for rows that cannot be parsed unambiguously, which are written to quarantine with a reason code rather than discarded. Across the 99 files, 378 rows are quarantined, all of them in the Mexican 2011 and 2012 vintages, which is 0.0061% and 0.0073% of those 2 provider files and none of the remaining 97. Every quarantined row is isolated, and the damaged rows are spread evenly through both files, which rules out a corrupted export segment and points to a defect dependent on row content, most plausibly an unquoted separator inside a text field. A column-shift test reads each canonical column both from the start of the row and from its distance to the end, so that the segment validating from the left and the segment validating from the right bracket the damage. It shows that 339 of the 378 rows carry every canonical column intact, 25 carry at least 1 distorted canonical column, and 14 collapsed to a single field and are unrecoverable. The pipeline reconstructs none of them; the test states whether reconstruction would be warranted, and does not substitute for it. Row losses are now reported from the per-file ledger rather than from parser logs. In the released files, the Chilean 2022 vintage parses without loss, with 1,597,118 rows on input and the same number on output, and the figure given for that file in the submitted version is superseded by the ledger. The loss map (Table 5) makes the exceptions explicit and quantified. The largest row-level omission is the 378 quarantined rows classified above. Suspected truncations (Korea 2020, 2022) and one unavailable file (Korea 2024) account for the principal record-level gaps. Column-level and information-level losses—out-of-model fields dropped at selection, fields structurally absent from some sources, non-standardized sentinels, and reduced semantic resolution (grouper categories, age bands)—are recorded without record loss. Making these losses explicit is itself a contribution; it converts silent, undocumented attrition into an auditable artifact that downstream users can reason about.
Table 5.
Information-loss map for the harmonization pipeline.
3.5. Analytical Feasibility: Ischemic Stroke (I63)
To confirm that the harmonized fields support a genuine research query, we extracted a cohort of discharges with a principal diagnosis of ischemic stroke, defined by ICD-10 codes with the prefix I63, from the primary-diagnosis field across the four sources that retain raw ICD-10 codes (Korea, Brazil, Mexico, Chile) [41,42]. Diagnosis values were normalized—spaces and periods stripped, upper-cased—before prefix matching against the pattern ^I63. Ischemic stroke is an established marker condition in administrative data comparisons, including EuroHOPE [17]. This is a technical face-validity check, not an epidemiological analysis: cross-jurisdiction comparison requiring population denominators, age standardization, and clinical validation is out of scope. New York was excluded from the strict definition because its diagnoses are grouper categories, not raw ICD-10. A cerebrovascular group category is reported separately as an approximation. That approximation is not constant over time. From 2018, the CCSR category CIR020, Cerebral infarction, is consistent with I63, but the CCS category 109 used from 2009 to 2017 is Acute cerebrovascular disease and also covers intracranial hemorrhage and acute but ill-defined cerebrovascular accidents. HCUP maps CCS 109 onto four distinct CCSR categories, one of which is CIR020 [43,44]. The two periods are, therefore, two different clinical definitions and are reported as separate rows. The demonstration succeeds in its stated criterion—technically consistent extractability of the I63 cohort across all four ICD-10 sources with no impossible values in the core descriptive fields—showing that the framework yields a consistently defined cohort on the four sources that retain raw ICD-10 codes [39,42]. The case definition is declared per source and vintage in schema/case_definitions.json and is read from there by the analysis, rather than being carried in analysis code.
To show that harmonization enables not only cohort identification but also further analysis on a common schema, basic descriptive measures available across multiple sources were calculated for the I63 cohort, including discharge counts, sex completeness, age or age-group completeness, and length-of-stay distribution (Table 6). The analysis was performed using the same query across all sources, retaining raw ICD-10 codes, without writing separate scripts for individual jurisdictions. The goal was to assess the technical portability of the query, not to compare incidence or quality of care across countries.
Table 6.
Descriptive summary of the ischemic stroke (I63) cohort across the four sources retaining raw ICD-10 codes; New York is reported separately as a grouper-based approximation (see note).
To show that the framework is not specific to one clinical concept, the analysis was repeated for fracture of the proximal femur, ICD-10 S72.0 to S72.2. The condition was chosen because its coding differs from ischaemic stroke in three respects, each of which exercises a part of the mechanism that the stroke query never reaches. The concept spans several three-character categories and therefore cannot be expressed as a prefix. The New York grouper requires an explicit multi-code list rather than a single category, and the condition is identifiable only at four characters, so records coded at three characters cannot be assigned either way. Grouper category assignments were read from the description columns published alongside the codes in the source files [43,44], covering 262 CCS and 478 CCSR categories, rather than from external knowledge, so that each assignment is traceable to the provider’s own dictionary.
The strict ICD-10 cohort comprises 1,471,168 records across Korea, Brazil, Mexico, and Chile. A further 13,570 records carry the three-character code S72 with no fourth character, which states that a femoral fracture occurred and nothing beyond that. These are neither included nor excluded in evidence, so they are reported separately as unassignable rather than absorbed into the denominator. The question does not arise for I63, where the three-character category is itself the concept, and the granularity threshold is declared with the case definition rather than applied silently.
For New York, the grouper change at the 2018 vintage again prevents pooling, but for a different reason than in the stroke query. CCS 226 and CCSR INJ006 describe the same clinical breadth, yet CCSR adds an encounter-type distinction that CCS did not encode; 10,510 subsequent-encounter records under INJ043 sit alongside 116,638 initial-encounter records in 2018 to 2024, whereas the 151,364 records under CCS 226 in 2009 to 2017 contain both. Combining the series without that distinction would introduce a level shift of roughly 9% at the 2018 boundary attributable to the classification tool rather than to incidence. In the stroke query, the two eras differed in clinical breadth. Here, the breadth is the same and the unit of observation differs, so the second condition exposes a class of incompatibility that the first does not contain. The reporting rules are declared with the case definition and enforced by the analysis: a source whose coding system changes between vintages is marked as not poolable, and any combined figure is written to a field labeled as not for quotation.
The case for reporting a median rather than a mean recurs independently on this condition. The Korean median is one day with an interquartile range of 1 to 14 and a mean of 8.12, against an interquartile range of 1 to 1 for the stroke cohort in the same source. The distribution is visibly bimodal, and in both conditions the mean alone describes a length of stay that the data do not contain. The corresponding descriptive results are summarized in Table 7.
Table 7.
Descriptive summary of the proximal femoral fracture (S72.0–S72.2) cohort across the four sources retaining raw ICD-10 codes; New York is reported separately as a grouper-based approximation (see note). Reported in parallel with Table 6.
3.6. External Comparison with a Provider Published Aggregate
The external comparison covers the 16 New York vintages and is reported in Table 8, against the summary published by the provider [46]. Counts agree closely across the whole period. The difference is below 0.06% in fifteen of sixteen vintages, and five consecutive vintages from 2012 to 2016, covering 12.0 million records, agree exactly. Over the full period, the harmonized files carry 37,557,456 records against 37,541,685 in the published summary, a difference of 0.04%. The agreement is a check on the pipeline rather than on the source. It establishes that harmonization neither loses nor duplicates records at a scale that would affect analysis, on the one source where that can be tested against the provider directly.
Table 8.
Harmonized record counts for New York against the summary of the same file published by the provider. A positive difference means the harmonized files carry more records. Counts are harmonized output records, excluding the header line of each file.
One vintage does not follow the pattern. The 2017 files differ by 18,487 records, or 0.80%, against differences of zero or a few hundred in the neighboring years. The magnitude is two orders larger than the residual differences elsewhere, so it is not attributable to rounding or to a revision of a small number of cells, and we report it as unresolved rather than offer an explanation the data do not support. We note that 2017 is also the last vintage before the grouper family changes, although we have no evidence connecting the two.
The published summary also reports an average length of stay, which provides an independent check on the treatment of threshold coding described in Section 3.5. Counting the threshold value at its lower bound, the summary gives a record-weighted mean of between 5.43 and 5.92 days depending on vintage. Excluding the threshold-coded records, as our statistics do, gives between 5.30 and 5.72 days. The direction and the magnitude of the difference match what exclusion of the right tail predicts, so the bias we describe is measured against provider-published values rather than argued from first principles.
3.7. Computational Performance
The harmonization run reported here was executed on a single workstation (Apple M4, 10 cores, 26 GB of memory, macOS 15) under Python 3.13.13 with pandas 2.3.3, pyarrow 23.0.1, and numpy 2.4.4, reading in chunks of 500,000 rows. Across the five sources, the pipeline scanned and harmonized 561,966,231 records from 182.7 GB of input in approximately 1.5 h of scanning and processing combined, at between 104,000 and 278,000 records per second depending on row width. Peak resident memory over the whole run was 2473 MB, against input files of several gigabytes, because the pipeline reads and writes one chunk at a time. Memory is a function of the chunk size and the row width, not of the file size. Output files are written to a temporary file and moved into place only after the last chunk, so an interrupted run leaves the previous output intact rather than a partial file. Per-file timings, peak memory, and output sizes are published in the row ledger.
4. Discussion
As the five-source evaluation demonstrates, in the secondary analysis of large-scale administrative health data, the main constraints on reuse are not data volume alone, but access, data quality, interoperability, and the transparency of transformation. The proposed framework addresses these constraints by combining a structured barrier taxonomy, a declarative harmonization pipeline, automated validation, and an explicit information-loss map. The barrier taxonomy (Table 3) transforms a diffuse set of practical obstacles into a reusable analytical structure. The quality metrics (Table 4) show that a lightweight pipeline can achieve conformance to declared source profiles and crosswalk idempotency at the scale of more than half a billion records, and the information-loss map (Table 5) demonstrates that data fidelity can be documented rather than assumed. Importantly, the validation process not only confirms technical conformance but also detects source-level defects, including truncated Korean files. The revised row audit identified 378 structurally malformed records requiring quarantine, all in the Mexican 2011 and 2012 vintages. By contrast, the Chile 2022 file, which had been flagged in the submitted parser logs, reconciles completely in the released row ledger and is not treated as structurally defective.
Implementation effort was measured rather than asserted, and the result does not favor the declarative form on the metric usually cited for it. A standalone script that uses no part of the framework and reproduces the harmonized output byte for byte requires 47 effective lines for Chile and 53 for Mexico, against 151 and 186 lines of declarative crosswalk, respectively; the shared execution engine adds 473 lines, paid once across the five sources. The declarative form is, therefore, three to three and a half times longer to express, and we make no claim of reduced implementation effort on that basis.
What the declarative form changes is the kind of artifact rather than its size. A rule expressed as data can be validated against a schema, versioned with a changelog that records its scope of effect, compared between releases, and reviewed without being executed. The New York charge-parsing rule was corrected because it could be read. The expression matched exactly two decimal digits, which is apparent in the declaration and far less so in a line of procedural code that behaves correctly on almost every input. The cost that is reduced is, therefore, the cost of maintenance and audit rather than the cost of first implementation, and it accrues per source over time rather than at the point of writing. By the same reasoning, the framework sits below a comprehensive common data model rather than beside it. It answers what was done to a given column and how many rows disappeared on the way, which an extract–transform–load process targeting OMOP assumes to be settled before it begins.
Table 9 positions the framework against three families of tooling with which it is easily confused. The distinction that matters is what each family declares. A comprehensive common data model declares the target model and its vocabularies, and leaves the transformation to an extract–transform–load process written per source. Data package specifications declare a schema and its types, but perform no transformation. Pipeline expectation frameworks declare what values should look like, and again transform nothing. This framework declares the transformation itself, executes it through one engine for every source, and states in the same declaration which fields may be pooled across which sources.
Table 9.
Positioning of the framework against adjacent families of tooling. The comparison is by what each family declares and executes, not by feature count.
From an applied data science perspective, the main contribution is the conversion of harmonization from a set of local, source-specific scripts into an auditable computational artifact. In many secondary analyses based on administrative data, transformation decisions remain embedded in one-off code, provider documentation, or the analyst’s local knowledge. In the proposed framework, these decisions are moved into explicit, versioned crosswalks and executed by a shared engine according to a fixed sequence of operations. This design provides four technical advantages, including deterministic transformation, separation of source-specific mapping rules from the execution engine, resilience to common structural defects in input files, and traceable documentation of information loss. As a result, users can reproduce not only the harmonized output but also the path by which the output was produced.
The framework is deliberately complementary to comprehensive common data models such as OMOP. Where the analytical goal is federated, vocabulary-rich, multi-domain analysis, a full ETL to OMOP remains appropriate. However, a complete OMOP transformation is resource-intensive and depends heavily on source-level mapping of concepts, codes, and file structures. For targeted and reproducible reuse of publicly available discharge data, a lightweight intermediate layer may therefore be useful. It can support diagnosis-based cohort extraction, descriptive trend analysis, and length-of-stay summaries while preserving transparency about what was transformed, reduced, or lost. It may also serve as a preparatory layer for later export to OMOP or another comprehensive CDM.
The findings should nevertheless be interpreted within several limitations. First, coverage is uneven across sources and years, so harmonized files must be joined by column name or reindexed to the full schema before pooled analysis. Second, the model operates at the discharge level and does not contain a stable patient identifier; therefore, rehospitalizations, longitudinal trajectories, and patient-level care pathways cannot be reconstructed. Third, the included sources cover different segments of their health systems. For example, the Mexican SAEH captures only Secretaría de Salud facilities, while New York represents a single US state. As a result, raw discharge counts are not directly comparable across jurisdictions without population denominators, age standardization, institutional coverage assessment, and clinical validation of case definitions. Fourth, diagnostic coding systems and grouper categories are not semantically interchangeable across sources or vintages. Four sources retain raw ICD-10 codes, whereas New York publishes AHRQ grouper categories and spans two classification regimes, CCS in 2009–2017 and CCSR in 2018–2024. The 2017/2018 transition cannot be treated as a simple relabeling of equivalent categories. As demonstrated by the marker-condition analyses, its effect is condition-dependent. For ischemic stroke, CCS 109 and CCSR CIR020 differ in clinical breadth, whereas for proximal femoral fracture the later CCSR representation introduces an encounter-type distinction absent from the earlier CCS category. Consequently, diagnosis-based analyses involving New York require vintage-specific case definitions, and estimates spanning the CCS and CCSR periods should not be pooled unless equivalence has been demonstrated explicitly. FORM_CD, DSBJT_CD, MAIN_SICK, and SUB_SICK carry a different source concept in at least one jurisdiction and are declared class C3; the framework does not support pooling them across sources without an explicit override.
A further limitation is upstream rather than methodological. Chile applies a record-level suppression marker to year, sex, and age on part of its records, covering 3,980,654 values, so completeness of those fields for Chile cannot be read as knowledge of the underlying values. A further limitation concerns the audit trail rather than the outputs. The Korean files available to us and the Brazilian 2006 file were retained locally in the canonical column layout rather than as first-hand provider exports; this reflects how those copies were kept for this study and not a property of the sources themselves. For those files, the crosswalk performs only an age-group relabeling, so the record audit can confirm value preservation but cannot re-verify the mapping against an original export; the currency conversion for Korea is documented by its rate source but cannot be recomputed from the inputs available to us. The Korean 2020 file lacks the record identifier at input as well as at output. Finally, no independent replication of a crosswalk by a second analyst has been carried out; a second test written by the same analyst against the same documentation reproduces that analyst’s reading of it, and we identify independent replication as future work rather than claim it here. What was verified is weaker and is described as such. The declarative crosswalk is sufficient to reconstruct the transformation, demonstrated by a framework-free reimplementation that reproduces the output byte for byte for two sources, and the field-level audit was written from the provider documentation rather than from the crosswalk. A separate limitation concerns the source data rather than the framework. Length-of-stay reaches 12,201 days in Mexico and 3375 in Chile, values that pass validation as non-negative integers because we hold no basis on which to declare an upper bound, and that are implausible as individual episodes of care; the extreme case is a single Chilean record carrying 73,049 days. External comparison against provider-published aggregates was carried out for one source only. For Brazil, Chile, and Mexico, the provider files remain publicly available, so full reproduction from the source is possible directly, and an aggregate comparison would chiefly measure differences of definition; for Korea, reproduction from the provider file is no longer possible. Finally, cost fields are derived through different pathways or are absent in some sources, and sentinel values remain non-standardized.
These limitations are not failures of the framework but properties of the underlying data that the framework makes visible. The harmonization layer does not eliminate systemic differences between jurisdictions and does not produce ready-made comparative epidemiological indicators. Its contribution is instead technical and methodological. It provides a reproducible, transparent, and loss-aware bridge between heterogeneous public discharge microdata and subsequent analyses. By making access barriers, structural defects, semantic reductions, and information loss explicit, the framework supports safer secondary use of administrative health data and offers a template that has been exercised on five sources and remains to be tested elsewhere.
Three lines of further work follow directly from what the evaluation exposed. The first is the scope of the model itself. Four of the five sources publish an outcome field that the canonical model does not retain. Brazil records a death indicator, an ICD code of death, and a reason for discharge; Chile records a discharge condition distinguishing alive from deceased; Mexico records a discharge motive; and New York records a patient disposition that includes death. Korea declares no such column among its excluded fields. This is a gap in the scope of the model rather than in the data; it is recorded in the information-loss map, and mortality is the first candidate for extension because it is the outcome most often required of discharge data and because four sources already carry it. Extending the model to it would require a comparability class of its own, since the four source concepts are a binary indicator, a discharge condition, a discharge motive, and a disposition destination.
The second is migration to a comprehensive common data model, and the comparability classes make its cost estimable rather than merely anticipated. Of the 14 canonical fields, 2 are class C1 and account for 10 of the 56 field-by-source pairs: these move to a target model without any semantic decision. Four fields are class C2 and account for 27 pairs: each needs one stated transformation, such as an age-band reconciliation or a date-anchor alignment, and the transformation is the same for every source producing the field. Eight fields are class C3 and account for 19 pairs: these require a separate decision for each pair of sources, because the underlying concepts differ rather than the encoding. The work of migration is, therefore, concentrated in the 19 C3 pairs, and the released declaration enumerates them by field and source pair together with the two source concepts involved. The main obstacles are the ones the classes already name: a grouper-based diagnosis field that no vocabulary mapping can convert into a code; monetary fields whose economic concepts differ; and an external-cause code occupying a secondary-diagnosis slot in one source.
The third concerns what a researcher would have to add to move from harmonized output to a publishable comparative study, which the present work deliberately does not attempt. Four steps are needed beyond the harmonization layer. Population denominators and age standardization are required before any rate can be compared, and neither is derivable from discharge records alone. The case definition has to be validated clinically in each jurisdiction rather than assumed to transfer, since an identical code list does not guarantee identical ascertainment. Every field entering the analysis has to be checked against its comparability class, and any field in class C3 either excluded or handled per source pair. Finally, the unit of observation has to be reconciled, because a claim, an authorization, and a discharge are not the same event, and the differences are documented per source in the released declaration. The framework is intended to make these four steps explicit and auditable, not to remove them.
5. Conclusions
This study characterized recurring access, quality, interoperability, and information-loss barriers that limit the reuse of large-scale public administrative health data. We presented and evaluated a reproducible, loss-aware harmonization framework for public hospital discharge data, based on a lightweight 14-field canonical model, declarative JSON crosswalks, a shared execution engine, schema validation, idempotency testing, value-domain checks, and an explicit information-loss map. Applied to five publicly available record-level discharge datasets from three continents, covering 561,966,231 harmonized records from 2001 to 2025, the framework achieved conformance to the declared source profiles for 82 of 99 files, crosswalk idempotency across all 99, value-domain conformance of 99.99% under an explicitly stated aggregation, and detection of three classes of source-level integrity defects. A tracer-condition query for ischemic stroke showed that a common analytical definition executes consistently across the sources retaining raw ICD-10 codes.
The main implication is that, in the secondary analysis of heterogeneous administrative health data, scale alone is insufficient. Responsible reuse requires transparent transformation rules, reproducible execution, systematic quality checks, and explicit documentation of what information is preserved, reduced, or lost during harmonization. The proposed framework provides a lightweight and auditable technical bridge between raw public microdata and subsequent comparative analyses or more comprehensive common data models. Future work should include export to OMOP or other CDMs, extension to additional jurisdictions and clinical case definitions, and substantive epidemiological studies that incorporate population denominators, standardization, and validation of clinical comparability.
Supplementary Materials
The following supporting information can be downloaded at https://www.mdpi.com/article/10.3390/app16178454/s1: Additional File 1: technical documentation of the source systems, canonical field model, source-to-canonical mappings, crosswalk execution model, preprocessing notes, value-normalization rules, validation protocol, completeness matrix, known anomalies, and reproducibility guidance. Additional File 1 contains: Table S1: Source overview, giving the publisher, coverage, file count, encoding and delimiter of each of the five sources; Table S2: Raw data source access records, listing the provider portal, access route and retrieval conditions for each source; Table S3: Release package structure, as released, mapping each released artifact to its path in the deposit; Table S4: Canonical fields and normalization notes, with the definition, output format, normalization rule and comparability class of each of the 14 canonical fields; Table S5: Semantic profile of the canonical fields whose source concept is not constant across jurisdictions, stating the provider-defined concept, coding system or unit, and the pairs of sources over which pooling is supported; Table S6: Field availability matrix, giving per-source and per-vintage availability of each canonical field, with footnotes for proxy mappings and vintage-level absences; Table S7: Source-to-canonical mapping, listing every source variable, its provider-defined meaning and the canonical field it populates; Table S8: Authoritative provider documentation and variable-level provenance for the source fields used in the crosswalks; Table S9: Pipeline stages, describing the read, rename, transform, convert, select, order and optional reindex stages with worked examples; Table S10: Mexico filename and container normalization, documenting the vintage-specific file naming and packaging variants; Table S11: Value-level normalization rules, giving the rule applied to each canonical field and its source-specific exceptions; Table S12: Validation protocol, defining each check, its level of assessment and its acceptance criterion; Table S13: Data completeness matrix, reporting per-source and per-vintage completeness for every canonical field; Table S14: Information-loss map, cataloguing each loss mechanism with its affected sources, level and measured scale.
Author Contributions
Conceptualization, K.W. and J.K.; methodology, K.W. and J.K.; software, K.W.; validation, K.W.; formal analysis, K.W. and J.K.; data curation, K.W.; visualization, K.W.; writing—original draft preparation, K.W. and J.K.; writing—review and editing, K.W. and J.K.; supervision, J.K. All authors have read and agreed to the published version of the manuscript.
Funding
This research received no external funding.
Institutional Review Board Statement
Not applicable. The study used only publicly available, de-identified administrative data and involved no human participants, intervention, or access to identifiable records.
Informed Consent Statement
Not applicable. No individual person’s data are reported in any form.
Data Availability Statement
The code, declarative crosswalks, validation scripts, source documentation, access records, and Supplementary Materials are available in the Zenodo repository at https://doi.org/10.5281/zenodo.21982702 [46]. The harmonized crosswalk dataset is additionally available at https://doi.org/10.5281/zenodo.21919629 [47]. Raw microdata are not redistributed; users receive reproducible access recipes for the original public source files of Brazil, Mexico, Chile, and New York. The Korean dataset has since been withdrawn by its provider and is no longer publicly obtainable, so the deposited harmonized files are the only surviving derivation of that source. Users are also provided with aggregated and synthetic examples sufficient to reproduce the technical validation procedures. The source code and documentation are released under the MIT License; deposited dataset components are made available under the Creative Commons CC0 1.0 waiver. Raw source data remain governed by the licenses and terms of the original providers (NHIS, DATASUS/SIHSUS, DGIS/SSA, DEIS-MINSAL, NY SPARCS).
Conflicts of Interest
The authors declare no conflicts of interest.
References
- Katz, A.; Enns, J.; Wong, S.T.; Williamson, T.; Singer, A.; McGrail, K.; Bakal, J.; Taylor, C.R.; Peterson, S. Challenges Associated with Cross-Jurisdictional Analyses using Administrative Health Data and Primary Care Electronic Medical Records in Canada. Int. J. Popul. Data Sci. 2018, 3, 437. [Google Scholar] [CrossRef] [Scilit][Green Version]
- Finster, M.; Wenzel, M.; Taghizadeh, E. Common data models and data standards for tabular health data: A systematic review. BMC Med. Inform. Decis. Mak. 2025, 25, 422. [Google Scholar] [CrossRef] [Scilit]
- European Parliament; Council of the European Union. Regulation (EU) 2025/327 of 11 February 2025 on the European Health Data Space and amending Directive 2011/24/EU and Regulation (EU) 2024/2847. Off. J. Eur. Union 2025. Available online: https://eur-lex.europa.eu/eli/reg/2025/327/oj (accessed on 17 June 2026).
- Mainor, A.J.; Morden, N.E.; Smith, J.; Tomlin, S.; Skinner, J. ICD-10 coding will challenge researchers: Caution and collaboration may reduce measurement error and improve comparability over time. Med. Care 2019, 57, e42–e46. [Google Scholar]
- Ahmed, N.M.; Nouredanesh, M.; Lix, L.M.; Hamad, A.F. Mapping different versions of the International Classification of Diseases: A scoping review. Int. J. Popul. Data Sci. 2026, 6, 3321. [Google Scholar] [CrossRef] [Scilit]
- Sanusi, R.A.; Yan, L.; Hamad, A.; Ayilara, O.; Vasylkiv, V.; Jozani, M.J.; Banerji, S.; Delaney, J.; Hu, P.; Wall-Wieler, E.; et al. Transitions between versions of the International Classification of Diseases and chronic disease prevalence estimates from administrative health data: A population-based study. BMC Public Health 2022, 22, 701. [Google Scholar] [CrossRef] [Scilit]
- Hsu, M.-C.; Wang, C.; Huang, L.-Y.; Lin, C.-Y.; Lin, F.; Toh, S. Effect of ICD-9-CM to ICD-10-CM coding system transition on identification of common conditions: An interrupted time series analysis. Pharmacoepidemiol. Drug Saf. 2021, 30, 1653–1674. [Google Scholar] [CrossRef] [Scilit]
- Emerson, S.D.; McLinden, T.; Sereda, P.; Yonkman, A.M.; Trigg, J.; Peterson, S.; Hogg, R.S.; Salters, K.; Lima, V.D.; Barrios, R. Secondary use of routinely collected administrative health data for epidemiologic research: Answering research questions using data collected for a different purpose. Int. J. Popul. Data Sci. 2024, 9, 2407. [Google Scholar] [CrossRef] [Scilit]
- Malecki, S.L.; Loffler, A.; Tamming, D.; Dyrby Johansen, N.; Biering-Sørensen, T.; Fralick, M.; Sohail, S.; Shi, J.; Roberts, S.B.; Colacci, M.; et al. Development and external validation of tools for categorizing diagnosis codes in international hospital data. Int. J. Med. Inform. 2024, 189, 105508. [Google Scholar] [CrossRef] [Scilit]
- Lighterness, A.; Adcock, M.; Scanlon, L.A.; Price, G. Data quality-driven improvement in health care: Systematic literature review. J. Med. Internet Res. 2024, 26, e57615. [Google Scholar] [CrossRef] [Scilit]
- Hosseinzadeh, E.; Afkanpour, M.; Momeni, M.; Tabesh, H. Data quality assessment in healthcare, dimensions, methods and tools: A systematic review. BMC Med. Inform. Decis. Mak. 2025, 25, 296. [Google Scholar] [CrossRef] [Scilit]
- Razzaghi, H.; Greenberg, J.; Bailey, L.C. Developing a systematic approach to assessing data quality in secondary use of clinical data based on intended use. Learn. Health Syst. 2021, 6, e10264. [Google Scholar] [CrossRef] [Scilit]
- Declerck, J.; Kalra, D.; Stichele, V.R.; Coorevits, P. Frameworks, Dimensions, Definitions of Aspects, and Assessment Methods for the Appraisal of Quality of Health Data for Secondary Use: Comprehensive Overview of Reviews. JMIR Med. Inform. 2024, 12, e51560. [Google Scholar] [CrossRef] [Scilit]
- Ghalavand, H.; Shirshahi, S.; Rahimi, A.; Zarrinabadi, Z.; Amani, F. Common data quality elements for health information systems: A systematic review. BMC Med. Inform. Decis. Mak. 2024, 24, 243. [Google Scholar] [CrossRef] [Scilit]
- Häkkinen, U.; Iversen, T.; Peltola, M.; Seppälä, T.T.; Malmivaara, A.; Belicza, É.; Fattore, G.; Numerato, D.; Heijink, R.; Medin, E.; et al. Health care performance comparison using a disease-based approach: The EuroHOPE project. Health Policy 2013, 112, 100–109. [Google Scholar] [CrossRef] [Scilit]
- Heijink, R.; Engelfriet, P.; Rehnberg, C.; Kittelsen, S.A.C.; Häkkinen, U. A window on geographic variation in health care: Insights from EuroHOPE. Health Econ. 2015, 24, 164–177. [Google Scholar] [CrossRef] [Scilit]
- Malmivaara, A.; Meretoja, A.; Peltola, M.; Numerato, D.; Heijink, R.; Engelfriet, P.; Wild, S.; Belicza, É.; Bereczki, D.; Medin, E.; et al. Comparing ischaemic stroke in six European countries: The EuroHOPE register study. Eur. J. Neurol. 2015, 22, 284–291. [Google Scholar] [CrossRef] [Scilit]
- Bottle, A.; Middleton, S.; Kalkman, C.J.; Livingston, E.H.; Aylin, P. Global Comparators Project. Global comparators project: International comparison of hospital outcomes using administrative data. Health Serv. Res. 2013, 48, 2081–2100. [Google Scholar] [CrossRef] [Scilit]
- Reich, C.; Ostropolets, A.; Ryan, P.; Rijnbeek, P.; Schuemie, M.; Davydov, A.; Dymshyts, D.; Hripcsak, G. OHDSI standardized vocabularies—A large-scale centralized reference ontology for international data harmonization. J. Am. Med. Inform. Assoc. 2024, 31, 583–590. [Google Scholar] [CrossRef] [Scilit]
- Henke, E.; Zoch, M.; Peng, Y.; Reinecke, I.; Sedlmayr, M.; Bathelt, F. Conceptual design of a generic data harmonization process for OMOP common data model. BMC Med. Inform. Decis. Mak. 2024, 24, 58. [Google Scholar] [CrossRef] [Scilit]
- Kim, J.W.; Kim, C.; Kim, K.H.; Lee, Y.; Yu, D.H.; Yun, J.; Baek, H.; Park, R.W.; You, S.C. Scalable infrastructure supporting reproducible nationwide healthcare data analysis toward FAIR stewardship. Sci. Data 2023, 10, 674. [Google Scholar] [CrossRef] [Scilit]
- Quiroz, J.; Chard, T.; Sa, Z.; Ritchie, A.; Jorm, L.R.; Gallego, B. Extract, transform, load framework for the conversion of health databases to OMOP. PLoS ONE 2022, 17, e0266911. [Google Scholar] [CrossRef] [Scilit]
- Mateus, P.; Moonen, J.E.F.; Beran, M.; Jaarsma, E.; Landen, S.M.; Heuvelink, J.; Birhanu, M.A.; Harms, A.G.J.; Bron, E.; Wolters, F.; et al. Data harmonization and federated learning for multi-cohort dementia research using the OMOP common data model: A Netherlands consortium of dementia cohorts case study. J. Biomed. Inform. 2024, 155, 104661. [Google Scholar] [CrossRef] [Scilit]
- Wilkinson, M.D.; Dumontier, M.; Aalbersberg, I.J.J.; Appleton, G.; Axton, M.; Baak, A.; Blomberg, N.; Boiten, J.W.; da Silva Santos, L.B.; Bourne, P.E.; et al. The FAIR Guiding Principles for scientific data management and stewardship. Sci. Data 2016, 3, 160018. [Google Scholar] [CrossRef] [Scilit] [PubMed]
- Sinaci, A.A.; Núñez-Benjumea, F.J.; Gencturk, M.; Jauer, M.L.; Deserno, T.; Chronaki, C.; Cangioli, G.; Cavero-Barca, C.; Rodríguez-Pérez, J.M.; Pérez-Pérez, M.M.; et al. From raw data to FAIR data: The FAIRification workflow for health research. Methods Inf. Med. 2020, 59, e21–e32. [Google Scholar] [CrossRef] [Scilit]
- Wilkinson, S.R.; Aloqalaa, M.; Belhajjame, K.; Crusoe, M.R.; de Paula Kinoshita, B.; Gadelha, L.; Garijo, D.; Gustafsson, O.J.R.; Juty, N.; Kanwal, S.; et al. Applying the FAIR Principles to computational workflows. Sci. Data 2025, 12, 328. [Google Scholar] [CrossRef] [Scilit] [PubMed]
- Desmond, J.; Wartmann, R.; Lau, C.W.; Thomas, S.; Middleton, P.M.; Ginige, J.A. OMOP ETL Framework for Semi-Structured Health Data. arXiv 2025. [Google Scholar] [CrossRef] [Scilit]
- Razzaghi, H.; Goodwin Davies, A.; Boss, S.; Bunnell, H.T.; Chen, Y.; Chrischilles, E.A.; Dickinson, K.; Hanauer, D.; Huang, Y.; Ilunga, K.T.S.; et al. Systematic data quality assessment of electronic health record data to evaluate study-specific fitness: Report from the PRESERVE research study. PLoS Digit. Health 2024, 3, e0000527. [Google Scholar] [CrossRef] [Scilit]
- Castellanos, E.H.; Wittmershaus, B.; Chandwani, S. Raising the Bar for Real-World Data in Oncology: Approaches to Quality Across Multiple Dimensions. JCO Clin. Cancer Inform. 2024, 8, e2300046. [Google Scholar] [CrossRef] [Scilit]
- Syed, R.; Eden, R.; Makasi, T.; Chukwudi, I.; Mamudu, A.; Kamalpour, M.; Geeganage, D.K.K.; Sadeghianasl, S.; Leemans, S.; Goel, K.; et al. Digital Health Data Quality Issues: Systematic Review. J. Med. Internet Res. 2023, 25, e42615. [Google Scholar] [CrossRef] [Scilit] [PubMed]
- Hamad, A.; Vasylkiv, V.; Yan, L.; Sanusi, R.; Ayilara, O.; Delaney, J.A.; Wall-Wieler, E.; Jozani, M.J.; Hu, P.; Banerji, S.; et al. Mapping three versions of the international classification of diseases to categories of chronic conditions. Int. J. Popul. Data Sci. 2021, 6, 1406. [Google Scholar] [CrossRef] [Scilit]
- Malecki, S.; Loffler, A.; Tamming, D.; Fralick, M.; Sohail, S.; Shi, J.; Roberts, S.; Colacci, M.; Razak, F.; Verma, A. Tools for categorization of diagnostic codes in hospital data: Operationalizing CCSR into a patient data repository. MedRxiv 2022. [Google Scholar] [CrossRef] [Scilit]
- Healthcare Cost and Utilization Project (HCUP). Clinical Classifications Software Refined (CCSR) Archive. Available online: https://hcup-us.ahrq.gov/toolssoftware/ccsr/ccsr_archive.jsp (accessed on 9 August 2026).
- Healthcare Cost and Utilization Project (HCUP). Clinical Classifications Software Refined (CCSR) for ICD-10-CM Diagnoses. Available online: https://hcup-us.ahrq.gov/toolssoftware/ccsr/dxccsr.jsp (accessed on 9 August 2026).
- Narodowy Fundusz Zdrowia. Raport Dotyczacy Hospitalizacji JGP [Data Set]. Available online: https://dane.gov.pl/pl/dataset/2581 (accessed on 9 August 2026).
- Wang, S.V.; Sreedhara, S.K.; Schneeweiss, S.; Franklin, J.; Gagne, J.; Huybrechts, K.; Patorno, E.; Lee, M.P.; Mahesri, M.; Pawar, A.M.; et al. Reproducibility of real-world evidence studies using clinical practice data to inform regulatory and coverage decisions. Nat. Commun. 2022, 13, 5126. [Google Scholar] [CrossRef] [Scilit]
- Board of Governors of the Federal Reserve System (US). South Korean Won to U.S. Dollar Spot Exchange Rate [AEXKOUS], Annual, Not Seasonally Adjusted, South Korean Won to One U.S. Dollar; G.5A Foreign Exchange Rates. FRED, Federal Reserve Bank of St. Louis. Available online: https://fred.stlouisfed.org/series/AEXKOUS (accessed on 9 August 2026).
- Torab-Miandoab, A.; Samad-Soltani, T.; Jodati, A.; Rezaei-Hachesu, P. Interoperability of heterogeneous health information systems: A systematic literature review. BMC Med. Inform. Decis. Mak. 2023, 23, 18. [Google Scholar] [CrossRef] [Scilit]
- Nelson, S.J.; Yin, Y.; Trujillo Rivera, E.A.; Shao, Y.P.; Tuttle, M.; Garvin, J.H.; Zeng-Treitler, Q. Are ICD codes reliable for observational studies? Assessing coding consistency for data quality. Digit. Health 2024, 10, 20552076241297056. [Google Scholar] [CrossRef] [Scilit]
- Health Insurance Review and Assessment Service. Health Insurance Review Statistics: Claims by Inpatient and Outpatient Care [Data set]. Available online: https://opendata.hira.or.kr/op/opc/olapHthInsRvStatInfoTab17.do (accessed on 9 August 2026).
- Prada-Ramallal, G.; Takkouche, B.; Figueiras, A. Bias in pharmacoepidemiologic studies using secondary health care databases: A scoping review. BMC Med. Res. Methodol. 2019, 19, 53. [Google Scholar] [CrossRef] [Scilit]
- Gómez-Coronado-Martín, R.; Salinero-Fort, M.; López-De-Andrés, A.; Weir, D.L.; De Burgos-Lunar, C. Clinical Validation of Type 1 Diabetes Coding in Hospital Discharge Records Using ADA Criteria: Implications for Spanish and European Health Data Spaces. J. Clin. Med. 2026, 15, 2286. [Google Scholar] [CrossRef] [Scilit]
- Agency for Healthcare Research and Quality. Clinical Classifications Software (CCS) for ICD-9-CM; Healthcare Cost and Utilization Project (HCUP): Rockville, MD, USA, 2015. Available online: https://hcup-us.ahrq.gov/toolssoftware/ccs/ccs.jsp (accessed on 9 August 2026).
- Agency for Healthcare Research and Quality. User Guide: Clinical Classifications Software Refined (CCSR), Version 2019.1; Healthcare Cost and Utilization Project (HCUP): Rockville, MD, USA, 2019. Available online: https://hcup-us.ahrq.gov/toolssoftware/ccsr/DXCCSR-User-Guide-v2019-1.pdf (accessed on 9 August 2026).
- New York State Department of Health. NYSDOH SPARCS De-Identified Data Dictionary 2020. Hospital Inpatient Discharges (SPARCS De-Identified): 2020. Available online: https://health.data.ny.gov/Health/Hospital-Inpatient-Discharges-SPARCS-De-Identified/nxi5-zj9x (accessed on 12 August 2026).
- Wykrota, K. Crosswalk and Harmonized Model for Multi-Country Hospital Discharge Data. Zenodo 2026. [Google Scholar] [CrossRef]
- Wykrota, K. Versioned Crosswalks for Harmonizing Public Administrative Hospital Discharge Data [Data Set]. Zenodo 2026. [Google Scholar] [CrossRef]
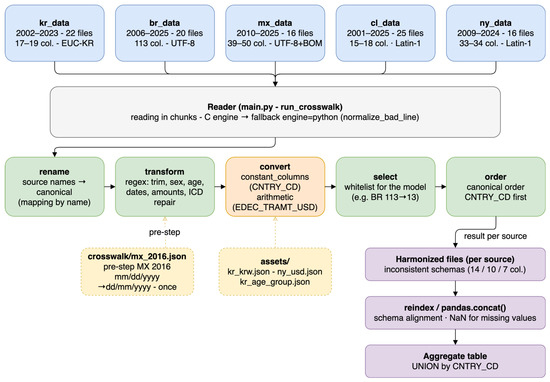
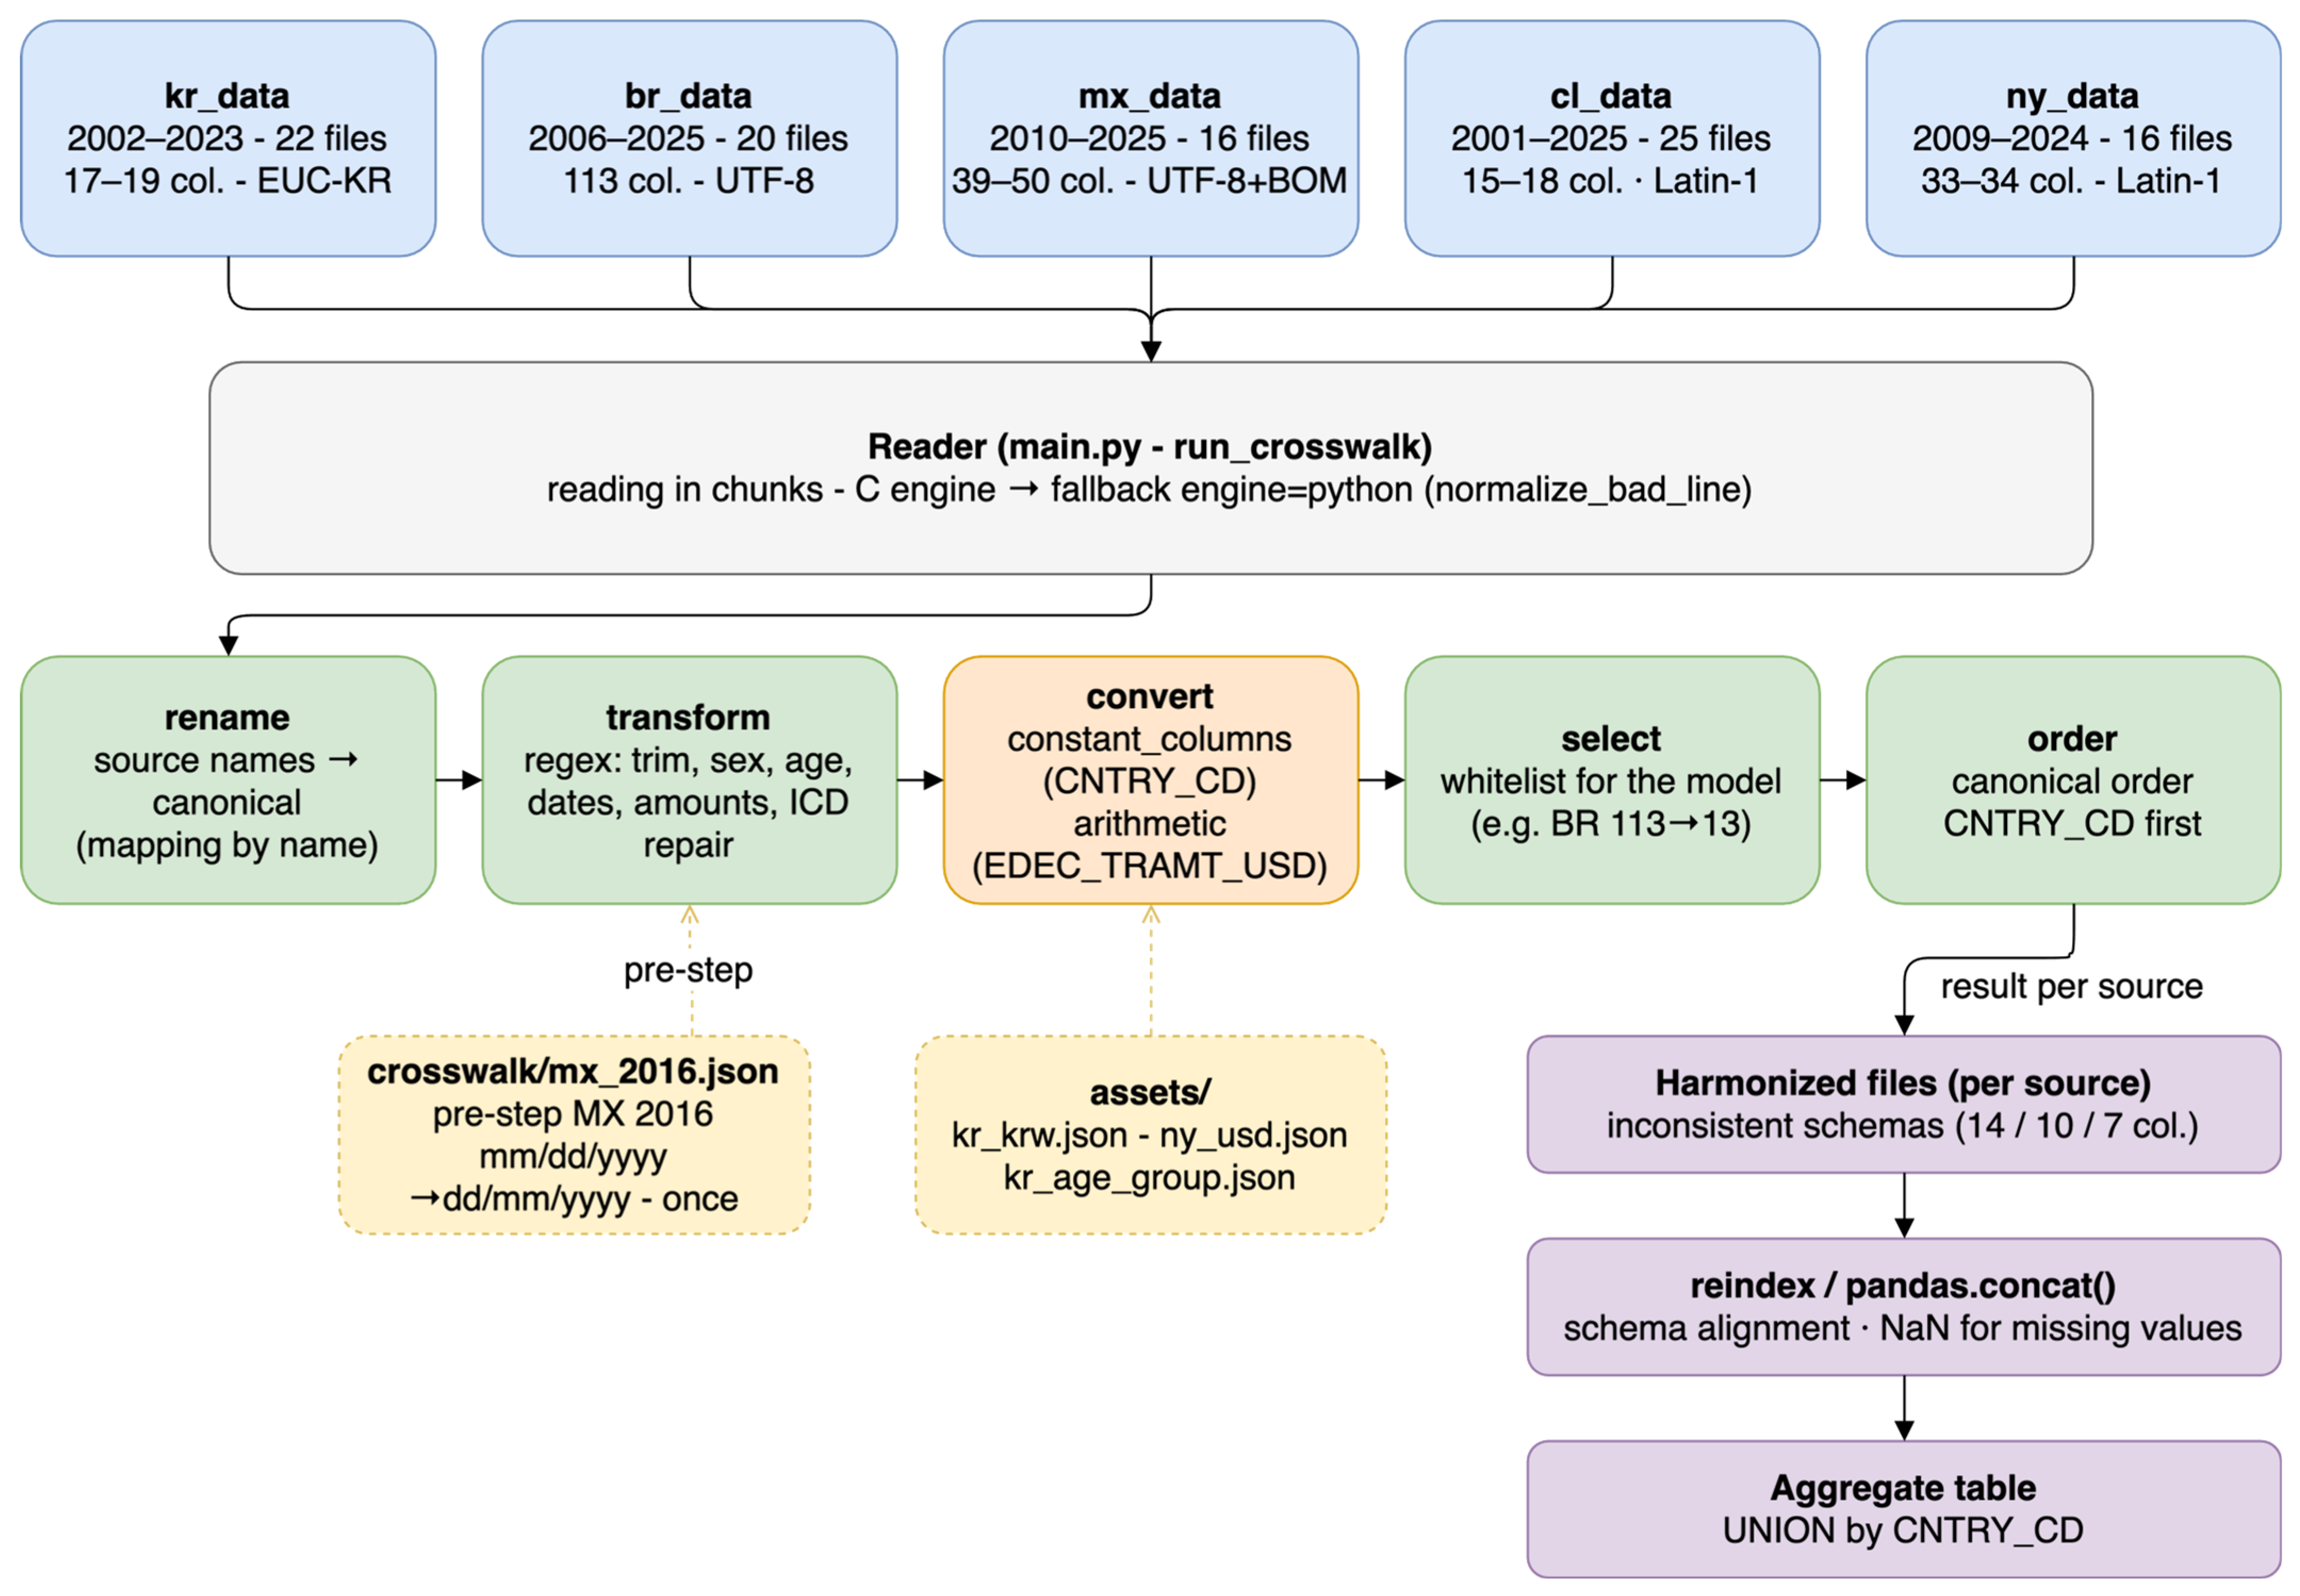

Disclaimer/Publisher’s Note: The statements, opinions and data contained in all publications are solely those of the individual author(s) and contributor(s) and not of MDPI and/or the editor(s). MDPI and/or the editor(s) disclaim responsibility for any injury to people or property resulting from any ideas, methods, instructions or products referred to in the content. |
© 2026 by the authors. Licensee MDPI, Basel, Switzerland. This article is an open access article distributed under the terms and conditions of the Creative Commons Attribution (CC BY) license.