


Featured Application
The results provide practical guidance for instructional designers and higher education instructors choosing between static text-and-image materials and AI-avatar video for introductory software learning. For the materials tested, the text-and-image format produced higher immediate knowledge scores. No statistically significant group differences were detected in practical performance or delayed-test scores. The findings underline the importance of pacing, visual signaling and learner control when designing AI-supported procedural instruction.
Abstract
AI-generated instructional videos are increasingly used in higher education, yet their effectiveness relative to carefully designed conventional instructional materials remains unclear, particularly for introductory procedural learning. This randomized two-group study compared two complete instructional formats, static text-and-image instruction and AI-avatar video instruction. Both covered the same learning objectives and worked procedure, but differed in verbal presentation, temporal pacing, navigation, visual signaling and avatar presence. Eighty-one first-year university students with no prior formal university instruction in Adobe Illustrator provided pre-test, post-test, practical-task, questionnaire and seven-day retention data. The text-and-image group achieved higher immediate post-test scores than the video group. No statistically significant group differences were detected in practical task or delayed-test scores, and the exploratory comparison of post-to-retention change was also not significant. Holm correction for three perception comparisons indicated that only perceived clarity remained significantly higher in the text-and-image group. For the materials tested, the text-and-image material provided a stronger basis for immediate learning, although this advantage was not detected in practical performance or delayed outcomes. Because the formats differed in several instructional features, the observed pattern cannot be attributed specifically to avatar presence. The results highlight the importance of pacing, segmentation, visual signaling and learner control when designing AI-supported instructional videos for novice procedural learning.
1. Introduction
Artificial intelligence is increasingly shaping contemporary education through AI-supported feedback systems, intelligent tutoring environments and AI-generated instructional materials. AI-generated instructional videos have emerged as one of the rapidly adopted applications in higher education. However, the educational value of AI-avatar instruction cannot be assumed on the basis of technological novelty alone, as its effectiveness depends on instructional design, learner control, cognitive load and the characteristics of the learning task. This issue is particularly relevant in graphic design software education, where students must simultaneously acquire conceptual knowledge and procedural skills. Learning Adobe Illustrator requires beginners to understand the software interface, identify tool functions, follow sequential operations and apply them in specific design tasks. These characteristics make graphic design software a representative example of procedural software learning, in which learners must simultaneously acquire conceptual understanding of software functions and procedural knowledge required for their practical application. Such learning demands instructional materials that provide clear guidance while avoiding unnecessary cognitive load. Although video-based instruction can demonstrate dynamic software procedures, text-and-image materials may offer stronger learner control by allowing students to inspect, revisit and process individual steps at their own pace. Existing research on video instruction remains inconclusive regarding its superiority over text-and-image formats, particularly in relation to initial learning, practical application and delayed retention [1,2,3]. Moreover, empirical evidence remains limited on how AI-generated avatar narration affects learning outcomes and learner perceptions in introductory software-learning contexts.
1.1. Theoretical Framework
The Cognitive Theory of Multimedia Learning (CTML) provides one of the most influential theoretical frameworks for explaining how learners process multimodal instructional materials [4]. According to the CTML, meaningful learning occurs through the selection, organization and integration of verbal and visual information presented through two separate cognitive channels, each characterized by limited processing capacity [4,5,6,7,8,9]. Within this framework, instructional design should facilitate active cognitive processing while minimizing unnecessary cognitive load, enabling learners to construct coherent mental representations of the presented content [8,10].
One of the central principles of the CTML is the modality principle, which proposes that spoken narration accompanying visual information may reduce overload of the visual channel compared with written text and consequently improve learning [4]. However, subsequent research has demonstrated that modality effects are not universal. Their effectiveness depends on learner characteristics, instructional design, task complexity and the degree of learner control during the learning process [2,3]. Furthermore, it is important to distinguish immediate learning outcomes from long-term knowledge retention, as delayed performance reflects the stability and durability of learners’ mental representations rather than initial acquisition alone [9].
The rapid development of digital education together with recent advances in artificial intelligence has accelerated the adoption of instructional videos across educational settings. Video-based materials are increasingly used to teach procedural knowledge because they enable dynamic demonstration of task execution while combining visual information with spoken explanations. Previous research has shown that instructional videos can effectively support learning and, under certain conditions, outperform traditional instructional approaches [3,11]. Their educational value has been attributed to the possibility of demonstrating procedural skills, supporting self-paced learning and aligning with multimedia learning principles [3]. Nevertheless, empirical findings remain inconsistent, suggesting that the effectiveness of instructional videos depends primarily on instructional design and contextual factors rather than on the video format itself [12,13]. Similarly, more technologically advanced instructional environments, including augmented and virtual reality, do not consistently produce better learning outcomes than simpler instructional formats [14,15].
An important aspect of instructional video design concerns instructor presence and the use of social cues during content presentation [2]. Previous studies indicate that visible instructors can strengthen social presence, increase learner motivation and emotional engagement and, in some contexts, improve knowledge retention. However, their influence on knowledge transfer and objective learning outcomes remains inconsistent. While some studies suggest that removing the visible instructor reduces cognitive fatigue and improves performance, others report that human instructors are perceived as more natural, more trustworthy and more engaging, resulting in higher levels of learner satisfaction [16]. These findings indicate that the educational value of instructor presence depends on the interaction between pedagogical objectives, instructional content and presentation format.
Recent advances in generative artificial intelligence have enabled the rapid production of AI-avatar instructional videos that combine synthetic speech, animated facial expressions and screen demonstrations. Compared with conventionally recorded instructional videos, AI-generated avatars offer practical advantages including scalability, reduced production costs and rapid updating of instructional content. They are increasingly being adopted in higher education as an alternative means of delivering educational materials. Despite these practical advantages, their educational effectiveness remains insufficiently understood. Previous studies report heterogeneous findings, indicating that learning outcomes depend not only on the presence of an AI-generated instructor but also on the characteristics of the learning task and the quality of instructional design. Although limitations related to the perceived naturalness of AI avatars have been reported, some studies suggest that they can increase learner engagement and reduce extraneous cognitive load [1,17,18,19]. Other studies demonstrate that AI-generated instructional videos achieve learning outcomes comparable to those obtained with human instructors, despite often receiving lower ratings of acceptance and user satisfaction [20].
Taken together, previous research indicates that the effectiveness of instructional modalities is strongly influenced by contextual factors including content complexity, the type of knowledge, cognitive load and the quality of instructional design [21,22]. Studies comparing AI-generated and conventionally produced instructional videos generally report comparable objective learning outcomes despite differences in learner perceptions [23,24,25]. In addition, design characteristics such as visual signaling, auditory presentation, emotional design and interaction quality influence learner engagement and the overall learning experience, although their effects on objective cognitive outcomes remain inconsistent [12,26,27,28,29,30,31,32].
These findings suggest that the educational value of AI-supported instructional materials cannot be attributed solely to the presence of artificial intelligence. Rather, learning effectiveness depends on the extent to which AI technologies are integrated into evidence-based instructional design that supports cognitive processing while responding to the characteristics of learners and instructional tasks.
1.2. Research Gap and Study Rationale
Despite the growing body of research on video-based instruction and AI-supported learning, empirical evidence comparing carefully designed text-and-image materials with AI-avatar video instruction in procedural software learning remains limited. Existing studies have predominantly compared AI-generated videos with human-instructor videos or conventional online instruction, while considerably less attention has been devoted to comparisons with structured text-and-image instructional materials. Moreover, relatively few studies have simultaneously examined both objective learning outcomes and learners’ subjective perceptions, despite the fact that these dimensions do not necessarily correspond.
Addressing this gap is important from both theoretical and practical perspectives. Procedural software learning provides a useful setting for examining how combinations of presentation features shape cognitive processing. Videos can demonstrate dynamic procedures through synchronized visual and auditory information, whereas text-and-image resources allow direct inspection and revisiting of individual steps. Comparing the two complete formats used in this study provides evidence about the resources as implemented, while recognizing that modality, pacing, signaling, navigation and presenter presence were not manipulated separately.
The comparison is also highly relevant for educational practice. AI-generated instructional materials are being adopted at an increasing rate across higher education, often under the assumption that technologically advanced instructional formats will automatically improve learning. However, if novice learners benefit equally or even more from carefully designed self-paced instructional materials, instructional decisions should be guided by empirical evidence rather than technological novelty alone.
Graphic design software provides a particularly suitable context for investigating these questions because successful performance requires learners to integrate conceptual understanding with procedural execution. Students must simultaneously identify interface elements, locate appropriate tools, understand sequential operations and apply design principles while solving authentic tasks. Consequently, the effectiveness of instructional materials depends not only on the delivery medium but also on the extent to which they support cognitive processing and the development of accurate procedural mental models. Examining text-and-image and AI-avatar video instruction in Adobe Illustrator therefore offers both theoretical insight into AI-supported procedural learning and practical implications for the design of instructional materials in digital design education.
1.3. Aim and Contribution of the Study
The aim of this study was to compare two complete instructional formats, a static text-and-image and an AI-avatar video, as they were implemented during introductory procedural software learning. The study examined immediate knowledge acquisition, practical task performance, delayed-test performance and learners’ perceptions in the context of Adobe Illustrator education.
The study contributes a controlled comparison of two authentic instructional resources used for the same lesson. Both formats covered the same objectives, content and working procedure, while differing in the way information was presented and revisited. The design therefore estimates the combined effect of the two formats as implemented. It cannot isolate avatar presence, narration, pacing, signaling or any other individual design feature. By examining an immediate knowledge test, a practical task, a retention test and learner perceptions within the same experiment, the study provides a more complete account of how the two resources functioned in introductory software learning.
2. Materials and Methods
2.1. Study Design and Instructional Content
This research compared two instructional formats used to introduce first-year Graphic Engineering and Design students to Adobe Illustrator 2023 (Adobe Inc., San Jose, CA, USA), static text-and-image material and an AI-avatar instructional video. The students had not yet received formal university instruction in Adobe Illustrator.
Adobe Illustrator was selected because it represents a typical procedural software environment in which successful task performance depends on learning sequential operations, tool selection, and interface navigation, making it suitable for comparing complete instructional resources during introductory software learning. The study evaluates how the two resources functioned in this context rather than evaluating Adobe Illustrator itself.
Both conditions covered the same learning objectives, followed the same instructional script, and addressed the same software procedures and examples. Participants in both groups received the same 20 min learning period and completed the same practical task. However, the resources themselves represented two distinct instructional formats. The text-and-image condition presented written explanations and static screenshots that learners could scan and revisit directly. The video condition combined a continuous screen recording with spoken narration and a visible AI avatar, and learners could navigate it using pause, rewind and replay controls. The conditions therefore differed in verbal presentation, temporal pacing, visual signaling, navigation and avatar presence. The design supports a comparison of the two formats as implemented but does not isolate the effect of any single feature.
The instructional content covered several key introductory areas in Adobe Illustrator: document setup (dimensions, bleed, CMYK), use of basic tools (Rectangle, Pencil, Direct Selection, Shape Builder), object alignment (Align), object manipulation (defining correct dimensions), and object coloring (stroke and fill). The lesson content (Lesson 1—business card design) was identical in both instructional modalities and is publicly available on the website https://www.asking.edu.rs/ (accessed on 15 January 2026) [33].
The independent variable was instructional format, with two conditions: (1) static text-and-image material and (2) an AI-avatar instructional video. Dependent variables were immediate post-test performance, practical task performance, delayed-test performance and subjective learning experience. Prior knowledge was measured before the learning phase and included as a covariate in the analyses of post-test and delayed-test scores.
Table 1 distinguishes the characteristics shared by the two conditions from the features that differed between the formats.
Table 1.
Shared and differing characteristics of the two instructional formats.
The knowledge tests were brief, criterion-referenced measures of four Adobe Illustrator domains: document setup, tool use, object manipulation and shape editing. The pre-test and post-test each contained 14 items. The retention test contained 10 rephrased or modified items covering the same core objectives, in order to reduce burden and direct recall after seven days. The post-test and retention test were therefore content-aligned but were not parallel forms. Percentage scores provided a common reporting scale, but did not make the tests psychometrically equivalent. For the 81 complete cases, Cronbach’s α (KR-20) was 0.401 for the pre-test, 0.461 for the post-test and 0.345 for the retention test. Item difficulty and corrected item–total correlations are summarized in Table 2. The modest coefficients are consistent with the short, heterogeneous, criterion-referenced tests and the limited variance created by several easy items. The delayed-test score and the exploratory analysis of post-to-delayed-test score change are interpreted cautiously.
Table 2.
Summary of knowledge-test item diagnostics for the 81 complete cases.
Four domain experts with extensive Adobe Illustrator and graphic design education experience reviewed the tests, answer keys and practical-task rubric for content coverage and clarity. Before practical scoring, the same experts jointly defined the elements to be assessed, their point values and a common scoring key. Some elements were assigned 0.5 points, and the maximum performance score was 22 points. A separate checklist recorded up to 23 predefined errors. All four experts reviewed every practical assignment without knowing the participant’s instructional condition. When ratings differed, the assignment was jointly re-examined against the agreed key until a consensus score was reached. The final consensus ratings were retained.
2.2. Instructional Material Preparation
The instructional materials were developed from the same master script, learning objectives, worked example and sequence of Adobe Illustrator procedures. This alignment was used to keep the lesson content consistent across conditions, but it did not make the resulting resources instructionally equivalent. The static and the video instructional material differed in navigation, temporal structure, verbal presentation and visual guidance.
(1) Static text-and-image instructional material. The instructional content was initially prepared in .docx format (Microsoft Word), allowing structured organization of textual and image elements. The material was then converted into PDF format and provided to participants (Figure 1). The PDF instructional material consisted of 60 pages, approximately 1526 words, and 119 screenshots illustrating the workflow in Adobe Illustrator. The content included step-by-step explanations supported by corresponding visual representations, enabling students to follow each action in the software interface at their own pace.
Figure 1.
Static text-and-image instructional material used in the experiment.
(2) AI-avatar video instructional material. A screen-recorded demonstration of the same business-card procedure was produced from the same master script and same visual content used to prepare the PDF. The 12 min 13 s video was created in Studio D-ID (Creative Reality Studio 3.0) (De-Identification Ltd., Tel Aviv, Israel) and combined the software demonstration with an AI-generated avatar and spoken narration. The avatar was a pre-recorded presenter rather than an interactive or adaptive agent. It did not respond to learners, personalize explanations or generate content during the experiment. A standard avatar from the platform library was used throughout (Figure 2).
Figure 2.
AI-avatar video instructional material created using Studio D-ID.
The avatar was positioned in the lower left corner of the video frame to maintain spatial contiguity between the narration and visual content while avoiding obstruction of key interface elements. The platform settings included English language, a male voice, and a standard speech rate.
During the experiment, the video was presented individually on each participant’s computer. Participants used headphones and were able to pause, rewind, or replay parts of the video during the learning phase.
Both groups had access to the aligned lesson content during the same 20 min learning period. The PDF allowed direct scanning and page-by-page revisiting, whereas the video required navigation within a continuous temporal sequence. These differences are part of the complete-format comparison and are considered when interpreting the results.
Both instructional resources were presented in English. The PDF used written English and the video used spoken English. The pre-test, post-test, practical-task instructions, questionnaire and retention test were administered in Serbian, the participants’ native language. English proficiency was not assessed.
2.3. Participants and Flow of the Experiment
The final analytic sample comprised 81 first-year students enrolled in the undergraduate Graphic Engineering and Design program at the Faculty of Technical Sciences, University of Novi Sad. The text-and-image group included 44 participants and the AI-avatar video group 37 participants. Eligibility was based on the absence of prior formal university instruction in Adobe Illustrator. Previous informal experience with Illustrator or similar software was not collected. The pre-test was used as the empirical measure of baseline knowledge. Before data collection, the index numbers of the 88 registered volunteers were entered into Microsoft Excel. A random number was generated for each record using the RAND function, the records were sorted by that value, and students were allocated without blocking or stratification to the text-and-image condition (n = 46) or AI-avatar video condition (n = 42).
A total of 88 students entered the study, whereas 46 were allocated to the text-and-image condition and 42 to the AI-avatar video condition. Seven were excluded because a complete dataset was not available. In the text-and-image group, two participants did not complete the retention test. In the video group, four participants did not complete the retention test and one had an unusable post-test record because the wrong test version was completed. Six of the seven excluded participants had valid pre-test scores. Their mean pre-test score was 54.76% (SD = 14.75), compared with 67.46% (SD = 14.11) among retained participants. A Welch test did not detect a statistically significant difference, t(5.70) = 2.04, p = 0.090.
Data collection was conducted in multiple scheduled laboratory sessions in the same computer classroom, using computers with identical technical characteristics and the same software environment. Within each session, participants began each study phase at the same time, received the same time limits and instructions, and were supervised by the same researcher. No communication between participants was permitted. No participant crossed over to the other group. Participation was voluntary, and the anonymized data were used exclusively for research purposes.
Ethical approval was obtained before recruitment and data collection (Approval No. 01-1418/1, 23 April 2026). Recruitment took place after approval. The pre-test, learning phase, post-test, practical task and questionnaire were administered on 27 April 2026. The retention test followed on 4 May 2026.
The experiment was conducted in five phases.
Phase 1: Pre-test (assessment of prior knowledge). In the first phase, participants completed a pre-test to assess their initial knowledge level and check group uniformity. The test comprised 14 questions (13 multiple choice and 1 true/false) (see Appendix B.1). Each correct answer was worth 1 point; incorrect answers received no points. The maximum score was 14. The maximum time to complete the test was 15 min.
Phase 2: Learning and post-test. In the second phase, participants were exposed to teaching material according to their assigned modality for 20 min. In both groups they were allowed to progress through the learning material at their own pace within the allocated 20 min learning period. Afterwards, they completed a post-test, which was identical for both groups. The test contained 14 multiple choice questions (see Appendix B.2), covering key lesson concepts. Each correct answer was worth 1 point, with a maximum score of 14. The maximum time to complete the test was 15 min.
Phase 3: Practical task. The third phase involved a practical task (see Appendix B.3) that required participants to reproduce the demonstrated workflow independently in Adobe Illustrator. Performance and errors were recorded on separate predefined scales. The performance rubric had a maximum of 22 points and included elements worth 0.5 points. The error checklist contained 23 possible errors. The four blinded expert assessors applied the shared key and resolved disagreements by joint re-examination.
The two practical measures were not mathematical complements. The performance score awarded credit for correctly completed elements, whereas the error checklist counted predefined types of faults. A single element could therefore affect the score and also generate one or more error categories. The full point rubric and error checklist are provided in Appendix C.
Phase 4: Subjective evaluation. In the fourth phase, participants completed a questionnaire assessing subjective learning experiences (see Appendix B.4). The questionnaire consisted of 12 Likert-type questions (scale 1–5) and 3 open-ended questions. For analysis, the items were grouped by their intended content: clarity combined intelligibility, ease of following the explanation and understanding; engagement combined attention, involvement and interest in further work; and system evaluation combined satisfaction, two usefulness items, perceived modernity, technical execution and interaction. These were study-specific summary composites rather than previously validated unidimensional instruments.
The open-ended questions were used to provide descriptive context for participants’ evaluations of the two instructional resources. At least one written response was provided by 37 of the 44 participants in the text-and-image group and 26 of the 37 participants in the AI-avatar video group. Three authors jointly reviewed all available comments across four review rounds. They identified recurring topics and agreed, through discussion, on overlapping descriptive categories related to learner control, visual guidance, pacing, engagement, usefulness and suggested improvements. Differences in categorization were resolved through discussion. Because the reviews were not completed independently, no coder-agreement coefficient was calculated. Selected quotations are reported anonymously using participant and group labels to illustrate these observations. The responses were not independently coded, and no coder-agreement analysis was conducted. They are presented as descriptive feedback and are not used to support inferential or causal claims.
Phase 5: Retention test. The fifth phase was conducted seven days after the initial testing and assessed knowledge retention (see Appendix B.5). The retention test consisted of 10 questions (8 multiple choice and 2 true/false). Each correct answer was worth 1 point, with no partial scoring. The maximum time to complete the test was 15 min.
The retention test included fewer items than the post-test to minimize recall effects and reduce test fatigue, while maintaining coverage of key learning objectives.
The overall experimental procedure and sequence of the study phases are summarized in Figure 3.
Figure 3.
Flowchart of the experimental design and study procedure.
2.4. Statistical Methods
Statistical analyses were conducted using IBM SPSS Statistics 20 (IBM Corp., Armonk, NY, USA). Distributions were reviewed using descriptive statistics, Shapiro–Wilk tests, Q–Q plots and boxplots. Values flagged by the boxplots were checked against the source data. No valid observation was excluded solely because it was an outlier. Homogeneity of variance was assessed with Levene’s test. Missingness was checked across all required assessments before defining the complete-case analytic sample. The 81 included participants had complete pre-test, post-test, practical-task, questionnaire and retention test data. Group means were compared with independent samples t-tests, using Student’s test when the equal-variance assumption was met and Welch’s test when it was not.
ANCOVA was used for immediate post-test and delayed-test scores while controlling for pre-test performance. Homogeneity of regression slopes was assessed with the group-by-pre-test interaction. Standardized residuals, Q–Q plots, Shapiro–Wilk tests and Cook’s distances were examined. Post-test residuals were approximately normal (W = 0.996, p = 0.997; standardized residual range −2.49 to 2.53; maximum Cook’s distance = 0.23). Delayed-test residuals showed a lower-tail departure from normality (W = 0.961, p = 0.015; standardized residual range −3.16 to 2.71; maximum Cook’s distance = 0.38). No Cook’s distance exceeded 1 and no case was removed on the basis of these diagnostics.
For reporting and analysis on a common 0–100 scale, the raw scores from the knowledge tests and practical task, as well as the number of recorded errors, were converted into percentages of their respective maximum values. This conversion provided a common reporting metric but did not make the immediate and delayed knowledge tests psychometrically equivalent. Internal consistency of the dichotomously scored knowledge tests was assessed using Cronbach’s α, which is equivalent to KR-20 for binary items. Item difficulty was represented by the proportion of correct responses, while item discrimination was examined using corrected item–total correlations.
To explore change between the immediate and delayed assessments, a change score was calculated for each participant by subtracting the immediate post-test percentage from the retention test percentage. Because the variance of the change scores differed between the groups, the Welch independent-samples test was used. This analysis was treated as exploratory because the immediate post-test and retention test differed in length and were not parallel forms.
The three perception composites, clarity, engagement and system evaluation, were calculated as the means of their constituent items. They were used to reduce the 12 related questionnaire items to three conceptually interpretable summaries. Cronbach’s α was reported as an internal-consistency estimate, but was not treated as evidence of unidimensional or construct validity. Group comparisons used independent samples t-tests with Welch’s correction where appropriate. Holm adjustment was applied to control the overall risk of false-positive findings across the three tests.
All statistical tests were two-sided, with α = 0.05. Mean differences and 95% confidence intervals were reported together with effect-size estimates. Eta squared (η2) was reported for independent-group comparisons and partial eta squared (partial η2) for ANCOVA effects. A sensitivity analysis based on the final group sizes of 44 and 37 participants indicated that, with two-sided α = 0.05 and 80% power, the independent-group tests could detect a standardized difference of approximately d = 0.63. The corresponding approximate sensitivity for a one-degree-of-freedom ANCOVA group effect was partial η2 = 0.09. Smaller effects may therefore have gone undetected, and non-significant findings are not interpreted as evidence of equivalence.
2.5. Research Questions and Research Hypotheses
In line with the aim of this study, the research questions for the context of introductory Adobe Illustrator learning were formulated as follows:
RQ1. Do the two instructional formats differ in immediate knowledge acquisition?
RQ2. Do the two instructional formats differ in practical task performance?
RQ3. Do the two instructional formats differ in delayed-test performance after seven days?
RQ4. Do the two instructional formats differ in learners’ perceptions of clarity, engagement and overall system evaluation?
Based on the CTML and previous research on AI-supported instructional resources, the two formats were expected to produce differences in objective or subjective outcomes. Given the mixed earlier findings, however, the direction and size of any difference were expected to depend on the task and on the combined design features of the resources.
From these theoretical assumptions and research questions, the following hypotheses were derived:
H1.
Immediate post-test performance differs between participants using the text-and-image material and those using the AI-avatar video.
H2.
Practical task performance differs between participants using the text-and-image material and those using the AI-avatar video.
H3.
Delayed-test performance differs between participants using the text-and-image material and those using the AI-avatar video.
H4.
Learners’ ratings of clarity, engagement or overall system evaluation differ between the two instructional formats.
3. Results
3.1. Descriptive Statistics
Figure 4 presents the mean percentage scores for the pre-test, immediate post-test and retention test. The pre-test means differed by less than one percentage point. The text-and-image group had higher mean scores on both the immediate post-test and the retention test. Although presented on the same percentage scale, the immediate post-test and retention test differed in length and were not parallel forms.
Figure 4.
Mean percentage scores across pre-test, post-test, and retention test.
Figure 5 presents the mean practical-task scores and error percentages for the two instructional formats. Higher task scores indicate better performance, whereas lower error percentages indicate better performance. The text-and-image group had a slightly higher mean task score, whereas the video group had a slightly lower mean error percentage.
Figure 5.
Mean practical task performance and error rates by group. Higher task scores and lower error percentages indicate better performance.
Figure 6 presents the mean ratings for each of the 12 questionnaire items in the two groups. Participants in the text-and-image condition (G1) reported higher ratings for most items, whereas the AI-avatar condition (G2) received slightly higher ratings only for selected technology-oriented aspects, most notably perceived up-to-dateness, reflecting the novelty of the instructional format. The composite scale results are examined in the inferential analysis.
Figure 6.
Mean ratings for the 12 questionnaire items by instructional group (five-point scale).
3.2. Baseline Prior Knowledge
An independent samples t-test (see Appendix A.1) showed no statistically significant difference in pre-test scores between the groups, t(79) = 0.27, p = 0.784. The mean score was 67.86% (SD = 12.75) in the text-and-image group and 66.99% (SD = 15.74) in the video group. The mean difference was 0.87 percentage points, 95% CI [−5.43, 7.17], with a negligible effect size, η2 = 0.001.
3.3. Immediate Learning
An ANCOVA examined immediate post-test performance while controlling for pre-test scores (see Appendix A.3). The assumption of homogeneity of regression slopes was met (p = 0.88) (see Appendix A.2). The adjusted mean was 11.89 percentage points higher in the text-and-image group than in the video group, 95% CI [6.70, 17.09], F(1, 78) = 20.80, p < 0.001, partial η2 = 0.210.
Because Levene’s test indicated unequal post-test variances (p = 0.001), a Welch independent samples t-test was conducted as an unadjusted robustness check. It likewise showed higher scores in the text-and-image group, t(58.30) = 4.41, p < 0.001, mean difference = 11.74, 95% CI [6.41, 17.08] (see Appendix A.3). This result was consistent in direction with the ANCOVA finding, but it did not assess the robustness of the covariate-adjusted estimate.
3.4. Practical Task Results
Independent samples t-tests (see Appendix A.4) were conducted to compare groups in terms of task performance and error rates. No statistically significant differences were found between the groups for task score (t(79) = 0.58, p = 0.56) or task errors (t(79) = 0.49, p = 0.62). The mean difference in task scores was 2.94 percentage points in favor of the text-and-image group, 95% CI [−7.16, 13.03]. For error percentages, the mean difference between the text-and-image and video groups was 1.03 percentage points, 95% CI [−3.11, 5.17]. Effect sizes were negligible (η2 = 0.004 for task scores and η2 = 0.003 for error percentages). Because both confidence intervals include differences in either direction, these findings are not interpreted as evidence of equivalence.
3.5. Delayed-Test Performance and Post-to-Retention Change
An ANCOVA examined delayed-test scores while controlling for pre-test scores (see Appendix A.6). The assumption of homogeneity of regression slopes was satisfied (p = 0.204; see Appendix A.5). The adjusted mean difference was 5.56 percentage points in favor of the text-and-image group, 95% CI [−.99, 12.12], F(1, 78) = 2.85, p = 0.095, partial η2 = 0.035, indicating a small effect. The confidence interval ranged from a difference of 0.99 percentage points in favor of the video group to a difference of 12.12 points in favor of the text-and-image group. This non-significant result does not establish equivalence between the formats.
To explore post-to-retention change, a change score was calculated as the retention test percentage minus the immediate post-test percentage. Mean change was −5.23 percentage points (SD = 12.62) in the text-and-image group and 1.04 percentage points (SD = 22.48) in the video group. Because change-score variances differed, Welch’s test was used. The estimated between-group difference in change was −6.27 percentage points, 95% CI [−14.60, 2.06], and was not statistically significant, t(54.41) = −1.51, p = 0.137 (see Appendix A.9). Because the immediate post-test and retention test differed in length and were not parallel forms, this exploratory change-score analysis should be interpreted cautiously.
3.6. Perception of the Instructional Formats
Based on the participants’ responses, three composite scales were constructed to assess perception: clarity, engagement, and system evaluation. Composite scores were calculated as the mean value of the items belonging to each perception dimension. All scales demonstrated high internal consistency (Cronbach α ≥ 0.80) (see Appendix A.7). Independent samples t-tests, with Welch correction applied where appropriate, were conducted for each scale (see Appendix A.8), and the resulting p-values were adjusted using the Holm procedure. The text-and-image group reported higher perceived clarity (M = 4.03, SD = 0.78) than the video group (M = 3.14, SD = 1.09), mean difference = 0.89, 95% CI [0.46, 1.31], unadjusted p < 0.001, Holm-adjusted p < 0.001. The unadjusted comparisons also favored the text-and-image group for engagement (mean difference = 0.51, p = 0.028) and system evaluation (mean difference = 0.44, p = 0.047), but neither remained statistically significant after Holm correction (adjusted p = 0.055 for both). Thus, only perceived clarity differed significantly between the groups after correction.
3.7. Descriptive Feedback from Open-Ended Responses
Written comments were examined descriptively to provide context for the scale ratings. The quotations below illustrate observations made by respondents but are not presented as results of a formal qualitative content analysis.
Among the 37 text-and-image participants who wrote at least one comment, 10 mentioned screenshots or the stepwise organization of the material and nine mentioned learner control or self-paced access. One participant described the main advantage as “independent work” (P1, G1), while another wrote that the material allowed each student to proceed “at their own pace” (P17, G1). Because a response could mention more than one topic, the category counts overlap.
Seven respondents in this group suggested adding a video or instructor demonstration, and four requested clearer cursor or interface highlighting. For example, one student said that the images showed clearly “how and what should be used” (P2, G1), whereas another suggested “adding a pointer showing where the mouse cursor is” (P43, G1).
Among the 26 video participants who commented, 11 positively described the video or its modern digital format, five referred to pacing or repetition, three mentioned cursor or click visibility, and four commented on the naturalness of the narration or avatar. Examples included “a modern way of teaching through video recording” (P9, G2), requests for “a slower version of the video” (P5, G2) and “a brightly colored pointer” (P8, G2), and a request for a “less robotic pace” (P25, G2). These overlapping counts describe the comments and are not used as inferential evidence.
Taken as descriptive feedback, these comments identify features that participants noticed in each resource. They do not establish that pacing, signaling, navigation or avatar narration caused the observed group difference in immediate post-test performance.
The comments are therefore used only to inform possible refinements to future materials, such as clearer signaling in both formats and additional segmentation and pacing controls in video.
4. Discussion
This study compared a static text-and-image resource with an AI-avatar video in an introductory Adobe Illustrator lesson. After adjustment for pre-test performance, the text-and-image group achieved significantly higher immediate post-test scores than the AI-avatar video group. Among the three perception measures, only perceived clarity was also significantly higher after correction for multiple comparisons. No statistically significant group differences were detected in practical-task performance, delayed-test scores or post-to-retention change. This pattern suggests that the text-and-image resource supported initial learning more effectively under the conditions tested, but the analyses did not show that this advantage extended to practical application or delayed outcomes. Because the resources also differed in verbal presentation, pacing, navigation and visual signaling, the findings concern the two complete formats rather than an isolated effect of the avatar.
4.1. Immediate Learning in the Two Formats
The higher immediate post-test score in the text-and-image group suggests that this resource provided stronger support for initial knowledge acquisition than the AI-avatar video used in the study. The PDF allowed learners to inspect individual steps, move between pages and revisit written explanations without searching within a continuous sequence. These features may have helped students understand how the software interface works.
The video offered pause, rewind and replay controls, but learners still had to coordinate narration, screen activity, cursor movement and interface changes over time. This may have increased processing demands when actions were presented quickly or were not clearly highlighted. These explanations are plausible, but the study was not designed to determine which individual feature produced the observed difference.
The finding therefore concerns the two resources as they were implemented rather than demonstrating a general advantage of text-and-image instruction or an isolated effect of the avatar. The results point to learner control, appropriate pacing, segmentation and clear visual signaling as important priorities when designing instructional videos for novice software learners.
4.2. Interpretation of Practical Task Outcomes
No statistically significant group differences were detected in practical-task scores or error percentages, and both estimated effect sizes were negligible. The confidence interval for the task-score difference was relatively wide, ranging from −7.16 to 13.03 percentage points, and therefore remains compatible with differences in either direction. The study consequently found no clear practical-performance advantage for either format, but it does not establish that their effects were equivalent.
4.3. Delayed-Test Scores and Change over Seven Days
After adjustment for pre-test performance, the estimated delayed-test score was 5.56 percentage points higher in the text-and-image group, but the difference was not statistically significant (p = 0.095). The confidence interval ranged from a 0.99-point advantage for the video group to a 12.12-point advantage for the text-and-image group. The delayed-test result is therefore inconclusive. It provides no clear evidence of a group difference, but it also does not establish equivalent retention or show that the immediate advantage had disappeared.
The exploratory change-score analysis showed an average decline of 5.23 percentage points in the text-and-image group and a slight increase of 1.04 points in the video group. However, the between-group difference in change was not statistically significant and its confidence interval was wide. Because the immediate post-test and retention test differed in length and were not parallel forms, the observed percentage-point change should not be interpreted as a retention rate or as a direct measure of knowledge loss. The analysis is therefore presented only as a supplementary description of the score pattern.
Pre-test performance remained associated with delayed-test scores, highlighting the continuing contribution of prior knowledge to later performance.
4.4. Perception of Instructional Materials and Learner Experience
After Holm correction, perceived clarity was the only scale that differed significantly between the groups. The mean clarity score was 0.89 points higher in the text-and-image group on the five-point scale. Engagement and system evaluation had unadjusted p-values below 0.05, but both adjusted values were 0.055 and are therefore not interpreted as statistically significant. The corrected results consequently indicate a difference in perceived clarity rather than a general difference in learner experience.
The open-ended responses provide additional context for this finding. Participants in the text-and-image group valued the step-by-step access, screenshots and ease of returning to earlier information. Video participants appreciated the modern presentation but also commented on pacing, cursor visibility and narration. Because the responses were not independently coded, they are treated as descriptive feedback rather than as formal qualitative evidence.
This feedback points to practical refinements, including stronger visual signaling in both resources and shorter segments, clearer cursor emphasis and more natural pacing in the video. These features provide useful directions for future design and experimental testing, but they should not be treated as confirmed explanations for the quantitative results.
4.5. Relationship Between Perception and Performance
At the group level, the text-and-image format was both perceived as clearer and associated with higher immediate post-test performance. Engagement and system evaluation did not differ significantly after correction for multiple comparisons.
This parallel group-level pattern makes clarity a relevant instructional design consideration. The study did not examine participant-level correlations between perception scores and learning outcomes. It therefore cannot show that individual students who perceived the material as clearer also achieved higher scores. Similarly, the group comparisons provide no evidence about individual relationships between subjective ratings and practical-task or delayed-test performance.
Perceived clarity should therefore be treated as an important aspect of instructional design, but not as a substitute for objective evidence of learning. Evaluations of AI-supported instructional materials should combine learner perceptions with measures of immediate knowledge, practical application and delayed performance.
4.6. Implications for AI-Supported Instructional Design
The findings have important implications for the design of AI-supported instructional materials in software-based learning environments such as graphic design. Although the study was conducted using Adobe Illustrator, the findings may be informative for comparable introductory procedural software-learning contexts involving sequential task execution, interface navigation and tool-based interaction. Because the sample comprised students from one program at one university, applicability to other software, institutions and learner populations remains to be established through replication.
Learning graphic design software requires the simultaneous acquisition of conceptual understanding and procedural skills, making instructional design particularly important for novice learners. The present findings suggest that instructional decisions should prioritize evidence-based learning principles over technological sophistication.
Video can demonstrate dynamic procedures, cursor movements, tool selection and temporal sequences directly. In the present implementation, however, playback controls did not lead to the same immediate post-test result as the text-and-image resource, and the video was rated as less clear. Future versions may benefit from shorter segments, stronger cursor and interface signaling, deliberate pauses after key actions and closer synchronization of narration with on-screen activity.
These findings should therefore not be interpreted as evidence against AI-avatar or video-based instruction. Rather, they suggest that AI-supported instructional materials require design strategies specifically adapted to procedural software learning. In practice, this may include shorter segmented videos, enhanced visual signaling, cursor highlighting, zooming into relevant interface elements, brief pauses after key actions, on-screen labels, and more natural avatar narration. Such design features may preserve the advantages of dynamic video demonstrations while reducing unnecessary cognitive demands during initial learning.
Overall, the present findings suggest that the educational value of AI-supported instructional materials depends less on the presence of AI-generated features than on the extent to which they implement evidence-based instructional design principles that support learner control, cognitive processing, and procedural understanding.
4.7. Limitations and Future Research
The sample consisted of 81 first-year students from one program at one university, which limits the broader applicability of the findings. The sensitivity analysis indicated that the study was mainly able to detect moderate-to-large group differences, while smaller effects may have gone undetected. This is particularly relevant to the non-significant practical task, retention test and change-score results, which should not be interpreted as evidence of equivalence.
The two conditions differed simultaneously in written versus spoken information, static versus continuous presentation, navigation, pacing, signaling and avatar presence. The design therefore cannot separate the contributions of these features. Both instructional resources and the Adobe Illustrator interface were in English, while knowledge tests, practical task instructions and the questionnaire were in Serbian. Administering the outcome measures in Serbian reduced language demands during response, but it did not remove potential variation in participants’ ability to process written English in the PDF and spoken English presented continuously in the video. Because English proficiency was not measured, its contribution to individual performance and to the observed between-format pattern cannot be determined.
The knowledge measures were brief and had modest internal consistency overall, with particularly low reliability for the retention test (Cronbach’s α (KR-20) = 0.345). Several items also showed weak or negative corrected item–total correlations. These properties increase measurement uncertainty and reduce the precision of the immediate and delayed knowledge-test findings, particularly the retention and change-score results. The immediate post-test and retention test were also not parallel forms, which further limits interpretation of change between assessments. The three perception composites were study-specific summaries, and their internal-consistency coefficients do not establish unidimensional or construct validity. These measurement limitations reduce the precision of conclusions about knowledge change and learner perceptions.
Post-test ANCOVA residuals were approximately normal, but Levene’s test indicated unequal error variances. The supplementary Welch test compared unadjusted group means and therefore did not assess the robustness of the covariate-adjusted ANCOVA estimate. Delayed-test residuals also showed a lower-tail departure from normality. Although no case had Cook’s distance above 1 and no valid case was removed, the adjusted results should be interpreted with these diagnostics in mind.
Seven participants were excluded because complete data were unavailable. Although no statistically significant baseline difference was detected between the retained and excluded participants, the small number of excluded participants did not allow a precise attrition analysis.
Practical work was assessed by four experts who were blinded to group allocation and used a shared scoring key. Discrepancies were resolved by consensus using the shared scoring key. Because the individual pre-consensus ratings were not retained, a separate inter-rater agreement coefficient could not be calculated.
Future studies should retain the independent ratings recorded before consensus and report an inter-rater agreement coefficient. Parallel immediate and retention test forms, repeated measurements and longer retention intervals would provide a clearer distinction between initial learning and subsequent knowledge loss. Larger multisite samples would improve the precision and broader applicability of the estimates, while repeated practical tasks would provide a more stable assessment of applied performance. Also, factorial designs that vary avatar presence, narration, segmentation and signaling separately would help identify which features contribute to differences in learning outcomes.
5. Conclusions
This study examined how text-and-image and AI-avatar video instruction supported immediate knowledge acquisition, practical application and delayed retention during an introductory Adobe Illustrator lesson. For the materials tested, students in the text-and-image group achieved higher immediate post-test scores. No statistically significant differences were detected in practical-task performance or delayed-test scores, and the exploratory comparison of post-to-retention change was also not significant.
The clearest difference between the two resources therefore emerged immediately after instruction. The non-significant practical-task and delayed-test results do not establish that the formats were equivalent. The immediate advantage of the text-and-image material cannot be attributed specifically to avatar presence because the resources also differed in verbal presentation, pacing, navigation and visual signaling. The conclusions consequently relate to the two complete instructional formats as implemented in this study.
Students’ evaluations provide additional context. After correction for the three perception comparisons, only perceived clarity remained significantly higher in the text-and-image group. The descriptive comments indicate that students valued the step-by-step organization and easy access to screenshots in the PDF, while their comments on the video identified pacing, cursor visibility and narration as areas for improvement. These observations do not establish which features caused the difference in immediate performance, but they identify aspects of instructional design that deserve further investigation.
The findings do not support a categorical preference for one instructional medium. Text-and-image materials and instructional videos provide different forms of support, and their value is likely to depend on the needs of novice learners and the demands of the task. AI-supported videos may be particularly useful for demonstrating dynamic procedures, but they may benefit from careful segmentation, clear visual signaling and pacing that allows learners to follow and revisit important steps.
The study provides focused evidence that, in this introductory lesson, the text-and-image material supported stronger immediate learning and was perceived as clearer than the AI-avatar video. The findings highlight that AI-supported instructional materials should be evaluated not only in terms of the technology used, but also in terms of their instructional design. Future studies using parallel test forms, longer follow-up periods, larger samples and designs that vary video and avatar features separately could clarify when and under what conditions AI-supported instruction offers additional learning benefits.
Author Contributions
Conceptualization, Ž.Z., N.K., M.S. and A.J.Ž.; methodology, N.K., S.D., I.J. and S.P.; validation, Ž.Z., N.K., S.D., S.P. and I.J.; formal analysis, S.D., I.J. and S.P.; investigation, S.D. and I.J.; data curation, I.J., S.D. and A.J.Ž.; writing—original draft preparation, N.K., S.D., S.P. and I.J.; writing—review and editing, all authors; visualization, Ž.Z.; supervision, N.K. and M.S. All authors have read and agreed to the published version of the manuscript.
Funding
This research was supported by the Provincial Secretariat for Higher Education and Scientific Research of the Autonomous Province of Vojvodina, Serbia (Contract No. 003795691 2025 09418 003 000 000 001 04 002), through the project “Development of Artificial Intelligence-Based Systems for Self-Regulated Student Assessment”.
Institutional Review Board Statement
The study was conducted in an educational context using anonymized academic data and did not involve sensitive personal information. All questionnaires and tests were approved before recruitment and data collection by the Ethics Committee of the Faculty of Technical Sciences, University of Novi Sad, Serbia (Approval No. 01-1418/1, 23.04.2026). Recruitment began after approval. The initial experimental session was conducted on 27 April 2026 and the retention test on 4 May 2026.
Informed Consent Statement
Participation was voluntary and students were informed about the use of anonymized data for research purposes.
Data Availability Statement
The data are available from the corresponding author upon reasonable request.
Conflicts of Interest
The authors declare no conflicts of interest.
Abbreviations
The following abbreviations are used in this manuscript:
| AI | Artificial Intelligence |
| CTML | Cognitive Theory of Multimedia Learning |
| ANCOVA | Analysis of Covariance |
Appendix A
Appendix A.1
Appendix A.1 presents the results of the parametric independent samples t-test on the pre-test scores. This analysis was conducted as a preliminary step to examine whether the experimental groups had similar levels of prior knowledge of Adobe Illustrator.
The results of the t-test indicate that there is no statistically significant difference between the groups (t(79) = 0.27, p = 0.78). The effect size was negligible (η2 = 0.001). This result indicates that the observed baseline scores were similar, but it is not treated as a formal demonstration of equivalence.
Table A1.
Group statistics (pre-test).
Table A2.
Independent samples t-test (pre-test).
Appendix A.2
Appendix A.2 presents the results of the analysis of the homogeneity of regression slopes, a prerequisite for applying the ANCOVA statistical method to the post-test results. The assumption of homogeneity of regression slopes was checked and met, as the interaction between the group and the pre-test results was not statistically significant (p = 0.88).
Table A3.
Tests of between-subjects effects.
Appendix A.3
Appendix A.3 presents the ANCOVA results for post-test performance, including Levene’s test of equality of error variances. Because Levene’s test indicated unequal variances, a supplementary Welch independent samples t-test was applied to the unadjusted group means. The Welch comparison is reported for descriptive context and is not treated as a robustness test of the covariate-adjusted ANCOVA estimate.
Table A4.
Tests of between-subjects effects (post-test).
Table A5.
Descriptive statistics (post-test).
Table A6.
Levene’s test of equality of error variances.
Table A7.
Estimated marginal means.
Table A8.
Independent samples t-test (post-test score).
Appendix A.4
Within Appendix A.4, the results of the descriptive statistical analysis and the independent samples t-test for task_score and task_errors are presented.
Table A9.
Group statistics (task_score and task_errors).
Table A10.
Independent samples t-test (task score and task errors).
Appendix A.5
Within Appendix A.5, the results of the analysis of the homogeneity of regression slopes, as a prerequisite for applying the ANCOVA statistical method to the retention test results, are presented.
Table A11.
Tests of between-subjects effects (retention test).
Appendix A.6
Appendix A.6 presents descriptive statistics, the variance check and the ANCOVA examining delayed-test scores while controlling for pre-test scores. The group estimate is reported with its 95% confidence interval and is not interpreted as an equivalence test.
Table A12.
Tests of between-subjects effects (retention test).
Table A13.
Descriptive statistics (retention test).
Table A14.
Levene’s test of equality of error variances (retention test).
Table A15.
Estimated marginal means group.
Appendix A.7
Appendix A.7 presents internal-consistency estimates for the three study-specific perception composites. Cronbach’s α was 0.886 for clarity, 0.809 for engagement and 0.884 for system evaluation. These coefficients summarize internal consistency in this sample and are not presented as evidence that the composites are validated unidimensional scales. The clarity composite was the mean of the material clarity, ease of following procedures and task understanding items; engagement was the mean of attention during learning, focus and engagement and interest in further work; and system evaluation was the mean of overall satisfaction, ability to repeat the procedure, useful and applicable, modern presentation, technical performance and natural interaction. The first two composites summarized closely related learning-experience content. System evaluation was intentionally broader and represented an overall appraisal of usefulness, satisfaction, modernity, technical execution and interaction.
Table A16.
Reliability statistics (clarity scale).
Table A17.
Reliability statistics (engagement scale).
Table A18.
Reliability statistics (system evaluation scale).
Appendix A.8
Appendix A.8 presents descriptive statistics and group comparisons for the three perception scales. Holm adjustment was applied across the three tests. Only clarity remained statistically significant after correction (p = 0.00030525). The adjusted p-values for engagement and system evaluation were both 0.055.
Table A19.
Group statistics (clarity scale).
Table A20.
Group statistics (engagement scale).
Table A21.
Group statistics (system evaluation scale).
Table A22.
Independent samples t-test (clarity scale).
Table A23.
Independent samples t-test (engagement scale).
Table A24.
Independent samples t-test (system evaluation scale).
Appendix A.9
Appendix A.9 reports an exploratory comparison of post-to-retention change between the groups. For each participant, a change score was calculated as the retention test percentage minus the immediate post-test percentage. Negative values indicate a decline from the immediate to the delayed assessment. Because change-score variances differed, the Welch-corrected results are interpreted.
Table A25.
Independent samples t-test (change_score).
Appendix B
Appendix B.1
Within Appendix B.1, the design of the pre-test questions is presented.
- What is the name of the workspace in Adobe Illustrator where the final design is created?
- (a)
- Canvas
- (b)
- Artboard
- (c)
- Workspace
- (d)
- Frame
- Which tool allows the selection of individual points (anchor points) on a path?
- (a)
- Selection Tool
- (b)
- Direct Selection Tool
- (c)
- Pen Tool
- (d)
- Shape Builder Tool
- Which color format is most commonly used for print preparation?
- (a)
- RGB
- (b)
- HSB
- (c)
- LAB
- (d)
- CMYK
- Which tool is used for drawing precise vector lines and curves?
- (a)
- Brush Tool
- (b)
- Pencil Tool
- (c)
- Pen Tool
- (d)
- Line Tool
- Vector graphics can be scaled without loss of quality.
- (a)
- True
- (b)
- False
- Which tool allows combining and removing parts of shapes to create new forms?
- (a)
- Blend Tool
- (b)
- Gradient Tool
- (c)
- Knife Tool
- (d)
- Shape Builder Tool
- What does it mean when graphics in an Illustrator document are “linked”?
- (a)
- The graphics are in a separate file and connected to the document
- (b)
- The graphics are embedded in the document
- (c)
- The graphics are locked
- (d)
- The graphics are rasterized
- Which option allows aligning objects relative to the artboard?
- (a)
- Pathfinder
- (b)
- Transform
- (c)
- Align
- (d)
- Appearance
- Which transformation changes the size of an object?
- (a)
- Scale
- (b)
- Rotate
- (c)
- Reflect
- (d)
- Wrap
- Which option allows converting text into vector shapes (outline)?
- (a)
- Type > Create Outlines
- (b)
- Object > Expand
- (c)
- Type > Convert to Path
- (d)
- Type > Vectorize
- What is the main difference between raster and vector graphics?
- (a)
- Raster graphics use mathematically defined curves (Bezier curves)
- (b)
- Vector graphics use pixels
- (c)
- Raster graphics consist of pixels
- (d)
- There is no difference
- Which panel allows changing the stroke thickness?
- (a)
- Color panel
- (b)
- Stroke panel
- (c)
- Transform panel
- (d)
- Layers panel
- Which tool is used for precise movement and transformation of objects?
- (a)
- Selection Tool
- (b)
- Bild Tool
- (c)
- Pen Tool
- (d)
- Gradient Tool
- Which panel allows organizing objects into layers?
- (a)
- Transform panel
- (b)
- Appearance panel
- (c)
- Pathfinder panel
- (d)
- Layers panel
Appendix B.2
Within Appendix B.2, the design of the post-test questions is presented.
- Which dimensions were used for the business card in the lesson?
- (a)
- 100 × 70 mm
- (b)
- 90 × 60 mm
- (c)
- 80 × 50 mm
- (d)
- 85 × 55 mm
- What bleed value was set in the document?
- (a)
- 1 mm
- (b)
- 2 mm
- (c)
- 3 mm
- (d)
- 5 mm
- Which color mode was selected for the document used to create a business card for print?
- (a)
- CMYK
- (b)
- RGB
- (c)
- LAB
- (d)
- Grayscale
- What raster-effects resolution was set for print?
- (a)
- 72 ppi
- (b)
- 150 ppi
- (c)
- 300 ppi
- (d)
- 600 ppi
- Which tool was used to create the basic rectangle in the document?
- (a)
- Pen Tool
- (b)
- Line Tool
- (c)
- Shape Builder Tool
- (d)
- Rectangle Tool
- Which option allows centering objects relative to the artboard?
- (a)
- Pathfinder
- (b)
- Align to Artboard
- (c)
- Appearance
- (d)
- Transform
- Which tool was used for drawing lines in the design?
- (a)
- Pen Tool
- (b)
- Pencil Tool
- (c)
- Brush Tool
- (d)
- Line Segment Tool
- Which tool was used to refine and smooth drawn lines?
- (a)
- Smooth Tool
- (b)
- Blur Tool
- (c)
- Wrap Tool
- (d)
- Gradient Tool
- Which tool allows moving anchor points on a line?
- (a)
- Selection Tool
- (b)
- Direct Selection Tool
- (c)
- Shape Builder Tool
- (d)
- Rotate Tool
- Which tool allows dividing surfaces into multiple parts so they can be colored separately?
- (a)
- Pathfinder
- (b)
- Shape Builder Tool
- (c)
- Gradient Tool
- (d)
- Knife Tool
- Which panel is used to change the color of an object?
- (a)
- Stroke panel
- (b)
- Layers panel
- (c)
- Color panel
- (d)
- Appearance panel
- What happens when the “Maintain proportions” option is enabled during object transformation?
- (a)
- The object rotates
- (b)
- Width and height change proportionally
- (c)
- Only the height changes
- (d)
- Only the width changes
- Why are bleed margins used in print preparation?
- (a)
- To avoid white edges after trimming
- (b)
- To center the design
- (c)
- To reduce file size
- (d)
- To speed up the printing process
- What is the purpose of the Object → Hide → Selection option used in the lesson?
- (a)
- Deleting the object
- (b)
- Temporarily hiding the object
- (c)
- Grouping objects
- (d)
- Locking the object
Appendix B.3
Within Appendix B.3, the design of the practical task is presented.
TASK DESCRIPTION
Your task is to create a business card:
- Format 90 × 60 mm;
- Bleed value of 3 mm on all four sides;
- Document color mode CMYK.
The business card should ultimately look as follows:
Figure A1.
Final design of the business card.
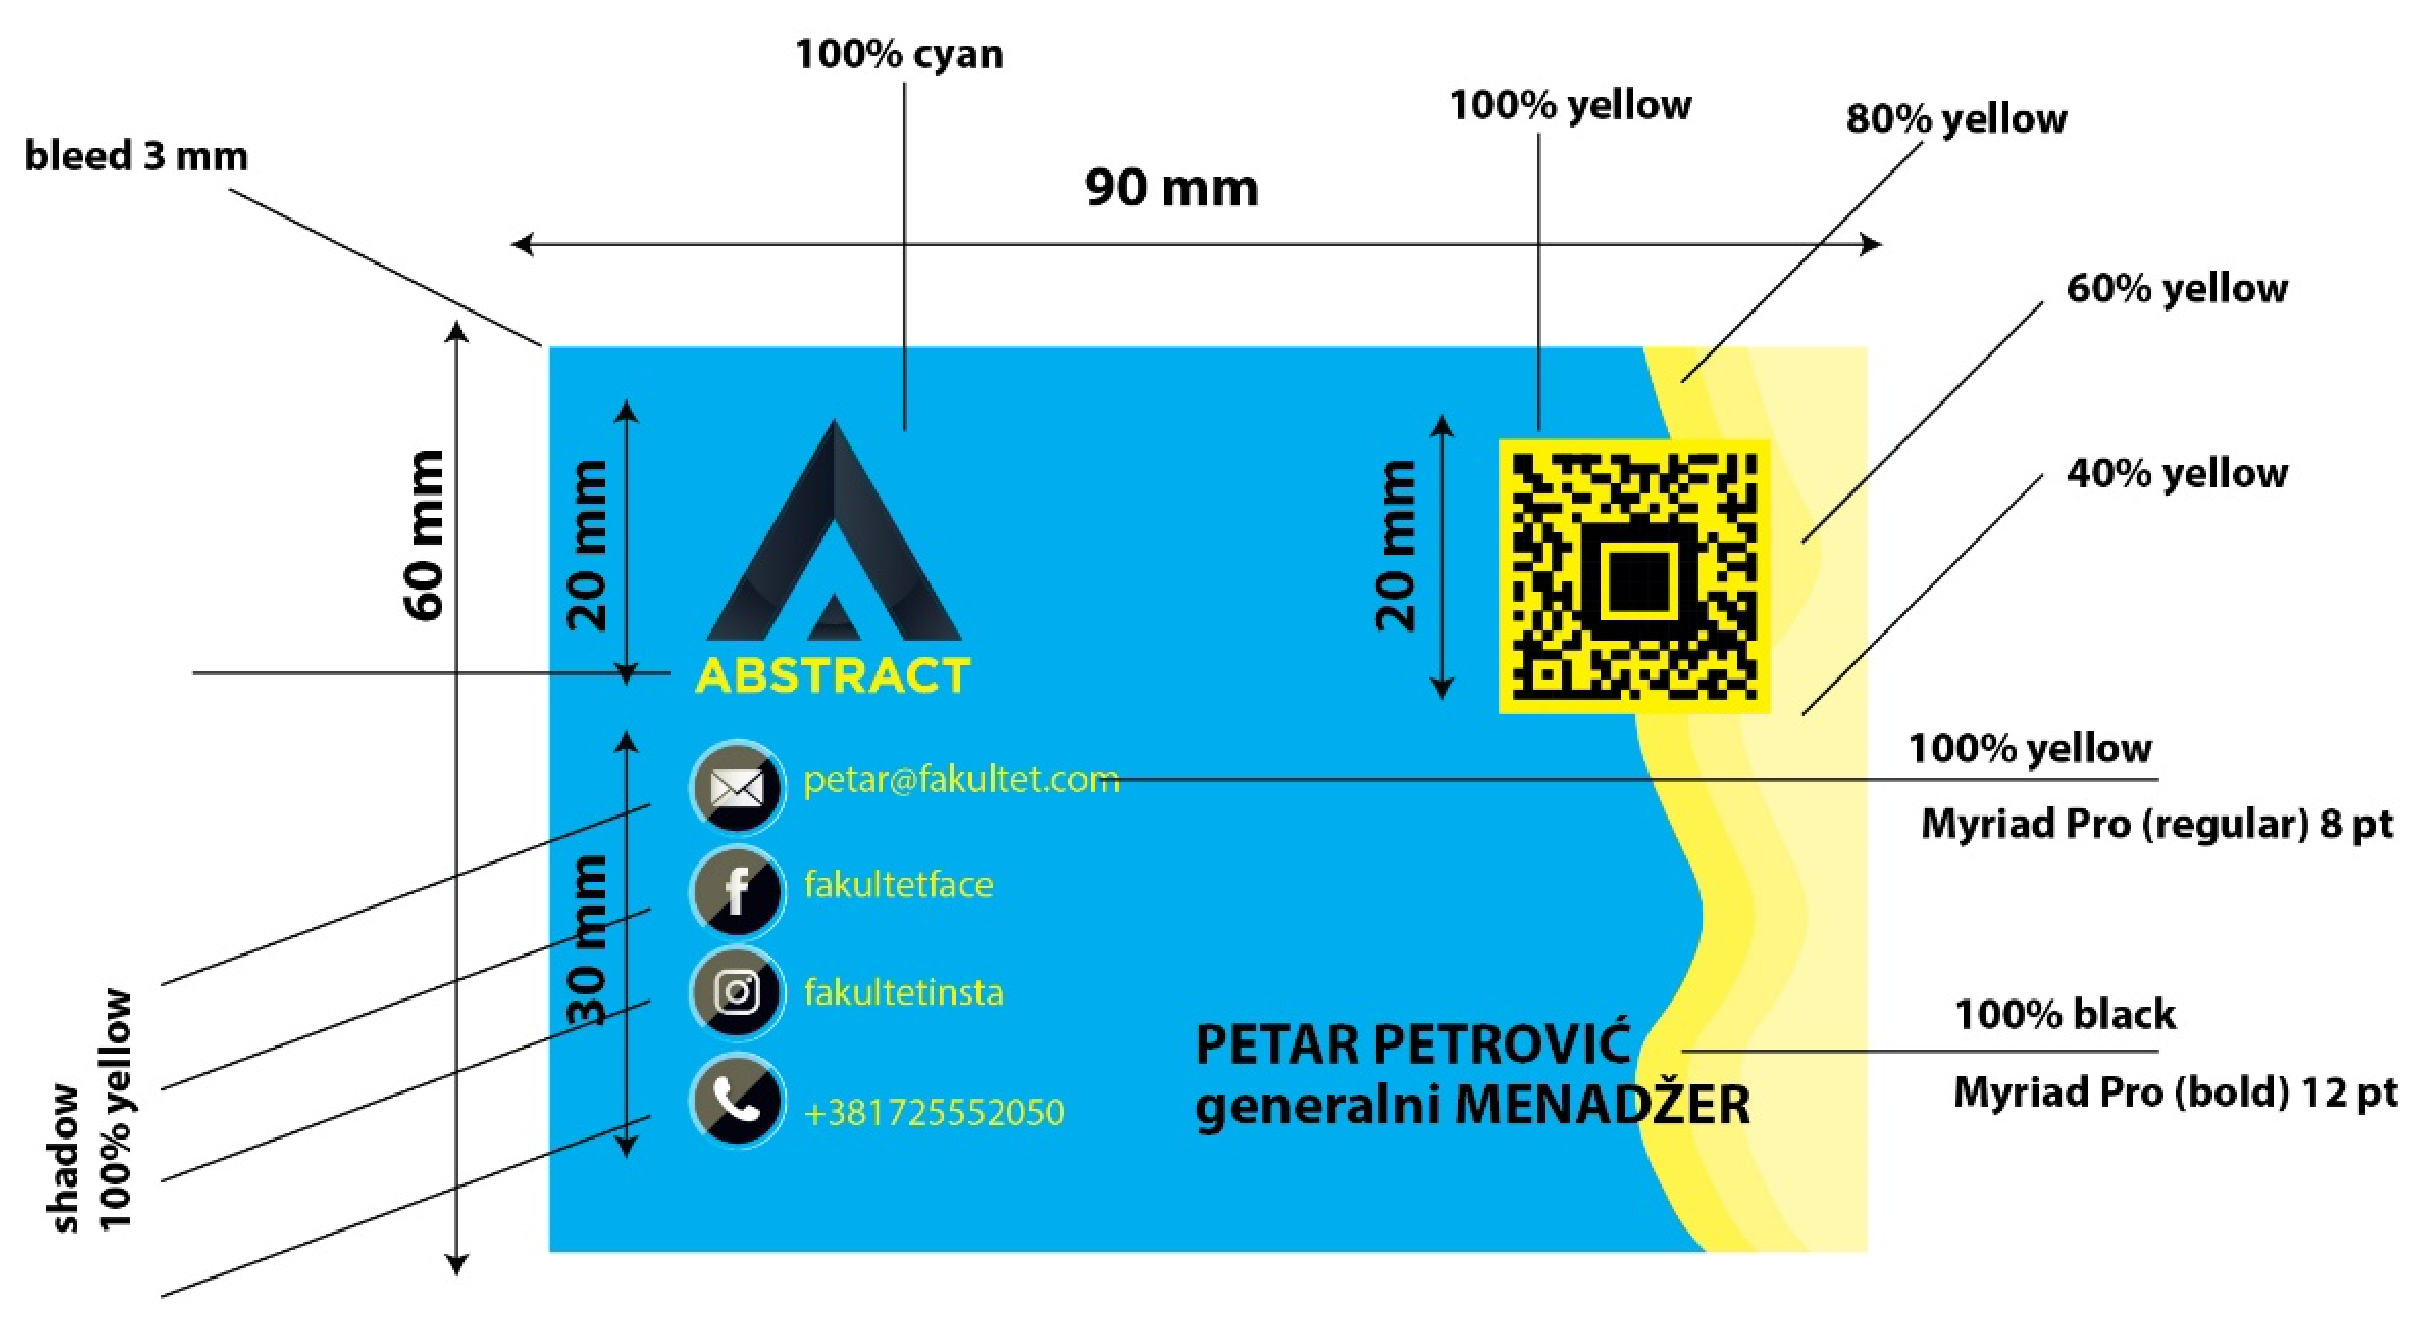
Important guidelines for accurate task execution:
- The background of the rectangle is 100% cyan.
- The “waves” on the right half of the business card are colored as 80% yellow, 60% yellow, and 40% yellow.
- The icons are located in the file Ikonice.ai. The total height of the icons is 30 mm. The color of the upper half of the shadow on the icons is changed to 100% yellow.
- The text next to the icons is 100% yellow, font Myriad Pro (Regular) 8 pt.
- The text “PETAR PETROVIĆ general MANAGER” is 100% black and uses the font Myriad Pro (Bold) 12 pt.
- The logo is taken from the file Logo.ai and has a total height of 20 mm. The color of the name in the logo is changed to 100% yellow.
- The barcode is taken from the file Bar kod.ai. Its total height is 20 mm, and the background is colored 100% yellow.
- The file is saved as a package on the computer desktop.
Appendix B.4
Within Appendix B.4, the design of the evaluation questionnaires is presented.
- The instructional material was clear and understandable (material clarity).
- The explanation of procedures in Illustrator was easy to follow (ease of following procedures).
- The material maintained my attention during learning (attention during learning).
- The material helped me understand how the task is performed (task understanding).
- During the lesson, I was focused and engaged (focus and engagement).
- This approach increased my interest in further work in Illustrator (interest in further work).
- Overall, I am satisfied with the way the material was presented (overall satisfaction).
- After the lesson, I feel that I could independently repeat the procedure (ability to repeat the procedure).
- I feel that I have learned something useful and applicable (useful and applicable).
- This method of presentation seems modern (modern presentation).
- The technical execution was at a satisfactory level (technical performance).
- Interaction with the digital material felt natural and seamless (natural interaction).
- What did you like the most about this learning approach? (open-ended question).
- What would you improve or change in the way the material was presented? (open-ended question).
- How would you briefly describe your experience during this lesson? (open-ended question).
Appendix B.5
Within Appendix B.5, the design of the retention test questions is presented.
- When creating a business card document in Illustrator in the lesson, was the format 80 × 50 mm used?
- (a)
- True
- (b)
- False
- Bleed is a margin value that is most commonly set to 3 mm.
- (a)
- True
- (b)
- False
- The color mode for print is:
- (a)
- RGB
- (b)
- CMYK
- (c)
- LAB
- (d)
- HSB
- Which Illustrator tool allows quick drawing of rectangular shapes as a basis for design?
- (a)
- Rectangle Tool
- (b)
- Pen Tool
- (c)
- Line Segment Tool
- (d)
- Shape Builder Tool
- If you want an object to be vertically centered relative to the artboard, which option in the Align panel should be selected?
- (a)
- Vertical Center Alignment
- (b)
- Horizontal Center Alignment
- (c)
- Align to Artboard
- (d)
- Align to Grid
- The Pencil Tool allows:
- (a)
- Technical line drawing
- (b)
- Precise line drawing
- (c)
- Limited line drawing
- (d)
- Freehand line drawing
- The Direct Selection Tool is used for:
- (a)
- Precise movement of individual parts (points) of an object
- (b)
- Precise rotation of individual parts (points) of an object
- (c)
- Precise scaling of individual parts (points) of an object
- (d)
- Precise addition of individual parts (points) of an object
- Which option allows hiding the selected object?
- (a)
- Object → Hide → Selection
- (b)
- Object → Lock
- (c)
- View → Hide
- (d)
- Edit → Hide
- The Package option allows:
- (a)
- Saving the document like the Save option
- (b)
- Saving the document like the Save As option
- (c)
- Saving the document like the Save option while also saving fonts
- (d)
- Saving the document like the Save option while also saving fonts and linked files
- Which tool is used to sample a color from the workspace?
- (a)
- Color Tool
- (b)
- Eyedropper Tool
- (c)
- Swatches Tool
- (d)
- Line Tool
Appendix C
Table A26.
Practical-task performance rubric (maximum 22 points).
Table A27.
Practical-task error checklist (maximum 23 errors).
References
- Lin, Y.; Yu, Z. A meta-analysis evaluating the effectiveness of instructional video technologies. Technol. Knowl. Learn. 2024, 29, 2081–2115. [Google Scholar]
- Beege, M.; Schroeder, N.L.; Heidig, S.; Rey, G.D.; Schneider, S. The instructor presence effect and its moderators in instructional video: A series of meta-analyses. Educ. Res. Rev. 2023, 41, 100564. [Google Scholar] [CrossRef] [Scilit]
- Noetel, M.; Griffith, S.; Delaney, O.; Sanders, T.; Parker, P.; Del Pozo Cruz, B.; Lonsdale, C. Video improves learning in higher education: A systematic review. Rev. Educ. Res. 2021, 91, 204–236. [Google Scholar] [CrossRef] [Scilit]
- Mayer, R.E. The past, present, and future of the cognitive theory of multimedia learning. Educ. Psychol. Rev. 2024, 36, 8. [Google Scholar] [CrossRef] [Scilit]
- AlShaikh, R.; Al-Mali, N.; Almasre, M. The implementation of the cognitive theory of multimedia learning in the design and evaluation of an AI educational video assistant utilizing large language models. Heliyon 2024, 10, e25361. [Google Scholar] [CrossRef] [Scilit] [PubMed]
- Cavanagh, T.M.; Kiersch, C. Using commonly-available technologies to create online multimedia lessons through the application of the Cognitive Theory of Multimedia Learning. Educ. Technol. Res. Dev. 2023, 71, 1033–1053. [Google Scholar]
- Park, E.E. Expanding Reference through Cognitive Theory of Multimedia Learning Videos. J. Acad. Librariansh. 2022, 48, 102522. [Google Scholar] [CrossRef] [Scilit]
- Ibrahim, M. Implications of designing instructional video using cognitive theory of multimedia learning. Crit. Quest. Educ. 2012, 3, 83–104. [Google Scholar]
- Mayer, R.E. Multimedia learning. Psychol. Learn. Motiv. 2002, 41, 85–139. [Google Scholar] [CrossRef] [Scilit] [PubMed]
- Shamim, M. Application of Cognitive Theory of Multimedia Learning in Under graduate Surgery Course. J. Surg. Res. Prac. 2018, 5, 065. [Google Scholar] [CrossRef] [Scilit]
- Ashrafi, A.M.; Hosna, R. Comparative study of the use of video-based learning media and textbooks on fiqh learning outcomes. Urwatul Wutsqo J. Studi Kependidikan Keislam. 2025, 14, 859–873. [Google Scholar] [CrossRef]
- Lim, J. The Potential of Learning With AI-Generated Pedagogical Agents in Instructional Videos. In Proceedings of the CHI Conference on Human Factors in Computing Systems, Honolulu, HI, USA, 11–16 May 2024. [Google Scholar]
- Truss, A.; McBride, K.; Porter, H.; Anderson, V.; Stilwell, G.; Philippou, C.; Taggart, A. Learner engagement with instructor-generated video. Br. J. Educ. Technol. 2024, 55, 2192–2211. [Google Scholar] [CrossRef] [Scilit]
- Wiafe, I.; Ekpezu, A.O.; Gyamera, G.O.; Winful, F.B.P.; Atsakpo, E.D.; Nutropkor, C.; Gulliver, S. Comparative evaluation of learning technologies using a randomized controlled trial: Virtual reality, augmented reality, online video platforms, and traditional classroom learning. Educ. Inf. Technol. 2025, 30, 11775–11795. [Google Scholar] [CrossRef] [Scilit]
- Çeken, B.; Taşkın, N. Examination of multimedia learning principles in augmented reality and virtual reality learning environments. J. Comput. Assist. Learn. 2025, 41, e13097. [Google Scholar]
- Yuan, M.; Zeng, J.; Wang, A.; Shang, J. Would It Be Better if Instructors Technically Adjust Their Image or Voice in Online Courses? Impact of the Way of Instructor Presence on Online Learning. Front. Psychol. 2021, 12, 746857. [Google Scholar] [CrossRef] [Scilit] [PubMed]
- Yusuf, H.; Money, A.; Daylamani-Zad, D. Pedagogical AI conversational agents in higher education: A conceptual framework and survey of the state of the art. Educ. Technol. Res. Dev. 2025, 73, 815–874. [Google Scholar] [CrossRef] [Scilit]
- Zhang, Y.; Lucas, M.; Bem-Haja, P.; Pedro, L. The effect of student acceptance on learning outcomes: AI-generated short videos versus paper materials. Comput. Educ. Artif. Intell. 2024, 7, 100286. [Google Scholar] [CrossRef] [Scilit]
- Tan, S.F. Perceptions of students on artificial intelligence-generated content avatar utilization in learning management systems. Asian Assoc. Open Univ. J. 2024, 19, 170–185. [Google Scholar] [CrossRef] [Scilit]
- Arkün-Kocadere, S.; Çağlar-Özhan, Ş. Video lectures with AI-generated instructors: Low video engagement, same performance as human instructors. Int. Rev. Res. Open Dis. 2024, 25, 350–369. [Google Scholar] [CrossRef] [Scilit]
- Hoang, C.; Miles, J.D.; Vu, K.P.L. Effectiveness of digital avatars in student engagement and learning. In Proceedings of the Human Interface and the Management of Information (HCII 2024), Washington, DC, USA, 29 June–4 July 2024. [Google Scholar]
- Polat, H.; Taş, N.; Kaban, A.; Kayaduman, H.; Battal, A. Human or Humanoid Animated Pedagogical Avatars in Video Lectures: The Impact of the Knowledge Type on Learning Outcomes. Int. J. Hum.-Comput. Interact. 2025, 41, 8912–8927. [Google Scholar] [CrossRef] [Scilit]
- Leiker, D.; Gyllen, A.R.; Eldesouky, I.; Cukurova, M. Generative AI for Learning: Investigating the Potential of Learning Videos with Synthetic Virtual Instructors. In Proceedings of the 24th International Conference on Artificial Intelligence in Education (AIED 2023), Tokyo, Japan, 3–7 July 2023. [Google Scholar]
- Netland, T.; von Dzengelevski, O.; Tesch, K.; Kwasnitschka, D. Comparing human-made and AI-generated teaching videos: An experimental study on learning effects. Comput. Educ. 2025, 224, 105164. [Google Scholar] [CrossRef] [Scilit]
- Xu, T.; Liu, Y.; Jin, Y.; Qu, Y.; Bai, J.; Zhang, W.; Zhou, Y. From recorded to AI-generated instructional videos: A comparison of learning performance and experience. Br. J. Educ. Technol. 2025, 56, 1463–1487. [Google Scholar] [CrossRef] [Scilit]
- Zhang, R.; Wu, Q. Impact of using virtual avatars in educational videos on user experience. Sci. Rep. 2024, 14, 6592. [Google Scholar] [CrossRef] [Scilit] [PubMed]
- Pi, Z.; Deng, L.; Wang, X.; Guo, P.; Xu, T.; Zhou, Y. The influences of a virtual instructor’s voice and appearance on learning from video lectures. J. Comput. Assist. Learn. 2022, 38, 1703–1713. [Google Scholar] [CrossRef] [Scilit]
- Daniels, D.; Lee, J.S. The impact of avatar Teachers on student learning and engagement in a virtual learning environment for online STEM courses. In Proceedings of the 9th International Conference (LCT 2022), Part of the 24th HCI International Conference (HCII 2022), Virtual Event, 26 June–1 July 2022. [Google Scholar]
- Phillips, K.; Hancock, G.; Miles, J.D. Instructor Avatars and Virtual Learning: How Does Instructor Type and Gender Affect Student Perceptions and Learning Outcomes? In Proceedings of the Human Interface and the Management of Information (HCII 2024), Washington, DC, USA, 29 June–4 July 2024. [Google Scholar]
- Lawson, A.P.; Mayer, R.E.; Adamo-Villani, N.; Benes, B.; Lei, X.; Cheng, J. Do Learners Recognize and Relate to the Emotions Displayed By Virtual Instructors? Int. J. Artif. Intell. Educ. 2021, 31, 134–153. [Google Scholar] [CrossRef] [Scilit]
- Lawson, P.A.; Mayer, R.E. Does the emotional stance of human and virtual instructors in instructional videos affect learning processes and outcomes? Contemp. Educ. Psychol. 2022, 70, 102080. [Google Scholar] [CrossRef] [Scilit]
- Xia, T.; Tan, M.; Guo, J. Avatars improve the quality of online learning: The role of attention and positive emotions. Educ. Inf. Technol. 2024, 29, 24203–24222. [Google Scholar] [CrossRef] [Scilit]
- Kašiković, N.; Glušac, D.; Premčevski, V.; Anđelković, A.; Tasić, N. Using Studio D-ID (Creative Reality Studio) in educational platform Asking. In Proceedings of the 2nd International Conference on Digital Education Trends and Challenges, Novi Sad, Serbia, 7–9 November 2025. [Google Scholar]
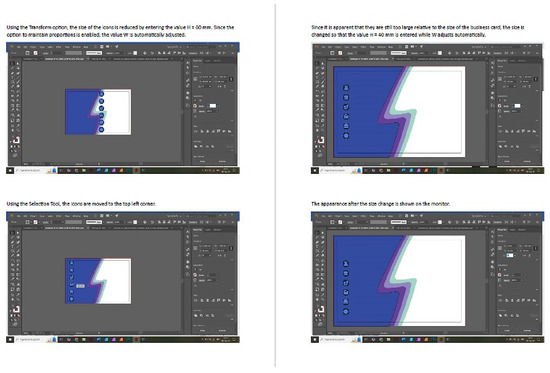
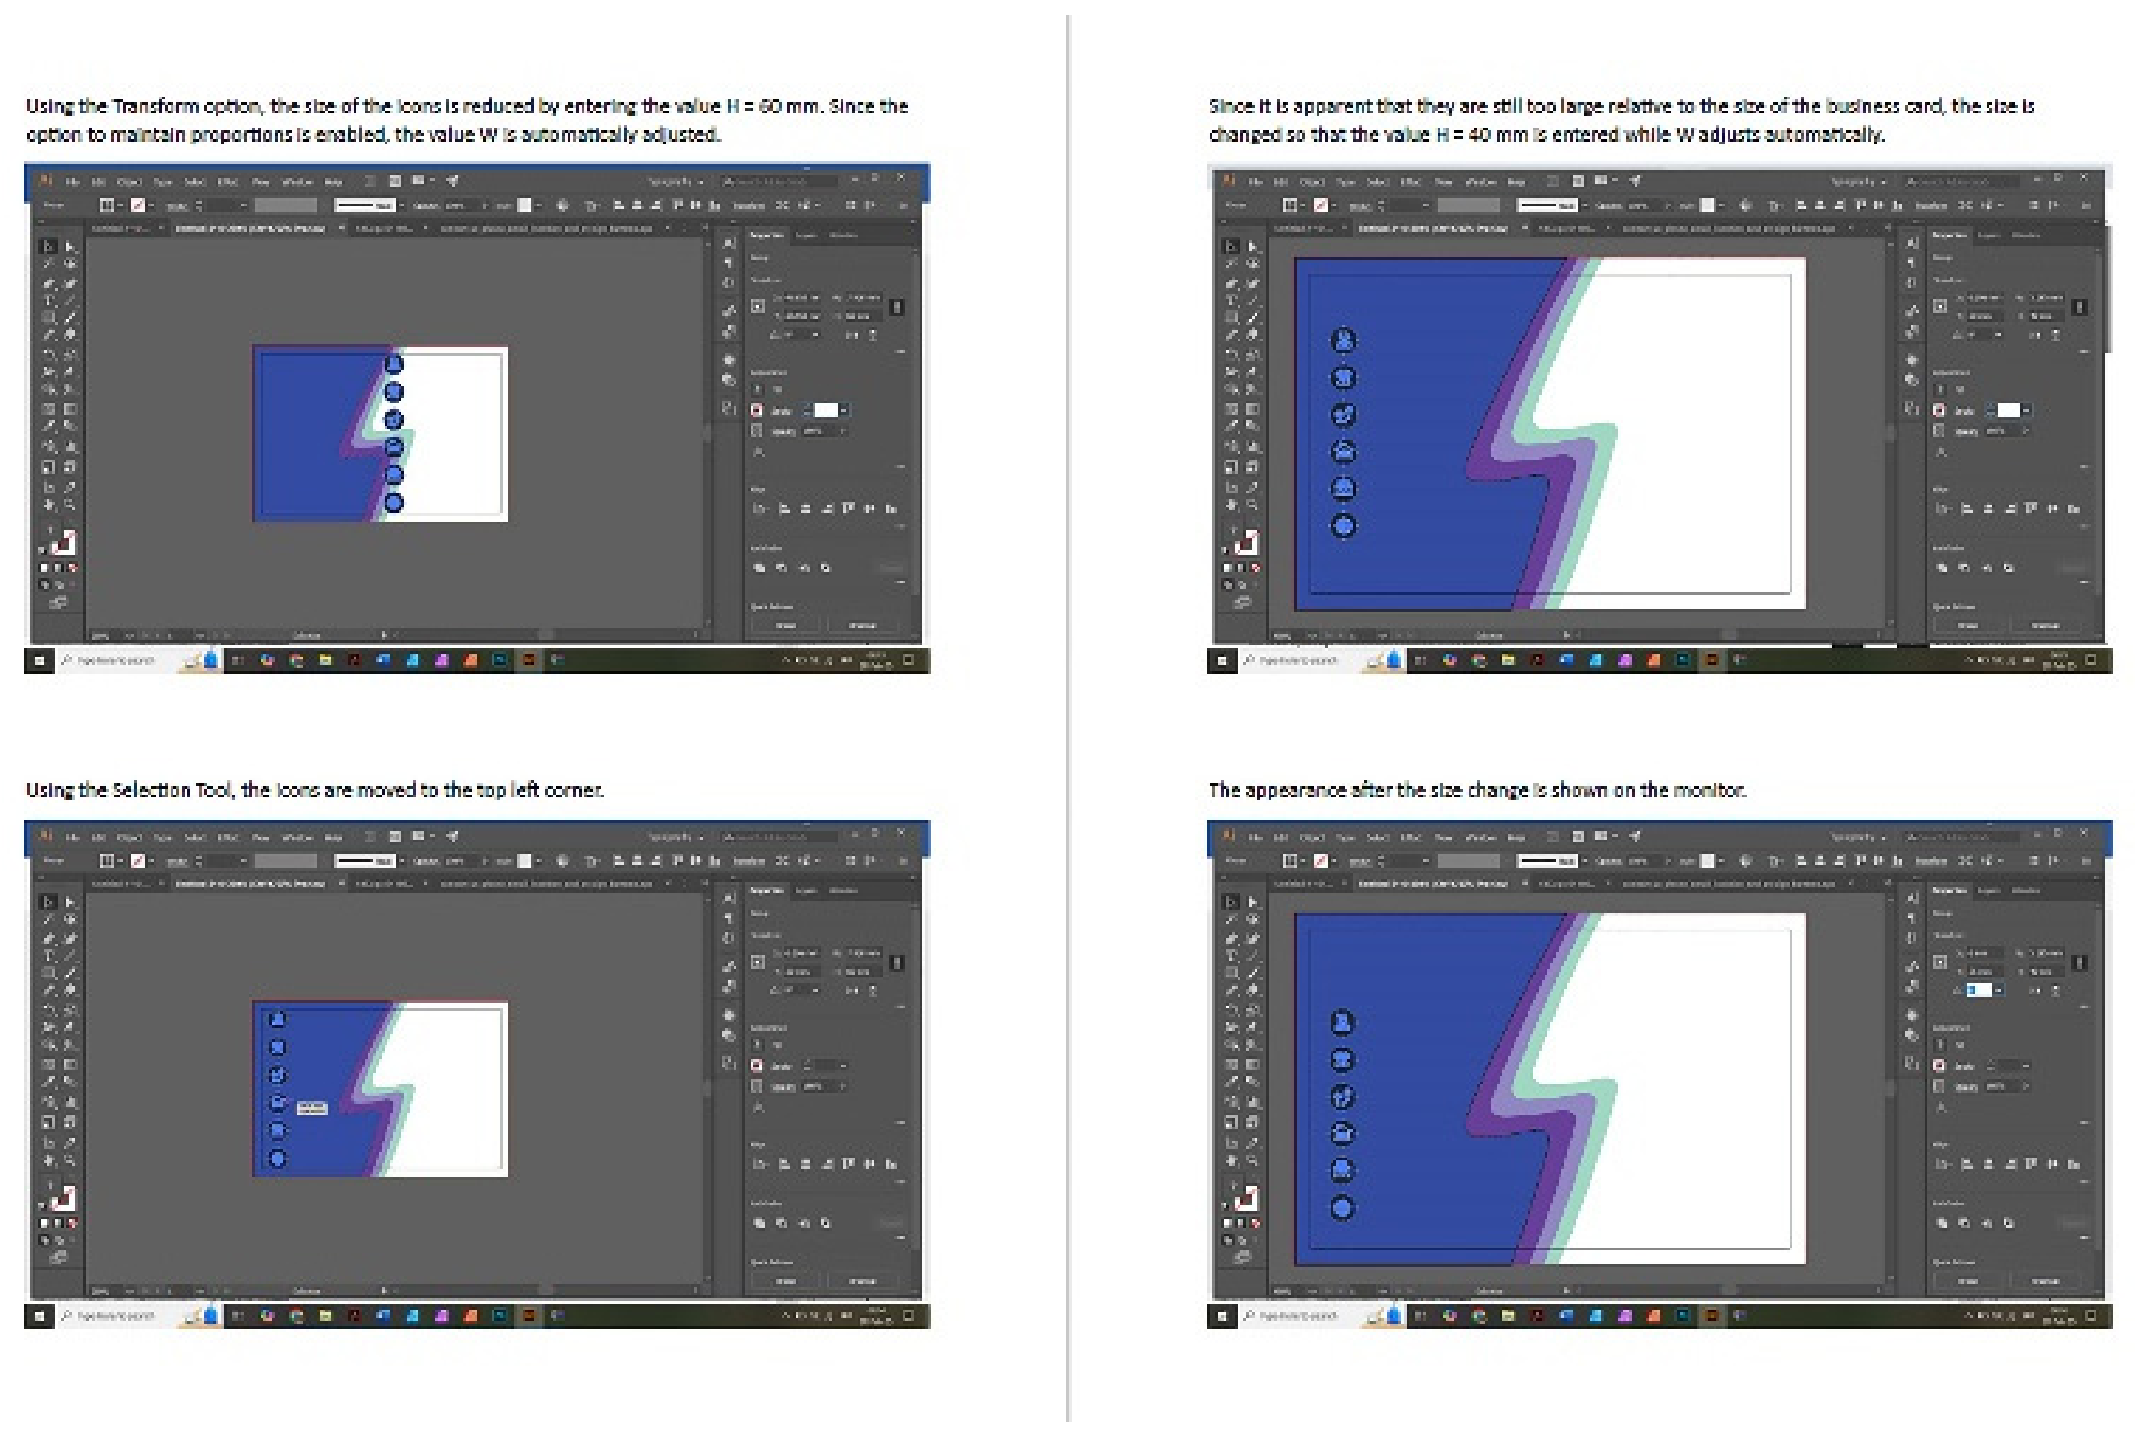
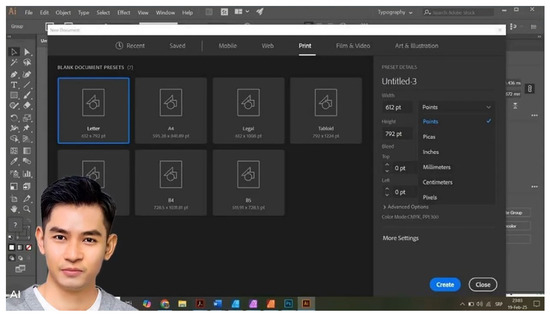
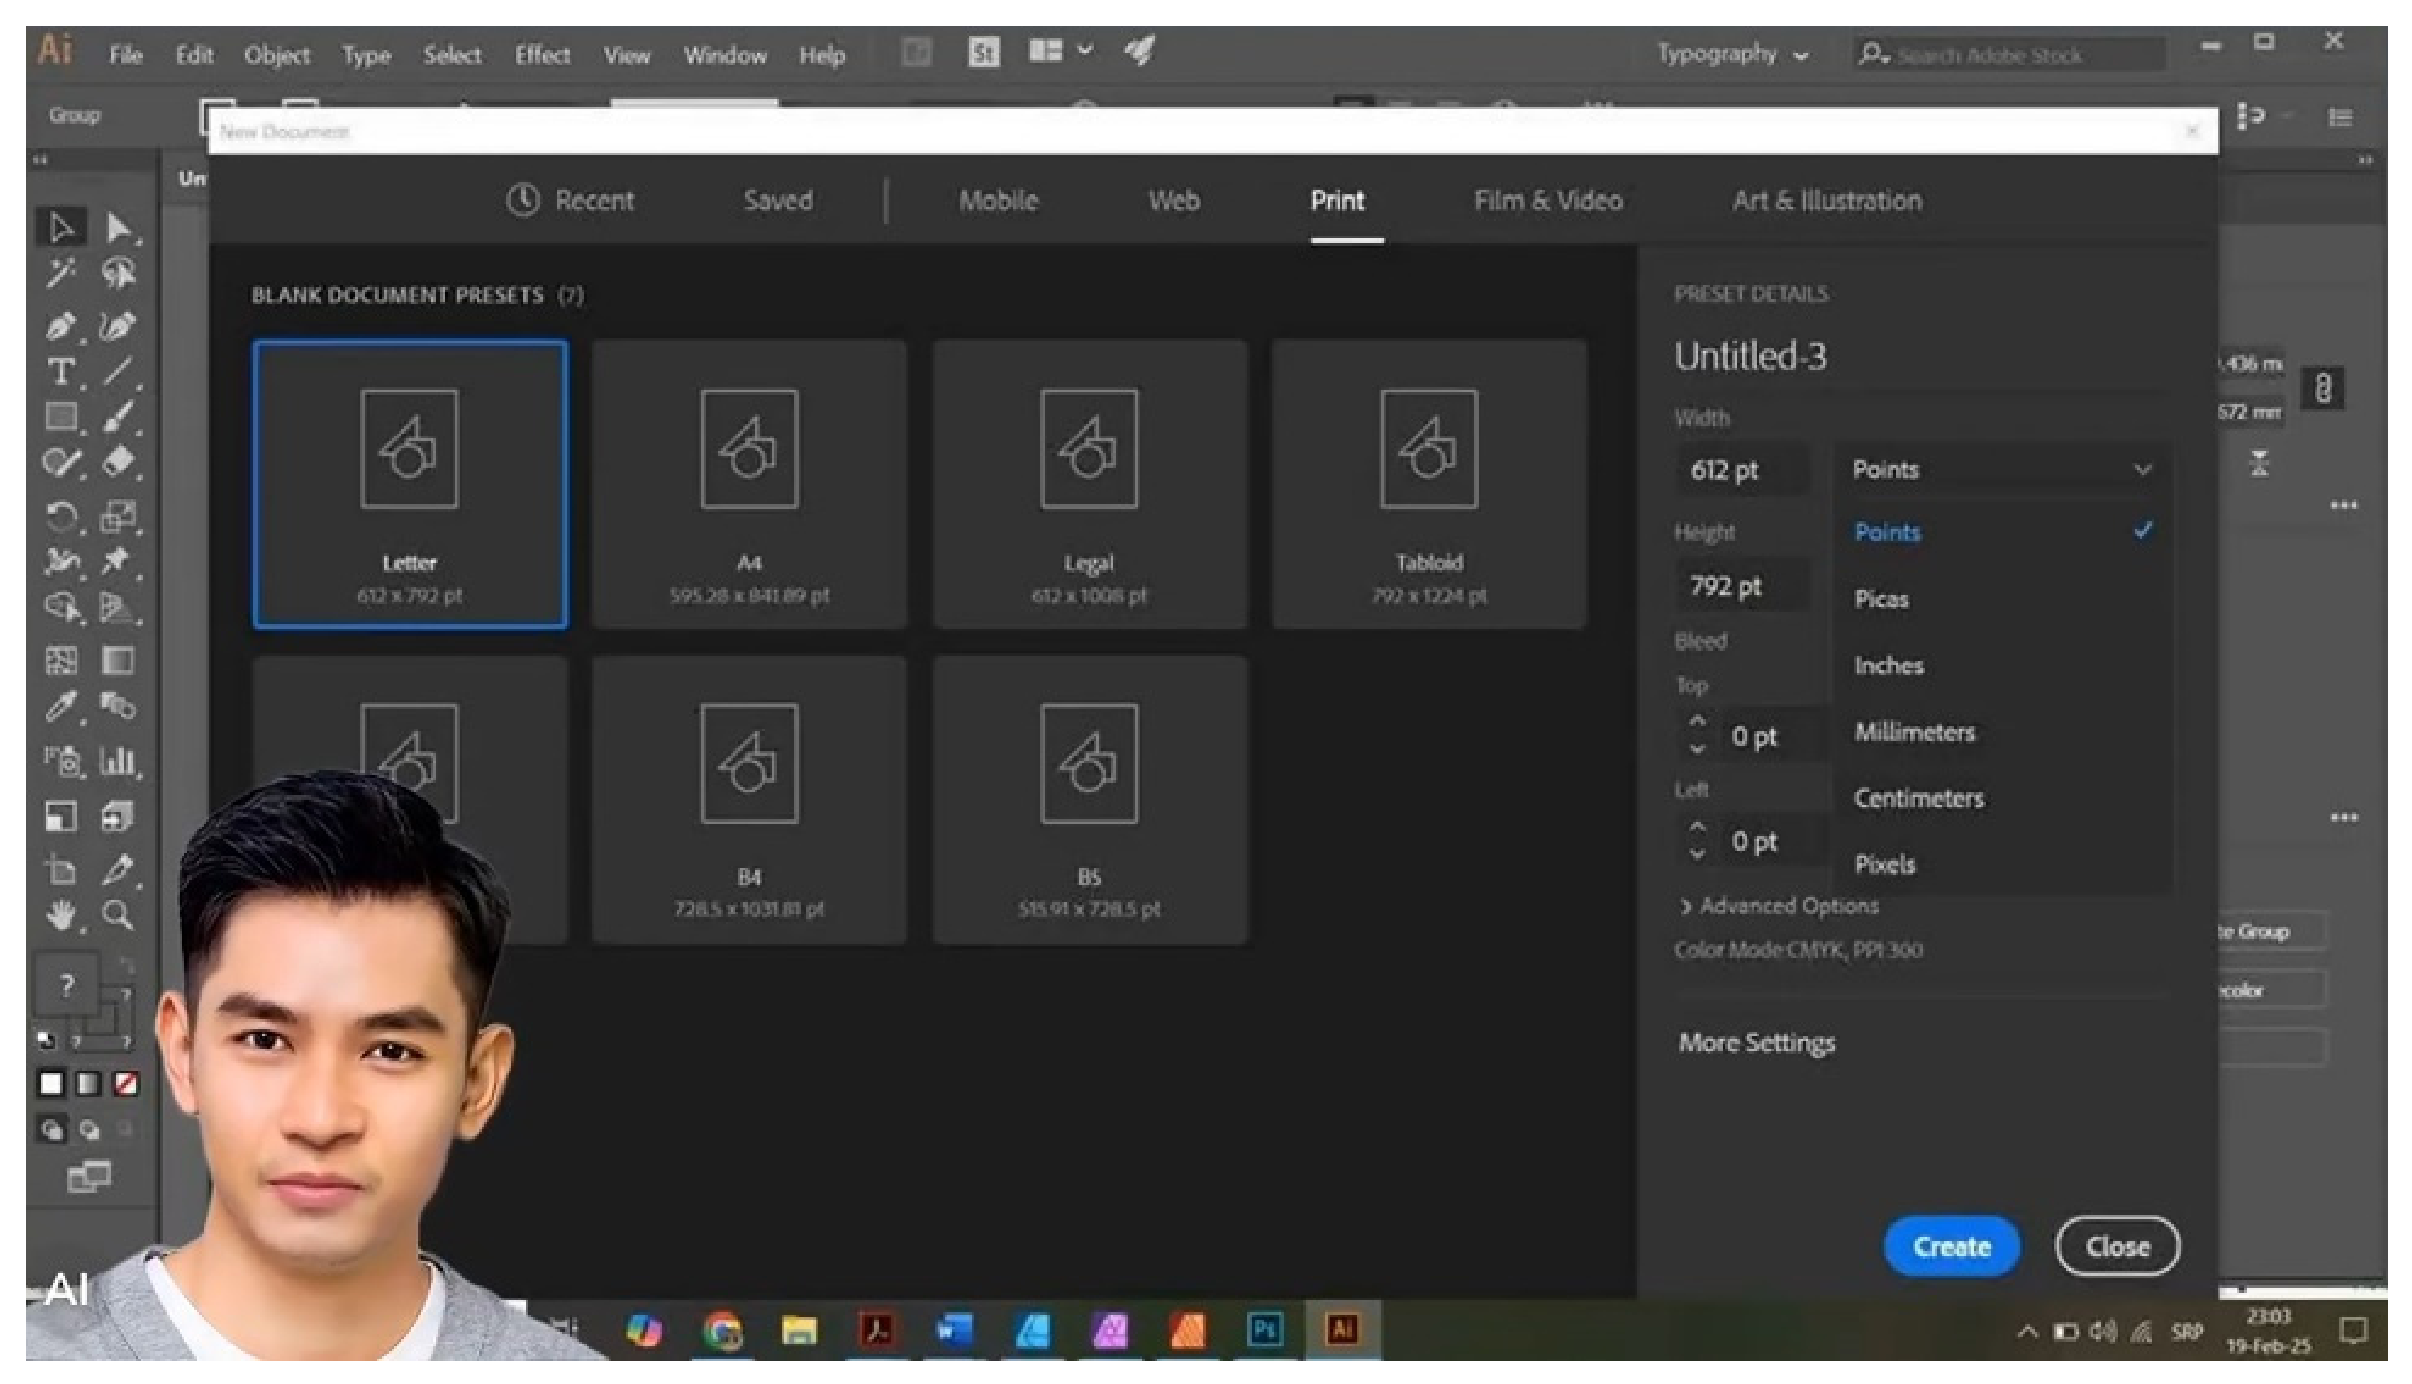
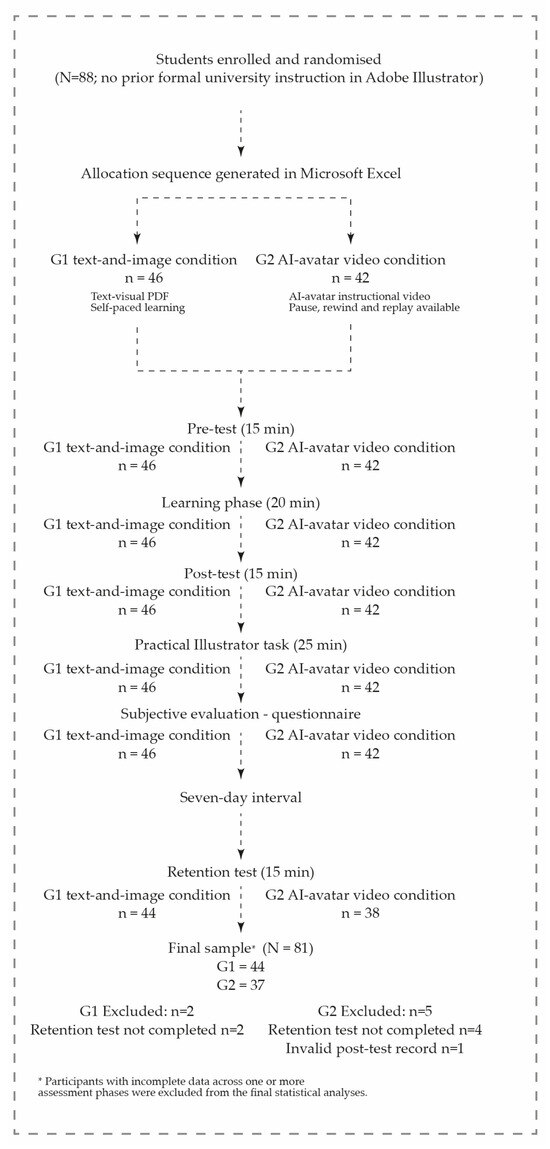
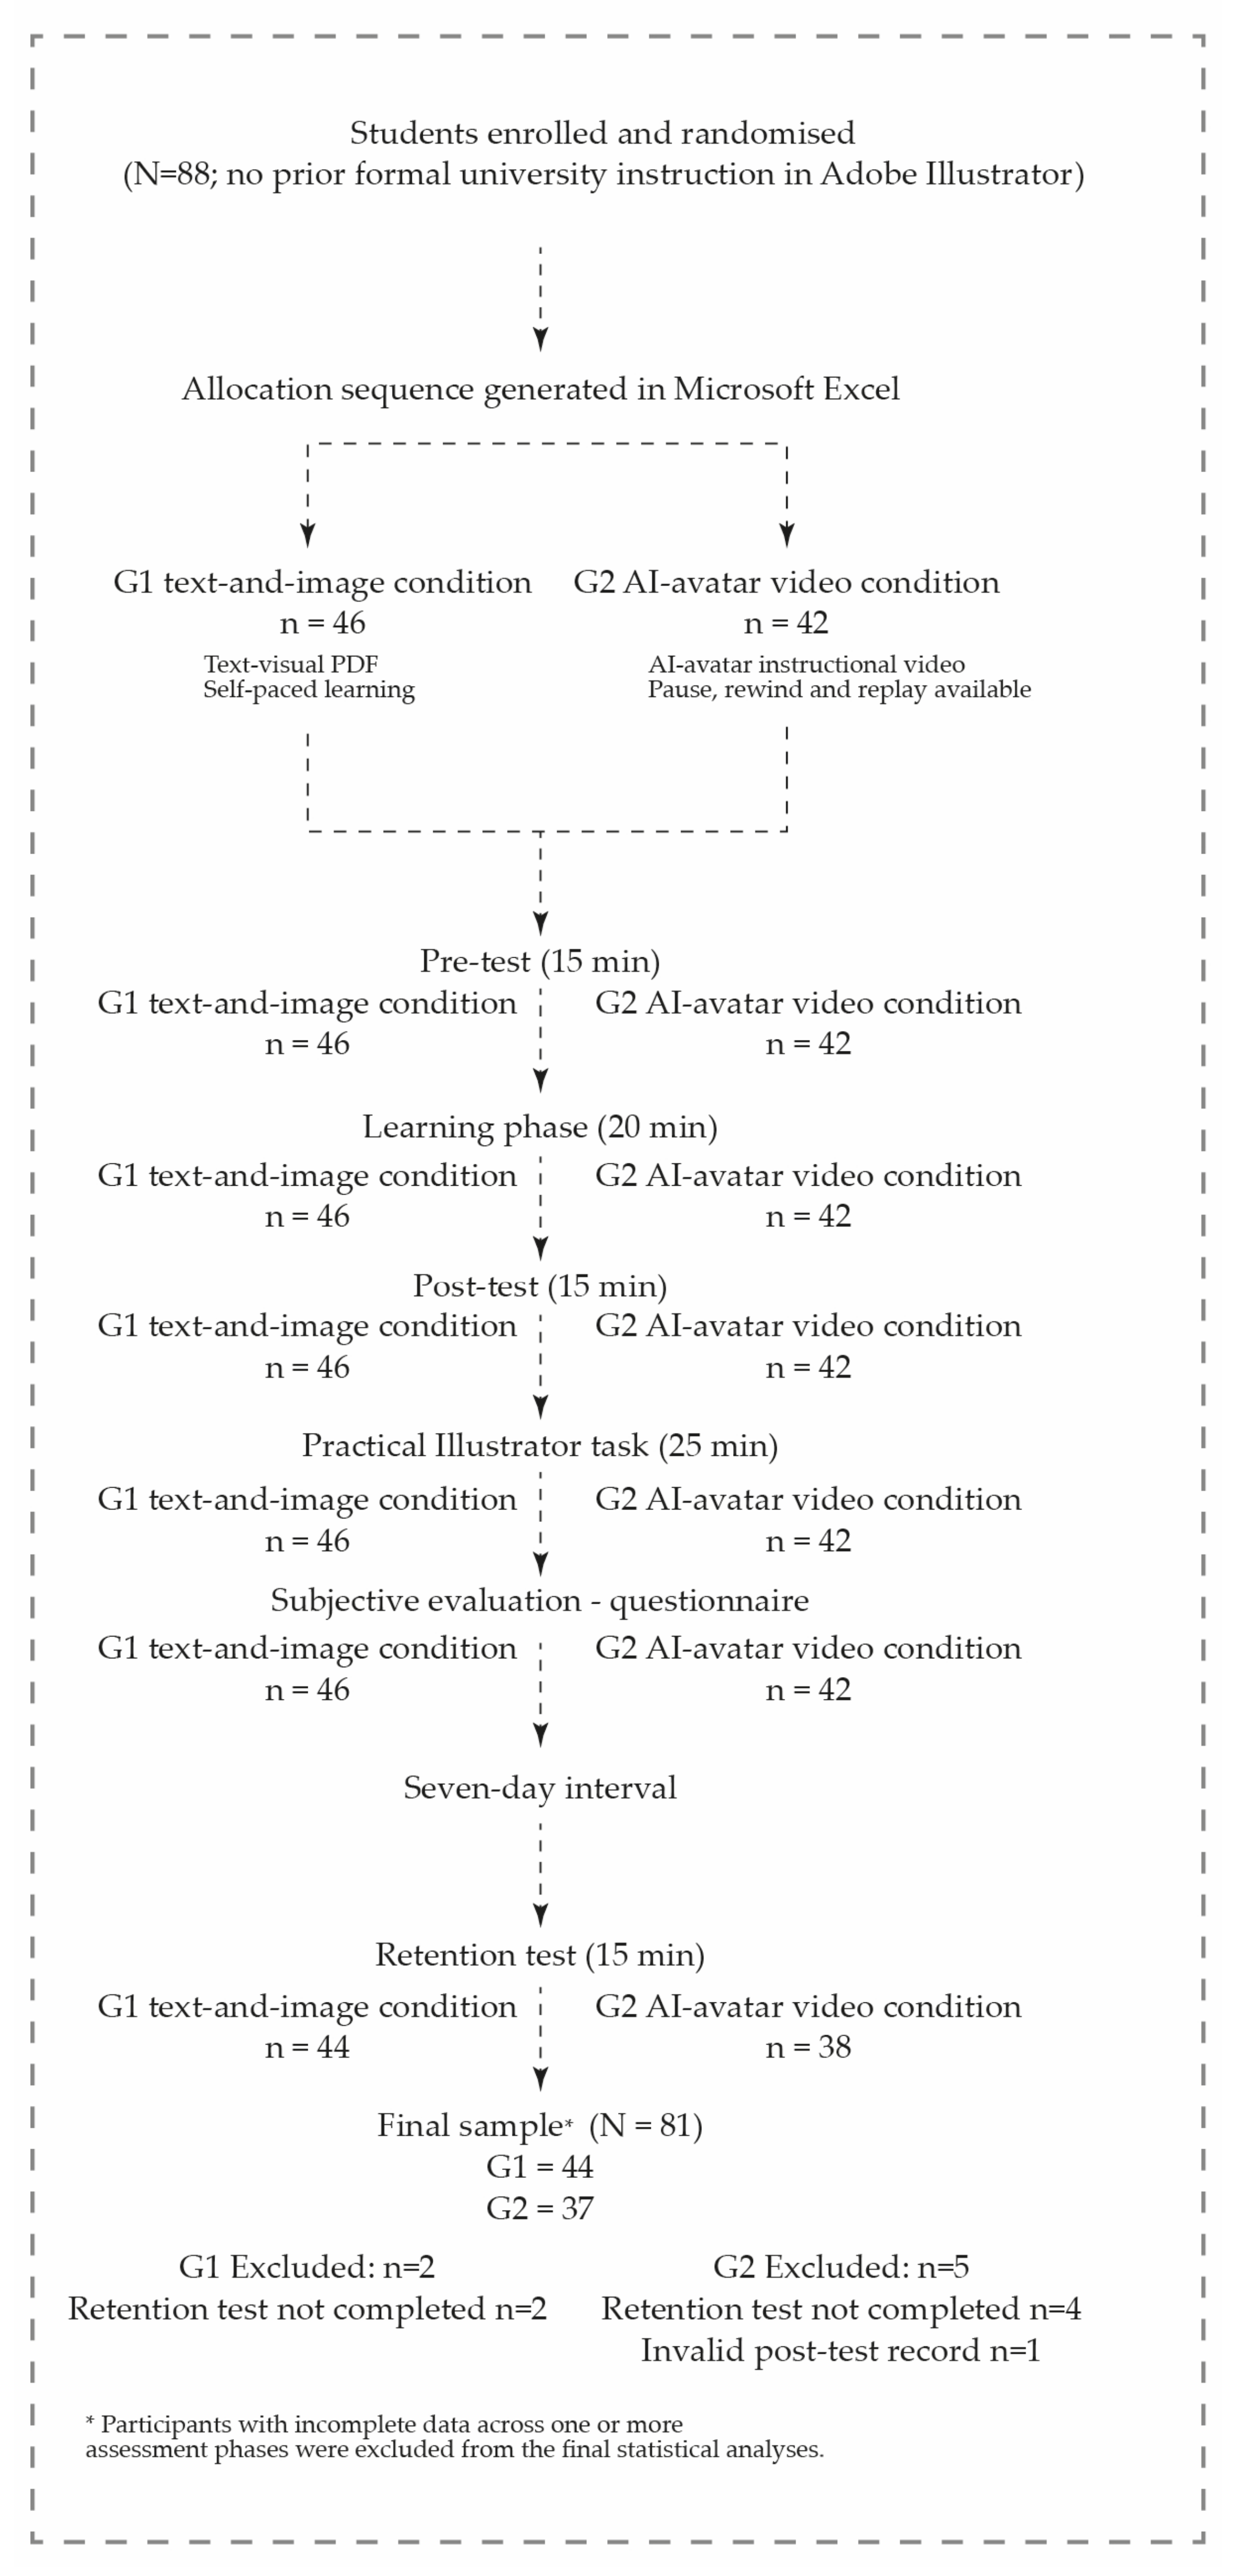
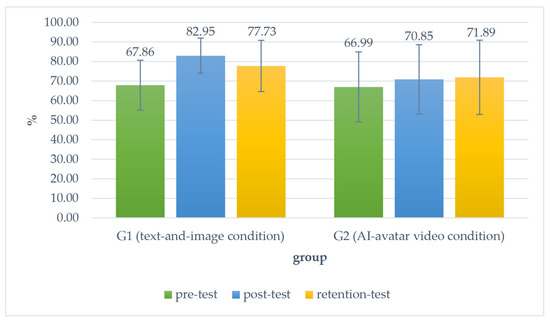
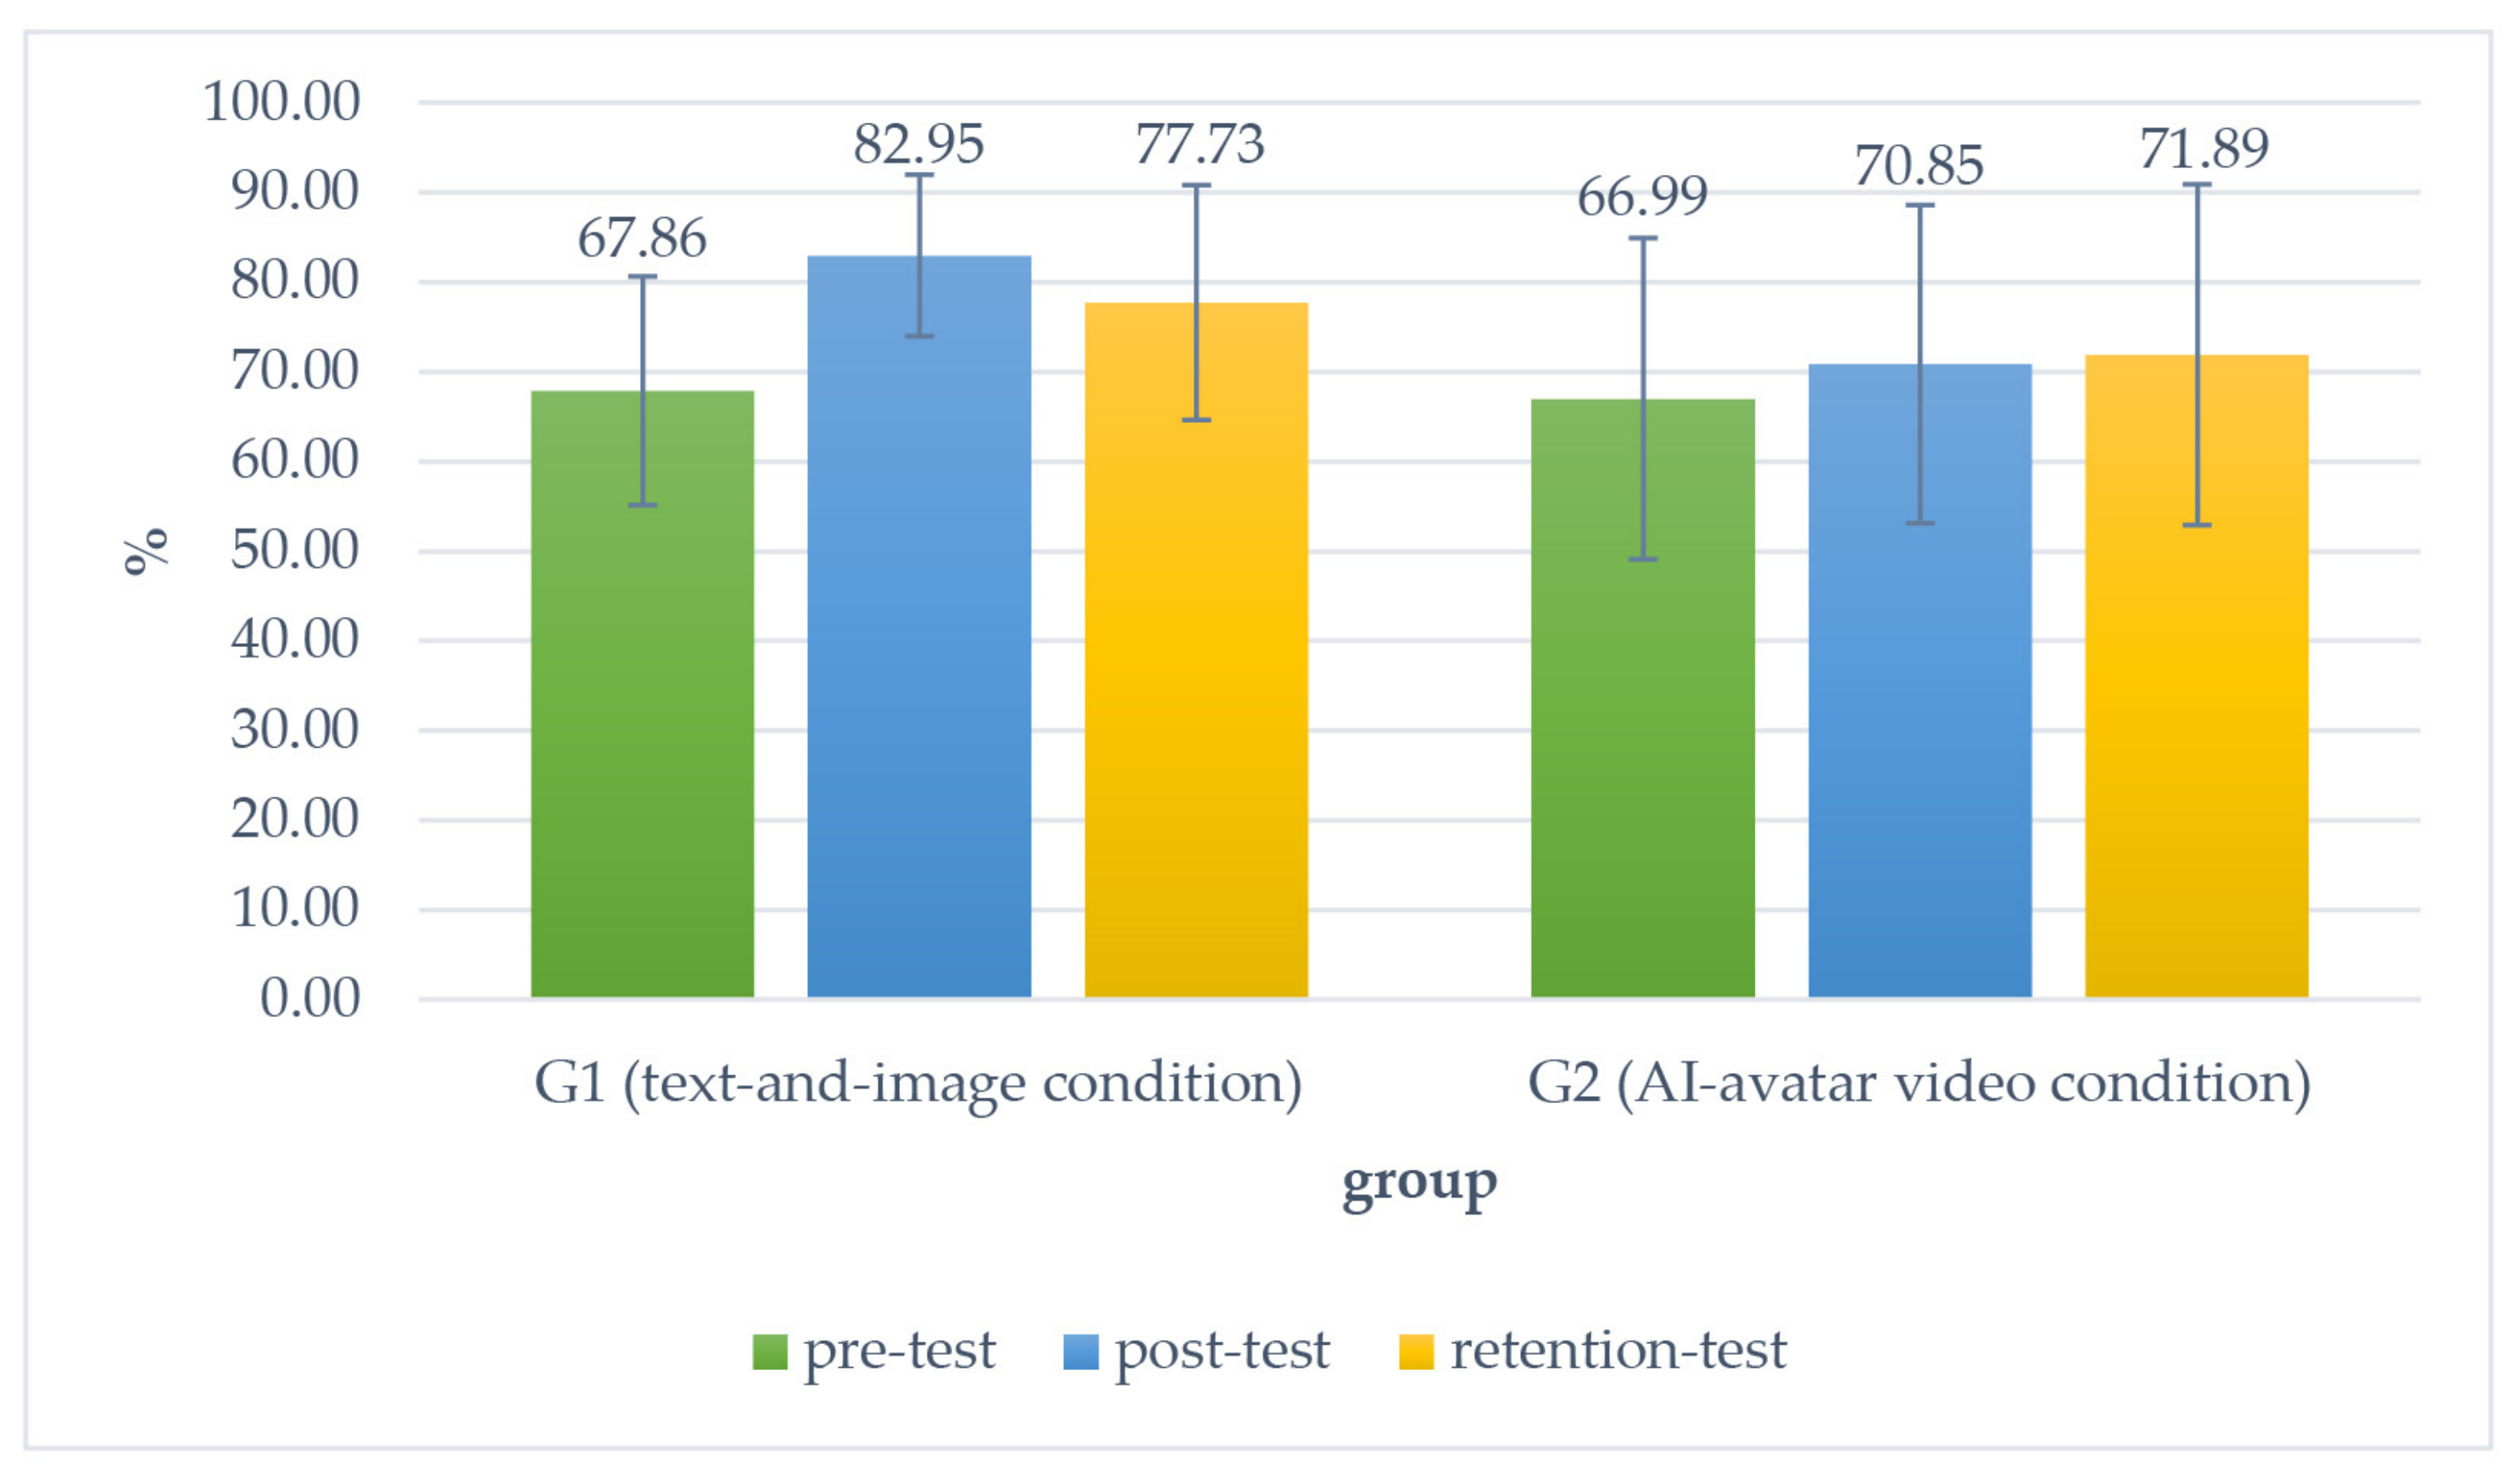
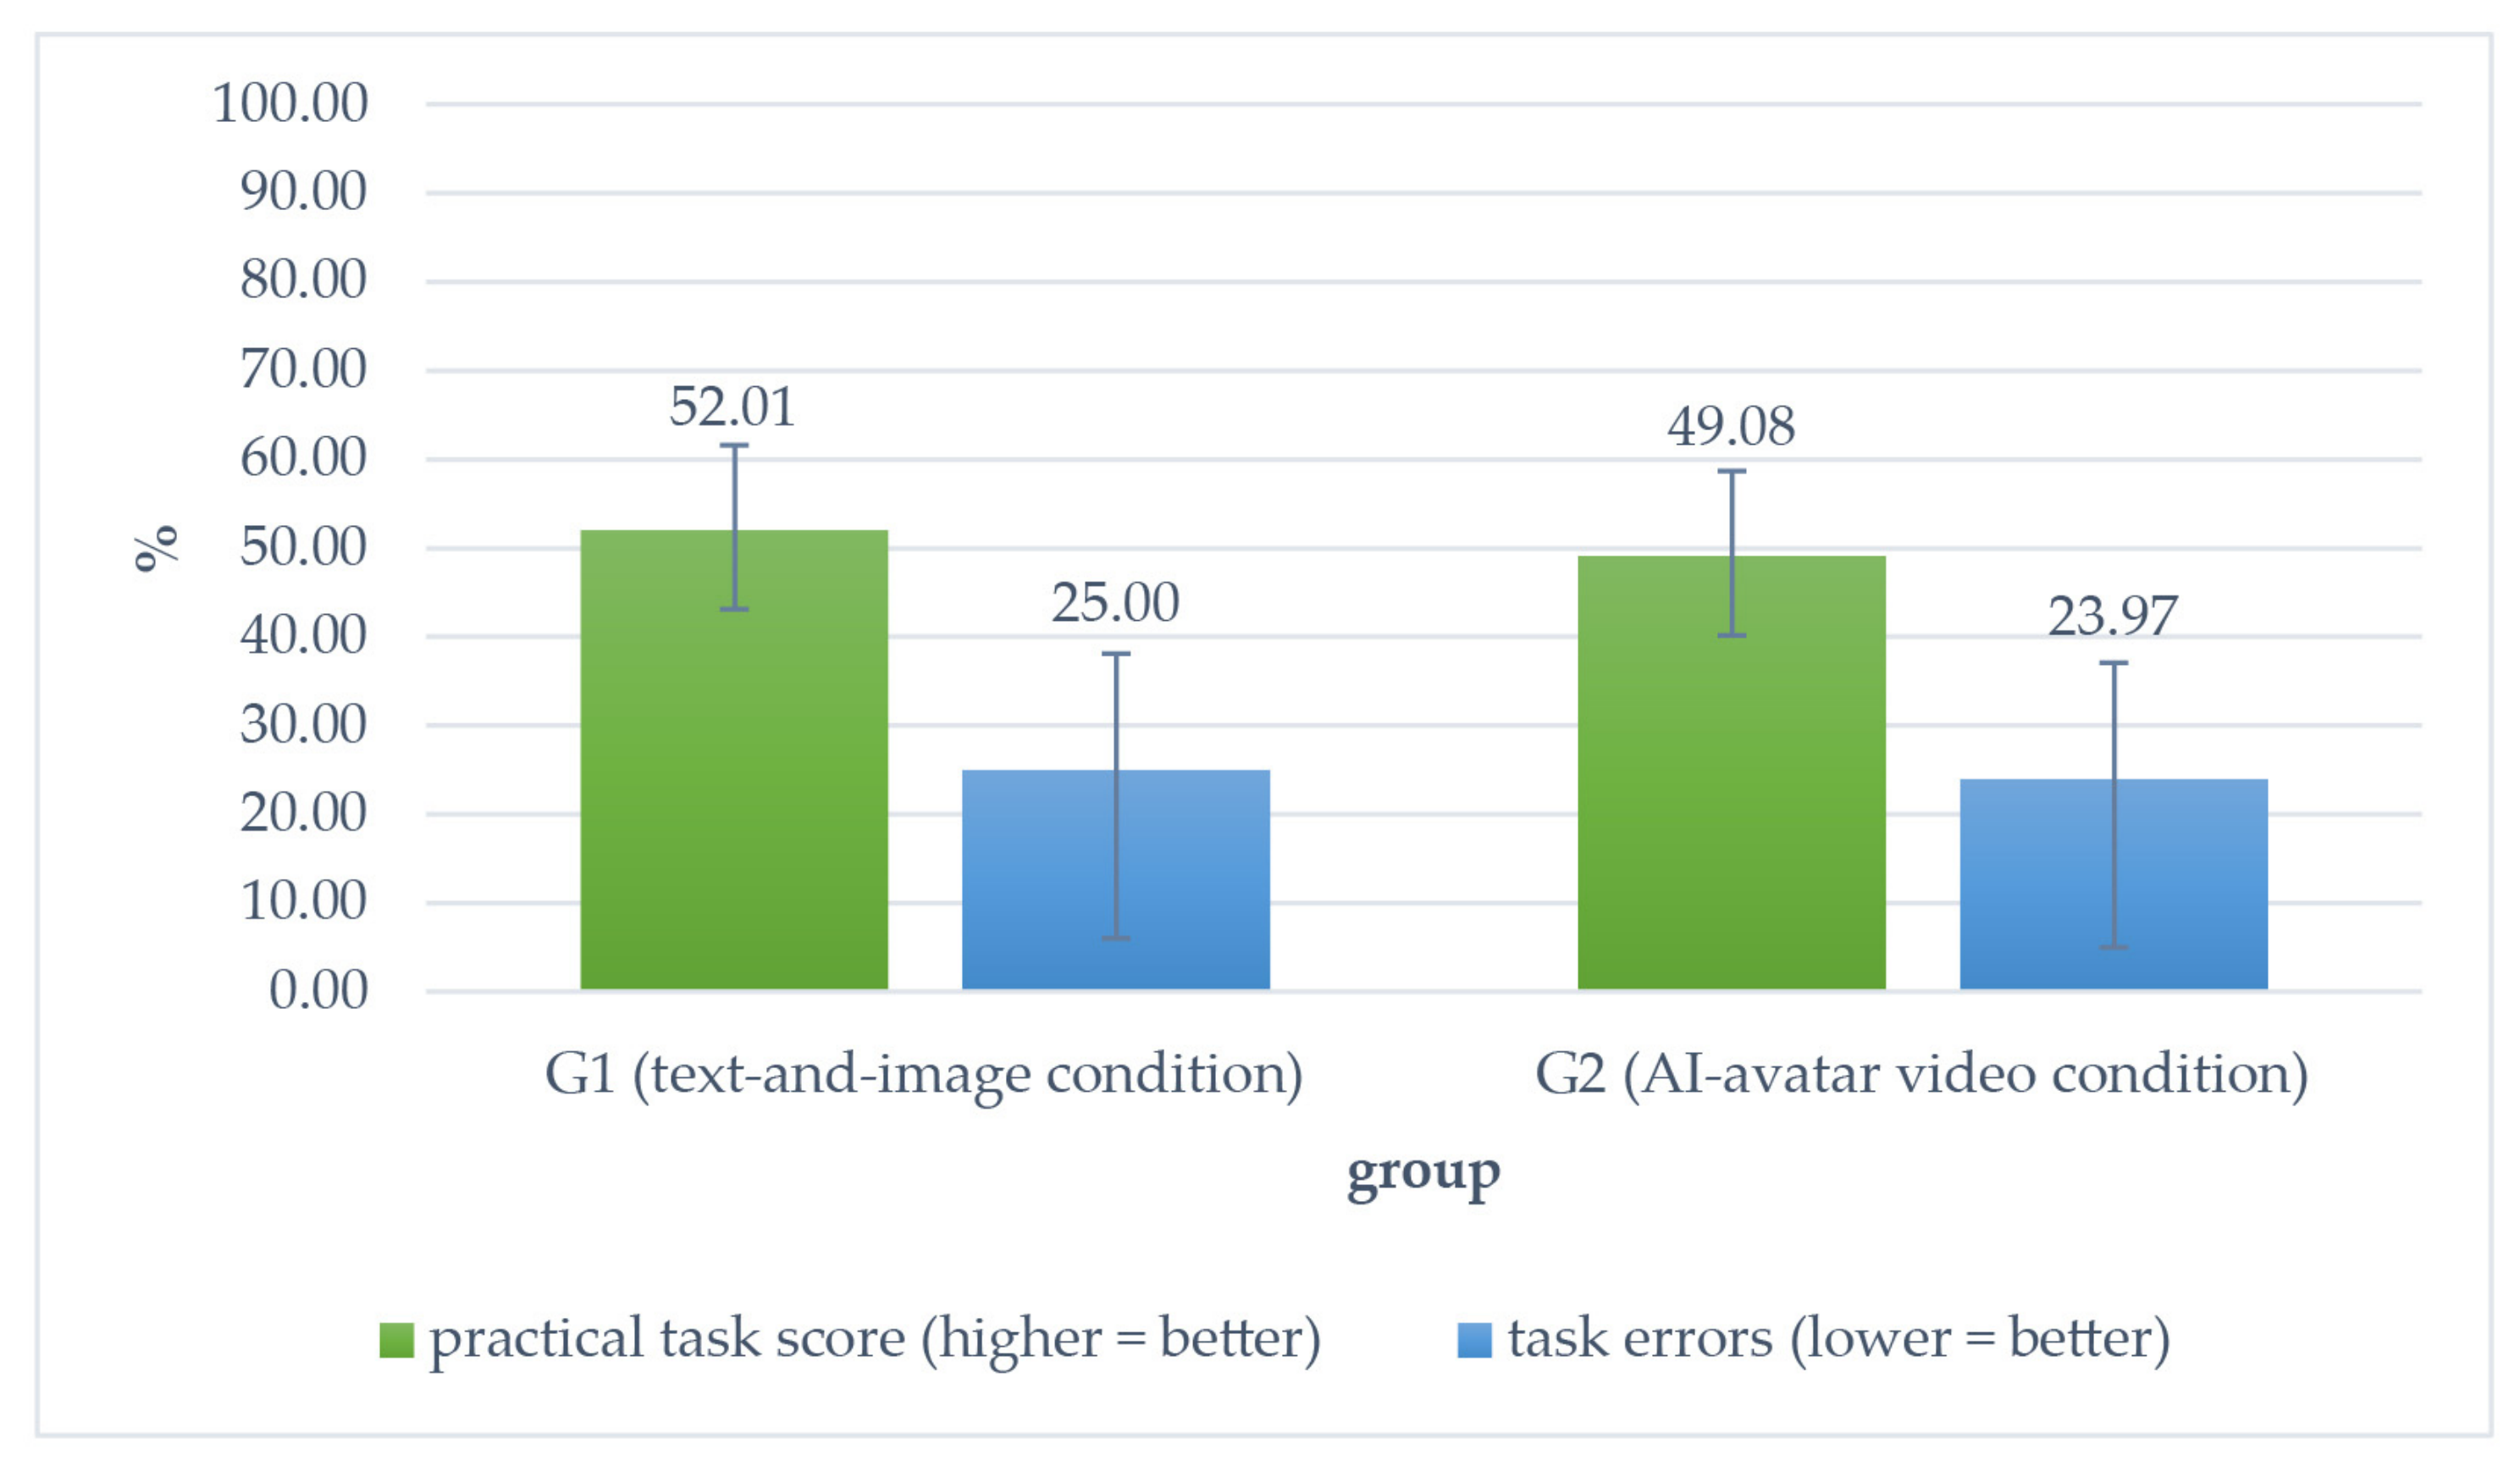
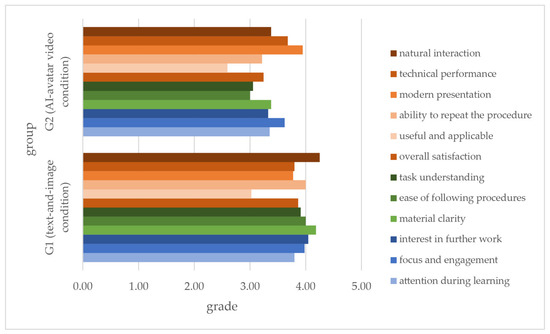
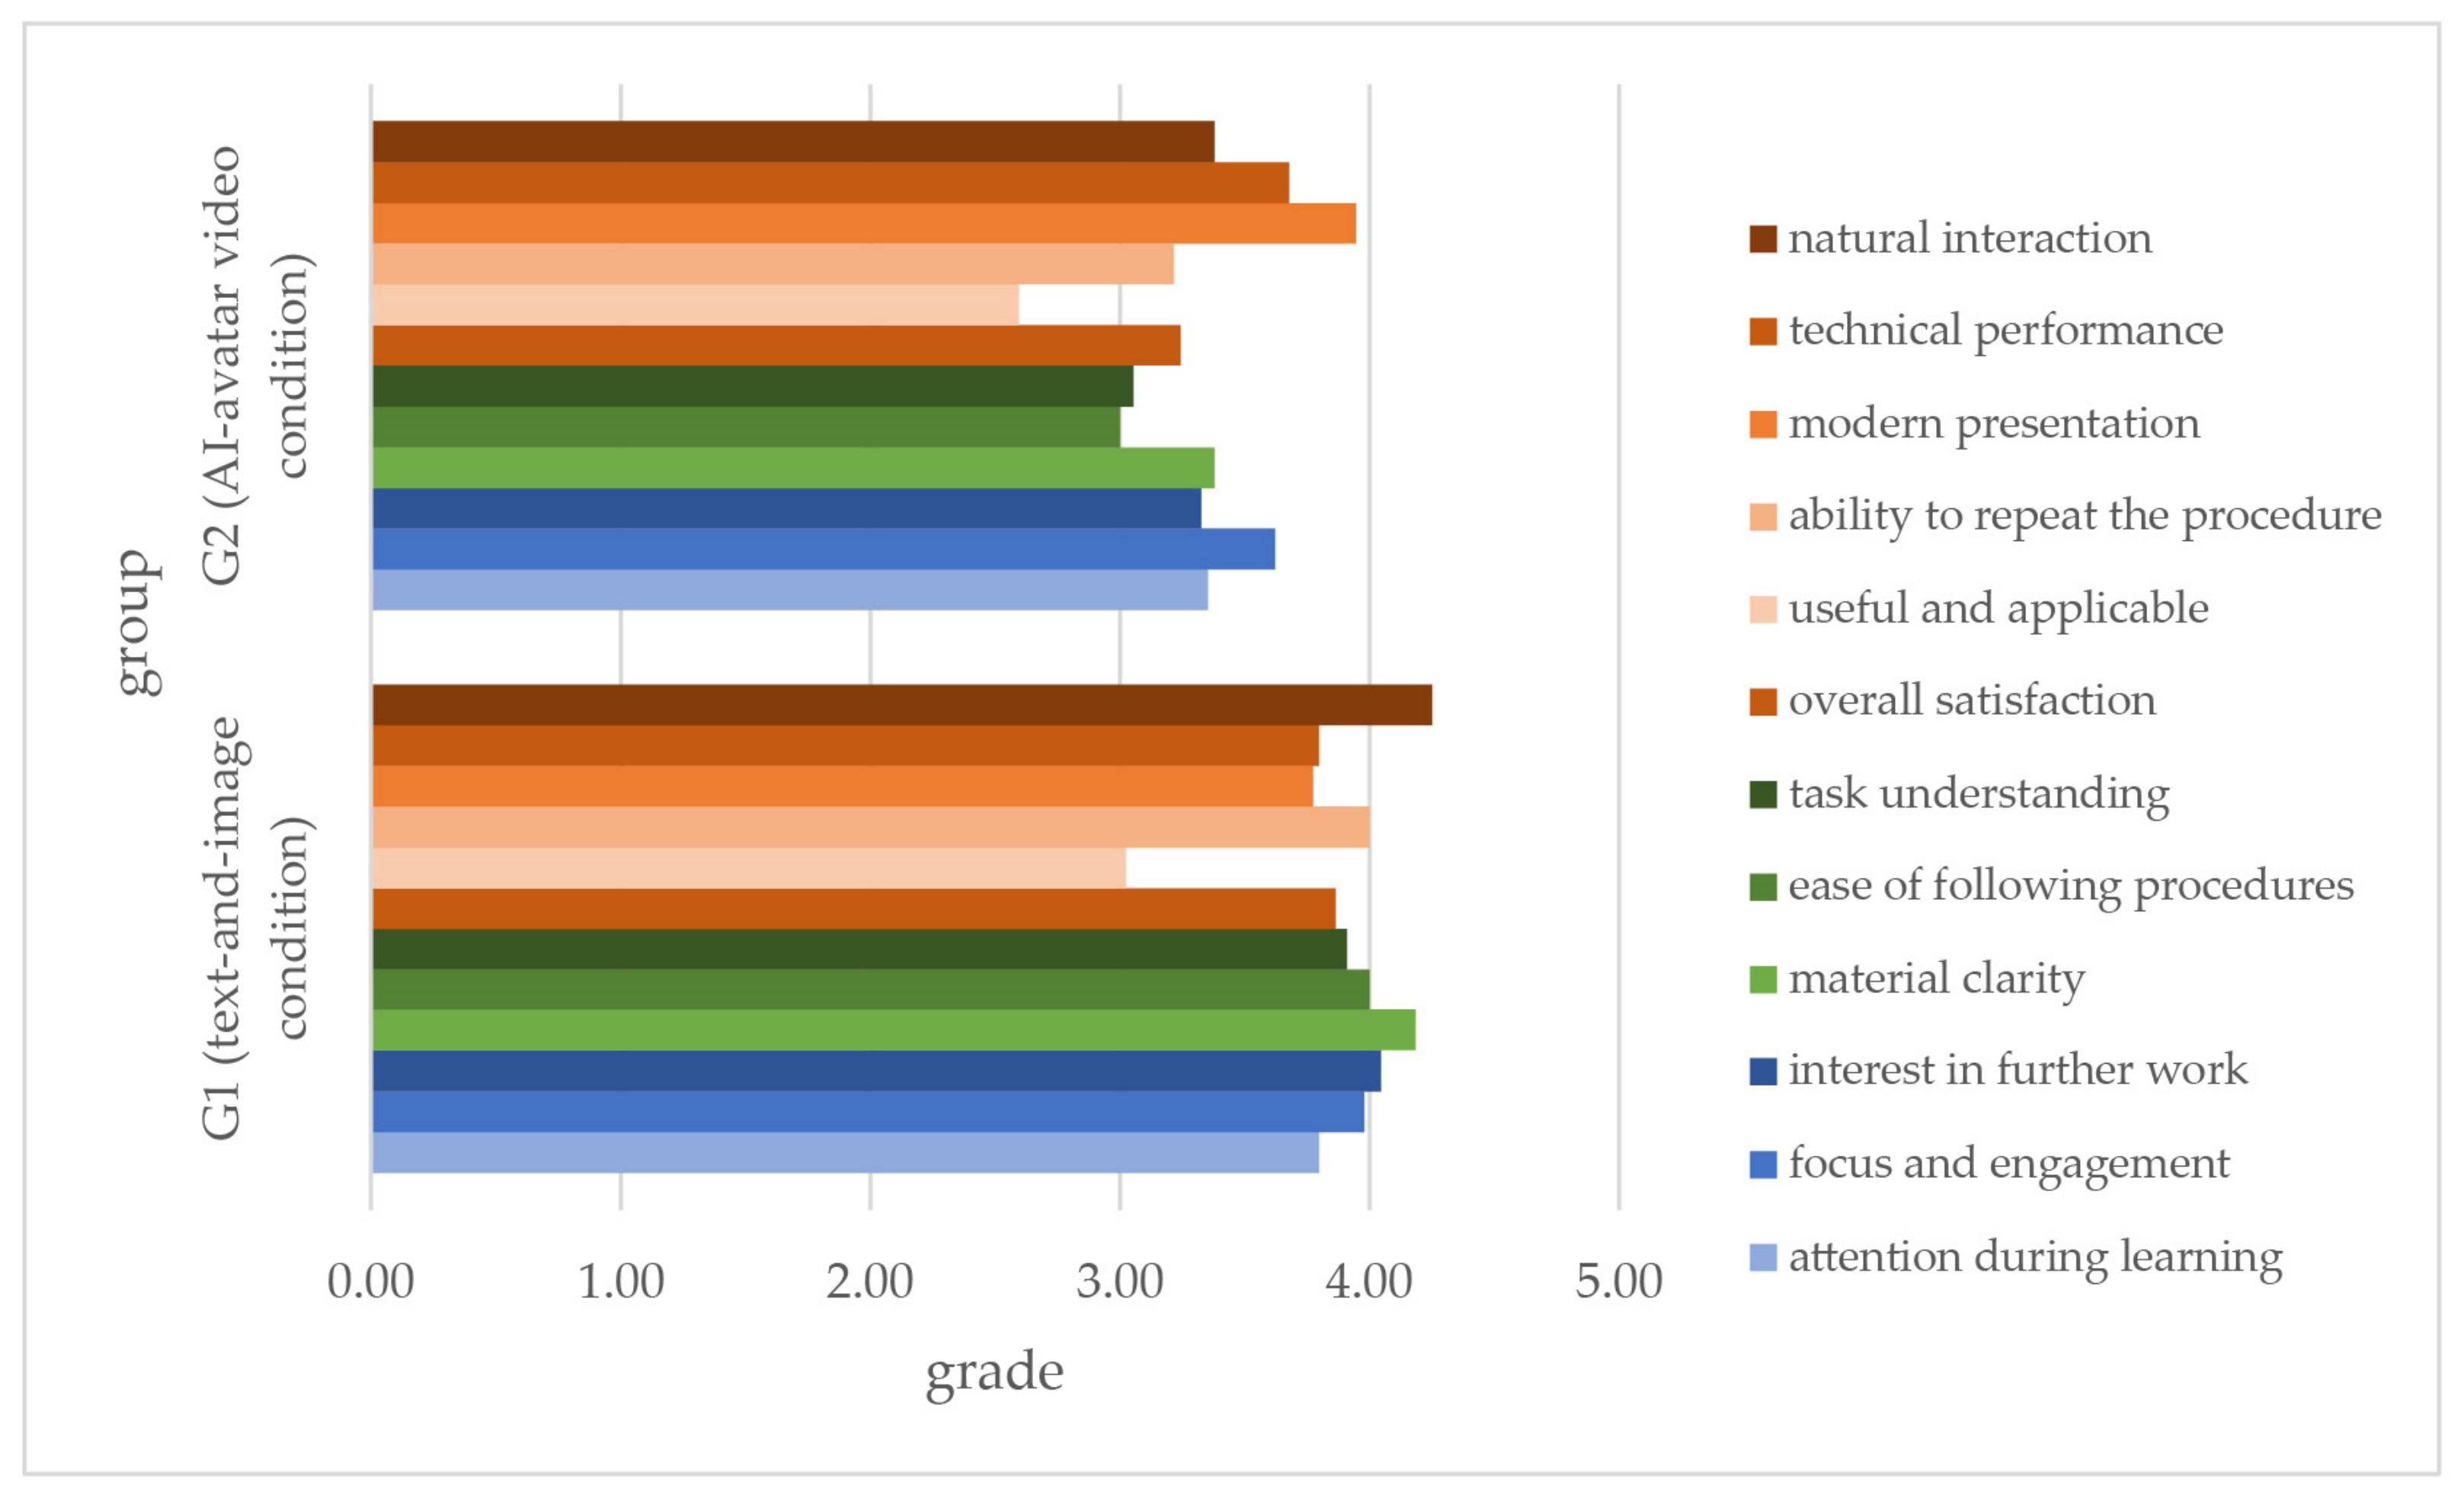

Disclaimer/Publisher’s Note: The statements, opinions and data contained in all publications are solely those of the individual author(s) and contributor(s) and not of MDPI and/or the editor(s). MDPI and/or the editor(s) disclaim responsibility for any injury to people or property resulting from any ideas, methods, instructions or products referred to in the content. |
© 2026 by the authors. Licensee MDPI, Basel, Switzerland. This article is an open access article distributed under the terms and conditions of the Creative Commons Attribution (CC BY) license.