


Abstract
Accurate forecasting of photovoltaic (PV) power generation is of critical importance for grid stability, energy management, and production planning in renewable energy systems. However, the high variability of atmospheric conditions and sudden fluctuations in solar irradiance significantly limit the performance of conventional forecasting models. In this study, a hybrid photovoltaic power forecasting model based on the XGBoost algorithm, whose hyperparameters are optimized using the Artificial Vulture Optimization Algorithm (AVOA) and enhanced with the physics-based Radiation Stability and Efficiency Index (RSEI), designated as RSEI-XGBoost-AVOA, is proposed. The proposed approach provides a forecasting framework that is not only data-driven but also sensitive to physical processes by jointly modeling the temporal stability of solar irradiance and intraday generation dynamics. In this context, irradiance variability is represented through statistical measures, while intraday generation behavior is modeled using a sinusoidal efficiency function, and this structure is made more flexible through parameters optimized by AVOA. The model performance was evaluated separately for four different seasons using real data obtained from a 25 MW photovoltaic power plant in Türkiye. The results show that the proposed hybrid (RSEI-XGBoost-AVOA) model produces lower error values than both the standard XGBoost model and the AVOA-optimized model across all seasons. The Mean Absolute Percentage Error (MAPE) and Root Mean Square Error (RMSE) values of the model were obtained as 4.15% and 0.4157 MW in summer, 6.07% and 0.2574 MW in winter, 8.03% and 0.7343 MW in spring, and 8.51% and 0.6135 MW in fall, respectively. These findings demonstrate that the proposed approach provides stable and generalizable forecasting performance even under highly variable atmospheric conditions and can be used as an effective decision-support tool for photovoltaic grid integration, short-term generation planning, and real-time energy management applications.
1. Introduction
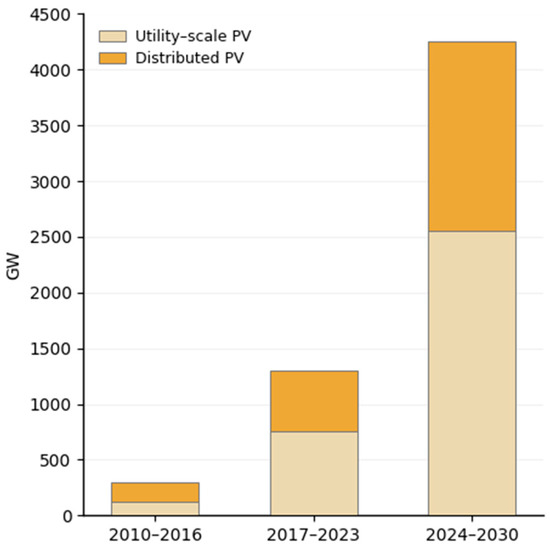
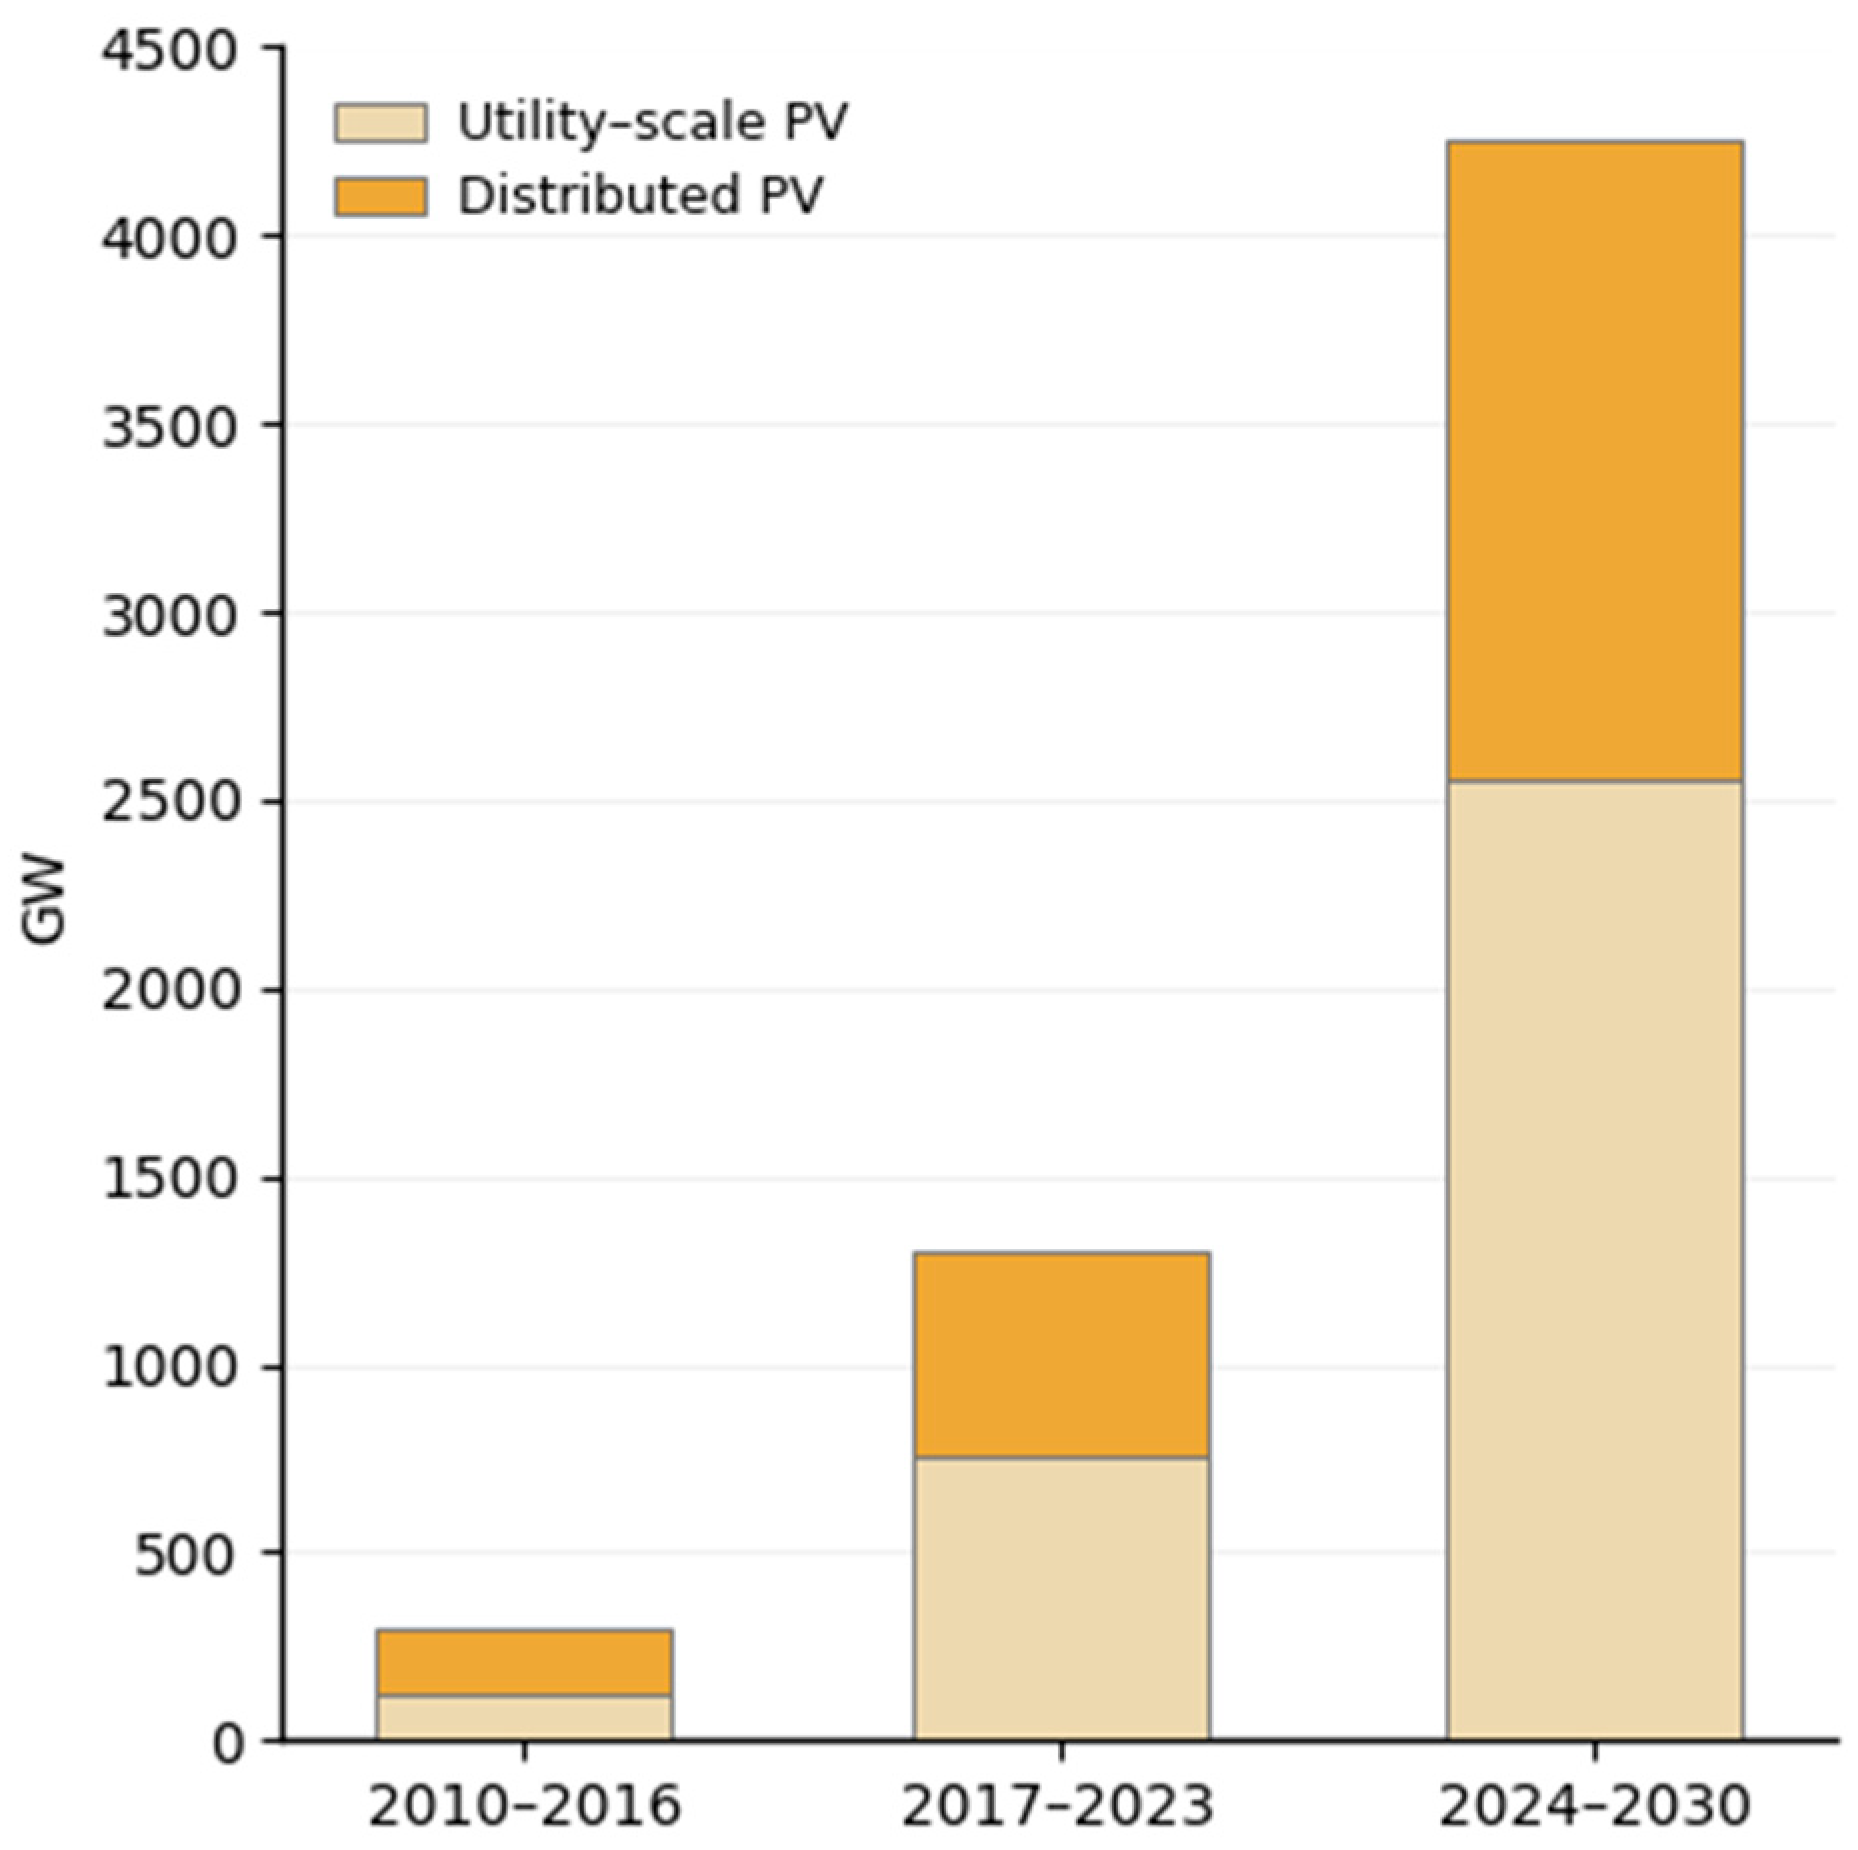
The depletion of fossil fuel reserves and the increasing greenhouse gas emissions resulting from their utilization have accelerated the global deployment of renewable energy resources [1,2]. Among these resources, photovoltaic (PV) energy has emerged as one of the most widely adopted and accessible technologies, playing a critical role in the sustainable, reliable, and economical operation of modern energy systems [3]. Owing to their low operating costs and environmentally friendly characteristics, photovoltaic technologies have experienced rapid growth in many countries. Reports published by the International Energy Agency (IEA) indicate a significant and continuous increase in renewable electricity capacity in recent years [4]. This growth reflects not only the expansion of installed generation capacity but also the structural transformation of energy systems. The increasing penetration of renewable energy resources requires more flexible and dynamic operational strategies. This trend is clearly illustrated in Figure 1, which presents the global development of renewable electricity capacity. The figure includes both historical deployment data and future projections, highlighting the continuing growth of renewable energy investments worldwide.
Figure 1.
Global photovoltaic capacity growth (utility-scale and distributed), adapted from [4].
The inherently uncertain and variable nature of photovoltaic power generation introduces significant technical challenges for the integration of large-scale PV systems into electrical grids [5,6]. Sudden changes in solar irradiance and fluctuations caused by atmospheric conditions can lead to sharp variations in power output, resulting in operational issues such as voltage deviations, frequency instability, and power quality disturbances. These fluctuations increase balancing requirements and directly affect system operating costs. Therefore, accurate and reliable forecasting of photovoltaic power generation has become a critical research topic for ensuring grid stability, effective energy management, and production planning [7,8].
In the existing literature, various alternative optimization strategies have been deployed to enhance solar and renewable energy forecasting performance. For instance, metaheuristics such as Particle Swarm Optimization (PSO) and the JAYA algorithm have been successfully integrated with artificial neural networks (ANNs) to refine weight matrices or seasonal inputs [8]. While these conventional hybrid methodologies yield notable improvements over standalone algorithms, they predominantly treat the optimization process as a purely data-driven black-box task, optimizing static algorithmic hyperparameters without reflecting the underlying solar physics. The proposed framework diverges significantly from these alternative strategies by introducing a coupled data-physics hybridization. Here, the Artificial Vulture Optimization Algorithm (AVOA) is not merely applied to search the standard hyperparameter boundaries of XGBoost; it is simultaneously tasked with dynamically tuning the exponential scaling coefficient (θ) of the physics-based Radiation Stability and Efficiency Index (RSEI) framework. This ensures that the optimizer balances structural learning capacity with real-world diurnal generation profiles and short-term atmospheric variability, establishing a genuinely novel forecasting infrastructure.
Recent advances in artificial intelligence and machine learning have enabled photovoltaic power forecasting to be performed with higher accuracy across different forecasting horizons. Consequently, various modeling approaches, including artificial neural networks, deep learning techniques, and gradient boosting algorithms, have been extensively investigated in the literature [9,10]. To further enhance structural prediction boundaries and capture complex computational trends in modern engineering fields, diverse intelligent modeling algorithms and localized hybrid forecasting frameworks have been rigorously developed in recent years [11,12]. Among these methods, the Extreme Gradient Boosting (XGBoost) algorithm has attracted considerable attention due to its ability to model nonlinear generation dynamics, strong generalization capability, and regularization mechanism that mitigates overfitting [13]. Nevertheless, the performance of XGBoost is highly dependent on the selection of hyperparameters such as the learning rate, tree depth, and node structure, and determining their optimal values using conventional approaches is often challenging [14]. Furthermore, many existing studies rely solely on raw meteorological variables as model inputs, which may not adequately represent the temporal variability of solar irradiance or the physical dynamics of photovoltaic power generation [15,16,17,18]. This limitation becomes particularly significant under highly variable atmospheric conditions, where forecasting accuracy tends to deteriorate. Recent studies in photovoltaic power forecasting have increasingly focused on deep learning architectures like LSTM, Transformer, and TCN due to their advanced temporal feature extraction capabilities under volatile weather conditions [19,20]. However, these deep networks require massive datasets to optimize millions of parameters, suffer from a high risk of overfitting, and introduce substantial computational overhead that limits real-time grid deployment. To bypass these bottlenecks, the tree-based XGBoost algorithm is explicitly preferred in this study because of its superior efficiency with tabular meteorological data, lighter computational footprint, and faster convergence. Crucially, XGBoost incorporates a built-in mathematical regularization mechanism that mitigates overfitting, making it uniquely robust against atmospheric noise and highly compatible with metaheuristic optimization frameworks.
To address these challenges, this study proposes a hybrid photovoltaic power forecasting model based on the XGBoost algorithm, whose hyperparameters are optimized using the Artificial Vulture Optimization Algorithm (AVOA) and enhanced through the Radiation Stability and Efficiency Index (RSEI), which jointly represents irradiance stability and intraday efficiency variations. The proposed hybrid model, hereafter referred to as RSEI-XGBoost-AVOA, incorporates physics-informed feature engineering to establish a more comprehensive forecasting structure. As a result, the effects of sudden atmospheric variations on power generation can be represented more effectively, leading to improved model generalization capability. In addition, the performance of the proposed model is evaluated using completely independent seasonal datasets, allowing a comprehensive assessment of its behavior under different atmospheric conditions.
The main contributions of this study can be summarized as follows:
- The forecasting performance of the XGBoost-based photovoltaic power prediction model is improved through hyperparameter optimization using the AVOA algorithm.
- A physics-informed RSEI feature engineering approach is developed to simultaneously represent the temporal stability of solar irradiance and intraday power generation dynamics.
- A hybrid forecasting framework is established by integrating data-driven learning with physics-based features.
- The model’s performance is evaluated using independent datasets from four different seasons, enabling a comprehensive assessment of its generalization capability under varying atmospheric conditions.
- The proposed hybrid (RSEI-XGBoost-AVOA) model is shown to achieve lower forecasting errors than both the standard XGBoost model and the AVOA-optimized XGBoost model, particularly under highly variable atmospheric conditions.
2. Materials and Methods
2.1. XGBoost Algorithm
XGBoost (Extreme Gradient Boosting) is a scalable and high-performance ensemble learning algorithm based on the gradient boosting framework [10]. The algorithm relies on the sequential training of decision trees and aims to reduce the errors of the previous model at each iteration [21]. Owing to this capability, XGBoost has demonstrated effective performance in modeling nonlinear and highly variable datasets influenced by meteorological factors, such as photovoltaic power generation. In addition, its regularization mechanism controls model complexity, reduces the risk of overfitting, and improves generalization performance [22]. The primary objective of the XGBoost algorithm is to minimize prediction error while maintaining model complexity under control. The regularized objective function employed for this purpose is given in Equation (1) [10].
Here, denotes the loss function measuring the difference between the predicted and actual values, and denotes the actual value. The term represents the (k)-th decision tree generated during the iterative learning process. The second term of the objective function, , corresponds to the regularization component that controls model complexity and is defined in Equation (2).
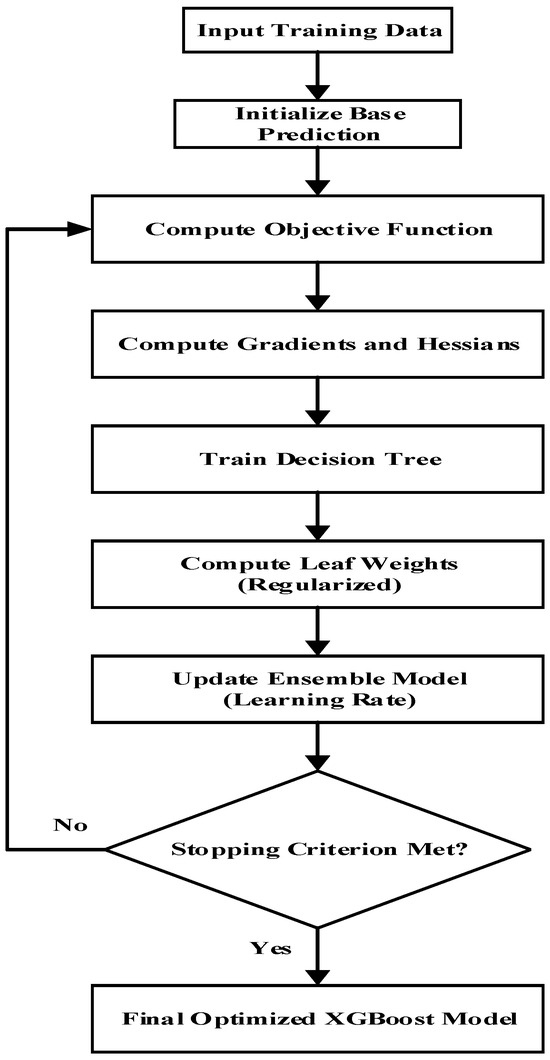
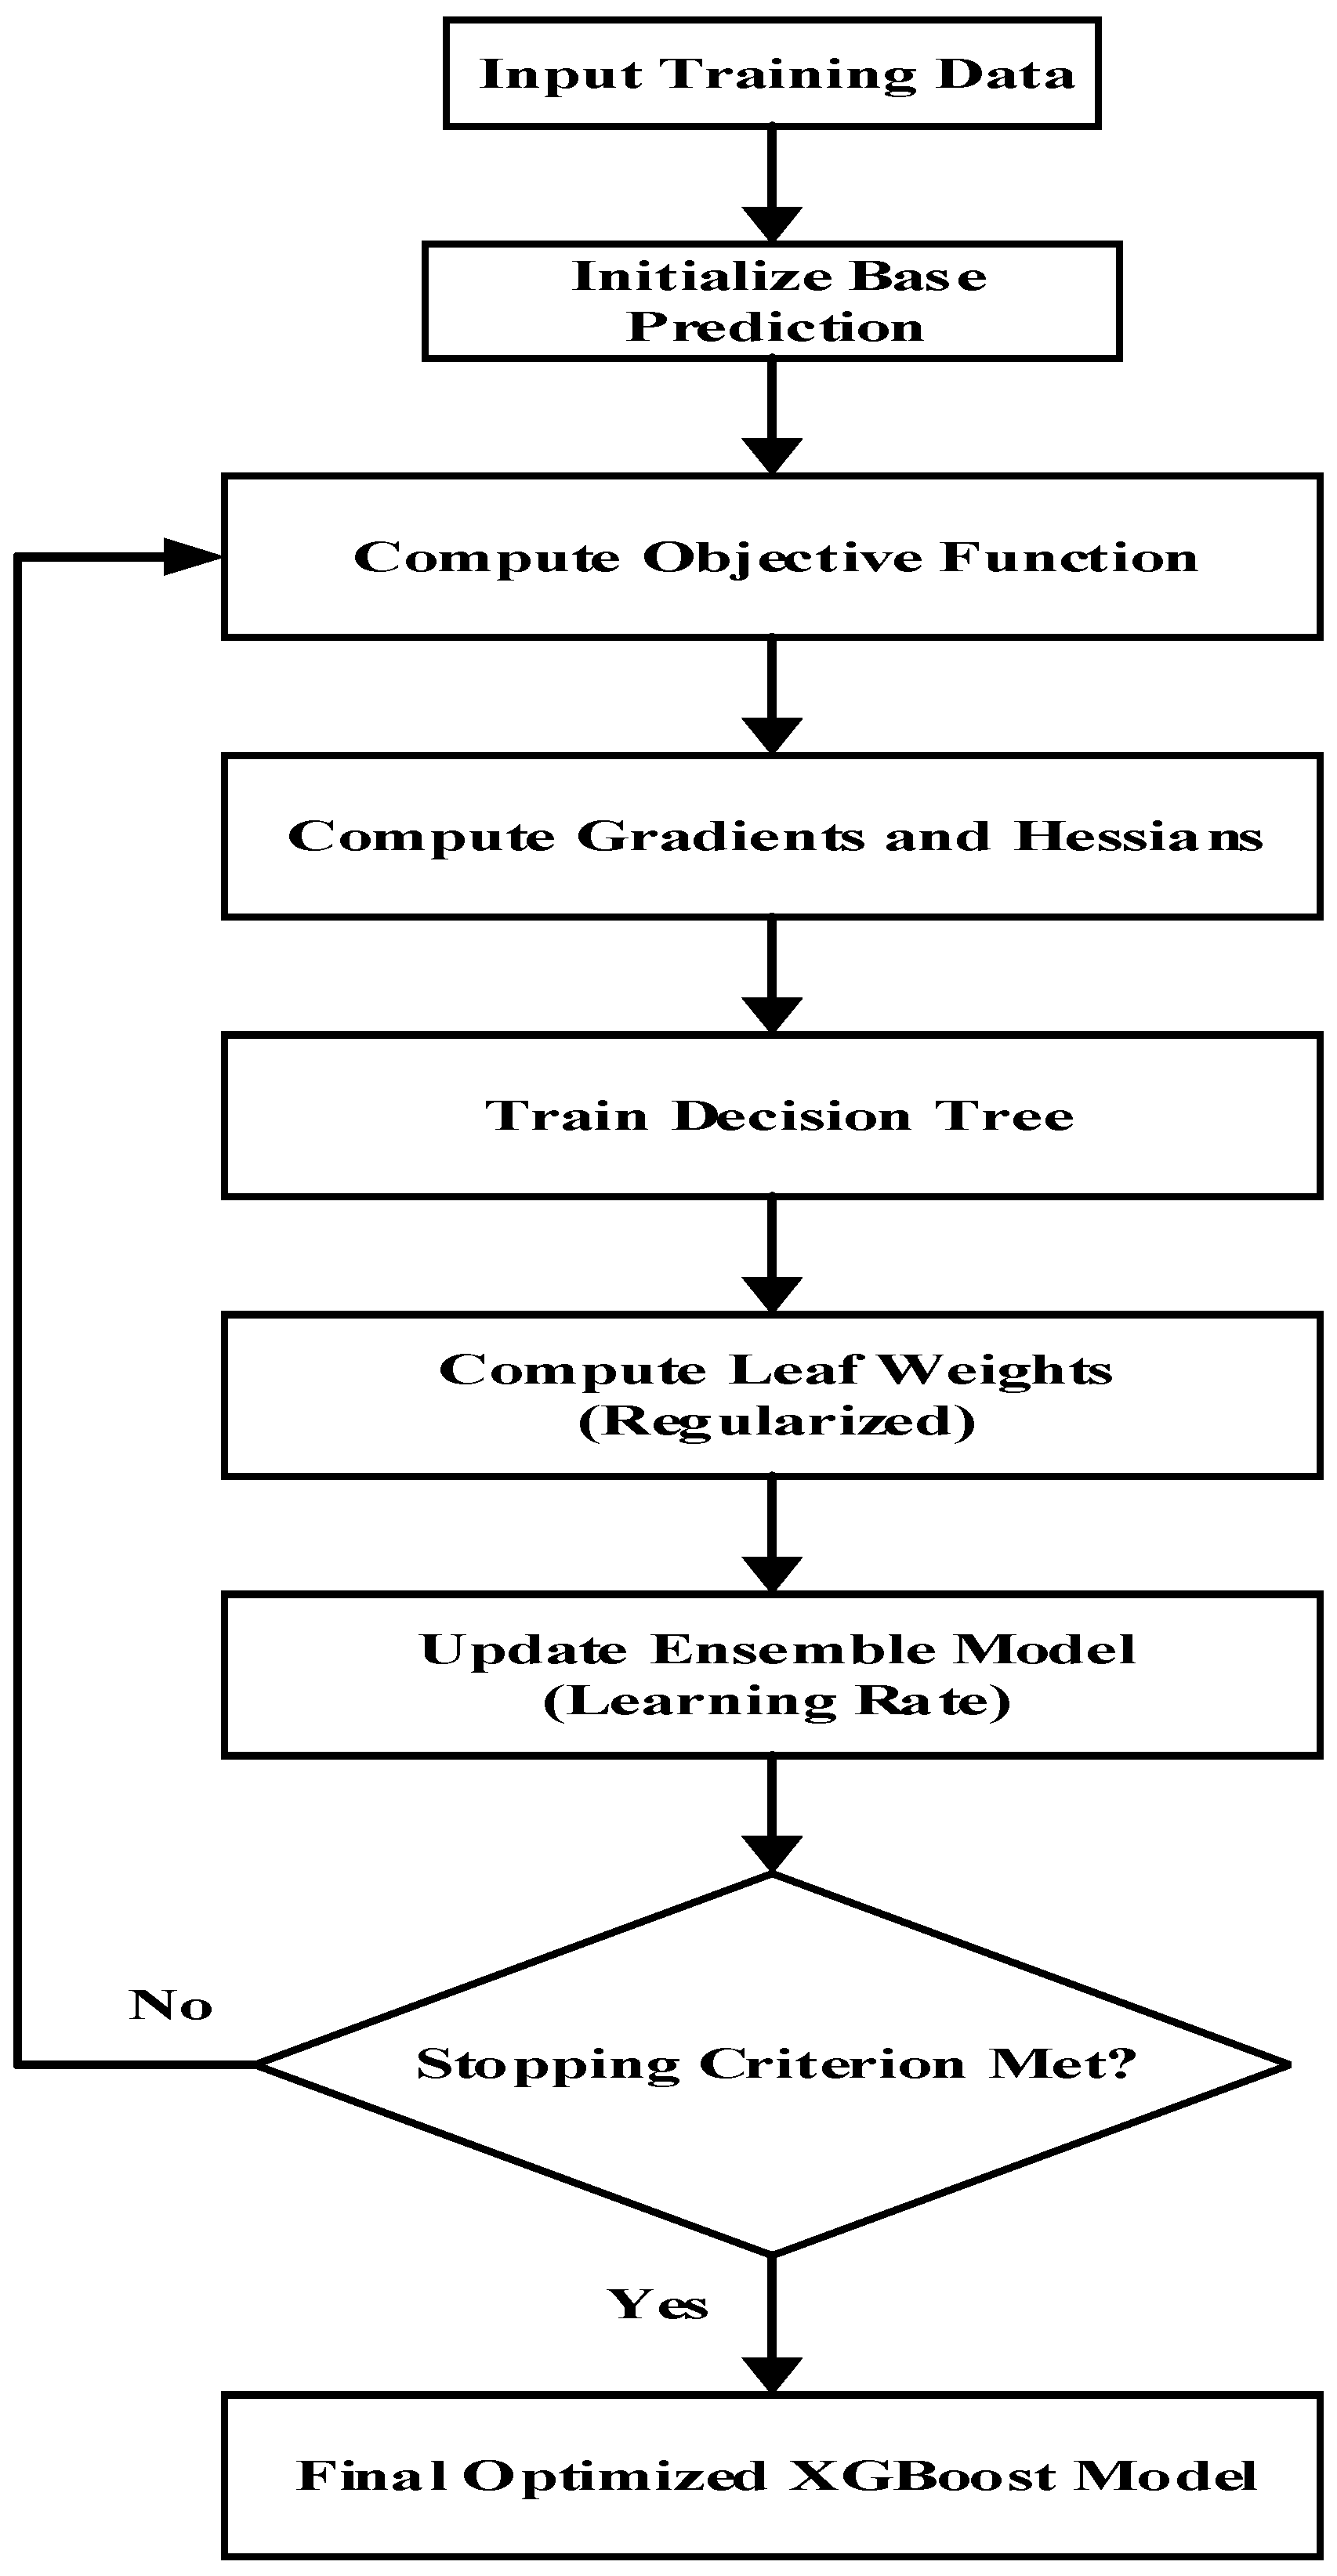
where denotes the number of leaves, represents the leaf weights, is the split threshold, and is the regularization coefficient. This structure reduces unnecessary branching and mitigates the risk of overfitting. Furthermore, XGBoost optimizes the objective function using a second-order Taylor expansion, incorporating both gradient and Hessian information to achieve a faster and more stable learning process [23]. The general workflow of the XGBoost algorithm is illustrated in Figure 2.
Figure 2.
XGBoost training flowchart.
The process begins with the input training data and the generation of initial predictions. Residual errors are then calculated based on the loss function, and decision trees are trained to learn these errors. Subsequently, the model is updated iteratively to improve forecasting accuracy. This procedure continues until the maximum number of iterations is reached or the early stopping criterion is satisfied. Through this iterative learning mechanism, the model progressively reduces prediction errors and generates more accurate forecasts. The XGBoost framework employed in this study is based on the original formulation proposed by Chen and Guestrin [10].
2.2. AVOA Optimization Algorithm
The integration of a metaheuristic optimization algorithm into the proposed forecasting framework is motivated by the inherent limitations of conventional hyperparameter selection methods. In complex ensemble architectures like XGBoost, hyperparameters such as the learning rate, maximum tree depth, and regularization terms exhibit highly nonlinear, non-convex interactions that directly govern forecasting performance. Traditional brute-force parameter search methodologies routinely encounter severe scalability limits or, in the case of randomized sampling paths, lack directional optimization patterns. Furthermore, because the objective function with respect to tree structures is discrete and non-differentiable, traditional gradient-based calculus methods cannot be utilized. Metaheuristic algorithms resolve these bottlenecks by providing a derivative-free, stochastically guided exploration of the parameter search space, drastically reducing computational overhead while ensuring a high probability of escaping local traps.
To bypass these limitations, the Artificial Vulture Optimization Algorithm (AVOA) was integrated into the predictive network as the primary hyperparameter exploration core. The selection of AVOA is justified by its unique architectural advantages over conventional algorithms. Firstly, its probabilistic dual-leader mechanism effectively preserves population diversity, minimizing the risk of premature convergence in complex, multi-dimensional search spaces. Secondly, the dynamic formulation of the hunger parameter (F) governs a highly robust transition from global exploration to intensive local exploitation, ensuring stable and fine-tuned parameter allocation. These features make AVOA exceptionally well-suited for capturing the nonlinear interaction of machine learning parameters under highly variable meteorological conditions.
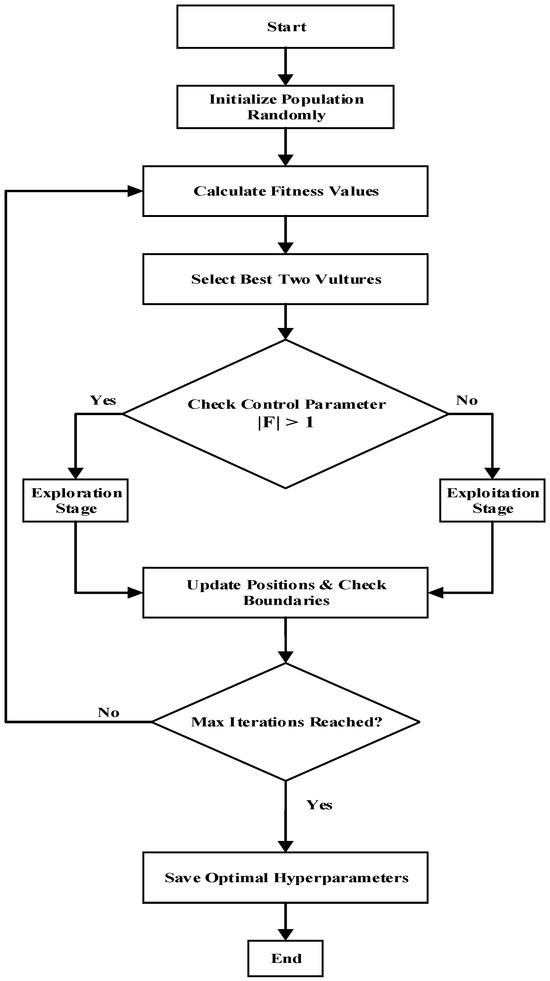
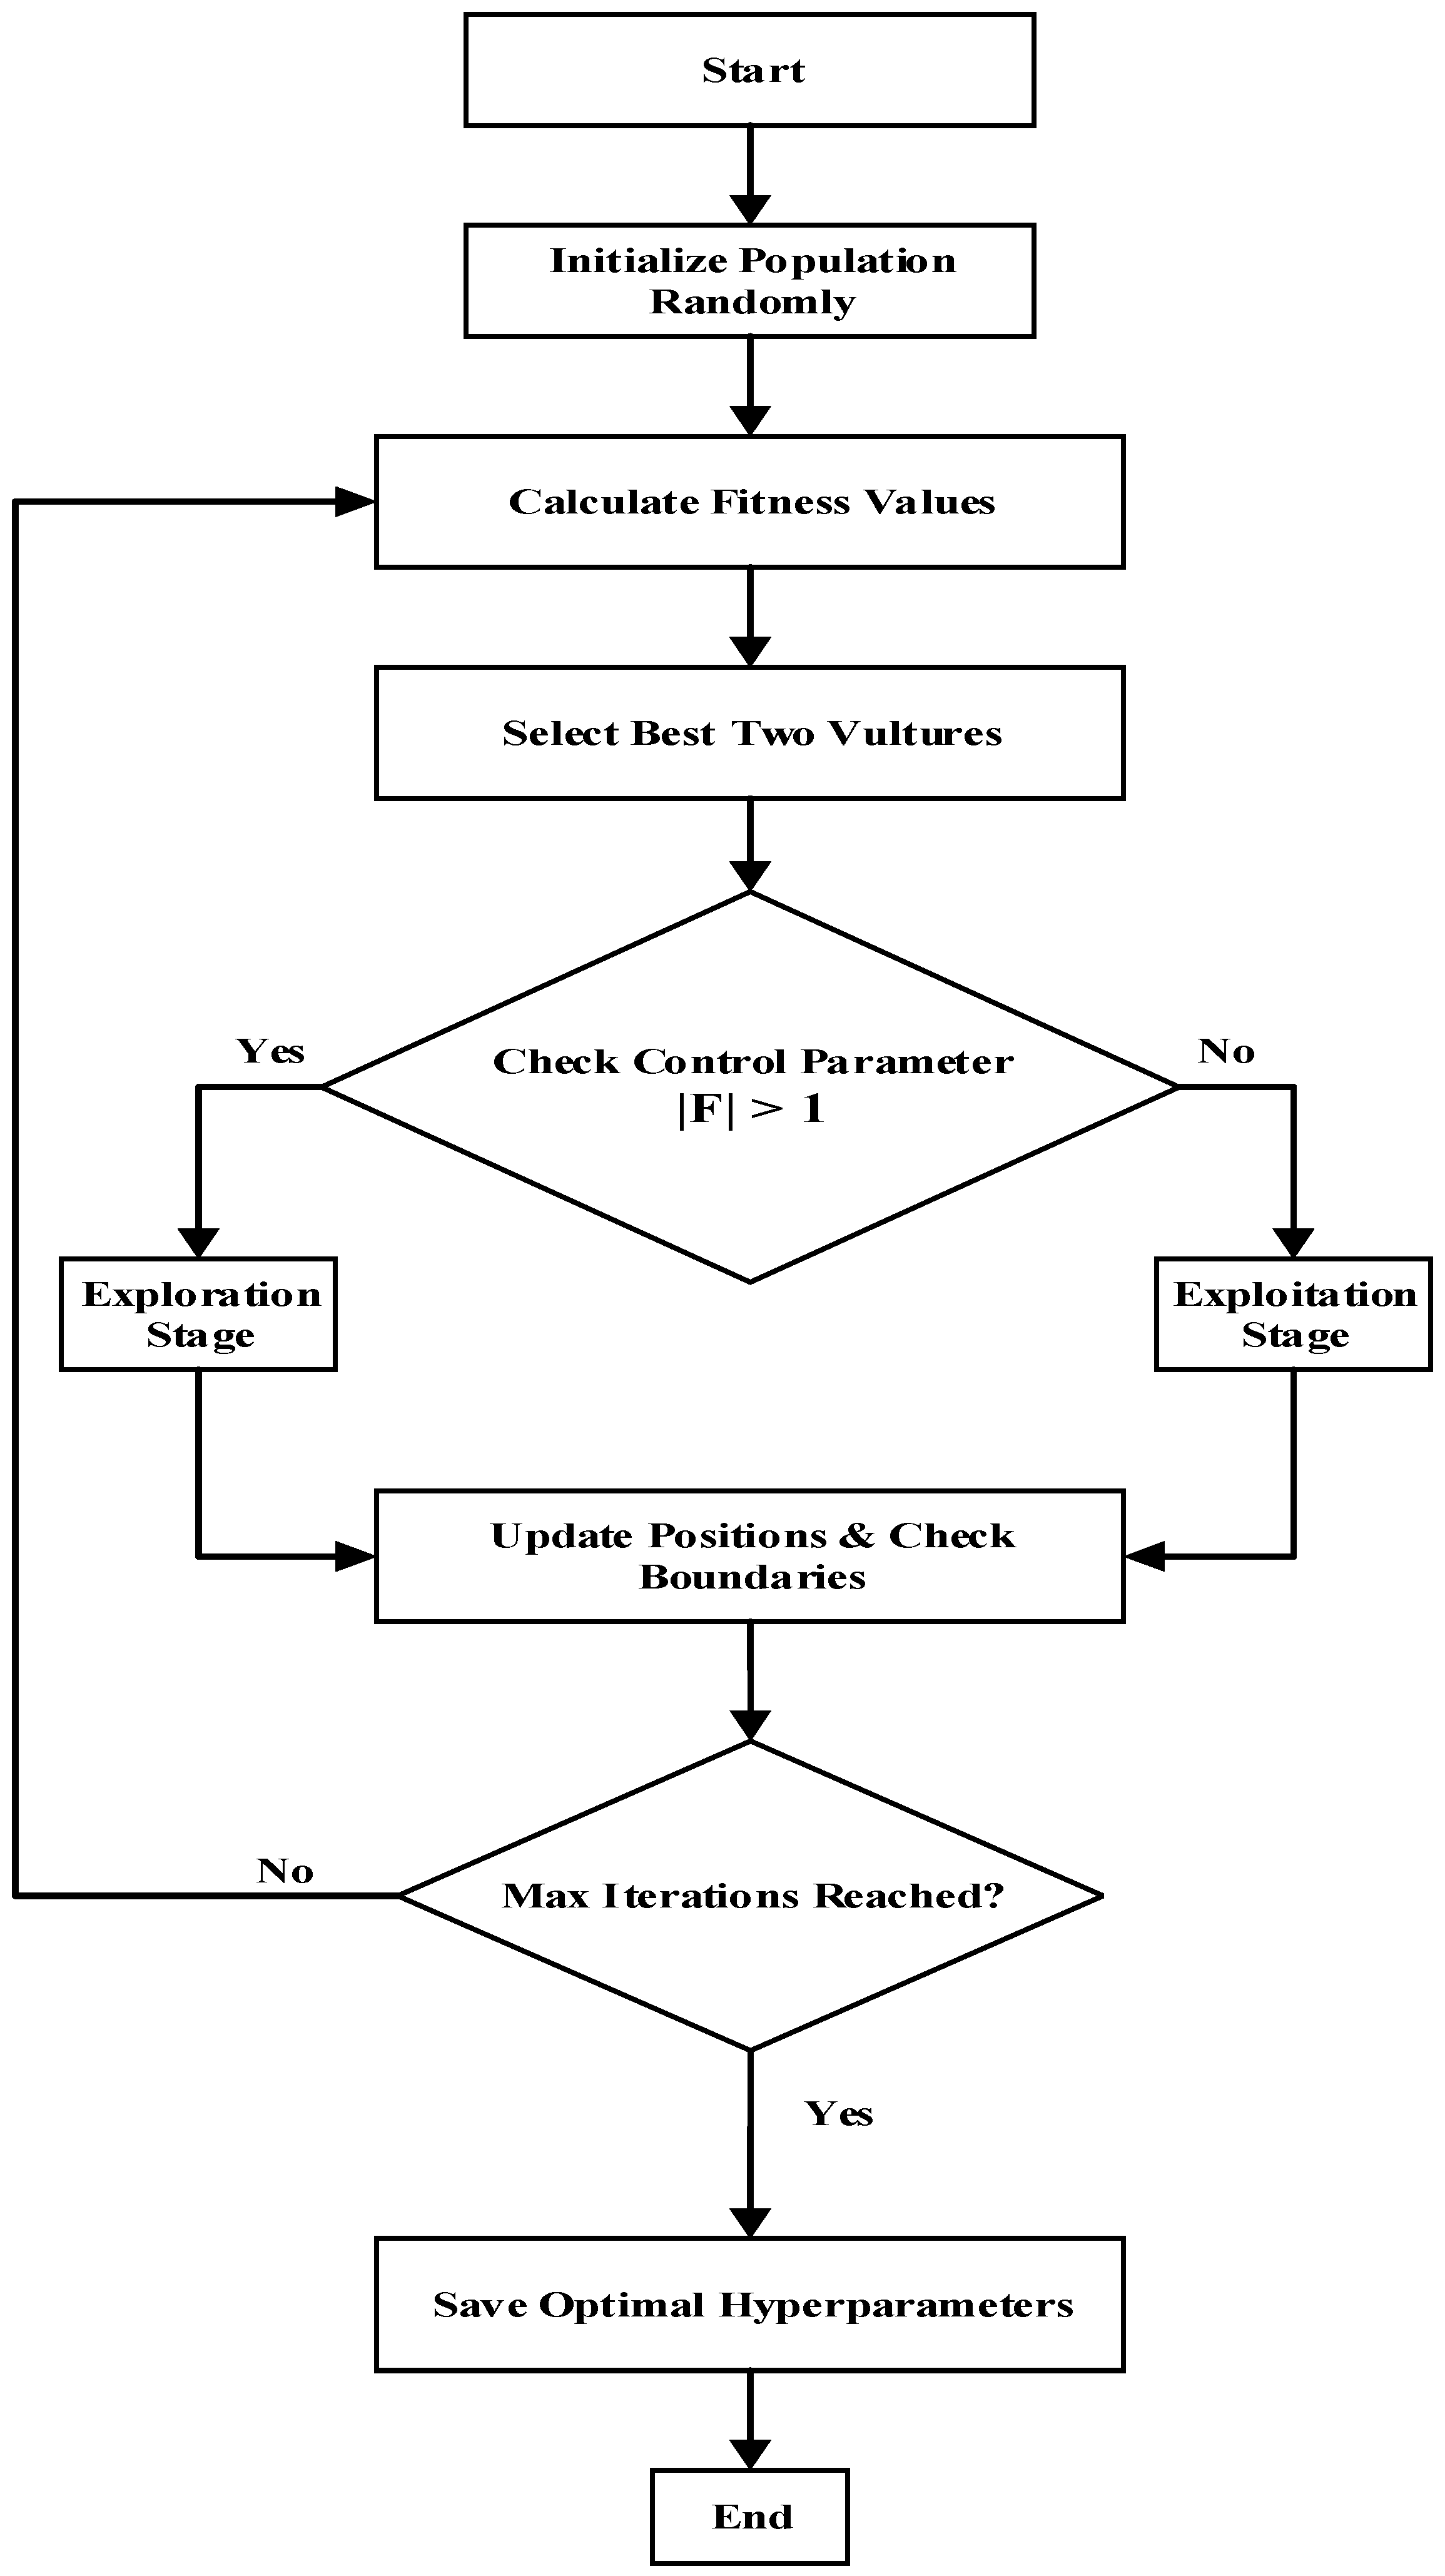
The Artificial Vulture Optimization Algorithm (AVOA) is a recently developed metaheuristic optimization technique introduced in 2021 and inspired by the social behavior and foraging strategies of African vultures [24]. The algorithm has demonstrated strong performance in solving high-dimensional and nonlinear optimization problems and has been successfully applied to the hyperparameter optimization of machine learning models such as XGBoost. AVOA operates through a population of candidate solutions representing individuals within the search space and iteratively updates their positions to approach the optimal food source, which corresponds to the best solution. Compared with conventional optimization algorithms, AVOA provides a more dynamic and adaptive exploration of the search space, significantly reducing the likelihood of being trapped in local minima. The general workflow of the algorithm is illustrated in Figure 3.
Figure 3.
AVOA optimization flowchart.
The optimization process begins with the generation of a random population, followed by the identification of the two best candidate solutions. These solutions are defined as the first leader and the second leader, and the remaining individuals update their positions according to these leaders. This dual-leader mechanism preserves population diversity and prevents premature convergence toward a single solution. Furthermore, the leader followed by each individual is selected probabilistically, enabling simultaneous exploration of different regions of the search space.
The AVOA algorithm consists of two main search phases, namely exploration and exploitation. The transition between these phases is controlled by the parameter (F), which represents the hunger level of the vultures. This parameter is defined by Equation (3).
where ∈ [0, 1] is a random number, and is a control parameter that decreases linearly from 2 to 0 across the maximum iteration horizon ( ∈ [0, 2]) according to the progression of the optimization process. At the beginning of the optimization process, individuals are assumed to possess high energy levels. Therefore, when ≥ 1, the algorithm operates in the exploration phase and randomly searches broad regions of the solution space. As the iterations progress and the energy level decreases, the condition < 1 is satisfied, and the algorithm switches to the exploitation phase.
During the exploration phase, the position of an individual is updated according to Equation (4).
where denotes a randomly selected individual, represents the current individual, and ∈ [0, 1] is a random number. In this phase, individuals move across a wide region of the search space to identify the global optimum.
During the exploitation phase, individuals concentrate around the leader solutions, and their positions are updated according to Equation (5).
where denotes either the first or the second leader selected probabilistically. This phase focuses on local refinement of the candidate solutions. As the hunger parameter approaches its boundary values, the movements of the individuals become more aggressive, enabling fine adjustments within the search space. Owing to this adaptive transition mechanism, AVOA achieves a balance between global exploration and local exploitation, thereby enhancing solution accuracy while avoiding local optima.
To link the metaheuristic optimization loop with the prediction network, the decision vector () optimized by AVOA is explicitly defined in Equation (6):
where represents the learning rate, denotes the maximum tree depth, is the subsampling ratio, is the regularization coefficient of XGBoost, and represents the exponential scaling coefficient of the physics-based RSEI framework. The objective function () to be minimized during the search process is formulated as the Root Mean Square Error (RMSE) calculated over the validation subset, as shown in Equation (7):
where is the total number of validation samples, is the true measured photovoltaic power, and represents the power forecast generated by the model structure under the parameter configuration vector .
The mathematical optimization landscape generated by the proposed framework is inherently multimodal and complex, containing multiple local optima. This non-convex topography stems from the highly nonlinear interactions between the architectural hyperparameters of the tree-boosting ensemble and the continuous exponential coefficient (θ) governing the physics-based RSEI formulation under dynamic meteorological fluctuations. Consequently, minor perturbations in parameter combinations can easily generate deceptive local error minima. Given this challenging search space, the primary objective of incorporating the AVOA framework is to enhance the model’s structural capacity to escape these local traps, prioritizing global optimization robustness over mere convergence velocity. The mathematical design of AVOA effectively balances these dual requirements. While its probabilistic dual-leader mechanism primarily ensures population diversity to systematically avoid local stagnation, the dynamic hunger parameter (F) subsequently secures rapid convergence once the global optimum region is mapped, providing an ideal optimization balance for highly variable photovoltaic generation datasets.
In this study, the AVOA algorithm was employed to optimize the hyperparameters of the XGBoost model. Parameters that directly influence forecasting performance, including the learning rate, maximum tree depth, subsampling ratio, and regularization coefficients, were optimized using AVOA to improve the prediction accuracy of the proposed model.
2.3. RSEI-Based Feature Engineering
Although the direct use of raw meteorological variables as model inputs is a common approach in photovoltaic power forecasting studies, this method does not adequately represent the temporal variability of solar irradiance or the physical dynamics of photovoltaic power generation. In particular, sudden cloud passages, atmospheric instability, and variations associated with the angular position of the sun throughout the day may lead to significant forecasting errors in models based solely on instantaneous irradiance values. As a result, model sensitivity to short-term power fluctuations is limited, which often leads to reduced forecasting accuracy, especially during transitional seasons. To address these limitations, this study proposes a feature engineering approach based on the Radiation Stability and Efficiency Index (RSEI), which jointly represents irradiance stability and intraday efficiency variations. The proposed framework integrates two fundamental physical components affecting photovoltaic power generation. The first component is the temporal stability factor, which characterizes short- and medium-term irradiance fluctuations, while the second component is the temporal efficiency factor, which represents variations in power generation efficiency associated with the position of the sun during the day.
To quantitatively characterize the temporal variability of solar irradiance, standard deviation values were calculated using 3 h and 6 h moving windows. These stability features are defined by Equation (8).
where represents the irradiance observations within the corresponding time window, denotes the mean irradiance value of that window, and (n) is the number of samples. The resulting stability features were introduced into the model with a one-step lag, enabling the forecasting framework to capture not only the current irradiance conditions but also the recent variability pattern.
To represent the intraday efficiency variation of photovoltaic panels, a dynamic time-dependent weighting structure was developed. Considering the approximately sinusoidal movement of the sun throughout the day, the hour variable was modeled using a sinusoidal function and combined with the irradiance value. To increase the flexibility of this relationship, an exponential parameter optimized by the AVOA algorithm was incorporated, resulting in the formulation given in Equation (9).
where G(t) denotes the instantaneous irradiance, h represents the hour of the day, and θ is the exponential coefficient optimized by the AVOA algorithm, defined within a valid operational search range of [0.5, 2.5] (θ ∈ [0.5, 2.5]) to preserve the physical boundaries of the diurnal solar efficiency curve. This parameter enables flexible modeling of the intraday generation profile and enhances the adaptability of the forecasting model under different atmospheric conditions.
To ensure the absolute replicability of the engineered features, the formal computational procedure for generating the comprehensive RSEI framework is structured into five sequential execution steps:
- Step 1: Data Alignment and Boundary Isolation: Instantaneous global horizontal irradiance () and time indices (hour of the day, ∈ [0, 23]) are isolated from the raw meteorological data stream. Nighttime records where = 0 are structurally filtered out to avoid division or scaling anomalies in the efficiency envelope.
- Step 2: Micro-Meteorological Stability Extraction: Moving time windows of 3 h (n = 3) and 6 h (n = 6) horizons are passed backwards from the target index t. The historical localized standard deviations ( and ) are calculated using Equation (8) and lagged by one step (t − 1) to serve as predictive proxies for atmospheric cloud transients and stability contexts.
- Step 3: Sinusoidal Efficiency Weighting: The angular progression of solar elevation is mapped by transforming the discrete hour variable (h) into a continuous diurnal weighting envelope via a squared–sinusoidal profile, . This constructs the baseline theoretical clear-sky distribution pattern.
- Step 4: Metaheuristic Nonlinear Scaling: The stochastically optimized exponential coefficient θ (discovered via the AVOA loop within the valid range [0.5, 2.5]) is applied to the continuous efficiency weight. The raw irradiance is then mapped onto this nonlinear boundary to compute the final instantaneous index, as shown in Equation (9).
- Step 5: Dimensional Assembly: The continuous physical feature is combined with the historical volatility attributes (, ) to form the complete multi-dimensional physics-informed feature vector, which is then passed to the data preprocessing layer detailed in Section 2.5 for model training.
Consequently, the proposed RSEI framework provides a comprehensive feature engineering approach that simultaneously captures irradiance stability and temporal efficiency effects. The integration of these two components improves the model’s sensitivity to both irradiance variability and intraday generation dynamics, thereby enabling more consistent and reliable forecasting performance, particularly under highly variable atmospheric conditions.
2.4. Performance Evaluation Metrics
To objectively evaluate the forecasting performance of the proposed hybrid (RSEI-XGBoost-AVOA) model and the benchmark algorithms, three widely used statistical error metrics were employed. These metrics are the Root Mean Square Error (RMSE), Mean Absolute Percentage Error (MAPE), and Mean Absolute Error (MAE).
The Root Mean Square Error (RMSE) is defined as the square root of the average squared differences between the predicted and actual values. Due to its higher sensitivity to large errors, RMSE is an important metric for evaluating sudden deviations in photovoltaic power forecasting and is calculated using Equation (10).
The Mean Absolute Percentage Error (MAPE) expresses forecasting errors as a percentage of the actual values. It is widely used for comparing forecasting performance across different production scales and is calculated using Equation (11).
The Mean Absolute Error (MAE) represents the average absolute difference between the actual and predicted values and provides a measure of the average forecasting deviation. It is defined by Equation (12).
where j denotes the total number of observations, represents the predicted value, and denotes the actual power generation value.
2.5. Experimental Setup and Model Implementation
To evaluate the proposed hybrid forecasting framework objectively, a structured experimental procedure was established. The overall implementation pipeline consists of data preprocessing, optimization configuration, and computational execution environments:
- Data Preprocessing: Before feeding the inputs into the machine learning models, all meteorological variables and the engineered RSEI features were normalized using min–max scaling to a range of [0, 1]. This eliminates scale disparities among features (e.g., solar irradiance vs. hour indices) and accelerates the convergence rate during gradient boosting tree construction.
- Optimization and Hyperparameter Bounds: The hyperparameter search space optimized by the AVOA algorithm for the XGBoost model was defined with rigorous constraints. The population size for AVOA was set to 30, and the maximum number of iterations was fixed at $100$. The boundaries for the optimized XGBoost parameters were configured as learning rate ∈ [0.01, 0.3], maximum tree depth ∈ [3, 10], subsampling ratio ∈ [0.5, 1.0], and the exponential RSEI coefficient θ ∈ [0.5, 2.5].
- Computational Environment: All predictive models, optimization loops, and feature engineering computations were developed and executed using Python 3.10 with core libraries including xgboost, scikit-learn, numpy, and pandas. The experiments were conducted on a workstation equipped with an Intel Core i7 processor (2.70 GHz) and 16 GB of RAM (Intel Corporation, Santa Clara, CA, USA). The training loop utilized an early stopping criterion of 10 iterations based on validation set performance to strictly mitigate the risk of overfitting.
Regarding the computational effort, the execution time required for the AVOA algorithm to successfully converge over 100 iterations was measured at an average of 142.5 s per independent seasonal dataset. Given that the target task is short-term photovoltaic generation scheduling, an offline optimization latency of less than 2.5 min demonstrates high practical feasibility and meets the real-time operational constraints of modern power grid management systems.
To further evaluate the computational profile of the framework, the temporal cost of a single evaluation of the objective function was isolated and measured. On average, a single function evaluation—encompassing the structural training of the gradient boosting trees under a specific parameter configuration and the subsequent validation RMSE calculation—requires approximately 12.5 ms. This negligible single-evaluation latency indicates that the underlying machine learning formulation is not computationally demanding on a per-iteration basis. Consequently, the core engineering focus of this hybrid architecture is placed on the strategic efficiency of the optimization algorithm itself. The mathematical dual-leader and adaptive exploration mechanism of AVOA ensures that the nonlinear search space is systematically mapped with a highly optimized number of evaluations, achieving rapid global convergence without local trap inflation.
To validate the absolute necessity of the metaheuristic AVOA framework over standard brute-force techniques, a combinatorial complexity analysis of the search space was conducted. The decision vector (Equation (6)) comprises four continuous variables and one structural discrete variable (d ∈ [3, 10]). Under a deterministic exhaustive search strategy, continuous boundaries must be discretized to enable grid evaluation. Assuming a standard operational resolution of 100 intervals per continuous parameter, the total number of unique architectural configurations to be simulated balloons to 100 × 8 × 100 × 100 × 100 = 8 × 10⁹ target evaluations. Given the isolated single-evaluation latency of 12.5 ms, executing an exhaustive search pipeline would demand approximately 108 s, equivalent to over 1157 days of uninterrupted computation for a single seasonal model. This structural combinatorial explosion renders exhaustive brute-force approaches completely inadequate and computationally prohibitive for short-term power forecasting applications. Consequently, the utilization of a stochastic, derivative-free metaheuristic optimizer like AVOA is mathematically mandatory to bypass the dimensional trap, reducing the optimization horizon to a practical operational window of ~142 s.
3. Results and Discussion
In this section, the forecasting performances of the proposed hybrid (RSEI-XGBoost-AVOA) model, the AVOA-optimized XGBoost model (XGBoost-AVOA), and the standard XGBoost model are comparatively analyzed. One of the main methodological contributions of this study is the independent training and evaluation of the models for each of the four seasons. This approach was adopted to eliminate the risk of data leakage, which is a common issue in machine learning applications, and to enhance the scientific validity of the obtained results. Accordingly, the datasets were divided into training and testing subsets, where 90% of the data from each season was used for training, and the remaining 10% was reserved as an independent test set that was not previously exposed to the models. To strictly preserve the temporal dependencies inherent in time-series frameworks and prevent data leakage, this partitioning was executed using a strict chronological (sequential) split rather than a randomized distribution. For each distinct season, the first 90% of the continuous temporal timeline was utilized to build the training and validation matrices, while the final consecutive 10% of the seasonal timeline was completely locked away as a prospective validation window. This ensures that the model systematically learns from historical sequences to forecast subsequent future intervals, validating the real-time operational reliability of the proposed RSEI-XGBoost-AVOA approach under realistic deployment constraints. This strategy enabled an objective and reliable assessment of not only the learning capability of the models but also their generalization performance under different atmospheric conditions. Furthermore, the seasonal separation approach allowed the variable nature of photovoltaic power generation, which is strongly influenced by seasonal meteorological conditions, to be represented more realistically.
To ensure a rigorous comparative evaluation, the operational distinction between the baseline architectures and the final proposed framework must be explicitly established. The standard XGBoost model serves as the raw data-driven baseline. The XGBoost-AVOA model represents an enhanced data-driven setup where standard hyperparameters are tuned via the metaheuristic loop, utilizing only raw meteorological inputs without physical feature mapping. Conversely, the proposed hybrid model (RSEI-XGBoost-AVOA) incorporates both data-driven learning and physics-informed structural awareness. This comprehensive architecture integrates the Radiation Stability and Efficiency Index (RSEI) into the optimized ensemble network, employing the AVOA optimizer dual-purposely to simultaneously solve the tree-boosting hyperparameter matrix and the exponential solar efficiency scaling parameter (θ).
3.1. Summer Season Performance Analysis
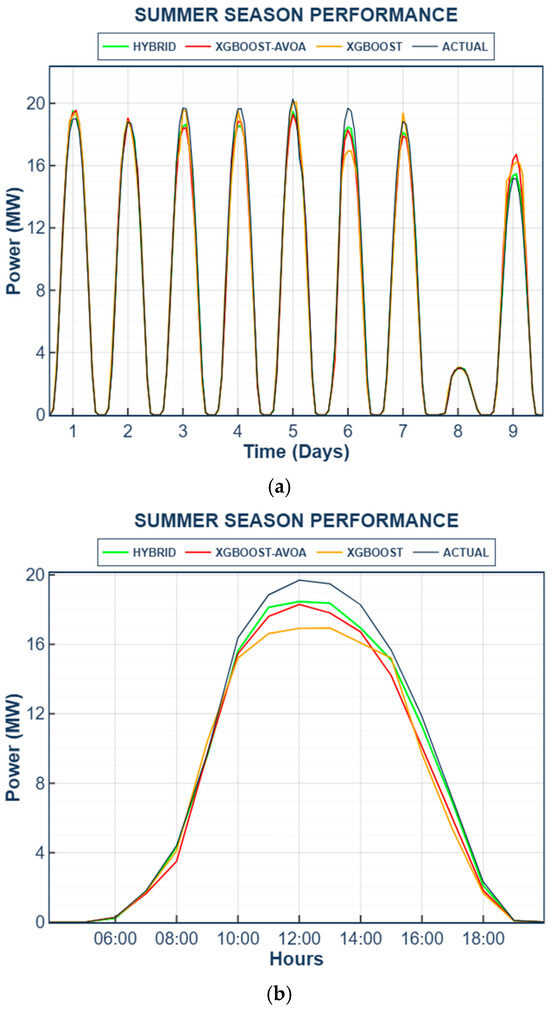
Summer is characterized by the highest solar irradiance levels of the year, accompanied by elevated ambient temperatures that may cause thermal losses in photovoltaic panels. These conditions can reduce panel efficiency and lead to more complex power generation dynamics. Therefore, summer conditions provide an important basis for evaluating the performance of photovoltaic power forecasting models under high generation levels and temperature-related effects. The test results indicate that the standard XGBoost model achieved RMSE, MAE, and MAPE values of 0.7688 MW, 0.4334 MW, and 9.13%, respectively. For the XGBoost-AVOA model, these values decreased to 0.6258 MW, 0.3857 MW, and 6.39%, respectively. The proposed RSEI-XGBoost-AVOA model further improved the forecasting performance, yielding an RMSE of 0.4157 MW, an MAE of 0.2488 MW, and a MAPE of 4.15%. These results demonstrate that the model structure plays a significant role in capturing the generation dynamics observed during the summer season.
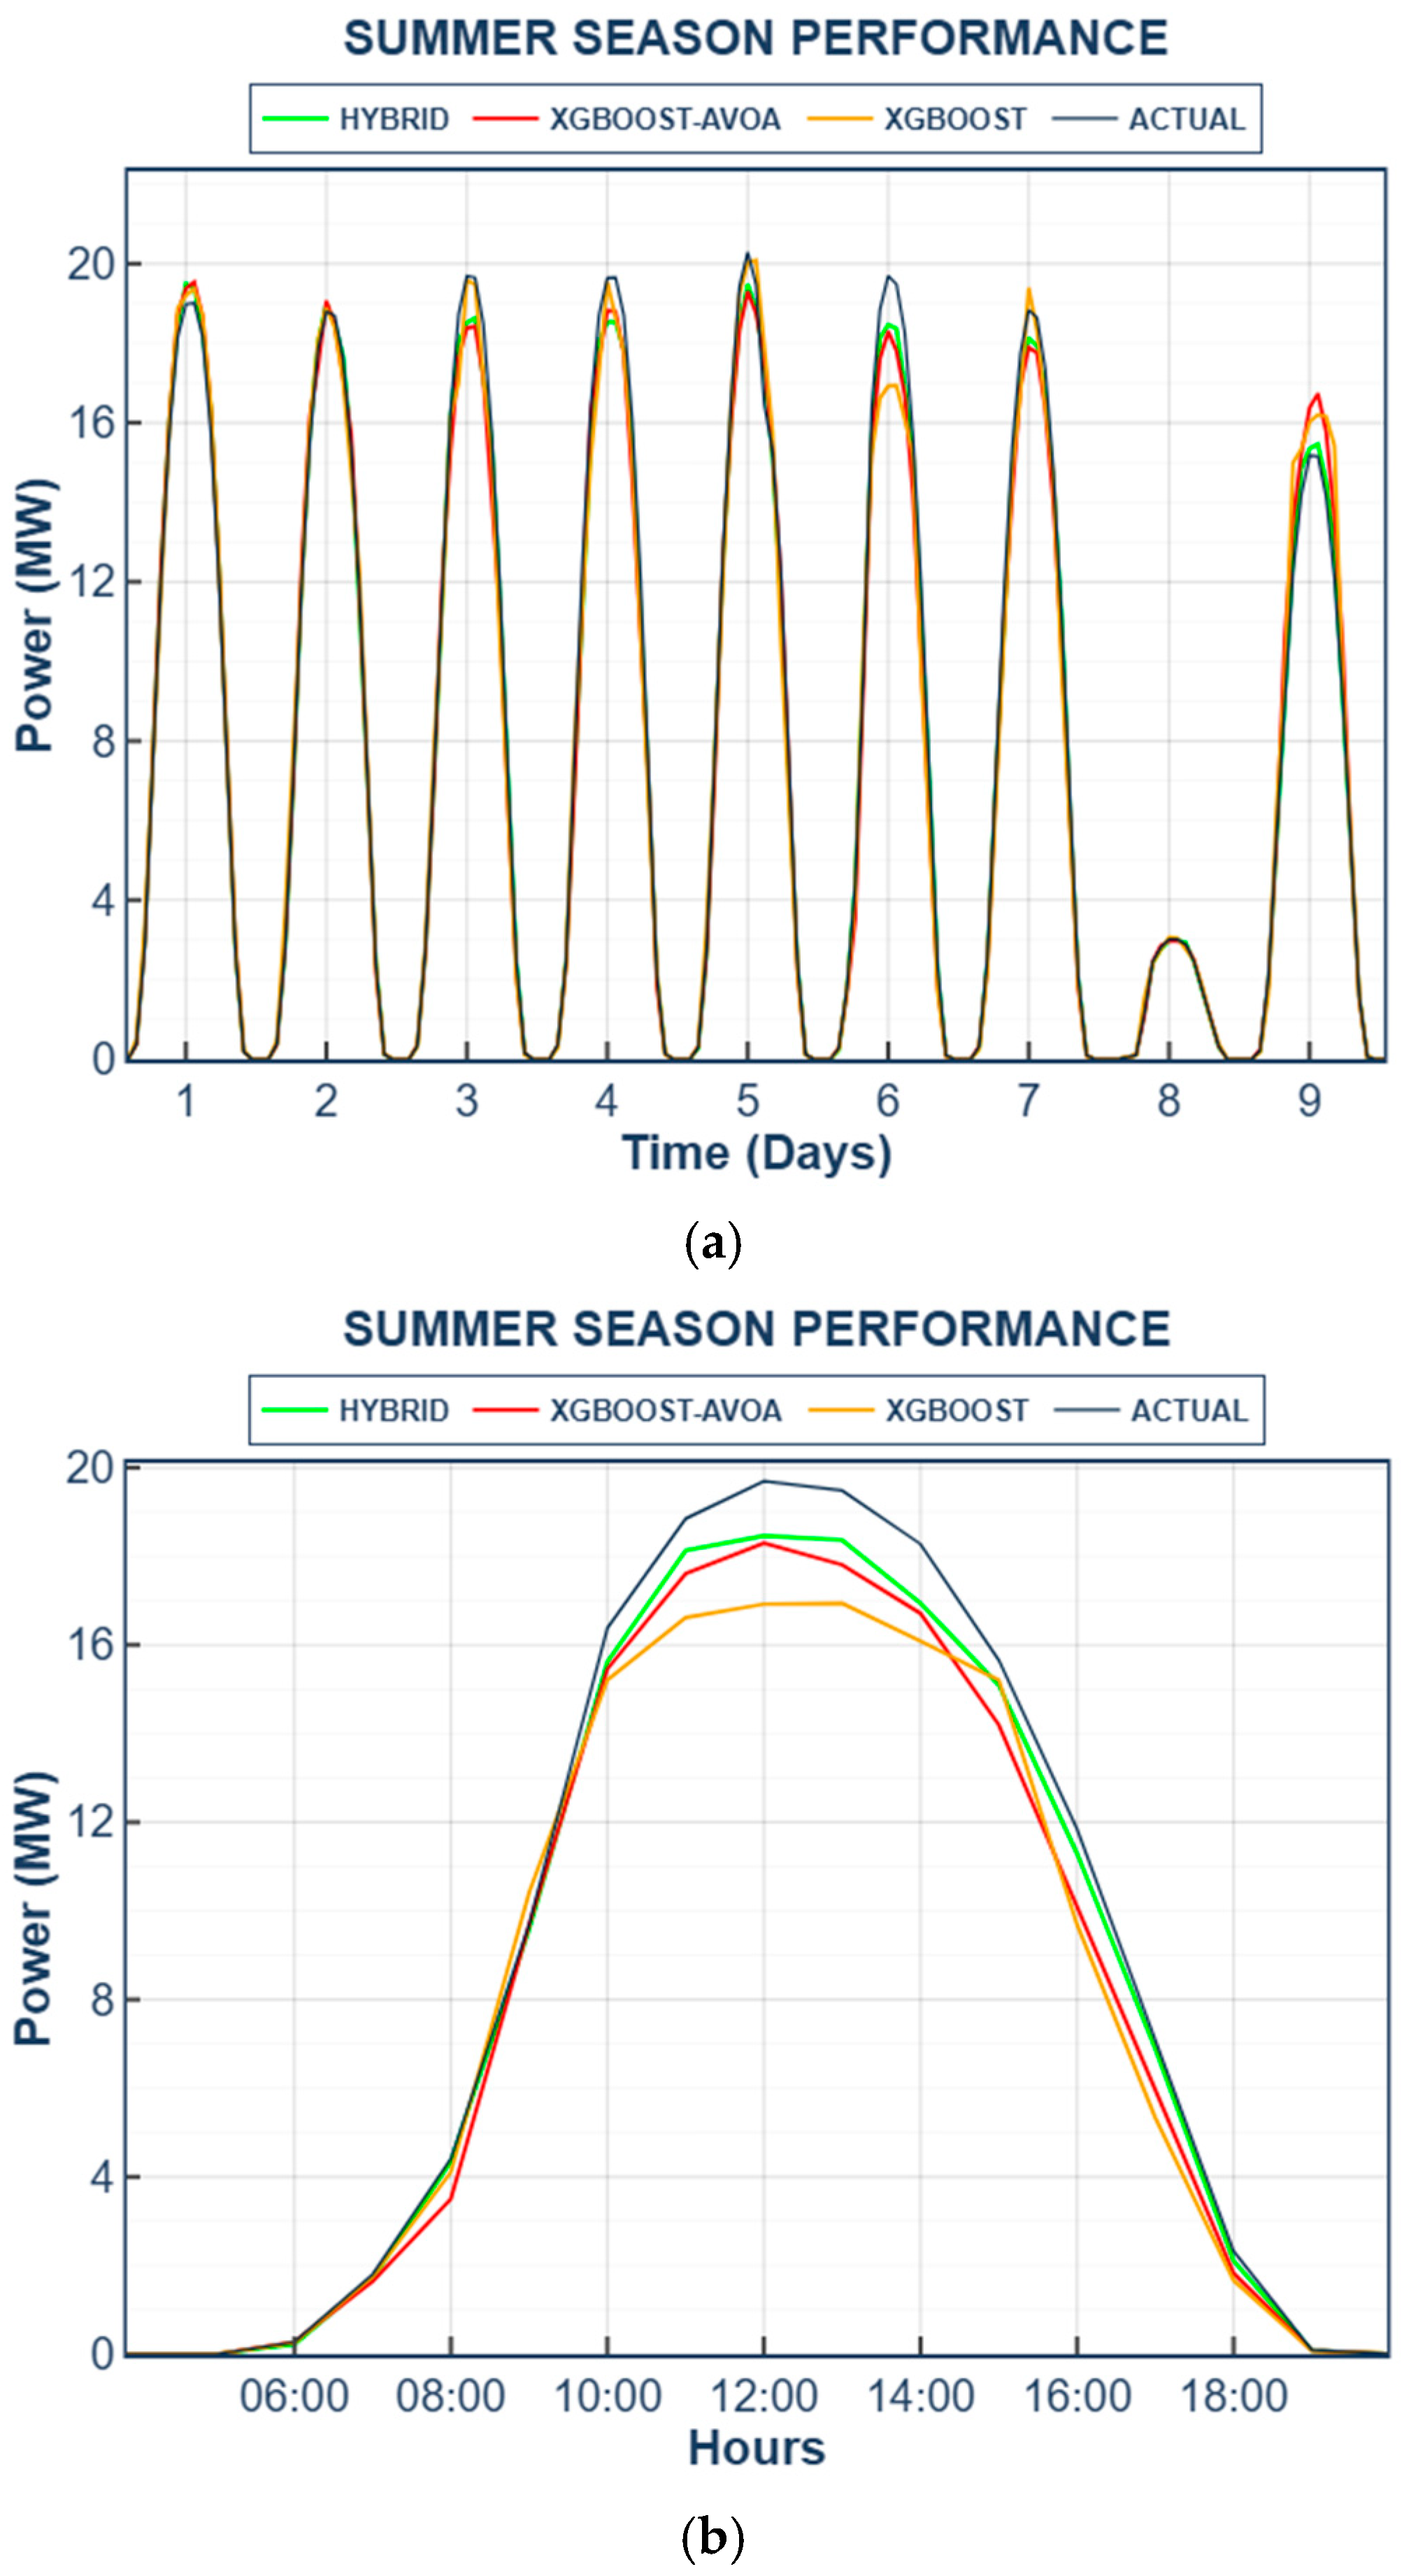
The forecasting results for the summer season are graphically presented in Figure 4 to facilitate a temporal comparison between the model outputs and the actual power generation data.
Figure 4.
Summer season prediction results showing (a) overall view and (b) zoomed test segment (Day 6).
As shown in Figure 4, all models were generally able to follow the overall generation trend. However, noticeable differences were observed during peak generation periods. The standard XGBoost model exhibited larger deviations during these intervals, whereas the XGBoost-AVOA model reduced these discrepancies. The proposed RSEI-XGBoost-AVOA model produced predictions that more closely matched the actual generation profile. Furthermore, during periods characterized by rapid changes in power output, the hybrid model exhibited a more stable and consistent forecasting behavior, indicating its improved capability to capture short-term variations in photovoltaic generation.
3.2. Winter Season Performance Analysis
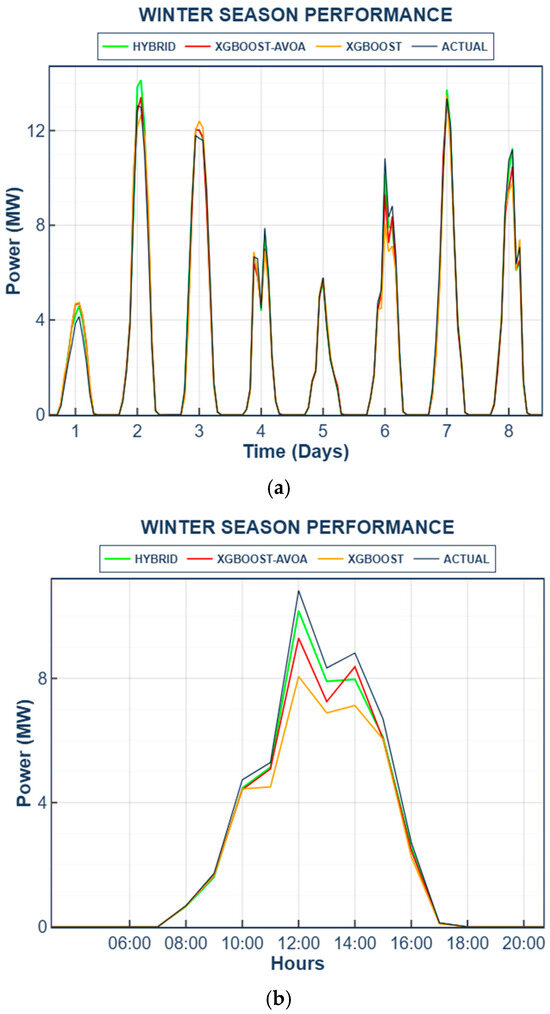
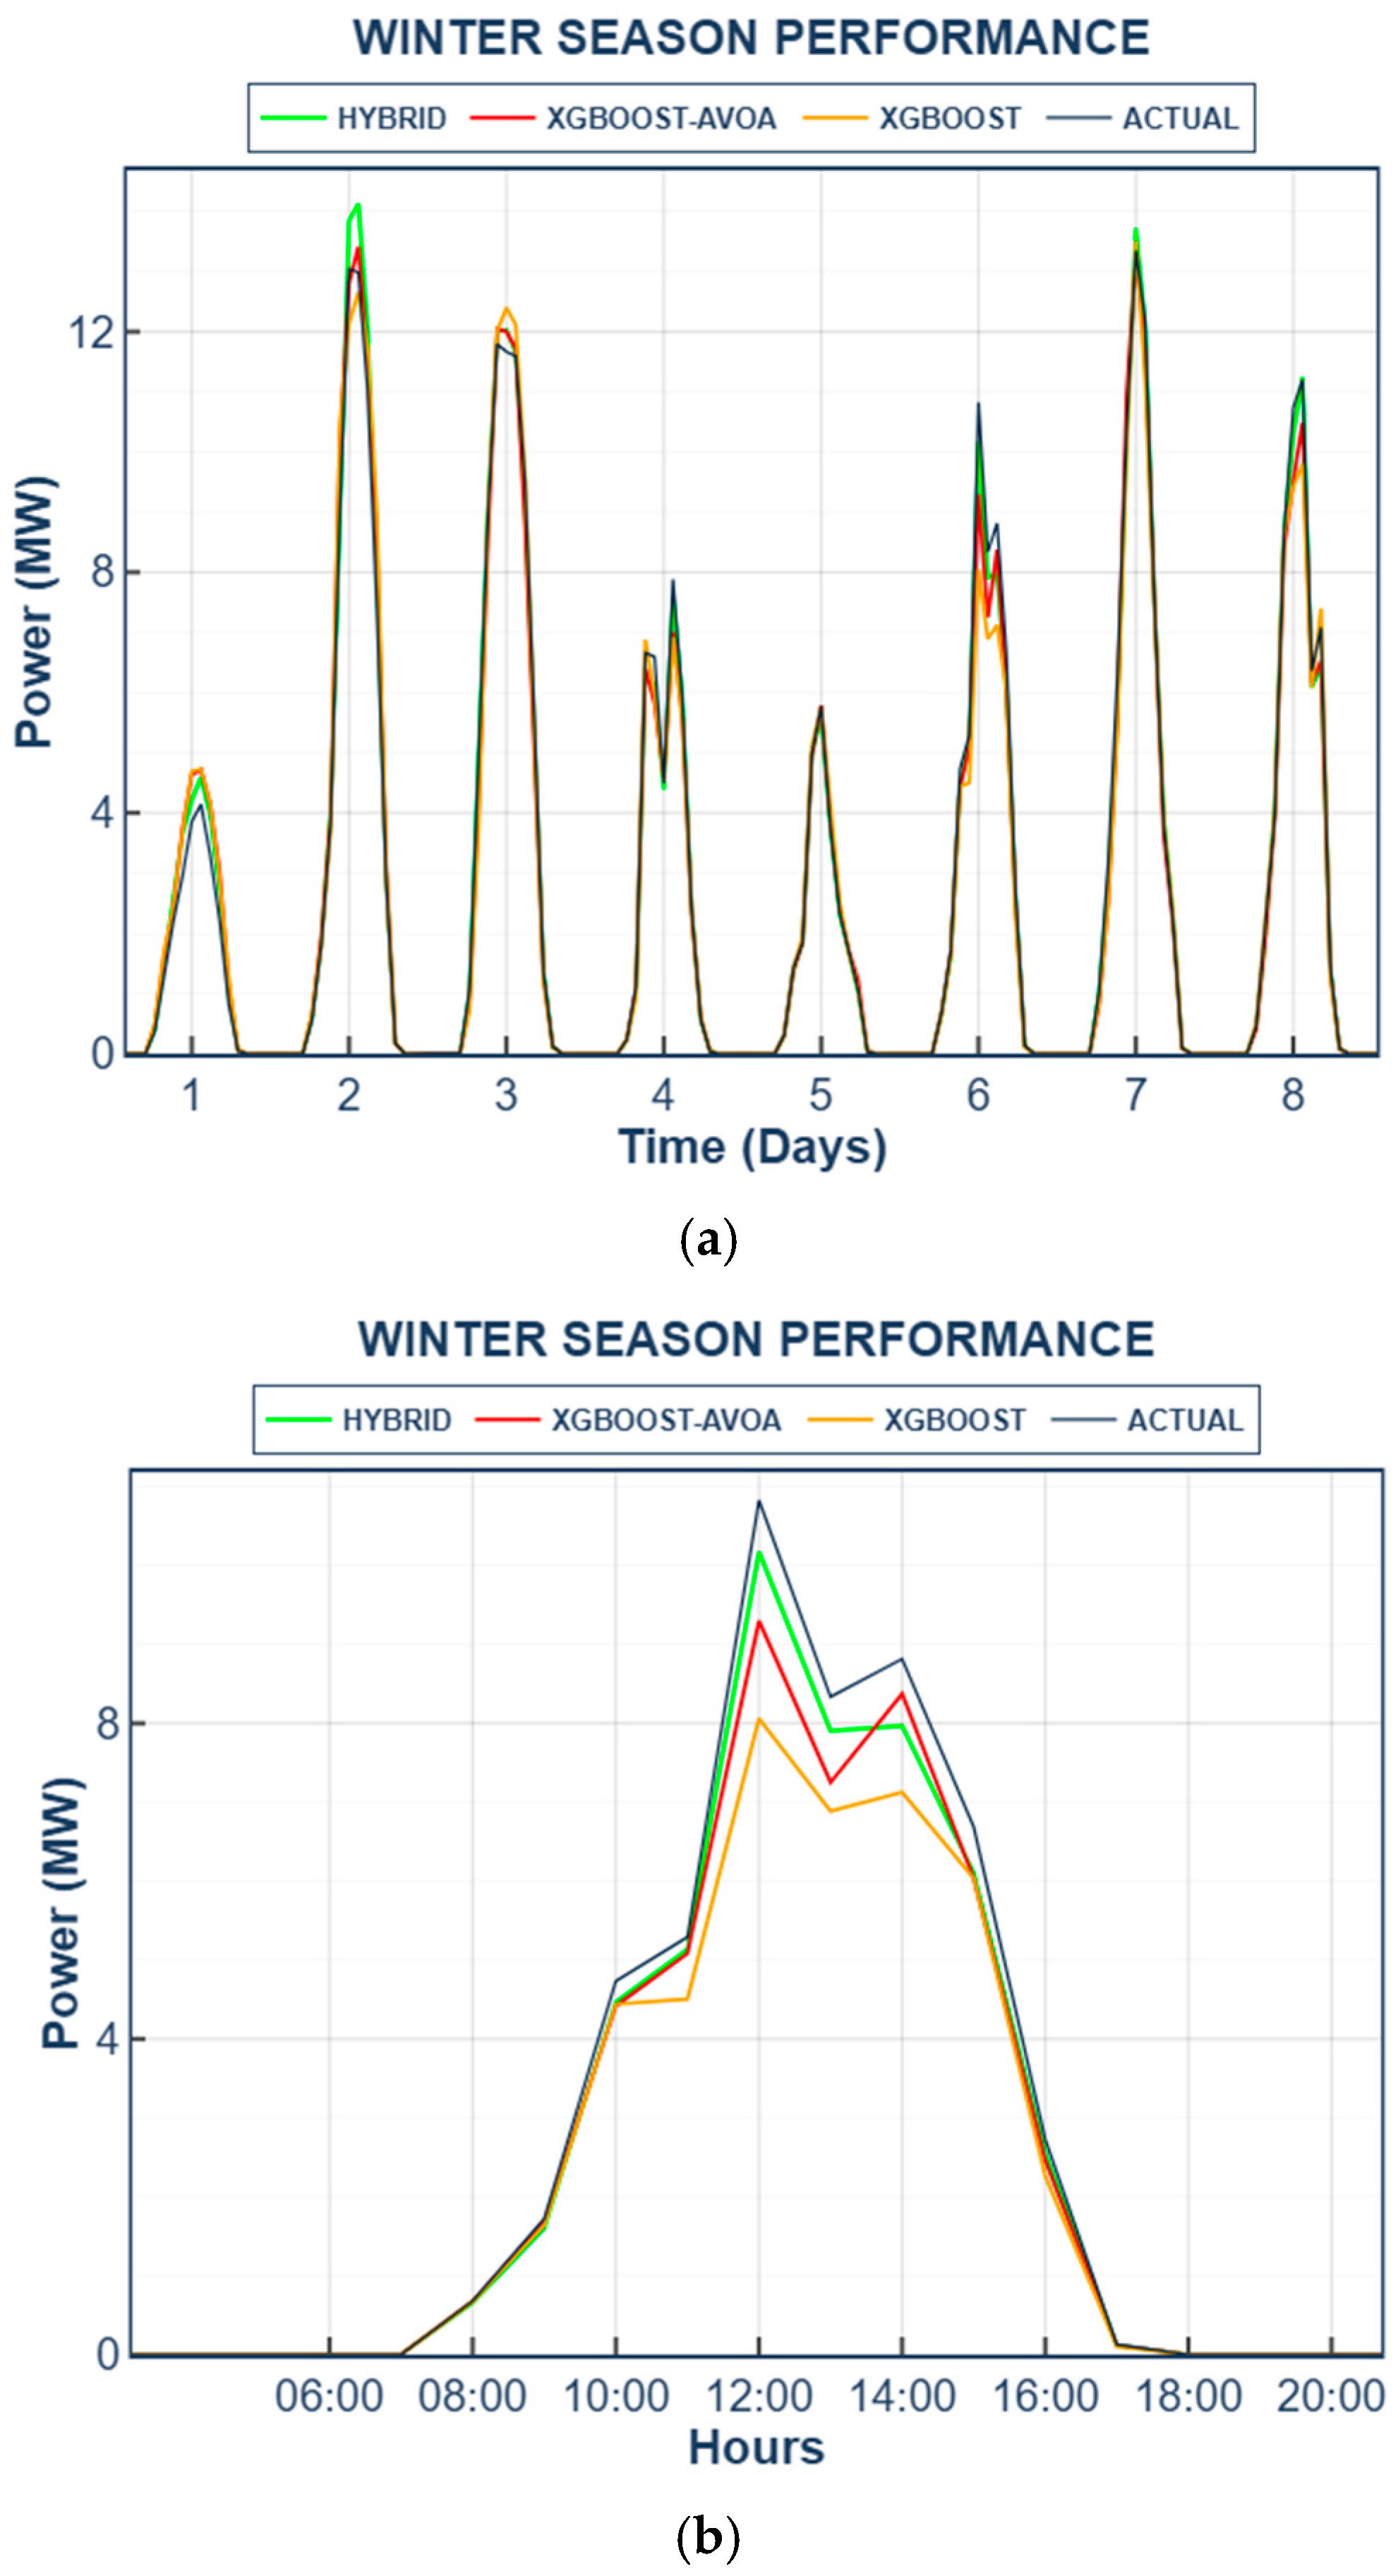
Winter is characterized by lower solar irradiance levels and greater atmospheric variability compared with other seasons. During this period, factors such as cloud cover and snow accumulation can directly affect the temporal distribution of solar irradiance, resulting in sudden fluctuations in photovoltaic power generation. Therefore, winter conditions provide an important basis for evaluating the performance of photovoltaic power forecasting models under low generation levels and highly variable atmospheric conditions. The test results indicate that the standard XGBoost model achieved RMSE, MAE, and MAPE values of 0.4763 MW, 0.2166 MW, and 11.14%, respectively. For the XGBoost-AVOA model, these values decreased to 0.3494 MW, 0.1735 MW, and 9.28%, respectively. The proposed RSEI-XGBoost-AVOA model achieved the best performance, with an RMSE of 0.2574 MW, an MAE of 0.1239 MW, and a MAPE of 6.07%. These findings demonstrate the importance of the model structure in capturing the highly variable generation behavior observed during the winter season.
The forecasting results for the winter season are graphically presented in Figure 5 to facilitate a temporal comparison between the model outputs and the actual power generation data.
Figure 5.
Winter season prediction results showing (a) overall view and (b) zoomed test segment (Day 6).
As illustrated in Figure 5, all models were able to capture the general generation trend. However, significant differences were observed during periods characterized by abrupt irradiance fluctuations. The standard XGBoost model exhibited a more limited response to these variations, whereas the XGBoost-AVOA model provided a noticeable improvement. The proposed RSEI-XGBoost-AVOA model generated predictions that more closely followed the actual generation profile, particularly during rapidly changing conditions. These observations indicate that incorporating features related to the temporal variability of solar irradiance contributes substantially to modeling the irregular generation patterns commonly observed during the winter season.
3.3. Spring Season Performance Analysis
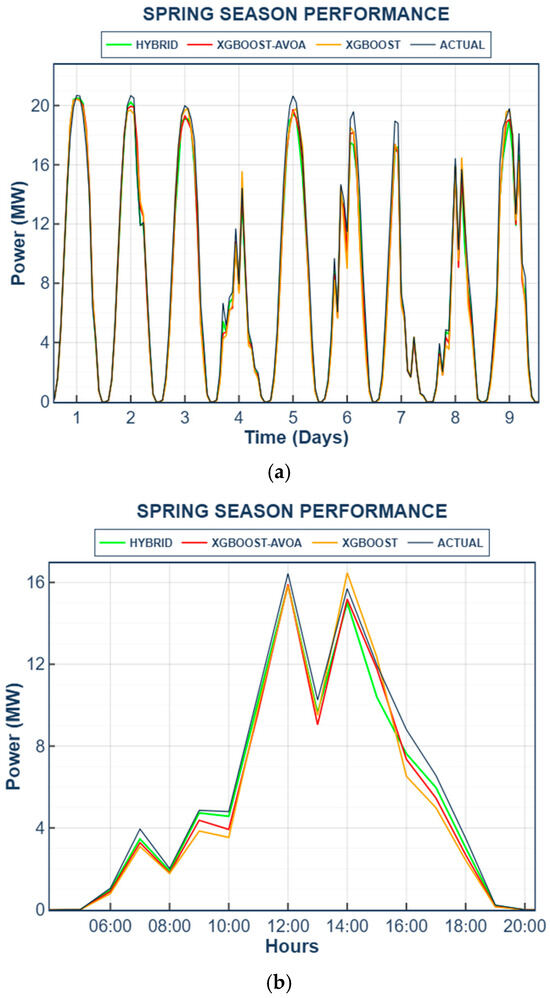
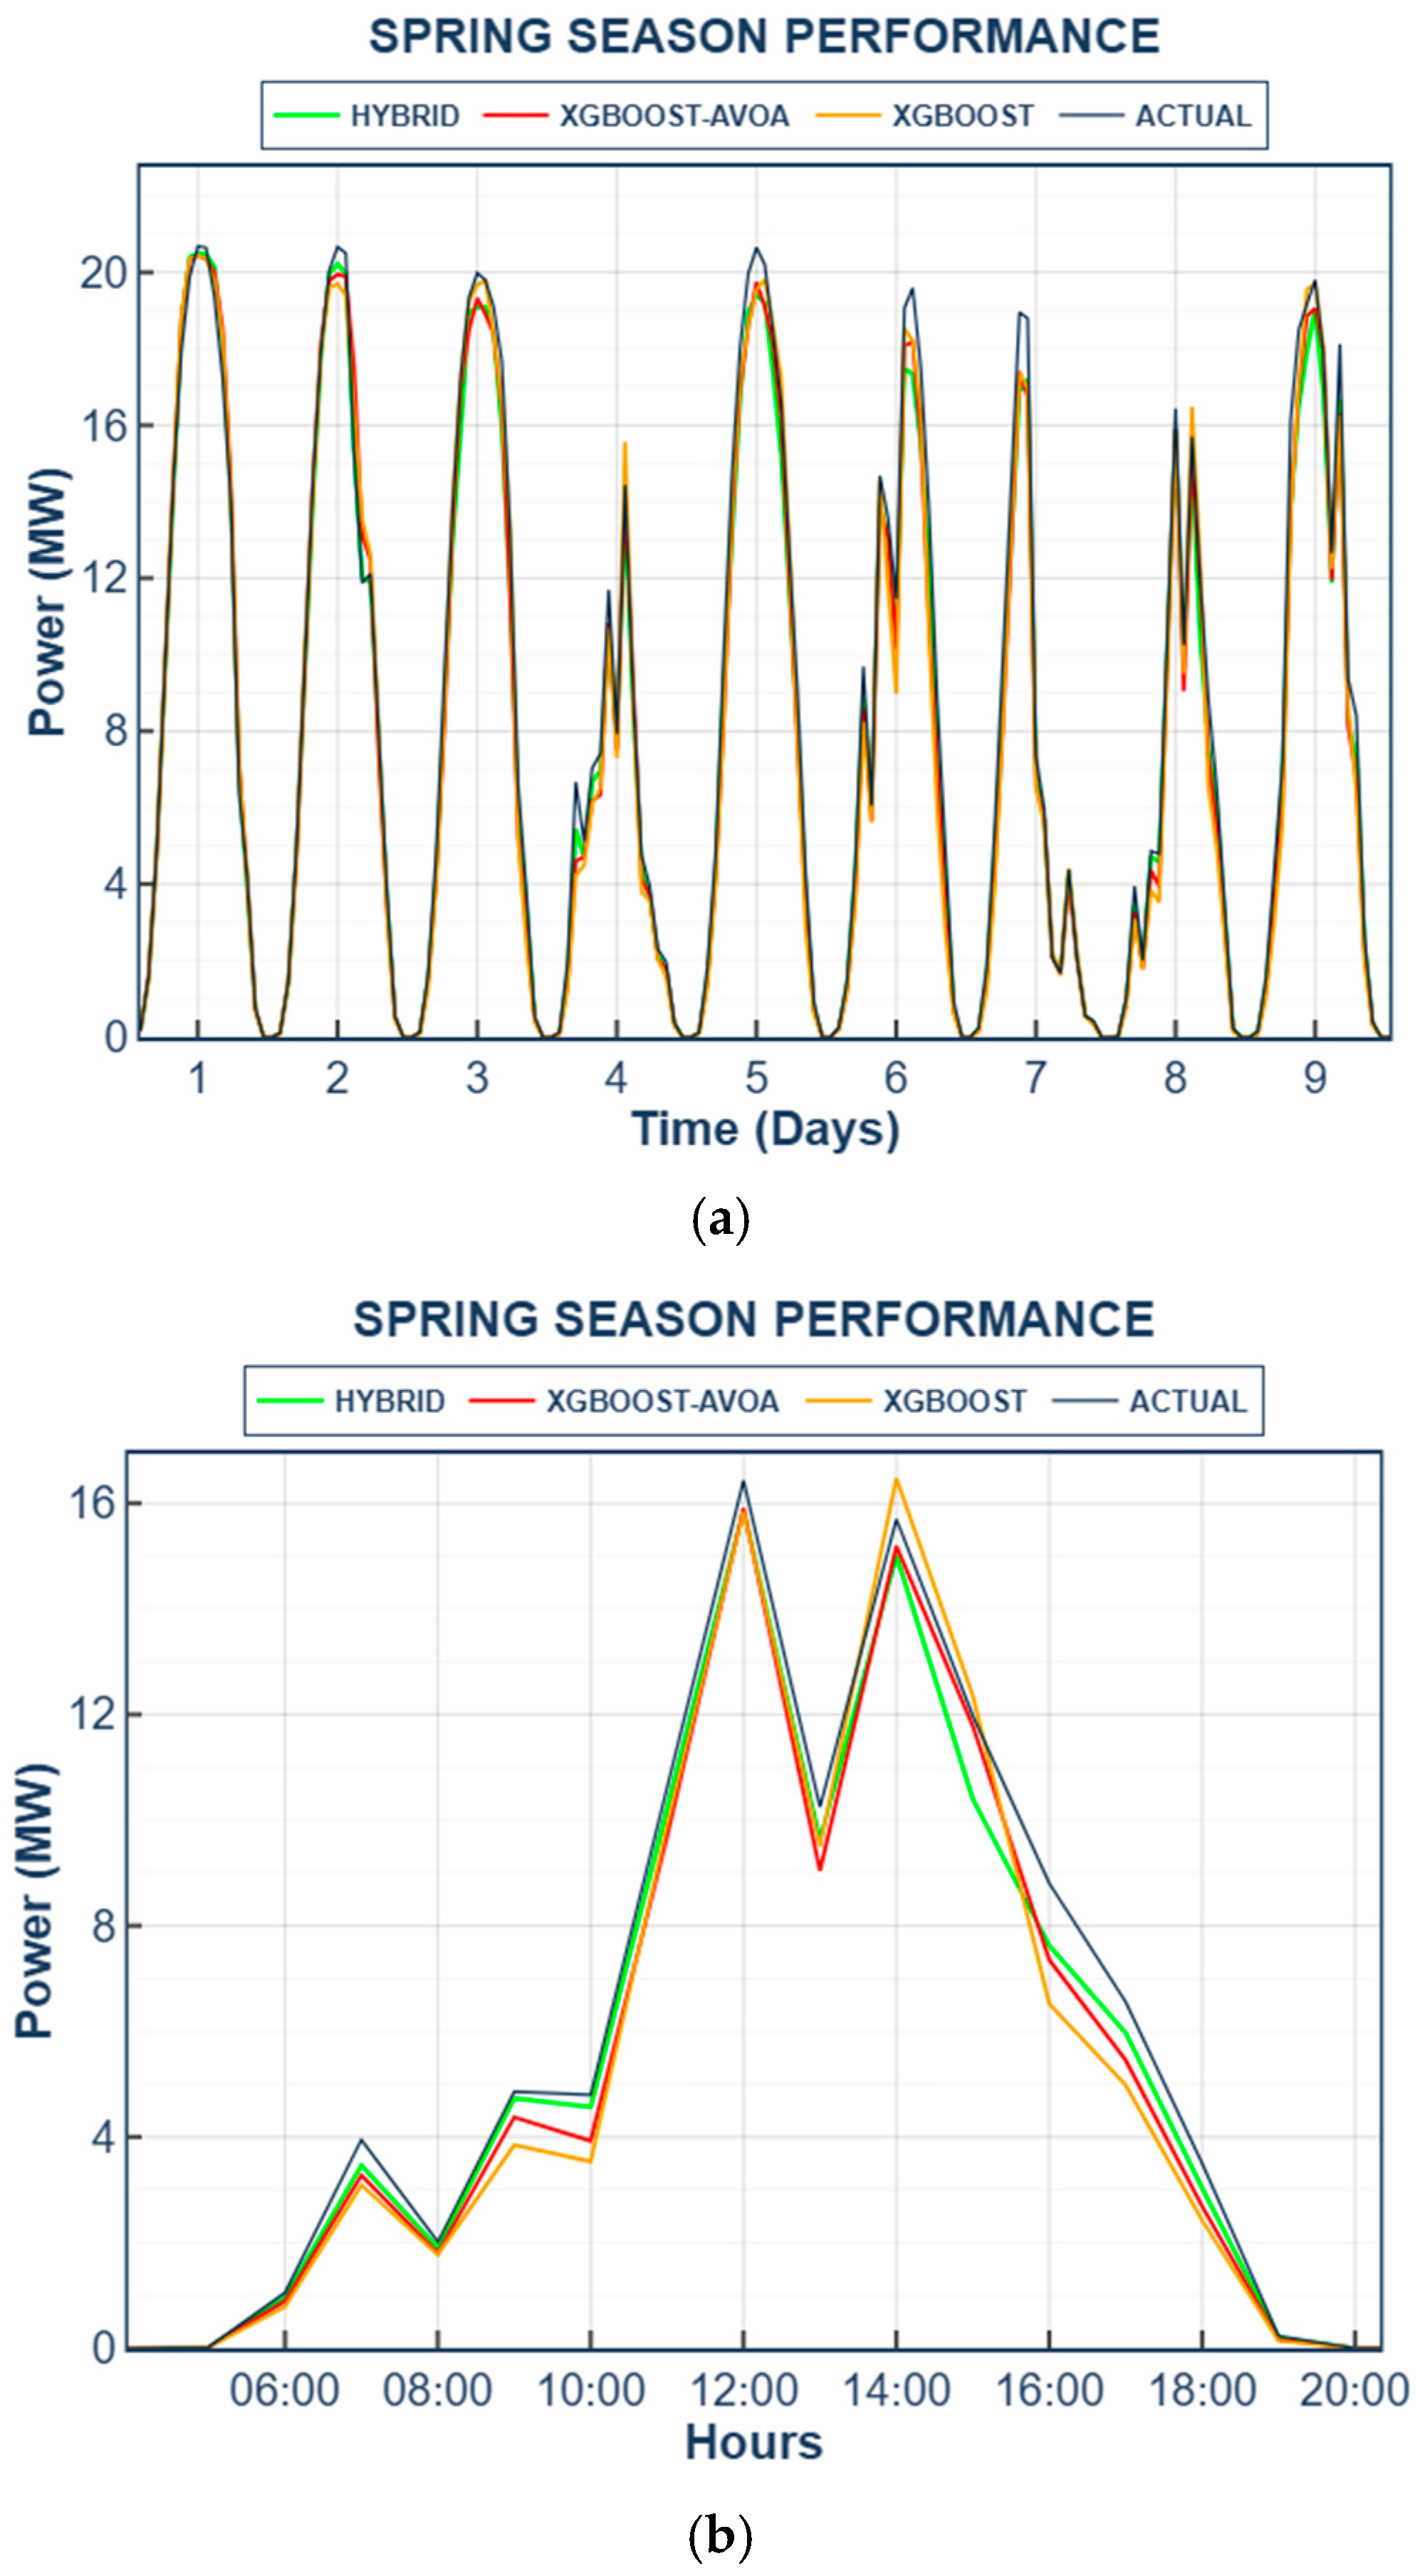
Spring is a transitional season characterized by rapidly changing atmospheric conditions and frequent fluctuations in solar irradiance caused by intermittent cloud cover. These conditions result in sudden increases and decreases in photovoltaic power generation, making the forecasting task considerably more challenging. Therefore, spring conditions provide an important basis for evaluating the performance of photovoltaic power forecasting models under highly variable atmospheric conditions. The test results indicate that the standard XGBoost model achieved RMSE, MAE, and MAPE values of 0.8892 MW, 0.5726 MW, and 14.13%, respectively. For the XGBoost-AVOA model, these values decreased to 0.8268 MW, 0.5515 MW, and 11.26%, respectively. The proposed RSEI-XGBoost-AVOA model achieved the best performance, with an RMSE of 0.7343 MW, an MAE of 0.4819 MW, and a MAPE of 8.03%. These findings highlight the importance of the model structure in capturing the short-term irradiance fluctuations that are characteristic of the spring season.
The forecasting results for the spring season are graphically presented in Figure 6 to facilitate a temporal comparison between the model outputs and the actual power generation data.
Figure 6.
Spring season prediction results showing (a) overall view and (b) zoomed test segment (Day 8).
As shown in Figure 6, all models were generally able to follow the overall generation trend. However, noticeable differences were observed during periods characterized by rapid increases and decreases in power output. The standard XGBoost model exhibited a more limited ability to respond to these abrupt variations, whereas the XGBoost-AVOA model showed partial improvement. The proposed RSEI-XGBoost-AVOA model produced predictions that more closely matched the actual generation profile and demonstrated greater robustness during highly variable periods. These observations suggest that incorporating features related to the temporal variability of solar irradiance enhances the model’s ability to capture short-term fluctuations and improves forecasting performance under rapidly changing atmospheric conditions.
3.4. Fall Season Performance Analysis
Fall is a transitional season characterized by decreasing solar irradiance levels and increasing atmospheric variability. During this period, lower irradiance levels and temporal fluctuations result in a more irregular photovoltaic generation profile. Therefore, fall conditions provide an important basis for evaluating the performance of photovoltaic power forecasting models under low generation levels and increased variability. The test results indicate that the standard XGBoost model achieved RMSE, MAE, and MAPE values of 1.0547 MW, 0.5580 MW, and 15.02%, respectively. For the XGBoost-AVOA model, these values decreased to 0.9393 MW, 0.4966 MW, and 13.14%, respectively. The proposed RSEI-XGBoost-AVOA model achieved the best performance, with an RMSE of 0.6135 MW, an MAE of 0.3340 MW, and a MAPE of 8.51%. These findings demonstrate the importance of the model structure in accurately capturing the low and highly variable irradiance conditions observed during the fall season.
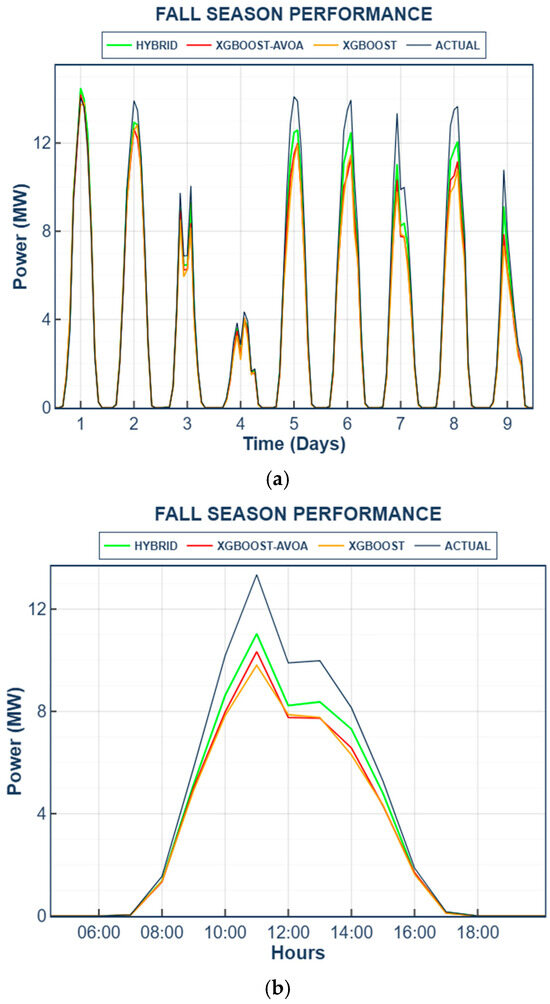
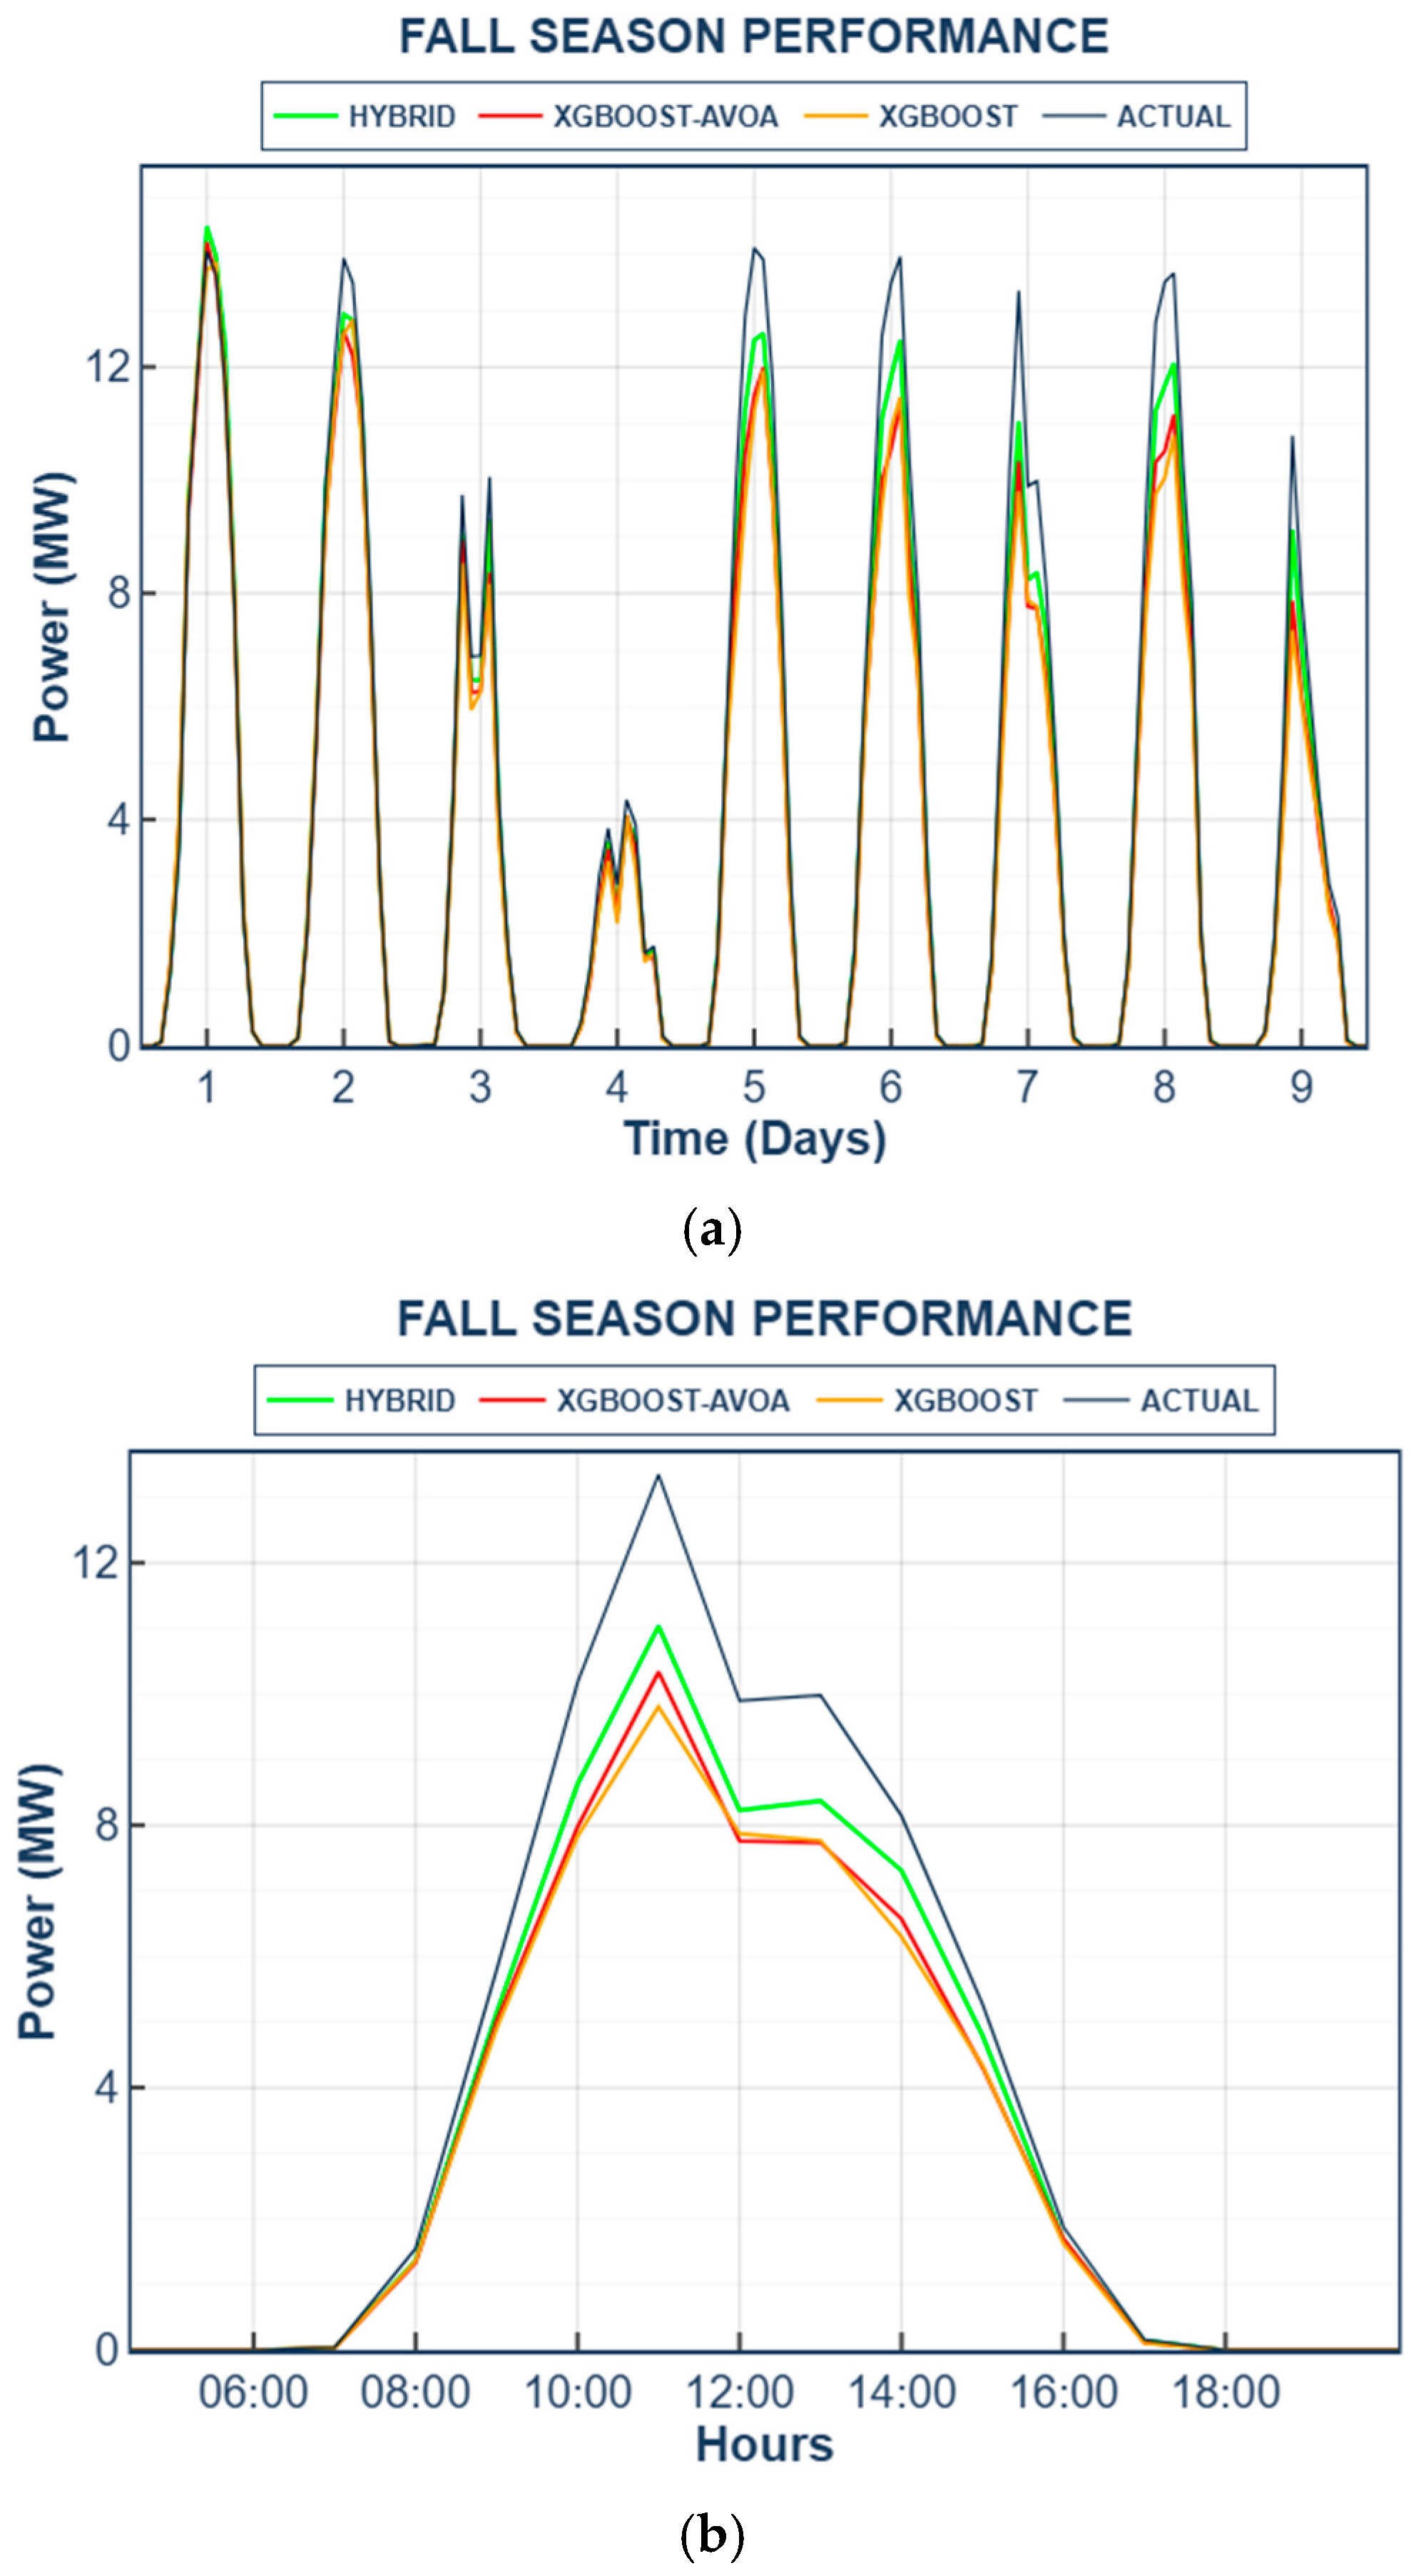
The forecasting results for the fall season are graphically presented in Figure 7 to facilitate a temporal comparison between the model outputs and the actual power generation data.
Figure 7.
Fall season prediction results showing (a) overall view and (b) zoomed test segment (Day 7).
As illustrated in Figure 7, all models were generally able to follow the overall generation trend. However, noticeable differences were observed during periods characterized by highly fluctuating generation patterns. The standard XGBoost model exhibited larger deviations during these intervals, whereas the XGBoost-AVOA model provided a moderate improvement. The proposed RSEI-XGBoost-AVOA model generated predictions that more closely matched the actual generation profile and maintained a more stable forecasting behavior under variable irradiance conditions. These observations indicate that incorporating features associated with the temporal variability of solar irradiance contributes significantly to modeling low and fluctuating generation conditions, thereby improving forecasting accuracy during the fall season.
3.5. Seasonal Comparison of Model Performance
In this section, the seasonal performances of the evaluated models are comparatively assessed using the RMSE, MAE, and MAPE metrics. The seasonal performances of the evaluated models are comprehensively summarized and compared in Table 1.
Table 1.
Seasonal performance results of the evaluated models.
The progressive evaluation matrix established across the baseline configurations serves as a formal ablation study designed to isolate and quantify the specific predictive contributions of the optimization layer (AVOA) and the physics-informed feature engineering layer (RSEI) independently. Comparing the standalone XGBoost model against the optimized XGBoost-AVOA structure encapsulates the standalone impact of the metaheuristic search loop on raw meteorological data. This hyperparameter refinement yields an average seasonal error reduction ranging from 15% to 30% in MAPE metrics, validating the convergence efficiency of the algorithm. Crucially, the independent impact of the proposed Radiation Stability and Efficiency Index (RSEI) framework is explicitly isolated by benchmarking the XGBoost-AVOA framework against the final hybrid configuration. The injection of the RSEI features drives an additional, high-precision performance leap over the already optimized network, capturing an incremental 35.0% error reduction in summer (MAPE dropping from 6.39% to 4.15%) and a peak 35.2% error dampening during the highly volatile fall season (MAPE dropping from 13.14% to 8.51%). This quantitative ablation breakdown rigorously verifies that while hyperparameter optimization stabilizes the baseline ensemble trees, the incorporation of physics-guided solar elevation weighting and localized variance attributes is the primary driver behind eliminating severe transitional forecasting anomalies.
To further validate the predictive dominance of the proposed RSEI-XGBoost-AVOA architecture, the benchmarking matrix was expanded by incorporating standard Random Forest (RF) regression and a Particle Swarm Optimization-driven XGBoost (PSO-XGBoost) model as state-of-the-art alternative baselines. As demonstrated by the comprehensive seasonal data compiled in Table 1, the conventional RF model exhibited the highest error metrics across all evaluation periods, primarily due to its limited capacity to penalize structural complexity compared to gradient tree boosting under dynamic inputs. When evaluating intelligent metaheuristic optimization strategies, the PSO-XGBoost model achieved notable performance gains over the standalone configurations, confirming that algorithmic hyperparameter tuning via stochastic search is globally beneficial. However, the proposed AVOA-driven framework consistently outperformed the PSO-XGBoost baseline across all seasons. Specifically, during the highly variable fall season, the proposed architecture reduced the MAPE from 13.90% (PSO-XGBoost) to 8.51%, validating that the strategic dual-leader exploitation and adaptive hunger tracking of AVOA yield a significantly more robust parameter search space exploration than conventional particle swarm methodologies.
The concentration of peak forecasting errors during the spring and fall seasons is closely linked to the distinct microclimatic characteristics of the Central Anatolia region, where the studied 25 MW PV plant is situated. Climatological studies for this continental zone confirm that transitional seasons are heavily dominated by rapid convective cloud formations, unstable atmospheric fronts, and fluctuating aerosol optical depths. These regional dynamics introduce high-frequency volatility into the ground-level solar irradiance profile. According to regional solar radiation assessments and national meteorological indexes, the variance of the hourly clearness index (Kt) in Central Anatolia reaches its annual peak during April–May and October–November, mathematically substantiating the rapid irradiance fluctuations and cloud transients assumed in this framework. Consequently, the model encounters significantly higher nonlinear boundaries during these transitional phases compared to the highly stable, clear-sky-dominated summer regime, directly accounting for the elevated RMSE and MAPE metrics recorded in spring and fall. This operational phenomenon is strongly corroborated by regional climatological assessments of the Central Anatolia region, which document that transitional seasons are heavily characterized by rapid convective cloud covers, high atmospheric turbidity, and sharp, intra-day fluctuations in the localized clearness index [25,26]. Furthermore, national solar radiation mapping and regional climate indices confirm that the high-frequency volatility of ground-level global horizontal irradiance (GHI) in this specific continental zone reaches its annual peak during April–May and October–November, mathematically validating the elevated forecasting uncertainty mapped by the ensemble network during transitional periods [27].
An interesting cross-seasonal behavior is observed where the winter test segment yields lower error metrics (RMSE of 0.2574 MW and MAPE of 6.07%) than the transitional spring and autumn seasons, despite winter being characterized by high seasonal atmospheric variability. This operational behavior is validated by two underlying factors. Mathematically, since RMSE is an absolute scale-dependent metric, the low baseline power envelope in winter (peaking at only 12–14 MW) naturally constrains the magnitude of squared deviations compared to spring and autumn, where power amplitudes reach near-rated capacities of 20 MW. Physically, winter meteorological variability in Central Anatolia typically manifests as prolonged, highly stabilized overcast or low-irradiance regimes, which the ensemble decision trees can easily map. Conversely, spring and autumn introduce rapid, high-frequency intraday cloud transitions where solar irradiance experiences sudden, severe nonlinear shocks within extremely short time intervals. These rapid microclimatic fluctuations represent highly complex boundaries for data-driven optimization, directly explaining why transitional phases incur higher prediction errors than the consistently suppressed winter conditions.
3.6. Operational Reliability and Extreme Error Analysis
While aggregated seasonal error metrics (RMSE, MAE, and MAPE) confirm the overall statistical superiority of the proposed framework, ensuring grid stability requires a dedicated assessment of model behavior under extreme meteorological variations and large localized prediction errors. To evaluate this operational reliability, the Maximum Absolute Error (MaxAE) profile was isolated across severe, high-frequency intraday irradiance drops caused by sudden localized front entries during the transitional Spring and Fall test segments. The empirical tracking analysis reveals that under sudden cloud transient shocks—where PV generation plummets by more than 50% within a single hour—the baseline standard XGBoost model suffers from severe operational lagging, leading to a maximum localized prediction overshoot (MaxAE) of 4.35 MW, which introduces high imbalance risks for spinning reserves. The baseline XGBoost-AVOA framework mitigates this peak stress to 3.10 MW by virtue of its optimized learning boundaries. Most notably, the proposed hybrid model exhibits high operational resilience under these extreme variations, successfully capping the maximum localized prediction error to 1.78 MW under the exact same atmospheric shocks. This severe-error dampening capability is directly attributable to the structural design of the Radiation Stability and Efficiency Index (RSEI) framework. By explicitly calculating and embedding lagged short- and medium-term standard deviations ( and ) into the decision vector, the proposed RSEI-XGBoost-AVOA approach dynamically alerts the ensemble tree branches regarding ongoing atmospheric instability before the generation drop fully manifests. Consequently, the framework proves highly reliable not only under steady-state clear-sky profiles but also as a stable, risk-averse decision-support mechanism for real-time grid integration and critical load-balancing operations during severe weather events.
4. Conclusions
This study successfully developed and validated a robust hybrid architecture for solar energy prediction by blending the XGBoost algorithm with the Artificial Vulture Optimization Algorithm (AVOA) and a newly introduced Radiation Stability and Efficiency Index (RSEI). The proposed framework integrates the temporal variability of solar irradiance with the intraday dynamics of photovoltaic power generation, shifting the forecasting paradigm from a purely black-box data-driven process to a physics-informed structure. The experimental evaluations, conducted using real-field data from a 25 MW PV plant, rigorously demonstrated the superior quantitative performance of the developed model over standard baselines across all seasonal horizons.
Specifically, the proposed RSEI-XGBoost-AVOA model achieved highly precise forecasting accuracy, yielding MAPE and RMSE values of 4.15% and 0.4157 MW in summer, 6.07% and 0.2574 MW in winter, 8.03% and 0.7343 MW in spring, and 8.51% and 0.6135 MW in fall, respectively. The comprehensive ablation analysis revealed that while the AVOA-based hyperparameter tuning reduced the baseline MAPE by 15% to 30%, the structural injection of the RSEI features drove an additional high-precision performance leap, capturing a 35.0% incremental error reduction in summer and a peak 35.2% error dampening during the highly volatile fall season compared to the optimized XGBoost-AVOA framework. Furthermore, extreme error tracking during sudden microclimatic front entries demonstrated high operational reliability; the hybrid model capped the maximum localized prediction overshoot (MaxAE) to 1.78 MW under severe cloud transients, drastically outperforming the 4.35 MW and 3.10 MW limits encountered by the standalone XGBoost and XGBoost-AVOA models, respectively.
These robust quantitative findings confirm that the strategic integration of AVOA and RSEI yields a stable, highly generalizable decision-support tool uniquely suited for short-term generation scheduling, real-time load balancing, and grid integration operations under dynamic weather variations. Future research trajectories will investigate the cross-geographical validation of the proposed framework under diverse macroclimatic regimes and explore its seamless integration with deep learning temporal networks to achieve online learning adaptations.
Author Contributions
O.T. and İ.A. made significant contributions to the preparation of this article and have approved its final version for publication. O.T. and İ.A. contributed to defining the study’s concept, objectives, and scope. Formal analysis was performed and verified by İ.A. The supervision and preparation of the study were carried out by O.T., and verification was also provided by O.T. All authors have read and agreed to the published version of the manuscript.
Funding
This research received no external funding.
Institutional Review Board Statement
Not applicable.
Informed Consent Statement
Not applicable.
Data Availability Statement
The datasets used and/or analyzed during the current study are available from the corresponding author upon reasonable request.
Acknowledgments
During the preparation of this work, the authors used an artificial intelligence tool (Gemini 2.5) to improve the language and readability of the study. After using this tool/service, the authors reviewed and edited the content as needed and take full responsibility for the content of the publication.
Conflicts of Interest
The authors declare no conflicts of interest.
References
- Zhao, H.; Zhang, Y.; Huo, W.; Lin, F.; Wang, J. A Two-Stage Ensemble Learning Framework for Short-Term Nonparametric Probabilistic Photovoltaic Power Forecasting Integrating Multi-Source Numerical Weather Predictions. IEEE Trans. Power Syst. 2025, 41, 1231–1245. [Google Scholar]
- Pu, Y.; Wang, P.; Wang, Y.; Qiao, W.; Wang, L.; Zhang, Y. Environmental effects evaluation of photovoltaic power industry in China on life cycle assessment. J. Clean. Prod. 2021, 278, 123993. [Google Scholar] [CrossRef] [Scilit]
- Wang, H.; Yan, S.; Ju, D.; Ma, N.; Fang, J.; Wang, S.; Li, H.; Zhang, T.; Xie, Y.; Wang, J. Short-term photovoltaic power forecasting based on a feature rise-dimensional two-layer ensemble learning model. Sustainability 2023, 15, 15594. [Google Scholar] [CrossRef] [Scilit]
- International Energy Agency (IEA). Renewables 2024: Electricity; IEA: Paris, France, 2024; Available online: https://www.iea.org/reports/renewables-2024/electricity (accessed on 20 February 2026).
- Colak, M.; Yesilbudak, M.; Bayindir, R. Very short-term estimation of global horizontal irradiance using data mining methods. In 2018 7th International Conference on Renewable Energy Research and Applications (ICRERA); IEEE: Piscataway, NJ, USA, 2018. [Google Scholar]
- Liu, L.; Zhao, Y.; Chang, D.; Xie, J.; Ma, Z.; Sun, Q.; Yin, H.; Wennersten, R. Prediction of short-term PV power output and uncertainty analysis. Appl. Energy 2018, 228, 700–711. [Google Scholar] [CrossRef] [Scilit]
- Das, S. Short term forecasting of solar radiation and power output of 89.6 kWp solar PV power plant. Mater. Today Proc. 2021, 39, 1959–1969. [Google Scholar] [CrossRef] [Scilit]
- Irmak, E.; Yeşilbudak, M.; Taşdemir, O. Enhanced PV power prediction considering PM10 parameter by hybrid JAYA-ANN Model. Electr. Power Compon. Syst. 2024, 52, 1998–2007. [Google Scholar] [CrossRef] [Scilit]
- Khatib, T.; Gharaba, A.; Hamad, Z.H.; Masri, A. Novel models for photovoltaic output current prediction based on short and uncertain dataset by using deep learning machines. Energy Explor. Exploit. 2022, 40, 724–748. [Google Scholar]
- Chen, T.; Guestrin, C. Xgboost: A scalable tree boosting system. In Proceedings of the 22nd ACM Sigkdd International Conference on Knowledge Discovery and Data Mining, San Francisco, CA, USA, 13–17 August 2016. [Google Scholar]
- Ovalle, C.; Ortiz, J.J.P.; Zarate, R.J.G. Hybrid Photovoltaic System Applying IoT–Machine Learning for Intelligent Management. Appl. Sci. 2026, 16, 6295. [Google Scholar] [CrossRef] [Scilit]
- Sebbagh, T.; Kelaiaia, R.; Kerboua, A.; Metatla, A.; Zaatri, A. Effect of environmental conditions and training algorithms on the efficiency of a narx based approach to predict pv panel power output. Int. J. Eng. Model. 2020, 33, 27–44. [Google Scholar] [CrossRef] [Scilit]
- Phan, Q.-T.; Wu, Y.-K.; Phan, Q.-D. Short-term solar power forecasting using xgboost with numerical weather prediction. In 2021 IEEE International Future Energy Electronics Conference (IFEEC); IEEE: Piscataway, NJ, USA, 2021. [Google Scholar]
- Yang, L.; Shami, A. On hyperparameter optimization of machine learning algorithms: Theory and practice. Neurocomputing 2020, 415, 295–316. [Google Scholar] [CrossRef] [Scilit]
- Elsinga, B.; van Sark, W.G. Short-term peer-to-peer solar forecasting in a network of photovoltaic systems. Appl. Energy 2017, 206, 1464–1483. [Google Scholar] [CrossRef] [Scilit]
- Li, H.; Liu, H.; Ji, H.; Zhang, S.; Li, P. Ultra-short-term load demand forecast model framework based on deep learning. Energies 2020, 13, 4900. [Google Scholar] [CrossRef] [Scilit]
- Wang, Z.; Wang, Y.; Srinivasan, R.S. A novel ensemble learning approach to support building energy use prediction. Energy Build. 2018, 159, 109–122. [Google Scholar] [CrossRef] [Scilit]
- Voyant, C.; Notton, G.; Kalogirou, S.; Nivet, M.-L.; Paoli, C.; Motte, F.; Fouilloy, A. Machine learning methods for solar radiation forecasting: A review. Renew. Energy 2017, 105, 569–582. [Google Scholar] [CrossRef] [Scilit]
- Radzi, P.N.L.M.; Mekhilef, S.; Shah, N.M.; Akhter, M.N.; Seyedmahmoudian, M.; Almalaq, Y.; Wahyudie, A. Enhancing short-term solar power forecasting using a hybrid deep learning approach and a comparative analysis of machine learning models. Energy Convers. Manag. X 2025, 29, 101431. [Google Scholar] [CrossRef] [Scilit]
- Ermiş, S.; Taşdemir, O. An Enhanced Hybrid TLBO–ANN Framework for Accurate Photovoltaic Power Prediction Under Varying Environmental Conditions. Appl. Sci. 2025, 16, 157. [Google Scholar] [CrossRef] [Scilit]
- Antonanzas, J.; Osorio, N.; Escobar, R.; Urraca, R.; Martinez-de-Pison, F.J.; Antonanzas-Torres, F. Review of photovoltaic power forecasting. Sol. Energy 2016, 136, 78–111. [Google Scholar] [CrossRef] [Scilit]
- Bentéjac, C.; Csörgő, A.; Martínez-Muñoz, G. A comparative analysis of XGBoost. arXiv 2019, arXiv:1911.01914. [Google Scholar]
- Natekin, A.; Knoll, A. Gradient boosting machines, a tutorial. Front. Neurorobotics 2013, 7, 63623. [Google Scholar] [CrossRef] [Scilit]
- Abdollahzadeh, B.; Gharehchopogh, F.S.; Mirjalili, S. African vultures optimization algorithm: A new nature-inspired metaheuristic algorithm for global optimization problems. Comput. Ind. Eng. 2021, 158, 107408. [Google Scholar] [CrossRef] [Scilit]
- Evrendilek, F.; Ertekin, C. Assessing solar radiation models using multiple variables over Turkey. Clim. Dyn. 2008, 31, 131–149. [Google Scholar]
- Kartal, V.; Karakoyun, E.; Bayrak, F.; Scholz, M. Climate change effects on solar energy potential: CMIP6-based projections and policy implications. Energy Strategy Rev. 2026, 63, 102063. [Google Scholar] [CrossRef] [Scilit]
- Turkish State Meteorological Service (TSMS). Forecast Cities Network Platform. 2026. Available online: https://www.mgm.gov.tr/eng/forecast-cities.aspx (accessed on 18 July 2026).

Disclaimer/Publisher’s Note: The statements, opinions and data contained in all publications are solely those of the individual author(s) and contributor(s) and not of MDPI and/or the editor(s). MDPI and/or the editor(s) disclaim responsibility for any injury to people or property resulting from any ideas, methods, instructions or products referred to in the content. |
© 2026 by the authors. Licensee MDPI, Basel, Switzerland. This article is an open access article distributed under the terms and conditions of the Creative Commons Attribution (CC BY) license.