


Abstract
High countermovement-jump (CMJ) height prediction may reflect mechanical reconstruction rather than independent neuromuscular information. This study separated mechanically proximal variables from mechanically restricted force-expression, movement-organization, and tensiomyography (TMG) predictors. Sixty-six elite youth football players completed force-platform CMJ and rectus femoris TMG assessments. Jump height was reconstructed from mean propulsion force and propulsion duration. After excluding these variables and direct mechanical equivalents, Ridge, Elastic Net, GAM, and random forest models were evaluated using repeated nested cross-validation, with predictor-set, ablation, and held-out permutation-importance analyses. The mechanical benchmark almost perfectly reconstructed jump height (RMSE = 0.0027 m; predictive R2 = 0.998). After mechanical restriction, random forests were the strongest prespecified single model family (RMSE = 0.0510 m; predictive R2 = 0.296), whereas the fully nested one-standard-error model-selection pipeline provided a more conservative estimate of generalization (RMSE = 0.0548 m; predictive R2 = 0.187). Within the retained predictor set, movement organization provided more information than force expression (predictive R2 = 0.214 vs. 0.078). The TMG-only prediction was worse than the mean-level benchmark (predictive R2 = −0.039), and adding TMG did not improve the CMJ base model. CMJ height is readily reconstructed from proximal propulsion mechanics. After their removal, movement organization retains modest predictive information, whereas single-muscle rectus femoris TMG did not provide useful standalone or incremental value in this cohort.
1. Introduction
The countermovement jump (CMJ) is widely used to assess lower-limb neuromuscular performance because it is brief, minimally fatiguing, and readily quantified using force platforms. Although jump height is the most familiar outcome, it represents the endpoint of a multistage movement involving unweighting, braking, transition, propulsion, flight, and landing, and recent landing-mechanics work further shows that lower-limb movement organization during landing is relevant for loading and injury-risk profiles [1]. Phase-specific force–time analysis can therefore provide information that is not apparent from jump height alone, including how force is developed, how the center of mass is lowered and redirected, and how the available movement time is organized. This distinction is practically important because two athletes with similar jump heights may produce substantially different force–time curves and may therefore rely on different mechanical solutions to achieve the same external outcome [2,3,4].
Nevertheless, predicting CMJ height poses a fundamental interpretive problem. During a force-platform assessment, take-off velocity is determined by net vertical impulse relative to body mass, and ballistic jump height is subsequently calculated from take-off velocity. Consequently, impulse, take-off velocity, flight time, momentum, and closely related power variables are not independent explanatory characteristics of jump height; they are direct or near-direct components of its calculation. Even after these explicit variables are removed, mechanical reconstruction may still be possible if their constituent components are retained. For example, when mean propulsion force is expressed relative to body weight, take-off velocity can be approximated from the product of net mean propulsion force and propulsion duration.
Thus, a model containing both mean propulsion force and propulsion duration may reproduce jump height primarily through the impulse–momentum relationship rather than identify more distal neuromuscular or movement-organization determinants.
This issue is relevant to previous data-driven work: a random-forest model incorporating force–time metrics explained approximately 93% of the variance in CMJ height, with relative mean and peak concentric power among the most influential predictors [5].
Separating mechanical reconstruction from mechanically restricted prediction is necessary because CMJ performance cannot be reduced to force magnitude alone. Vertical jumping is a coordinated multijoint action in which muscle activation, segmental sequencing, joint work, and energy transfer must be organized so that muscular work contributes effectively to center-of-mass velocity before take-off. Foundational biomechanical work demonstrated the importance of proximal-to-distal sequencing and the coordinated action of mono- and biarticular muscles, while stretch–shortening-cycle research has highlighted active-state development, muscle–tendon behavior, and the rapid transition from eccentric to concentric action [6,7,8]. More recent evidence similarly indicates that joint coordination and muscle–tendon interaction differ across jumping performance levels [9].
Countermovement depth and phase organization are particularly relevant because they influence the distance and time available for force application. Experimental manipulation has shown that a deeper countermovement can increase net vertical impulse and jump height, although additional depth does not uniformly improve performance and may increase execution time [10,11]. McHugh et al. described self-selected depth as a trade-off between lowering the center of mass sufficiently and executing the movement rapidly, while also identifying unweighting as an important component of CMJ neuromechanics [11]. Similarly, greater braking rate of force development or amortization force does not necessarily increase jump height because additional early concentric impulse may be offset by reduced force production later in the push-off [12]. Recent evidence further suggests that jump height is more closely related to how force impulse is distributed during push-off than to braking rate of force development in isolation [13]. These findings indicate that discrete force or timing variables should not be automatically interpreted as universally beneficial; their relevance depends on how they are integrated into the complete movement.
Substantial between-athlete variability in CMJ execution provides further reason to examine movement organization rather than only isolated mechanical peaks. Distinct downward-phase strategies have been identified among elite basketball players, including relatively stiff, deep-flexion, and hip-dominant patterns. Importantly, these clusters did not differ significantly in jump height, indicating that athletes may achieve comparable external performance through different kinematic solutions [14]. Force–time waveform analyses have also identified distinct unimodal and bimodal patterns associated with differences in kinetic and temporal characteristics, whereas clustering studies combining force-platform and kinematic variables suggest that movement profiles may contain information relevant to performance or injury risk [15,16,17]. Collectively, this literature supports the presence of interindividual movement variability, but it also cautions against equating the identification of strategy clusters with evidence that one strategy independently determines jump height.
A complementary question is whether isolated muscle contractile characteristics provide information beyond the force–time organization observed during the CMJ. Tensiomyography (TMG) quantifies the radial displacement of an electrically stimulated superficial muscle and provides temporal and spatial indicators, including contraction time, delay time, sustain time, relaxation time, and maximal displacement. These parameters have been proposed as non-invasive indicators of twitch speed, stiffness-related behavior, fatigue, and muscle phenotype [18]. However, TMG elicits a low-level, isolated, electrically evoked contraction, whereas maximal CMJ performance requires voluntary activation and coordinated contributions from multiple muscles and joints. This difference raises questions about the external validity of TMG for predicting maximal dynamic performance. Macgregor et al. noted that the low contraction level elicited by TMG may limit its applications in sport performance [18], while Gil et al. found that TMG variables were not predictive of jumping or sprinting performance in elite soccer players [19]. Similarly, CMJ variables, but not TMG parameters, discriminated between sprint- and endurance-oriented track cyclists in the study of Lewis et al. [20].
Despite the extensive CMJ literature, three related uncertainties remain. First, high prediction accuracy may be achieved by including variables that directly determine jump height or jointly reconstruct its mechanical calculation, making it difficult to distinguish between prediction and mathematical redundancy. Second, after such mechanically proximal variables are removed, it remains unclear how much out-of-sample information is retained in braking-force characteristics, countermovement depth, phase timing, and stiffness-related variables. Third, the incremental value of TMG-derived contractile properties beyond these force-platform characteristics has not been clearly established. Existing studies have mainly examined bivariate associations, between-group differences, phase-specific regressions, or predictive models containing highly proximal force, impulse, velocity, or power metrics. A rigorous evaluation therefore requires an explicit mechanical benchmark, a restricted predictor set that cannot directly reconstruct take-off velocity, comparison of linear and nonlinear model families, and performance estimation on observations not used for model or hyperparameter selection.
This methodological distinction is especially important in a relatively small, correlated biomechanical dataset. Random forests can represent nonlinearities and interactions, whereas generalized additive models can model smooth additive nonlinearities, and penalized linear models provide more stable additive benchmarks. However, model tuning and model-family selection must be separated from the final performance evaluation, as using the same cross-validation results for both purposes yields optimistic error estimates [21]. Moreover, conventional random-forest importance scores can be distorted when predictors are correlated [22]. Repeated nested cross-validation, paired out-of-fold model comparison, and held-out permutation procedures are therefore required to determine whether any apparent nonlinear or domain-specific contribution generalizes beyond the analyzed sample [21,22,23,24,25].
Accordingly, the primary aim of this study was to distinguish mechanical reconstruction from mechanically restricted prediction of CMJ height. First, a physics-based benchmark was used to quantify the extent to which jump height could be reconstructed from mean propulsion force and propulsion duration. Second, after excluding these variables and explicit mechanical equivalents of jump height, repeated nested cross-validation was used to compare the out-of-sample performance of random forest, Ridge regression, Elastic Net, and generalized additive models. Third, predictor-set, leave-one-domain-out, and held-out permutation-importance analyses were used to determine the relative and incremental contributions of restricted force-expression variables, movement-organization variables, and TMG-derived contractile properties.
It was hypothesized that: (1) the mechanical benchmark would reproduce substantially more variation in jump height than mechanically restricted prediction models; (2) after mechanically reconstructive variables were excluded, CMJ height would remain only modestly predictable from countermovement depth, phase timing, and braking-force characteristics; (3) movement-organization variables would provide greater out-of-sample information than TMG-derived variables; and (4) TMG would provide limited standalone and incremental predictive value beyond the force-platform predictor set. Any reproducible advantage of random forests over Ridge, Elastic Net, or generalized additive models was interpreted as evidence of a nonlinear or interaction-dependent predictive structure, rather than as proof of causality, discrete athlete strategies, or motor skill.
2. Materials and Methods
2.1. Study Design
This study used a cross-sectional observational design with predictive modeling and internal validation. The analysis was designed to separate two conceptually distinct questions. First, a physics-based benchmark quantified the extent to which countermovement jump (CMJ) height could be mechanically reconstructed from mean propulsion force and propulsion phase duration. Second, a mechanically restricted modeling framework examined whether movement-organization variables, braking-force characteristics, vertical stiffness, and tensiomyography-derived contractile properties retained reproducible out-of-sample information about jump height after mechanically proximal variables had been excluded. Each athlete contributed one matched set of CMJ force-platform variables and tensiomyography measurements. The athlete was therefore the unit of analysis, and repeated cross-validation predictions were not treated as independent observations. All predictor sets, model families, performance measures, and sensitivity analyses were specified before interpretation of the final results.
2.2. Participants
Sixty-six highly trained male elite youth football players volunteered for the study. Players were recruited from Radnički Niš and competed at the top level of national youth football. The sample was 18.1 ± 1.0 years of age, 180.0 ± 5.4 cm in stature, and 74.5 ± 7.3 kg in body mass. Their regular football exposure consisted of five organized training sessions and one competitive match each week. The highly trained/elite youth classification was based on participation in a structured club academy environment, regular exposure to organized training and competition, and competition at the highest national youth level. Eligibility criteria were current registration with the participating club, regular participation in football training and competition, previous experience with maximal jumping assessments, and medical clearance for unrestricted training. Players were excluded if they had current pain or injury limiting maximal jumping, a lower-limb injury during the preceding 3 months that materially restricted training, a known neurological or musculoskeletal disorder affecting performance, or incomplete paired CMJ and TMG data. The sample comprised all eligible athletes with complete paired measurements available during the testing period.
A priori sample-size planning was based on the primary incremental-value question: whether five rectus femoris TMG variables would explain additional variance beyond seven mechanically restricted CMJ predictors. Using Cohen’s f2 framework for hierarchical multiple regression, with alpha = 0.05, power = 0.80, an assumed CMJ base-model R2 = 0.20, and five added TMG predictors, a sample of 66 participants was sufficient to detect a large incremental TMG contribution corresponding to an R2 increase of approximately 0.16 or greater. Accordingly, the study was designed to identify practically substantial incremental TMG effects, whereas smaller incremental effects were interpreted cautiously. Predictive uncertainty in the final analytical sample was further quantified using repeated nested cross-validation and participant-level bootstrap confidence intervals. The study was conducted in accordance with the Declaration of Helsinki and was approved by the Faculty of Sport and Physical Education, University of Niš, Serbia (Decision No. 04-474/3; approval date: 28 March 2024). Written informed consent was obtained from players aged 18 years or older; for players younger than 18 years, written informed consent was obtained from a parent or legal guardian, and player assent was obtained before testing.
2.3. Testing Procedures and Standardization
Testing was conducted at the Faculty of Sport and Physical Education during the in-season phase of the competitive calendar. TMG and CMJ measurements were obtained during the same session. When conducted during the same visit, TMG was performed before the dynamic warm-up and CMJ assessment to minimize the potential acute effects of exercise on the electrically evoked muscle response. Participants were instructed to avoid strenuous lower-limb exercise and competitive match play for 48 h, maintain their usual diet and hydration, and avoid food and caffeine for 4 h before testing. All athletes were familiar with CMJ testing as part of their regular performance-monitoring program. The same experienced investigators performed all measurements. Before CMJ testing, athletes completed a standardized 5 min warm-up consisting of light running, dynamic lower-limb mobility exercises, body-weight squats, and progressively intensified submaximal CMJs. The warm-up was followed by 1 min of recovery before maximal trials. Athletes then performed two maximal CMJ trials with 1 min between trials, using a standardized arm position of hands on hips. Standardized verbal encouragement was provided. The best technically valid trial was retained for analysis according to the prespecified trial selection rule.
2.4. Tensiomyography Assessment
Tensiomyography was performed using a TMG-100 system (TMG-BMC d.o.o., Ljubljana, Slovenia). Although the original measurement protocol included several lower-limb muscles, the present analysis used the rectus femoris variables available in the analytical dataset. Participants lay supine in a relaxed position with the knee flexed. The measurement site was identified using visual inspection and palpation during a brief voluntary contraction, and the point of greatest radial muscle-belly displacement was marked for sensor placement. A GK40 displacement sensor (Panoptik, Ljubljana, Slovenia) was positioned perpendicular to the skin over the marked site, and two self-adhesive stimulation electrodes were placed proximally and distally to the sensor, approximately 55–60 mm apart. The dominant limb was tested, and the knee was maintained at approximately 30° of flexion throughout the assessment, using standardized support to ensure a relaxed and reproducible muscle length. A single 1 ms electrical stimulus was delivered, beginning at 25 mA and increasing in 10 mA increments until no further increase in radial displacement was observed. Consecutive stimuli were separated by 5 s to allow muscle relaxation and reduce potentiation. The twitch response with the largest technically valid radial displacement was retained, and the following parameters were extracted automatically from the displacement–time curve: maximal radial displacement (, mm), delay time (, ms), contraction time (, ms), sustain time (, ms), and half-relaxation time (, ms). These parameters were interpreted as indicators of isolated electrically evoked peripheral contractile behavior rather than direct measures of voluntary multijoint performance. TMG intraclass correlation coefficients were not calculated because the analytical dataset retained only the maximal technically valid rectus femoris twitch response per athlete, and the preceding stimulation responses represented a progressive intensity–response sequence rather than repeated independent trials under identical conditions. It would therefore have been inappropriate to treat the incremental stimulation responses as repeated trials for ICC estimation, because their purpose was to identify the maximal plateau response rather than to obtain exchangeable measurements at the same stimulation amplitude. This limitation was considered during interpretation, particularly for sustain time and half-relaxation time, which have been reported to be less stable than maximal displacement and contraction time in previous TMG reliability work [18,20].
2.5. Countermovement Jump Assessment
CMJs were performed on a Kistler Quattro Jump force plate (Kistler Instrumente AG, Winterthur, Switzerland). Force-plate data were processed using a custom R script. The vertical ground-reaction force signal was sampled at 500 Hz and analyzed without additional digital filtering in the processing script. Body weight was calculated as the mean vertical force over the first 200 samples of quiet standing:
and body mass was obtained by dividing body weight by gravitational acceleration:
Movement onset was identified as the first force deviation exceeding five quiet-standing standard deviations, either above the quiet-standing maximum force or below the quiet-standing mean force:
The integration window began 200 ms before movement onset. Net vertical force was calculated by subtracting body weight from the total vertical force:
Center-of-mass acceleration was then calculated as net force divided by body mass:
Acceleration and velocity were numerically integrated using the trapezoidal rule to obtain center-of-mass velocity and displacement, respectively:
Take-off was identified as the first sample at which vertical force fell below 30 N while center-of-mass velocity was non-negative:
The force–time curve was divided into unloading, yielding, braking, and propulsion phases, following recommended CMJ force–time terminology [2]. Unloading ended at minimum vertical force, yielding ended at maximum downward center-of-mass velocity, braking ended when center-of-mass velocity returned to zero at the lowest center-of-mass position, and propulsion extended from this point to take-off. The jump height was calculated from the take-off velocity:
The mechanically restricted CMJ predictor set included countermovement depth, unloading time, yielding time, braking time, peak braking force normalized to body weight, braking rate of force development from 0 to 100 ms expressed in body weights per second (BW s−1), and vertical stiffness. Countermovement depth was calculated as the minimum vertical center-of-mass displacement before the end of braking:
Peak braking force normalized to body weight was calculated as
Braking rate of force development from 0 to 100 ms was calculated as
Vertical stiffness was calculated as
Vertical stiffness was expressed in kN m−1 as
Countermovement depth was defined as the minimum vertical center-of-mass displacement before the end of braking, with more negative values indicating a deeper countermovement. Units were standardized throughout the manuscript as follows: relative force variables were normalized to body weight (BW), RFD was expressed as BW s−1, temporal CMJ variables were expressed in seconds (s), CMJ displacement was expressed in meters (m), vertical stiffness was expressed as kN m−1, TMG temporal variables were expressed in milliseconds (ms), and maximal radial displacement was expressed in millimeters (mm).
Within-session reliability was calculated from the repeated CMJ trials before trial selection. Agreement ranged from 0.44 to 0.93 across the retained CMJ variables, with CV values ranging from 4.1% to 17.5%. Jump height showed high agreement (ICC = 0.93; CV = 4.33%), whereas some temporal variables showed lower consistency and were interpreted cautiously. Reliability was not used as a hard predictor-deletion rule because the mechanically restricted predictor set was defined a priori to represent movement organization and braking-force expression. Applying a post hoc reliability threshold such as ICC ≥ 0.75 would have changed the construct representation of the model and could have removed variables that were central to the study question. Instead, reliability was used to qualify interpretation, and the retained CMJ variables are summarized together with their held-out permutation-importance values in Supplementary Table S1.
2.6. Mechanical Reconstruction Benchmark and Predictor Domains
A non-fitted mechanical benchmark was calculated to quantify how closely mean propulsion force and propulsion duration reconstructed take-off velocity and jump height. Mean propulsion force was expressed relative to body weight, and reconstructed take-off velocity was calculated as follows:
In this equation, reconstructed take-off velocity is estimated from gravitational acceleration, mean total vertical force during propulsion normalized to body weight, and propulsion-phase duration. Reconstructed jump height was then calculated as follows:
Because this benchmark contained no fitted parameters, it was evaluated directly rather than through cross-validation and was used only as a mechanical audit of the outcome information embedded in proximal force–time components. Mean propulsion force and propulsion duration were excluded from all primary predictive models, as were take-off velocity, flight time, impulse, momentum, power, modified reactive strength index, and other variables that directly or nearly directly incorporated jump height.
The 12 retained predictors were assigned a priori to three domains. The movement-organization domain comprised countermovement depth, unweighting duration, yielding time, and braking time. The force-expression domain comprised peak braking force, braking rate of force development from 0 to 100 ms, and vertical stiffness. The isolated-contractile-properties domain comprised rectus femoris contraction time, half-relaxation time, delay time, sustain time, and maximal radial displacement.
The primary mechanically restricted CMJ model included movement-organization and force-expression variables, whereas the TMG-added model added all five rectus femoris TMG variables to this CMJ base set. Prespecified secondary predictor-set analyses evaluated movement organization only, force expression only, TMG only, the complete mechanically restricted model, and sensitivity models excluding vertical stiffness or removing each domain from the full restricted predictor set.
2.7. Statistical Analyses
The full R analysis script used for data preprocessing, mechanical auditing, nested cross-validation, predictor-set comparisons, held-out permutation-importance analysis, and figure generation was uploaded as Supplementary File S1. The script contains the prespecified retained predictor sets, mechanical-audit variables, mechanically proximal or outcome-derived variables excluded from the primary predictive models, and the corresponding exclusion rules. The preprocessing and modeling workflow is summarized in Supplementary Table S2. Before modeling, all prespecified numeric variables were coerced to numeric format and checked for missing values, non-finite values, duplicate participant identifiers, and zero-variance predictors. The athlete was the unit of analysis, and only one complete matched CMJ–TMG record per athlete was retained. Complete-case analysis was used; no imputation was performed. Predictor eligibility was determined a priori rather than through outcome-driven screening. Variables that directly determined or nearly reconstructed jump height, including mean propulsion force, propulsion duration, take-off velocity, flight time, impulse, momentum, power, modified reactive strength index, and other variables incorporating jump height, were excluded from the primary predictive models.
No reliability-based predictor filtering was applied in the primary analysis. The retained CMJ variables were prespecified construct indicators, and reliability estimates were used for interpretation and sensitivity reporting rather than for post hoc feature deletion. A reliability-impact summary reporting average-measure ICC, CV, typical error, held-out permutation importance, and rank stability for the retained CMJ variables was uploaded as Supplementary Table S1.
A mechanical benchmark reconstructed jump height from mean propulsion force and propulsion duration, whereas the primary mechanically restricted prediction analysis excluded these mechanically proximal variables and their direct mechanical equivalents. Null models, Ridge regression, Elastic Net, generalized additive models (GAMs), and random forests were compared using repeated, nested five-fold cross-validation with 10 repetitions. GAMs were included as a conservative additive nonlinear benchmark rather than as high-flexibility surface models. To limit overfitting in relation to the sample size, each predictor was modeled using a shrinkage smooth term, smoothing parameters were estimated by restricted maximum likelihood, and term selection was enabled. The smoothing penalty was tuned within the inner cross-validation loop using values of 1.0 and 1.4. The basis dimension was also restricted within each training sample according to the number of observations and predictors, with an upper limit of five basis functions per smooth. Predictor standardization and all hyperparameter tuning were performed within the inner training folds, while outer folds were used only to estimate generalization performance. Model families were selected using a one-standard-error rule, favoring the simplest competitive model. Performance was evaluated using root mean square error (RMSE), mean absolute error (MAE), predictive R2, squared correlation, bias, and calibration. The 10 out-of-fold predictions for each athlete were averaged to obtain one prediction per participant, and 95% confidence intervals were estimated using 3000 participant-level bootstrap samples. Paired participant-level bootstrap comparisons were used to evaluate differences between models and predictor sets. For predictor-set analyses, the model family selected from the CMJ base set within each outer split was held constant across the corresponding predictor sets, with hyperparameters tuned separately within each outer training sample. Individual predictors and domains were evaluated using permutation importance calculated only in held-out test folds. To assess the stability of these importance values across cross-validation resamples, fold-level sums of squared error were aggregated within each complete outer-CV repetition so that each athlete contributed once per repetition. Permutation importance was then summarized within each repetition and finally expressed as the mean, standard deviation, range, positive-in-repeats count, and rank stability across the repeated outer-CV procedure. Thus, the held-out permutation-importance values represent held-out importance averaged across repeated outer-CV estimates rather than importance from a single fitted model. Final full-data models were fitted solely for exploratory interpretation and were not used to estimate predictive performance. Conclusions emphasized out-of-sample performance, uncertainty intervals, and stability rather than dichotomous significance testing.
3. Results
All 66 players had complete data for jump height and the 12 predictors included in the mechanically restricted analysis. Mean jump height was 0.358 m (SD = 0.061), with individual values ranging from 0.249 to 0.519 m. Descriptive statistics for the CMJ movement-organization variables, force-expression variables, and rectus femoris TMG parameters are presented in Table 1.
Table 1.
Descriptive characteristics of the complete-case cohort.
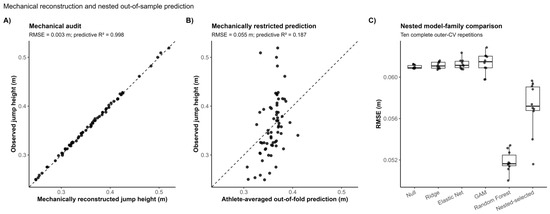
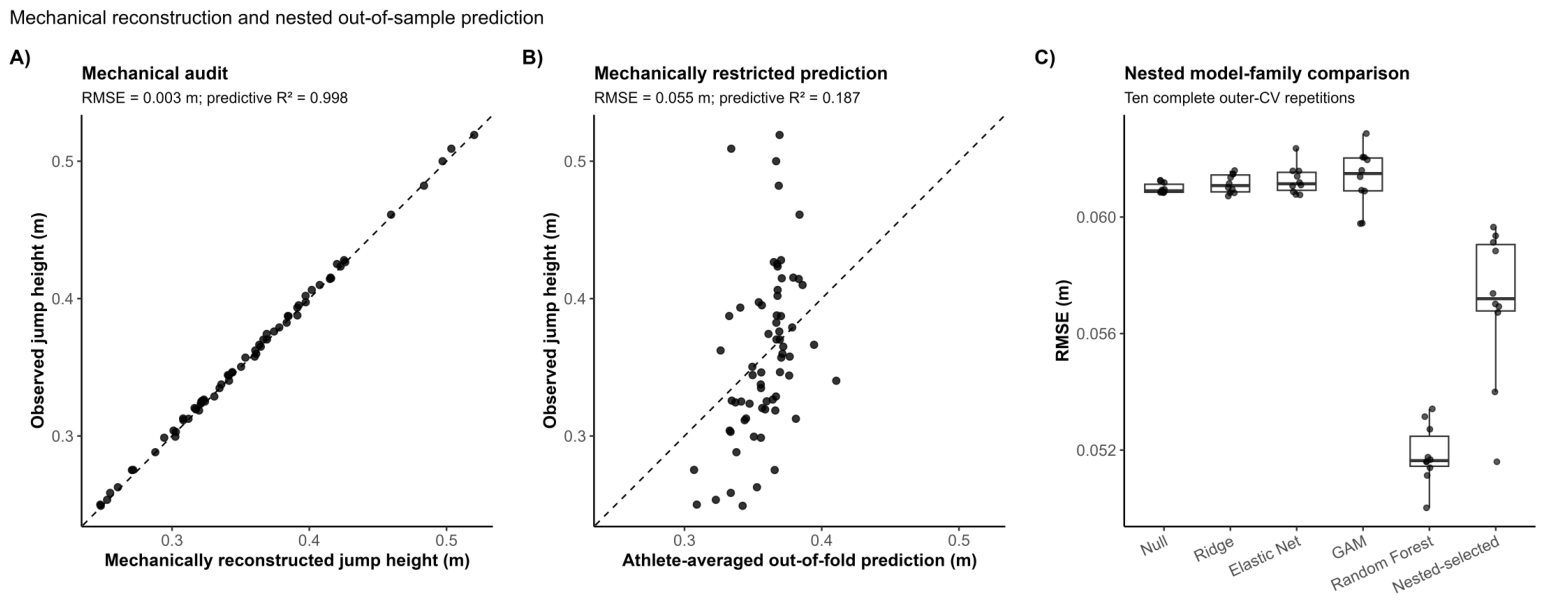
The mechanical audit showed that jump height was almost perfectly reconstructed from mean propulsion force and propulsion duration. The non-fitted reconstruction yielded RMSE = 0.0027 m, MAE = 0.0023 m, predictive R2 = 0.998, and mean bias = −0.0017 m, indicating that reconstructed values were typically within approximately 2–3 mm of the observed outcome (Figure 1A). This result confirmed that these mechanically proximal variables retained essentially the same propulsion-impulse information used to derive take-off velocity and jump height. Therefore, they were used solely for mechanical auditing and excluded from subsequent prediction models.
Figure 1.
Mechanical reconstruction and out-of-sample model performance. (A) Agreement between observed jump height and the non-fitted mechanical reconstruction based on mean propulsion force and propulsion duration. (B) Athlete-averaged out-of-fold predictions from the fully nested model-selection pipeline. (C) Comparison of model-family performance across repeated outer cross-validation splits. RMSE = root mean square error; GAM = generalized additive model.
After mechanically removing proximal variables, out-of-sample prediction was substantially weaker. Two complementary performance estimates were considered. First, in the fixed model-family comparison, random forest was the strongest prespecified single model family, with athlete-averaged out-of-fold RMSE = 0.051 m, MAE = 0.040 m, and predictive R2 = 0.296. This estimate answers the question of how well RF generalized when the model family was fixed in advance and tuned within the training data. Ridge, Elastic Net, and GAM showed little or no useful predictive performance, with predictive R2 values close to zero or negative. Random forest also produced the lowest RMSE across the repeated outer cross-validation splits (Figure 1C). Second, the fully nested one-standard-error model-selection procedure estimated the performance of the complete data-adaptive modeling pipeline, including model-family selection uncertainty. Although random forest had the lowest inner-CV error in most outer splits, the one-standard-error rule selected simpler models in a substantial proportion of splits. Consequently, the nested-selected pipeline produced RMSE = 0.055 m, MAE = 0.043 m, and predictive R2 = 0.187 (Figure 1B). Thus, RF was the strongest single model family in this dataset, whereas the nested-selected result provides the more conservative estimate of expected generalization when model-family selection is part of the analysis.
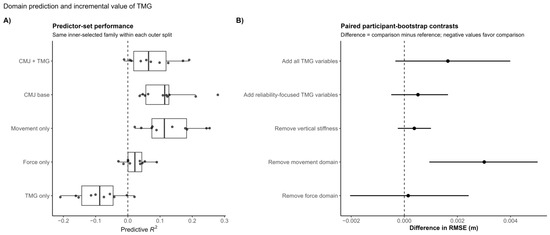
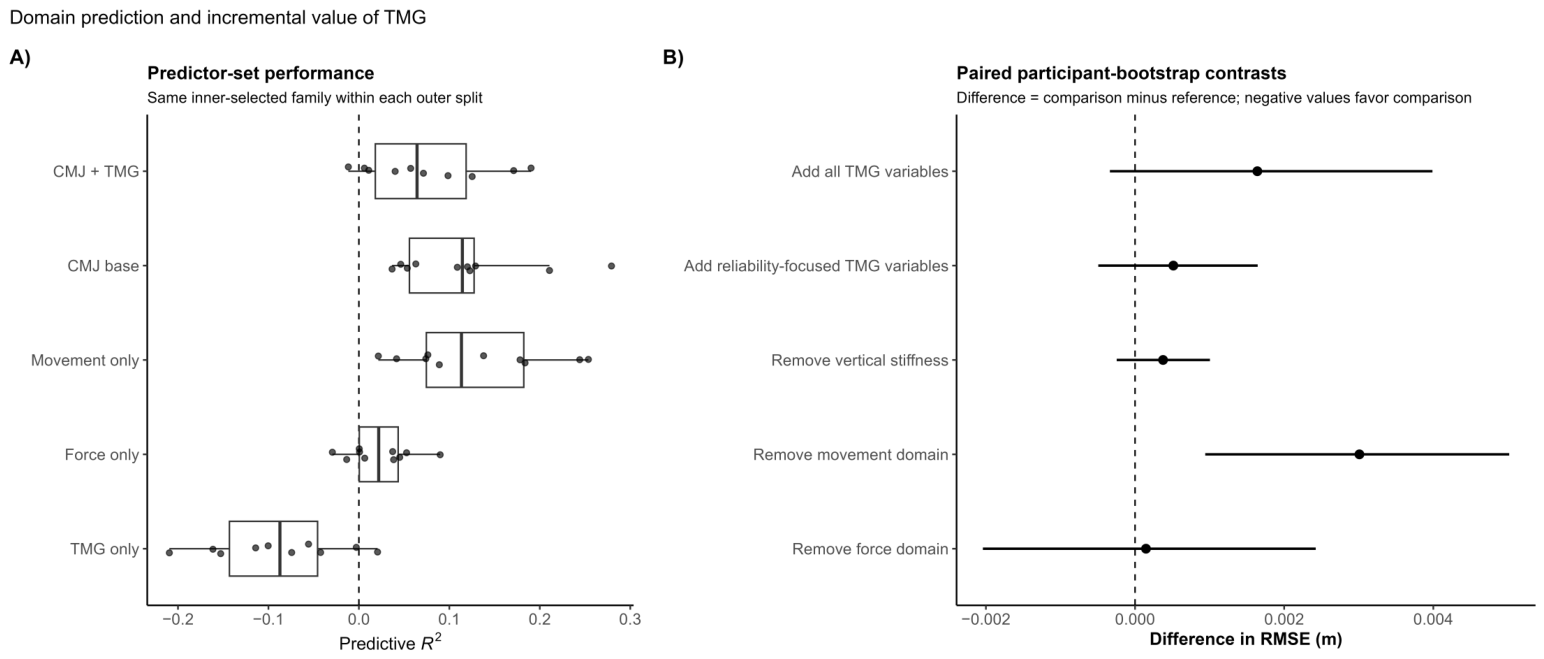
Predictor-set analyses showed that movement-organization variables carried the strongest information about mechanically restricted jump-height differences. The movement-only model achieved RMSE = 0.054 m and predictive R2 = 0.214, whereas the force-only model achieved RMSE = 0.058 m and predictive R2 = 0.078. The CMJ base model, which combined movement-organization and force-expression variables, achieved RMSE = 0.055 m and predictive R2 = 0.187. Removing the movement domain from the integrated model worsened performance, whereas removing the force-expression domain produced little change (Figure 2A,B). Thus, among the retained CMJ variables, countermovement depth and temporal organization of the downward movement were more informative than the restricted braking-force descriptors. This should not be interpreted as evidence that force capacity is unimportant, because the force-expression domain did not include direct measures of maximal strength, propulsion impulse, joint work, or voluntary force-generating capacity.
Figure 2.
Predictor set and incremental value analyses. (A) Out-of-sample performance of the prespecified predictor sets. (B) Paired participant-level bootstrap contrasts for domain ablation and TMG-added comparisons. CMJ = countermovement jump; TMG = tensiomyography; RMSE = root mean square error.
Single-muscle rectus femoris TMG variables provided no useful standalone or incremental prediction. The TMG-only model performed worse than mean-level prediction, with RMSE = 0.062 m, MAE = 0.049 m, and predictive R2 = −0.039. Adding all rectus femoris TMG variables to the CMJ base model did not improve performance; instead, the CMJ + TMG model showed RMSE = 0.056 m, MAE = 0.045 m, and predictive R2 = 0.138. The paired bootstrap contrast indicated a small deterioration when all TMG variables were added to the CMJ base, particularly for MAE, while the reliability-focused TMG subset was essentially neutral (Figure 2B). Therefore, within this single-muscle rectus femoris protocol, TMG did not provide complementary information about between-athlete differences in maximal CMJ height beyond mechanically restricted CMJ variables.
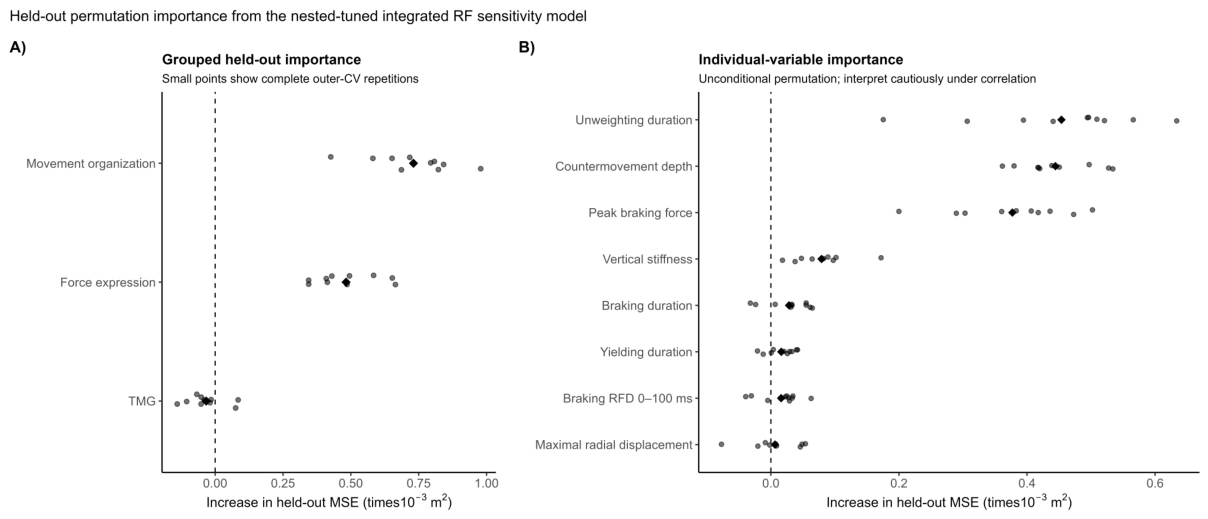
Held-out permutation importance from the nested-tuned integrated random forest sensitivity model converged with the predictor-set results. Importance values were calculated within held-out folds, aggregated within each complete outer-CV repetition, and then summarized across repetitions to assess stability. At the grouped level, movement organization showed the largest mean increase in held-out test error when permuted, with a change in MSE of 0.731 × 10⁻³ m2, followed by force expression, with a change in MSE of 0.482 × 10⁻³ m2. In contrast, permuting the TMG domain slightly reduced test error, with a change in MSE of −0.033 × 10⁻³ m2, indicating that TMG variation did not provide useful held-out information in the integrated model (Figure 3A). At the individual-variable level, unweighting duration, countermovement depth, and peak braking force formed the most stable leading predictors, with mean changes in MSE of 0.454 × 10⁻³ m2, 0.444 × 10⁻³ m2, and 0.377 × 10⁻³ m2, respectively (Figure 3B). The dispersion of the repeat-level points in Figure 3 shows the stability of the importance values across the repeated outer-CV procedure. Vertical stiffness, braking duration, yielding duration, and braking RFD showed smaller or less stable contributions, whereas TMG variables were close to zero or negative.
Figure 3.
Held-out permutation importance from the nested-tuned integrated random-forest sensitivity model. (A) Domain-level importance. (B) Individual-variable importance. Small circular points represent complete outer-CV repetition-level estimates, large diamond markers represent the mean across repetitions, and the vertical dashed reference line indicates zero change in held-out MSE after permutation. Positive values indicate increased held-out MSE after permutation, whereas values near or below zero indicate little or no positive predictive contribution in the held-out data. TMG = tensiomyography; RFD = rate of force development; MSE = mean squared error.
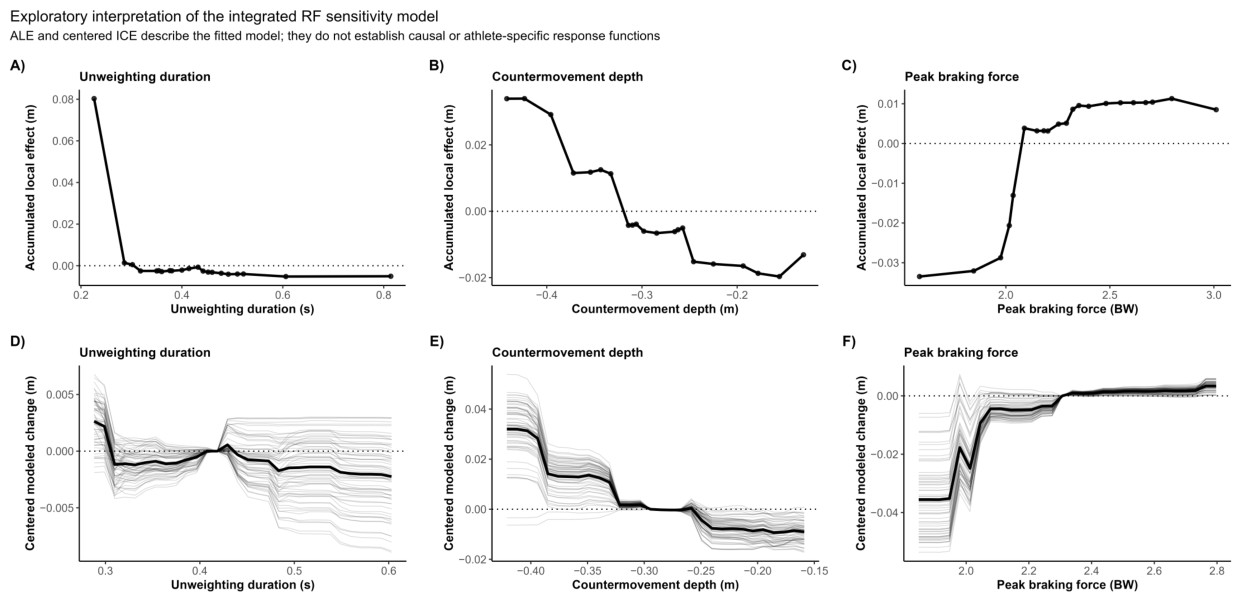
Exploratory ALE and centered ICE plots described the fitted behavior of the integrated random forest sensitivity model (Figure 4). The ALE functions described nonlinear model-fitted association patterns for unweighting duration, countermovement depth, and peak braking force. In the fitted model, unweighting duration had its largest modeled contribution at the shortest observed durations, with little additional modeled gain across most of the remaining range. Countermovement depth showed a graded model-fitted pattern in which deeper countermovements were generally associated with higher predicted jump height, although this pattern was not linear across the full observed range. Peak braking force showed a threshold-like model-fitted pattern, with lower predicted values at the lowest braking-force values and a plateau across moderate-to-high values. The centered ICE plots indicated heterogeneity in these model-fitted association patterns across observations, but these curves should be interpreted only as descriptions of the fitted prediction function rather than as causal effects or athlete-specific response functions.
Figure 4.
Exploratory ALE and centered ICE plots for the top-ranked variables from the integrated random-forest sensitivity model. (A–C) Accumulated local effects. (D–F) Centered individual conditional expectation curves. These plots describe the fitted model and should not be interpreted as causal effects. ALE = accumulated local effects; ICE = individual conditional expectation.
4. Discussion
This study aimed to distinguish mechanical reconstruction from mechanically restricted prediction of countermovement-jump height and, after removing mechanically proximal variables, to determine the relative contributions of movement organization, restricted braking-force expression, and rectus femoris TMG-derived contractile properties. Four principal findings emerged. Mean propulsion force and propulsion duration almost perfectly reconstructed jump height, confirming that these variables jointly retain the information required to recover take-off velocity. After these variables were excluded, prediction was substantially weaker: random forests were the strongest single model family, but the conservative nested selection pipeline showed only modest out-of-sample performance. Movement-organization variables provided more useful information than the restricted force-expression domain, whereas single-muscle rectus femoris TMG offered neither standalone nor incremental predictive value. Finally, unweighting duration, countermovement depth, and peak braking force were the most stable retained predictors, but exploratory model-interpretation analyses did not support causal effects or clearly separated athlete strategy profiles. Thus, the findings support the central premise that high CMJ-height prediction can reflect mechanical reconstruction rather than independent neuromuscular explanation.
The near-perfect mechanical benchmark is arguably the most important result because it clarifies what a highly accurate model of jump height may actually represent. Mean propulsion force multiplied by propulsion duration approximates net propulsion impulse; impulse determines the change in vertical velocity, and jump height is subsequently calculated from take-off velocity. Therefore, a model that includes both the magnitude of the force and the duration over which it acts is not necessarily discovering an independent neuromuscular determinant—it may simply be reconstructing the outcome through the impulse–momentum relationship. This distinction is often obscured in CMJ research because jump height, impulse, take-off velocity, power, momentum, and flight time are frequently analyzed together as though they were independent characteristics. Yet several are algebraically or mechanically coupled. Recent reviews have likewise emphasized that the selected jump-height equation determines the meaning of the outcome and that different force-platform calculations can produce materially different estimates from the same jump [2,4].
This point also changes how previous high-performing prediction models should be interpreted. Merrigan et al. [5], for example, reported that random-forest models explained approximately 93% of the variance in CMJ height, with relative mean and peak concentric power among the most influential variables. Such performance is impressive as prediction, but power incorporates velocity and force and is therefore mechanically close to jump height. The present findings demonstrate empirically that even after explicit impulse and take-off velocity variables are removed, their components may preserve almost complete reconstructive information. Accordingly, high explained variance should not automatically be treated as evidence that a model has identified new biological mechanisms. Prediction accuracy and explanatory novelty are different properties of an analysis.
Once mechanically reconstructive variables were removed, the reduction in predictive performance was substantial. The fixed random forest represented the strongest prespecified single model family, whereas the nested-selected pipeline represented the more conservative estimate of the full model-selection workflow. These estimates should not be interpreted as competing versions of the same result. The RF estimate reflects expected generalization when RF is chosen a priori as the model family, while the nested-selected estimate incorporates the uncertainty and instability associated with selecting the model family inside the training data. The gap between predictive R2 = 0.296 for fixed RF and predictive R2 = 0.187 for the nested-selected pipeline therefore reinforces the need for cautious interpretation in this modest sample. However, even for the strongest model family, the predictive R2 remained modest and the absolute prediction error remained large relative to the between-athlete SD of jump height, with predictions compressed toward the sample mean. This is an important limitation for applied use: the mechanically restricted models should not be interpreted as accurate individual prediction tools or used for athlete ranking, selection, or athlete-specific training prescription. Rather, their value lies in showing how much prediction remains after mechanical reconstruction has been removed. The modest performance indicates that much of the apparent predictability of jump height resides in the immediate mechanics of impulse generation. What remained was a more difficult and theoretically informative question: whether less mechanically proximal CMJ descriptors contained sufficient information to anticipate the eventual mechanical outcome. The better generalization of random forest compared with Ridge, Elastic Net, and GAM is consistent with predictive structure not captured by the tested penalized linear or additive smooth models in this sample, but it does not by itself establish a specific biological nonlinearity. However, the poor GAM performance should not be interpreted as evidence that smooth nonlinear associations were absent. Given the modest sample size, the number of candidate predictors, and the need to restrict the number of basis functions, the GAM was necessarily conservative. Its weak out-of-sample performance may therefore reflect limited sample size, additive-model constraints, measurement noise, or conservative smoothing choices, rather than the absence of nonlinear structure.
The unmeasured portion of performance is also biomechanically plausible. Vertical jumping is not governed by a small number of force-plate scalars alone. It requires the timed activation of multiple muscles, proximal-to-distal segmental sequencing, interjoint energy transfer, appropriate muscle operating lengths and velocities, and coordinated muscle–tendon interaction. Bobbert and van Ingen Schenau [6] demonstrated that effective vertical jumping depends on an ordered sequence of muscle activation and segmental velocity, with biarticular muscles transferring energy from proximal to distal joints so that muscular work is used effectively before take-off. More recent work similarly indicates that better jumpers may exploit joint coordination and muscle–tendon interaction more effectively rather than merely producing a larger isolated force [9]. These mechanisms were not directly measured in the present study and are likely to account for part of the unexplained variance [6,9,26].
The superiority of the movement-organization model is theoretically meaningful because CMJ depth, unweighting duration, yielding duration, and braking duration describe how the athlete creates and controls the countermovement before propulsion begins. Among the retained predictors, unweighting duration and countermovement depth were the leading movement-organization variables, whereas peak braking force was the most informative force-expression variable. This suggests that part of the remaining predictive information was contained not in isolated force magnitude, but in how athletes organized the downward movement before push-off. Vertical jumping requires coordinated displacement, velocity, force production, segmental sequencing, and muscle–tendon interaction; therefore, after mechanically reconstructive propulsion variables are removed, it is plausible that the strongest remaining signal comes from variables describing how the countermovement is organized [6,9,26].
This domain-level interpretation is necessarily conditional on the variables selected to represent each construct. In the present analysis, movement organization was represented by countermovement depth and phase-timing variables, whereas contractile properties were represented only by rectus femoris TMG parameters. Other indicators of contractile or neuromuscular capacity, such as maximal strength, eccentric strength, rate of voluntary force development, muscle activation, muscle architecture, tendon stiffness, or multi-muscle TMG profiles, were not included. Therefore, the finding that movement organization was more informative than TMG should be interpreted as a comparison between the specific retained predictor sets, not as evidence that movement organization is universally more important than contractile or neuromuscular properties for CMJ performance.
Countermovement depth and unweighting duration should be interpreted as components of a depth–time solution rather than as independent technical prescriptions. A deeper countermovement can increase the displacement and time available for impulse generation, but it may also lengthen execution time and alter muscle operating conditions. Conversely, an excessively shallow countermovement may restrict impulse generation and disrupt the normal neuromechanical preparation for propulsion. Unweighting is also not merely passive descent; it is an actively regulated reduction in vertical force that establishes the downward velocity and mechanical demands entering the yielding and braking phases. Thus, the practical problem is not to maximize depth or prolong unweighting, but to organize an effective displacement–time solution within the athlete’s force-generating and coordinative constraints [7,10,11].
Peak braking force was the leading contributor to force expression, whereas braking RFD provided comparatively little unique information. This does not mean that braking RFD is unimportant; rather, its relevance appears outcome- and strategy dependent. During braking, the athlete must arrest downward center-of-mass momentum and establish favorable conditions for reversal, but producing force more rapidly does not necessarily guarantee a larger total impulse or greater take-off velocity. Braking characteristics may therefore act as enabling components of the overall force–time organization rather than isolated performance targets [12,13,27].
The exploratory ALE and c-ICE results should be interpreted as descriptions of model-fitted association patterns. In the integrated random forest, predicted CMJ height varied nonlinearly across the observed ranges of unweighting duration, countermovement depth, and peak braking force, and the centered ICE curves indicated that these fitted patterns were not identical across observations. These patterns are compatible with the idea that athletes occupied a continuum of movement solutions rather than clearly separated strategy profiles. However, ALE and c-ICE describe the fitted prediction function; they do not provide causal evidence, biological proof of nonlinear mechanisms, or reproducible athlete-specific response functions. This interpretation is consistent with previous work showing that CMJ waveform or strategy classifications are sensitive to the measurement and classification approach and do not always correspond to jump-height differences [14,15,16].
The present findings support the description of CMJ height as a strategy-dependent expression of neuromuscular capacity, but they do not establish that CMJ execution is a motor skill in the learning-theory sense. Demonstrating skill would require evidence of practice-related optimization, retention, transfer, reduced variability, or improved control policy, none of which can be inferred from a single cross-sectional assessment. Therefore, “movement organization” is the more defensible interpretation: the data show that how athletes organized displacement, time, and force contained information about performance, but not that these organization patterns were learned, stable, or directly modifiable through technical practice [28].
The absence of useful prediction from the rectus femoris TMG variables was equally clear, but this finding should be interpreted in light of the reliability characteristics of TMG parameters. TMG variables performed worse than the mean-level benchmark when considered alone, produced no positive incremental value when added to force-platform variables, and showed importance estimates near or below zero. Study-specific TMG ICCs could not be calculated because the retained response was selected from an incremental stimulation sequence rather than from repeated independent trials at the same stimulation intensity. Previous reliability work suggests that maximal radial displacement and contraction time are generally the most stable TMG parameters, whereas half-relaxation time and some other temporal variables show greater variability [18]. Similarly, Lewis et al. [20] reported high rectus femoris TMG ICCs in track cyclists but also noted that most TMG variables showed unacceptable coefficients of variation and that TMG variables did not discriminate sprint- from endurance-oriented cyclists, whereas CMJ variables did. Thus, measurement variability may have attenuated the predictive value of some TMG variables, particularly sustain time and half-relaxation time. However, the reliability-focused TMG sensitivity set, which emphasized the more stable parameters (, , and ), also did not improve prediction. Therefore, the present findings are best interpreted as showing no useful observed predictive contribution of single-muscle rectus femoris TMG within this protocol, rather than as proving that local contractile properties are biologically irrelevant to jumping performance.
This result is also mechanistically plausible because TMG measures the radial response of an isolated, electrically stimulated superficial muscle at a low contraction level, whereas a maximal CMJ requires voluntary neural drive, intermuscular coordination, multijoint work, balance, and rapid energy transfer. Macgregor et al. [18] acknowledged that the low contraction level elicited by TMG raises questions about external validity in specialist athletic populations. Gil et al. [19] likewise found no meaningful association between TMG parameters and power-dependent jumping or sprinting tasks in elite soccer players and proposed that the absence of coordination and motor-control information within TMG explains this disconnect. Lewis et al. [20] similarly reported that CMJ variables, but not TMG parameters, differentiated sprint- and endurance-oriented track cyclists [18,19,20].
The present result should not be interpreted as evidence that TMG is universally uninformative. TMG may remain useful for characterizing local contractile behavior, monitoring fatigue or recovery, examining asymmetry, or tracking within-muscle changes over time. The current conclusion is narrower: in this sample of highly trained youth football players, single-muscle rectus femoris TMG parameters did not provide useful standalone prediction and did not improve out-of-sample prediction of between-athlete differences in maximal CMJ height beyond the selected force-platform descriptors. Because the present analysis did not include TMG profiles from other relevant lower-limb muscles, this finding should not be generalized to multi-muscle TMG assessment or to muscles that may contribute differently to hip, knee, or ankle extensor coordination during the CMJ. In this context, TMG appeared to add noise or unnecessary model complexity rather than complementary information about maximal whole-body jumping performance.
From an applied perspective, the findings provide a practical framework for variable selection in sports performance monitoring protocols. Jump height, take-off velocity, impulse, mean propulsion force, propulsion duration, and power should not be interpreted as independent neuromuscular qualities when reported together, because they are mechanically coupled. These variables are useful for summarizing performance and verifying the mechanical basis of the jump, but they should not all be treated as separate explanatory predictors of jump height. When the goal is to understand how performance was achieved rather than simply quantify the outcome, monitoring protocols should prioritize variables that describe movement organization and the force–time solution, such as countermovement depth, unweighting duration, phase timing, peak braking force, and force–time waveform characteristics. The present findings do not support adding single-muscle rectus femoris TMG variables to a CMJ monitoring protocol for the purpose of improving between-athlete prediction of jump height, although TMG may still be useful for other purposes such as local muscle-status monitoring, fatigue, recovery, or asymmetry assessment. Importantly, variable importance is not a training prescription: the prominence of depth does not mean that every player should be coached to jump from a deeper position, and the relevance of peak braking force does not mean that braking RFD should be maximized. Repeated within-athlete monitoring, reliability-aware variable selection, and experimentally verified individual responses are more defensible than universal thresholds.
Several strengths increase confidence in the principal interpretation. The study explicitly separated a non-fitted mechanical benchmark from the restricted prediction problem, preventing mechanically reconstructive variables from dominating the mechanically restricted prediction model. Linear and nonlinear model families were compared using out-of-sample predictions, and the domain conclusions were examined using both domain-only and leave-one-domain-out analyses. Held-out permutation importance also reduced the risk of interpreting apparent full-sample fit as generalizable information. Finally, convergence across model performance, domain ablation, and held-out importance strengthens the conclusion that movement organization contained useful information, whereas single-muscle rectus femoris TMG did not add useful predictive information in the present protocol.
The limitations should nevertheless shape the strength of inference. The sample was modest and consisted exclusively of young male elite football players from a single club environment, limiting external generalizability and leading to wide uncertainty around the predictive R2. The results may therefore not transfer directly to female athletes, senior professionals, younger or less mature players, athletes from other clubs or training systems, or sports with different jumping demands. Although the fixed random forest outperformed the alternative model families, the predictive R2 values remained modest after mechanically related variables were removed, and prediction error remained large relative to the observed between-athlete variation in jump height. Measurement reliability should also be considered when interpreting the mechanically restricted models. Some retained CMJ variables, particularly temporal variables, showed lower within-session reliability. Lower predictor reliability can attenuate predictive associations and reduce out-of-sample performance, meaning that the modest predictive R2 may partly reflect measurement noise. However, this limitation would be expected to make the predictive estimates more conservative rather than inflate the apparent contribution of these variables. Therefore, variables with lower reliability should not be used as precise athlete-level diagnostic markers without repeated-trial confirmation, even if they contributed to the model-level prediction pattern.
Therefore, the models should not be interpreted as sufficiently accurate for individual diagnosis, selection, or athlete-specific training prescription. The cross-sectional design precluded causal or learning-related conclusions, and no independent external cohort was available for validation. Although repeated nested cross-validation provides an internally valid estimate of out-of-sample performance within the present dataset, it does not establish transportability of the selected models to athletes from other clubs, age groups, sexes, competitive levels, sports, testing devices, or data-processing pipelines. Therefore, the proposed models should be considered internally validated and hypothesis-generating until their performance is confirmed in an independent cohort. Only discrete force-platform metrics were modeled; three-dimensional kinematics, joint moments and work, electromyography, muscle architecture, tendon behavior, maximal strength, and anthropometric leverage were not measured. Including these variables would provide a more direct test of how physical capacity is transformed into whole-body performance.
The domain-level comparisons were also limited by the variables selected to represent each construct. Movement organization was represented by countermovement depth and phase-timing variables, whereas contractile properties were represented by a small set of TMG parameters from a single isolated superficial muscle, the rectus femoris. Study-specific TMG reliability could not be quantified from the retained dataset because the stimulation sequence was incremental rather than composed of repeated independent trials at the same stimulation intensity. Some TMG variables—particularly sustain and half-relaxation measures—may be less reliable than contraction time and maximal displacement, and this measurement variability may have attenuated the observed predictive contribution of the TMG domain. Therefore, the TMG findings should be interpreted as evidence of the limited observed predictive utility in the present protocol, not as definitive evidence that local contractile properties have no relevance to CMJ performance.
Because CMJ performance depends on coordinated contributions from multiple lower-limb muscles and joints, a multi-muscle TMG protocol might yield different information than the single-muscle approach used here. Correlation among CMJ depth, stiffness, and temporal variables may redistribute random-forest importance across predictors, so rankings should not be interpreted as unique causal effects; correlated predictors are a recognized challenge for random-forest importance measures [22]. To reduce the risk of overinterpreting a single fitted forest, the present importance values were calculated only in held-out folds and summarized across complete repeated outer-CV repetitions. Nevertheless, these values remain descriptive indicators of model dependence rather than causal or uniquely attributable effects. Finally, ALE and c-ICE describe the fitted model rather than the underlying biological system. They are valuable for generating mechanistic hypotheses, especially when predictors are correlated, but they do not establish causal effects or reproducible individual response functions [29,30].
The GAM results should also be interpreted cautiously. Although the GAM was regularized and constrained to reduce overfitting, the sample size limited the complexity that could be estimated reliably. Therefore, GAM underperformance should be interpreted as poor generalization of the fitted additive smooth model under the present data constraints, not as definitive evidence against nonlinear biomechanical relationships.
Future studies should combine repeated CMJ trials with independent measures of maximal force capacity, eccentric strength, joint-level kinetics, segmental coordination, muscle activation, and muscle–tendon behavior. Experimentally manipulating countermovement depth and descent velocity would help determine whether the nonlinear relationships identified here are causal and whether athletes exhibit stable, individually optimal movement solutions. Longitudinal technical or strength interventions would be required to determine whether movement organization can be learned or altered and whether such changes improve performance beyond changes in force capacity. Larger multicenter samples that include female athletes, senior players, different maturity stages, and athletes from different clubs and sports, together with external validation, would permit more reliable individual modeling and examination of whether strategy profiles differ across developmental stages, positions, competitive levels, and sporting contexts.
5. Conclusions
This study demonstrates that CMJ-height prediction must be distinguished from mechanical reconstruction. Mean propulsion force and propulsion duration almost completely reproduced jump height because they jointly approximate the impulse–velocity relationship. After these mechanically proximal variables were excluded, jump height remained only modestly predictable. Random forest was the strongest prespecified single model family, but the fully nested one-standard-error selection pipeline provided a more conservative estimate of expected generalization. Most of the remaining predictive information came from unweighting duration, countermovement depth, and peak braking force. Within the retained predictor set, movement-organization variables were more informative than the restricted force-expression domain, whereas single-muscle rectus femoris TMG-derived contractile properties provided neither a useful standalone prediction nor incremental value in the present protocol. Exploratory ALE, centered ICE, and interaction analyses described model-fitted association patterns involving countermovement depth and temporal organization, but these analyses were descriptive and did not establish discrete athlete strategy profiles or causal effects. These findings indicate that CMJ height is an integrated mechanical outcome in which neuromuscular capacity is expressed through the organization of displacement, time, and force. This conclusion should not be extended to TMG assessment of other muscles or multi-muscle TMG profiles because CMJ performance depends on coordinated hip, knee, and ankle extensor function. Practitioners should therefore distinguish between variables that mathematically determine jump height and those that describe how the movement is performed, and should avoid interpreting predictor importance as a universal technical prescription.
Supplementary Materials
The following supporting information can be downloaded at: https://www.mdpi.com/article/10.3390/app16146954/s1, Supplementary File S1: Full R analysis script; Table S1: CMJ reliability and predictive importance; Table S2: Preprocessing and modeling workflow.
Author Contributions
Conceptualization, N.S., D.S., B.M. and N.T.; methodology, N.S., D.S., M.F. and I.I.; software, N.S.; validation, N.S., B.M., N.T. and G.P.; formal analysis, N.S.; investigation, N.S., D.S. and B.M.; resources, N.S., B.M., N.T. and G.P.; data curation, N.S.; writing—original draft preparation, N.S.; writing—review and editing, D.S., M.F., B.M., N.T., G.P. and I.I.; visualization, N.S.; supervision, N.T. and I.I.; project administration, N.S. and M.F. All authors have read and agreed to the published version of the manuscript.
Funding
This research received no external funding.
Institutional Review Board Statement
The study was conducted in accordance with the Declaration of Helsinki and approved by the Faculty of Sport and Physical Education, University of Niš, Serbia (Decision No. 04-474/3; approval date: 28 March 2024).
Informed Consent Statement
Written informed consent was obtained from all participants aged 18 years or older. For players younger than 18 years, written informed consent was obtained from a parent or legal guardian, and player assent was obtained before testing.
Data Availability Statement
The R analysis script is provided as Supplementary File S1, and Supplementary Tables S1 and S2 summarize the CMJ reliability-impact analysis and preprocessing/modeling workflow. The athlete-level data supporting the findings of this study are available from the corresponding author upon reasonable request. The data are not publicly available due to privacy and ethical restrictions related to the use of individual athlete performance and physiological measurements.
Acknowledgments
The authors declare that no additional support was received for the preparation of this manuscript.
Conflicts of Interest
The authors declare no conflicts of interest.
Abbreviations and Variables
The following abbreviations and variables are used in this manuscript:
| CMJ | Countermovement jump |
| COM | Center of mass |
| TMG | Tensiomyography |
| RFD | Rate of force development |
| h | Jump height |
| Take-off velocity | |
| Vertical ground-reaction force | |
| Net vertical force | |
| Countermovement depth | |
| Vertical stiffness | |
| Maximal radial displacement | |
| Contraction time | |
| Delay time | |
| Sustain time | |
| Half-relaxation time |
References
- Xu, D.; Zhou, H.; Quan, W.; Ma, X.; Chon, T.E.; Fernandez, J.; Gusztav, F.; Kovács, A.; Baker, J.S.; Gu, Y. New Insights Optimize Landing Strategies to Reduce Lower Limb Injury Risk. Cyborg Bionic Syst. 2024, 5, 0126. [Google Scholar] [CrossRef] [Scilit] [PubMed]
- McMahon, J.J.; Suchomel, T.J.; Lake, J.P.; Comfort, P. Understanding the key phases of the countermovement jump force-time curve. Strength Cond. J. 2018, 40, 96–106. [Google Scholar] [CrossRef] [Scilit]
- Aničić, Z.; Janićijević, D.; Knežević, O.M.; García-Ramos, A.; Petrović, M.R.; Čabarkapa, D.; Mirkov, D.M. Assessment of countermovement jump: What should we report? Life 2023, 13, 190. [Google Scholar] [CrossRef] [Scilit] [PubMed]
- Eythorsdottir, I.; Gløersen, Ø.; Rice, H.; Werkhausen, A.; Ettema, G.; Mentzoni, F.; Solberg, P.; Lindberg, K.; Paulsen, G. The battle of the equations: A systematic review of jump height calculations using force platforms. Sports Med. 2024, 54, 2771–2791. [Google Scholar] [CrossRef] [Scilit] [PubMed]
- Merrigan, J.J.; Stone, J.D.; Wagle, J.P.; Hornsby, W.G.; Ramadan, J.; Joseph, M.; Galster, S.M.; Hagen, J.A. Using random forest regression to determine influential force-time metrics for countermovement jump height: A technical report. J. Strength Cond. Res. 2022, 36, 277–283. [Google Scholar] [CrossRef] [Scilit] [PubMed]
- Bobbert, M.F.; van Ingen Schenau, G.J. Coordination in vertical jumping. J. Biomech. 1988, 21, 249–262. [Google Scholar] [CrossRef] [Scilit] [PubMed]
- Komi, P.V. Stretch-shortening cycle: A powerful model to study normal and fatigued muscle. J. Biomech. 2000, 33, 1197–1206. [Google Scholar] [CrossRef] [Scilit] [PubMed]
- Van Hooren, B.; Zolotarjova, J. The difference between countermovement and squat jump performances: A review of underlying mechanisms with practical applications. J. Strength Cond. Res. 2017, 31, 2011–2020. [Google Scholar] [CrossRef] [Scilit] [PubMed]
- Jo, I.; Lee, H.D. Joint coordination and muscle-tendon interaction differ depending on the level of jumping performance. J. Sports Sci. Med. 2023, 22, 189–195. [Google Scholar] [CrossRef] [Scilit] [PubMed]
- Sánchez-Sixto, A.; Harrison, A.J.; Floría, P. Larger countermovement increases the jump height of countermovement jump. Sports 2018, 6, 131. [Google Scholar] [CrossRef] [Scilit] [PubMed]
- McHugh, M.P.; Cohen, J.A.; Orishimo, K.F.; Kremenic, I.J. Effect of countermovement depth on the neuromechanics of a vertical jump. Transl. Sport. Med. 2024, 2024, 7113900. [Google Scholar] [CrossRef] [Scilit] [PubMed]
- Nishiumi, D.; Hirose, N. Increasing braking and amortization forces during the countermovement jump does not necessarily improve jump height. J. Hum. Kinet. 2024, 94, 65–75. [Google Scholar] [CrossRef] [Scilit] [PubMed]
- Kozinc, Ž.; Smajla, D.; Nishiumi, D.; Hirose, N.; Šarabon, N. The relationship between braking rate of force development, braking force impulse, push-off force distribution and jump performance: An exploratory study. Isokinet. Exerc. Sci. 2026. [Google Scholar] [CrossRef] [Scilit]
- Rauch, J.T.; Leidersdorf, E.; Reeves, T.; Borkan, L.; Elliott, M.; Ugrinowitsch, C. Different movement strategies in the countermovement jump amongst a large cohort of NBA players. Int. J. Environ. Res. Public Health 2020, 17, 6394. [Google Scholar] [CrossRef] [Scilit] [PubMed]
- Guess, T.M.; Gray, A.D.; Willis, B.W.; Guess, M.M.; Sherman, S.L.; Chapman, D.W.; Mann, J.B. Force-time waveform shape reveals countermovement jump strategies of collegiate athletes. Sports 2020, 8, 159. [Google Scholar] [CrossRef] [Scilit] [PubMed]
- Bayne, H.; Cockcroft, J.; Robyn, A.; Louw, Q. Objective classification of countermovement jump force-time curve modality: Within-athlete consistency and associations with jump performance. Sports Biomech. 2024, 23, 2053–2064. [Google Scholar] [CrossRef] [Scilit] [PubMed]
- Bird, M.B.; Mi, Q.; Koltun, K.J.; Lovalekar, M.T.; Martin, B.J.; Fain, A.; Bannister, A.; Vera Cruz, A.; Doyle, T.L.A.; Nindl, B.C. Unsupervised clustering techniques identify movement strategies in the countermovement jump associated with musculoskeletal injury risk during U.S. Marine Corps Officer Candidates School. Front. Physiol. 2022, 13, 868002. [Google Scholar] [CrossRef] [Scilit] [PubMed]
- Macgregor, L.J.; Hunter, A.M.; Orizio, C.; Fairweather, M.M.; Ditroilo, M. Assessment of skeletal muscle contractile properties by radial displacement: The case for tensiomyography. Sports Med. 2018, 48, 1607–1620. [Google Scholar] [CrossRef] [Scilit] [PubMed]
- Gil, S.; Loturco, I.; Tricoli, V.; Ugrinowitsch, C.; Kobal, R.; Cal Abad, C.C.; Roschel, H. Tensiomyography parameters and jumping and sprinting performance in Brazilian elite soccer players. Sports Biomech. 2015, 14, 340–350. [Google Scholar] [CrossRef] [Scilit] [PubMed]
- Lewis, M.D.; Young, W.B.; Knapstein, L.; Lavender, A.; Talpey, S.W. Countermovement jump variables not tensiomyography can distinguish between sprint and endurance focused track cyclists. Biol. Sport 2022, 39, 67–72. [Google Scholar] [CrossRef] [Scilit] [PubMed]
- Varma, S.; Simon, R. Bias in error estimation when using cross-validation for model selection. BMC Bioinform. 2006, 7, 91. [Google Scholar] [CrossRef] [Scilit] [PubMed]
- Strobl, C.; Boulesteix, A.L.; Kneib, T.; Augustin, T.; Zeileis, A. Conditional variable importance for random forests. BMC Bioinform. 2008, 9, 307. [Google Scholar] [CrossRef] [Scilit] [PubMed]
- Breiman, L. Random forests. Mach. Learn. 2001, 45, 5–32. [Google Scholar] [CrossRef] [Scilit]
- Wright, M.N.; Ziegler, A. ranger: A fast implementation of random forests for high dimensional data in C++ and R. J. Stat. Softw. 2017, 77, 1–17. [Google Scholar] [CrossRef] [Scilit]
- Zou, H.; Hastie, T. Regularization and variable selection via the elastic net. J. R. Stat. Soc. Ser. B (Stat. Methodol.) 2005, 67, 301–320. [Google Scholar] [CrossRef] [Scilit]
- McErlain-Naylor, S.; King, M.; Pain, M.T.G. Determinants of countermovement jump performance: A kinetic and kinematic analysis. J. Sports Sci. 2014, 32, 1805–1812. [Google Scholar] [CrossRef] [Scilit] [PubMed]
- Sole, C.J.; Mizuguchi, S.; Sato, K.; Moir, G.L.; Stone, M.H. Phase characteristics of the countermovement jump force-time curve: A comparison of athletes by jumping ability. J. Strength Cond. Res. 2018, 32, 1155–1165. [Google Scholar] [CrossRef] [Scilit] [PubMed]
- Yadav, G.; Duque, J. Reflecting on what is skill in human motor skill learning. Front. Hum. Neurosci. 2023, 17, 1117889. [Google Scholar] [CrossRef] [Scilit] [PubMed]
- Apley, D.W.; Zhu, J. Visualizing the effects of predictor variables in black box supervised learning models. J. R. Stat. Soc. Ser. B (Stat. Methodol.) 2020, 82, 1059–1086. [Google Scholar] [CrossRef] [Scilit]
- Goldstein, A.; Kapelner, A.; Bleich, J.; Pitkin, E. Peeking inside the black box: Visualizing statistical learning with plots of individual conditional expectation. J. Comput. Graph. Stat. 2015, 24, 44–65. [Google Scholar] [CrossRef] [Scilit]

Disclaimer/Publisher’s Note: The statements, opinions and data contained in all publications are solely those of the individual author(s) and contributor(s) and not of MDPI and/or the editor(s). MDPI and/or the editor(s) disclaim responsibility for any injury to people or property resulting from any ideas, methods, instructions or products referred to in the content. |
© 2026 by the authors. Licensee MDPI, Basel, Switzerland. This article is an open access article distributed under the terms and conditions of the Creative Commons Attribution (CC BY) license.