1. Introduction
Long-term intensive coal exploitation has resulted in the progressive depletion of coal reserves and the consequent closure of a large number of coal mines. According to successive Annual Reports on the Development of the Coal Industry, the number of coal mines in China has continuously declined. In 2013, the total number of coal mines was approximately 12,000, whereas by the end of 2025, it had decreased to fewer than 4200, representing a reduction exceeding 60%.
Following mine closure, pumping and drainage operations are terminated, leading to a progressive rise and redistribution of groundwater levels. Under such hydrogeological conditions, abandoned mines are highly susceptible to groundwater accumulation and waterlogging in goaf areas, thereby increasing the risk of secondary geological hazards. Previous studies indicate that the extraction of every 10,000 tons of coal induces approximately 0.2–0.33 hm
2 of surface subsidence [
1]. Based on the
Annual Reports on the Development of the Coal Industry and relevant datasets [
2], the cumulative coal production in China from 1949 to 2025 is estimated to be approximately 113.79 billion tons. Using a conservative mean subsidence coefficient of 0.265 hm
2 per 10,000 tons, the cumulative subsidence-affected area by 2025 is estimated to reach approximately 3.016 million hm
2.
Furthermore, assuming a constant annual coal production of 4.5 billion tons, the newly induced subsidence area is estimated to be approximately 119,000 hm2 per year, indicating that coal mining-related land subsidence remains a non-negligible and continuously accumulating environmental impact.
Groundwater acting within goaf areas reduces the strength of fractured rock masses. This weakening may destabilize fractured rock blocks within the fractured zone, causing them to slip or collapse due to changes in the void space beneath, thereby inducing deformation of the overlying strata [
3]. Groundwater not only affects the mechanical properties and structural characteristics of the overburden in goaf areas, but also alters the internal stress state of the rock mass through pore water pressure acting on the solid skeleton, thereby influencing overburden stability. Under groundwater action, surface deformation may occur in abandoned goafs. This type of deformation, not directly induced by mining activities, is referred to as secondary subsidence and includes both surface subsidence and uplift phenomena [
4,
5,
6]. The deformation associated with secondary subsidence in abandoned goafs is characterized by long-term evolution and complexity, typically involving both subsidence and uplift processes [
7,
8].
In recent years, scholars have conducted studies on residual deformation characteristics of goaf areas under groundwater influence. These studies have primarily focused on the degradation of mechanical properties of fragmented rock masses due to groundwater. Such degradation accelerates pore compaction, leading to increased surface subsidence. Most research has analyzed the effects of groundwater presence and groundwater level on surface deformation in goaf areas. Liu Zhanxin et al. [
9] performed numerical simulations considering water filling conditions and building loads as variables, and obtained surface movement and deformation patterns under different scenarios. Bai Yun et al. [
10] investigated overburden deformation characteristics under varying groundwater levels using FLAC3D. Hailong et al. [
11] employed similar-material physical modeling experiments and conducted long-term monitoring of overburden movement after groundwater infiltration into goaf areas, revealing displacement behavior and its residual deformation effects on the surface. Zhu Kun et al. [
12] also used similar-material simulation experiments to study displacement characteristics and mechanical behavior of overburden after goaf water filling. Their results indicate that after water filling, groundwater gradually rises, and rock masses within the water-conducting fracture zone undergo softening due to water action, leading to further pore compaction, continuous increase in rock mass stress, and greater subsidence.
Gao Xin [
13] established an experimental platform to investigate internal groundwater-level variation characteristics and influencing factors during the goaf water-filling process. The results show that this process can be divided into an initial water spreading stage and a subsequent filling stage. Yang Zhiqiang [
14] simulated the water-filling process of coal seams using similar-material models and studied the deformation characteristics of overburden after water filling; however, the analysis was limited to experimental phenomena without addressing the underlying mechanisms. Chen Shaojie et al. [
15] conducted physical simulation experiments to replicate a large goaf environment under water-filled conditions, in order to analyze the flow behavior of backfilling grout slurry. Notably, the similar-material simulation method has inherent limitations in representing groundwater effects, as the mechanical properties of rock strata after water filling cannot satisfy similarity ratio requirements.
Hu Weiyue et al. [
16,
17] suggested that groundwater rise reduces the effective stress of fractured rock masses induced by mining, thereby causing surface subsidence. Zheng Meinan et al. [
18] proposed that surface uplift occurs because groundwater rebound increases pore water pressure in rock strata, reduces effective stress, and consequently induces uplift. Zheng Meinan et al. [
19], through time-series deformation analysis, found that the surface secondary subsidence patterns of closed mines in the Huainan mining area are similar to those observed in the Xuzhou mining area. Dudek [
20] argued that rising groundwater generates buoyancy, reducing the stress of overlying strata, and analyzed surface subsidence and uplift during different mining stages. Luo Jin [
21] used FLAC3D numerical simulations to analyze the transmission process of surface uplift after groundwater level rebound, and examined the effects of mining height and groundwater level on surface uplift.
From the above, it can be concluded that current studies have extensively investigated the mechanisms of overburden deformation and surface subsidence in goaf areas under groundwater influence, whereas research on uplift mechanisms remains relatively limited. Moreover, there is a lack of systematic investigation into surface movement and deformation laws of goaf areas under varying geological and mining conditions. Surface deformation in abandoned goafs under groundwater action is mainly associated with the influence of groundwater on the caving zone, which weakens the rock mass and generates pore water pressure, thereby inducing deformation of both overburden and the ground surface. This deformation transfer process is a coupled rock–fluid interaction process, which is difficult to monitor through field measurements alone. Numerical simulation, however, provides an effective means to model internal deformation of rock masses and is one of the primary research approaches in geotechnical engineering. Therefore, this study adopts numerical simulation methods, building upon previous research on groundwater effects on goaf overburden, to further investigate the influence and response mechanisms of groundwater on overburden movement and deformation, as well as the effects of different geological and mining conditions on surface deformation in abandoned goafs.
3. Model and Scheme Design
3.1. Numerical Simulation Method for Abandoned Goafs Under Groundwater Influence
Numerical simulation is an essential research approach in engineering geology and mining engineering, capable of describing the processes of strata movement, failure, and stress evolution induced by underground mining activities. Compared with similar-material physical simulation, the latter cannot effectively account for hydraulic pressure effects. Moreover, when materials are exposed to water, their similarity ratios may no longer remain valid. In contrast, numerical simulation exhibits significant advantages in studying hydro–mechanical coupling processes, as it can accurately represent the influence of water pressure on rock mass deformation, thereby compensating for the limitations of similar-material simulation experiments.
The geological conditions encountered in mining engineering are highly complex and variable, making it difficult for theoretical models to fully represent real-world scenarios. Consequently, numerical simulation has certain limitations in providing precise quantitative results. However, through extensive research accumulation and validation in engineering practice, its reliability in qualitative analysis has been well established. Therefore, this study employs the FLAC3D v6.00 numerical simulation method to investigate the general laws governing overburden and surface movement in goaf areas under groundwater influence.
During the process in which abandoned goafs are affected by groundwater, groundwater infiltration not only significantly alters the physical and mechanical properties of the overburden but also generates pore water pressure. These changes lead to the redistribution of the stress field, which in turn induces new deformation and movement, thereby affecting the stability of both the overburden and the ground surface.
The primary process of groundwater infiltration into a goaf is as follows: groundwater flows from the fractured zone into the caving zone. The region influenced by groundwater expands progressively with the rise in groundwater level until the caving zone is completely saturated. In FLAC v6.00 numerical simulations, the main approaches for modeling groundwater effects include fully coupled methods, partially coupled methods, the equivalent density method, and the effective stress method.
According to relevant studies [
25], comparative simulations using these methods indicate that the equivalent density method and the effective stress method offer higher computational efficiency, while yielding results consistent with those of fully coupled approaches. Their validity has also been verified through analytical solutions. In addition, the feasibility of using the Mohr–Coulomb constitutive model to simulate groundwater effects has been confirmed.
Given that groundwater infiltration into a goaf is a long-term process and that fluid flow itself is not the primary focus of this study, the effective stress method—characterized by higher computational efficiency—is adopted for the simulation. In this approach, a rising groundwater level is initialized within the model domain. The effective stress method is primarily implemented through the influence of pore water pressure, based on Terzaghi’s effective stress principle, thereby capturing the mechanical effects of groundwater on the goaf. Test results indicate that the influence range parameters of groundwater in the coal wall region at the edge of the goaf have a negligible effect on overall deformation; therefore, these parameters are directly assigned using weakened values under saturated conditions.
This model adopts a gridpoint-based initialization approach for pore water pressure. The FLAC3D command zone gridpoint initialize pore-pressure is employed to impose an initial pore-pressure field within the designated domain. The pore pressure is assumed to follow a hydrostatic distribution in the vertical direction. The vertical gradient is specified as −1 × 10⁴ Pa/m, which is approximately equivalent to the product of the unit weight of water and gravitational acceleration. This initialization scheme is numerically equivalent to a hydrostatic pore-pressure field defined under a prescribed initial hydraulic head condition. It represents one of the commonly used and stable approaches for pore-pressure initialization in FLAC3D. On this basis, a reference pore water pressure is additionally imposed, resulting in a uniform upward shift in the pore-pressure field. This procedure enables the numerical simulation of groundwater-level-rise scenarios.
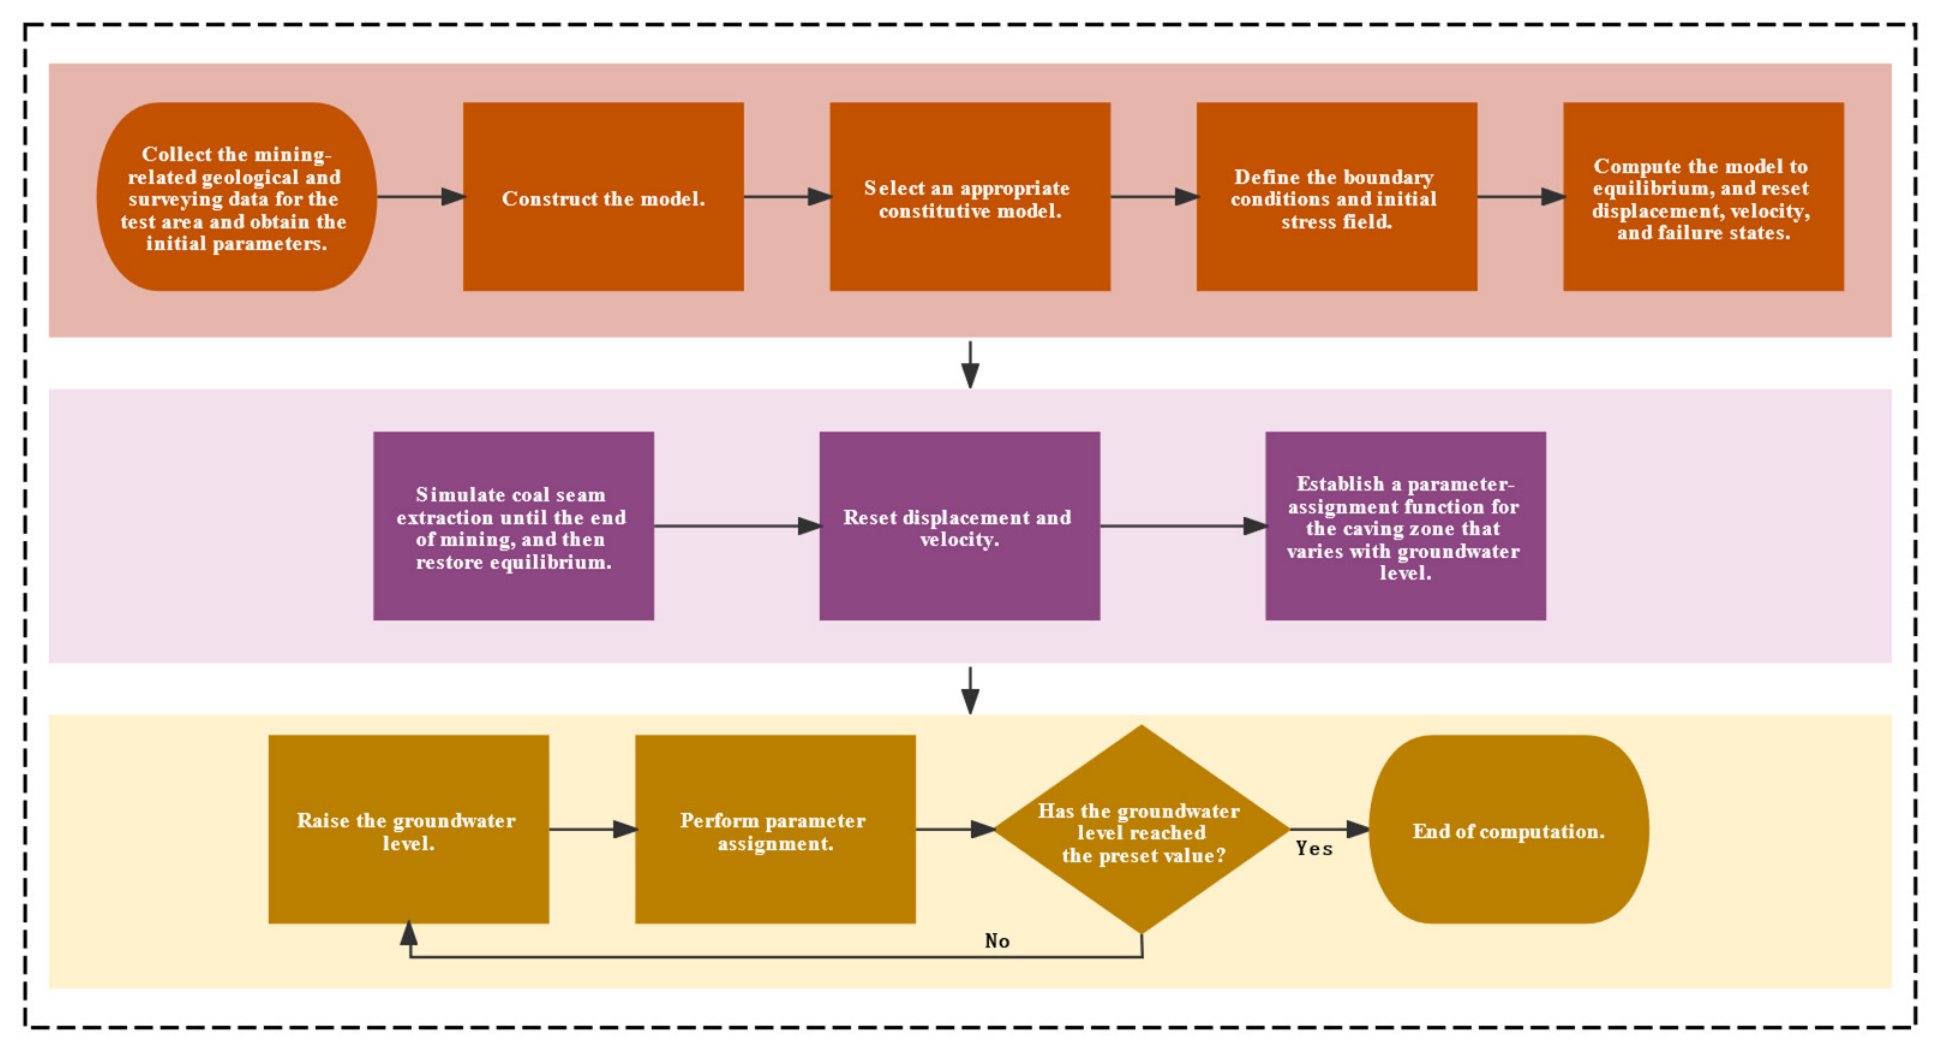
Based on the aforementioned groundwater infiltration process, a dynamic parameter assignment method is introduced to describe the temporal evolution of rock mass physical properties and environmental conditions induced by groundwater rise. This approach enables a more realistic simulation of the changes in physical–mechanical properties and stress conditions caused by groundwater infiltration, thereby facilitating analysis of their effects on overburden and surface stability. For clearer analysis of deformation induced by changes in groundwater level, the groundwater level at the goaf floor is set to 0 m as a reference. The detailed procedure is illustrated in
Figure 1.
The specific procedure is as follows:
- (1)
Initial Model Setup
Geological and mining data of the target area are collected to determine the initial mechanical parameters of the rock strata as well as the parameters under saturated conditions.
A suitable numerical mesh is constructed based on the actual conditions of the study area, ensuring that the model accurately reflects regional characteristics while satisfying computational requirements.
An appropriate constitutive model is selected, and initial parameters are assigned to represent in situ conditions.
Boundary conditions required for the calculation are defined, and the initial stress field is applied to complete model initialization.
Numerical computation is carried out until the model reaches an initial equilibrium state, after which the displacements and failures generated during the initialization process are removed.
- (2)
Groundwater Infiltration Process
As the groundwater level gradually rises, the height of rock strata affected by groundwater within the goaf correspondingly increases. To improve simulation accuracy, the increment of groundwater level should be reasonably defined according to the vertical extent of the rock strata in the model. Meanwhile, the physical parameters within the groundwater-affected zone are dynamically updated to reflect changes induced by the rising groundwater level.
3.2. Model Construction and Boundary Conditions
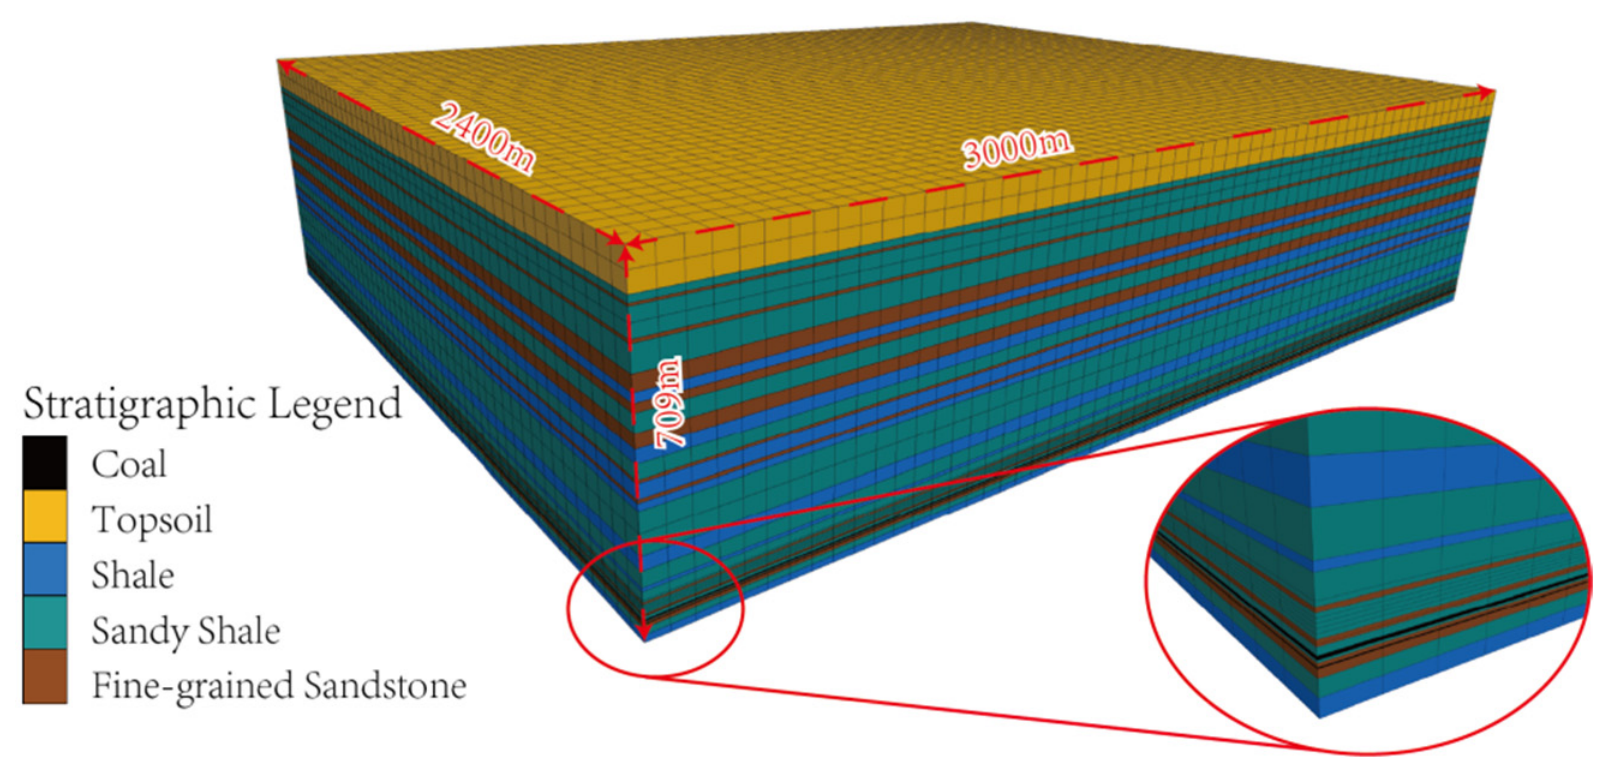
This study is based on the geological conditions of a coal mine in Xuzhou, Jiangsu Province, China. A numerical model is established to investigate the movement and failure characteristics of overburden strata above a water-filled goaf. The burial depth of the simulated coal seam is set to 667 m, with a seam thickness of 3 m. According to the stratigraphic column of the mining area, the rock strata mainly consist of sandstone, shale, and sandy shale. The simplified and merged stratigraphic sequence is presented in
Table 1.
The model extends from the coal seam to the ground surface, with refinement applied to the overburden strata above the coal seam to accommodate simulation requirements under varying groundwater levels. The model dimensions are 3000 m in length, 2400 m in width, and 709 m in height. The coal seam is assumed to be horizontal. The simulated working face has an advancing length of 1000 m and a width of 600 m.
The bottom boundary is fixed, while the two lateral boundaries in the x-direction are constrained in the x-axis, and the two lateral boundaries in the y-direction are constrained in the y-axis. The model configuration is illustrated in
Figure 2.
The model is composed of hexahedral elements, with grid sizes ranging from 1 m to 50 m in the vertical direction and 50 m in the horizontal direction. In total, the model consists of 128,527 nodes and 120,960 elements. Numerical calculations are performed after model construction.
3.3. Calibration of Mechanical Parameters of the Numerical Stratigraphic Model
During model calibration, a complete stratigraphic model is first established. Subsequently, the mechanical parameters of each rock layer are assigned based on the geotechnical properties of the study mining area. Coal seam excavation is then simulated, and surface subsidence data under near full-extraction conditions are extracted to calculate the corresponding subsidence coefficient.
The simulated subsidence coefficient is compared with the empirical value adopted in the mining area. When the two values are in close agreement, the model parameters are considered to be properly calibrated. Otherwise, the parameters of the rock strata are appropriately adjusted, and the above procedure is repeated until satisfactory agreement is achieved [
26].
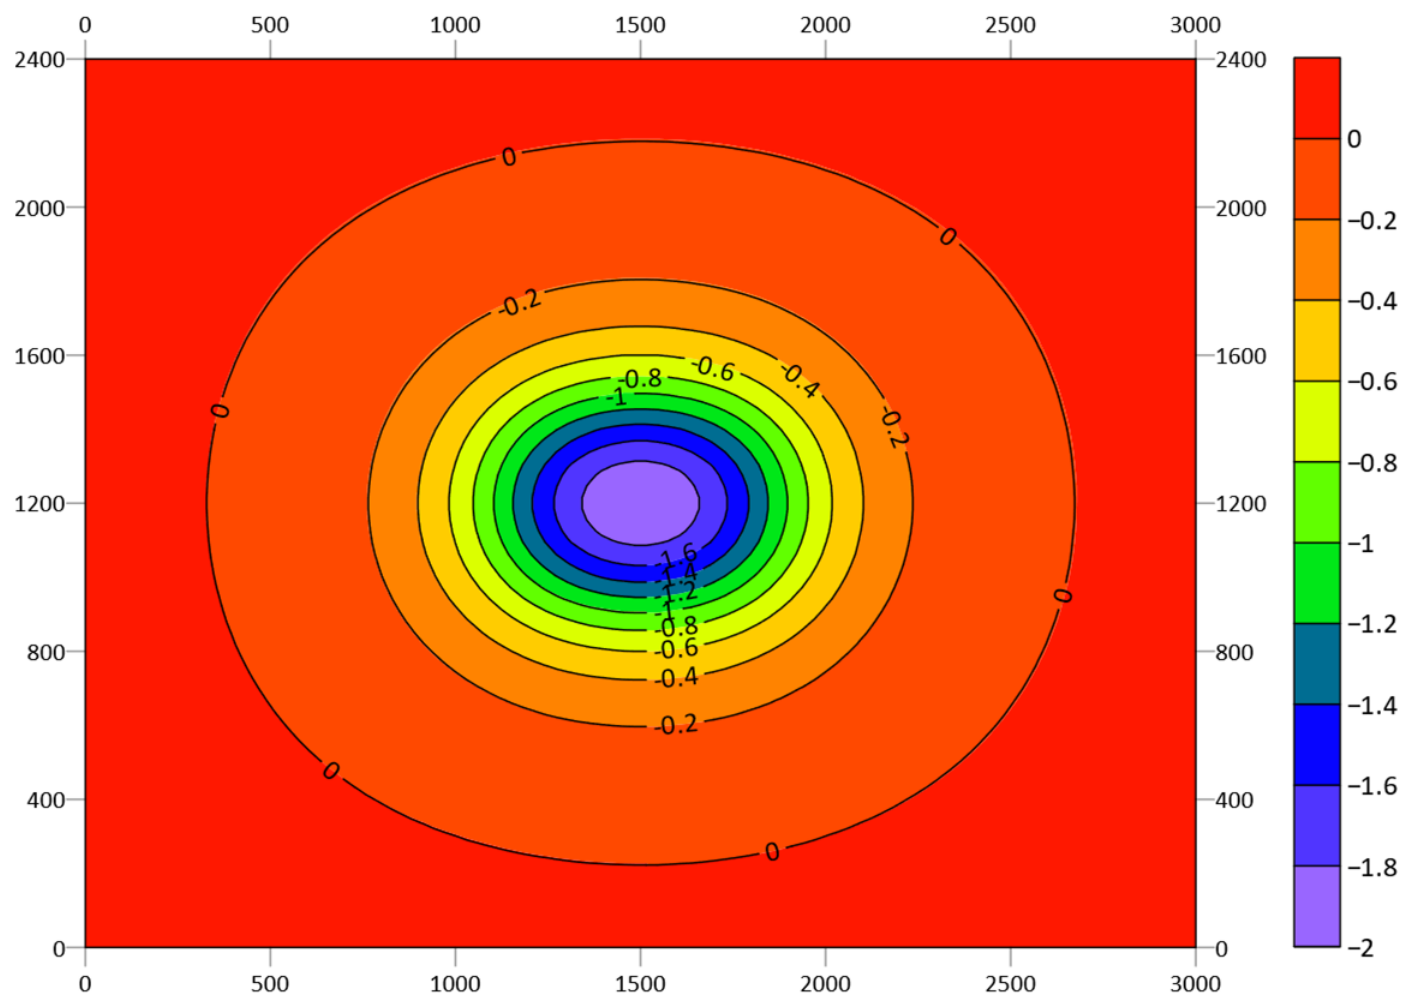
The subsidence coefficient of the study mining area is 0.72. Based on numerical excavation simulations, the Mohr–Coulomb constitutive model is adopted to represent the mechanical behavior of the rock mass. The model parameters are determined when the simulated subsidence coefficient is approximately 0.67. Considering that the numerical model does not explicitly account for joints and faults, and is also affected by mesh size, some discrepancies between the simulated and actual values are inevitable. Nevertheless, the established model is considered to meet the required accuracy for this study. The specific parameters are listed in
Table 2.
The surface subsidence contour map at the completion of working face extraction is shown in
Figure 3.
4. Influence of Groundwater on Goaf and Its Transmission Mechanism
4.1. Scheme Design
The influence of groundwater on goaf areas differs significantly from that under dry conditions, primarily in terms of changes in pore water pressure within the overburden and alterations in its mechanical properties. To investigate the effects of groundwater on the movement and failure behavior of overlying strata in abandoned goafs, as well as the mechanisms governing overburden deformation under groundwater conditions, a coal mine in Jiangsu Province was selected as the study area. A numerical model was established to evaluate the impacts of four scenarios on overburden movement above the goaf: (1) no groundwater effect, (2) water–rock softening effect, (3) pore water pressure effect, and (4) the combined effect of pore water pressure and water–rock softening.
Considering the geological and hydrogeological conditions of the study area, a groundwater inundation simulation of the goaf was conducted. Based on the established numerical model, key controlling factors, including the mechanical properties of the overburden and pore water pressure, were systematically varied and analyzed. The effects of groundwater inundation on the movement, deformation, and failure of the overburden above the goaf were thereby clarified, together with the corresponding mechanisms of deformation transmission and failure propagation.
In this study, the numerical model is constructed based on the evolutionary characteristics of water-filled goaf areas. Pore water pressure is assigned according to the groundwater level. Studies have shown that [
27,
28,
29,
30,
31] the mechanical parameters of rock, such as compressive strength, elastic modulus, and tensile strength, decrease with increasing water content. A substantial number of studies [
32,
33,
34,
35,
36,
37,
38,
39,
40,
41,
42,
43,
44] indicate that the weakening coefficient generally ranges from 0.3 to 0.9. For the sake of simplifying the numerical simulation, the reduction coefficient of the mechanical parameters of the caved zone rock mass is uniformly set to 0.4 in this model. According to the experimental results of Ma Zhanguo [
45], the hydraulic conductivity of fractured sandstone, mudstone, shale, and coal ranges from 10
−7 to 10
−8 cm/s in magnitude. In this study, a representative value of 4.7 × 10
−8 cm/s was adopted. In FLAC3D simulations, the permeability parameters need to be converted [
46]. Accordingly, the transformation relationship is given as
kh =
k × 1.02 × 10
−6, where
k is in cm/s. Therefore, the equivalent permeability is calculated as 4.8 × 10
−14 m
2/(Pa·s). The height of the caving zone is calculated using empirical formulas [
47,
48].
To analyze the influencing factors of strata movement, a comparative study is conducted using the following four simulation schemes:
Conventional mining: Simulates the traditional mining condition without groundwater influence. After coal seam extraction, the model is directly computed until equilibrium is reached.
Water–rock softening effect: After excavation reaches equilibrium, the physical and mechanical parameters of fractured rock masses in the caving zone are dynamically reassigned using the FISH language within the region corresponding to the groundwater level. The model is then computed until a new equilibrium is achieved.
Pore water pressure effect: After excavation equilibrium, pore water pressure is assigned according to the groundwater level to simulate its influence on the caving zone, and the model is computed to equilibrium.
Combined pore water pressure and water–rock softening effect: After excavation equilibrium, groundwater is introduced based on the groundwater level, and dynamically varying rock mass parameters are assigned using the FISH language. The model is then computed until equilibrium is reached.
4.2. Distribution of Surface Deformation in the Goaf
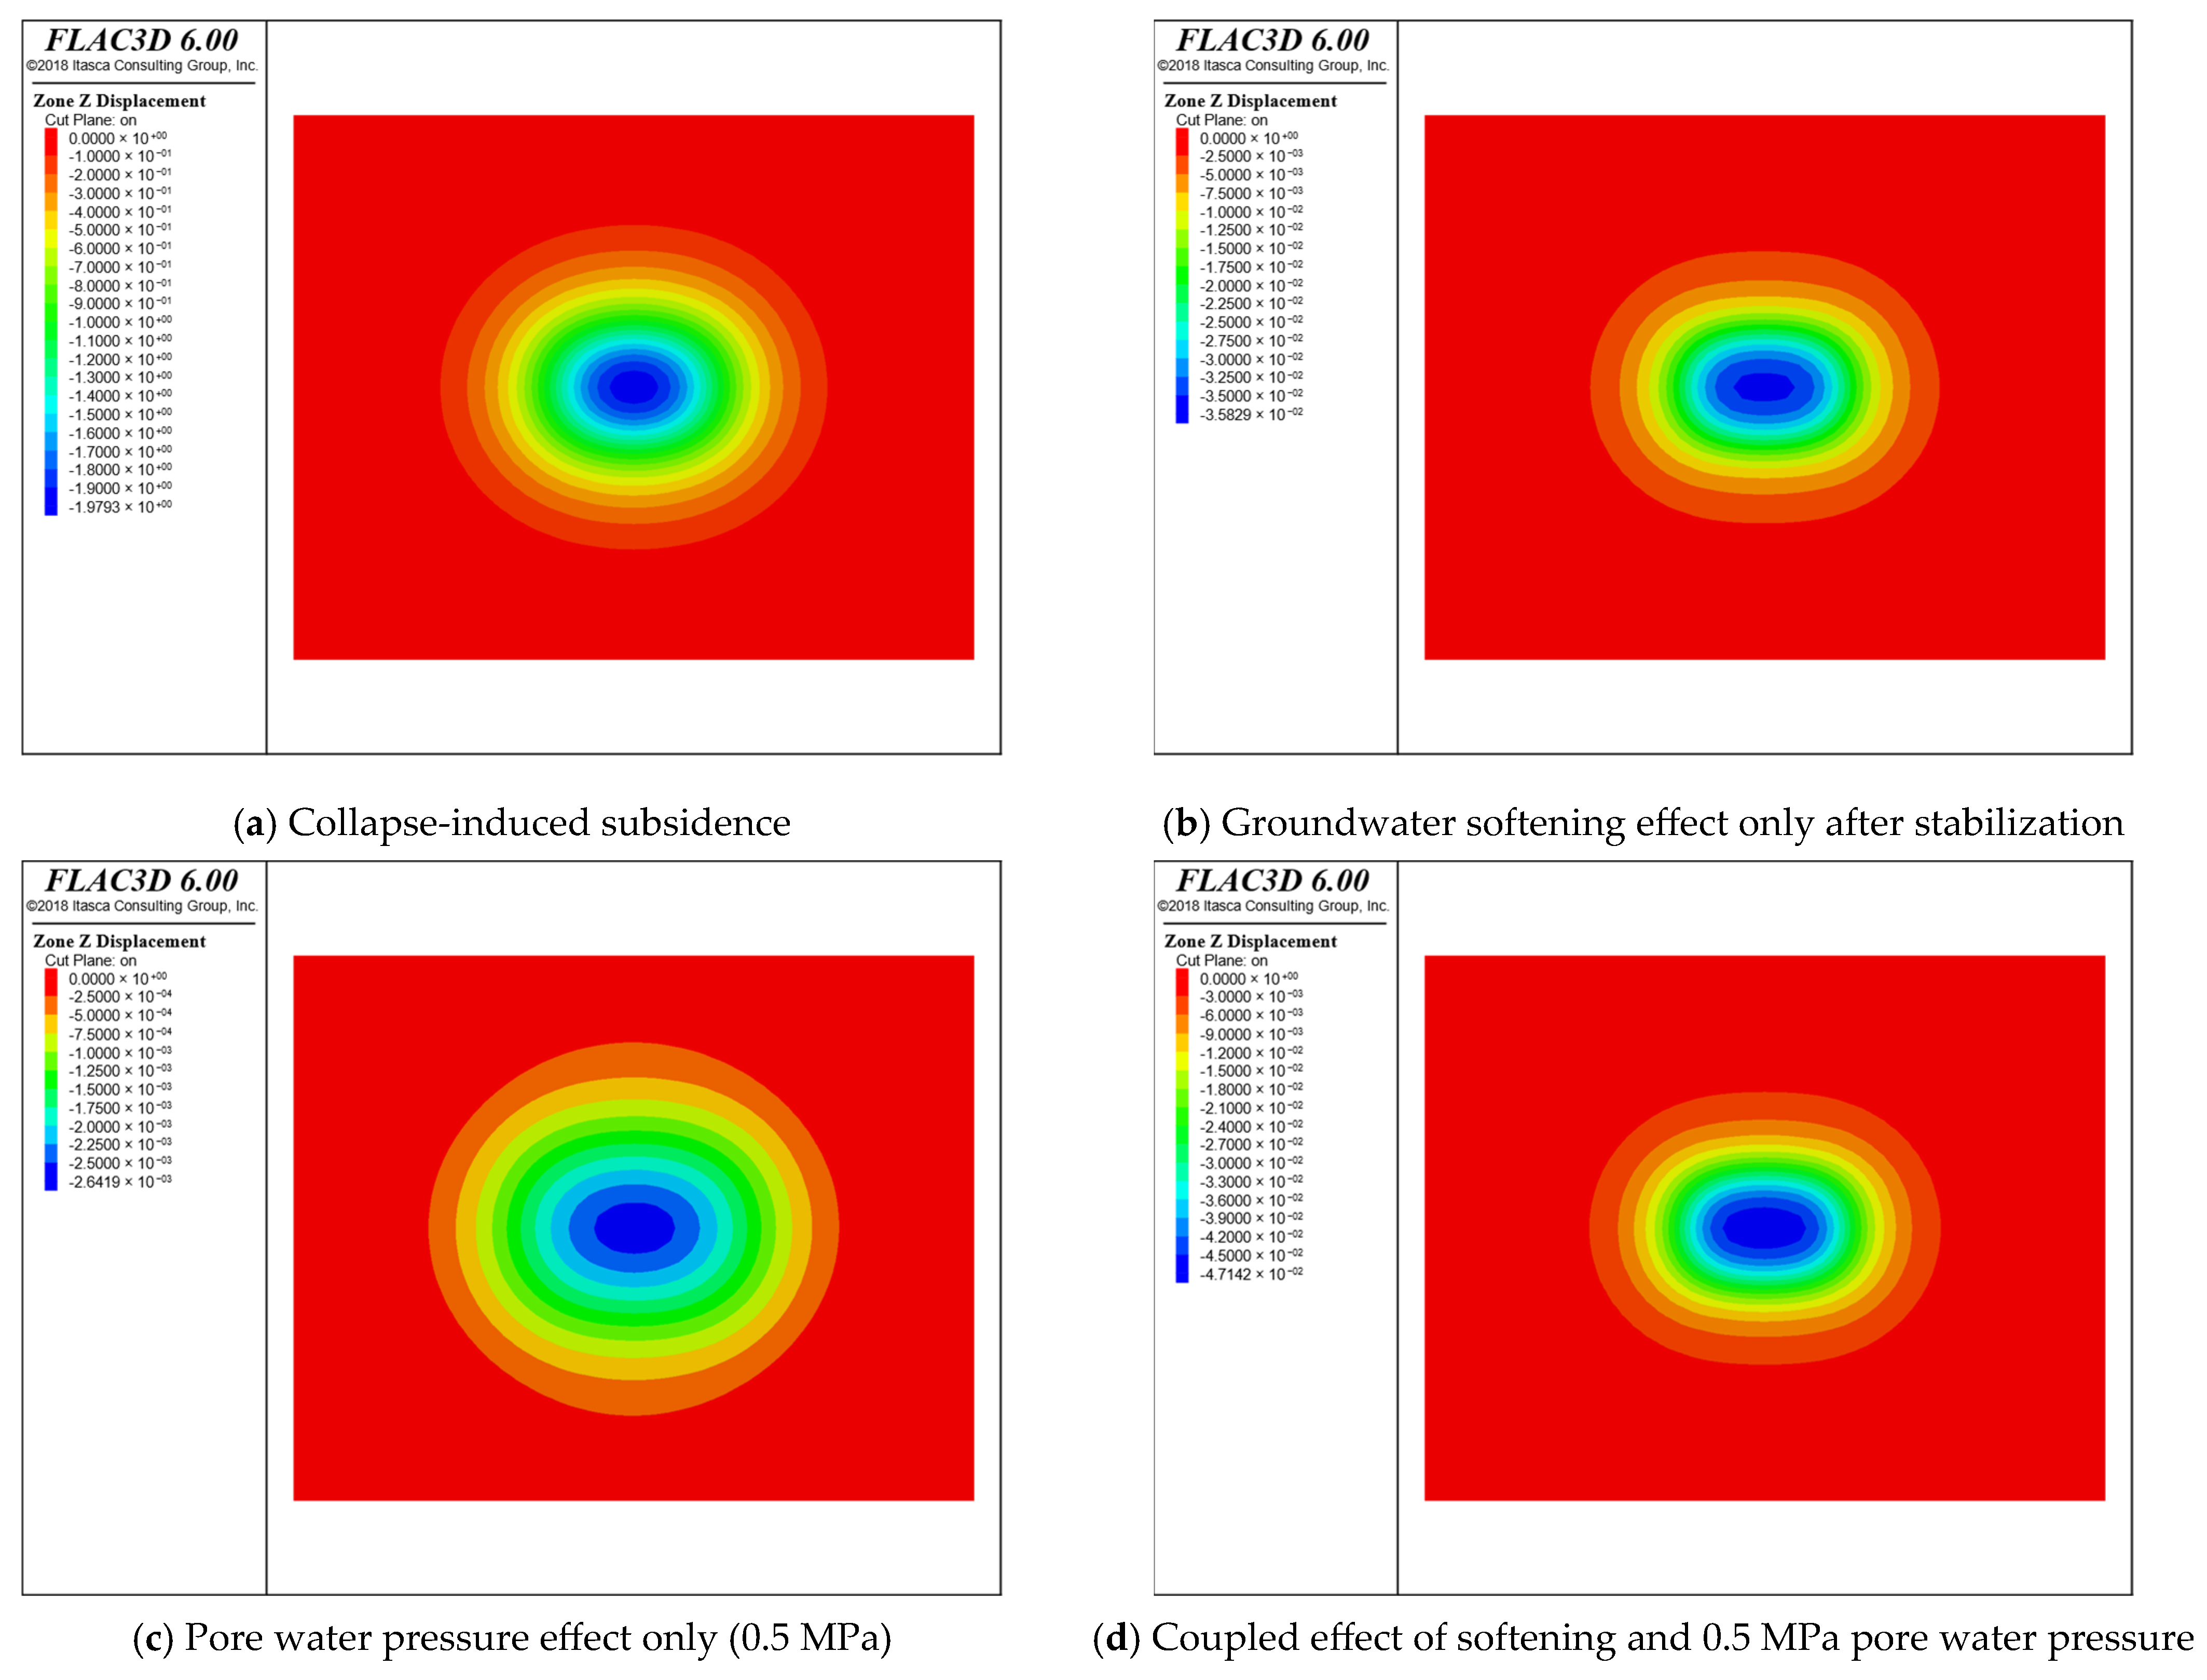
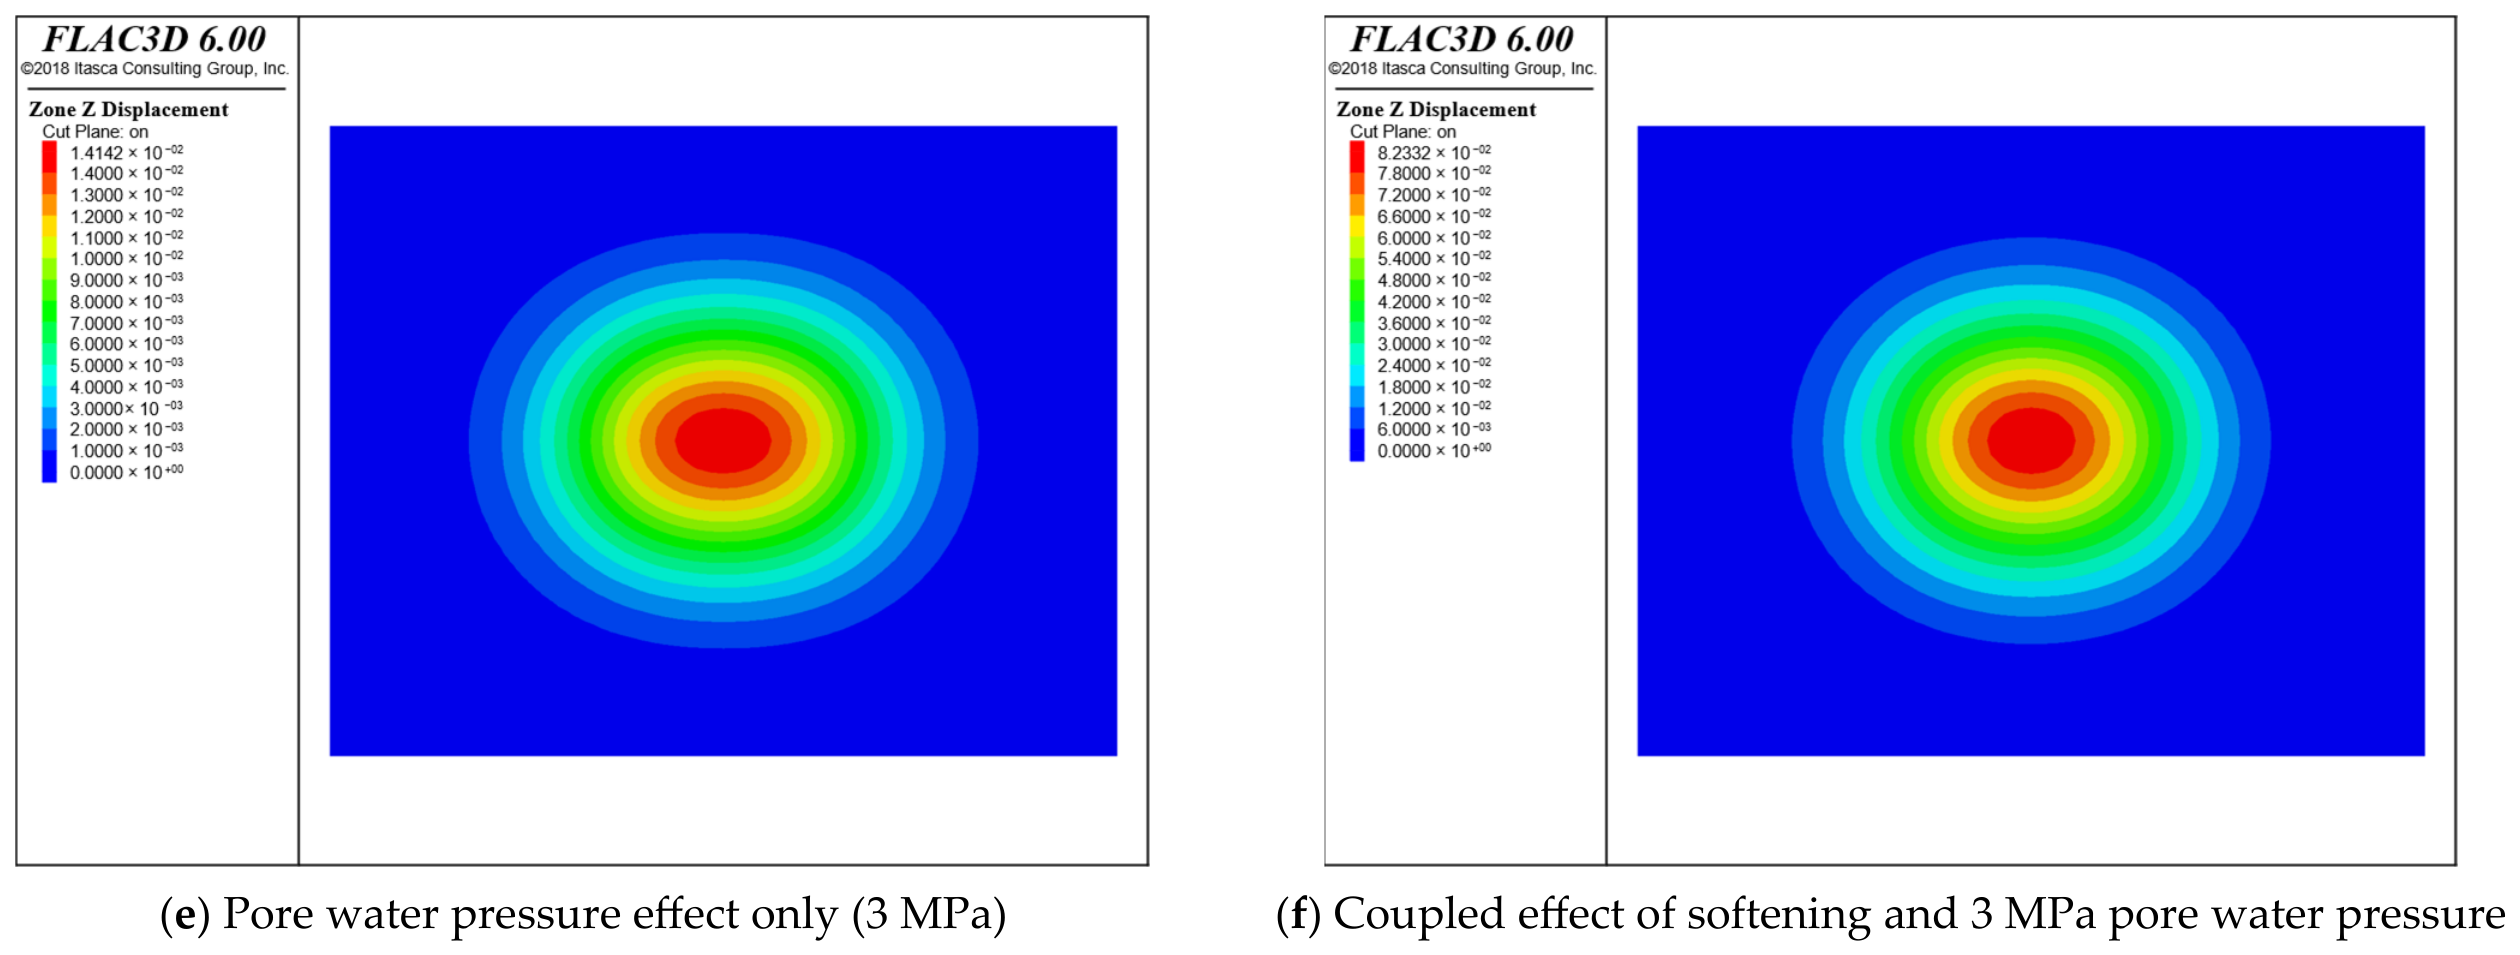
Based on the above simulation schemes, during groundwater infiltration into the goaf, deformation of the overburden propagates upward and ultimately forms a deformation zone at the ground surface. Representative cases are selected to analyze surface movement and deformation, as shown in the contour plots in
Figure 4.
Taking the contour of zero surface deformation (0 mm) as the boundary of influence, the simulation results indicate that the initial subsidence influence area after mining is 3,852,203.00 m2. When the groundwater level rises to 50 m, the affected area increases to 4,090,381.46 m2, and at a groundwater level of 300 m, it becomes 4,064,764.39 m2. During groundwater rise, the surface influence range initially expands and then slightly contracts relative to the original subsidence area, although the overall variation is not significant.
From the perspective of maximum vertical surface displacement, the deformation is −0.0471 m at a groundwater level of 50 m and 0.0823 m at 300 m. This indicates that vertical deformation first intensifies subsidence and subsequently transitions to uplift as the groundwater level increases.
Considering individual effects, the water–rock softening effect alone results in a vertical surface displacement of −0.0358 m. Under the sole influence of pore water pressure, the vertical displacement is −0.0026 m at a groundwater level of 50 m and 0.0823 m at 300 m. This suggests that pore water pressure alone initially enhances subsidence and then induces uplift as pressure increases.
At relatively low pore water pressure, surface subsidence is slightly intensified, primarily because groundwater action enhances compaction within the affected zone. However, as pore water pressure increases, the effective stress in the affected region decreases, leading to expansion (rebound) of the rock mass and consequently inducing surface uplift.
It can therefore be concluded that the increase in subsidence in goaf areas under groundwater influence is mainly governed by the water–rock softening effect. Low pore water pressure slightly aggravates subsidence and has a relatively minor impact, whereas higher pore water pressure produces a pronounced uplift effect on the ground surface.
The comparison results indicate that, compared with mining conditions without groundwater influence, the increased subsidence of the goaf is primarily attributed to the softening of the rock mass within the caving zone under groundwater action. Pore water pressure is closely related to the groundwater level, and its effects vary with different groundwater heights. Variations in pore water pressure can induce either subsidence or uplift of the ground surface. When pore water pressure is relatively low, its impact remains limited; however, once it exceeds a certain threshold, surface deformation may manifest as uplift.
In summary, the softening effect of groundwater reduces the strength of the rock mass in the caving zone, which is the principal cause of intensified surface subsidence and has a significant influence on subsidence depth. Low pore water pressure exacerbates subsidence, whereas high pore water pressure can induce surface uplift. When pore water pressure interacts with the softening of the overburden, their coupled effect leads to a sequential response in which surface subsidence occurs first, followed by uplift.
To further evaluate the stability of the surface deformation magnitude and the critical groundwater-level response, a sensitivity analysis was conducted by perturbing several key parameters, including the rock mass bulk modulus, internal friction angle and cohesion, by ±10% relative to their baseline values. The results indicate that although the maximum surface settlement and the extent of the affected area exhibit certain quantitative variations, their overall evolutionary trends remain essentially unchanged. Moreover, the critical transition from surface subsidence to uplift induced by increasing groundwater levels is consistently observed, with only a slight shift in the location of the critical transition point. These findings demonstrate that the deformation evolution pattern proposed in this study possesses good stability and robustness. They also suggest that the surface deformation behavior of mining goafs under groundwater influence is relatively insensitive to moderate variations in key geotechnical parameters.
4.3. Vertical Deformation Distribution of Overburden in the Goaf
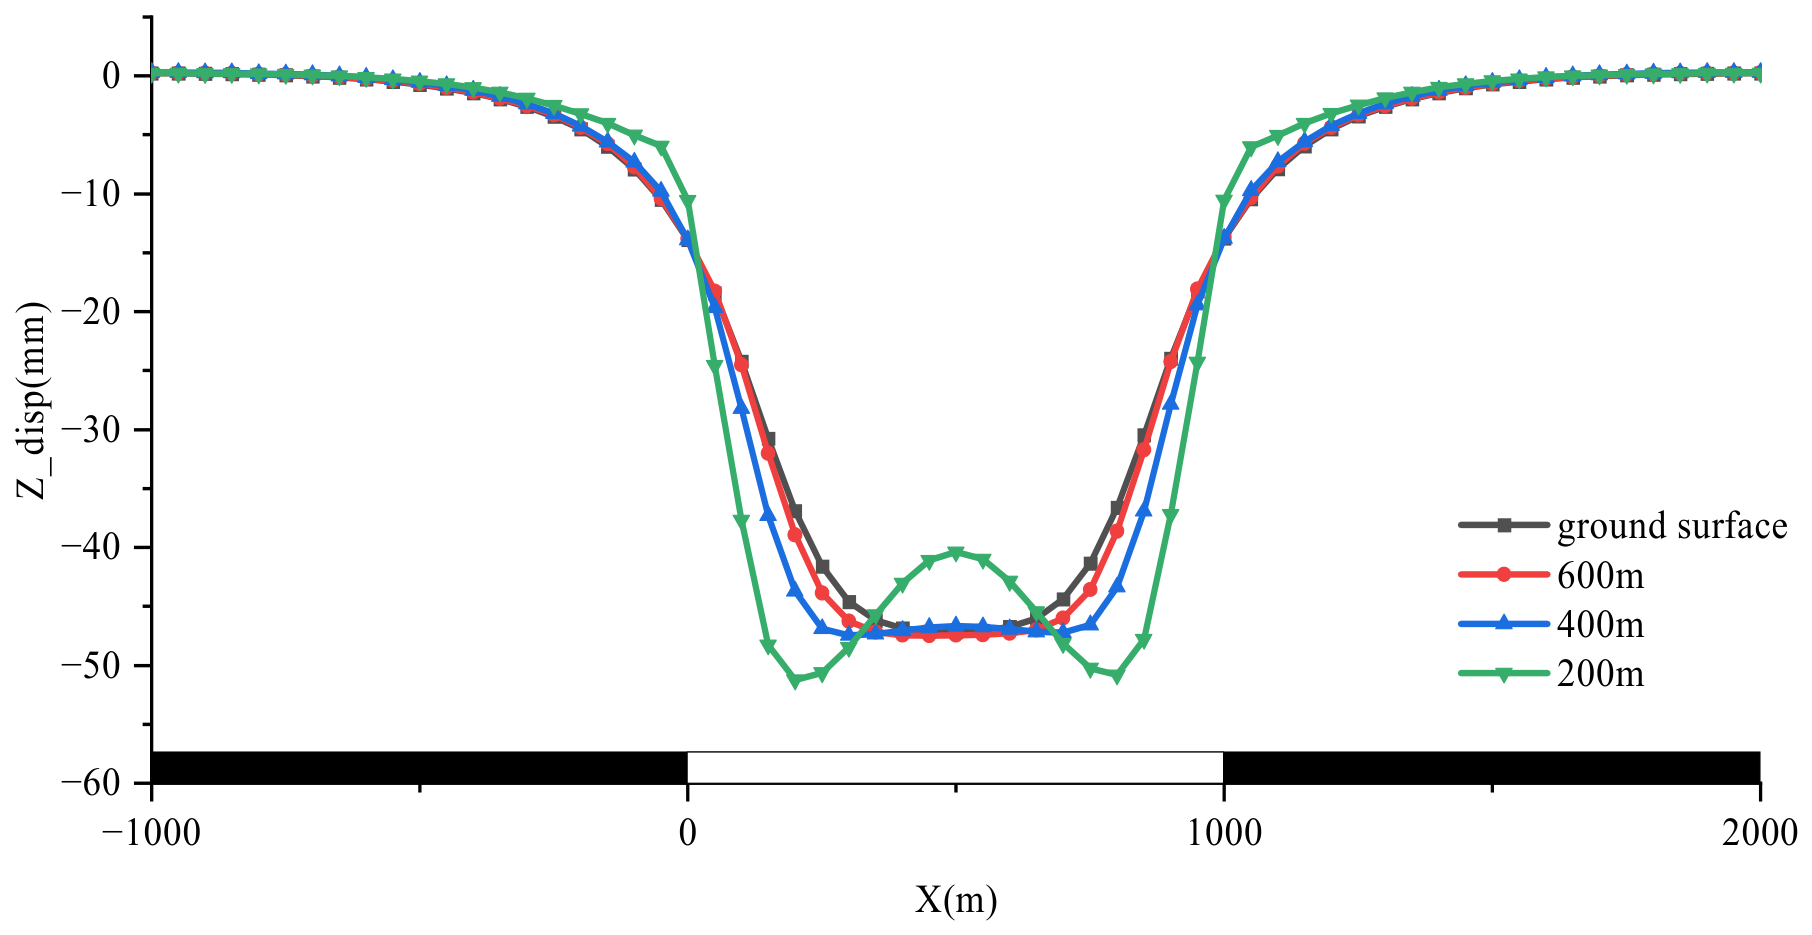
Based on the aforementioned simulation scheme, the deformation of the overburden under the coupled effects of softening and pore water pressure is analyzed. The deformation of the overburden and ground surface at a groundwater level of 50 m is selected for detailed examination. The deformation curve along the strike principal section is shown in
Figure 5.
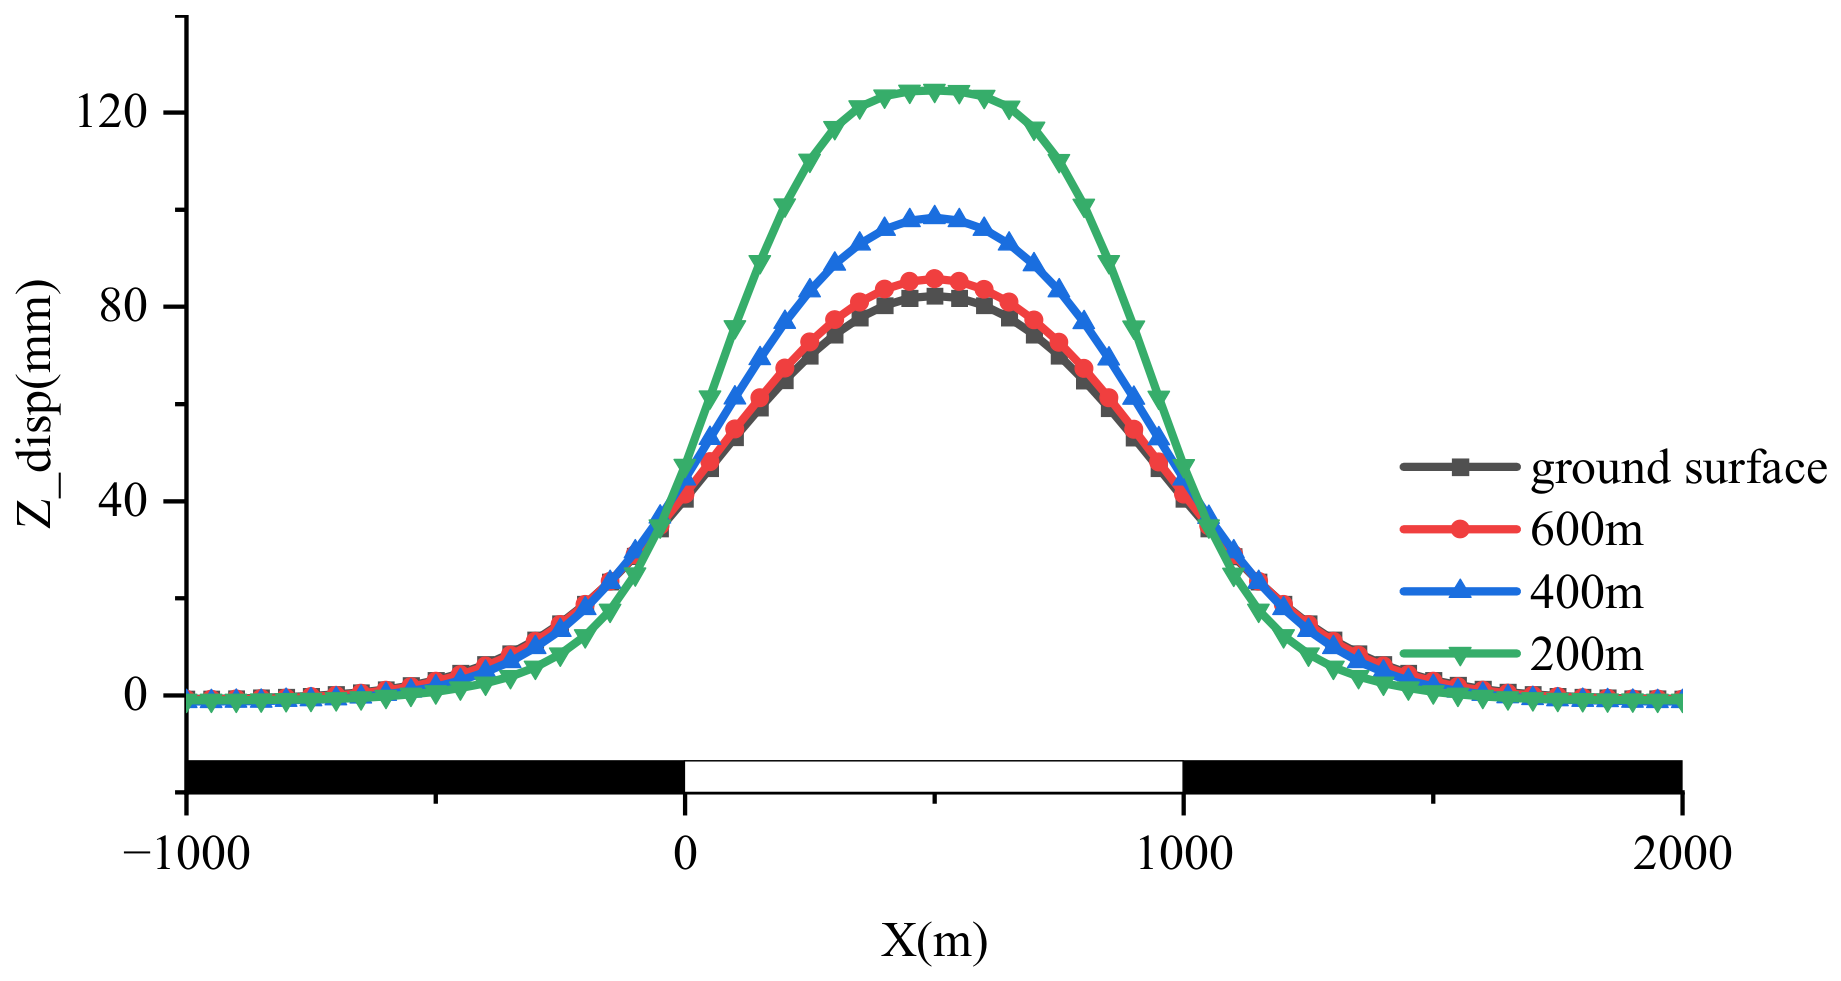
The numerical simulation results indicate that, when the rock mass in the caving zone is subjected to softening and relatively low water pressure, subsidence occurs in rock strata at all elevations. The lower strata show more pronounced subsidence, which is additionally affected by the void space within the goaf during the subsidence process. Meanwhile, the subsidence on both sides compresses toward the center, causing the central zone to exhibit a lower displacement than the two sides. At a groundwater level of 300 m, the deformation curve of the strike principal section is shown in
Figure 6.
The numerical simulation results indicate that, when the rock mass in the caving zone is affected by both softening and relatively high water pressure, uplift occurs in the overburden from the lower to the upper strata, and this uplift gradually diminishes with increasing elevation. This is mainly because the increase in pore water pressure reduces the effective stress, thereby causing volumetric recovery in the lower rock strata. The resulting deformation is then transmitted upward from the bottom, and after being attenuated by the buffering effect of the overlying strata, it eventually reaches the ground surface.
In summary, the deformation of the overburden and the ground surface results from the coupled effects of groundwater-induced softening and pore water pressure. Under their combined action, overburden deformation becomes more complex, and the vertical deformation curves exhibit different patterns. The main reasons are as follows: relatively low pore water pressure slightly intensifies subsidence, whereas relatively high pore water pressure can, to some extent, induce uplift of the overburden. At the same time, groundwater softening of the rock mass further aggravates subsidence. When these two factors act together, uplift of the overburden occurs only when the groundwater level exceeds a certain threshold, at which point the uplifting effect of pore water pressure becomes greater than the subsidence-enhancing effect caused by groundwater softening.
4.4. Analysis of the Transmission Mechanism of Overburden and Surface Deformation Under Groundwater Action
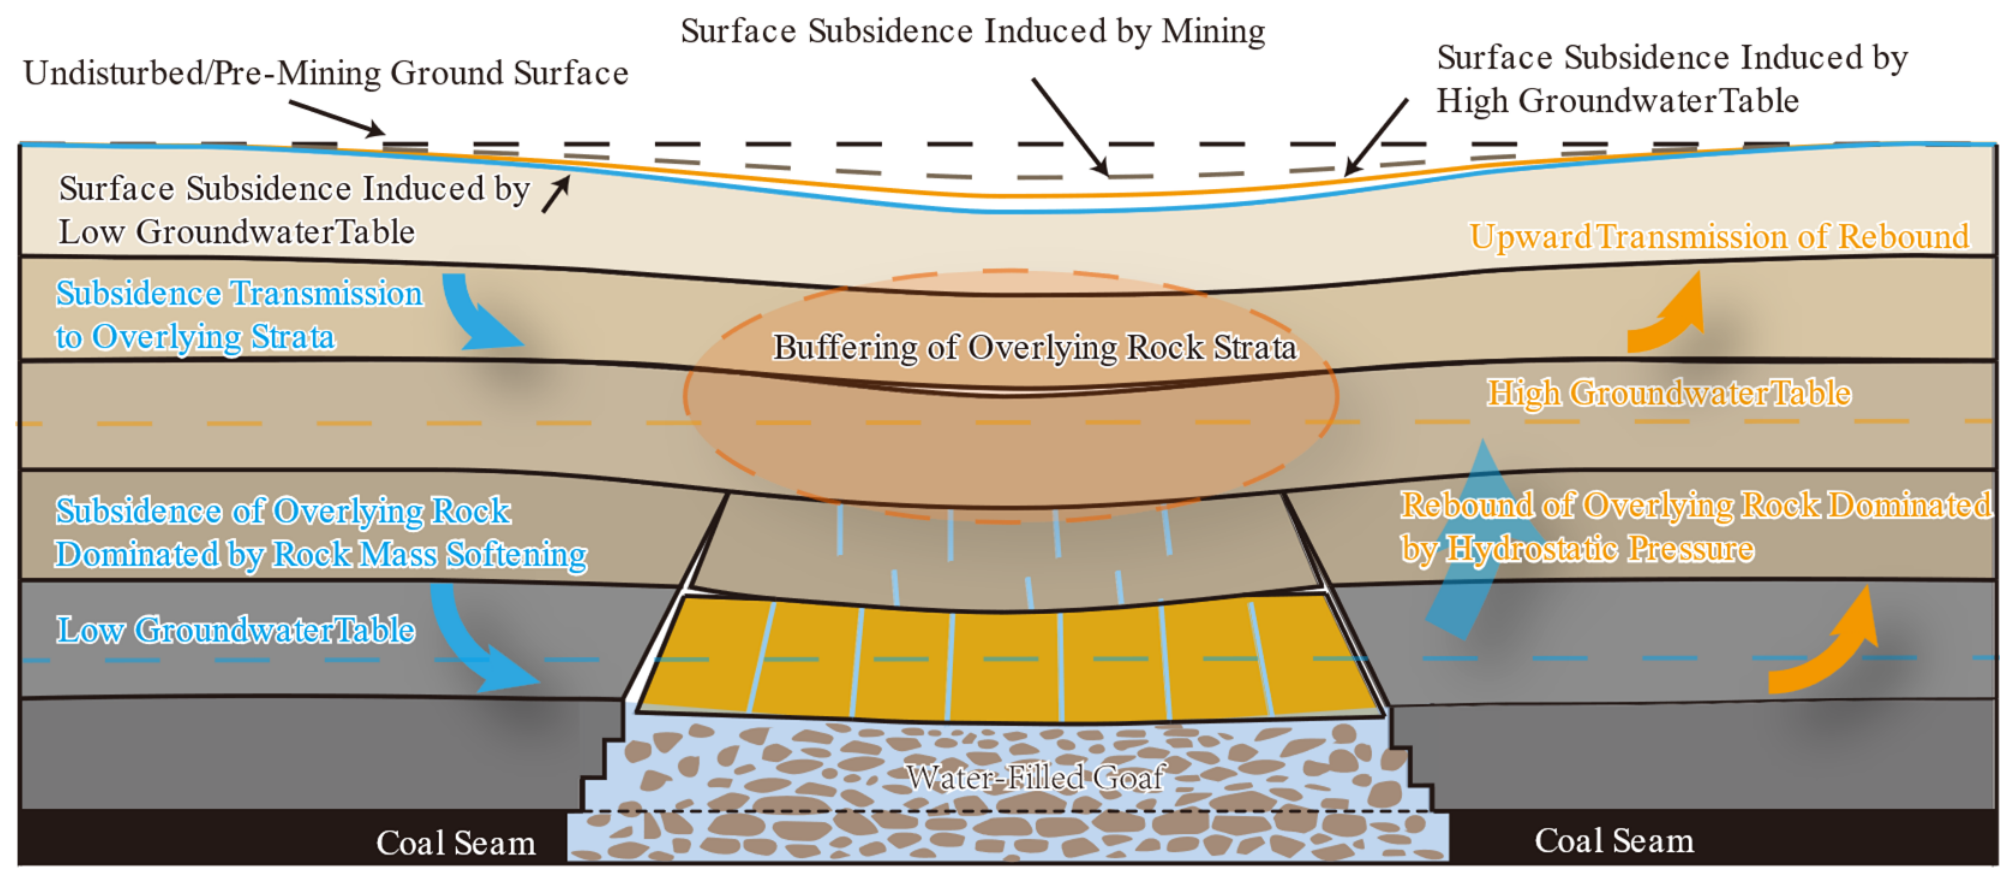
Combined with the summary and analysis of the deformation mechanism of abandoned goafs under groundwater influence presented in the previous section, it can be concluded that, as the groundwater level rises, the initial response is the softening of the rock mass in the caving zone, which plays a dominant role and consequently intensifies the subsidence of the overburden and ground surface. As shown on the left side of
Figure 7, during the early stage of groundwater level rise, water infiltration reduces the strength of the rock mass in the caving zone. Under the action of water, the rock mass undergoes softening and compression, which causes subsidence of the overlying strata and the ground surface.
However, as the groundwater level continues to rise, pore water pressure gradually increases as well. Once it reaches a certain level, the pore water pressure reduces the effective stress of the rock mass, causing volumetric rebound in the caving zone, which is then transmitted upward after attenuation through the overlying strata. As shown on the right side of
Figure 7, with the further rise in the groundwater level, the rock mass in the caving zone gradually recovers, resulting in a relative uplift of the overlying strata and the ground surface.
Regardless of whether the process manifests as intensified subsidence or uplift, deformation is consistently transmitted from the caving zone to the overlying strata and ultimately to the ground surface. Specifically, as the groundwater level changes, its effect on the rock mass within the caving zone is first reflected in softening-induced compression and volumetric rebound, which initially leads to aggravated settlement. With the further increase in pore water pressure, volumetric rebound of the rock mass becomes more pronounced, thereby inducing uplift of the overlying strata and the ground surface. Throughout this process, the influence generated by groundwater-level variation is progressively transmitted upward from the caving zone to the overburden and finally to the surface.
4.5. Analysis of Differences in the Deformation Response of Overburden and Ground Surface Under Groundwater Action
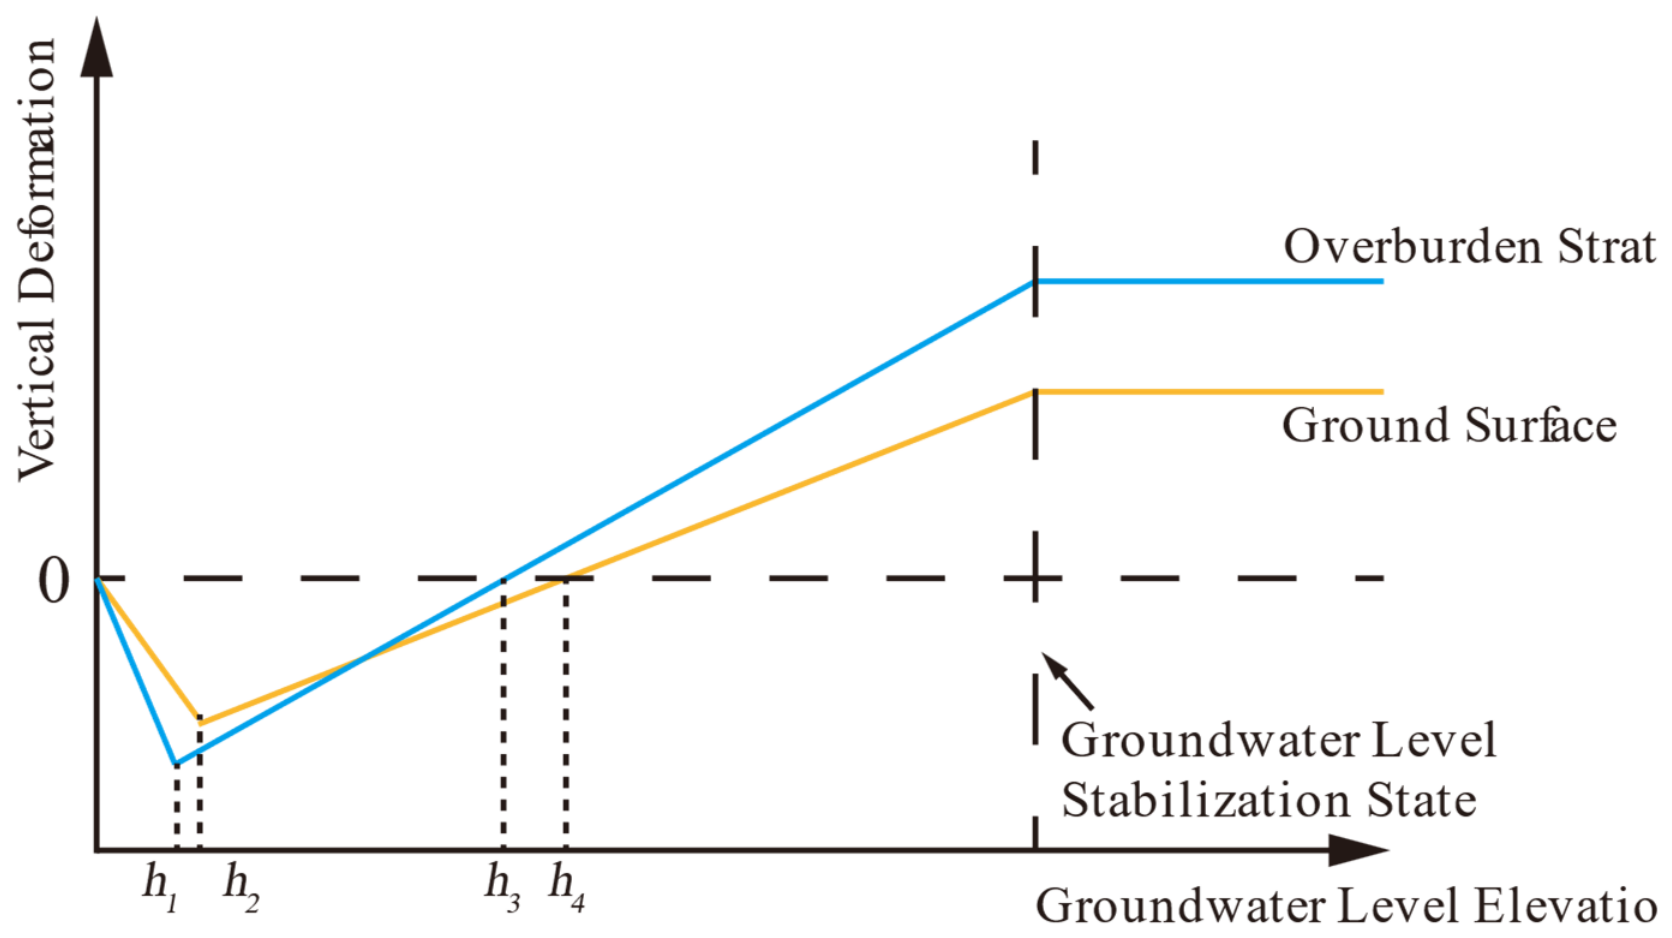
The above analysis indicates that there are clear differences between the deformation responses of the overburden and the ground surface. A rise in groundwater level causes softening of the rock mass in the caving zone, which promotes compaction in this zone. At the same time, it increases pore water pressure and reduces effective stress, thereby inducing rebound of the overburden. At the initial stage, the softening effect is dominant. However, when the groundwater level rises to a certain elevation, the latter effect gradually exceeds the former, resulting in surface uplift. The rebound of the deeper overburden is greater than that observed at the ground surface, indicating that surface uplift exhibits a certain degree of hysteresis. A schematic illustration of this transmission effect is shown in
Figure 8.
The mechanisms and differences in the effects of groundwater level on the subsidence and uplift of the overburden and ground surface above the goaf can be explained through the following stages:
Stage I: Before the groundwater level reaches h1, the strata within the goaf undergo aggravated subsidence due to the coupled effects of groundwater infiltration-induced softening and hydraulic pressure. This is mainly because groundwater alters the properties of the rocks in the caving zone, leading to rock softening, which intensifies the collapse or settlement of the roof strata above the goaf. At the same time, the residual deformation space is further compacted.
Stage II: When the groundwater level exceeds h1 but has not yet reached h2, the hydraulic pressure within the goaf continues to increase. At this stage, the effect of pore water pressure on the strata above the goaf becomes significantly stronger, causing localized uplift of the overburden within the goaf. This uplift occurs because the increase in groundwater raises the pore water pressure in the rock mass, thereby inducing rebound deformation. However, although rebound occurs within a certain range of the overburden above the goaf, the ground surface still remains in a subsiding state. This is because the overlying strata provide a buffering effect, preventing the rebound response of the overburden from being fully transmitted to the surface.
Stage III: When the groundwater level exceeds h2 but remains below h3, the rebound effect is transmitted to the ground surface. Both the overburden and the ground surface exhibit rebound deformation; however, relative to the initial state, the ground surface has not yet shown obvious uplift.
Stage IV: When the groundwater level exceeds h3 but has not yet reached h4, the effect of pore water pressure becomes more pronounced, resulting in evident uplift of the overburden above the goaf. Compared with the condition at the onset of groundwater infiltration, the vertical displacement becomes positive, indicating that uplift of the overburden has occurred.
Stage V: When the groundwater level reaches h4, the uplift effect is transmitted to the ground surface, and surface uplift becomes apparent.
Stage VI: After the groundwater level stabilizes, deformation of both the overburden and the ground surface gradually tends toward stability.
In summary, before the groundwater level reaches h3, an increase in groundwater level first causes subsidence of the overburden. As the groundwater level continues to rise, the overburden gradually rebounds. Once a critical threshold, h3, is exceeded, uplift of the overburden occurs. Similarly, ground-surface deformation is characterized by subsidence before the groundwater level reaches h2, whereas uplift occurs after h2. Compared with the overburden, the surface response shows a certain lag, which is mainly attributable to the buffering effect of the overlying strata.
5. Study on the Law of Residual Surface Deformation Induced by Groundwater Action
5.1. Analysis of the Influence of Groundwater Level on Surface Movement and Deformation Above the Goaf
Based on the above model parameters, this study investigates surface deformation caused by fractured rock masses in the caving zone of the goaf under different groundwater levels. Numerical simulations were carried out for a series of groundwater levels. The water table elevations relative to the coal seam floor were set at 6, 8, 15, 25, 50, 75, 100, 125, 150, 200, 250, and 300 m. The corresponding patterns of surface deformation induced by groundwater-level rise were then analyzed. The origin of the horizontal axis was defined at the goaf boundary, and the positive direction was taken toward the goaf.
5.1.1. Analysis of the Influence of Groundwater Level on Surface Movement Above the Goaf
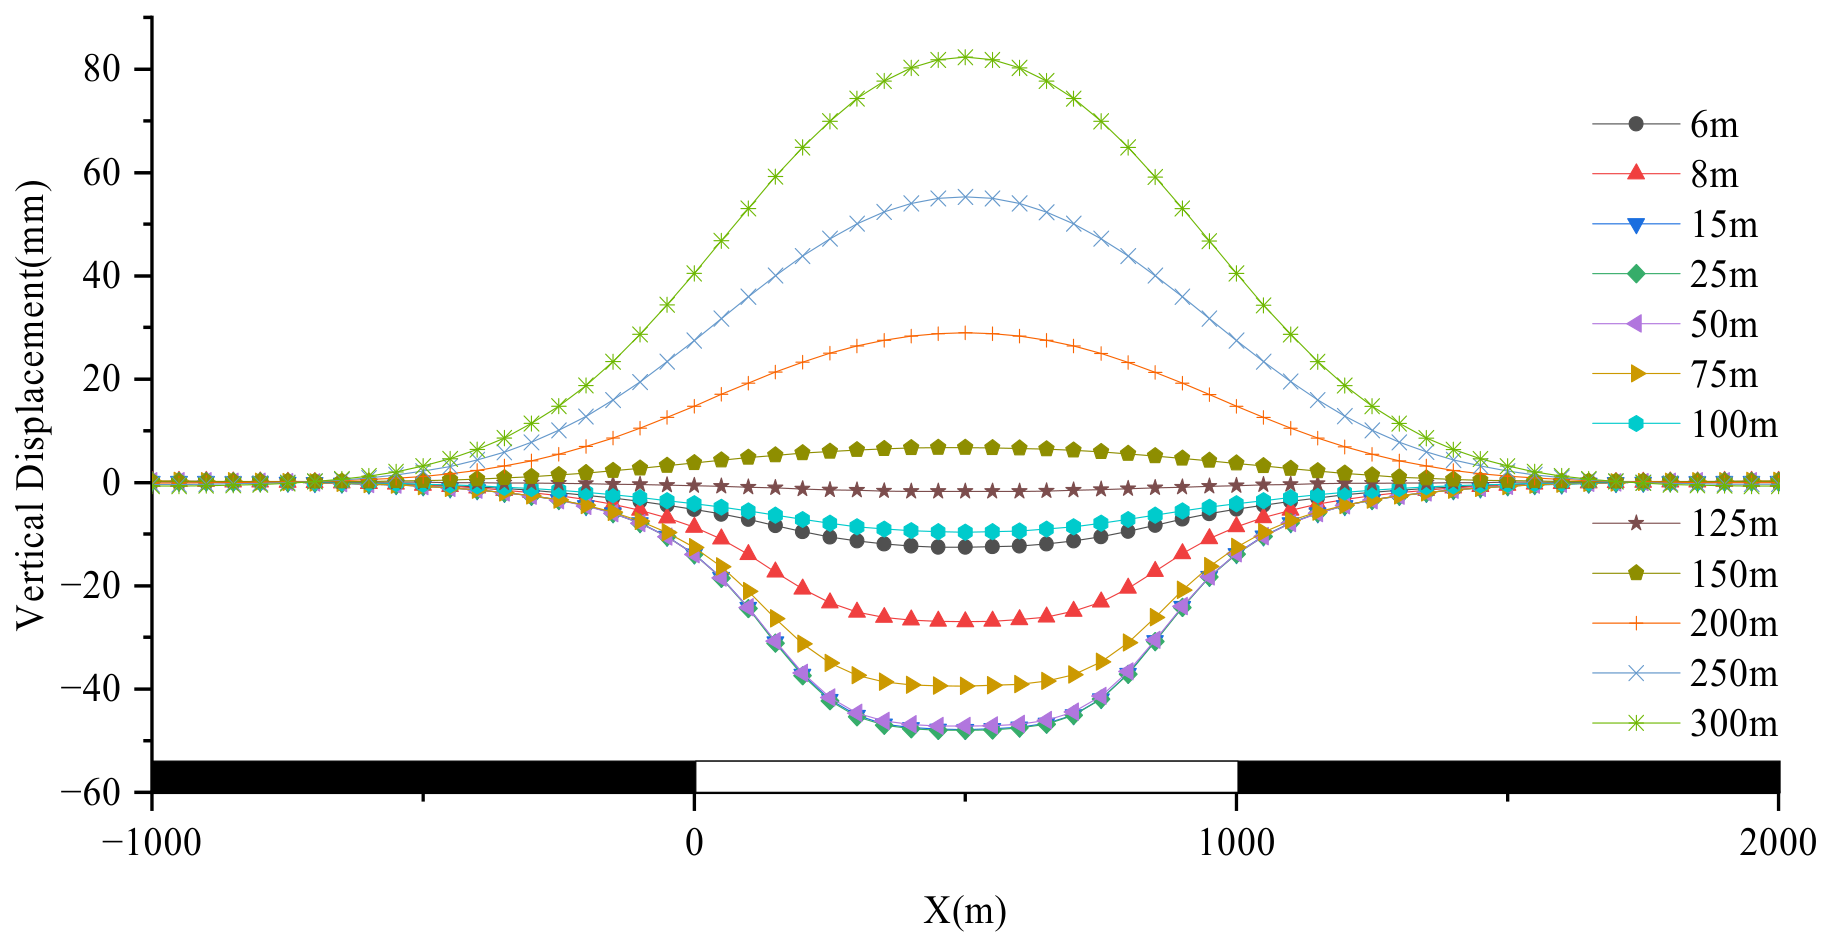
The vertical surface movement and deformation under different groundwater levels are shown in
Figure 9, which is used to analyze the influence of groundwater-level variation on vertical surface movement and deformation.
It can be seen from the figure that the vertical surface movement curve is basically symmetric about the center of the goaf. As the groundwater level rises from 25 m to 300 m, the maximum vertical surface displacement gradually changes from 47.97 mm of subsidence to 82.32 mm of uplift. When the groundwater level increases to between 125 m and 150 m, the maximum vertical displacement progressively decreases to zero, after which surface uplift begins to occur. At the initial stage of groundwater-level rise, water-level variation aggravates surface subsidence. With the continued rise in groundwater level, surface subsidence gradually diminishes and is progressively replaced by uplift. In other words, the vertical surface response evolves from intensified subsidence to gradual uplift. When the groundwater level is relatively low, the surface remains in a subsiding state, with the largest variation occurring near the center of the goaf. Once the groundwater level reaches a certain elevation, surface uplift occurs, and the affected range expands with further increases in groundwater level. This indicates that groundwater-level variation directly influences the stability of the ground surface above the goaf.
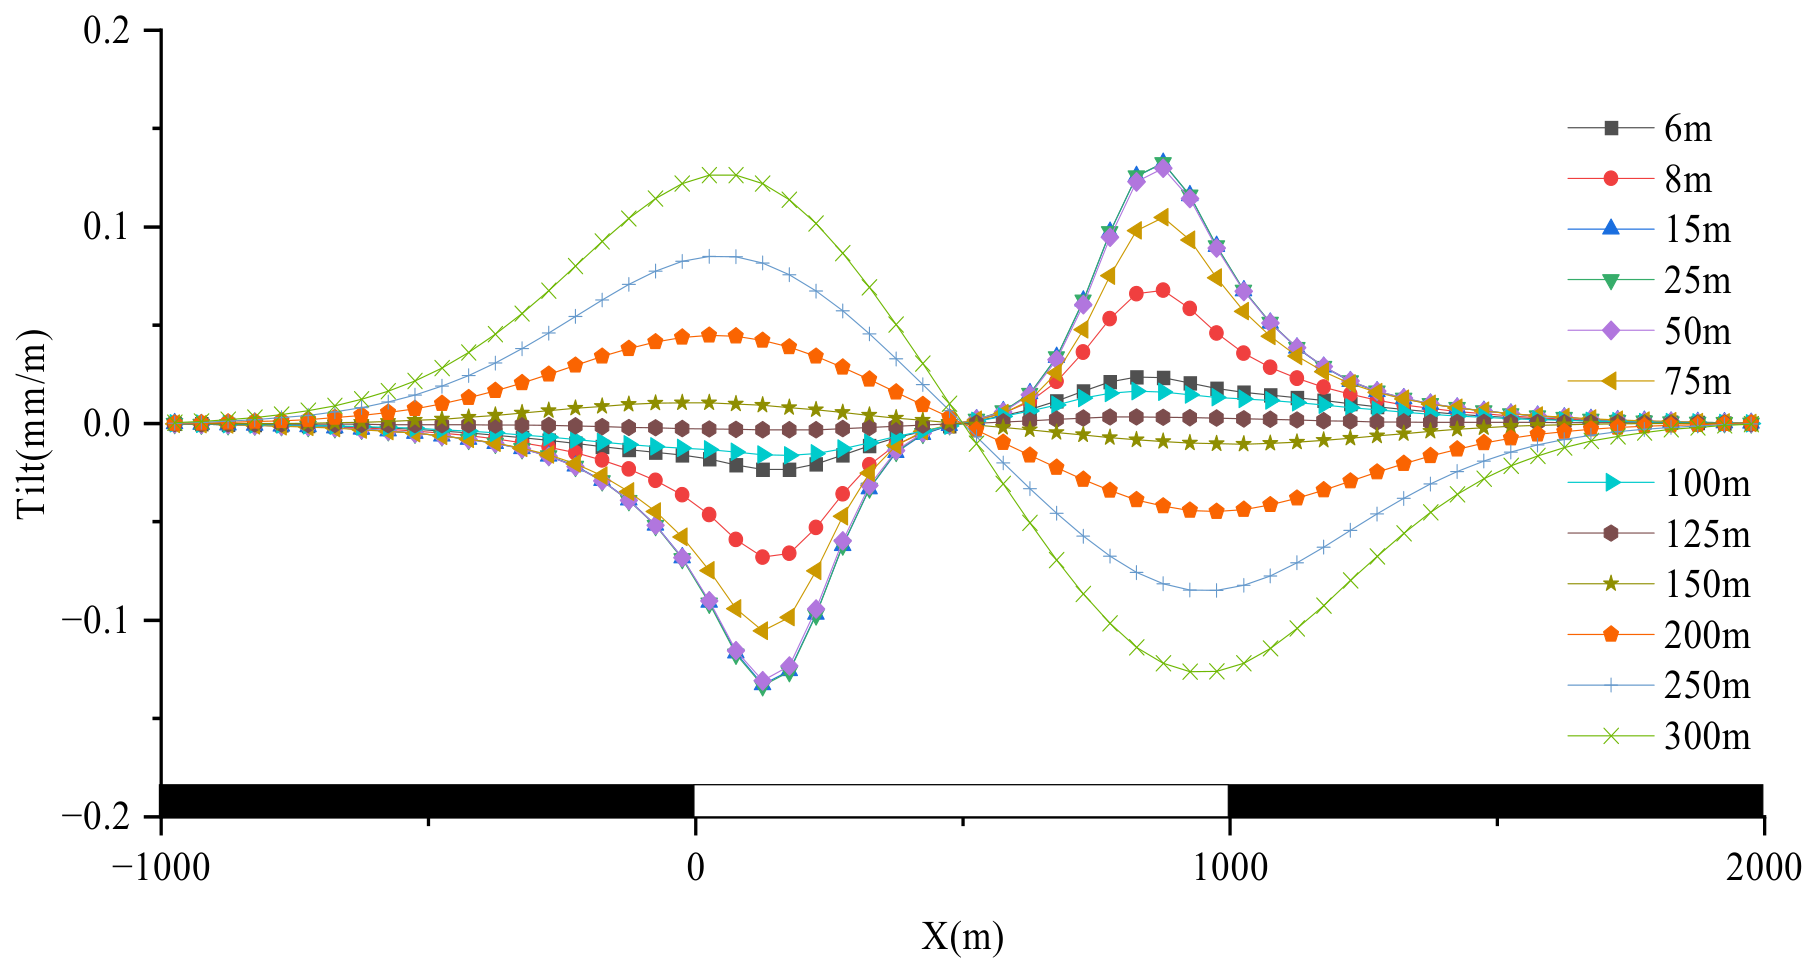
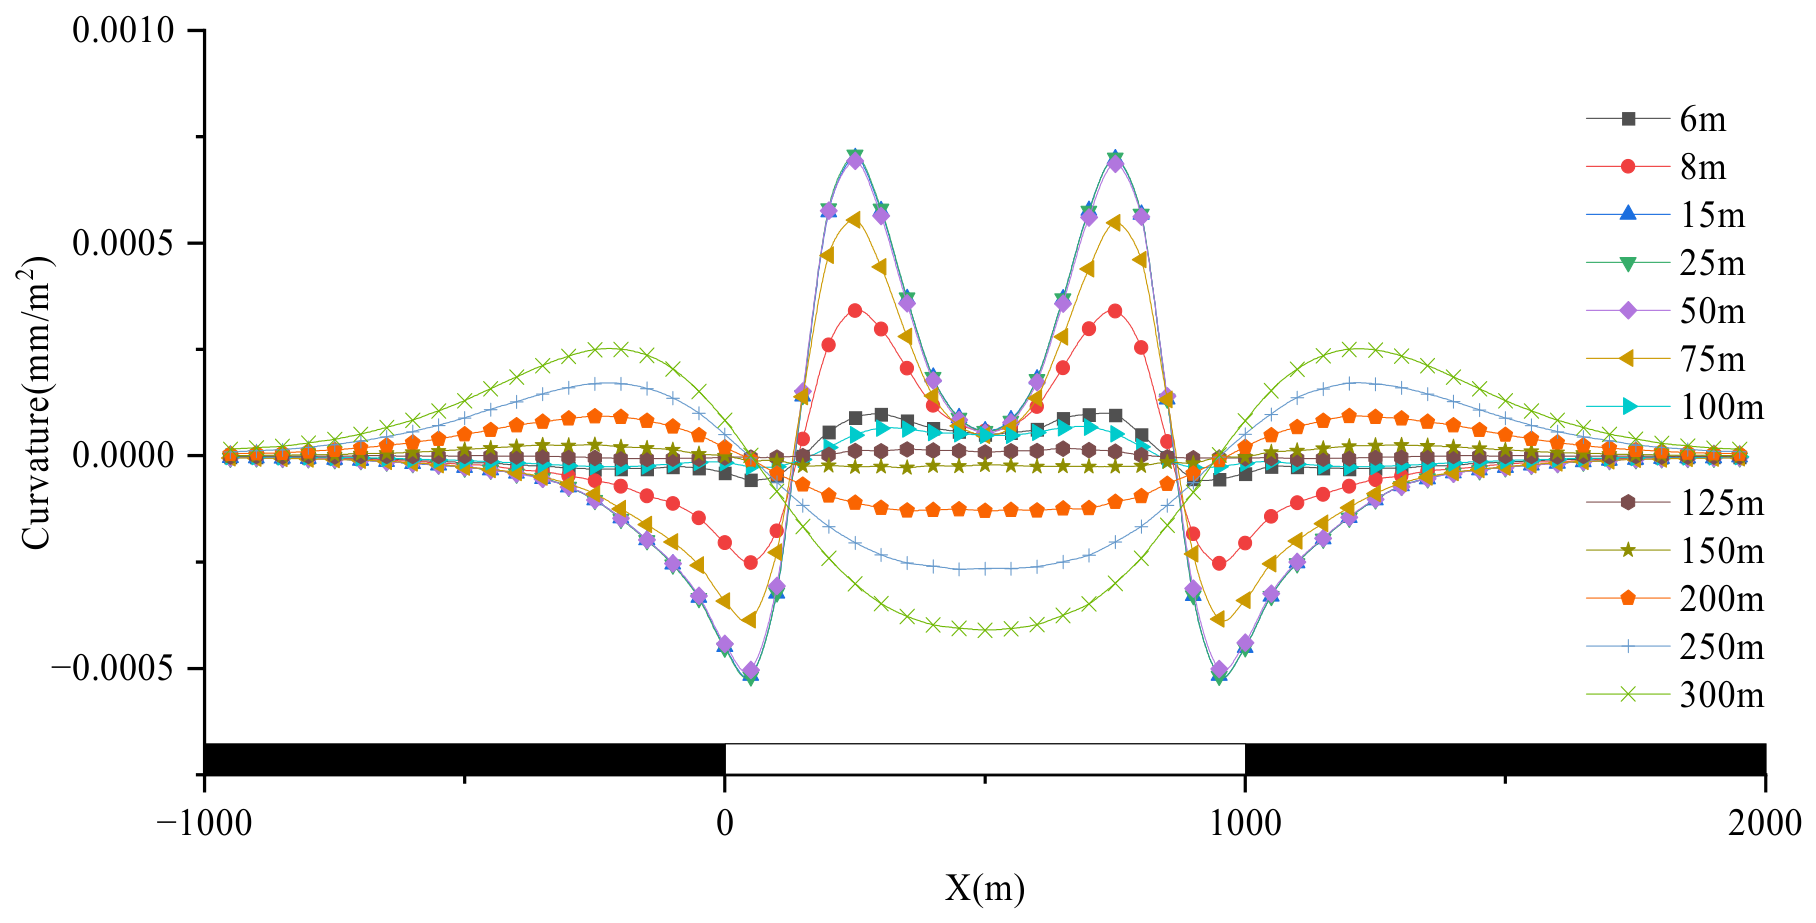
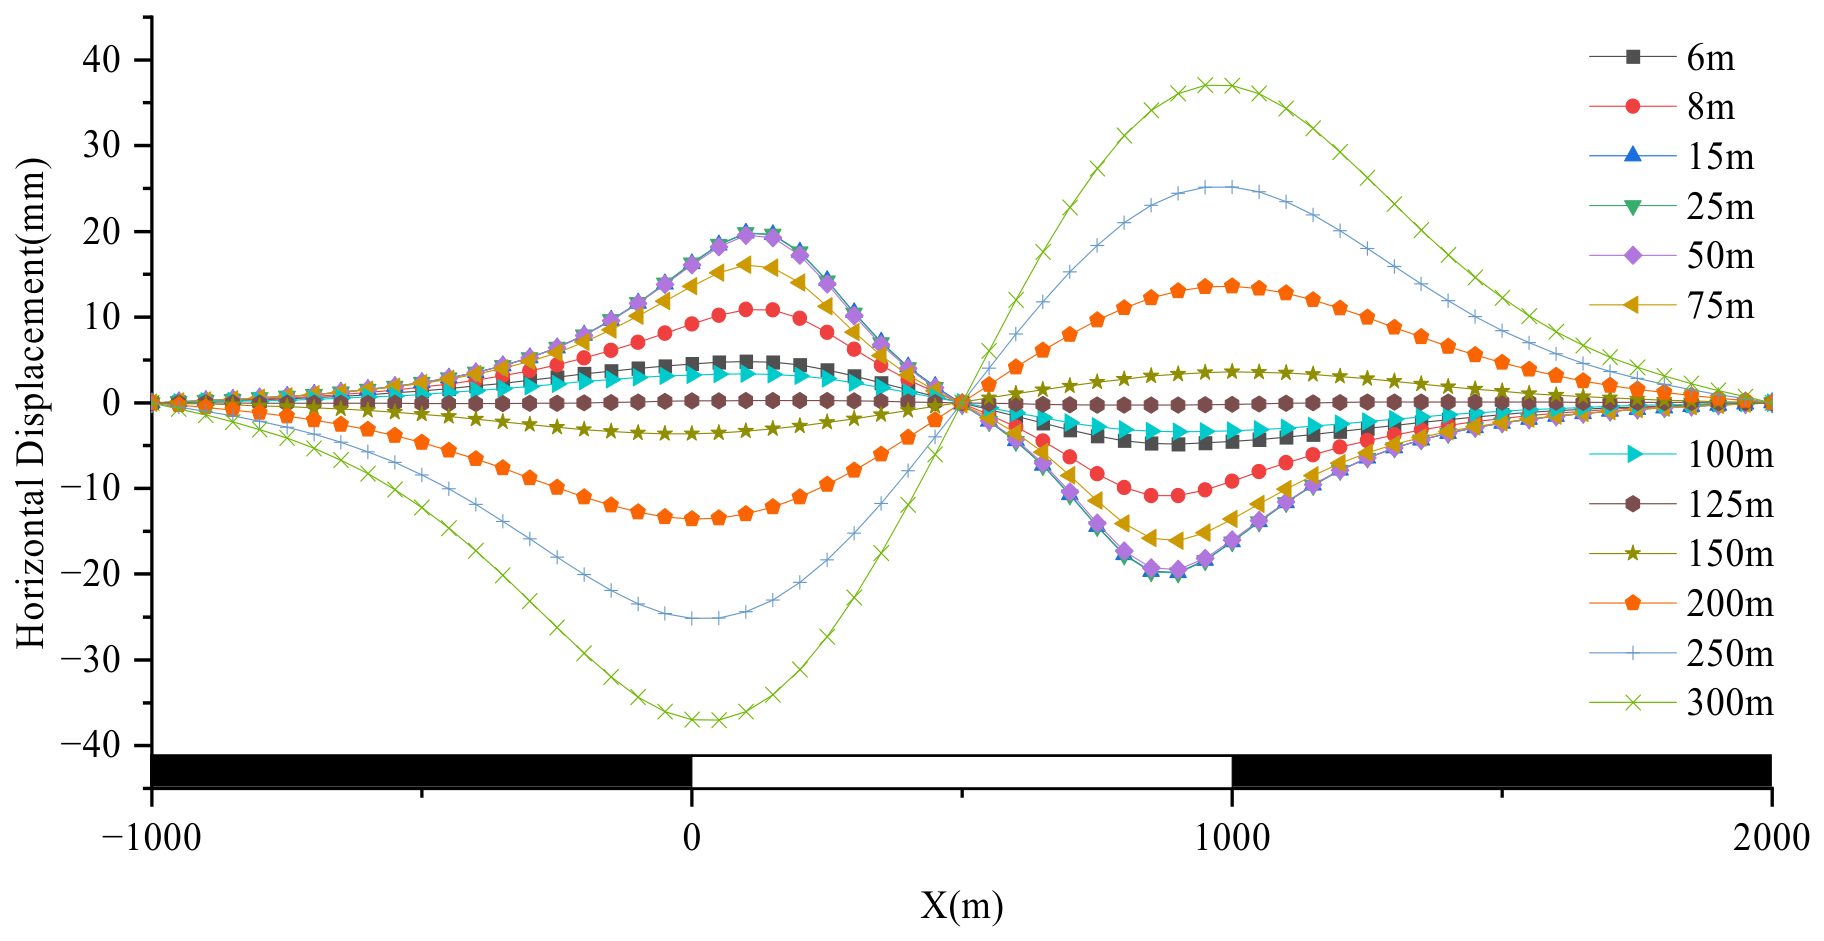
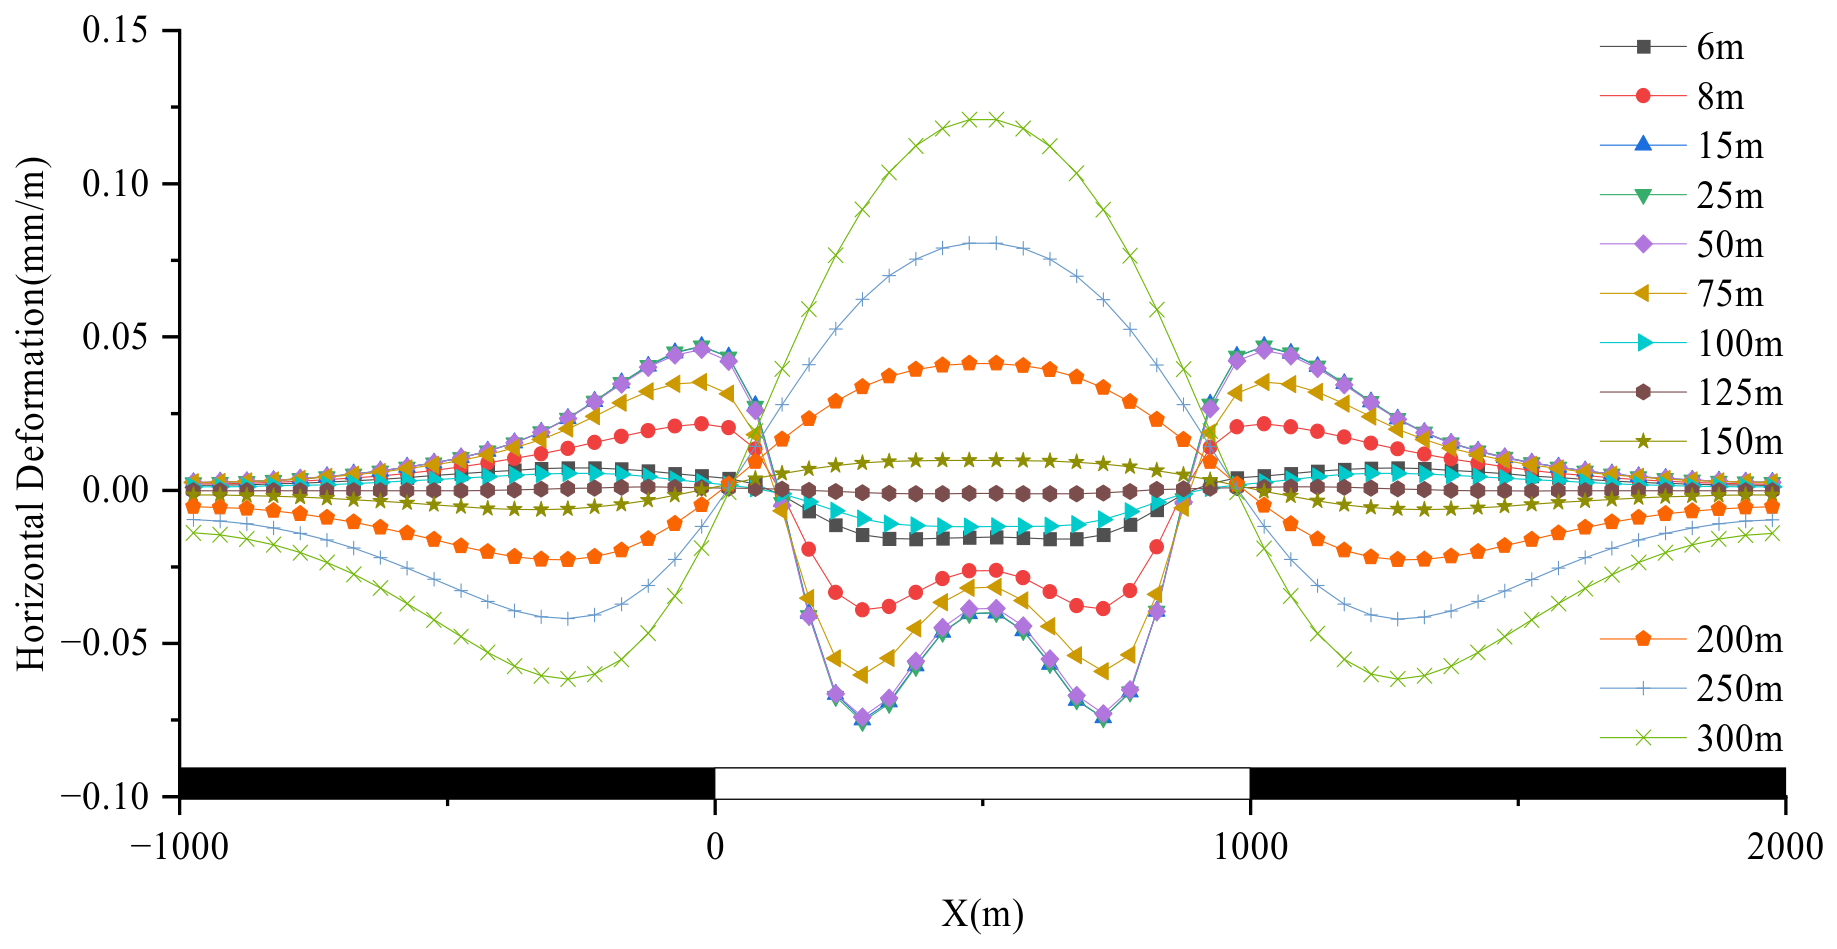
The curves of surface tilt, curvature, horizontal displacement, and horizontal strain under different groundwater levels are shown in
Figure 10,
Figure 11,
Figure 12 and
Figure 13.
The numerical simulation results indicate that the surface tilt exhibits both positive and negative zones under different groundwater levels and is symmetrically distributed about the center of the goaf. Under relatively low and relatively high groundwater levels, the tilt direction at the same location is reversed. As the groundwater level rises, the tilt on one side of the goaf gradually decreases in its original direction and then progressively increases in the opposite direction. Under different groundwater-level conditions, the extreme values of surface tilt occur near the goaf boundary. When the groundwater level ranges from 125 m to 150 m, the overall curve tends toward zero. Before the groundwater level reaches 125 m, the maximum tilt deformation gradually decreases. Once the groundwater level exceeds 150 m, the tilt direction changes and the magnitude of tilt progressively increases.
The numerical simulation results indicate that the surface curvature deformation exhibits distinctly different patterns under different groundwater levels. It can be divided into three main parts: the central region of the goaf and the regions on both sides of the goaf, with an overall distribution symmetric about the center of the goaf. The curvature curves differ significantly under relatively low and relatively high groundwater levels. When the groundwater level is between 125 m and 150 m, the overall curve tends toward zero. Under relatively low groundwater levels, the central region shows positive curvature, whereas both side regions show negative curvature. In contrast, under relatively high groundwater levels, the central region exhibits negative curvature, while the two side regions become positive.
The numerical simulation results indicate that the variation pattern of horizontal surface movement is similar to that of surface tilt deformation. The horizontal surface displacement under different groundwater levels also exhibits distinctly different patterns and can generally be divided into two parts, namely positive and negative zones, with point symmetry about the center of the goaf. Under relatively low and relatively high groundwater levels, the direction of horizontal movement at the same location is opposite. As the groundwater level rises, the horizontal movement on one side of the goaf gradually decreases in its original direction and then progressively increases in the opposite direction. Under all groundwater-level conditions, the maximum horizontal displacement occurs near the goaf boundary. When the groundwater level is between 125 m and 150 m, the overall horizontal movement tends toward zero. Before the groundwater level reaches 125 m, the maximum horizontal displacement gradually decreases. Once the groundwater level exceeds 125 m, the direction of horizontal movement reverses, and its magnitude progressively increases.
The numerical simulation results indicate that the variation pattern of horizontal surface strain is similar to that of horizontal displacement. Surface horizontal strain exhibits distinctly different characteristics under different groundwater levels. It can be divided into three main parts: the central region of the goaf and the regions on both sides of the goaf, with an overall distribution symmetric about the center of the goaf. The curves differ under relatively low and relatively high groundwater levels, whereas the overall curve tends toward zero when the groundwater level is between 125 m and 150 m. Under relatively low groundwater levels, the central region is positive, and the two side regions are negative. In contrast, under relatively high groundwater levels, the central region is negative, and the two side regions are positive.
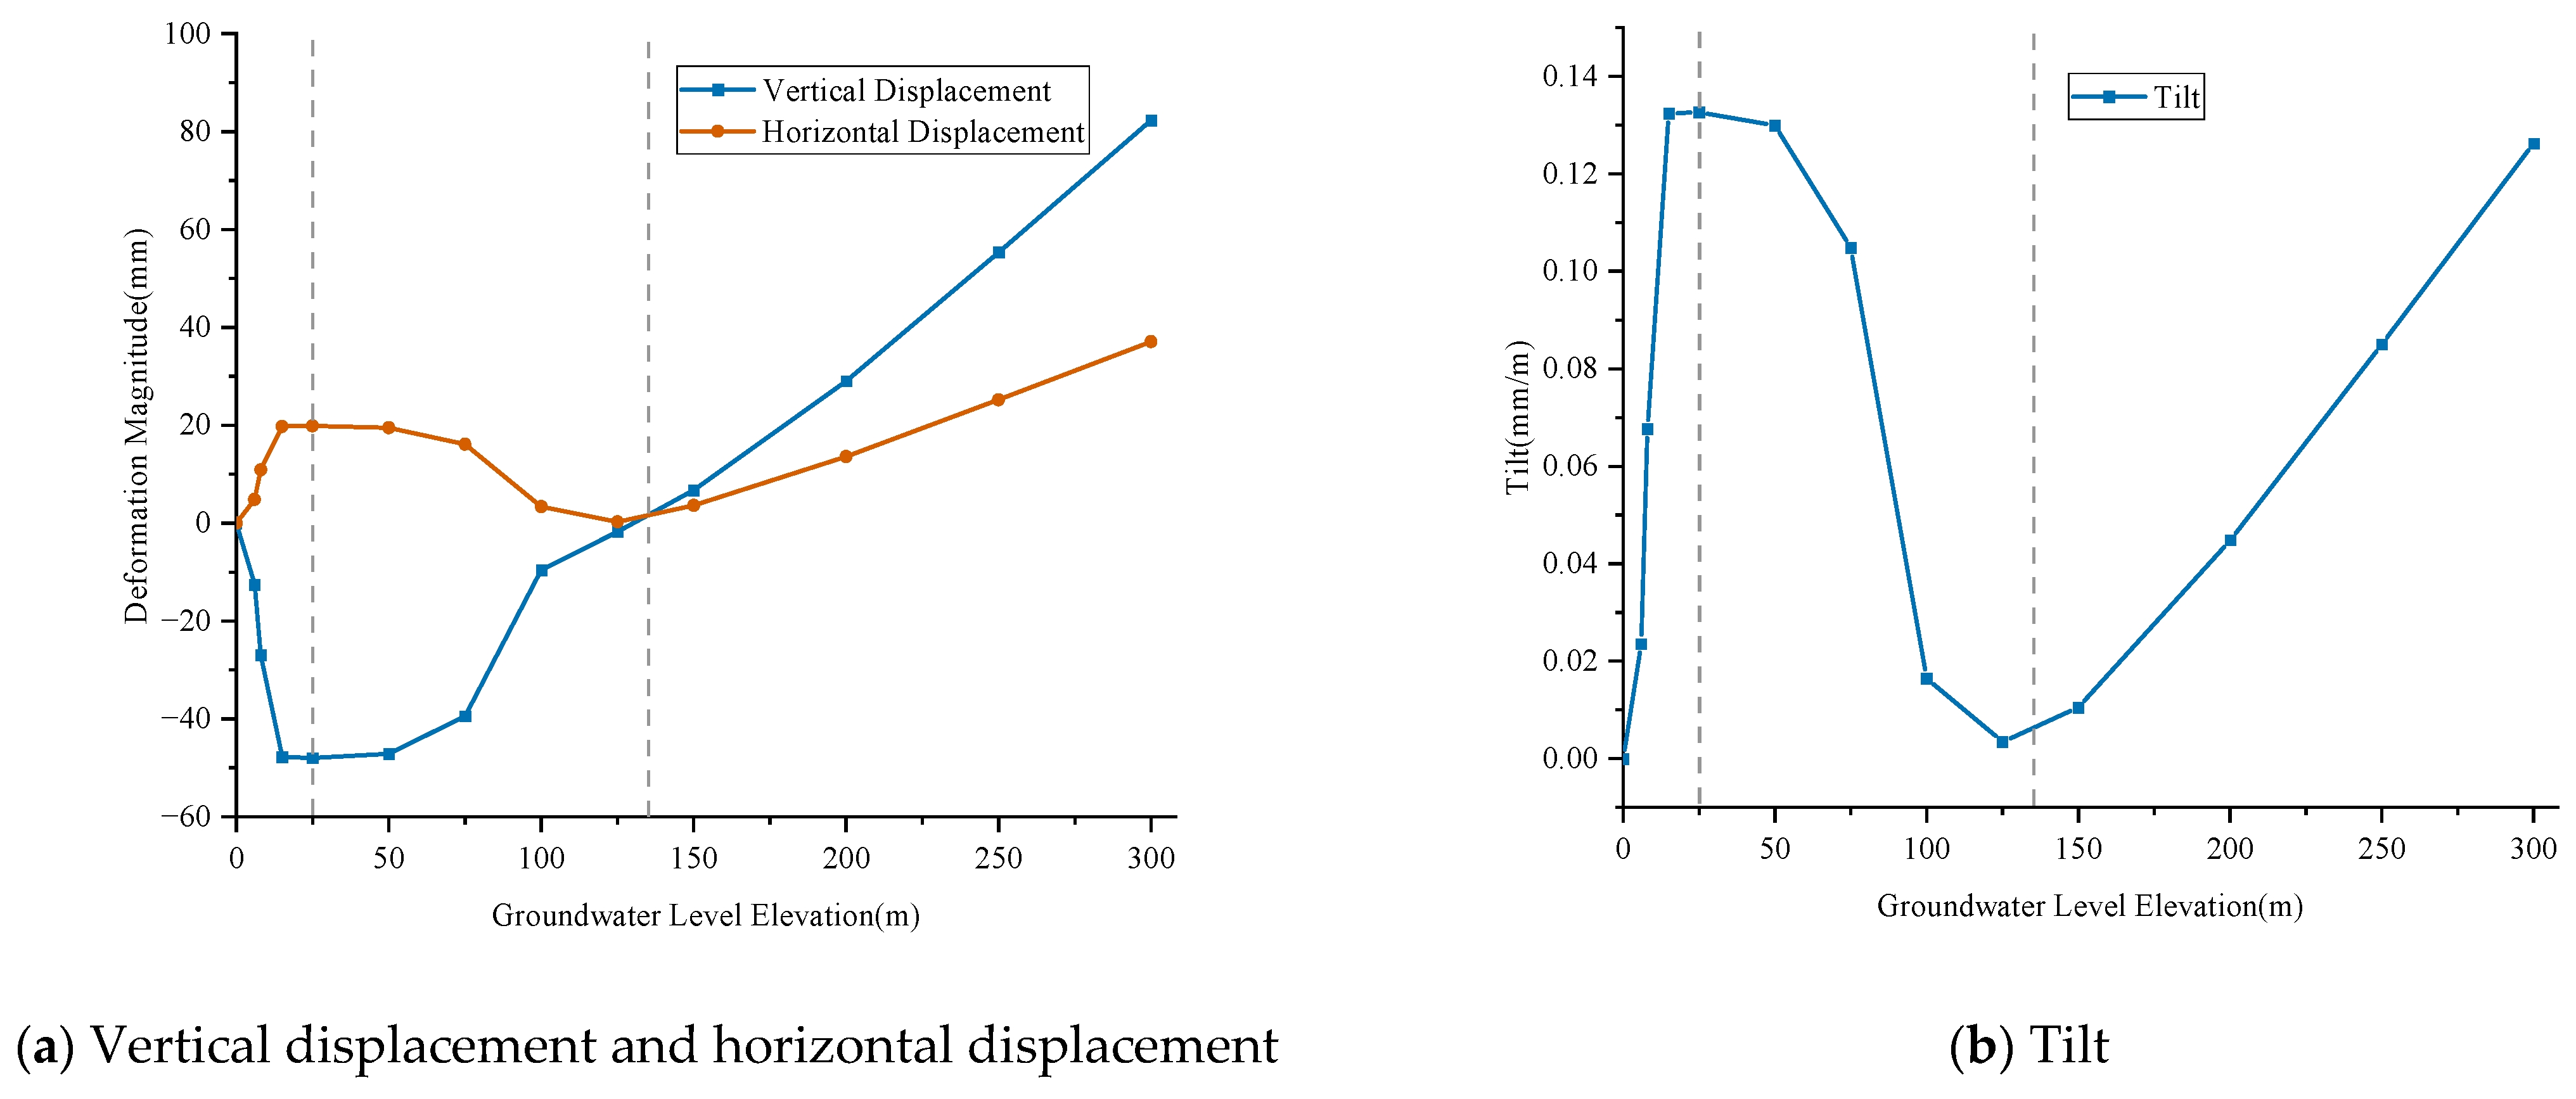
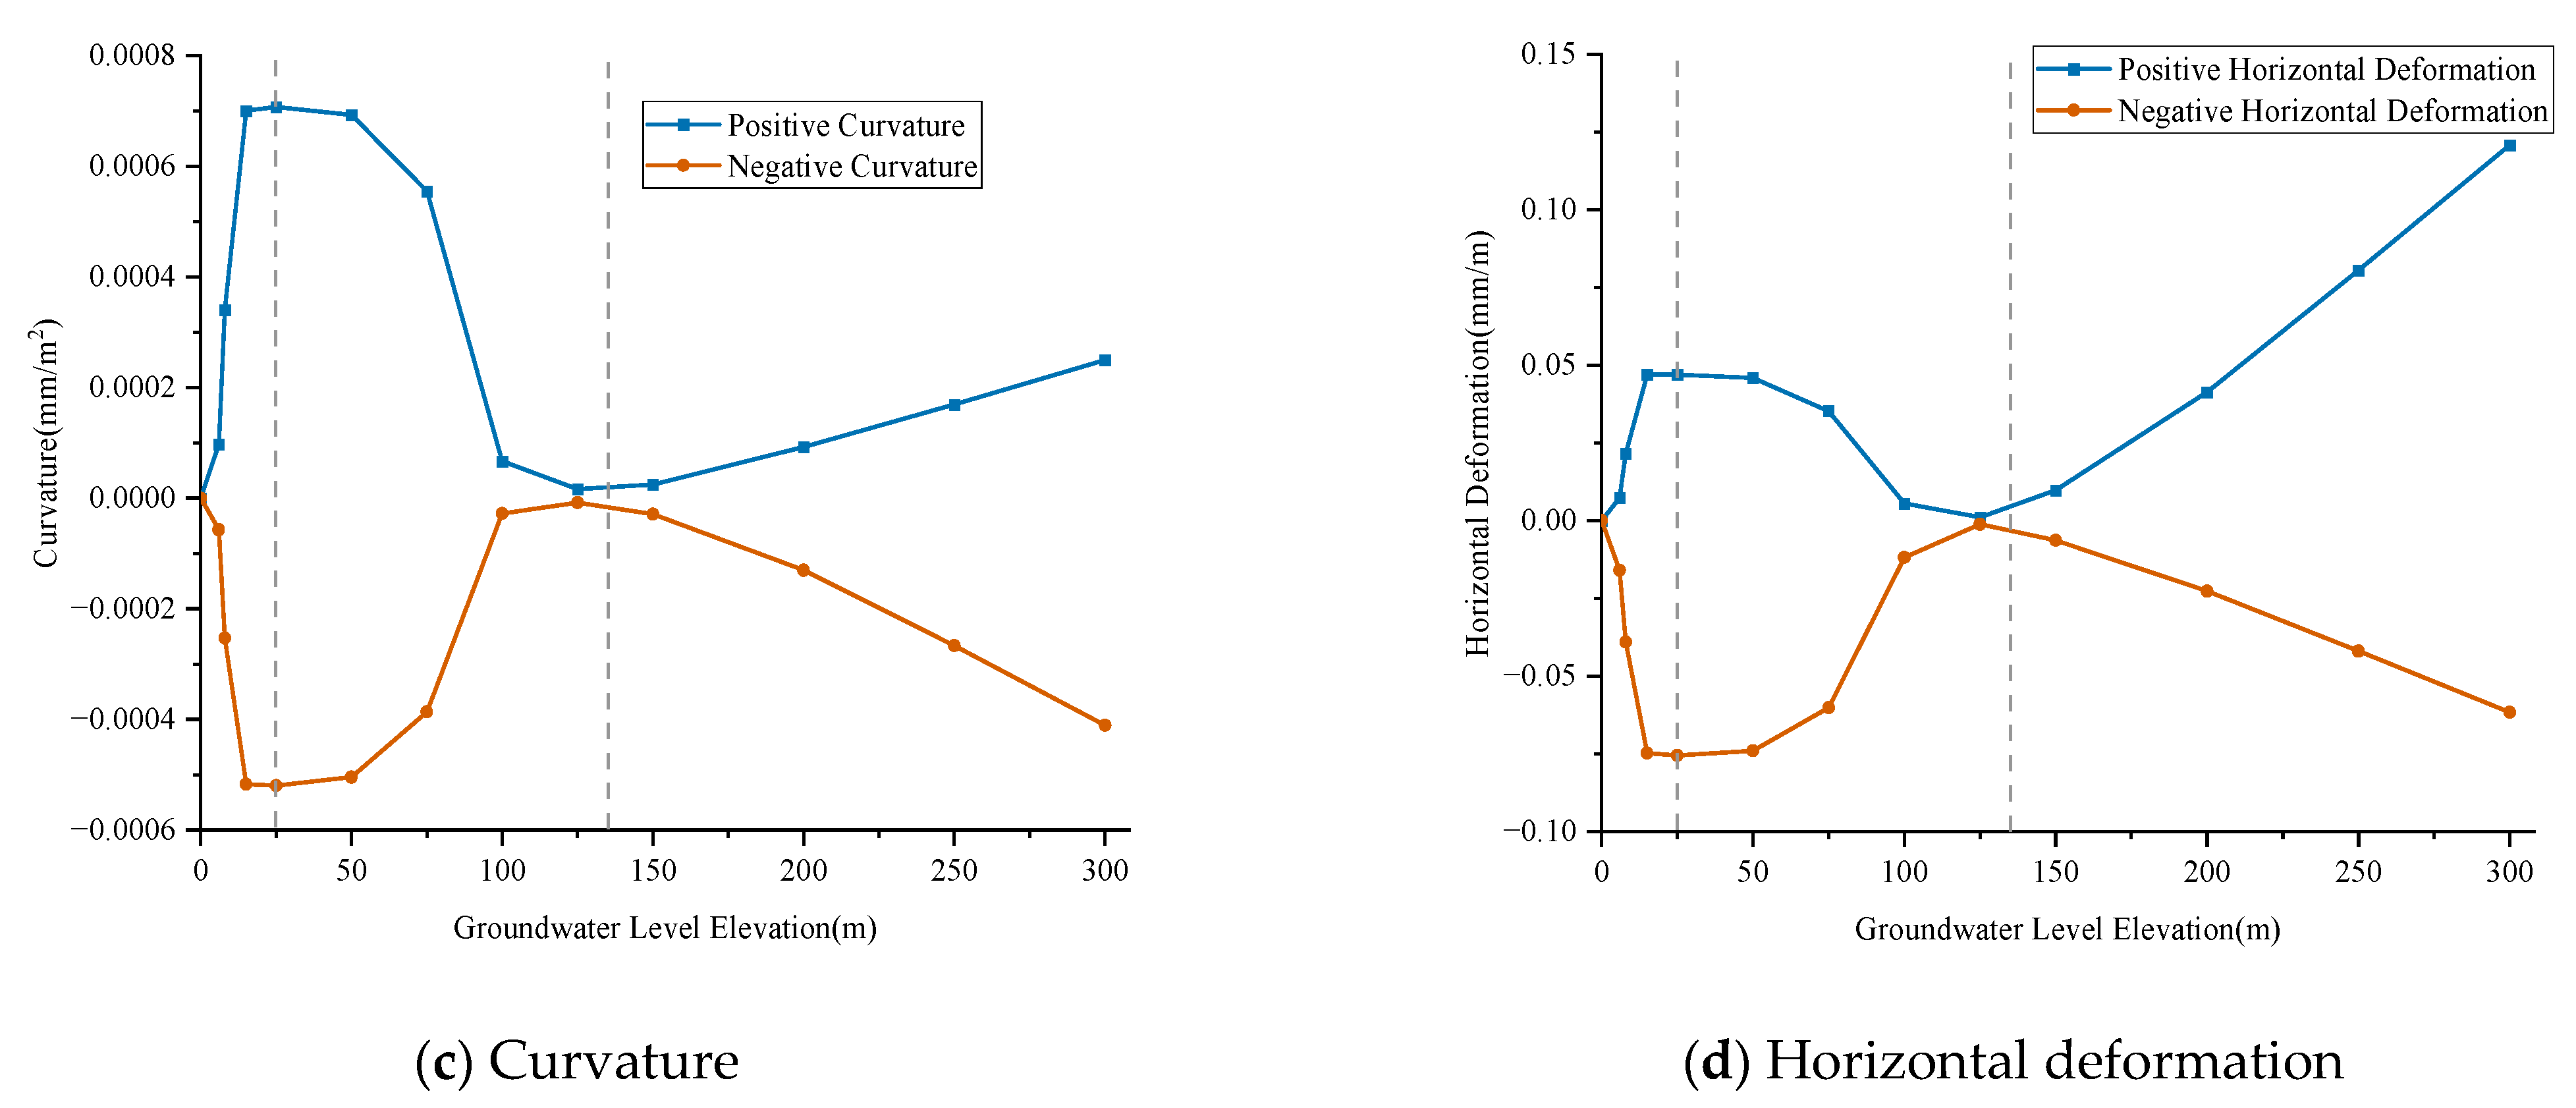
To further investigate the patterns of residual deformation in the abandoned goaf under different groundwater levels, the extreme values of various movement and deformation indices were extracted from the above curves for each groundwater level. On this basis, variation curves relating the extreme values of each deformation index to groundwater level were plotted, as shown in
Figure 14. Here, positive horizontal strain denotes tensile deformation, whereas negative curvature denotes compressive deformation.
The results indicate that the maximum surface vertical displacement, horizontal displacement, tilt, positive curvature, negative curvature, positive horizontal strain, and negative horizontal strain in the study area all exhibit a common trend with increasing groundwater level: they first increase, then decrease, and finally increase again. The turning points of these trends correspond to the stage at which the ground surface reaches its maximum subsidence (the gray dashed line on the left in the figure) and the stage at which the surface begins to transition from subsidence to uplift (the gray dashed line on the right in the figure).
In summary, during the process of groundwater level rise, surface movement and deformation exhibit pronounced variation characteristics. In particular, when the surface reaches maximum subsidence and when it shifts from subsidence to uplift, all categories of movement and deformation indices show corresponding increasing and decreasing trends. The fundamental reason is that the rise in groundwater level causes the ground surface to undergo a deformation evolution from initial subsidence to subsequent uplift.
The extreme values of deformation under different groundwater levels are summarized in
Table 3.
5.1.2. Analysis of the Variation Law of Surface Deformation with Groundwater Level
The above-mentioned pattern of surface deformation induced by groundwater level rise is consistent with the law of surface subsidence observed in the eastern Xuzhou mining area [
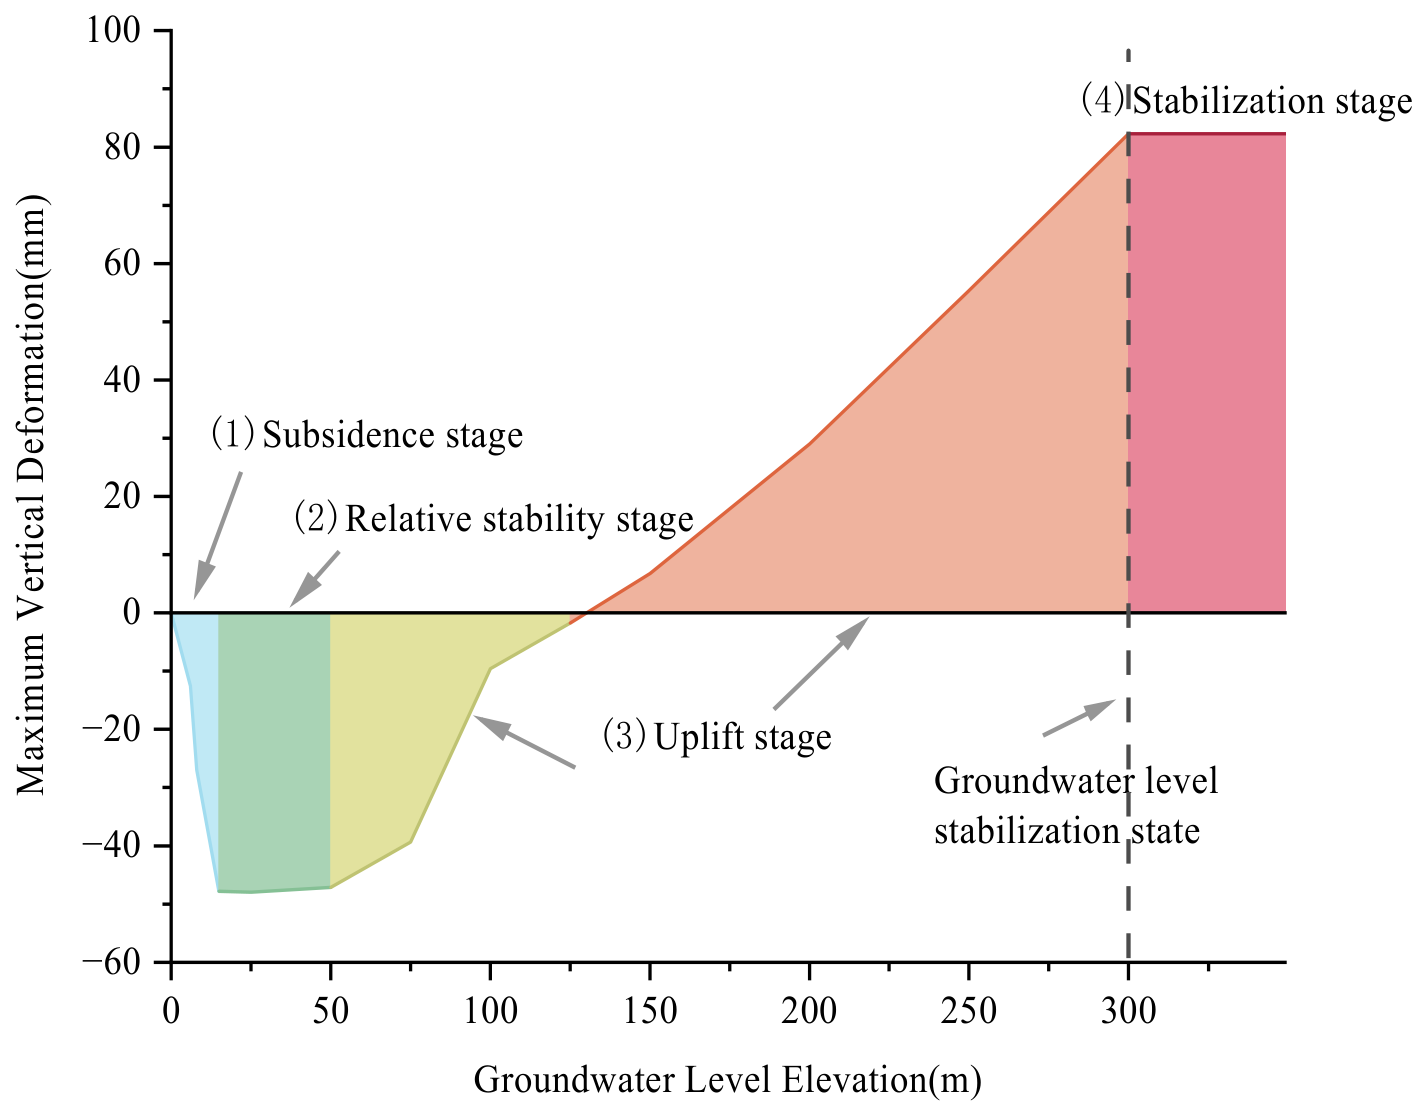
49]. Based on the above analysis of the deformation characteristics, the variation characteristics of the maximum vertical surface displacement with groundwater level are summarized in
Figure 15.
Analysis of the surface deformation evolution indicates that the deformation process above the goaf with increasing groundwater level can be divided into four principal stages: the subsidence stage, relative stability stage, uplift stage, and stabilization stage. This nonlinear deformation pattern indicates that the influence of groundwater on the ground surface above the goaf is not unidirectional. Rather, it represents a cumulative effect that progressively intensifies with changes in groundwater level. The specific characteristics of each stage are as follows:
- (1)
Subsidence stage: This stage is characterized by intensified surface subsidence and represents the initial stage of goaf deformation after groundwater inflow. It mainly results from the further reduction in structural strength of the goaf caused by groundwater infiltration, which redistributes the stress within the overburden and aggravates surface subsidence. At this stage, the groundwater-induced softening effect of the overburden is dominant, whereas the mitigating effect of pore water pressure plays only a secondary role.
- (2)
Relative stability stage: This stage is mainly characterized by the maintenance of a certain degree of stability in the rock mass within the caving zone under groundwater action, with the ground-surface deformation remaining essentially stable. During this stage, subsidence caused by groundwater-induced softening of the overburden enters a relatively stable state, whereas the hydraulic pressure associated with groundwater level rise is still insufficient to break this equilibrium and can only produce limited disturbance. The duration of this stage is related to the groundwater recharge rate.
- (3)
Uplift stage: This stage can be further divided into the uplift recovery stage and the surface uplift stage. In the uplift recovery stage, the ground surface begins to exhibit a certain degree of uplift, but it has not yet recovered to the state prior to groundwater influence. This mainly occurs because the rise in groundwater level increases pore water pressure within the rock mass in the underground goaf, thereby reducing effective stress and promoting volumetric recovery of the rock mass in the groundwater-affected zone, which in turn causes surface uplift. At this point, the effect of pore water pressure gradually approaches that of rock softening. The surface uplift stage is mainly characterized by the actual occurrence of ground-surface uplift. This stage represents the period during which uplift deformation becomes prominent throughout the entire groundwater-action process. It is mainly caused by the continued rise in groundwater level, whereby the effect of pore water pressure exceeds that of softening, inducing rock-mass rebound and consequently causing surface heave.
- (4)
Stabilization stage: This stage is mainly characterized by a stable ground surface. It occurs because the groundwater level tends to stabilize and the overburden reaches a new equilibrium state, after which surface deformation above the goaf also gradually stabilizes. In the absence of other disturbances, the surface will remain stable over time.
Because surface deformation is affected by groundwater level rise, the above phenomena may not necessarily all occur in every case; in some locations, one particular state may persist for a certain period or even remain stable for a long time. Meanwhile, due to the complexity of geological conditions, its critical threshold cannot be directly determined through analytical formulas or numerical simulation methods.
5.2. Analysis of the Influence of Mining Thickness on Surface Movement and Deformation of the Goaf Under Groundwater Action
Variations in coal mining thickness mainly affect the height of the caving zone, thereby altering the range influenced by groundwater. Based on the above model, numerical models with mining heights of 2 m, 3 m, 4 m, and 5 m were established to simulate the patterns of surface change after groundwater intrusion under different mining thicknesses, and to compare the differences in groundwater-induced surface responses under these conditions.
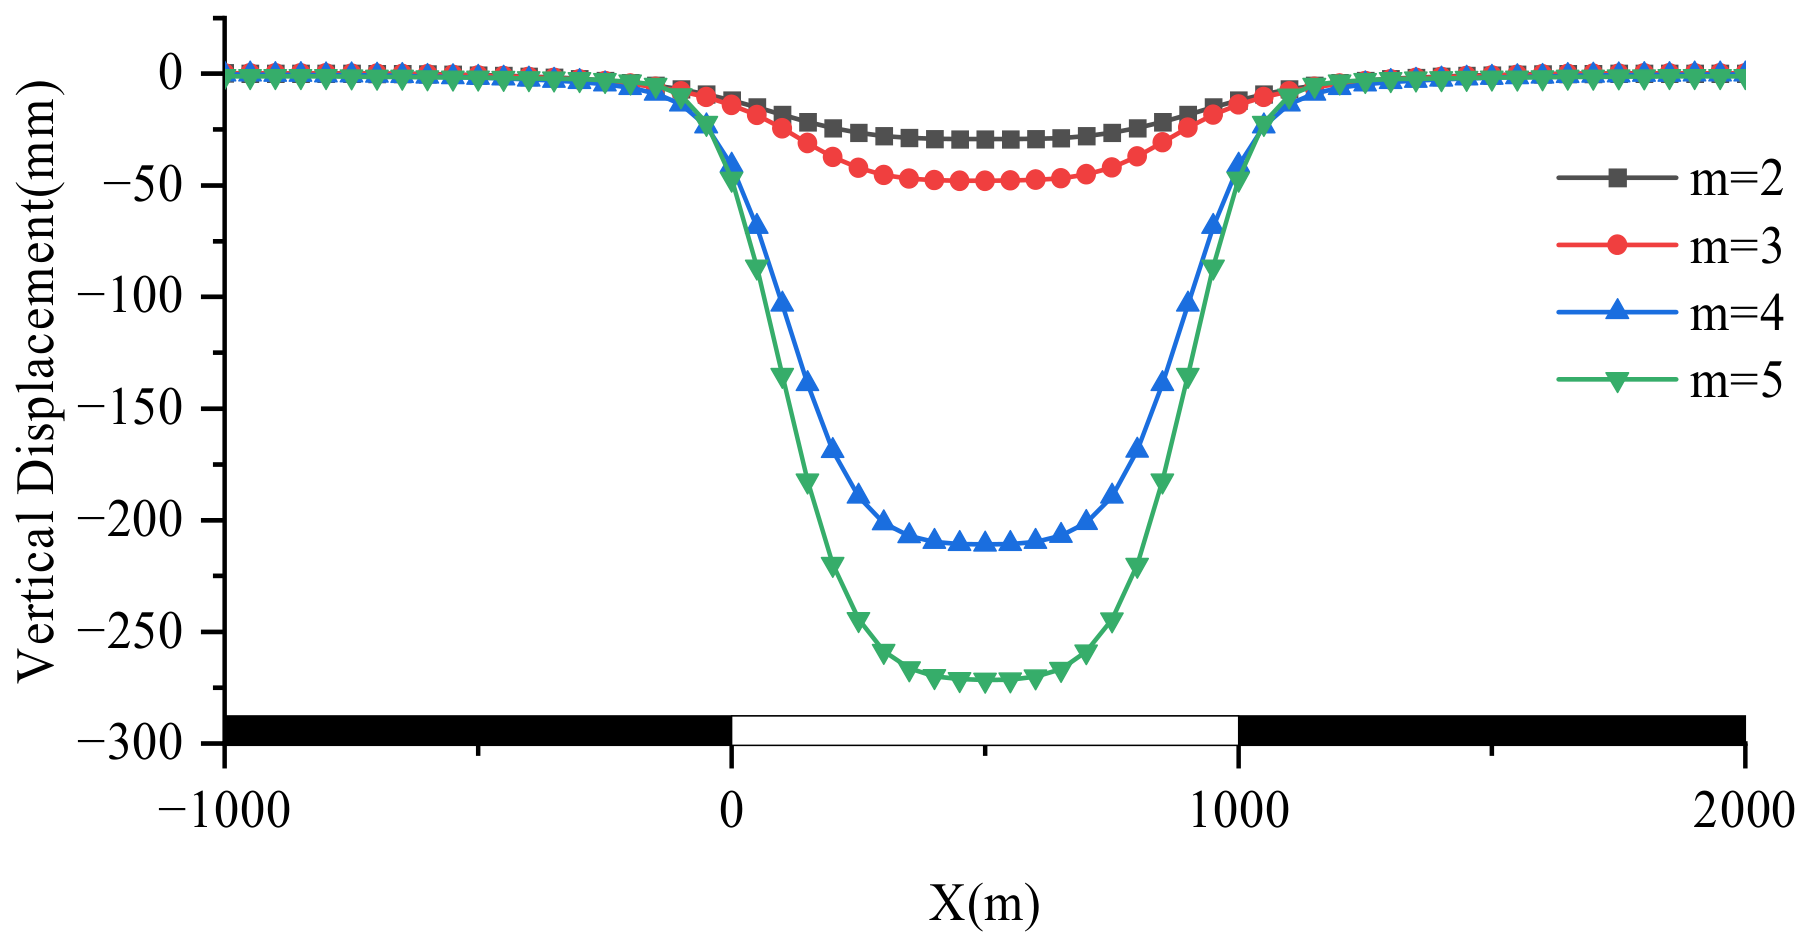
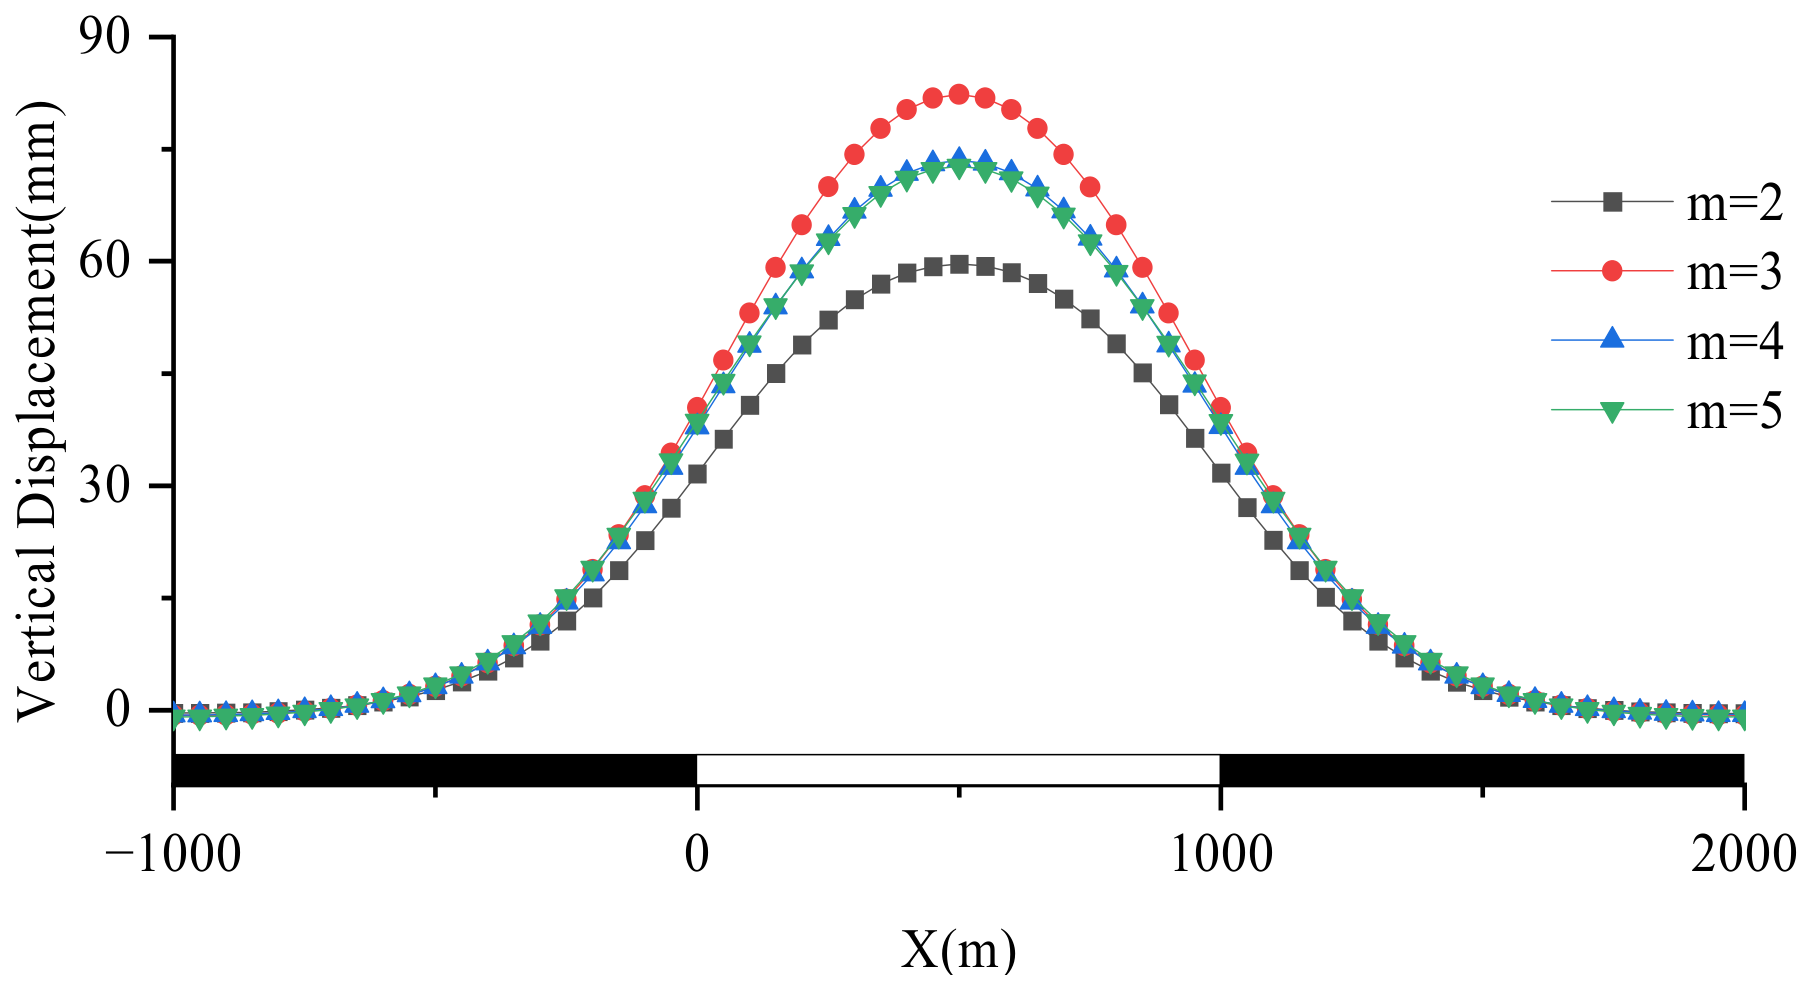
According to the above stage classification of surface deformation induced by groundwater level rise, two key stages are emphasized here, i.e., the subsidence stage and the uplift stage, corresponding to conditions of relatively low and relatively high groundwater levels, respectively. The cases with groundwater levels of 25 m and 300 m were selected as representative conditions for the typical subsidence and uplift stages of the ground surface, respectively, in order to analyze the influence of groundwater on surface movement and deformation above the goaf under different mining heights. The surface movement and deformation for different mining thicknesses at groundwater levels of 25 m and 300 m are shown in
Figure 16 and
Figure 17, respectively.
The numerical simulation results indicate that, under a groundwater level of 25 m, the surface subsidence patterns for different mining thicknesses are generally similar, showing a clear trend that greater mining thickness results in greater subsidence. Because the subsidence factors under the equilibrium mining condition differ for each mining thickness in the model, the compaction space within the goaf also differs, which in turn exerts a certain influence on surface deformation. In addition, the height of the caving zone varies with mining thickness, meaning that the ranges affected by rock-mass softening and pore water pressure are also different. As a result, during this stage, greater mining thickness leads to more pronounced surface subsidence.
The numerical simulation results indicate that, under a groundwater level of 300 m, the surface uplift patterns for different mining thicknesses are broadly similar, all exhibiting a convex profile with uplift concentrated in the central area. However, the trend of groundwater-induced surface uplift with increasing mining height is not obvious. This is because the groundwater-level threshold required to trigger surface uplift differs for coal seams of different thicknesses, resulting in different uplift responses under groundwater action. In addition, for coal seams with greater mining thickness, the residual subsidence space is relatively larger. After groundwater intrusion, this residual space may undergo further compaction, thereby affecting the magnitude of uplift.
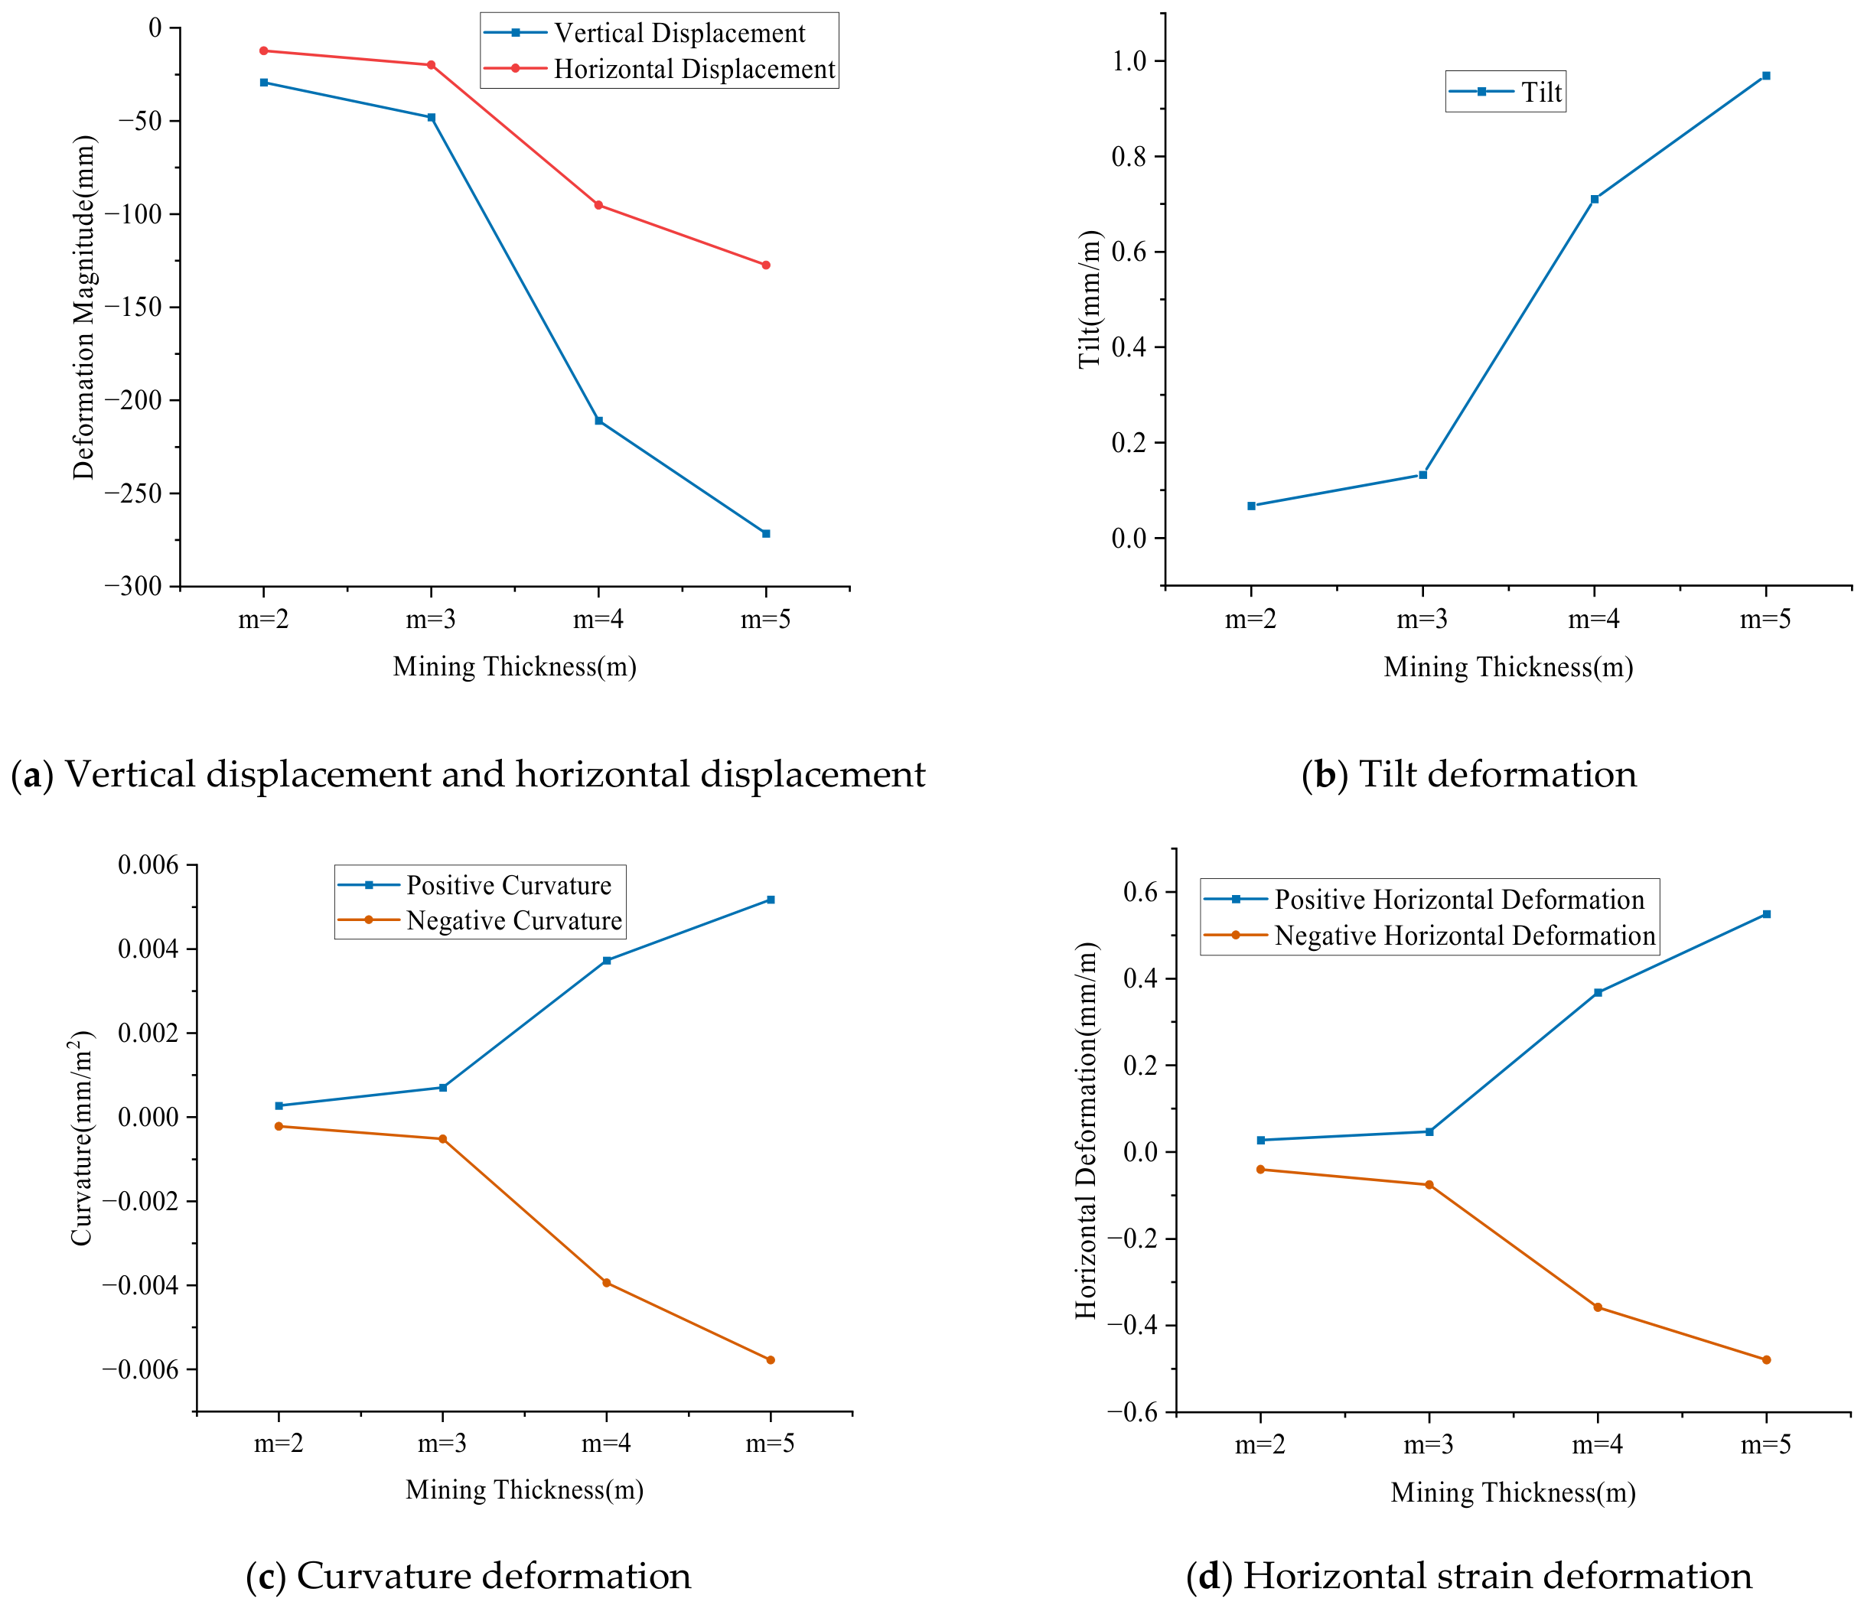
The extreme values of various surface movement and deformation indices under different mining thicknesses at a groundwater level of 25 m were extracted for analysis, as shown in
Figure 18.
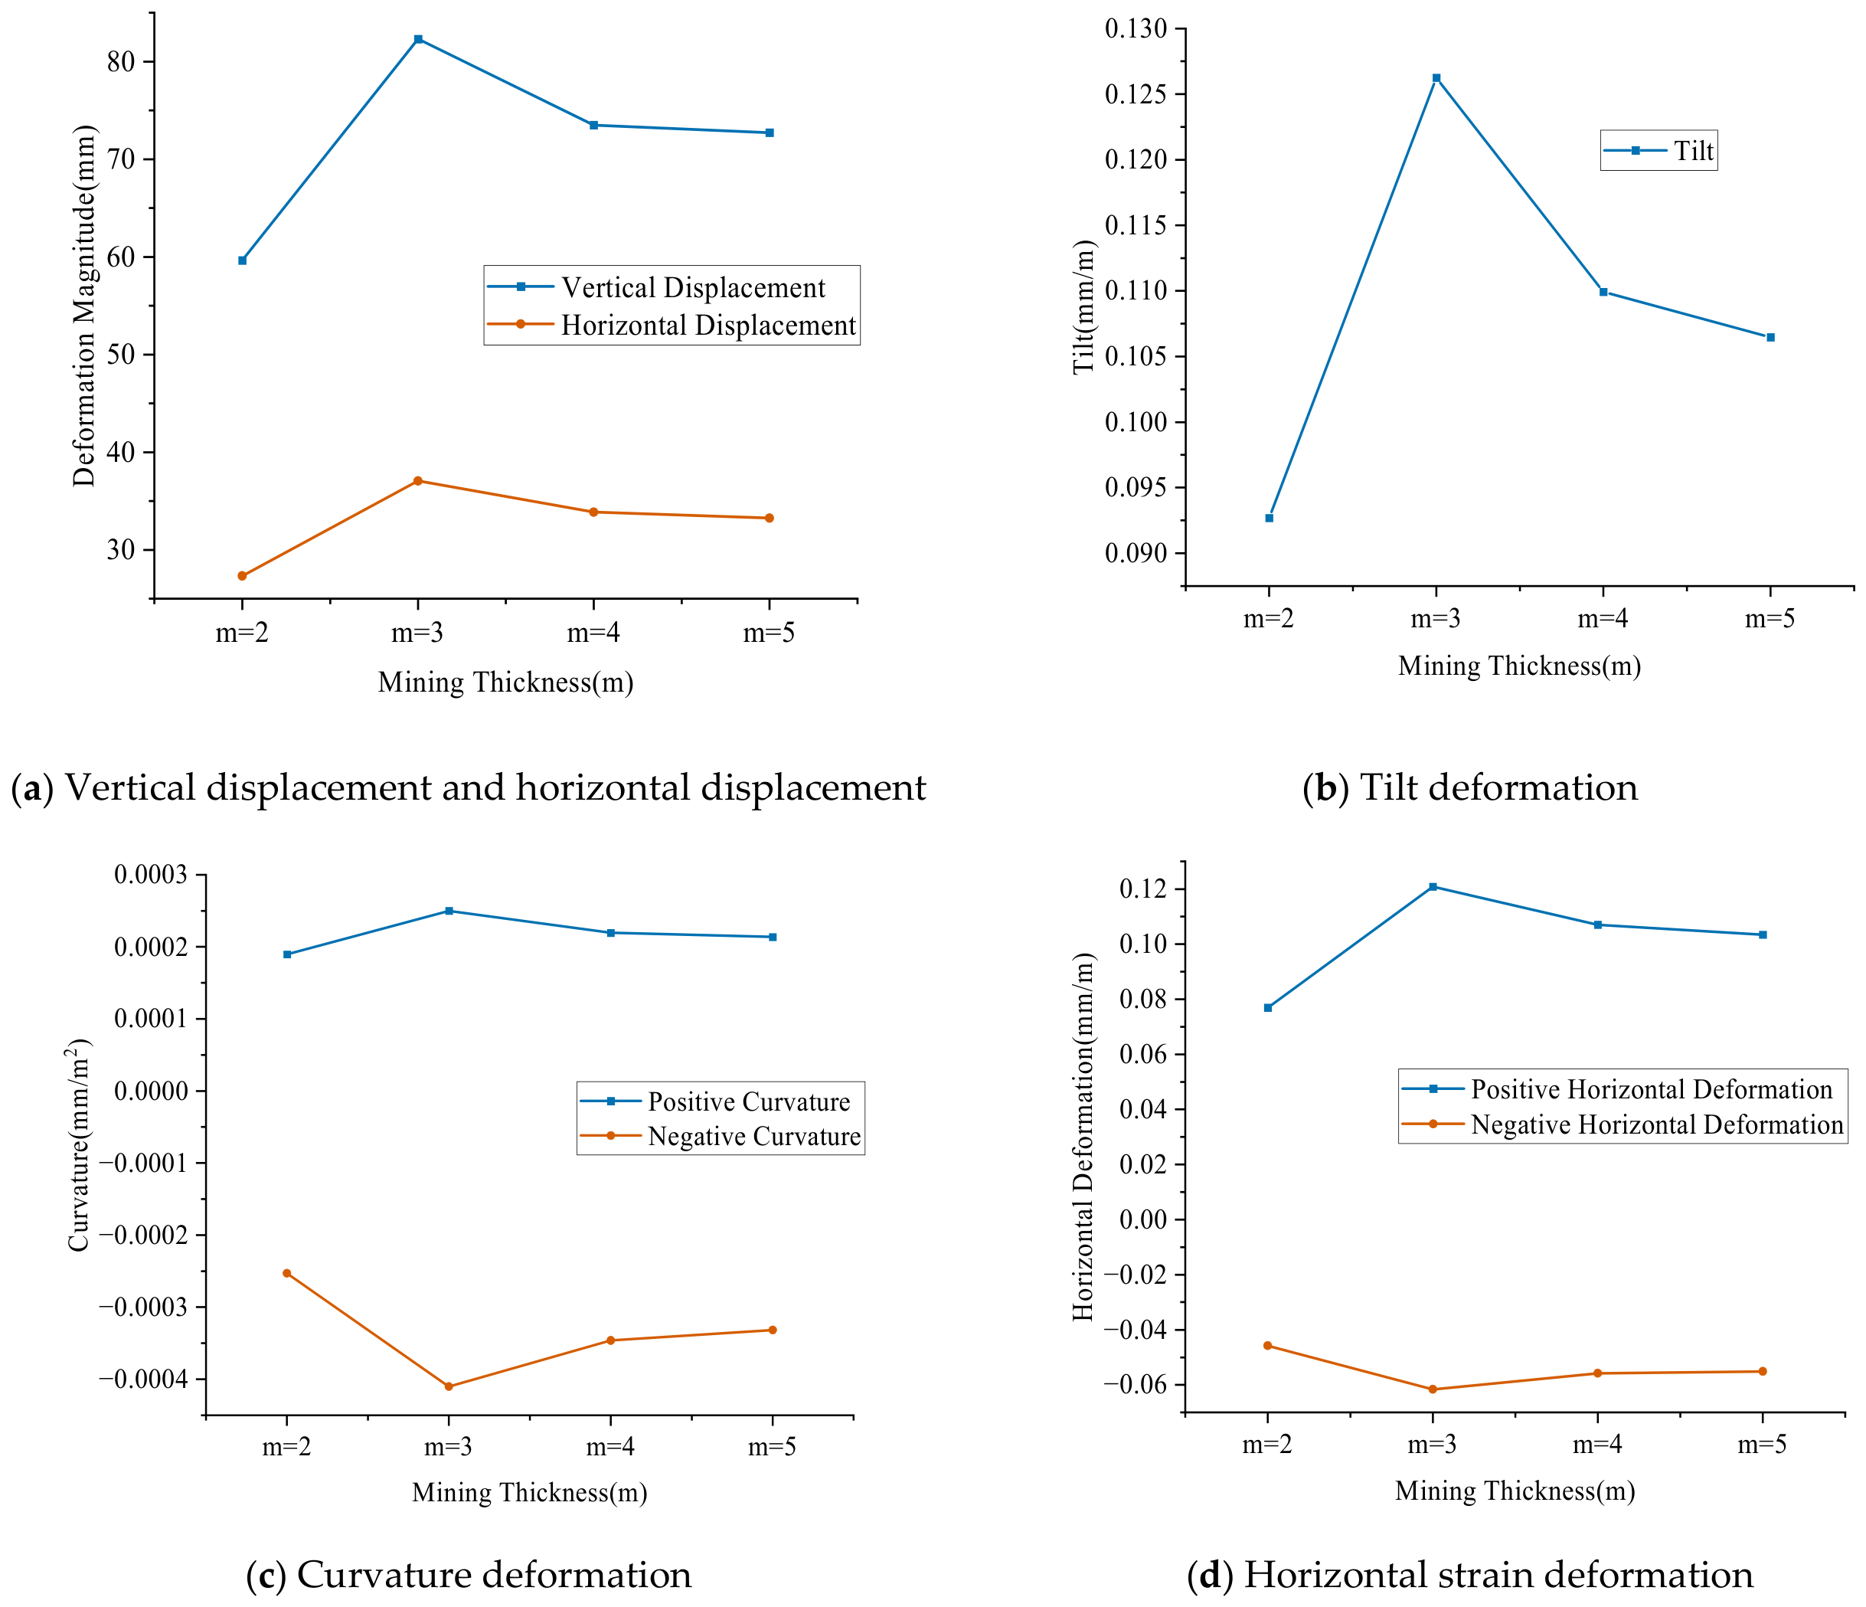
The results indicate that, during the subsidence stage under a relatively low groundwater level, the maximum values of surface vertical displacement, tilt, positive curvature, negative curvature, horizontal displacement, positive horizontal strain, and negative horizontal strain in the study area all increase with increasing mining thickness.
The extreme values of various surface movement and deformation indices under different mining thicknesses at a groundwater level of 300 m were extracted for further analysis, as shown in
Figure 19.
The results indicate that the variation patterns of the extreme values of surface movement and deformation with mining thickness differ under relatively low and relatively high groundwater-level conditions. Under relatively low groundwater levels, surface deformation is dominated by subsidence, and the magnitude of subsidence increases with the increase in caving-zone height resulting from greater mining thickness. In contrast, under relatively high groundwater levels, the extreme values of surface vertical displacement, horizontal displacement, tilt, positive and negative curvature, as well as positive and negative horizontal strain, initially increase and then decrease as mining thickness increases. This behavior is attributed to differences in the residual deformation space associated with varying mining thicknesses, causing the uplift pattern to become less pronounced rather than increasing monotonically with mining thickness.
The extreme values of various types of deformation under different mining thicknesses at different stages are summarized in
Table 4.
5.3. Analysis of the Influence of Caving-Zone Strength Weakening on Surface Movement and Deformation of the Goaf Under Groundwater Action
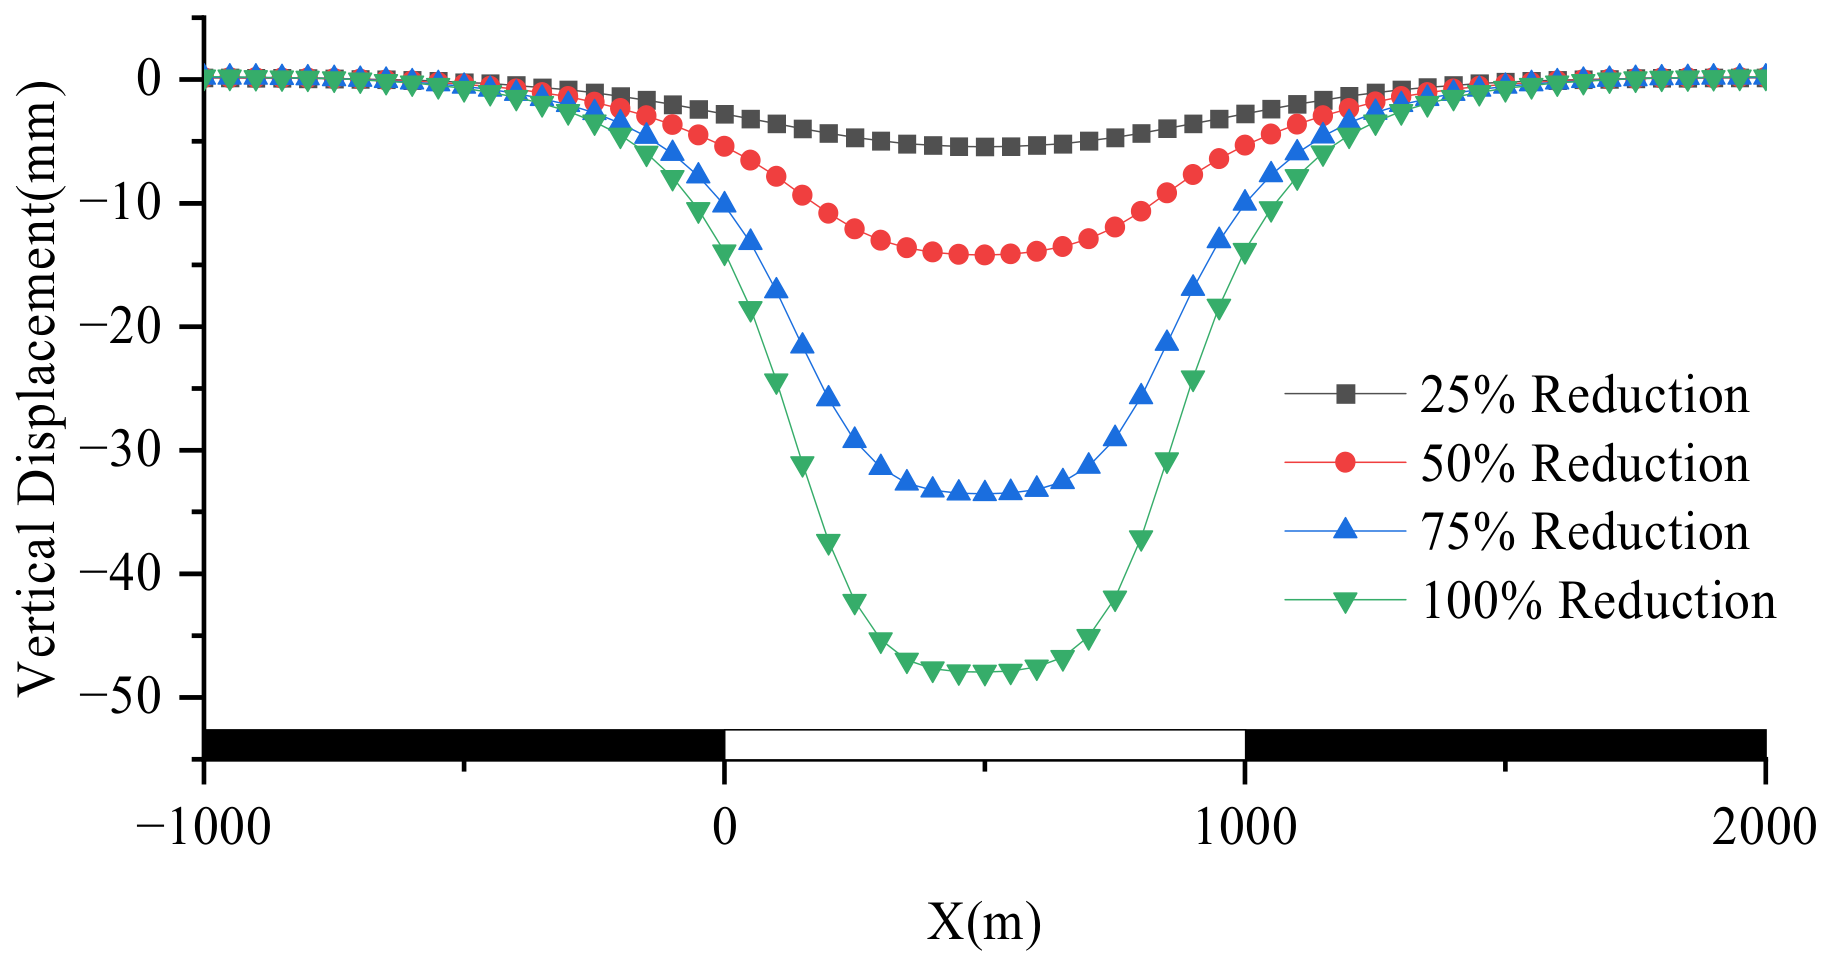
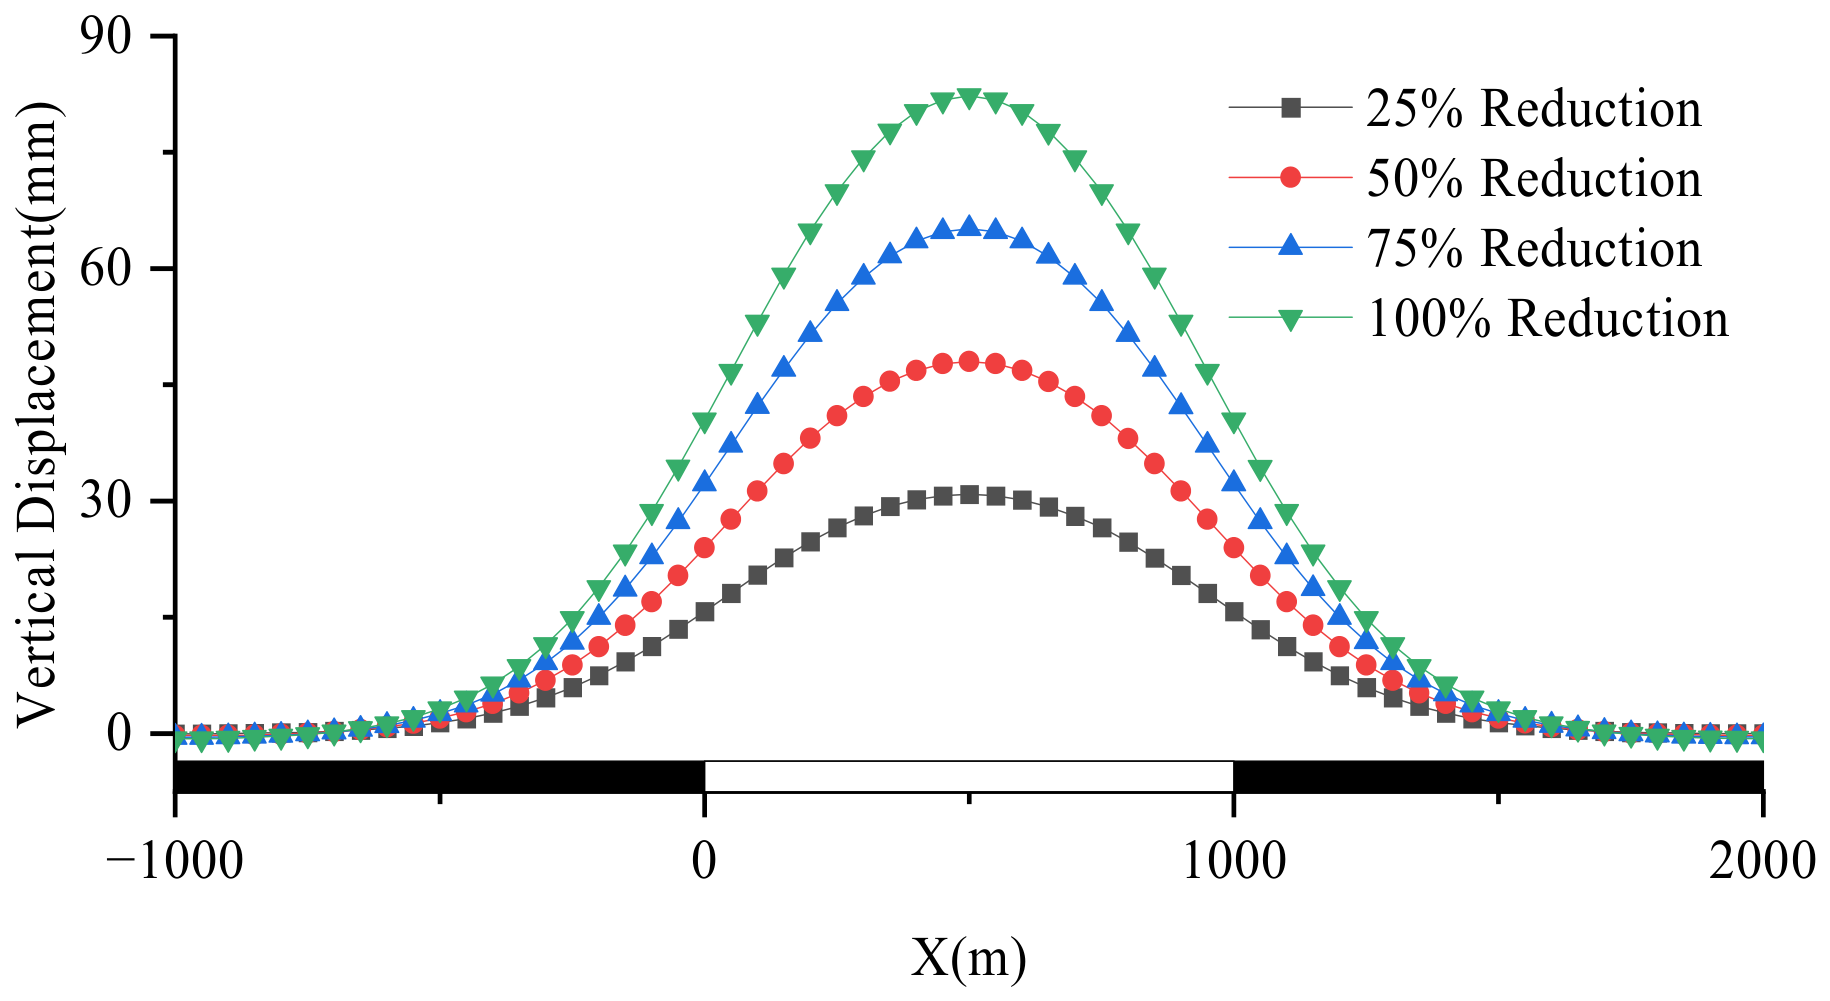
Based on the model with a mining height of 3 m, the influence of different degrees of parameter weakening in the caving zone under groundwater action on surface movement and deformation was investigated. Different weakening treatments were applied to the caving-zone parameters. Within the range from the original parameters to the saturated-state parameters, weakening degrees of 25%, 50%, 75%, and 100% of the saturated state were assigned, respectively. Different groundwater levels were selected to analyze the surface deformation characteristics during the typical subsidence and uplift stages, so as to further evaluate the influence of different caving-zone softening intensities on groundwater-induced surface movement and deformation. The cases with groundwater levels of 25 m and 300 m were selected as representative conditions for the typical subsidence and uplift stages of the ground surface, respectively. The vertical surface displacement curves corresponding to different degrees of caving-zone weakening at groundwater levels of 25 m and 300 m are shown in
Figure 20 and
Figure 21, respectively.
The results indicate that, during both the surface subsidence stage and the surface uplift stage, the weakening of caving-zone parameters has an important influence on the pattern of surface deformation: the lower the parameter values, the more pronounced the resulting deformation. To better evaluate the effect of weakening degree on surface deformation, the extreme values of vertical surface displacement at groundwater levels of 25 m and 300 m were extracted for weakening degrees of 100%, 75%, 50%, and 25%, respectively, and the extreme values of vertical surface displacement induced per unit increase in groundwater level were calculated, as presented in
Table 5.
The calculation results indicate that, for weakening degrees of 100%, 75%, 50%, and 25%, the corresponding increments in vertical surface displacement per unit rise in groundwater level are 0.48 mm, 0.36 mm, 0.23 mm, and 0.13 mm, respectively. In other words, the greater the degree of weakening in the caving zone, the greater the deformation increment caused by a unit increase in groundwater level. Lower parameter values make the ground surface more sensitive to groundwater-induced subsidence and uplift. This increase in sensitivity is reflected not only in the accelerated growth of surface uplift amplitude, but also in the faster response of the ground surface to fluctuations in groundwater level. That is, under a higher degree of weakening, groundwater-level fluctuations induce more rapid surface deformation, and the deformation magnitude shows an amplified trend. This phenomenon indicates that a reduction in elastic modulus significantly increases the sensitivity of surface deformation and aggravates the degree of surface damage.
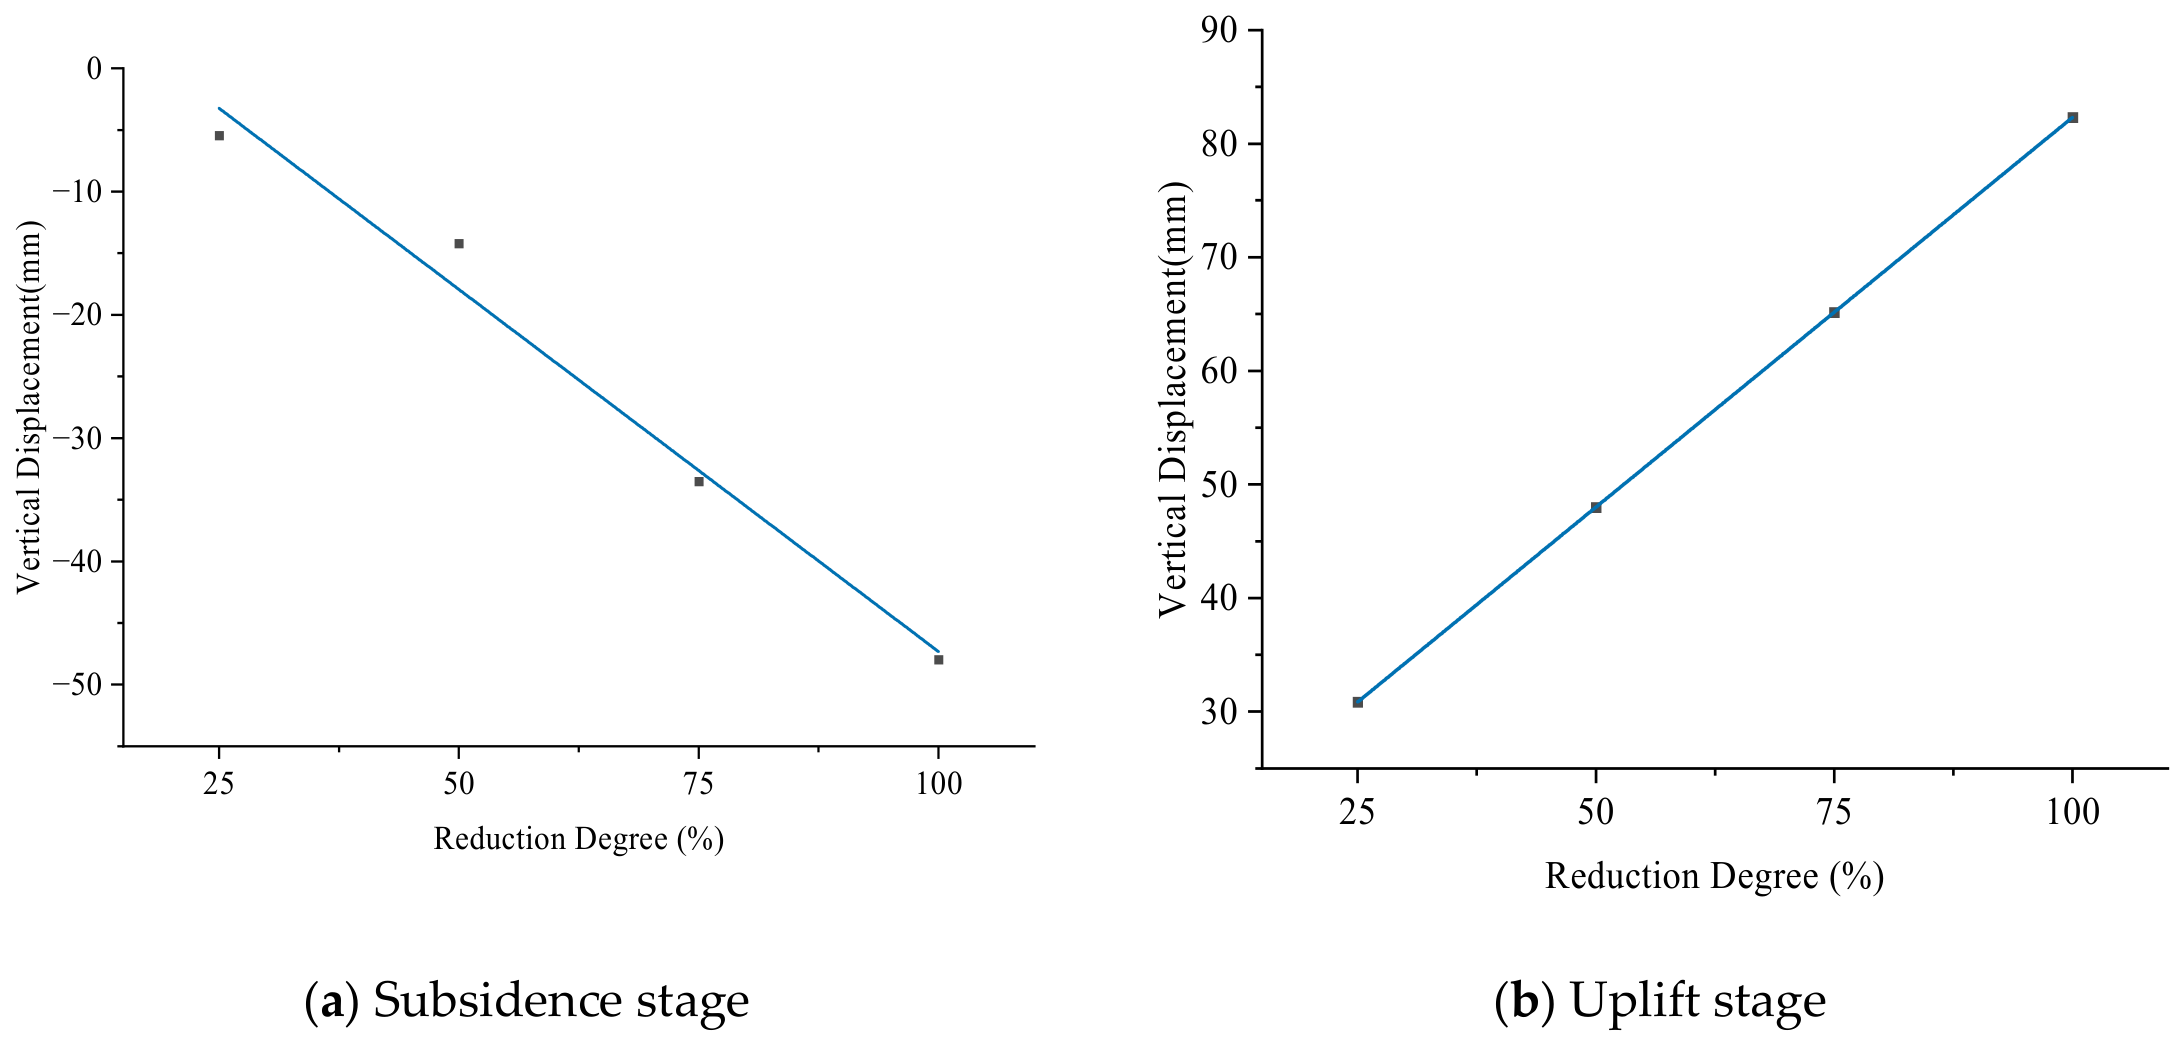
In addition, the relationships between different weakening degrees and the extreme values of vertical displacement in different stages were fitted, as shown in
Figure 22. The corresponding fitting equations, regression coefficients, and R
2 values are summarized in
Table 6.
Regression analysis reveals that the maximum vertical surface displacement in both the subsidence stage and the uplift stage exhibits a linear relationship with the weakening degree and increases with increasing weakening degree. The underlying reason is that, during the subsidence stage, subsidence induced by rock-mass weakening is dominant; therefore, the greater the weakening of the caving zone, the more pronounced the subsidence. In contrast, during the uplift stage, uplift induced by hydraulic pressure becomes dominant; accordingly, the greater the weakening degree, the more significant the groundwater-induced uplift effect.
During the subsidence stage, under a water level of 25 m, the extreme values of horizontal surface displacement for weakening degrees of 100%, 75%, 50%, and 25% are extracted, as shown in
Table 7.
During the uplift stage, under a water level of 300 m, the extreme values of horizontal surface displacement for weakening degrees of 100%, 75%, 50%, and 25% are extracted, as shown in
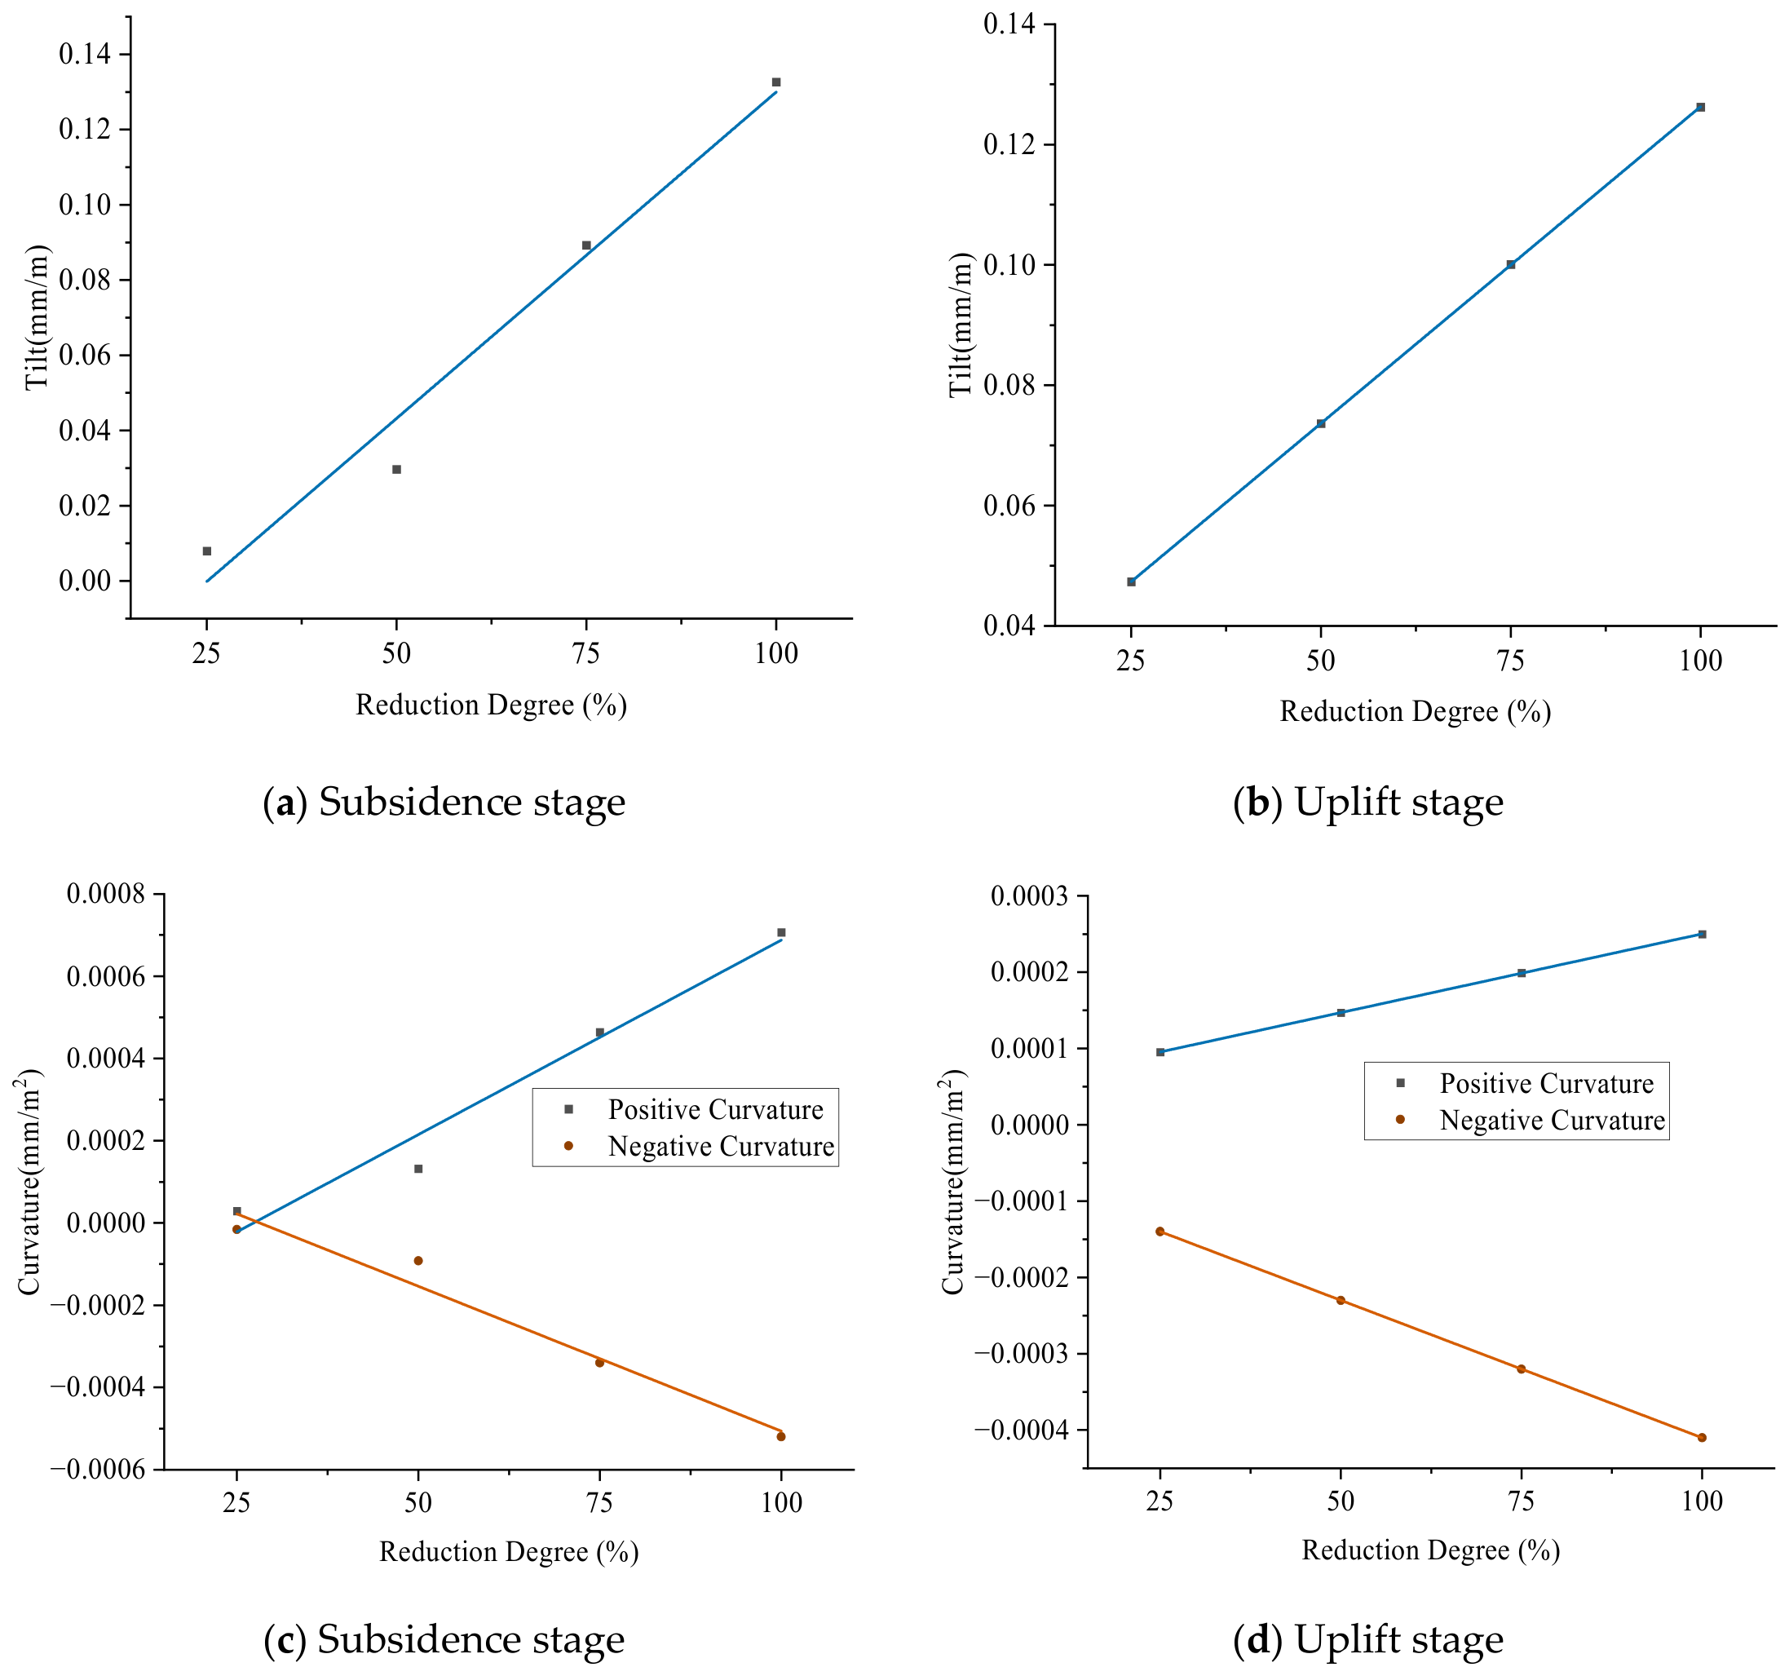
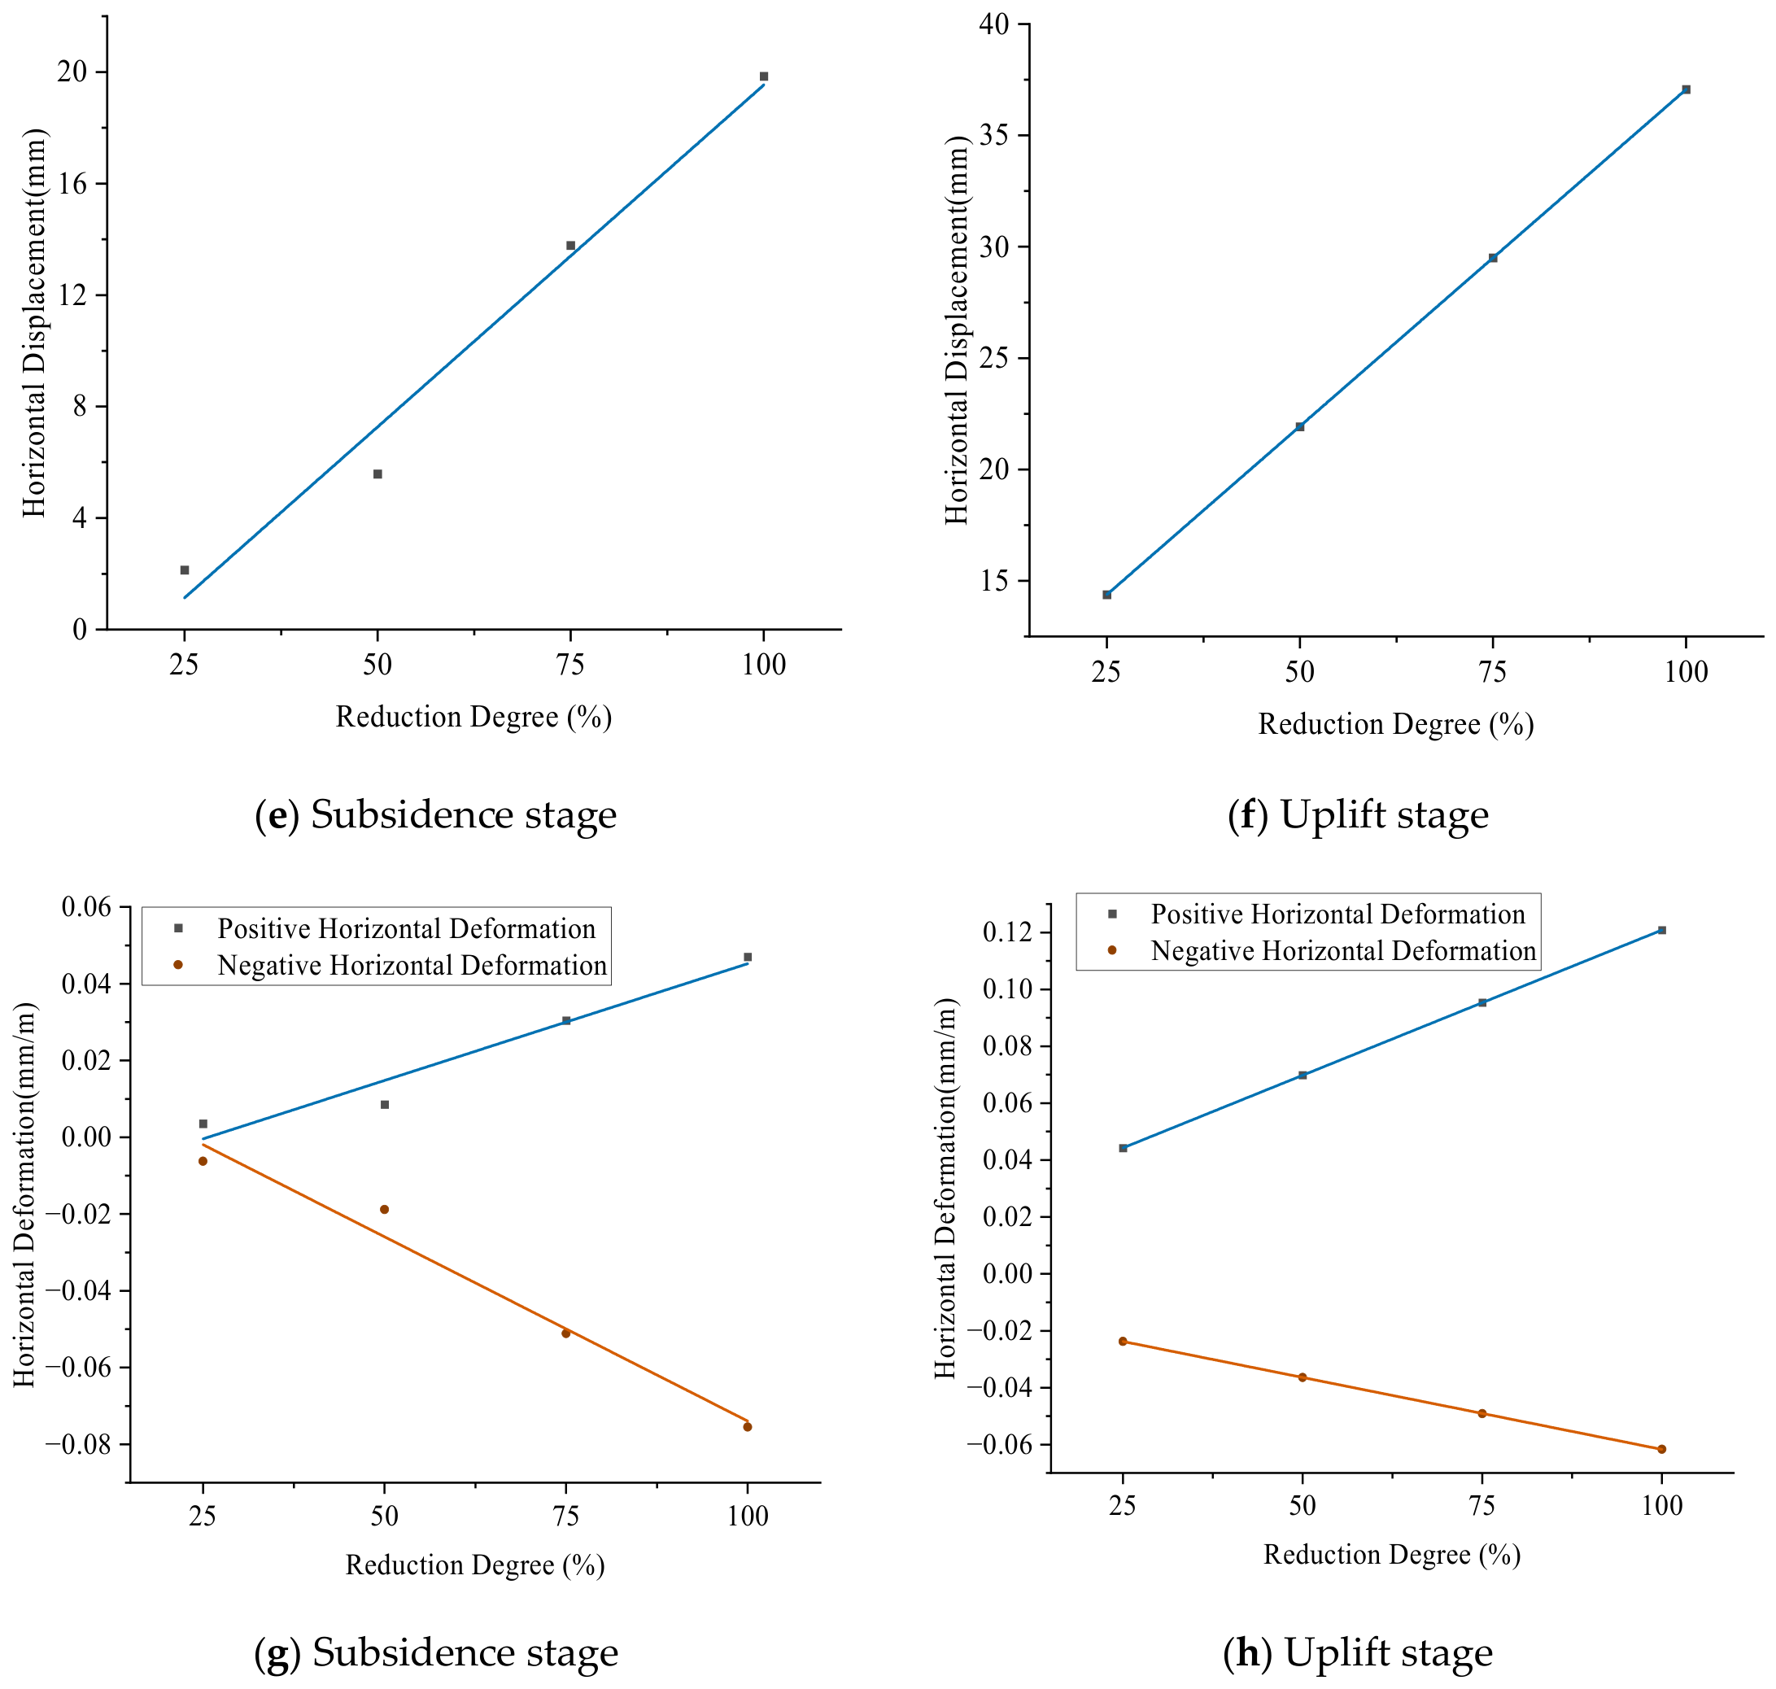
Table 8.
Based on the above tables, the curves for the subsidence and uplift stages were plotted and fitted, as shown in
Figure 23. The corresponding fitting equations, regression coefficients, and R
2 values are summarized in
Table 9.
Regression analysis indicates that the extreme values of all types of deformation increase with increasing weakening degree during both the subsidence and uplift stages. The relationships are generally linear, with all R2 values greater than 0.95, indicating a good fit.
In summary, under different degrees of weakening, the extreme values of surface movement and deformation, including vertical and horizontal displacements, increase with increasing weakening degree during both the subsidence and uplift stages. A greater weakening degree results in a more pronounced response of surface movement and deformation to groundwater action.