


Abstract
To achieve rapid and nondestructive evaluation of subgrade compaction quality, this study proposes a subgrade compaction quality evaluation method based on the dynamic modulus obtained from a portable falling weight deflectometer (PFWD), and field experiments were conducted relying on the Gaoyi North Connection Line Project of the Hengxi Expressway in Hebei Province. PFWD tests were carried out on the roadbed under different compaction passes, combined with compaction degree tests using the cutting ring method (CRM) and falling weight deflectometer (FWD) tests, to systematically analyze the evolution law and spatial uniformity of dynamic modulus during the subgrade compaction process. The results indicate that the PFWD dynamic modulus (EPFWD) exhibits a staged variation characteristic of “rapid increase—slow increase—tending to stability” with increasing compaction passes, and becomes basically stable after the eighth compaction pass. The overall longitudinal compaction quality of the subgrade is relatively uniform, while certain discreteness still exists among different lanes and local areas. The EPFWD shows good linear correlations with both compaction degree and the equivalent Benkelman Beam deflection values derived from FWD measurements, among which the correlation with FWD results is stronger. The study demonstrates that PFWD can effectively characterize the overall structural stiffness and compaction uniformity of subgrade, providing a reliable basis for rapid detection and uniformity evaluation of subgrade construction quality.
1. Introduction
During the service period of road engineering, the compaction quality and spatial uniformity of subgrade are regarded as one of the key factors controlling the long-term performance of pavement structures [1,2]. A sufficiently compacted subgrade should not only satisfy the designed compaction degree requirements, but also possess adequate and uniform stiffness distribution; otherwise, uneven settlement or accumulated deformation is likely to occur under traffic loading, thereby weakening the bearing capacity and durability of the upper structure [3,4]. A large number of engineering practices have shown that the occurrence of typical pavement distresses, such as cracks and rutting, is not only related to the material properties of asphalt surface layers but is also closely associated with insufficient or spatially non-uniform subgrade compaction [5,6]. Therefore, achieving rapid, continuous, and reliable evaluation of subgrade compaction quality and uniformity during the construction stage is of great significance for improving road service life and reducing life-cycle maintenance costs.
At present, compaction degree remains the core indicator for evaluating subgrade compaction quality, and the commonly used testing methods include the sand replacement method, water replacement method, and cutting ring method (CRM) [1,7]. However, these methods are essentially point-based measurements and are somewhat destructive in nature, and their test results are highly dependent on the experience of operators and sampling locations. Meanwhile, the excavation and sampling process damages the integrity of the compacted structure, thereby affecting the overall bearing performance of the subgrade [8,9]. In addition, due to their relatively low testing efficiency, such methods can usually only be conducted at limited measuring points, making it difficult to reflect the spatial variation characteristics of compaction quality within large-scale construction areas [10]. Therefore, traditional compaction degree testing methods exhibit obvious limitations in meeting the requirements of modern road engineering for high-efficiency and large-scale quality control.
Nondestructive testing technologies based on impact loading provide a new technical approach for the rapid evaluation of subgrade. Portable falling weight deflectometers (PFWD) and falling weight deflectometers (FWD) apply transient impact loads on the subgrade surface and record the corresponding deflection responses, from which the dynamic resilient modulus of the subgrade can be back-calculated, thereby enabling indirect evaluation of its bearing capacity. Compared with traditional methods, PFWD has advantages such as portability and high testing efficiency, making it particularly suitable for rapid quality control during construction, whereas FWD is widely used in the evaluation of road structural bearing capacity because its loading conditions are closer to actual traffic loads.
Fu et al. [11] analyzed the loading frequency characteristics of FWD through dynamic back-calculation and found that although the deflection response could be fitted, the modulus solution exhibited multiple solutions and was only reliable within the effective frequency range of 5–65 Hz. Elshaer et al. [12] analyzed resilient modulus models based on LTPP data and pointed out that the resilient modulus is significantly affected by stress and moisture content and exerts nonlinear control on deflection response. Sirithepmontree and Sapsathiarn [13] established a dynamic soil model for back-calculation analysis and found that the FWD modulus is highly sensitive to model assumptions and exhibits obvious dynamic effects and uncertainties. Rafiei et al. [14] found through laboratory model tests that the PFWD dynamic resilient modulus has good correlations with compaction degree and moisture content. Zhang et al. [15] analyzed the coupling relationship among moisture content, compaction degree, and dynamic resilient modulus based on field tests and pointed out that compaction quality in actual construction is easily affected by deviations in moisture content. Kavussi et al. [16] confirmed through comparative field and laboratory studies that the PFWD test results have certain correlations with FWD and the California bearing ratio (CBR). Xia et al. [17] established an empirical relationship model between compaction degree and dynamic resilient modulus for evaluating subgrade compaction quality. Steinert et al. [18] systematically verified the applicability of PFWD in the rapid evaluation of pavement bearing capacity, while George et al. [19] further established correlations between PFWD modulus and the results of CBR and dynamic cone penetration tests. Relevant studies by Grajewski [20] showed that factors such as soil particle composition, maximum dry density, and optimum moisture content significantly affect the LFWD testing modulus, and predictive models can be established through regression analysis.
Existing studies have demonstrated the applicability of PFWD in the rapid evaluation of subgrade bearing capacity. However, most previous research has primarily focused on the correlations between the PFWD dynamic modulus (EPFWD) and individual indicators such as compaction degree or CBR, whereas the evolution of dynamic modulus throughout the compaction process, its spatial uniformity characteristics, and its relationship with FWD-derived structural response indicators have received comparatively limited attention. Furthermore, traditional density-based indices are often insufficient to comprehensively characterize the overall stiffness and uniformity of subgrade structures, which restricts their effectiveness in construction quality evaluation. To address these gaps, field investigations were conducted on the Hengxi Expressway Project in Hebei Province using PFWD, FWD, and the cutting ring method (CRM). The evolution of EPFWD during successive roller passes was systematically analyzed, and high-density measurements were employed to characterize the spatial variability of subgrade compaction. In addition, the relationships among EPFWD, compaction degree (K), and the equivalent Benkelman Beam Deflection Value (LEBDV) derived from FWD measurements were investigated. Rather than proposing a new PFWD testing technique, this study develops and validates a PFWD—based assessment framework for evaluating subgrade compaction quality and spatial uniformity during construction. The main contribution of this work lies in integrating dynamic modulus evolution, spatial distribution analysis, and conventional quality—control indicators into a unified evaluation framework, thereby providing a practical basis for rapid field assessment of subgrade compaction performance.
2. Materials and Methods
2.1. Working Principle of PFWD
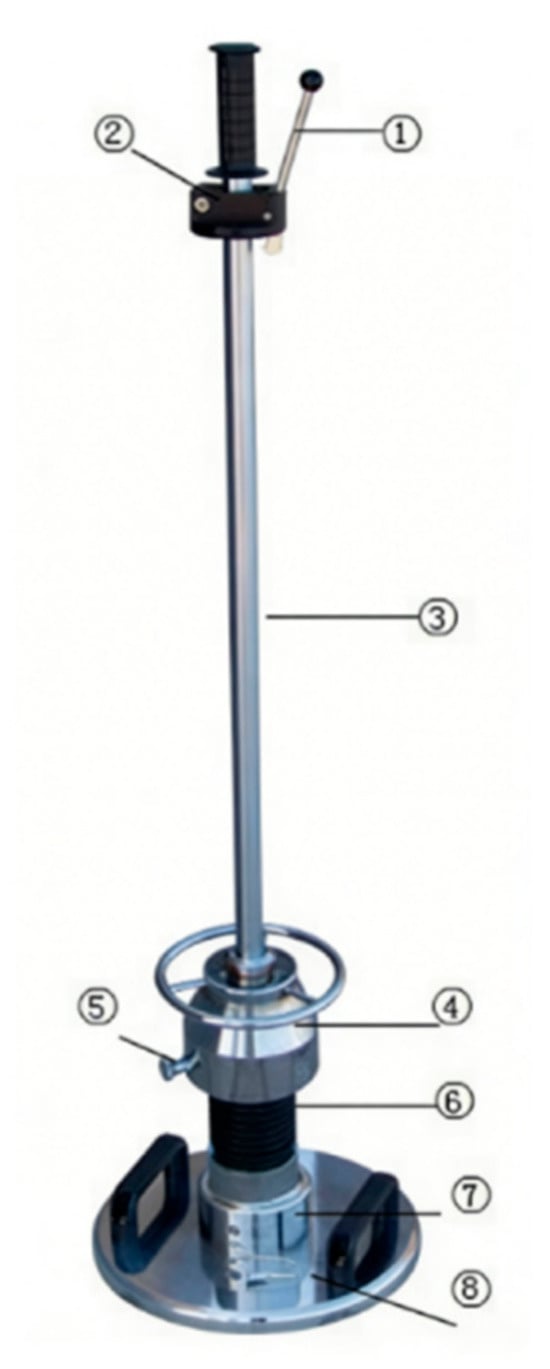
PFWD is a compact and portable testing device used for evaluating the dynamic bearing capacity of subgrade surfaces. It mainly consists of a loading system, a data acquisition system, and a data transmission system. The instrument used in the test is shown in Figure 1, and the details of each component are listed in Table 1. The PFWD adopted in this study was the GTJ-PFWD model, which was independently developed by Gaotiejian Technology Development Co., Ltd. (Beijing, China).
Figure 1.
PFWD used in the test.
Table 1.
Structural components of PFWD.
The testing principle of PFWD is mainly to simulate the dynamic deformation response of the subgrade under traffic loading. By lifting the drop hammer and allowing it to freely fall onto the bearing plate, an approximately half-sine impact load is generated. The load is transmitted to the subgrade surface through the bearing plate, thereby causing synchronous vertical deformation of both the bearing plate and the subgrade. The information acquisition system is used to obtain parameters such as deflection, strain, and stress before and after loading, and the resilient modulus of the subgrade is calculated through relevant computations.
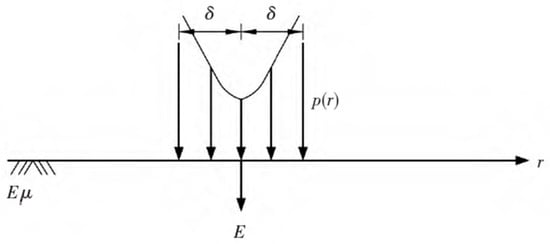
The test adopted the elastic half-space model under a rigid bearing plate as the theoretical testing model, and its stress state is shown in Figure 2.
Figure 2.
Stress state of the elastic half-space structure under a rigid bearing plate.
The expression for the vertical displacement at any point within an elastic half-space subjected to a circular vertically distributed rigid load is given as follows:
By substituting r = 0 and z = 0 into the above equation, the expression for the vertical displacement (i.e., deflection) of the subgrade surface at the center of the load can be obtained as follows:
Therefore, the theoretical calculation formula for the resilient modulus obtained from PFWD testing is as follows:
where Ep is the resilient modulus of the subgrade (MPa); r and z are the radial and vertical coordinates, respectively (cm); δ and p are the radius of the bearing plate (cm) and the average pressure of the load acting on the bearing plate (MPa), respectively; E is the resilient modulus of the subgrade (MPa); μ is the Poisson’s ratio of the subgrade soil, generally taken as μ = 0.35; J0( ) is the zero—order Bessel function; and x is the integration variable; and l is the measured deflection at the center of the bearing plate (µm).
2.2. Test Site
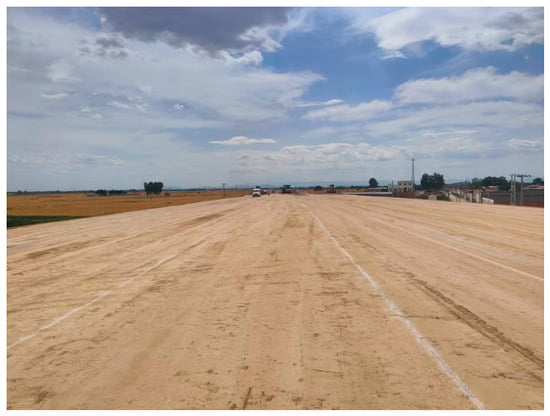
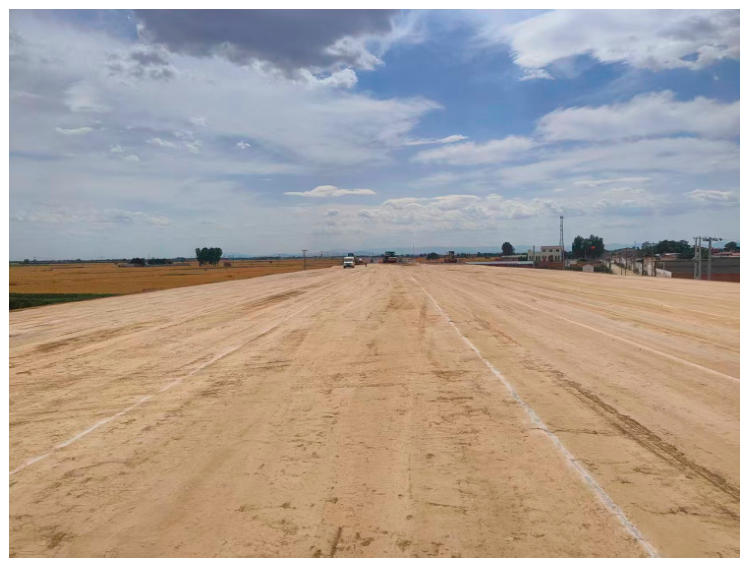
This study was conducted based on the Gaoyi North Connection Line Project of the Hengxi Expressway in Shijiazhuang City, Hebei Province, to investigate the compaction degree and compaction quality during the roadbed compaction process. The embankment section was filled using construction solid waste, and the settlement difference method was adopted in accordance with specifications [21] to evaluate the embankment compaction degree before roadbed filling. A rectangular test section with dimensions of 100 m (length) × 25.5 m (width) was selected. The roadbed was filled and compacted in four layers, with a filling thickness of 20 cm for each layer and a total thickness of 80 cm. After filling the roadbed with plain soil, 5% lime was added for in situ mixing. A 26 t vibratory roller was used for compaction (vibration frequency of 32 Hz and nominal amplitude of 1.1 mm), with a total of 10 compaction passes (5 forward passes and 5 backward passes), where odd-numbered passes represented forward compaction and even-numbered passes represented backward compaction. The test site is shown in Figure 3. The detailed operating mode of the roller during each compaction pass is listed in Table 2. The first two passes were conducted under static compaction for preliminary surface densification, passes 3–8 were performed under vibratory compaction to improve the overall stiffness of the filled layer, and the final two passes were conducted under static compaction or leveling to improve surface smoothness and interlayer contact.
Figure 3.
Test site.
Table 2.
Roller operating mode during different compaction passes.
2.3. Test Materials
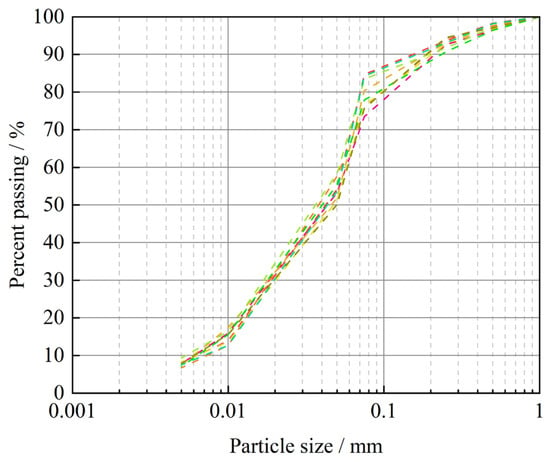
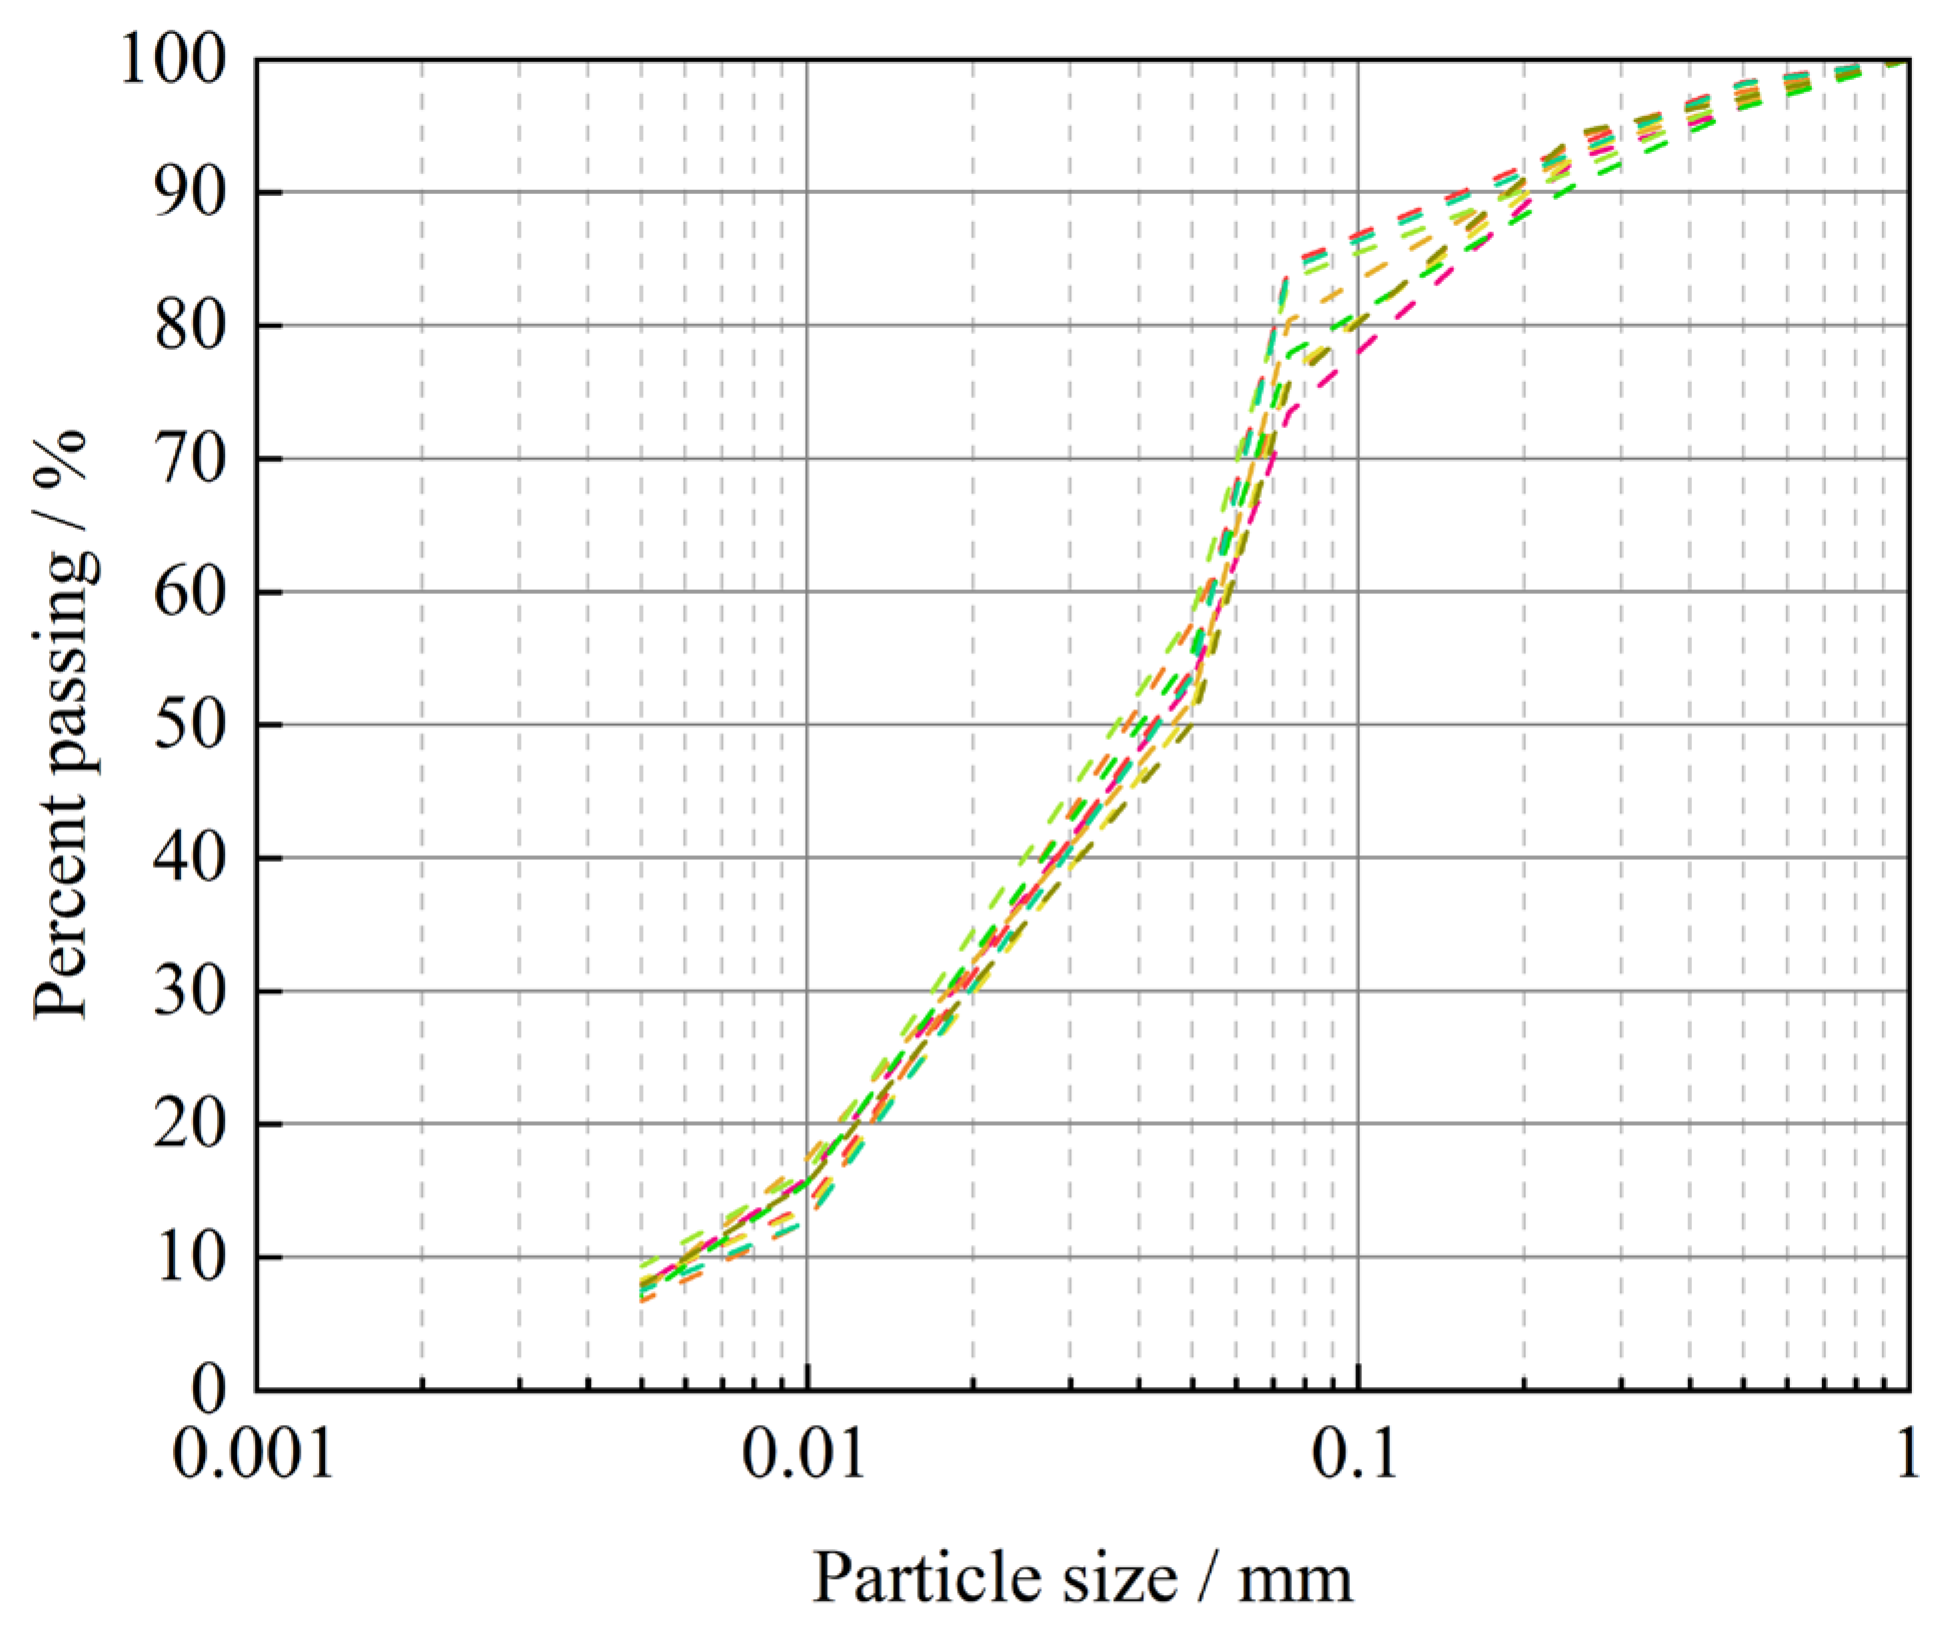
According to the specification requirements [22,23], sampling and analysis were conducted on the plain soil filler of the Hengxi Expressway roadbed. Basic physical property parameters were obtained by sampling and analyzing eight locations in different sections along the 100 m test section to ensure the uniformity of the field filler and provide a foundation for subsequent research. The gradation curves, coefficient of uniformity Cu, and coefficient of curvature Cc of the roadbed filler are shown in Figure 4 and Table 3. As can be seen from Figure 4 and Table 2, the filler throughout the entire roadbed section exhibited good and relatively uniform gradation, and all fillers were classified as low-liquid-limit silt (ML).
Figure 4.
Gradation curves of field fillers.
Table 3.
Cu and Cc of roadbed fillers.
To determine the optimum moisture content and maximum dry density of the field roadbed filler, compaction tests were conducted on plain soil and lime-stabilized soil in accordance with the specifications [22]. The results showed that the optimum moisture content of the plain soil was 12%, and the maximum dry density was 1.842 g/cm3. When the moisture content exceeded 12%, the dry density decreased rapidly. However, the natural moisture content of the field soil was generally higher than 16%, making it difficult to satisfy the specification requirements for roadbed compaction control. Therefore, a lime stabilization treatment was adopted. Specifically, 5% lime was added to the plain soil and mixed in situ prior to compaction. The lime not only absorbed part of the excess moisture but also improved the engineering properties of the soil, thereby facilitating compaction and improving subgrade quality.
The optimum moisture content of the improved lime-stabilized soil was 15%, and the maximum dry density was 1.805 g/cm3. Compared with the plain soil, the optimum moisture content of the improved soil increased by 3%, while the maximum dry density decreased by approximately 2%. The lime stabilization reaction requires additional water consumption, and lime also possesses a certain moisture absorption effect, which can effectively improve the difficulty of compacting soils with high moisture content.
2.4. In Situ Tests
The GTJ-PFWD employed in this study uses a falling mass of 10 kg and a drop height of 700 ± 20 mm. The loading plate diameter was 300 mm, resulting in a peak contact stress of approximately 100.0 ± 1.0 kPa, which is comparable to the stress level commonly applied in subgrade evaluation. The FWD testing was conducted using a CFWD-10T device (Shanghai Leao Test Instrument Co., Ltd., Shanghai, China.) with a 300 mm loading plate and a target load level of 50 kN. The loading pulse duration was less than 30 ms. The displacement sensor had a resolution of 0.2 μm and an accuracy of ±0.1%. Deflection responses were measured by a geophone positioned at the load center (offset = 0 mm). The LEBDV was calculated in accordance with the relevant specification.
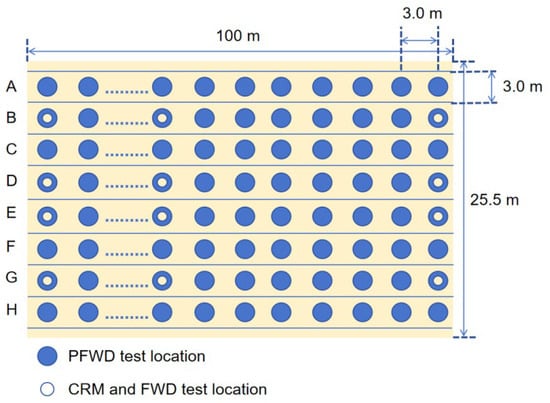
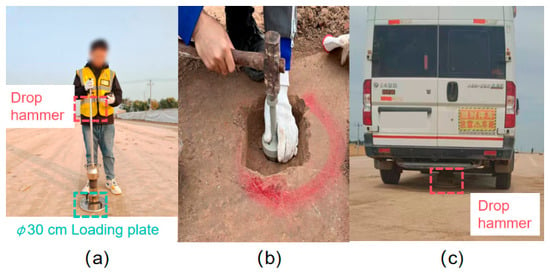
PFWD compaction quality tests were conducted after every even-numbered compaction pass for each roadbed layer, and the cutting ring method was adopted to determine the subgrade compaction degree after the completion of the tenth compaction pass. FWD testing was carried out after the compaction of the fourth roadbed layer was completed. Since the CRM is inherently destructive, CRM testing was carried out after the completion of the PFWD and FWD measurements. To prevent disturbance to the testing locations, CRM sampling points were positioned adjacent to, rather than directly at, the PFWD and FWD test points. For the correlation analyses, each CRM and FWD measurement was associated with the nearest PFWD measurement, and the maximum separation distance between paired locations was less than 0.3 m. This strategy minimized testing interference while maintaining the spatial representativeness of the datasets. The layouts of the in situ test points and testing equipment are shown in Figure 5 and Figure 6, respectively. During PFWD testing, one measuring point was arranged every 3 m along the route direction, with a total of 272 measuring points for each layer. For the cutting ring method, one measuring point was arranged every 21 m, located at 1 m, 22 m, 43 m, 64 m, 85 m, and 100 m, respectively, with a total of 24 measuring points for each layer. During PFWD testing, three pre-impacts were first applied at each measuring point, followed by five formal tests. The software automatically calculated the average value of the five dynamic resilient modulus measurements as the test result for that measuring point. The CRM was conducted in accordance with specification T 0923-2019 [21].
Figure 5.
Layout of in situ test points.
Figure 6.
Testing equipment: (a) PFWD; (b) CRM; (c) FWD.
3. Results
3.1. Relationship Between Subgrade Compaction Quality and Compaction Passes
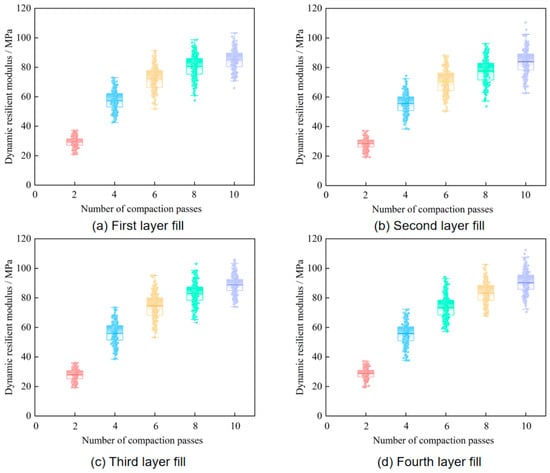
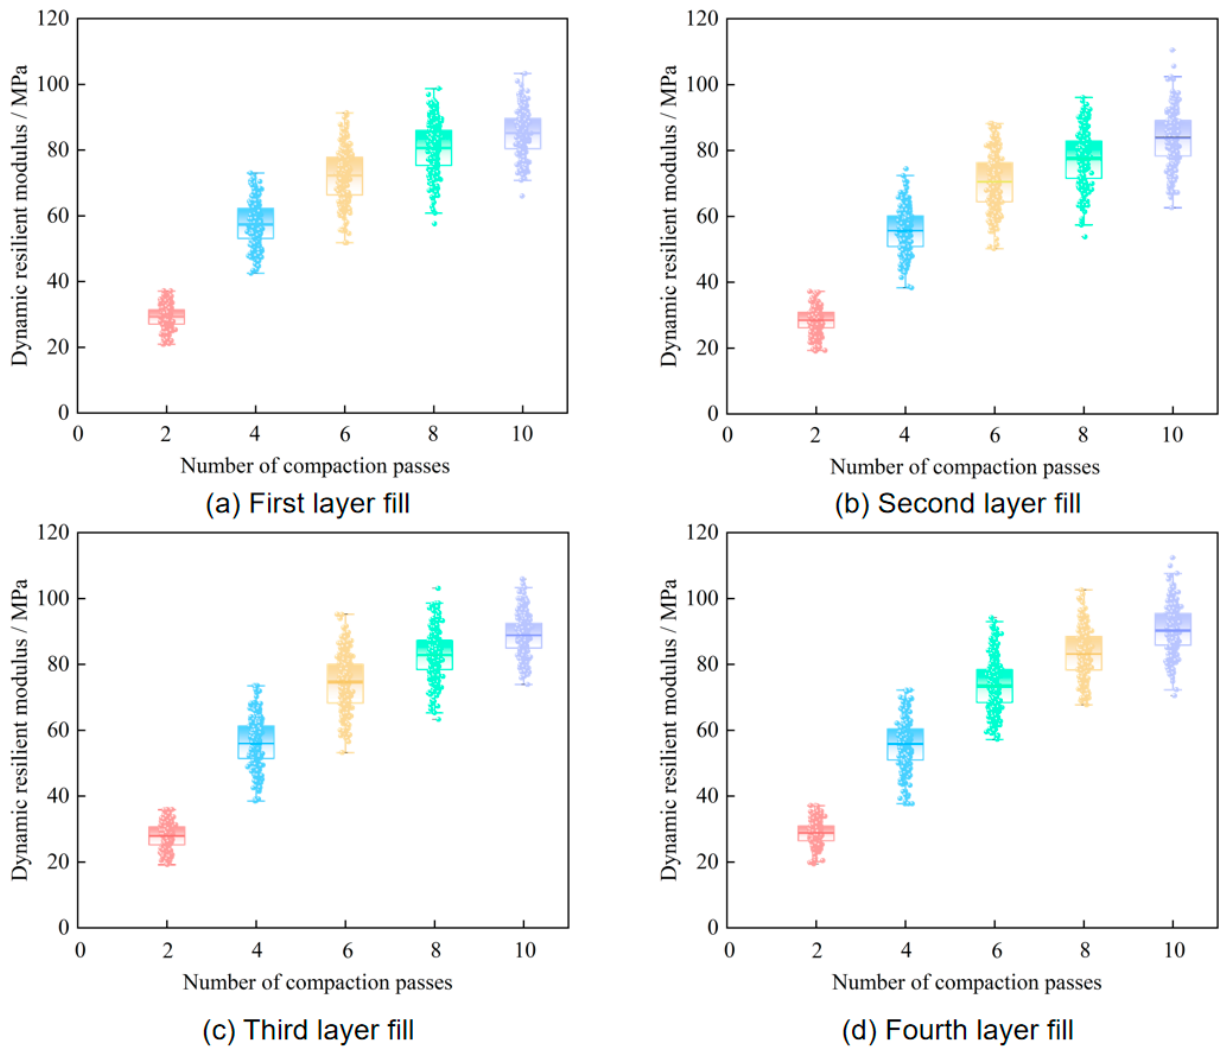
Each filler layer in the field test section of the Hengxi Expressway was compacted 10 times. During the compaction process, PFWD was used to measure the EPFWD of the filler, and boxplots of compaction passes versus EPFWD were drawn based on the field test results (Figure 7). As shown in Figure 7, the EPFWD values of all four filler layers increased significantly with increasing compaction passes, exhibiting an overall staged variation pattern of “rapid increase—slow increase—tending to stability”. After the second compaction pass, the dynamic modulus of each filler layer remained relatively low, with median values of approximately 28–32 MPa. After the fourth compaction pass, the modulus rapidly increased to 55–60 MPa, representing an increase close to 100%. Subsequently, the modulus continued to increase after the sixth and eighth compaction passes, and the median modulus reached 78–85 MPa after the eighth compaction pass. After the tenth compaction pass, the modulus of each layer increased to 85–92 MPa, while the growth rate decreased significantly. The modulus increment between adjacent compaction passes was generally less than 8%, indicating that the filler stiffness had gradually become stable.
Figure 7.
Boxplots of compaction passes versus EPFWD.
After the second compaction pass, the box width was the largest. With increasing compaction passes, the box width gradually decreased, and the distribution of outliers became more concentrated. In particular, after the eighth compaction pass, the interquartile range decreased significantly, indicating that the internal compaction state of the filler became more uniform. After the tenth compaction pass, the morphology of the boxplots changed only slightly, suggesting that the soil had approached its limit compaction state at this stage.
According to the test results, the roadbed filler exhibited obvious staged variation characteristics. In the early stage of compaction (the first two passes), the roller mainly adopted static compaction, and the compaction effect was concentrated primarily in the surface layer of the filler. The deep particle skeleton had not yet formed an effective interlocking structure; therefore, the overall stiffness of the soil remained low, and the growth of EPFWD was relatively slow. As the vibration load was gradually transmitted to deeper layers, soil particles underwent rearrangement and interlocking, and the internal skeleton structure gradually became stable, resulting in a significant increase in the overall stiffness of the soil and a rapid increase in EPFWD. During the sixth to eighth compaction passes, the growth rate of the modulus gradually slowed down, indicating that the soil had transitioned from the “rapid compaction stage” to the “stable compaction stage”. The tenth compaction pass adopted static leveling, with the purpose of eliminating local surface unevenness and improving the uniformity of interlayer contact. At this stage, the soil had already approached a dense state, and the variation in EPFWD after static compaction was relatively small.
Because PFWD measurements at different compaction passes were repeatedly obtained at the same spatial locations, these data were not fully independent observations. Therefore, the boxplots were used primarily to describe the variation trend and dispersion of EPFWD during compaction. Future studies should further apply repeated-measures analysis or mixed-effects models to quantify the effects of compaction passes while accounting for within-location correlation.
3.2. Evaluation of Subgrade Compaction Quality
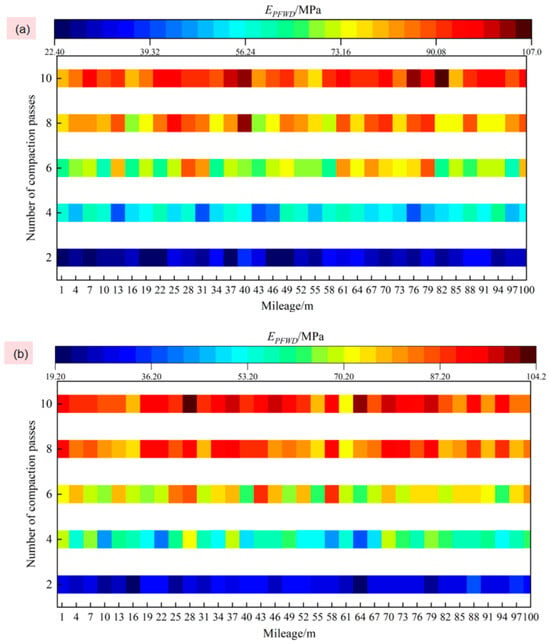
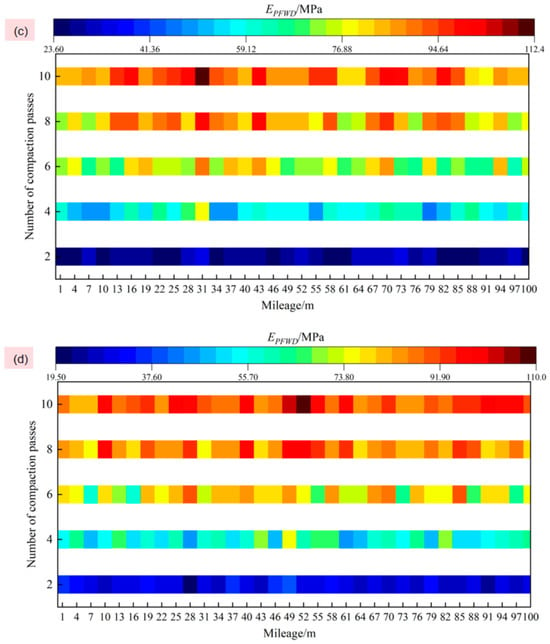
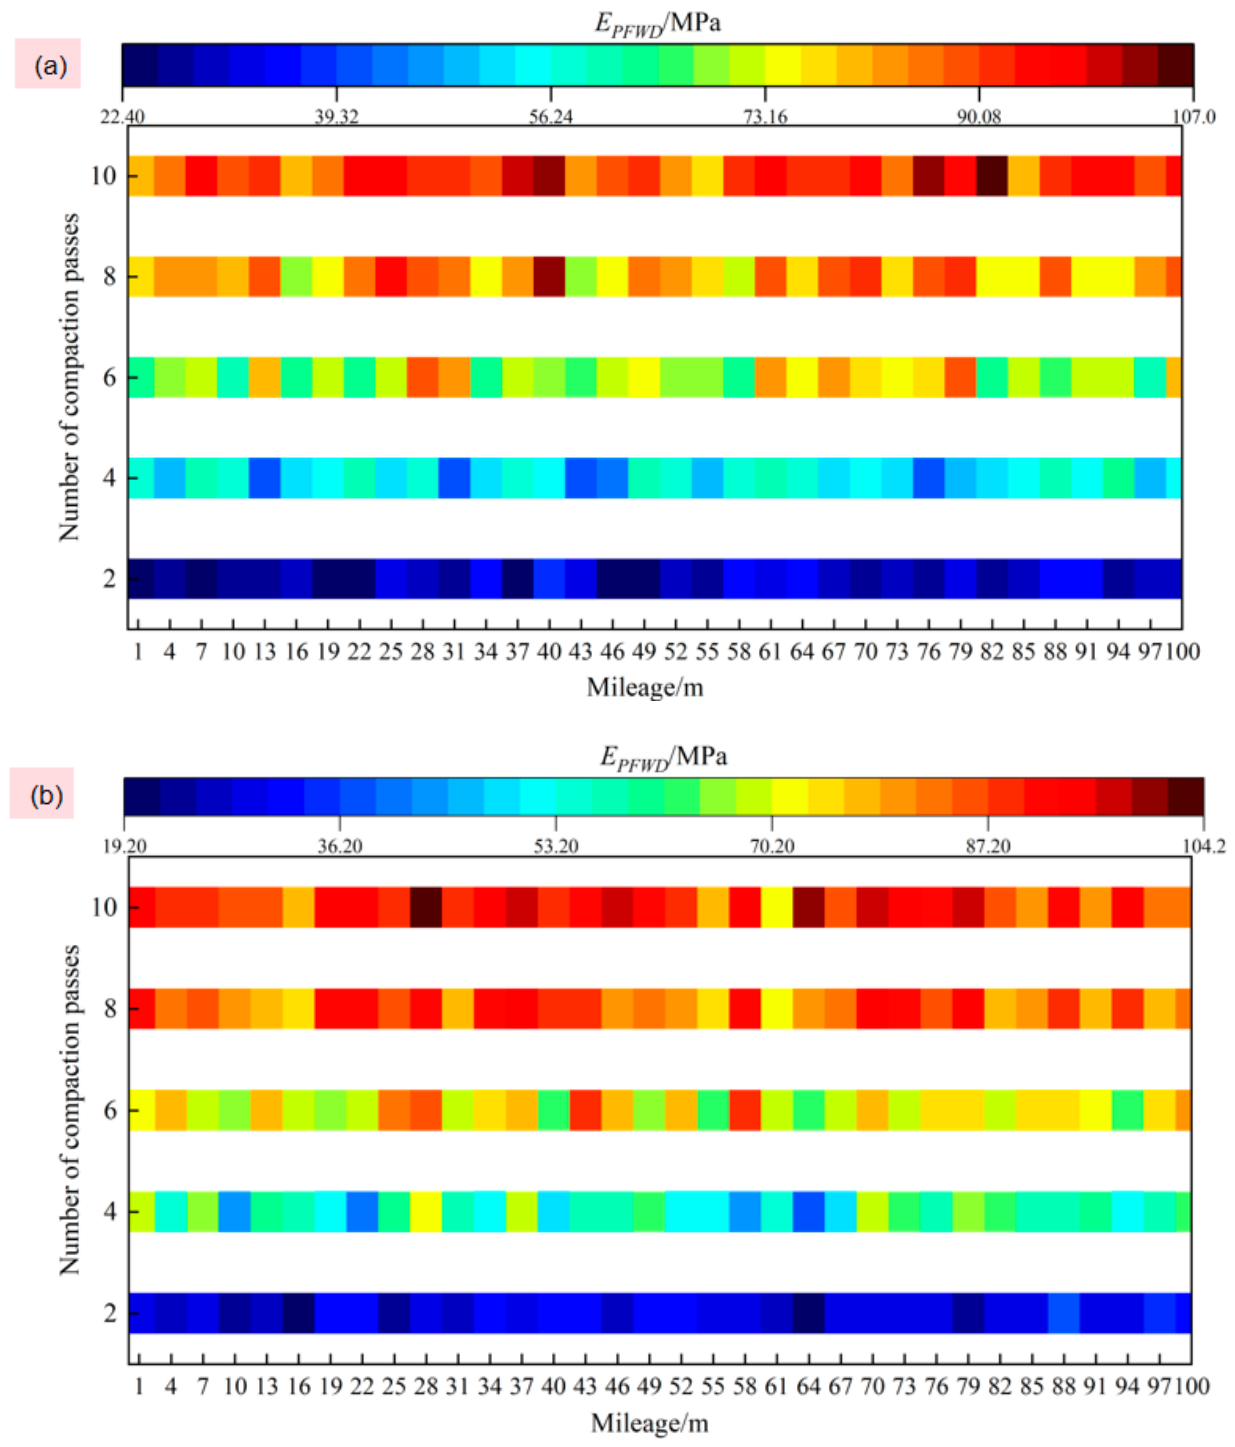
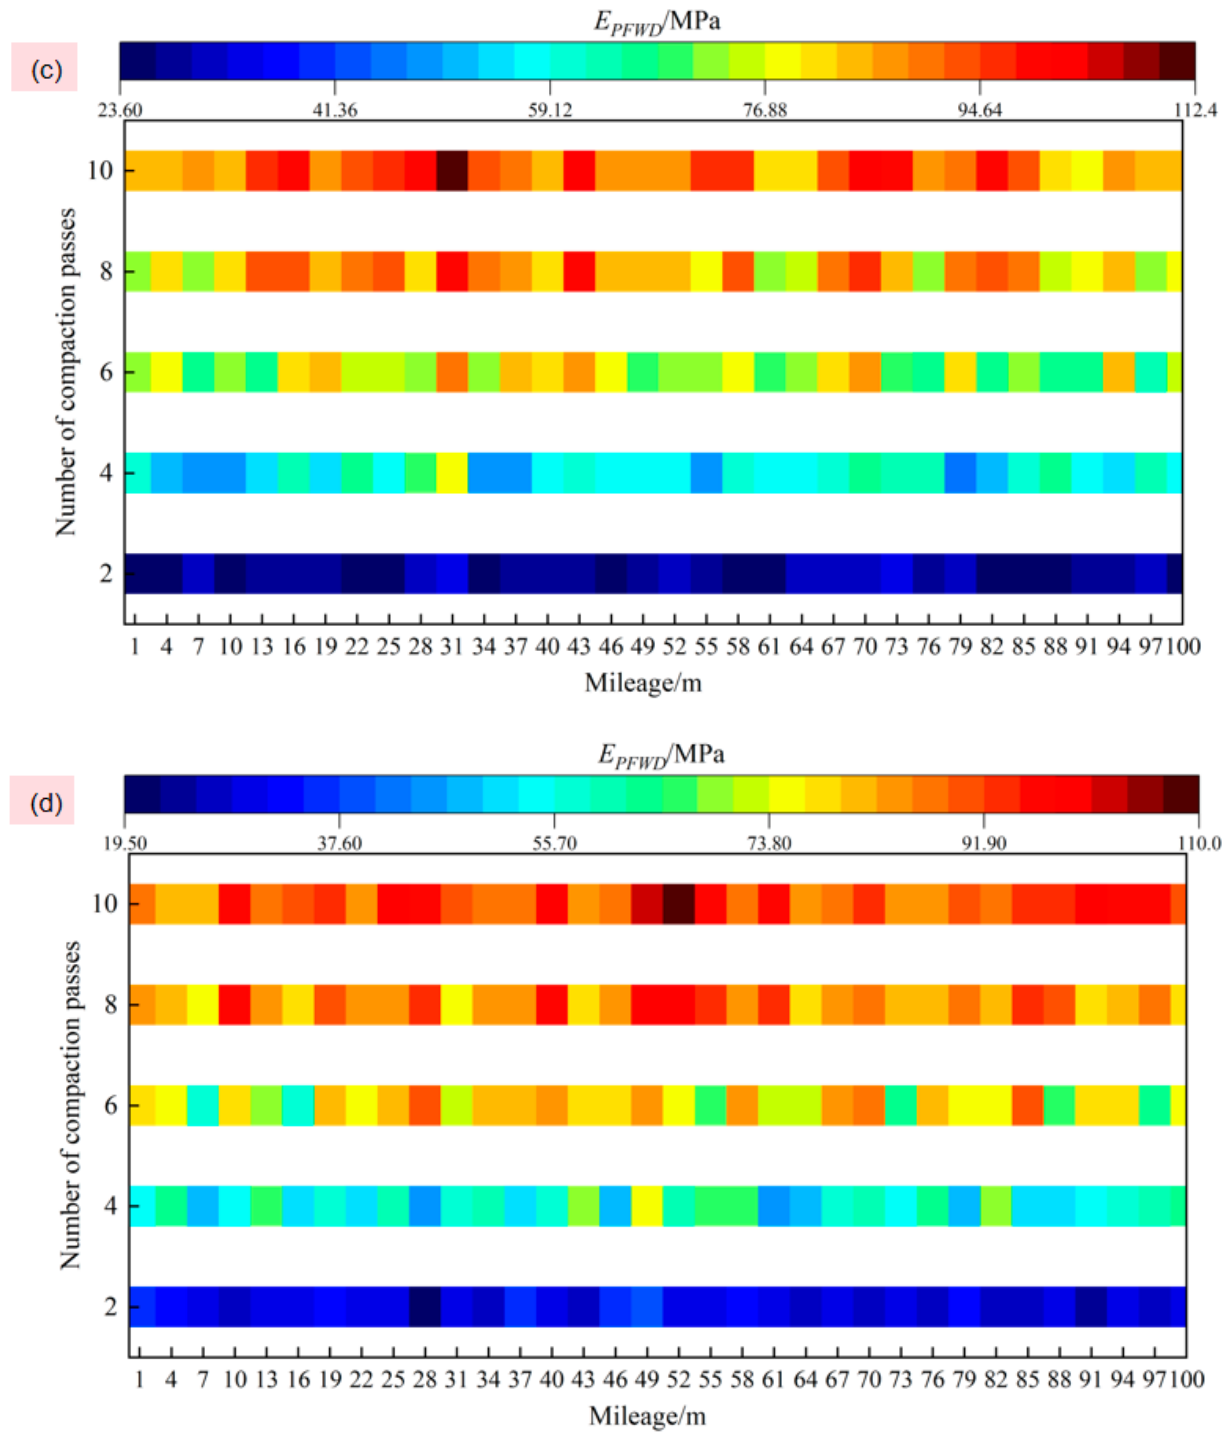
Taking lanes B, D, E, and G of the fourth filler layer as examples, a subgrade compaction uniformity evaluation based on EPFWD was carried out, and heatmaps of EPFWD varying with mileage during the compaction process were plotted (Figure 8). As shown in Figure 8, EPFWD gradually increased with increasing compaction passes and exhibited obvious staged evolution characteristics, which were consistent with the boxplot results shown in Figure 7. After the second compaction pass, all lanes were mainly dominated by low-value blue regions, and the dynamic modulus was primarily concentrated within 20–40 MPa. After the fourth and sixth vibration compaction passes, the colors gradually transitioned to green and yellow, and the modulus increased to 50–80 MPa. After the eighth and tenth compaction passes, most areas changed to orange-red regions, with a significant increase in high-value areas, and the dynamic modulus basically reached 80–100 MPa.
Figure 8.
Heatmaps of EPFWD variation with mileage: (a) lane B; (b) lane D; (c) lane E; (d) lane G. Note that different color scales were used for each compaction stage to better visualize the spatial variability of EPFWD within the corresponding stage.
The variation in EPFWD along the longitudinal direction of the subgrade (i.e., the mileage direction) was relatively small, and no obvious continuous low-value zones appeared, indicating that the longitudinal compaction quality during the construction process was relatively stable. However, certain transverse discreteness still existed among different lanes and local areas, which was particularly evident during the fourth to eighth vibration compaction stages. Intermittent alternations of high-value and low-value regions appeared in local areas of the heatmaps, indicating that differences in compaction degree existed at different positions of the filler during the vibration compaction process. Nevertheless, after the tenth static compaction pass, the color distribution of each lane became more uniform, and the differences between high and low values were significantly reduced, indicating that the overall compaction uniformity of the subgrade was further improved. To quantitatively evaluate compaction uniformity, the coefficient of variation (CV) of EPFWD at each compaction stage was calculated, as shown in Table 4. With an increase in the number of compaction passes, the CV showed a decreasing trend, indicating that the spatial uniformity of the subgrade was improved.
Table 4.
Statistical characteristics and coefficient of variation of EPFWD under different compaction passes.
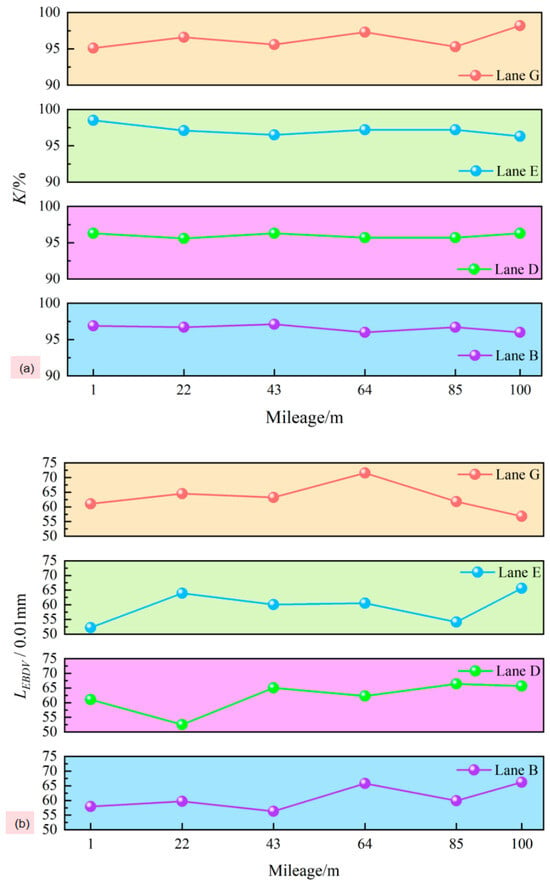
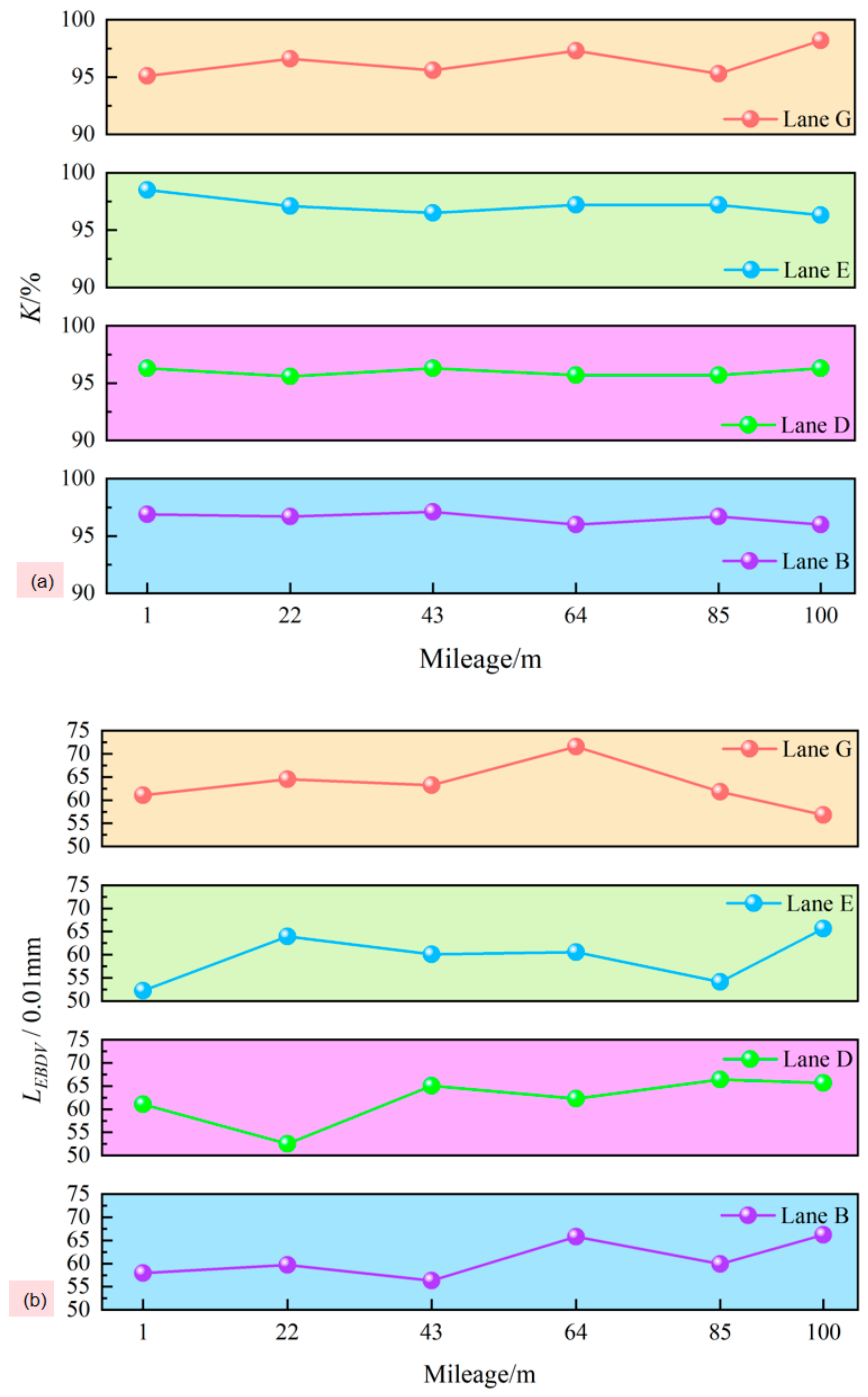
Figure 9 presents the relationships of subgrade compaction degree K measured by the cutting ring method and the equivalent Benkelman Beam Deflection Value (LEBDV) converted from the FWD measurements with the mileage of the test section for lanes B, D, E, and G of the fourth filler layer. As shown in the figure, the compaction degree curves of each lane changed relatively smoothly, and the K values remained stable above 95%, with only small local fluctuations, indicating that the overall compaction quality of the test section was good and exhibited high longitudinal uniformity. In contrast, LEBDV showed certain fluctuations along the mileage direction, but all values were generally lower than 0.075 mm, satisfying the requirements for bearing capacity and deformation control of the roadbed structure. The compaction degree K mainly reflects the compactness of the soil, and its test results are less affected by local particle contact conditions and transient load responses; therefore, it exhibited good stability along the route. Although the overall compaction degree satisfied the specification requirements, differences still existed in the internal skeleton structure of the subgrade, particle interlocking conditions, and interlayer contact conditions, resulting in inconsistencies in the overall structural stiffness. As an indicator reflecting the overall stress and deformation capacity of the subgrade, LEBDV is sensitive to variations in soil stiffness, and thus its spatial discreteness was relatively more pronounced. In some local areas, although the variation in compaction degree was small, fluctuations in deflection still occurred due to differences in filler gradation, moisture content, or local compaction energy transmission.
Figure 9.
Variation of compaction quality indicators along the mileage of the test section: (a) compaction degree K measured by the CRM; (b) LEBDV converted from FWD measurements.
3.3. Correlation Analysis of EPFWD with K and LEBDV
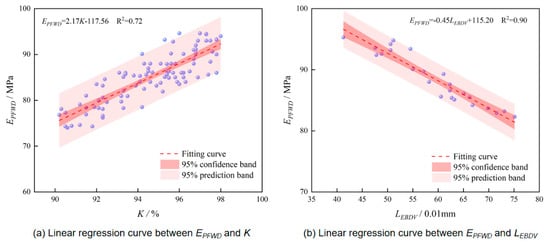
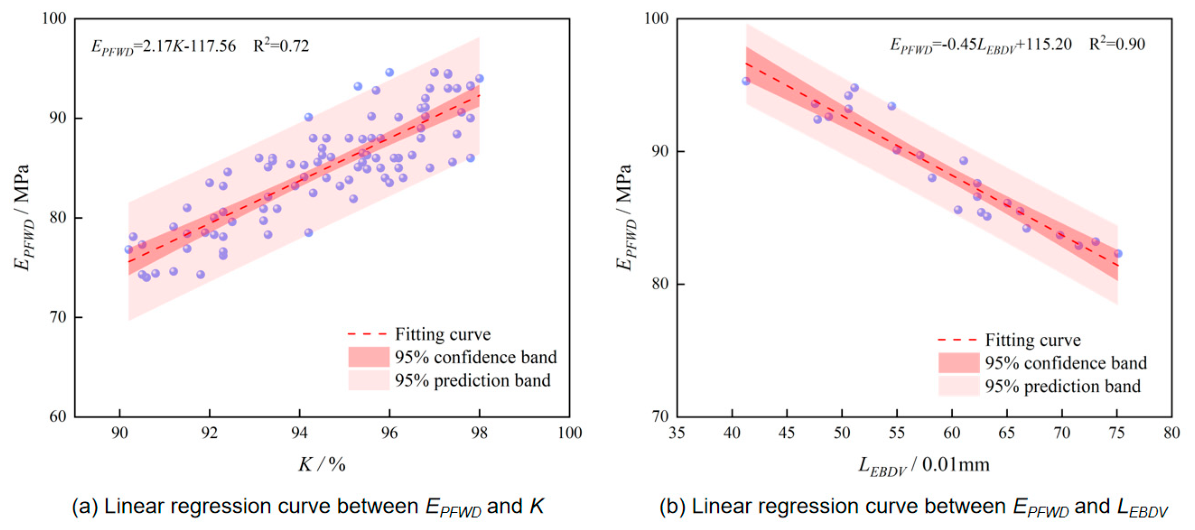
Correlation analyses were conducted between EPFWD and both K and LEBDV, and the linear regression results are shown in Figure 10. As shown in Figure 10, EPFWD exhibited good linear correlations with both parameters, although the degrees of correlation were different. EPFWD showed a positive correlation with K, with a correlation of determination (R2) of 0.72. As the compaction degree increased, the dynamic modulus of the subgrade generally exhibited an increasing trend, although the data were relatively scattered. EPFWD exhibited a significant negative correlation with LEBDV, with a correlation of determination (R2) of 0.90, indicating high consistency between EPFWD and LEBDV. Meanwhile, both the 95% confidence interval and prediction interval were relatively concentrated, indicating good stability and reliability of the results. The compaction degree K reflects the compactness of the soil, and its test results are mainly affected by local dry density, making it difficult to comprehensively characterize the overall mechanical behavior of the subgrade. Therefore, even when the compaction degree in different regions is similar, differences in structural stiffness may still exist, resulting in a relatively weaker correlation between EPFWD and K. In contrast, both the PFWD and FWD are based on the dynamic response under transient impact loading and reflect the overall stiffness and deformation capacity of the subgrade through deflection values. Their mechanisms therefore exhibit strong consistency, resulting in a strong linear relationship between EPFWD and LEBDV. Compared with traditional compaction degree indices, the evaluation method based on PFWD dynamic modulus can more realistically and effectively reflect the overall structural performance and compaction quality of the subgrade.
Figure 10.
Regression curves of EPFWD with K and LEBDV.
4. Discussion
The staged increase in EPFWD observed in this study reflects the progressive development of the internal soil skeleton during compaction. In the initial compaction stage, soil particles mainly undergo rearrangement and pore reduction near the surface, resulting in limited stiffness improvement. As vibration energy is gradually transferred to deeper layers, particle interlocking becomes more effective, and a stable load-transfer skeleton is formed, leading to a rapid increase in dynamic modulus. Similar trends have been reported by Rafiei et al. [14] and Xia et al. [17], who found that the PFWD modulus is highly sensitive to the evolution of soil density and stiffness during compaction. However, compared with previous studies that mainly focused on the relationship between PFWD modulus and compaction degree, the present study further reveals the spatial evolution characteristics of compaction uniformity through large—scale field measurements.
The strong correlation between EPFWD and FWD deflection indicates that both indices reflect the overall structural stiffness of the subgrade rather than merely local density conditions. This finding is consistent with the observations of Kavussi et al. [16], who reported that PFWD can effectively characterize the bearing capacity of pavement layers. Nevertheless, the correlation between EPFWD and compaction degree was relatively weaker, suggesting that density-based indicators alone may not fully represent the mechanical performance of compacted soils. Differences in moisture distribution, particle contact conditions, and stress transmission paths may result in similar compaction degrees but different stiffness responses. It should be noted that the regression relationships were established and evaluated using data collected from the same test section. Therefore, the reported coefficients should be interpreted as indicative correlations rather than fully validated predictive models. Future studies should employ cross-validation and independent field sections to assess model robustness and generalizability.
However, EPFWD is still affected by the coupled effects of multiple factors such as moisture content, particle gradation, and filler layer thickness, and therefore its results do not represent a single material parameter. Consequently, PFWD is more suitable as a comprehensive evaluation index based on structural response rather than as a direct replacement for traditional specification indices.
5. Conclusions
This study proposed a rapid and nondestructive detection method for subgrade compaction quality based on PFWD and verified its feasibility in evaluating subgrade compaction quality and uniformity through field tests. The main conclusions are as follows:
- (1)
- The EPFWD increased significantly with increasing compaction passes and exhibited a staged evolution pattern of “rapid increase—slow increase—stabilization”. After the eighth compaction pass, the modulus became generally stable, with values mainly ranging from 78 to 85 MPa.
- (2)
- The spatial distribution of EPFWD indicated that the longitudinal compaction quality of the subgrade was relatively uniform, while certain transverse variability existed among different lanes during the vibration compaction stage. This variability was noticeably reduced after the final static compaction pass.
- (3)
- The compaction degree K remained above 95% throughout the test section, while the equivalent Beckman beam deflection values measured by FWD satisfied the specification requirements. Both indicators confirmed that the subgrade achieved the required construction quality.
- (4)
- EPFWD showed good correlations with both K and LEBDV, with correlation of determination (R2) of 0.72 and 0.90, respectively. The results suggest that PFWD dynamic modulus can effectively characterize subgrade stiffness and compaction uniformity. However, further validation under different soil types and construction conditions is required before broader application.
The results demonstrate the feasibility of using PFWD dynamic modulus as a practical indicator for rapid assessment of subgrade compaction quality and spatial uniformity under field construction conditions. Future research will focus on conducting similar field investigations at multiple sites with different subgrade materials (e.g., clay, sandy soil, and granular fill) and varying environmental conditions to further validate the robustness and applicability of the proposed evaluation method and to establish more universally applicable prediction models.
Author Contributions
Resources, J.L.; investigation, H.Z.; software, X.M.; validation, H.Z., X.M. and G.Y.; formal analysis, G.Y.; data curation, Y.B.; writing—original draft preparation, J.L., H.Z., X.M., Y.B. and G.Y.; writing—review and editing, J.L. and Y.B.; funding acquisition, G.Y. All authors have read and agreed to the published version of the manuscript.
Funding
The authors appreciated the financial support from the National Natural Science Foundation of China (No. 52079078) and the Hebei Provincial Key Research Projects (No. 20375504D).
Institutional Review Board Statement
Not applicable.
Informed Consent Statement
Not applicable.
Data Availability Statement
The original contributions presented in this study are included in the article. Further inquiries can be directed to the corresponding authors.
Acknowledgments
Special thanks go to all those who helped in the course of the study.
Conflicts of Interest
Authors Jinfeng Liu, Hongning Zhou and Xiaodong Ma were employed by the company Shijiazhuang Hengxi Expressway Construction Management Co., Ltd. The remaining authors declare that the research was conducted in the absence of any commercial or financial relationships that could be construed as a potential conflict of interest.
Abbreviations
The following abbreviations are used in this manuscript:
| CRM | Cutting Ring Method |
| PFWD | Portable Falling Weight Deflectometers |
| FWD | Falling Weight Deflectometers |
| CBR | California Bearing Ratio |
| EPFWD | PFWD dynamic modulus |
| LEBDV | Equivalent Beckman Beam Deflection Value |
References
- Han, T.; Zhu, Y.; Huang, W.; Jiang, S.Q.; Zhang, J.M. Detection of uniformity and spatial correlation of subgrade compaction quality based on intelligent compaction technology. Case Stud. Constr. Mater. 2024, 21, e03636. [Google Scholar] [CrossRef] [Scilit]
- Cuccurullo, A.; Gallipoli, D.; Bruno, A.W.; Augarde, C.; Hughes, P.; La Borderie, C. A comparative study of the effects of particle grading and compaction effort on the strength and stiffness of earth building materials at different humidity levels. Constr. Build. Mater. 2021, 306, 124770. [Google Scholar] [CrossRef] [Scilit]
- Zhang, Q.; An, Z.; Huangfu, Z.; Li, Q. A review on roller compaction quality control and assurance methods for earthwork in five application scenarios. Materials 2022, 15, 2610. [Google Scholar] [CrossRef] [Scilit] [PubMed]
- Bong, T.; Chung, T.K.; Baek, S.H. Interpretation of dynamic cone penetrometer and light weight deflectometer data for subgrade compaction quality control. Constr. Build. Mater. 2026, 523, 146225. [Google Scholar] [CrossRef] [Scilit]
- Tong, Z.; Gao, J.; Zhang, H. Innovative method for recognizing subgrade defects based on a convolutional neural network. Constr. Build. Mater. 2018, 169, 69e82. [Google Scholar] [CrossRef] [Scilit]
- Wang, X.; Dong, X.; Li, X.; Zhang, J.; Ma, G.; Li, J. Micro-destructive assessment of subgrade compaction quality using ultrasonic pulse velocity. J. Rock. Mech. Geotech. Eng. 2024, 16, 4782–4797. [Google Scholar] [CrossRef] [Scilit]
- Zhang, L. Causes of highway pavement damage and technical measures for maintenance. China J. Highw. Transp. 2018, 21, 104–105. [Google Scholar]
- Wang, X.; Dong, X.; Zhang, Z.; Zhang, J.; Ma, G.; Yang, X. Compaction quality evaluation of subgrade based on soil characteristics assessment using machine learning. Transp. Geotech. 2022, 32, 100703. [Google Scholar] [CrossRef] [Scilit]
- Park, S.S. Evaluation of the sand-cone method for determination of the in-situ density of soil. Geotechnique 2010, 60, 701–707. [Google Scholar]
- Hernanz, J.L.; Peixoto, H.; Cerisola, C.; Sánchez-Girón, V. An empirical model to predict soil bulk density profiles in field conditions using penetration resistance, moisture content and soil depth. J. Terramechanics 2000, 37, 167–184. [Google Scholar] [CrossRef] [Scilit]
- Fu, G.; Zhao, Y.; Zhou, C.; Liu, W. Determination of effective frequency range excited by falling weight deflectometer loading history for asphalt pavement. Constr. Build. Mater. 2020, 235, 117792. [Google Scholar] [CrossRef] [Scilit]
- Elshaer, M.; Ghayoomi, M.; Daniel, J.S. The role of predictive models for resilient modulus of unbound materials in pavement FWD-deflection assessment. Road. Mater. Pavement Des. 2020, 21, 374–392. [Google Scholar]
- Sirithepmontree, H.; Sapsathiarn, Y. Dynamic soil models for backcalculation of material properties from falling weight deflectometer deflection data. Procedia Eng. 2017, 189, 152–157. [Google Scholar] [CrossRef] [Scilit]
- Rafiei, K.; Kavussi, A.; Yasrobi, S. Construction quality control of unbound layers based on stiffness modulus criteria. J. Civ. Eng. Manag. 2012, 18, 5–13. [Google Scholar] [CrossRef] [Scilit]
- Zhang, J.H.; Ding, L.; Zheng, J.L.; Gu, F. Deterioration mechanism and rapid detection of performances of an existing subgrade in southern China. J. Cent. South Univ. 2020, 27, 2134–2147. [Google Scholar] [CrossRef] [Scilit]
- Kavussi, A.; Rafiei, K.; Yasrobi, S. Evaluation of PFWD as potential quality control tool of pavement layers. J. Civ. Eng. Manag. 2010, 16, 123–129. [Google Scholar] [CrossRef] [Scilit]
- Xia, H.; Wang, L.; Xie, X. Fast Detection and Evaluation Methods of Semi-Rigid Base Compaction Quality Based on Portable Falling Weight Deflectometer (PFWD). In 17th COTA International Conference of Transportation Professionals; American Society of Civil Engineers: Reston, VA, USA, 2017; Volume 7. [Google Scholar]
- Steinert, B.C.; Humphrey, D.N.; Kestler, M.A.; Eaton, R.; Benda, C.C.; Berg, R.L. Monitoring stiffness of gravel surfaced roads during spring thaw using a portable falling weight deflectometer. In Current Practices in Cold Regions Engineering; American Society of Civil Engineers: Reston, VA, USA, 2006; pp. 1–15. [Google Scholar]
- George, V.; Kumar, A. Effect of soil parameters on modulus of resilience based on portable falling weight deflectometer tests on lateritic sub-grade soils. Int. J. Geotech. Eng. 2020, 14, 55–61. [Google Scholar]
- Grajewski, S.M. Prediction of primary deformation modulus based on bearing capacity: A case on forest road with a light falling weight deflectometer zorn ZFG 3000 GPS. Forests 2022, 13, 1874. [Google Scholar] [CrossRef] [Scilit]
- JTG 3450-2019; Field Test Methods of Highway Subgrade and Pavement. China Communications Press: Beijing, China, 2019.
- JTG 3441-2024; Test Methods of Materials Stabilized with Inorganic Binders for Highway Engineering. China Communications Press: Beijing, China, 2024.
- JTG 3430-2020; Test Methods of Soils for Highway Engineering. China Communications Press: Beijing, China, 2020.

Disclaimer/Publisher’s Note: The statements, opinions and data contained in all publications are solely those of the individual author(s) and contributor(s) and not of MDPI and/or the editor(s). MDPI and/or the editor(s) disclaim responsibility for any injury to people or property resulting from any ideas, methods, instructions or products referred to in the content. |
© 2026 by the authors. Licensee MDPI, Basel, Switzerland. This article is an open access article distributed under the terms and conditions of the Creative Commons Attribution (CC BY) license.