


Abstract
The present study is focused on experimental identification of a 21-story reinforced concrete residential building with dynamic parameters at each story, based on measurements conducted under ambient dynamic loadings and further analytical evaluation. These loadings include distant explosions, and natural ground excitations such as weak earthquakes, wind loads, operation of mechanical systems within the building, etc. The measurements were carried out using sensors and a seismograph, installed independently on each floor of the building. The primary objective of the study is to identify the building’s natural vibration periods and mode shapes, as well as to calculate the story stiffness within the linear elastic behavior. Additionally, the structure’s response to a remote explosion, occurring hundreds of kilometers away and generating a weak ground motion, was recorded. This event enabled comparison between the actual dynamic response of the building and corresponding analytical results. The proposed method offers a practical and effective tool for structural health monitoring, allowing for the detection of changes in the structural dynamic parameters of the building. At the same time, in certain cases, a difference between experimental and numerical results appeared. This problem requires further experimental and numerical investigation.
1. Introduction
Research on experimental identification of dynamic parameters and health monitoring of real buildings has significantly advanced in recent years. It became possible due to developments in sensing technology, signal processing, and data analysis methods. Modern studies are more often based on 3D sensors and continuous monitoring systems to record the dynamic response of real structures under low intensity seismic-type excitations [1,2]. It was shown that such methods can provide rather accurate values of natural vibration periods, mode shapes, damping ratios, etc. Proper sensor placement and signal processing yield limited sensitivity to noises and operational variations. This enables reliable long-term monitoring of structural dynamic parameters.
Recent developments in building monitoring standards require real time structural health monitoring for rather tall buildings [1]. It was demonstrated that measurements of ambient vibration in a 216 m office building enable accurate identification of dynamic parameters and reliable finite element predictions. Assessments of the 2023 Kahramanmaraş earthquake (Turkey) [3] highlighted the importance of nonstructural elements in seismic response of tall buildings. Energy based analysis is also one of the main components of structural design [4].
Ground motions with similar peak accelerations may induce different structural responses depending on the frequency distribution of input energy [5,6]. Energy-based seismic performance assessment enables us to understand how the input energy is distributed to kinetic, elastic, hysteretic, and damping components [7]. It was demonstrated that energy-based indicators have enhanced sensitivity to minor changes in structural dynamic parameters [8]. Beyond traditional seismic parameters, such as peak ground acceleration or elastic response spectra, the frequency distribution of input energy critically influences structural response [8].
It is known that forced vibration tests provide reliable dynamic parameters; however, they are also often impractical for residential structures due to operational constraints, high costs, and the need for specialized excitation equipment [9]. Ambient vibration testing is a good alternative to forced vibrations.
Ambient excitation techniques exploit naturally occurring low amplitude loads, including microtremors, wind, traffic, and operational vibrations, allowing non-destructive testing without interrupting building use. Although numerous studies have demonstrated that ambient vibration measurements can identify the dynamic parameters of structures, it was also reported that there are systematic differences between numerical and experimental results [10]. This highlights the importance of experimental validation of numerical models, and demonstrates the limitations of simplified numerical approaches. While many studies focus on global dynamic parameters, several researchers have emphasized the significant influence of non-structural elements on building stiffness. It was demonstrated that masonry infill walls can substantially increase the effective stiffness of RC frames, resulting in shorter natural vibration periods compared with frame models without infill walls [11]. These findings help explain why empirical code-based formulas, which estimate natural vibration periods primarily as a function of building height, often yield inaccurate results when applied to real buildings with substantial infill walls.
2. Identified Research Gap
Based on the reviewed literature, it is evident that ambient vibration testing is well established for identifying natural vibration periods and mode shapes of buildings. Direct experimental evaluation of story stiffness distributions in real tall buildings using ambient vibration measurements is still not sufficiently investigated.
Existing studies are typically based on analytical assumptions or on global response parameters, without considering stiffness variation at each story level. Although shaking table experiments have demonstrated the feasibility of extracting story stiffness under controlled conditions, dependance of these results on artificial excitation and laboratory boundary conditions limits their applicability to real buildings. Therefore, additional experiments, addressing these aspects for real buildings, are required.
The present study extends ambient vibration-based identification over conventional modal analysis and provides experimental data of each story level dynamic parameters for a real 21-story RC building. In the framework of this study, parameters such as natural vibration periods, mode shapes principal directions, and story stiffness of the investigated building were obtained.
3. Aims, Scope, and Novelty of the Present Research
The primary aim of the present research is to develop and demonstrate an experimental methodology for evaluating story level dynamic properties of a real tall RC residential building using ambient vibration measurements. The study focuses on the extraction of natural vibration periods, mode shapes, and story stiffness distribution, using the linear elastic response range of the structure.
A second aim is to compare experimentally identified dynamic properties with analytical predictions obtained from a numerical model. This comparison is intended to assess the reliability of commonly used modeling assumptions and to identify systematic deviations related to stiffness distribution, boundary conditions, and the contribution of nonstructural elements.
The scope of the present study is limited to a real 21 story RC residential building located in a moderate seismic region. The building’s response is evaluated exclusively under naturally occurring ambient excitations, including microtremors, wind induced vibrations, traffic effects, and operational loads. In addition, a recorded distant explosion provided a weak earthquake type excitation that enabled further investigation of energy distribution and modal interaction phenomena. As is known, blast induced vibrations often exhibit broadband frequency content similar to that of earthquakes [12].
All analyses are conducted under the assumption of linear elastic structural behavior, with sufficiently small vibration amplitudes to preclude damage or permanent deformation.
The investigation focuses on the first three vibration modes, which dominate the global response of the structure under ambient and low intensity dynamic loading. The experimental methodology is based on velocity measurements acquired independently on each floor using 3D sensors.
The study does not address strong motion response, non-linear behavior, damage progression, or collapse mechanism. Energy based measures are employed solely as interpretive tools to enhance understanding of measured dynamic response and to support structural health monitoring applications.
The primary novelty of the present research lies in the direct experimental evaluation of story stiffness contribution at each floor of a real building using ambient vibration data, without reliance on forced excitation, controlled loading, or permanent monitoring systems.
4. The Investigated Building
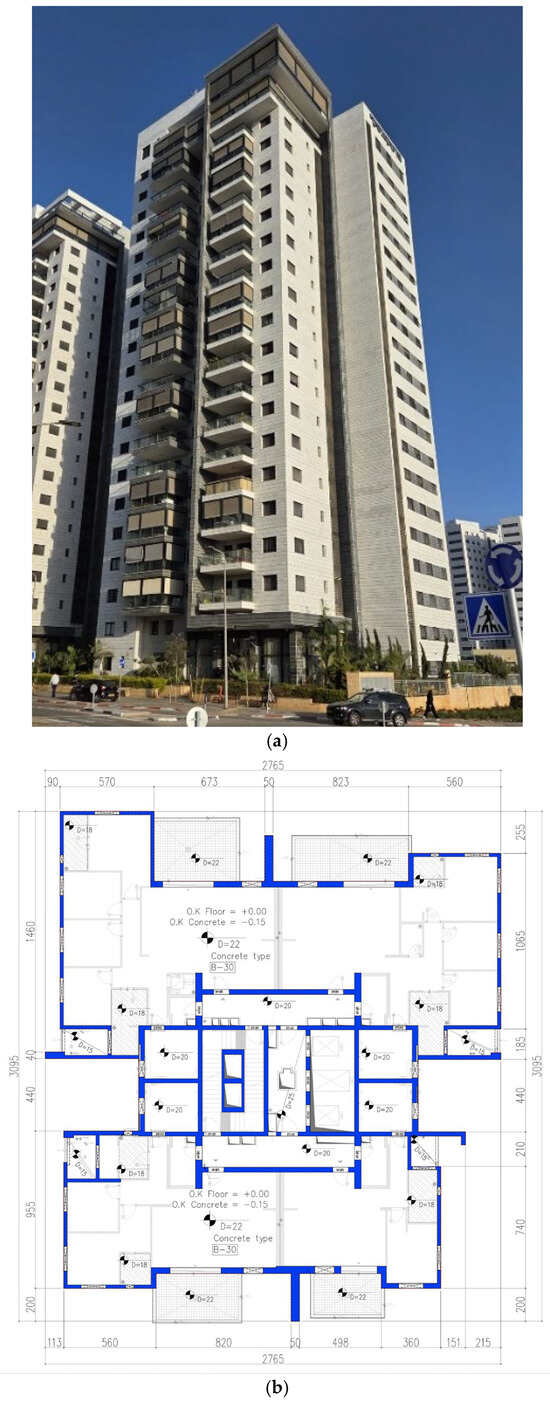
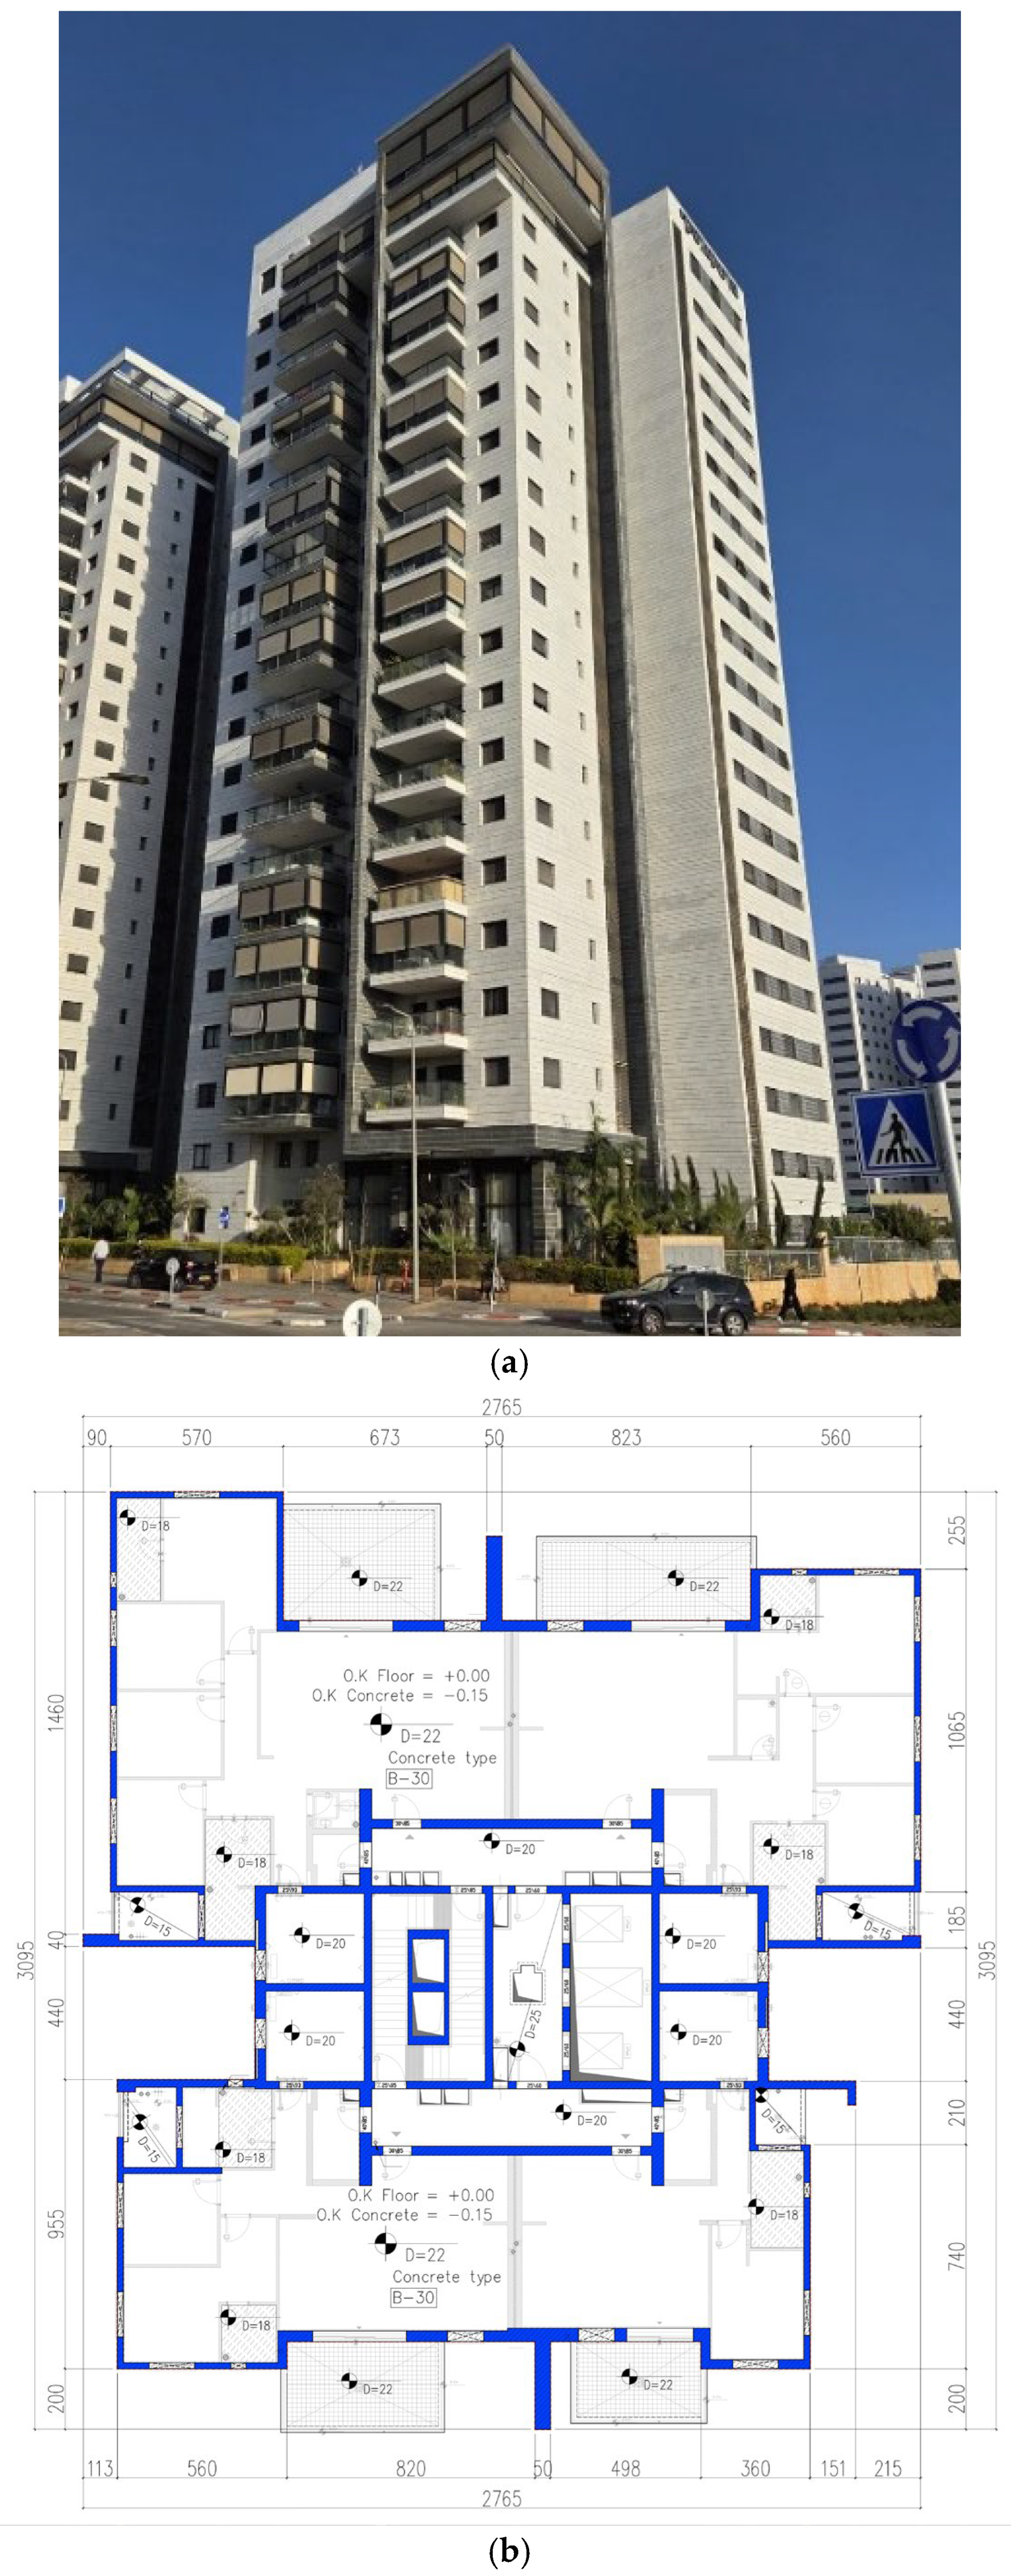
The investigated building (Figure 1) is a 21-story structure located in Ramla, Israel, forming part of a group of four similar buildings supported on a shared two-story underground parking level. The building has a typical story height of 3.1 m, typical floor area of 575 m2, a 15 cm flooring layer, and a 10 cm external stone cladding. The structure has a reinforced concrete raft foundation with a thickness of 140 cm under the main building and 100 cm under the general parking area. The site is classified as Soil Type D, with a design peak ground acceleration in the range of approximately 0.06 g [13]. A relatively clean sand layer was identified at depths ranging between 7.0 m and 11.5 m. The concrete class is C30/37 for the ground to third floors, and C25/30 for the upper floors [14].
Figure 1.
The investigated building: (a) general view, (b) typical floor scheme.
5. Research Methodology and Test Setup
Ambient vibration measurements were conducted using 3D Geophone velocity sensors, placed on each floor as well as on the roof. Geophone type 4.5 Hz Sunfull PS-4.5B and a coil resistance of 375 Ohm were used. The sensors have a sensitivity of 28.8 Volt/meter/s and effective measurement accuracy of 5 × 10⁻⁷ m/s. The experimental setup includes a data logger with sampling rate of 100 Hz, 24-bit ADC digitizer, Network Time Protocol based timing, and data format mini-SEED standard. Low frequency noise (below 0.1 Hz) was filtered using a digital filtering approach, based on the impulse response representation of linear time invariant systems, in which the output is obtained through convolution of the input signal with the system impulse response [15]. Four sensors were located on each floor.
The first step of the experiment was to identify the building’s natural vibration periods similar to the previous study that was carried out for a 4-story RC residential building with an open ground floor [10]. With this aim, the building’s vibrations under ambient vibrations were recorded and a Fast Fourier Transform (FFT) was performed.
To reveal the difference between the experimentally measured and calculated natural vibration periods, an estimate of the dominant vibration period was obtained [13]:
where H is the total building height. This estimate is approximate and does not consider nonuniform stiffness, finish materials, partition elements, connections, infill walls, or friction effects. Therefore, as it was shown in the frame of the previous research [10], the actual natural vibration period values may be different from this simplified prediction.
T = 0.049 · H 0.75 = 0.049 · 65.1 0.75 = 1.12 s
6. Story Stiffness
Story stiffness at each floor (which defines the relationship between the forces and inter-story displacements) is a key property governing the dynamic response of tall buildings. In this context, story stiffness characterizes the local lateral resistance of the building and serves as a basic description of how forces, deformations, and energy are distributed along the building height. Variations in story stiffness appear due to differences in story structural schemes, material properties, boundary conditions, etc. For a multi-story building the story stiffness ki at floor i can be calculated as:
where is the story shear force and is the inter-story drift, and ui is the story displacement.
The calculation is performed beginning with an initial assumption that drifts are within the linear behavior limits and iterate until convergence. Convergence was considered to be achieved when the relative difference between successive iterations passed below 2%. This threshold was selected because it is lower than the estimated random error of the measurements, indicating that additional iterations would not lead to a meaningful improvement in accuracy.
The external forces are:
where mi is story mass and ai is story acceleration.
The story shear is then:
where j is an index variable representing the summation from the selected floor up to the roof level, where the roof is defined as level N in the calculation.
Thus, the story stiffness is:
where
and
To enable a meaningful comparison between the experimental story stiffness values and numerical predictions, a finite element model considering the contribution of infill walls was developed. The walls were represented using equivalent diagonal strut elements [11].
Usually, the story stiffness computation converges slowly and requires several iterations. Convergence at each floor depends on that of the floors below it. Therefore, the experimental procedure involves the following steps:
- -
- selecting for each floor a time interval in which the vibration signal contains only the dominant period;
- -
- computing displacement and acceleration by integrating and differentiating the velocity signal, correspondingly;
- -
- extracting amplitude values of acceleration and displacement at the same time frame.
The above-mentioned time interval is selected based on the measured response characteristics. Across different intervals, variations in the identified natural vibration periods of the structure can be observed.
7. Cumulative Spectral Energy Distribution
The cumulative spectral energy distribution is used in the present study to quantify the frequency dependent contribution of the structural response under ambient or weak excitation. The frequency domain transformation is obtained via the Fourier transform, and the corresponding power spectral density function is defined as :
where v(t) is the measured velocity response signal and V(f) is its Fourier transform.
According to Parseval’s theorem [5], the total signal energy in the time domain is equivalent to the integral of the spectral energy in the frequency domain. For a system with mass m, the kinetic energy may be expressed as :
Based on this formulation, the cumulative spectral energy up to a given frequency f is:
where ξ is the frequency domain variable.
For comparison purposes, a normalized form is used:
This representation allows direct identification of frequency intervals in which the structural response accumulates significant portions of the total energy. In practice, sharp increases in E(f) correspond to narrow frequency bands associated with the natural vibration modes.
From a modal decomposition perspective, the structural response may be expressed as a superposition of modal contributions:
where are the mode shapes and are the modal coordinates. Substituting into the energy expression leads to a decomposition of the total energy into modal components:
where each modal contribution can be approximated in the frequency domain as
This formulation yields a direct correspondence between the spectral energy distribution and modal participation. The present approach provides an experimental representation of these theoretical participation measures, specifically, the ratio En/Etotal. This ratio may be interpreted as a frequency domain indicator of modal contribution, analogous in concept to modal participation factors.
It should be noted that the cumulative spectral energy, derived from the measured response, represents a relative energy distribution across frequencies. This representation provides a robust and physically meaningful tool for identifying dominant modes and their contribution to the total response.
8. Experimental Results
8.1. The Natural Vibration Periods of the Building
The measurements allowed identification of three natural vibration periods corresponding to the first three eigen modes of the building: s, and s. A comparison between the experimental and numerical results, obtained by FE modelling of the building, is presented in Table 1. Possible reasons for the differences between the obtained results are partial restraints of the walls at the ground floor, a difference between the designed and actual concrete strength, measurement errors, temperature effects, calculation inaccuracies, etc. Moreover, the dominant vibration period, obtained according to Equation (1) [13], is 1.12 s.; i.e., the real building has a higher stiffness compared to that predicted using the code equation, and a lower one relative to the numerical result.
Table 1.
Experimental and numerical values of natural vibration periods.
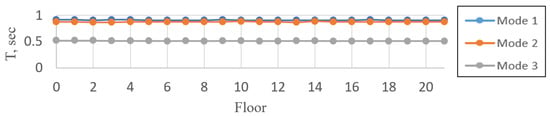
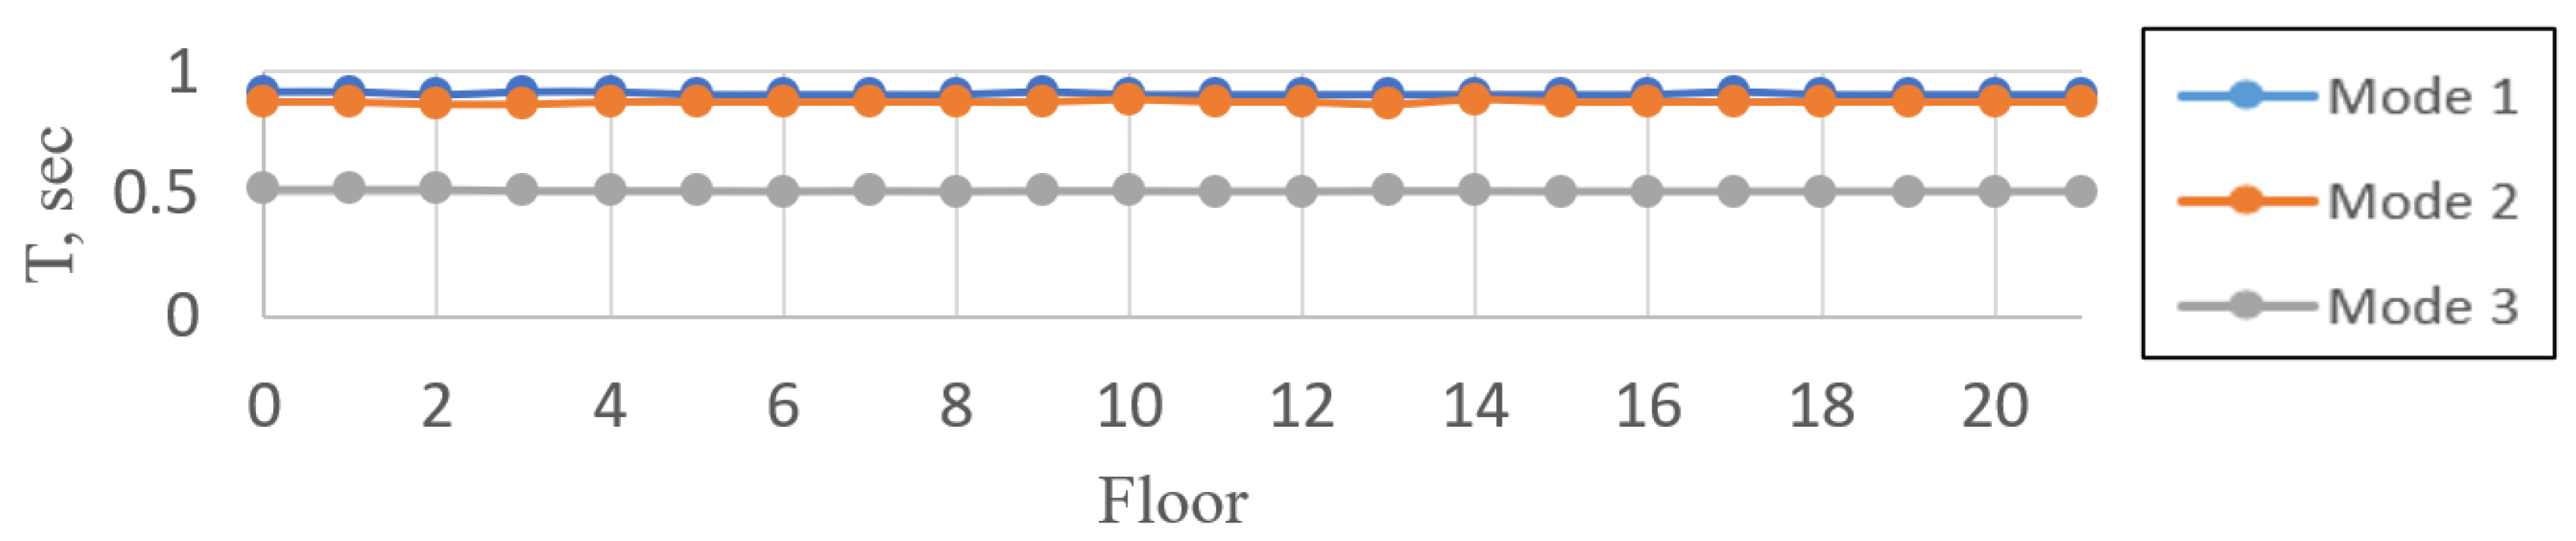
Figure 2 presents the values of natural vibration periods measured at different floors in horizontal direction. As is known, small variations in natural vibration periods (about 0.2 s), are associated with changes in the building’s state [16]. As can be seen from the figure, the difference in the results is rather small, which demonstrates the reliability of the measurement. These observations prove again that the measured natural vibration periods can be used for seismic health monitoring of buildings.
Figure 2.
Experimental values of natural vibration periods at each floor.
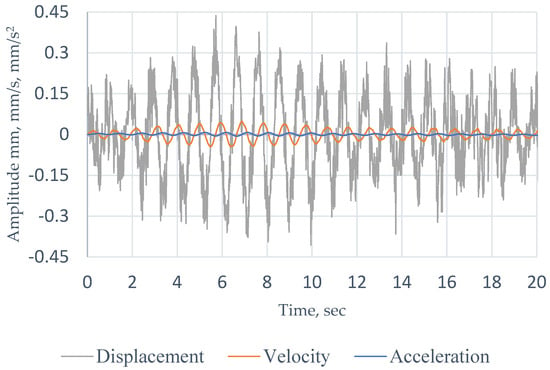
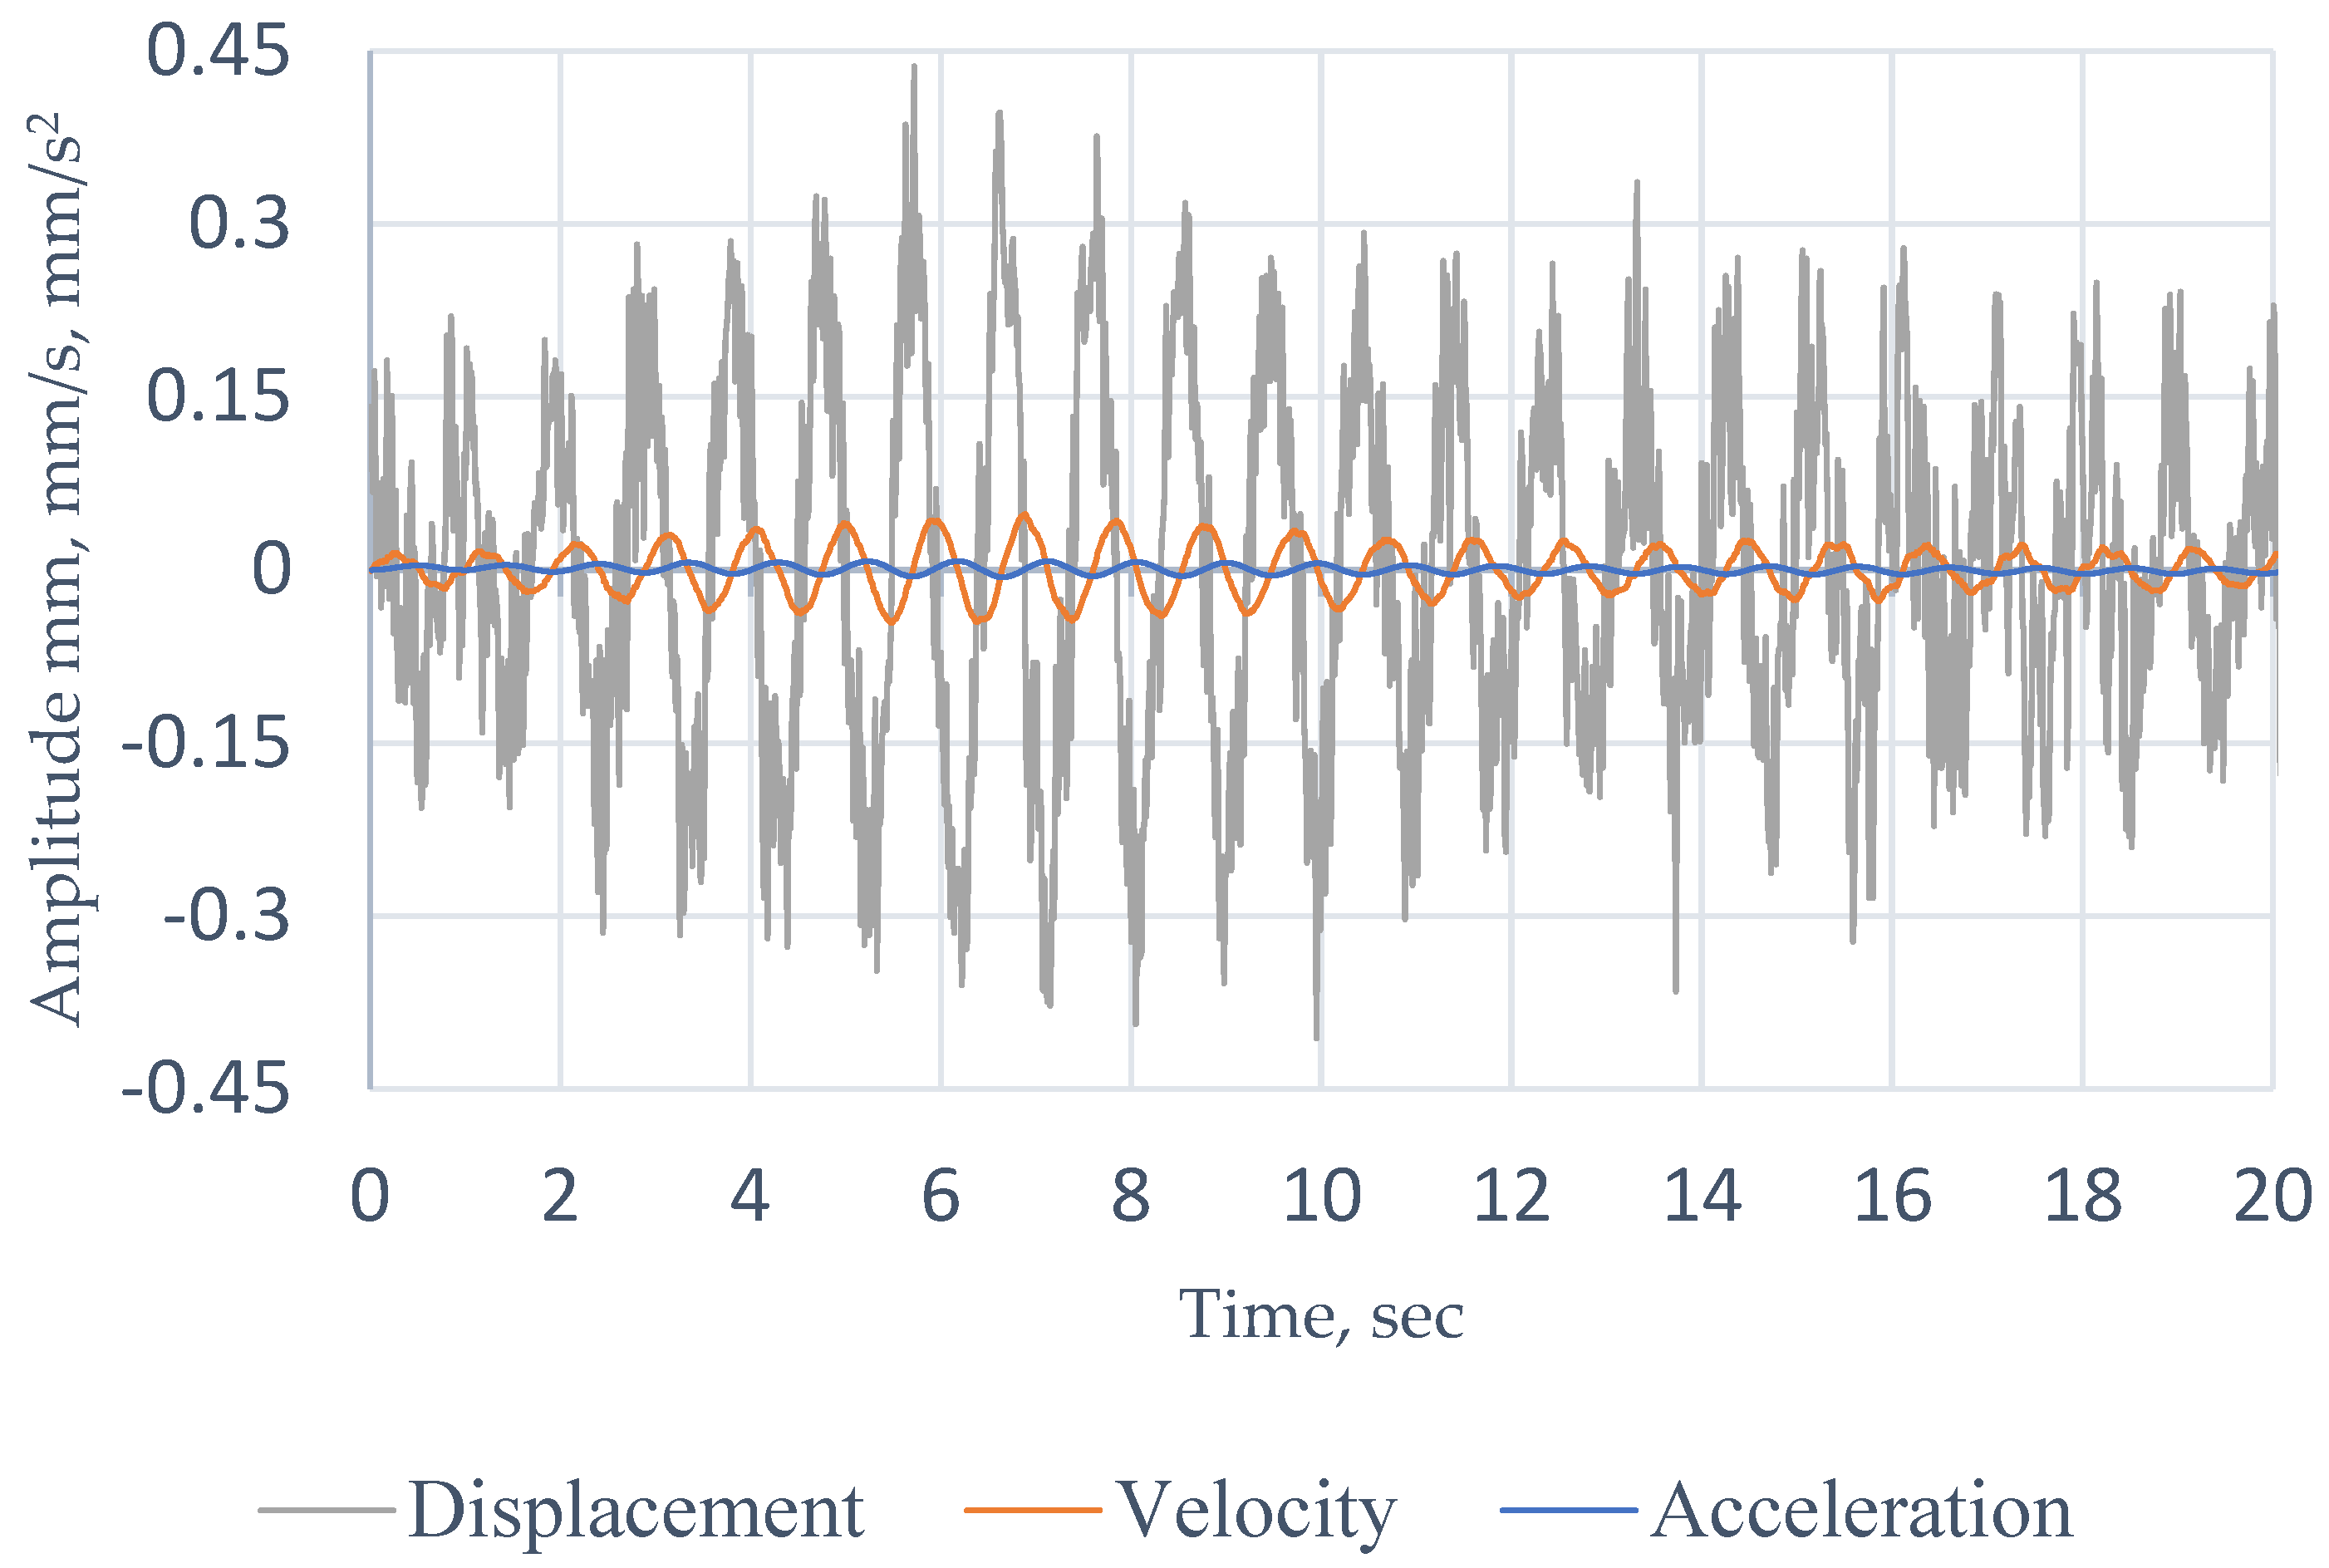
Figure 3 presents the kinematic elements of the building’s motion. The acceleration at a selected time, together with the story mass, was used to calculate the story shear force. This force and the corresponding displacement were used to calculate the story stiffness. This procedure was applied at each floor.
Figure 3.
Displacements, velocities, and accelerations on the 20th floor.
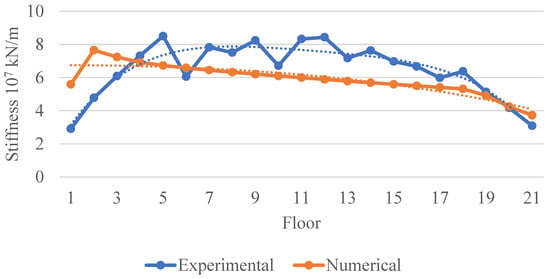
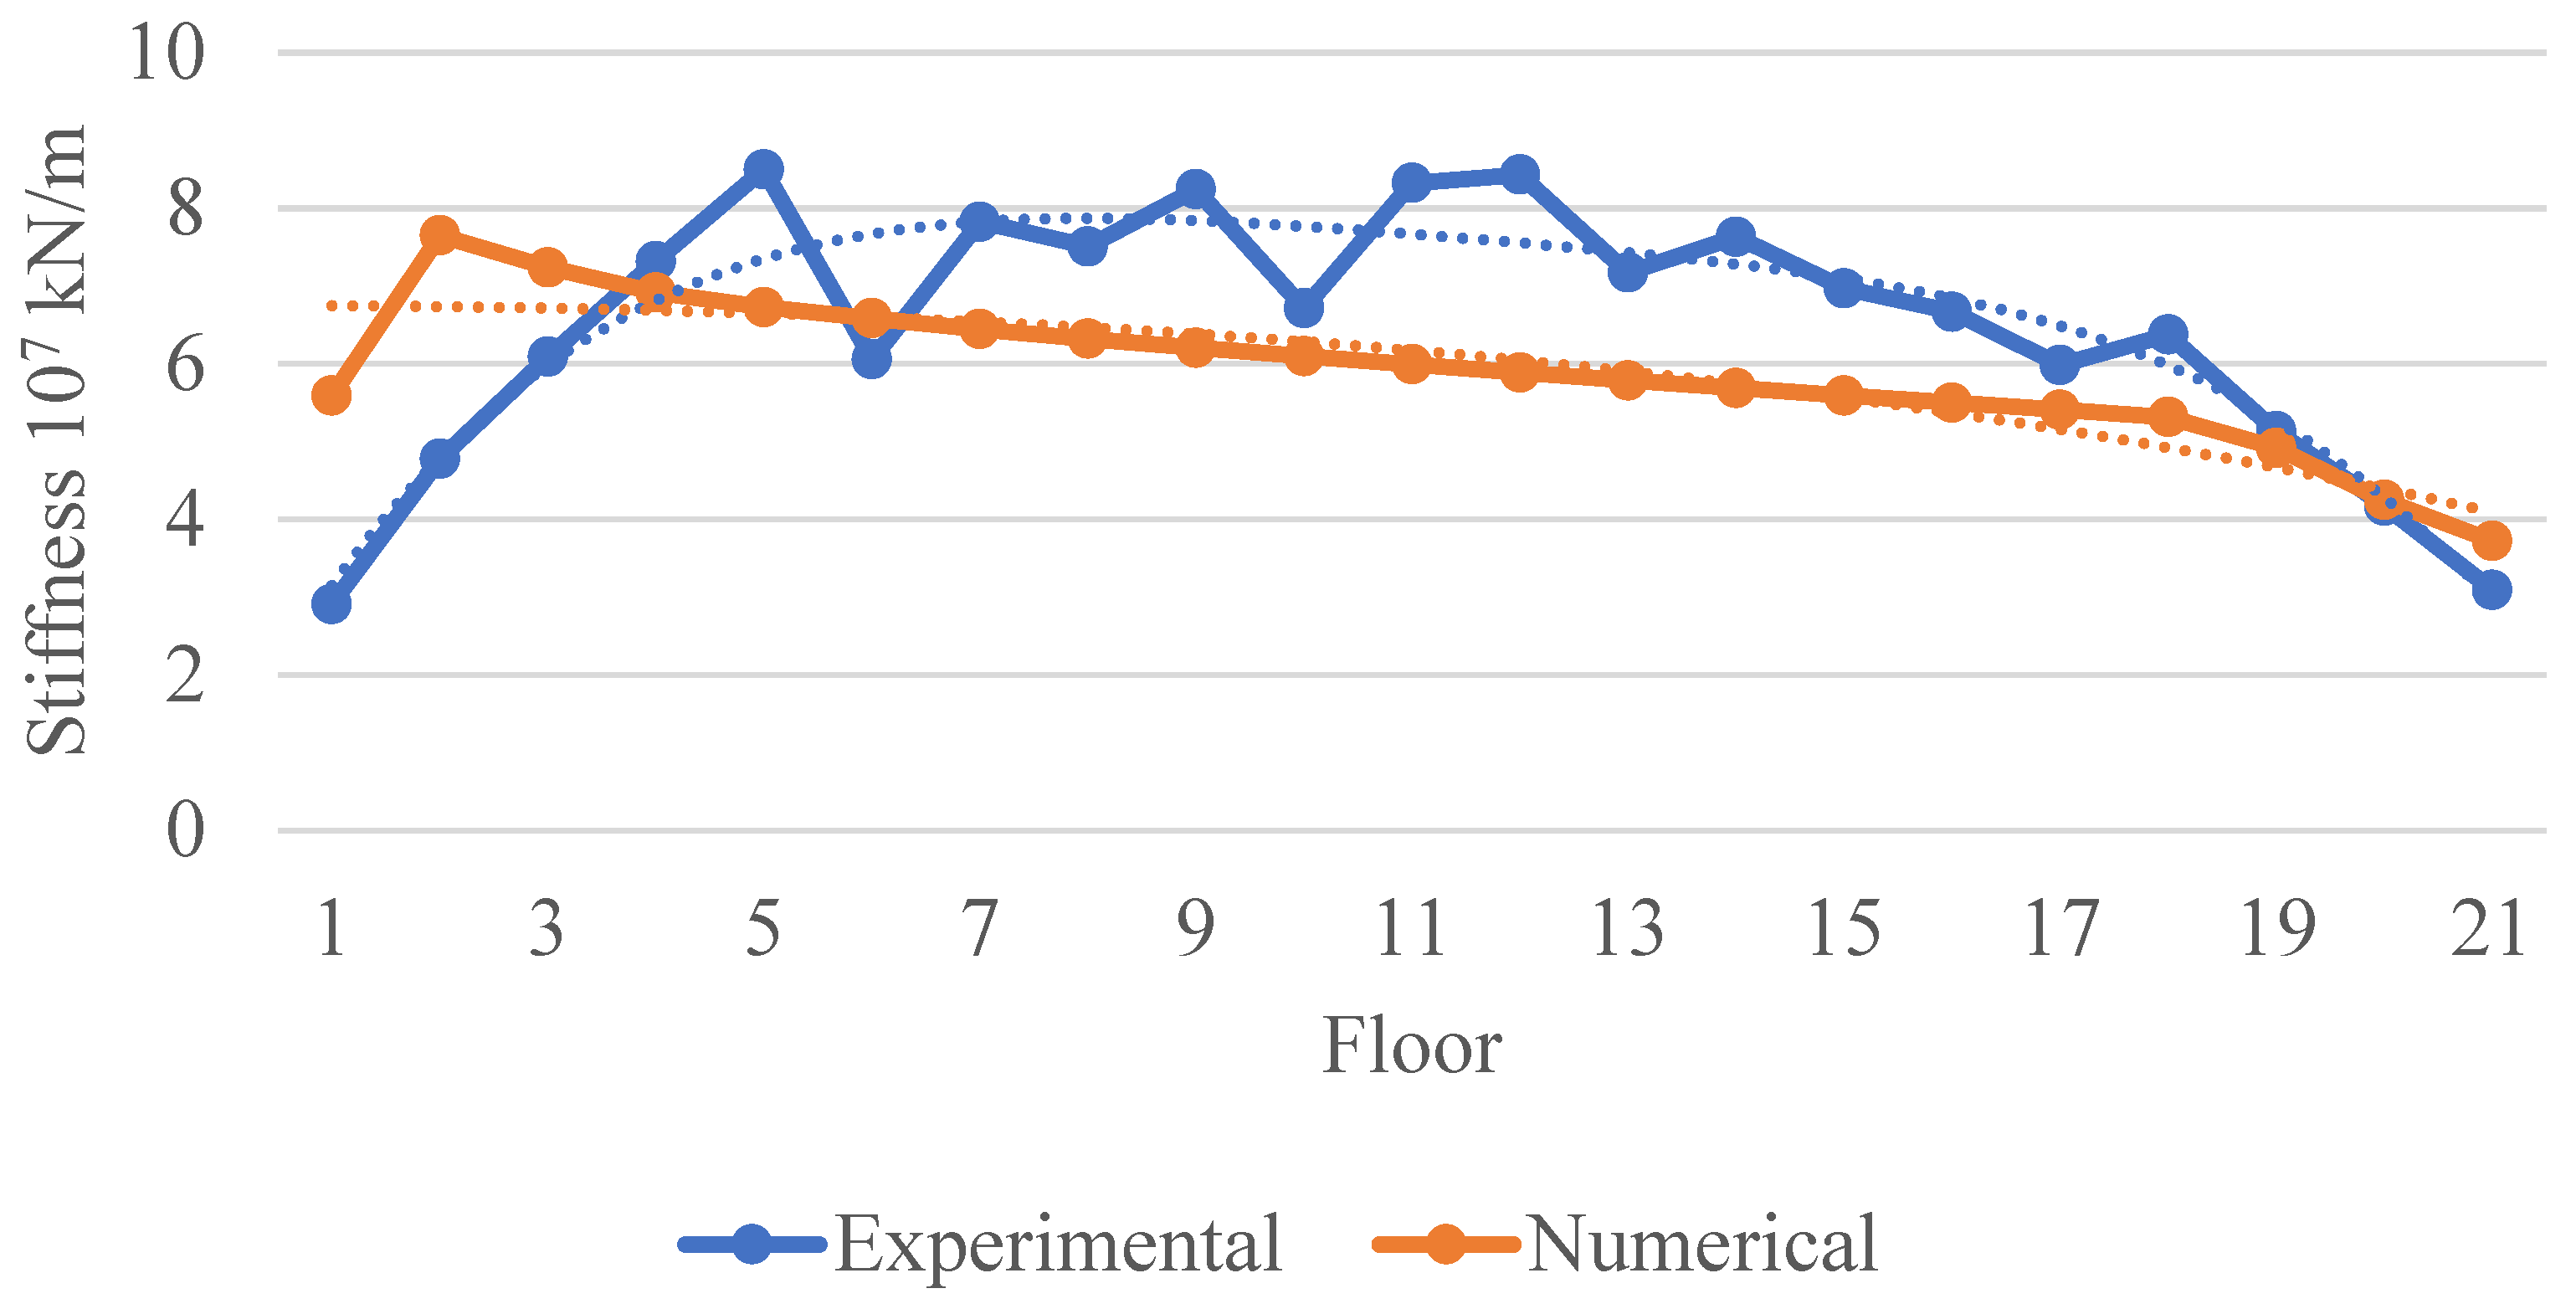
The resulting story stiffness distribution for Mode 1 and corresponding numerical results are shown in Figure 4.
Figure 4.
Floor stiffness for the first eigen mode.
The primary difference between the numerical and experimental stiffness is concentrated at the lower floors, particularly at the ground and first floors. While the numerical model predicts maximum stiffness at the second floor, the experimental results indicate a different distribution, with peak stiffness observed at the fifth floor. The structural walls were constructed using concrete class C30. Considering strength development over the building lifetime of about seven years, the in situ elastic modulus is expected to be on the order of 35 GPa. The observed story stiffness variation reflects the influence of increased seismic demand near the base of the building. At the same time, as can be seen from [11], infill walls can increase the estimated story stiffness by up to 40%.
8.2. Structural Response to a Remote Explosion
As mentioned before, a unique opportunity appeared when a large-scale explosion occurred approximately 160 km from the building site. The resulting ground motion enabled to record the building response under a pulse type loading.
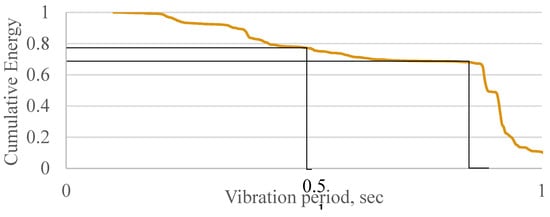
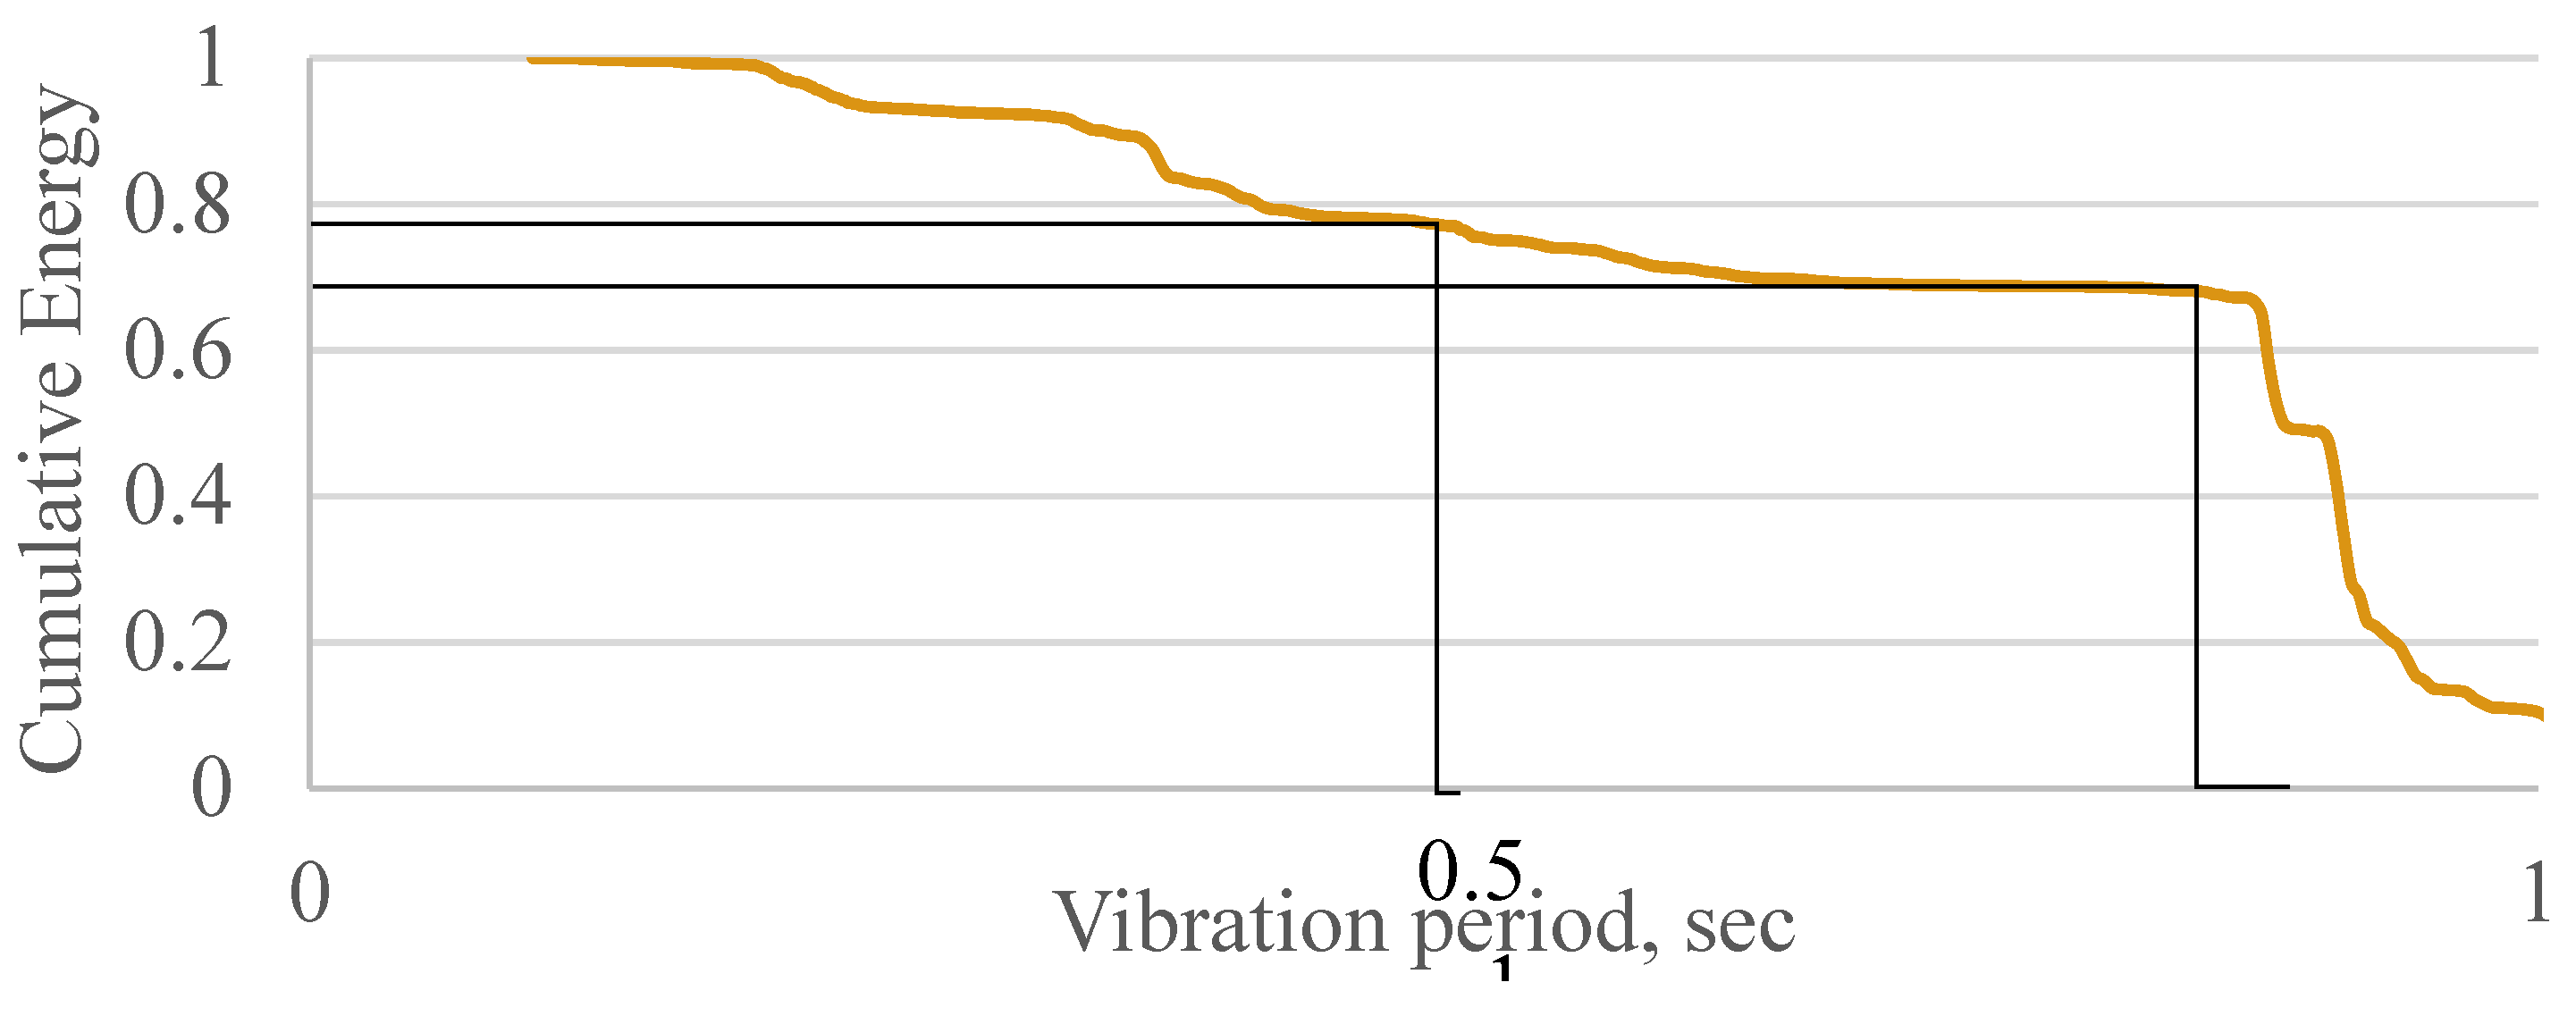
The investigated building has demonstrated linear response without any damage in the structure and even minor increase in measured natural vibration periods. The cumulative kinetic energy, associated with the explosion event, was computed using Equations (9)–(17). The obtained results are presented in Figure 5. The graph shows the normalized (to 1) energy accumulation vs. vibration period. Because the total energy is normalized, the graph highlights the relative distribution of kinetic energy across the dominant modal periods.
Figure 5.
The explosion event normalized cumulative energy and its distribution through the structure vs. natural vibration periods.
Figure 5 shows how the input energy from the remote explosion was distributed between the experimentally obtained natural vibration modes (black values on the graph). Following the graph and as known, the cumulative energy does not increase uniformly with the vibration period. Instead, distinct slope amplifications are visible within narrow period ranges that coincide with the experimentally identified natural vibration modes.
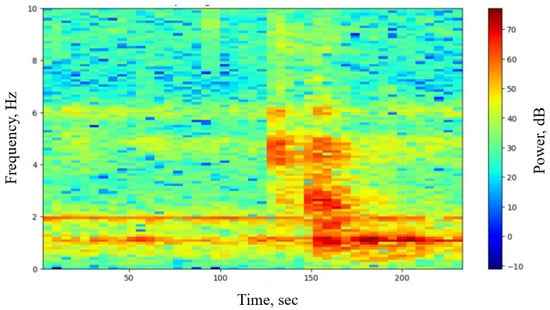
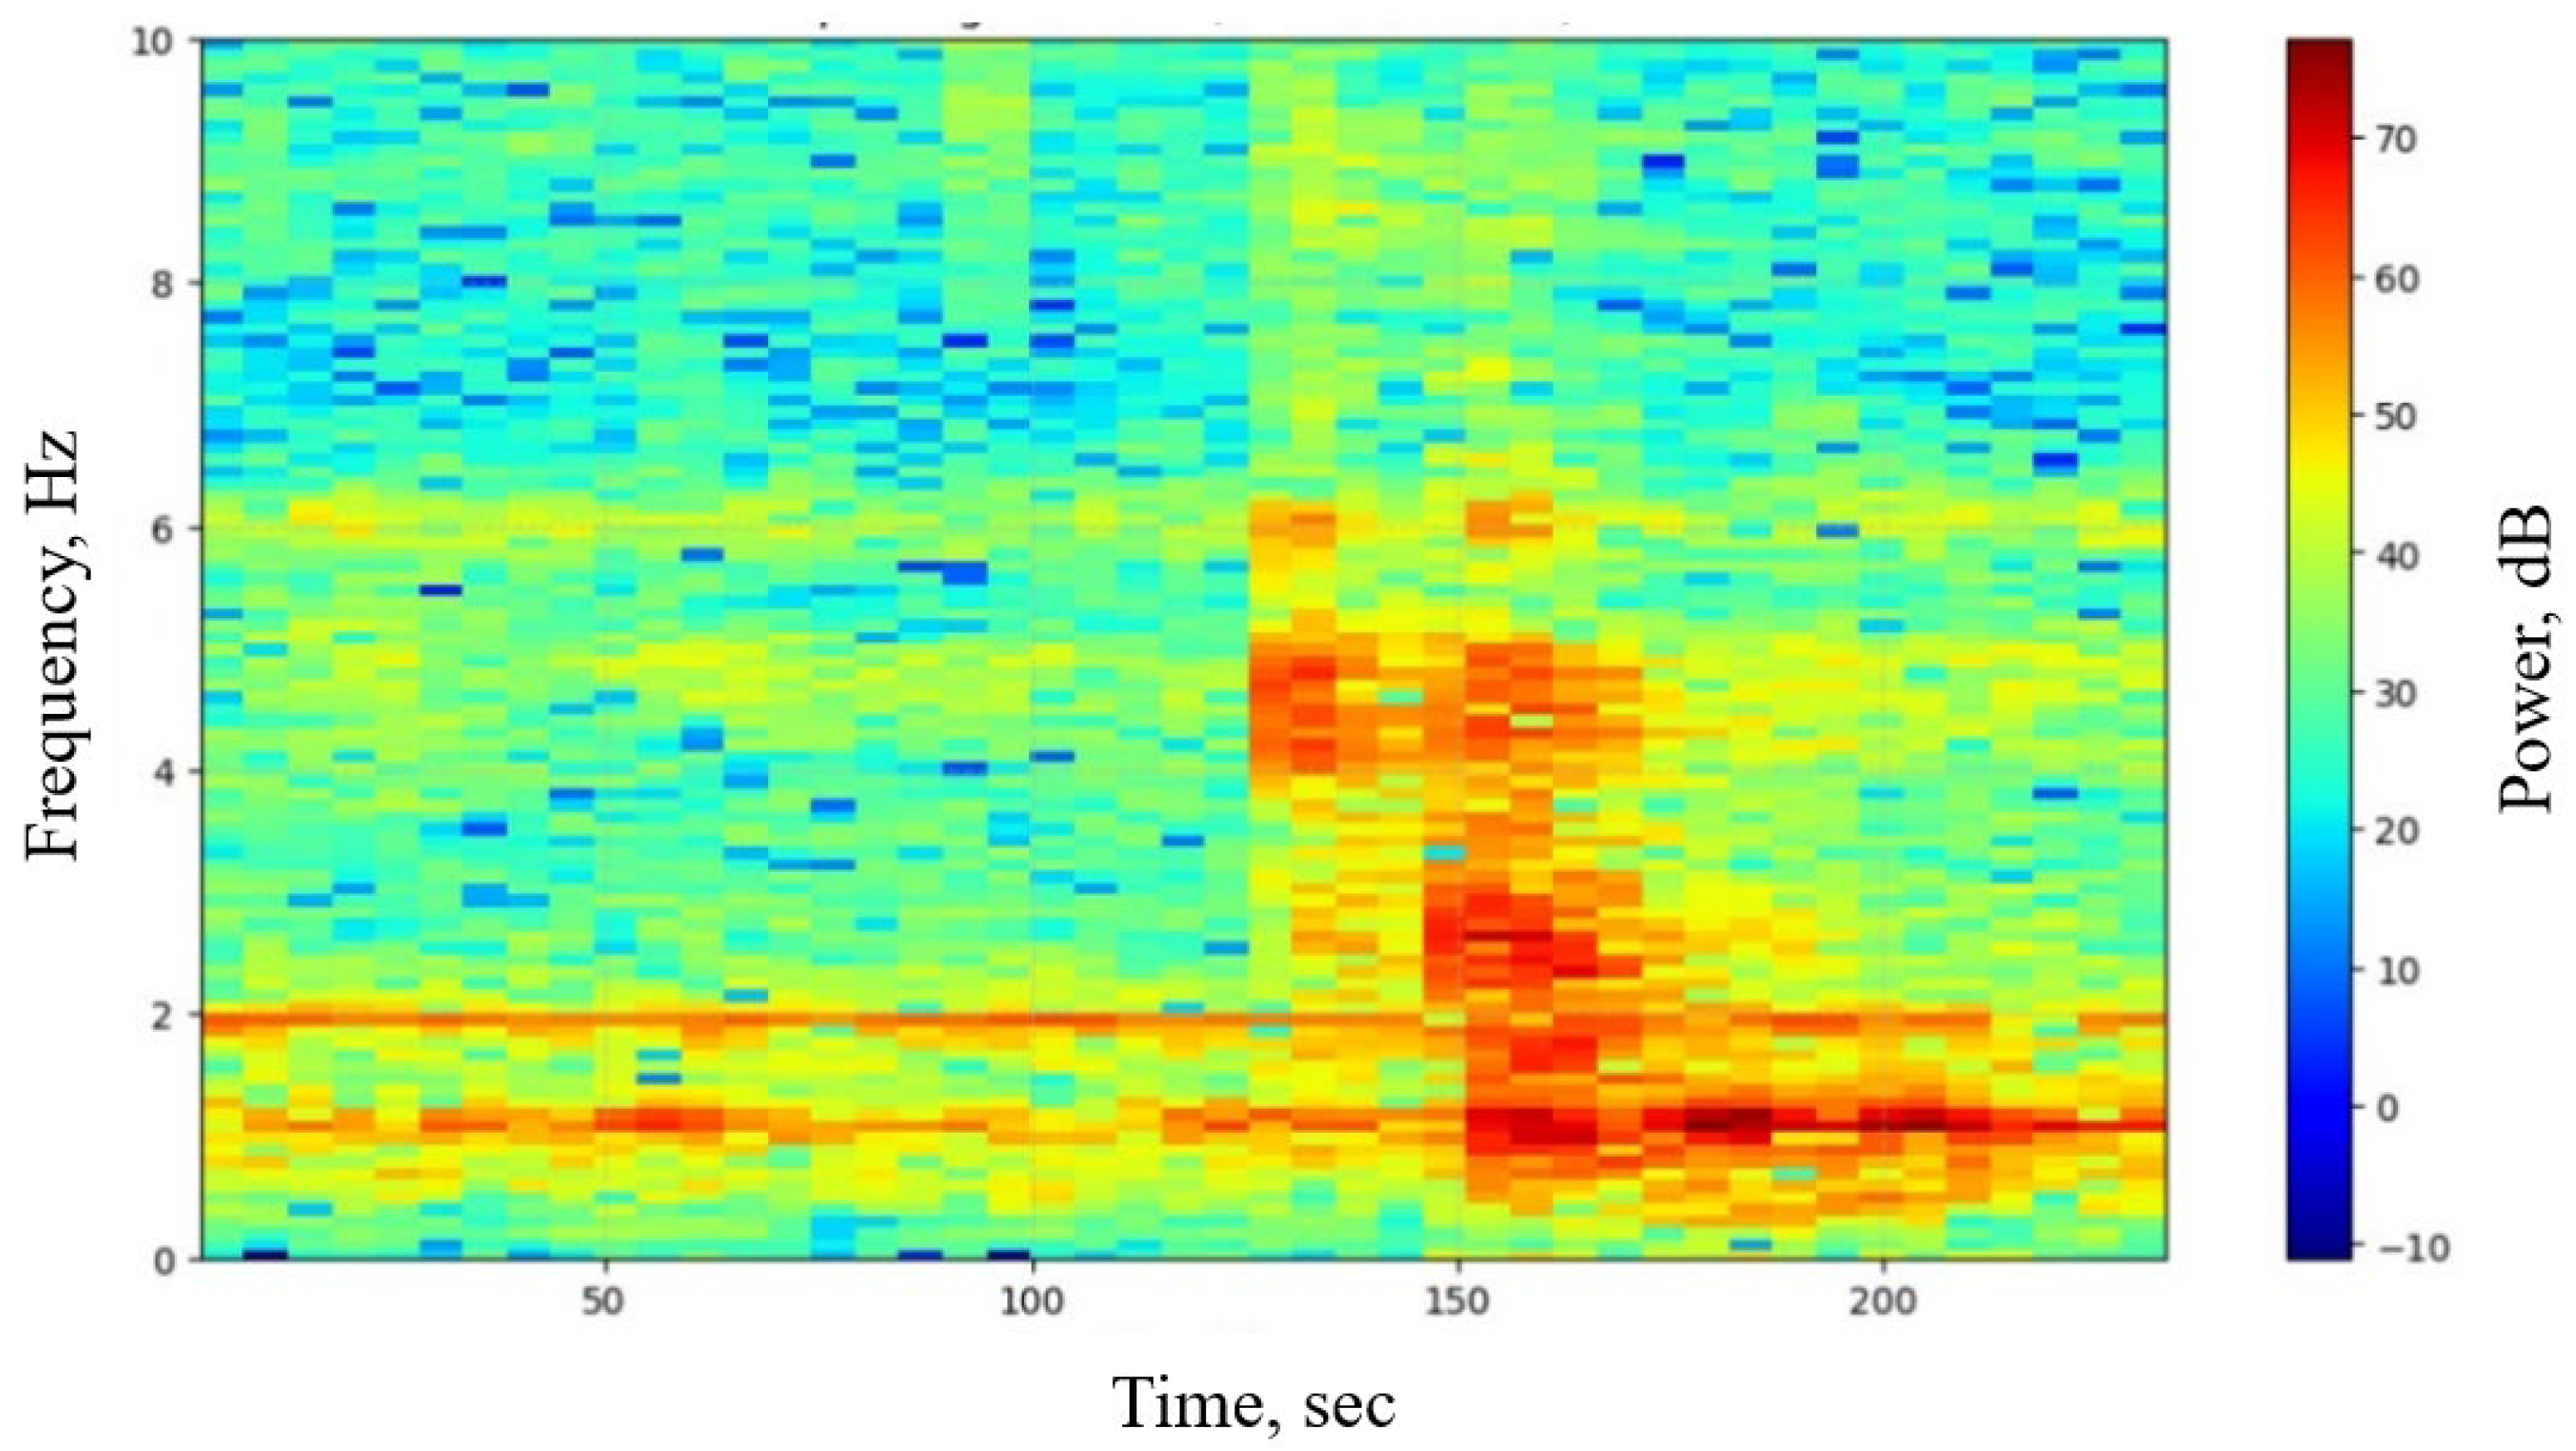
Following the explosion spectrogram (Figure 6), the explosion dominant frequency content was approximately within the range of 0.5 to 6 Hz. Therefore, the step like increase observed in Figure 5 at short periods, particularly around T ≈ 0.38 s, T ≈ 0.2 s, should not be interpreted as a structural vibration mode. Instead, it is more reasonably attributed to the frequency content of the explosion input itself. Accordingly, only the distinct changes in the cumulative energy curve that coincide with the experimentally identified natural periods of the building may be associated with the structural modes.
Figure 6.
The explosion spectrogram.
Moreover, the amount of energy corresponding to each vibration mode is similar to the mode participation factors: 42% for the first vibration mode, 26% for the second, and 8% for the third. Thus, the first three vibration modes accumulate 76% of the total energy of the building, and 24% of the energy is accumulated by higher vibration modes. As is known, for lower buildings the energy share corresponding to higher vibration modes is below 10% [10].
At the same time, cumulative energy representation has an advantage over FFT analysis, as it measures the relative importance of each modal region in terms of energy contribution instead of single amplitudes. Therefore, even if spectral peaks appear comparable in magnitude, their energetic impact on structural demand may differ.
As can be seen from the results, although the explosion excitation is broadband, its effect on higher dynamic modes was not observed. Such behavior is expected for weak ground motions with limited high frequency energy content and relatively small modal mass participation in higher modes.
The rapid saturation of the cumulative energy curve beyond the dominant modal range demonstrates the filtering role of the structure. Although the input ground motion contains frequency components extending beyond the natural periods, just a limited band effectively transfers kinetic energy into the building. This confirms that the structure behaves as a vibration period selective dynamic system. Period ranges far from the natural ones have negligible contribution to the total structural energy, even if present in the excitation spectrum. From a physical viewpoint, this reflects the combined influence of stiffness distribution, modal shapes, and natural damping, which collectively suppress the coupling of inefficient periods.
Thus, cumulative kinetic energy representation may serve as an indicator for structural health monitoring. Because the curves are normalized, they provide a shape-based signature of modal energy distribution that is independent of amplitude. Future recordings of similar weak excitations can be compared against this baseline.
9. Conclusions
Experimental and numerical study was conducted on a real 21-story reinforced concrete residential building using ambient vibration measurements and a weak earthquake type excitation (explosion). The study was focused on identifying the natural vibration periods and evaluating story stiffness through recording the dynamic response of the building at each floor.
A theoretical and practical framework for story stiffness identification was developed and applied for ambient dynamic loadings. It was shown that there are some differences between the experimental and numerical story stiffness values. Experimental stiffness values at the lower and higher floors were less than the numerically predicted ones. At the same time, numerical analysis clearly shows that story stiffness decreases for higher floors. These findings demonstrate the strong dependence of numerical results on modeling assumptions, boundary conditions, and representation of structural and non-structural components, which is a subject for further investigation. In the authors’ opinion, this will lead to further development of the seismic resistance theory for high-rise buildings.
The results show rather good agreement between experimental and numerical values of dynamic parameters of a 21-story residential reinforced concrete building. At the same time, further investigations are required in order to develop and improve the existing numerical tools allowing higher simulation accuracy. A detailed methodology of experimental investigation of tall buildings should be also proposed.
The present research forms a basis for developing the concept of a Building Structural Passport by establishing a reliable baseline of story level dynamic characteristics. This will enable rapid post event assessment and long-term structural health monitoring.
Author Contributions
Conceptualization, I.I. and Y.R.; methodology, I.I. and Y.R.; software, S.Y. and Y.G.; validation, Y.G., S.Y. and I.I.; formal analysis, Y.G.; investigation, Y.G.; resources, Y.R.; data curation, I.I., Y.R.; writing—original draft preparation, Y.G.; writing—review and editing, I.I., Y.R.; visualization, Y.G.; supervision, I.I. and Y.R.; project administration, Y.R.; funding acquisition, I.I., S.Y., Y.R. All authors have read and agreed to the published version of the manuscript.
Funding
This research received no external funding.
Institutional Review Board Statement
Not applicable.
Informed Consent Statement
Not applicable.
Data Availability Statement
The original contributions presented in the study are included in the article.
Conflicts of Interest
The authors declare no conflicts of interest.
References
- Gumus, O.; Celik, O.C. Structural Health Monitoring System on a 216 M Tall Building in Izmir Per the New Turkish Building Earthquake Code. In Proceedings of the Fifth International Conference on Earthquake Engineering and Seismology, Ankara, Turkey, 8–11 October 2019. [Google Scholar]
- Farrar, C.R.; Worden, K. An Introduction to Structural Health Monitoring. Philos. Trans. R. Soc. A 2007, 365, 303–315. [Google Scholar]
- Hernandez, E.; Genes, M.; Gulkan, P. Damage assessment and seismic response of steel buildings during the Kahramanmaras, Turkey earthquakes of 6 February 2023. Earthq. Spectra 2025, 41, 1565–1588. [Google Scholar]
- Iskhakov, I. Plastic energy dissipation and ductility of symmetric reinforced and over-reinforced RC elements’ sections. In Earthquake Resistant Engineering Structures; Latini, G., Brebbia, C., Eds.; WIT Press: Southampton, UK, 2003; Volume IV, pp. 27–36. [Google Scholar]
- Tao, D.; Lin, J.; Lu, Z. Time-Frequency Energy Distribution of Ground Motion and Its Effect on the Dynamic Response of Nonlinear Structures. Sustainability 2019, 11, 702. [Google Scholar] [CrossRef] [Scilit]
- Khashaee, P.; Mohraz, B.; Sadek, F.; Lew, H.S.; Gross, J.L. Distribution of Earthquake Input Energy in Structures; Report No. NISTIR 6903; National Institute of Standards and Technology: Gaithersburg, MD, USA, 2003. [Google Scholar]
- Guan, M.; Du, H. Energy based seismic performance of reinforced concrete frame structures. Mag. Concr. Res. 2013, 65, 494–505. [Google Scholar] [CrossRef] [Scilit]
- Reuland, Y.; Martakis, P.; Chatzi, E. A Comparative Study of Damage Sensitive Features for Rapid Data Driven Seismic Structural Health Monitoring. Appl. Sci. 2023, 13, 2708. [Google Scholar] [CrossRef] [Scilit]
- Iskhakov, I.; Ribakov, Y. Experimental and Numerical investigation of a full-scale multistorey RC building under dynamic loading. Struct. Des. Tall Spec. Build. 2005, 14, 299–313. [Google Scholar] [CrossRef] [Scilit]
- Iskhakov, I.; Yehuda, S.; Ribakov, Y. Experimental and Numerical Investigation of a Real Four-Story Building with an Open Ground Floor in a Seismic Region for Proper Strengthening. Adv. Mater. Sci. Eng. 2024, 1, 7812859. [Google Scholar]
- Kose, M.M. Parameters affecting the fundamental period of RC buildings with infill walls. Eng. Struct. 2009, 31, 93–102. [Google Scholar] [CrossRef] [Scilit]
- Fissha, Y.; Ikeda, H.; Toriya, H.; Adachi, T.; Kawamura, Y. Application of bayesian neural network (BNN) for the prediction of blast-induced ground vibration. Appl. Sci. 2023, 13, 3128. [Google Scholar] [CrossRef] [Scilit]
- IS 413; Design Provision for Earthquake Resistance of Structure, Amendment 5. Standard Institution of Israel: Tel Aviv, Israel, 2013.
- EN 1992-1-1; Eurocode 2: Design of Concrete Structures—Part 1-1: General Rules and Rules for Buildings. European Committee for Standardization: Brussels, Belgium, 2004.
- Verma, A.K. Response of LTI systems to arbitrary inputs. Res. J. Math. Stat. Sci. 2015, 3, 1–4. [Google Scholar]
- Sivasuriyan, A.; Vijayan, D.S.; Górski, W.; Wodzynski, Ł.; Vaverková, M.D.; Koda, E. Practical implementation of structural health monitoring in multi-story buildings. Buildings 2021, 11, 263. [Google Scholar] [CrossRef] [Scilit]

Disclaimer/Publisher’s Note: The statements, opinions and data contained in all publications are solely those of the individual author(s) and contributor(s) and not of MDPI and/or the editor(s). MDPI and/or the editor(s) disclaim responsibility for any injury to people or property resulting from any ideas, methods, instructions or products referred to in the content. |
© 2026 by the authors. Licensee MDPI, Basel, Switzerland. This article is an open access article distributed under the terms and conditions of the Creative Commons Attribution (CC BY) license.