


Abstract
This study focuses on the multi-dimensional uncertainties in synergistic pollution reduction and carbon mitigation pathways for the coal chemical industry in the Yellow River Basin, a region facing extreme water scarcity (only 2% of national water) and fragile ecology, and constructs a Multi-Level Uncertainty Conduction (MLUC) Model integrating data, modeling, and validation. Using 2011–2025 data, Monte Carlo (10,000) simulations quantify the impacts of policy, technology, market, and ecological uncertainties on synergistic benefits. Sobol’ global sensitivity (Saltelli) and Shapley decomposition (14 technologies) identify key drivers and technology contributions. A system dynamics model simulates 2023–2050 pathways under baseline, policy-enhanced, technology breakthrough, and composite uncertainty scenarios. Logarithmic Mean Divisia Index (LMDI-I) decomposition reveals a six-factor driving mechanism for carbon emission changes. Results show that policy uncertainty exerts the largest influence, with a variance contribution of approximately 35%, followed by technology (28%), market (22%), and ecological factors (15%)—the latter primarily reflecting water availability and regional ecological carrying capacity. Critical thresholds are 80 CNY/t CO2 for carbon capture, utilization and storage (CCUS) viability, and 6.8 CNY/t for green hydrogen substitution. Comprehensive resource utilization is optimal near term, while green hydrogen substitution and CCUS–green hydrogen coupling dominate medium- to- long term. The proposed dynamic threshold response mechanism and technology portfolio strategy could boost synergistic benefits by 22% to 35%. These findings underscore the need for watershed-scale collaborative governance and integrated water–carbon–energy management to ensure robust mitigation under the basin’s constraints.
1. Introduction
The Yellow River Basin is a critical energy production and processing hub in China, holding 472 billion tonnes of coal reserves, which account for 47% of the national total [1]. Major coal chemical bases such as Ningdong, Ordos, and Yulin have been established within the basin, and in 2023, its coal chemical output constituted roughly 60% of China’s production [2], with carbon emissions reaching 1.26 billion tonnes, representing 22% of national industrial emissions [3]. However, the basin possesses only 2% of the country’s total water resources [4], yet it hosts approximately 60% of the national capacity in the highly water-intensive coal chemical industry, intensifying the conflict between industrial development and ecological constraints. Against the backdrop of ecological protection and high-quality development of the Yellow River Basin being elevated to a national strategy, achieving synergistic governance of pollution reduction and carbon mitigation in the coal chemical industry within a basin characterized by extreme water scarcity and a fragile ecological foundation has become an urgent scientific and policy challenge.
Research on industry-specific pathways for pollution and carbon reduction has advanced the assessment of synergistic effects [5,6,7]. Many studies quantify these effects using coupling coordination models, cross elasticity methods, and data envelopment analysis (DEA) frameworks [7,8,9,10]. Others evaluate the economic viability of technological pathways based on marginal abatement cost and cost benefit frameworks [11,12,13], while additional research employs numerical simulation and econometric models to analyze policy and regional differences [8,14]. However, current methods largely rely on deterministic assumptions and thus fail to capture how dynamic uncertainties such as policy shifts, technological change, and market fluctuations affect synergistic benefits.
On the other hand, current research lacks a unified conceptual definition or measurement framework for uncertainty, and most studies are confined to a single industry or a single dimension [15,16,17]. Lo Piano and Benini (2022) systematically reviewed the shortcomings of uncertainty and sensitivity analysis methods in life cycle assessment [15]. Habibi et al. (2023) summarized uncertainty modeling approaches for biofuel supply chains [16]. Chen et al. (2024) found that supply chain research is shifting from single uncertainty to multi-dimensional and multi-objective decision making, yet the field remains underdeveloped overall [17]. At the watershed scale, quantitative coupling of the four dimensions of policy, technology, market, and ecology is still missing. The transmission mechanisms between systems and the coupling effects of multi-dimensional uncertainty urgently need further exploration.
To address the above research gap, this study proposes a multi-level uncertainty propagation model that integrates three analytical frameworks: the Driving Force–Pressure–State–Impact–Response (DPSIR) driver mechanism [18,19], complex system feedback loops, and the policy technology market triple helix [20,21]. The model systematically characterizes how uncertainty propagates through the driver, pressure, state, impact, and response stages, along with their superimposed effects. Methodologically, we introduce an interdisciplinary combination of Monte Carlo simulation, Sobol global sensitivity analysis, Shapley value cooperative game decomposition, system dynamics simulation, and Logarithmic Mean Divisia Index (LMDI) decomposition. This forms a closed loop research pathway from data collection and status diagnosis to uncertainty modeling, scenario simulation, and strategy optimization. This paper aims to answer two core questions. Under the stringent water resource and ecological constraints of the Yellow River Basin, how do multi-dimensional uncertainties affect the effectiveness and robustness of synergistic pollution and carbon reduction pathways in the coal chemical industry? And how can dynamic strategy design maximize synergistic benefits under uncertain conditions?
2. Materials and Methods
2.1. Research Framework and the MLUC Model
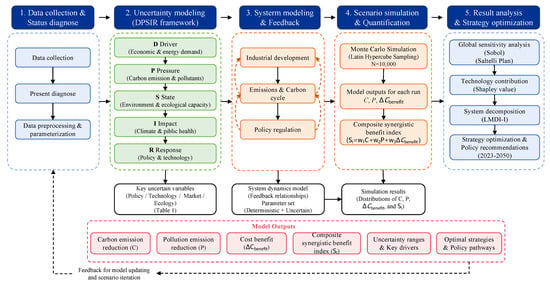
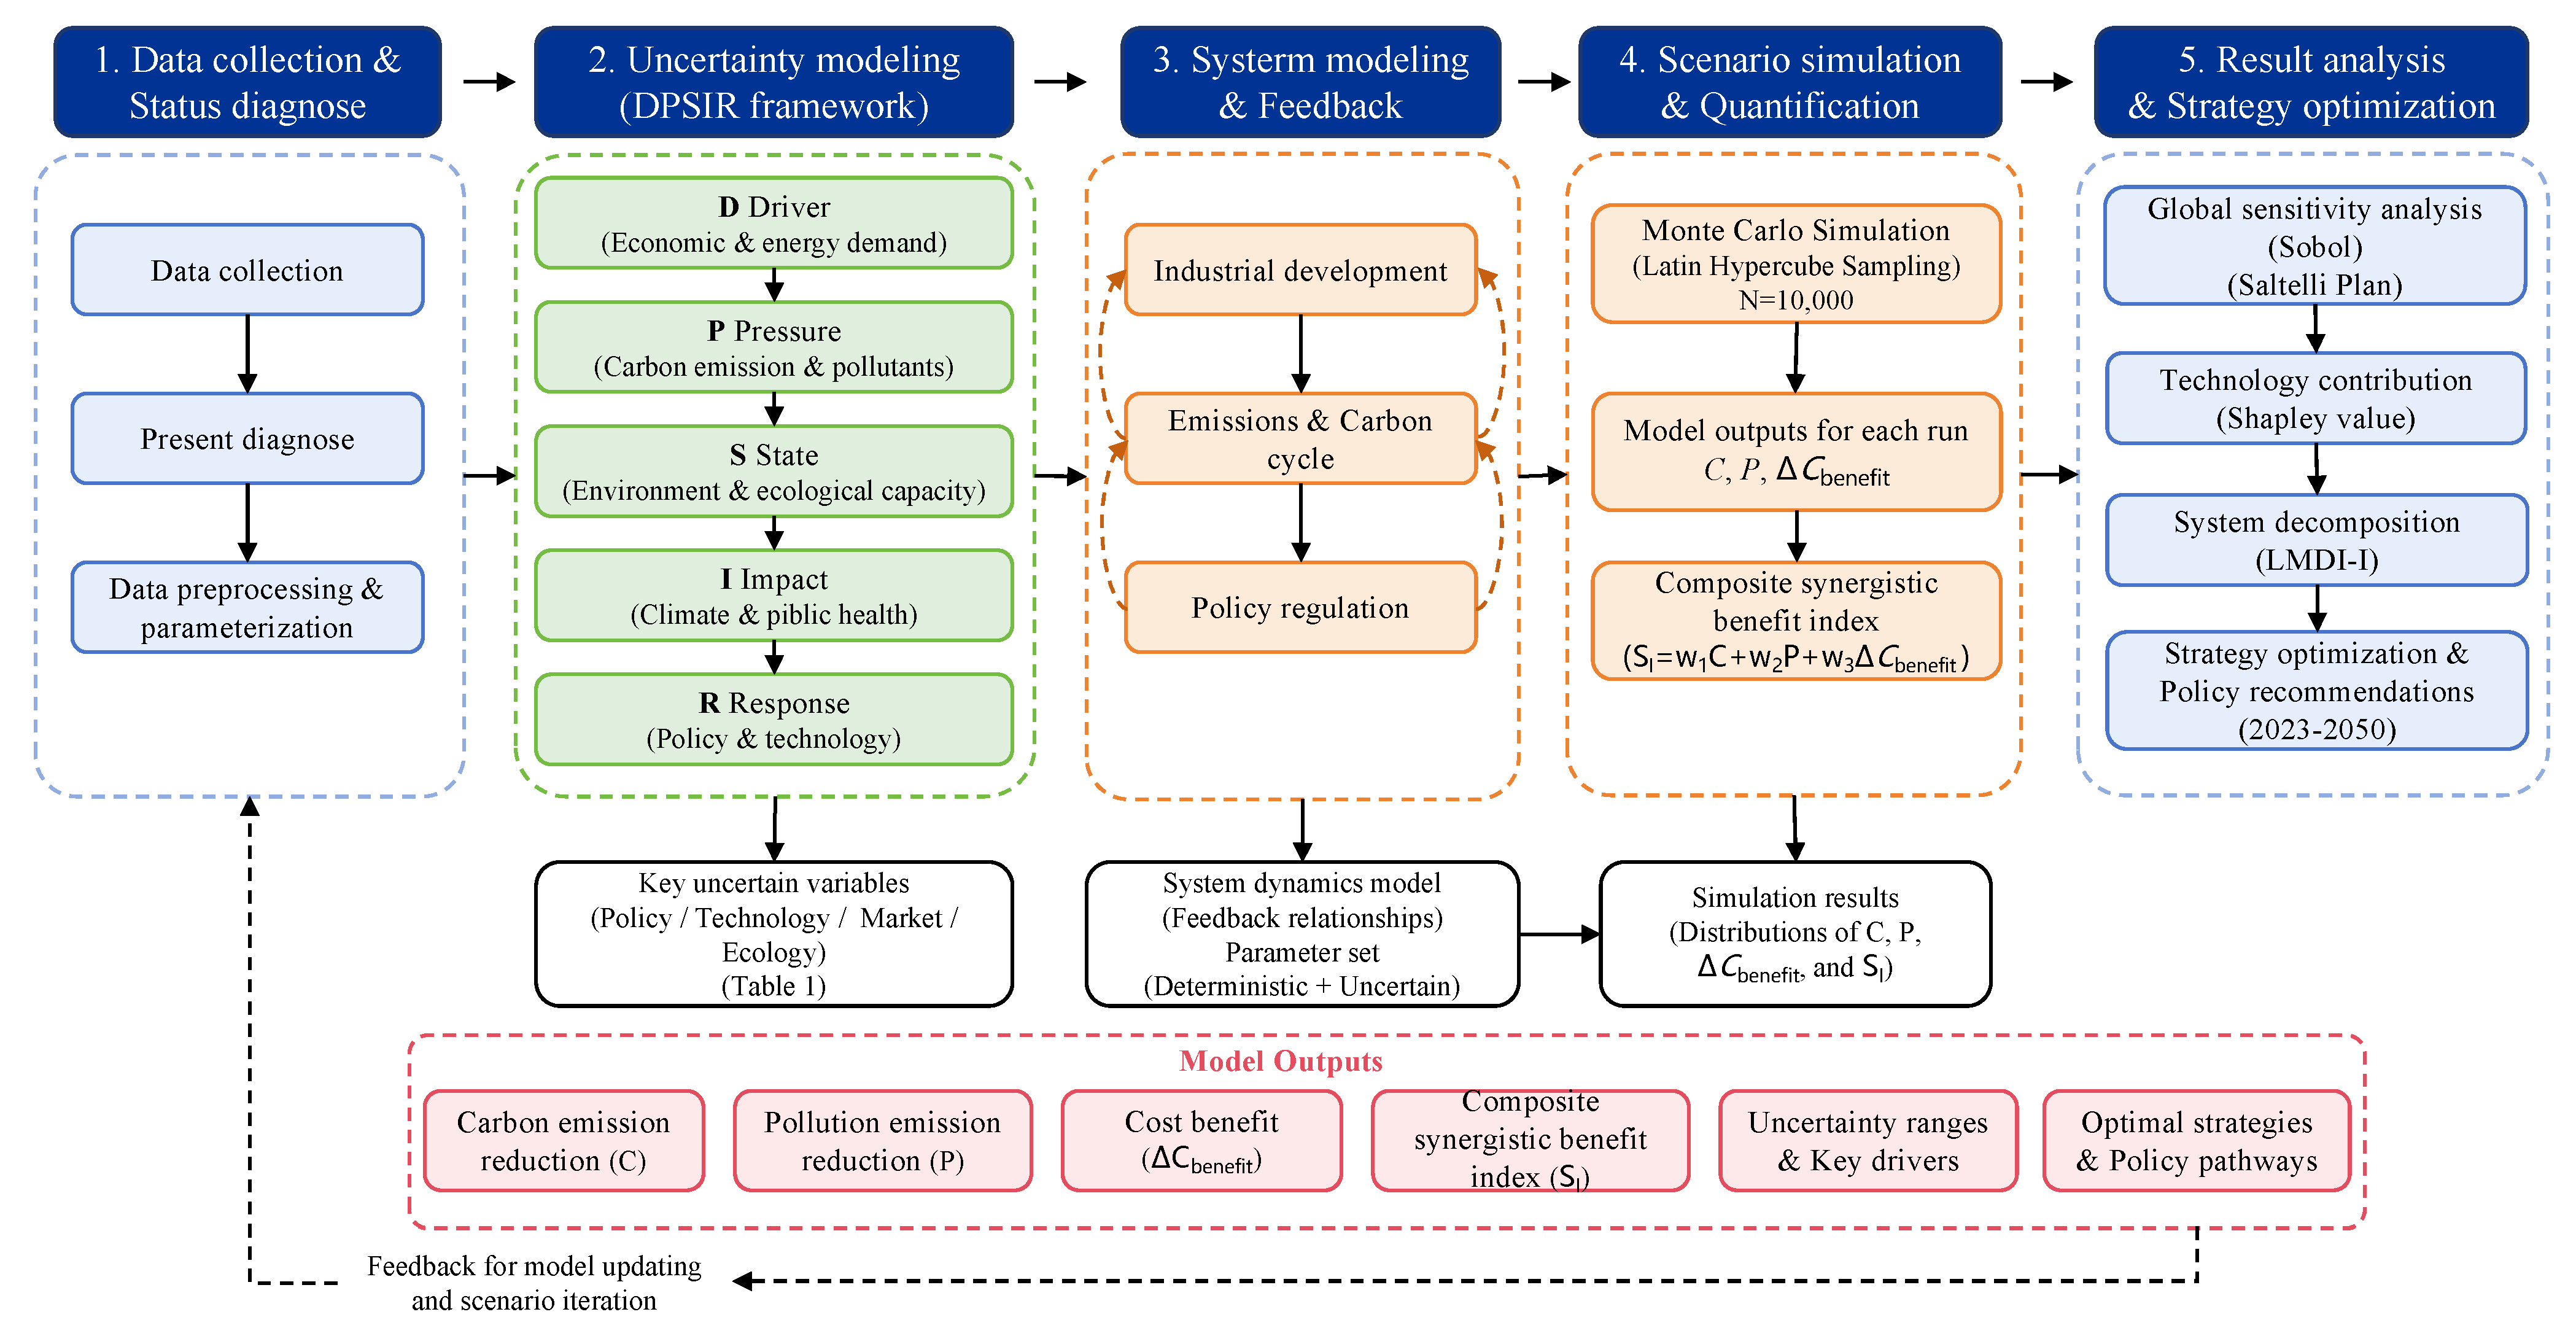
We constructed a closed loop research pathway from data collection and status diagnosis to uncertainty modeling, scenario simulation, and strategy optimization, as shown in Figure 1. To systematically characterize multi-dimensional uncertainty in the synergistic pollution and carbon reduction pathway, we propose the multi-level uncertainty propagation model, or MLUC. The model relies on three core mechanisms. First, the DPSIR driver mechanism embeds carbon and pollutant emissions from the coal chemical industry into the watershed ecology, economy, and social system. It traces how uncertainty propagates from driver, pressure, state, impact to response. Driver represents economic development and energy demand. Pressure represents carbon and pollutant emissions. State represents environmental quality and ecological carrying capacity. Impact represents climate change and public health. Response represents policy intervention and technology deployment. Second, the complex system feedback loop captures positive and negative feedbacks among four subsystems: industrial development, pollution emissions, carbon cycle, and policy regulation. For instance, a carbon price increase raises production costs, suppresses output, and reduces carbon emissions, forming a negative feedback loop. Conversely, technological progress lowers costs, stimulates output expansion, and increases carbon emissions, forming a positive feedback loop. These two loops alternate dominance across different time scales. Third, the triple helix of policy, technology, and market denotes that policy drives technology deployment, technology reshapes market structure, and market feedback in turn influences policy adjustment. Together, they form a spiraling co-evolutionary relationship. The MLUC model uses Monte Carlo simulation to quantify the superimposed effects of these mechanisms on synergistic benefits.
Figure 1.
Research technical framework.
2.2. Data Sources
The research data cover the coal chemical industry across nine provinces and regions in the Yellow River Basin, specifically Shanxi, Inner Mongolia, Shandong, Henan, Sichuan, Shaanxi, Gansu, Qinghai, and Ningxia. Eight subsectors are included as follows: coal-to-coke, synthetic ammonia, methanol, ethylene glycol, natural gas, direct coal to oil, indirect coal to oil, and olefins. The time span extends from 2011 to 2050. Data sources include the China Statistical Yearbook, ecological and environmental statistics, statistical records of coal chemical bases within the basin, the industry catalog of recommended energy-saving technologies, the catalog of industrial water saving technologies and equipment, and research papers [3,22,23,24,25,26,27,28,29,30,31,32,33,34]. A detailed data inventory is provided in the Supplementary Materials, Tables S1–S6.
2.3. Synergy Evaluation System
The synergistic benefit is evaluated using a three dimensional weighted composite index:
where C represents the carbon emission reduction potential (104 t CO2), P represents the pollutant emission reduction potential (104 t pollutant equivalent), and ΔCbenefit denotes the net cost benefit (104 CNY), with the pollutant equivalent conversion performed in accordance with the Environmental Protection Tax Law of the People’s Republic of China [22]. The pollutant equivalent aggregates twelve pollutants: ammonia (NH3), ammonia nitrogen (NH3-N), nitrogen oxides (NOx), sulfur dioxide (SO2), chemical oxygen demand (COD), volatile phenol (VP), volatile organic compounds (VOCs), particulate matter (PM), cyanide (CN), petroleum pollutants (PPs), total nitrogen (T-N), and total phosphorus (T-P). Carbon emission accounting covers direct and indirect emissions from three sources: raw material consumption, fuel combustion, and electricity and heat. Conversion factors and the detailed assessment system are provided in Table S5.
2.4. Uncertainty Analytical Framework
Based on the DPSIR model [35,36], the uncertainty system is divided into four dimensions: policy, technology, market, and ecology. Key variables and their probability distribution types are summarized in Table 1. The complete distribution characteristics of each parameter, such as the minimum, mode, and maximum of the triangular distribution for carbon price and the location parameter μ and the scale parameter σ of the lognormal distribution for green hydrogen cost, are detailed in Table S7 in the Section S2.2 of the Supporting Materials.
Table 1.
Key variables of four dimensional uncertainties based on DPSIR.
2.5. Model Construction
2.5.1. Monte Carlo Uncertainty Quantification
Latin Hypercube Sampling (LHS) [37] was employed to perform 10,000 simulations, thereby propagating parameter uncertainty. For each sample, carbon emission reduction (C), pollutant emission reduction (P), and net cost benefit (ΔCbenefit) were calculated sequentially, and a composite synergistic benefit index was synthesized from these three objective functions. The net cost benefit integrates the monetized values of carbon reduction gains, quantified as the carbon price multiplied by carbon emission reductions, and pollutant reduction gains, derived from pollution charge savings or avoided environmental damage costs. Statistical analysis of the 10,000 simulation outcomes yielded the probability distribution, selected quantiles, and variance contribution rate of the index.
where i denotes the subsector index (i = 1, 2, …, 8), corresponding to coal-to-coke, synthetic ammonia, methanol, ethylene glycol, natural gas, direct coal liquefaction, indirect coal liquefaction, and olefins, respectively. j is the reduction technology index (j = 1, 2, …, 14), with technology names and codes detailed in Section S2.4 of the Supporting Materials. Eij, Fij, and Bij represent the carbon emission reduction potential (104 t CO2), pollutant emission reduction potential (104 t pollutant equivalent), and reduction benefit (104 CNY) for subsector i when technology j achieves its maximum penetration rate. ΔPij denotes the change in the penetration rate of technology j in subsector i (%). θj and φj are dimensionless correction factors for the carbon reduction effectiveness and pollutant reduction effectiveness of technology j, respectively. Cfixed,ij and Coperating,ij are the fixed cost and annual operating cost (104 CNY) for deploying technology j in subsector i.
2.5.2. Sobol Global Sensitivity Analysis
A global sensitivity analysis was performed on 15 key parameters, including carbon price, CCUS penetration rate, green hydrogen cost, and comprehensive resource utilization penetration rate; it was conducted using the Sobol’ method with the Saltelli sampling scheme [38,39,40]. Detailed parameter ranges are given in Table S8 in the Section S2.3 of the Supporting Materials. The base sample size N was set to 1024, yielding a total of 32,768 model evaluations. The first-order index (S1i) and total-effect index (STi) were computed to quantify the main effect and interaction effect of each parameter, respectively. A parameter was deemed to exert a significant influence if STi > 0.1, and a difference STi − S1i > 0.1 indicated the presence of significant interactions. Comparison of multi-level sensitivity analysis methods are shown in Table S9.
where V(Y) represents the total variance of the model output Y, V[E(Y|Xi)] is the variance of the conditional expectation of Y given parameter Xi, X−i denotes the set of all parameters other than Xi, and V[E(Y|X−i)] is the variance of the conditional expectation of Y given all parameters except Xi.
2.5.3. Shapley Value-Based Technology Contribution Analysis
We treated the 14 mitigation technologies as players in a cooperative game, with the total synergistic benefit serving as the coalition payoff. By exhaustively enumerating all 214 (16,384) technology combinations, we computed the Shapley value φi for each technology [41]. A synergy factor δ was introduced to quantify the coupling gains among technologies. To reveal the dynamic evolution of technology contributions, we calculated the Shapley values for the years 2025, 2030, and 2050. The complete technology list and groupings are provided in Tables S10–S12 in the Section S2.4 of the Supporting Materials.
where S denotes any subset of technologies that excludes technology i, referred to as a coalition. |S| is the number of technologies in the coalition, ranging from 0 to 13. v(S) is the characteristic function value of coalition S, representing the total synergistic benefit generated by that technology combination. The term v(S∪{i}) − v(S) quantifies the marginal benefit increment when technology i joins coalition S. In the calculation, CS and PS are the total carbon emission reductions (104 t CO2) and total pollutant reductions (104 t equivalent) when all technologies in combination S are deployed synergistically, and ΔCS is the net cost benefit of combination S (104 CNY). The weighting coefficients wc, wp, and wcost are set at 0.4, 0.3, and 0.3, respectively, consistent with the composite synergistic benefit index.
2.5.4. System Dynamics Simulation
A system dynamics model [42] was built to simulate the dynamic trajectories of carbon and pollutant emissions from 2023 to 2050. The model integrates four subsystems: industrial development, pollution emission, carbon cycling, and policy regulation. It incorporates two key feedback mechanisms. The first triggers a rapid scale-up of CCUS carbon capture once the carbon price surpasses the threshold of 80 CNY per tonne of CO2 [43,44,45]. The second assumes that the penetration rate of each technology follows a logistic S-curve diffusion process [46,47], with the inflection year set according to the technology’s maturity level. The model runs on an annual time step, tracking state variables such as carbon emissions, pollution equivalents, production capacity structure, and carbon price. Further details on the numerical integration can be found in Table S13 in the Section S2.5 of the Supporting Materials.
2.5.5. Scenario Design
We developed four contrasting scenarios. The Business-as-Usual (BAU) scenario maintains current policy trends, with the carbon price rising slowly to approximately 111 CNY per tonne by 2050 and technologies diffusing at their natural pace. The Enhanced Policy Scenario (ESP) is predicated on resolute progress toward the dual-carbon goals, featuring a carbon price that reaches around 299 CNY per tonne and technology deployment accelerated by 5 to 10 years relative to the BAU. The Technology Breakthrough Scenario (TBS) assumes that green hydrogen cost falls below the critical threshold of 6.8 CNY per kg, CCUS costs drop by 50% from current levels, and the penetration rate of green electricity increases substantially. The composite uncertainty scenario (CUS) pushes multi-dimensional uncertainties to extremes, with carbon prices surging rapidly to about 386 CNY per tonne while the progress of certain technological breakthroughs remains highly uncertain. Key parameter comparisons across scenarios are presented in Table 2, and detailed technology penetration rate settings are provided in Table S14 in the Section S2.5 of the Supporting Materials.
Table 2.
Comparison of key parameters across the four scenarios.
2.5.6. Multi-Objective Optimization
We developed an NSGA-II multi-objective optimization model [48] to identify the Pareto optimal frontier among carbon emission reduction, pollutant reduction, and cost effectiveness, subject to fifteen constraints including capacity limits and technology mutual exclusivity. Details of the model are provided in Section S2.5 of the Supporting Materials. Current carbon and pollutant emission levels and the synergistic benefit weights are presented in Section S2.1 of the Supporting Materials. A multi-level methodological framework was adopted, comprising local sensitivity analysis, Sobol’ global sensitivity analysis, Shapley value decomposition, and Monte Carlo variance decomposition. A comparison and description of these methods can be found in Section S2.5 of the Supporting Materials.
3. Results
3.1. Current Status of Pollution and Carbon Emission
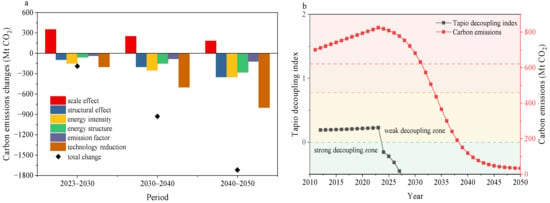
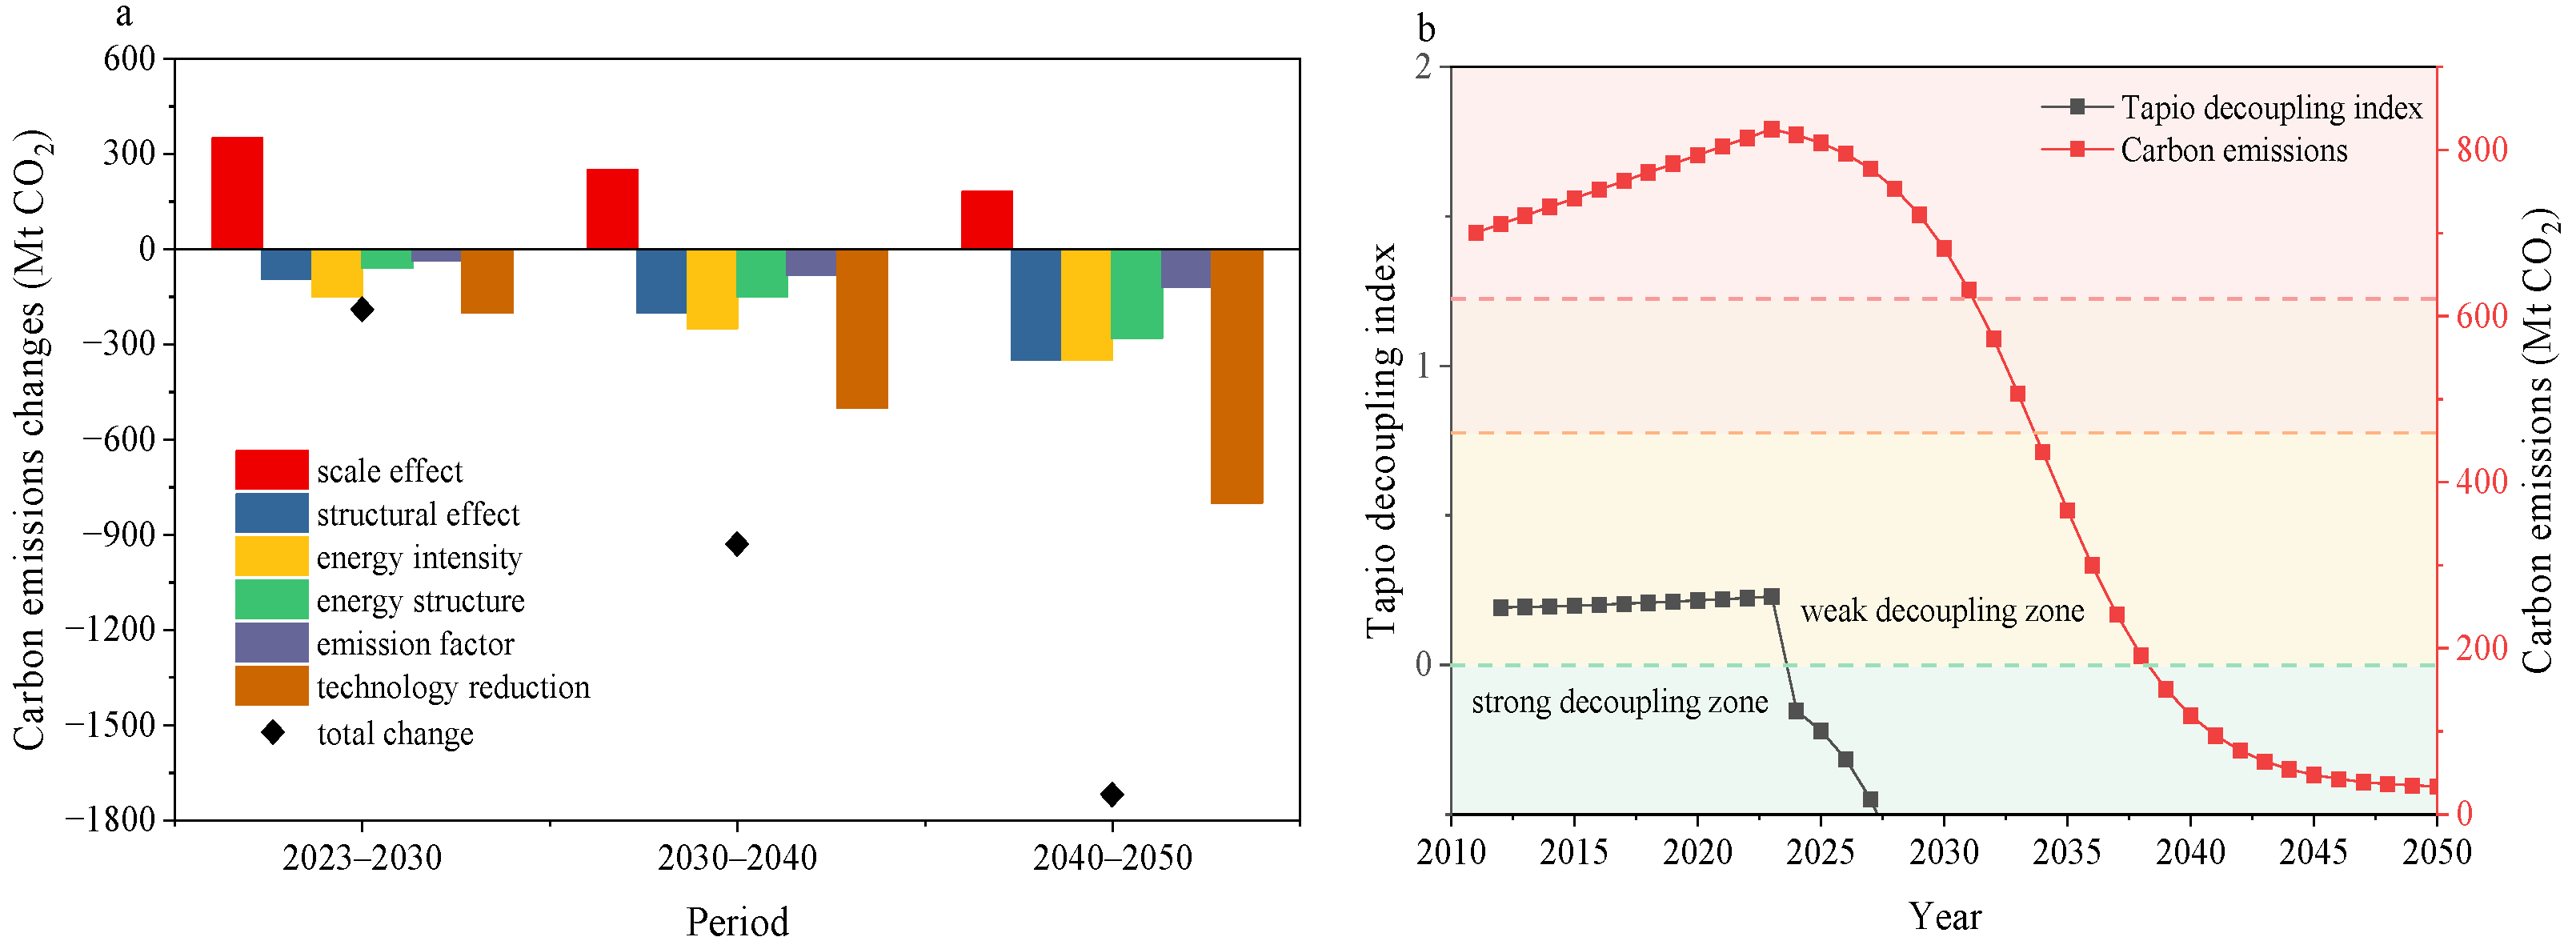
In 2023, carbon emissions from the coal chemical industry in the Yellow River Basin accounted for 60% of the sector’s national total, with traditional coal chemical processes contributing 62% and 69% of the basin’s total carbon and pollutant emissions, respectively [49]. Using the Logarithmic Mean Divisia Index (LMDI-I) method [50], carbon emission changes can be decomposed into six driving factors. Results for the historical period (2011–2023) (Figure 2a) show that the scale effect, i.e., output growth, was the dominant force increasing emissions, cumulatively adding approximately 580 Mt CO2, while declining energy intensity was the primary mitigating factor, reducing emissions by about 180 Mt CO2. From 2023 to 2030, the contribution of the technology reduction effect surpassed that of the scale effect for the first time, marking the industry’s entry into a decisive phase for carbon peaking. During 2030–2050, the structural effect of shifting from traditional to modern coal chemical processes and the technology reduction effect jointly propelled deep decarbonization (Figure 2b). Meanwhile, the emission reduction contribution from energy structure optimization, particularly green electricity substitution, intensified significantly during the 2040–2050 period.
Figure 2.
Current status and projections of carbon and pollutant emissions from the coal chemical industry in the Yellow River Basin. (a) Driving factors for changes in carbon emissions in the coal chemical industry; (b) decoupling index of carbon emissions and economic growth in the coal chemical industry (2011–2050).
3.2. Uncertainty Quantification
3.2.1. Monte Carlo Simulation Results
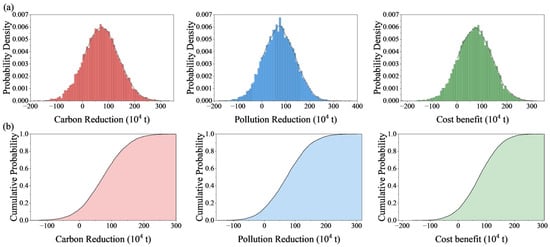
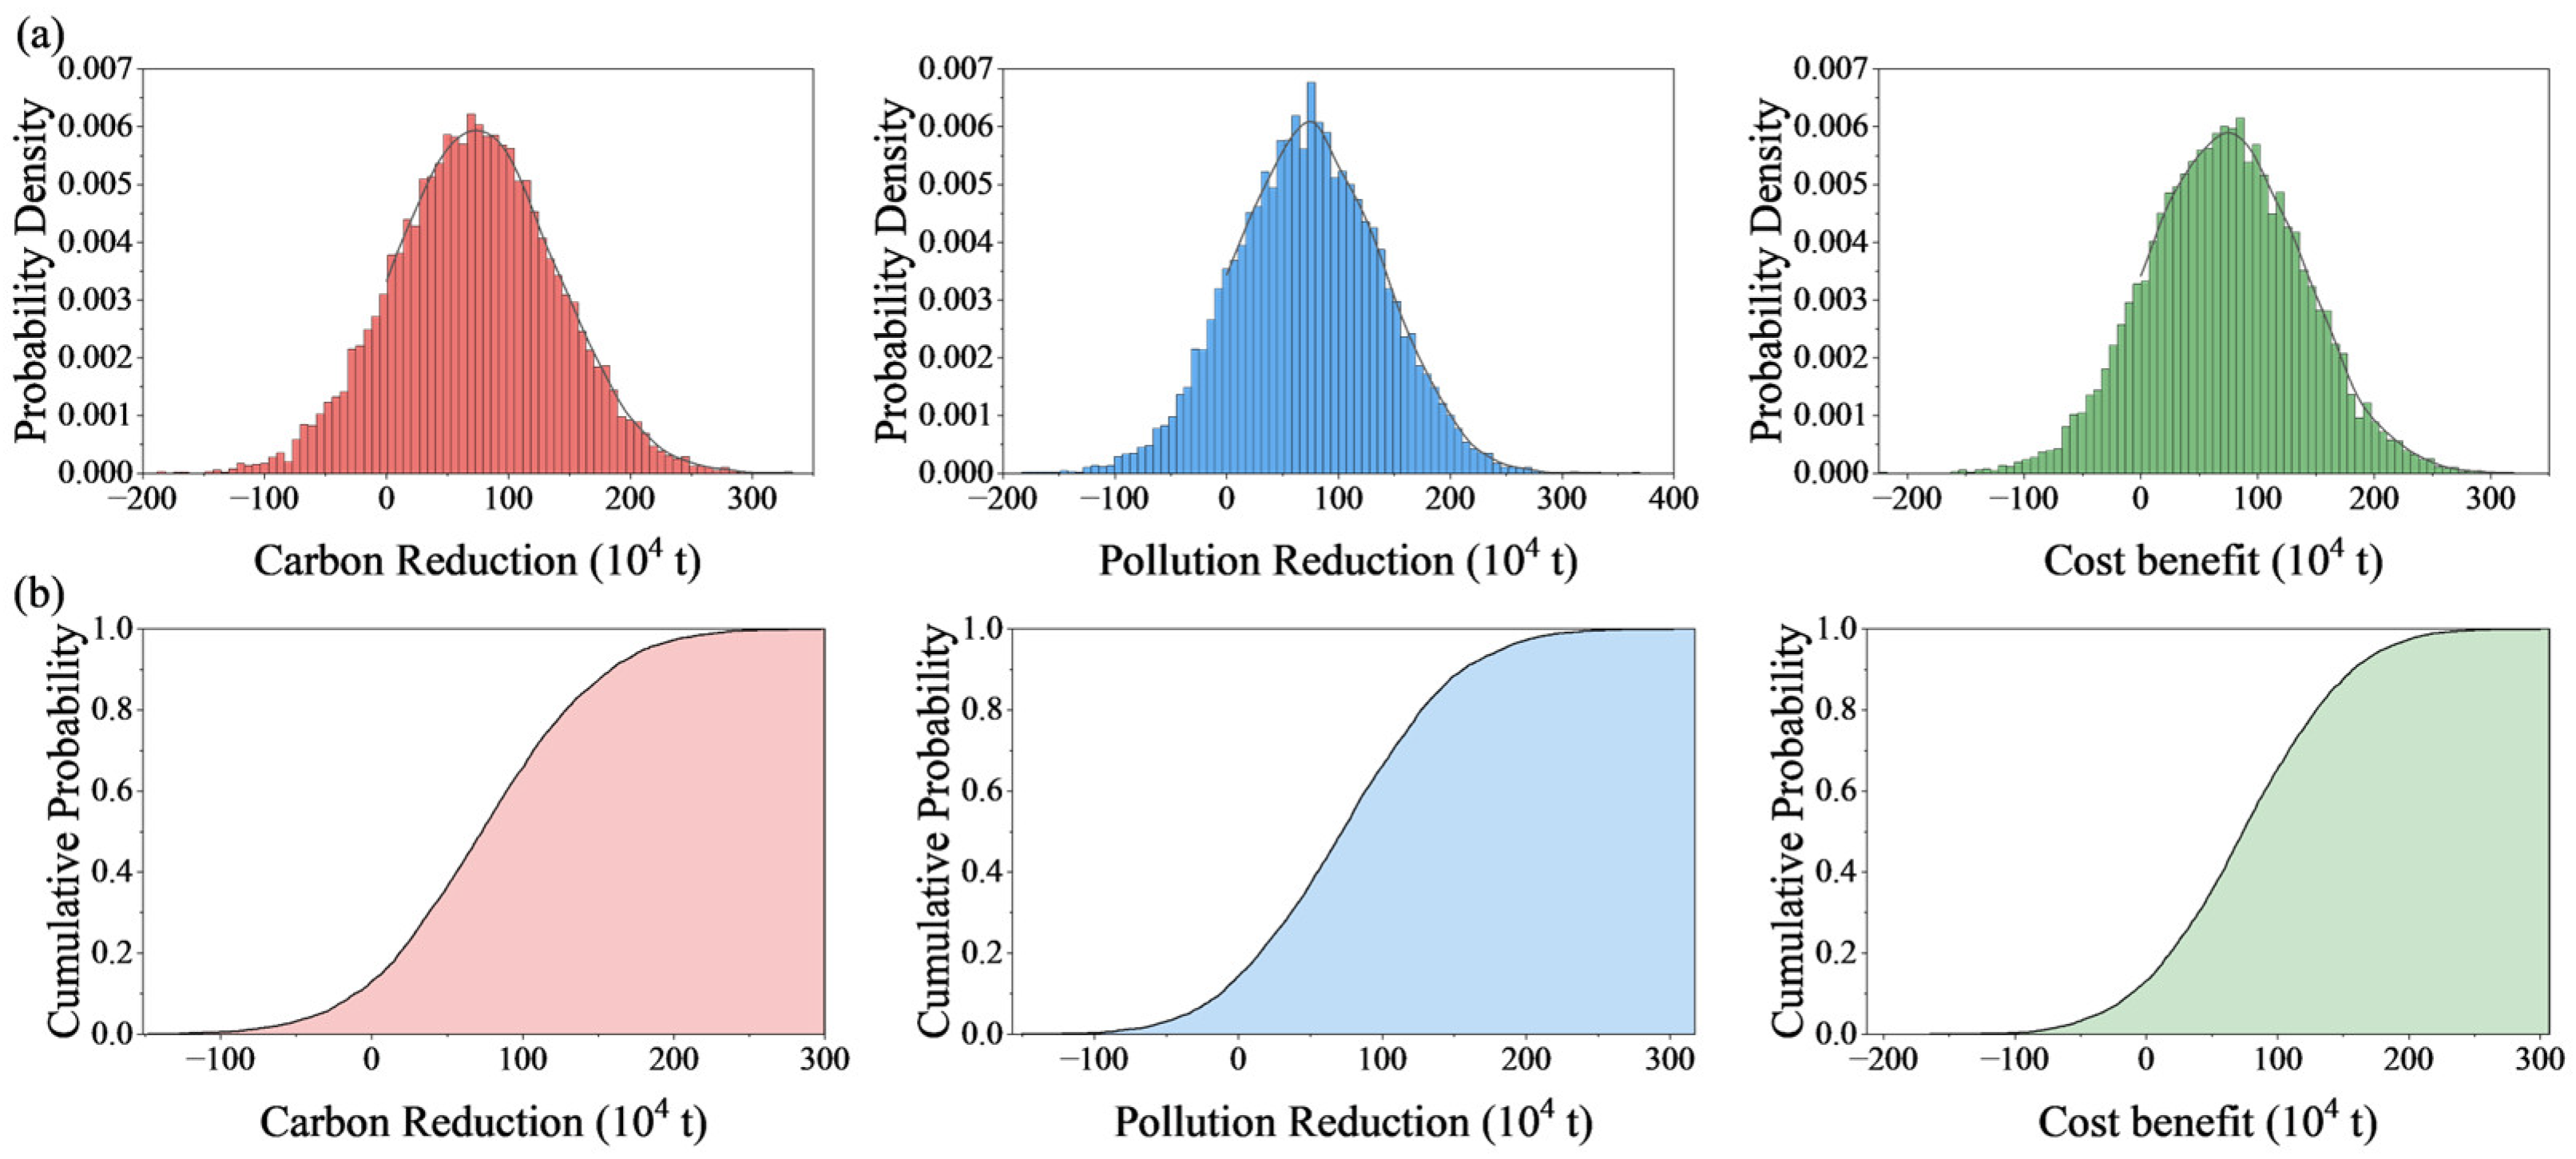
Monte Carlo simulation using Latin Hypercube Sampling (N = 10,000) reveals substantial uncertainty in the synergistic benefits among carbon emission reduction, pollutant reduction, and cost effectiveness for the coal chemical industry in the Yellow River Basin (Figure 3a). Policy-related parameters, such as carbon price and emission standards, account for approximately 35% of the variance contribution, technology-related parameters such as CCUS cost and green hydrogen cost contribute around 28%, while market and ecological dimensions contribute roughly 22% and 15%, respectively (Figure 3b). Figure 3 also illustrates that when the carbon price surpasses 80 CNY per tonne, the economic performance of CCUS technology improves significantly, with carbon capture volume exhibiting a nonlinear surge. When the green hydrogen cost drops below 6.8 CNY per kilogram, the contribution of the green hydrogen substitution pathway S1 to synergistic emission reduction benefits can reach 51%.
Figure 3.
Probability density distribution and cumulative distribution function of synergistic benefits from Monte Carlo simulation. (a) Monte Carlo probability density distribution; (b) Monte Carlo cumulative distribution function curve.
3.2.2. Sobol’ Global Sensitivity Analysis
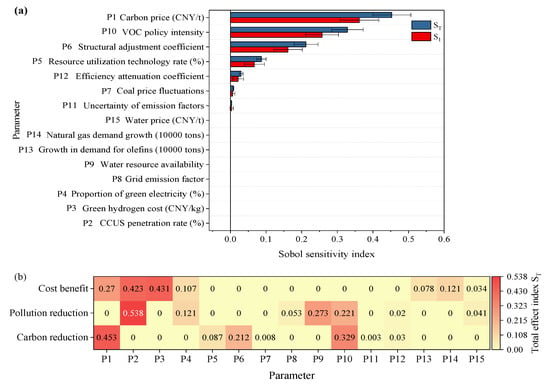
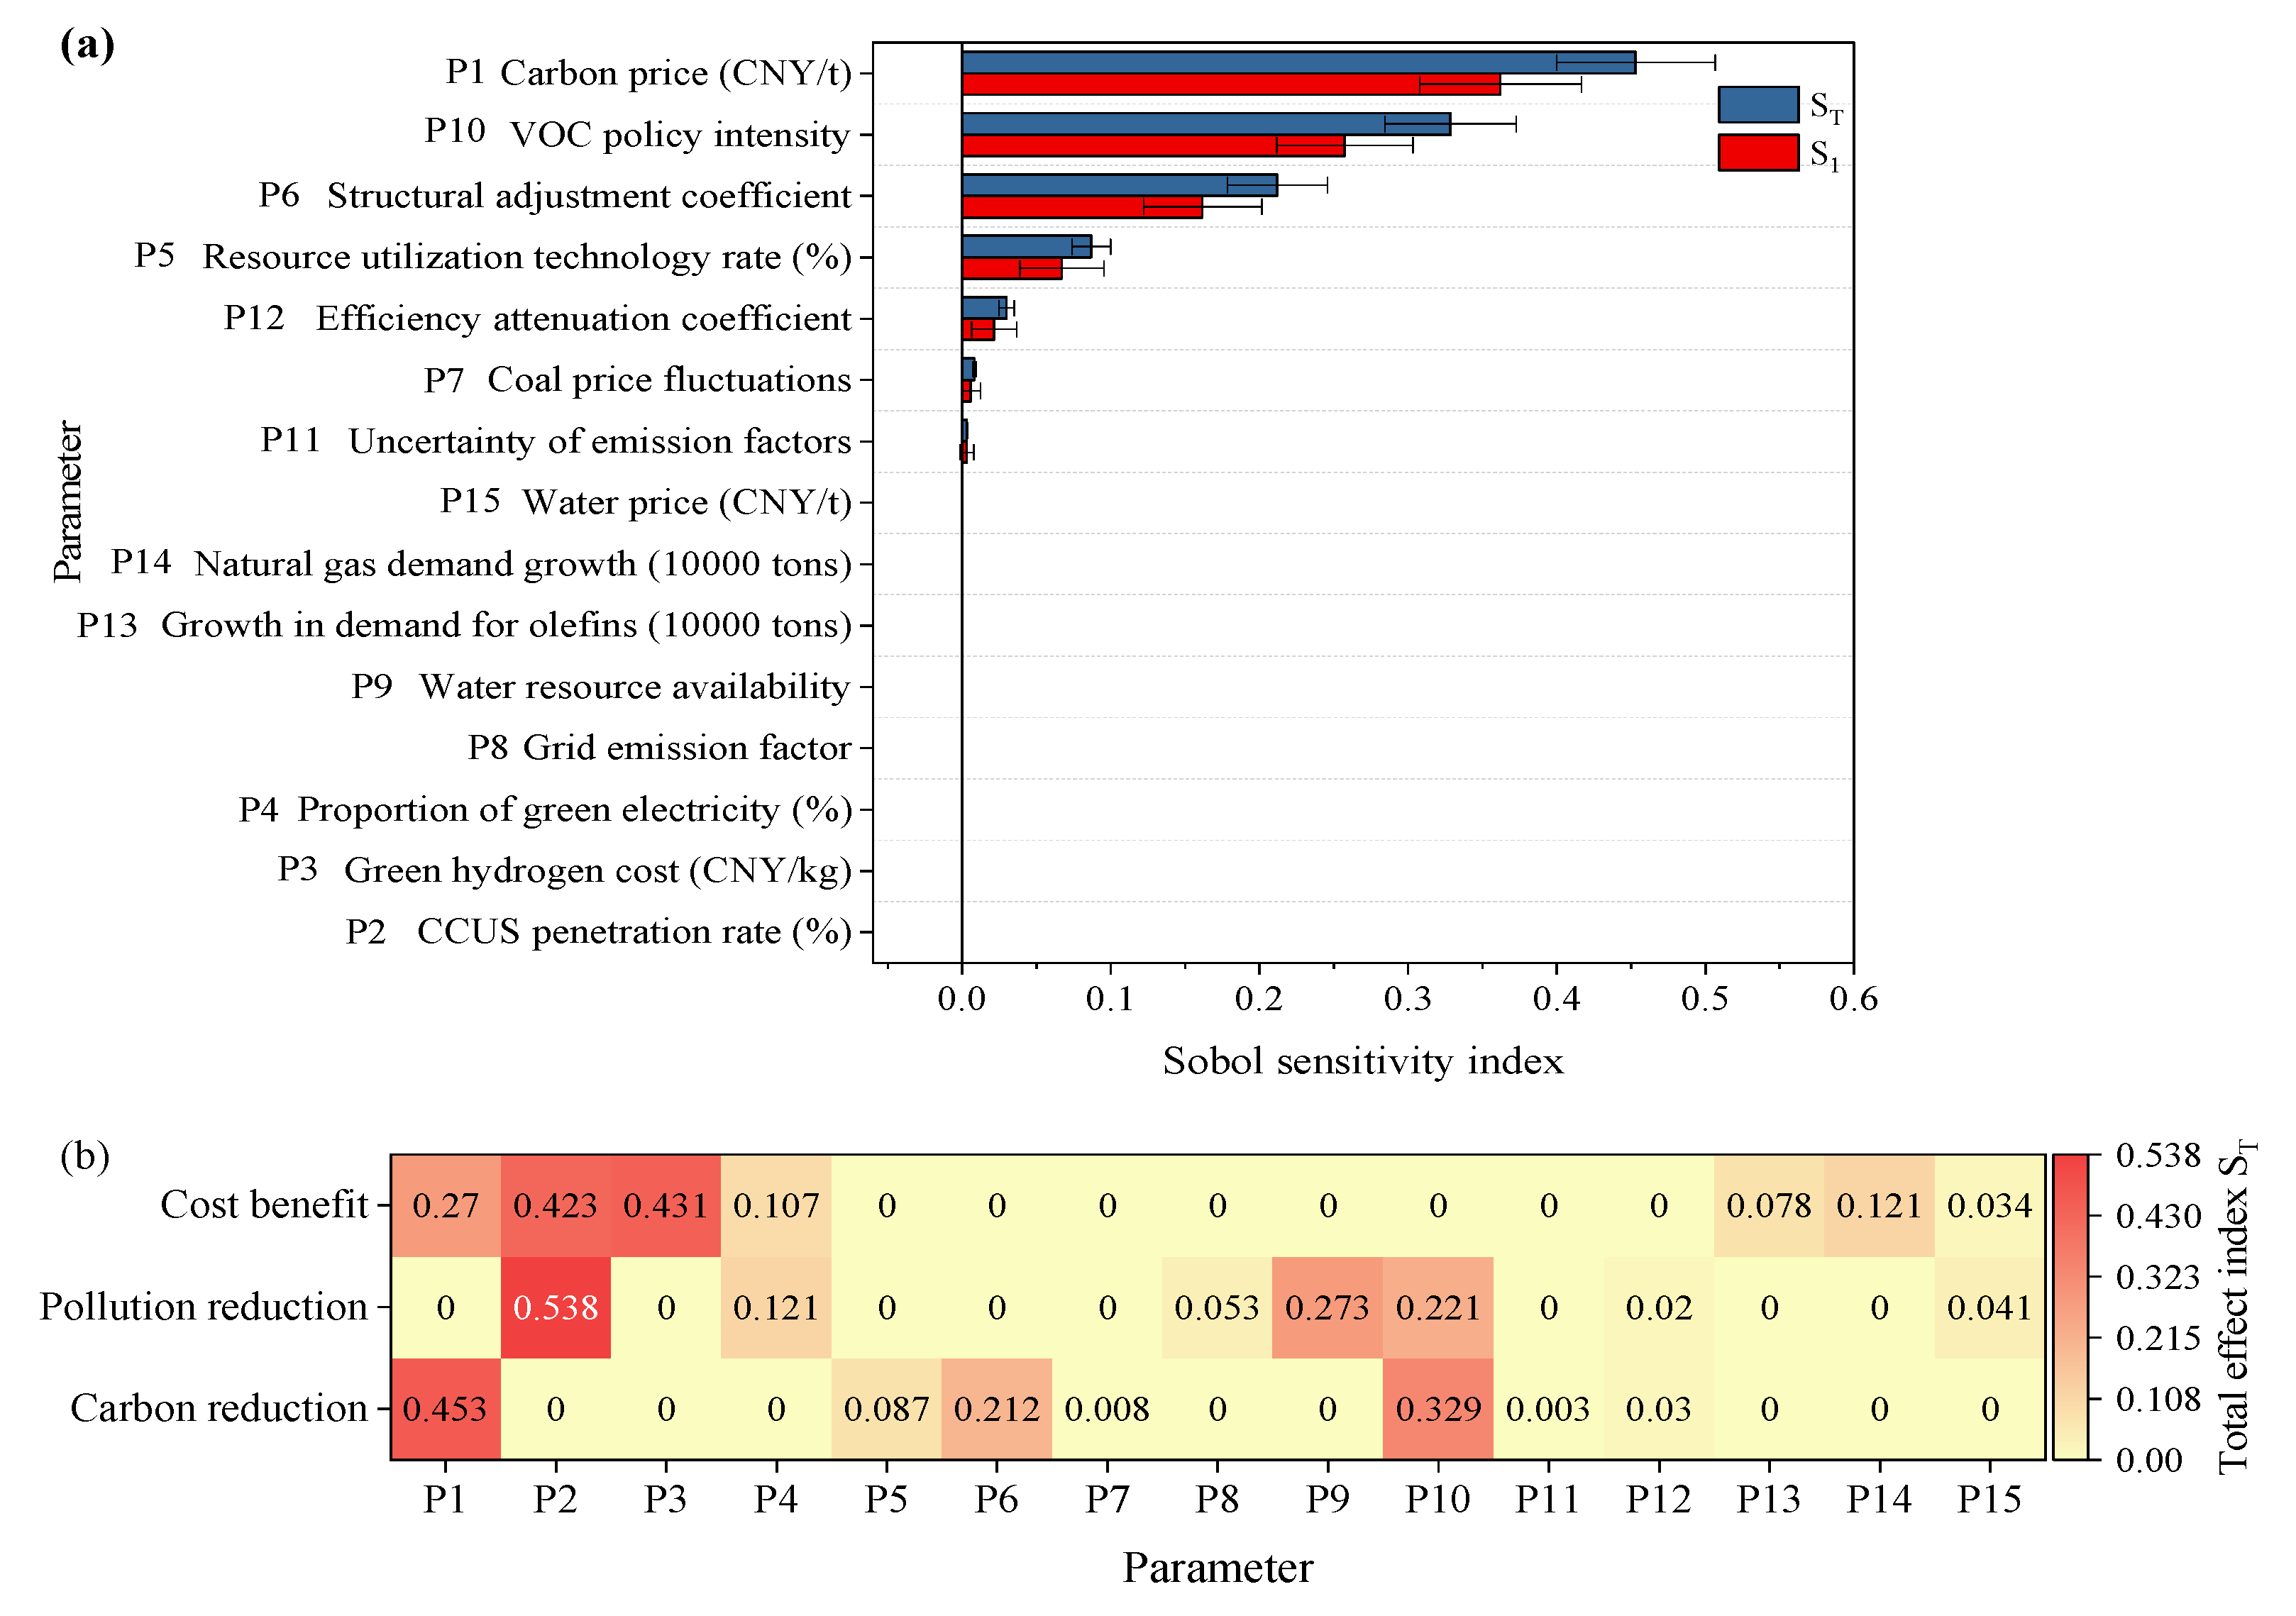
In the Sobol’ analysis employing the Saltelli sampling scheme, the base sample size was set to 1024, the number of parameters was 15, and the total sample size was approximately 17,408. The results indicate that the carbon price parameter P1 has the highest total-effect index ST, making it the primary driver of carbon emission reduction (Figure 4a). The CCUS technology penetration rate parameter P2 and the green hydrogen cost parameter P3 follow closely. For both P2 and P3, the difference between the total-effect index and the first-order index exceeds 0.1, revealing significant interaction effects and suggesting that the coupled deployment of green hydrogen and CCUS yields greater synergistic benefits than promoting either technology in isolation. For the pollutant reduction objective, the comprehensive resource utilization penetration rate parameter P5 and the VOC control policy intensity parameter P10 exhibit relatively high total-effect indices (Figure 4b). Regarding the cost-effectiveness objective, the carbon price parameter P1 and the coal price fluctuation parameter P7 are the dominant driving factors. Under the long-term 2050 framework, the influence of parameter P13 (the output growth rate of coal-to-olefins) and parameter P14 (the output growth rate of coal-to-synthetic natural gas) intensifies significantly, reflecting the profound impact of modern coal chemical industry expansion on long-term emission reduction pathways.
Figure 4.
Sobol global sensitivity analysis for carbon emission reduction and comparison of total-effect indices. (a) Global sensitivity analysis of carbon emission reduction; (b) comparison of total-effect index for carbon reduction, pollutant reduction, and cost benefit.
3.2.3. Shapley Value Analysis of Technology Contributions
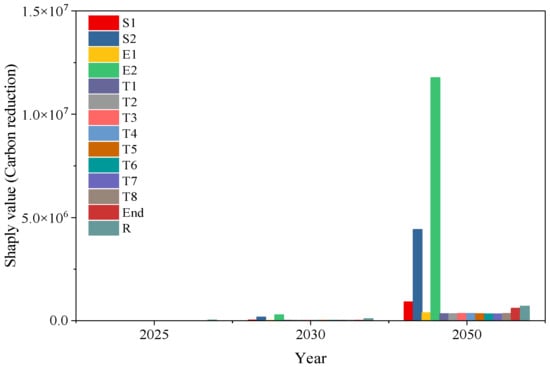
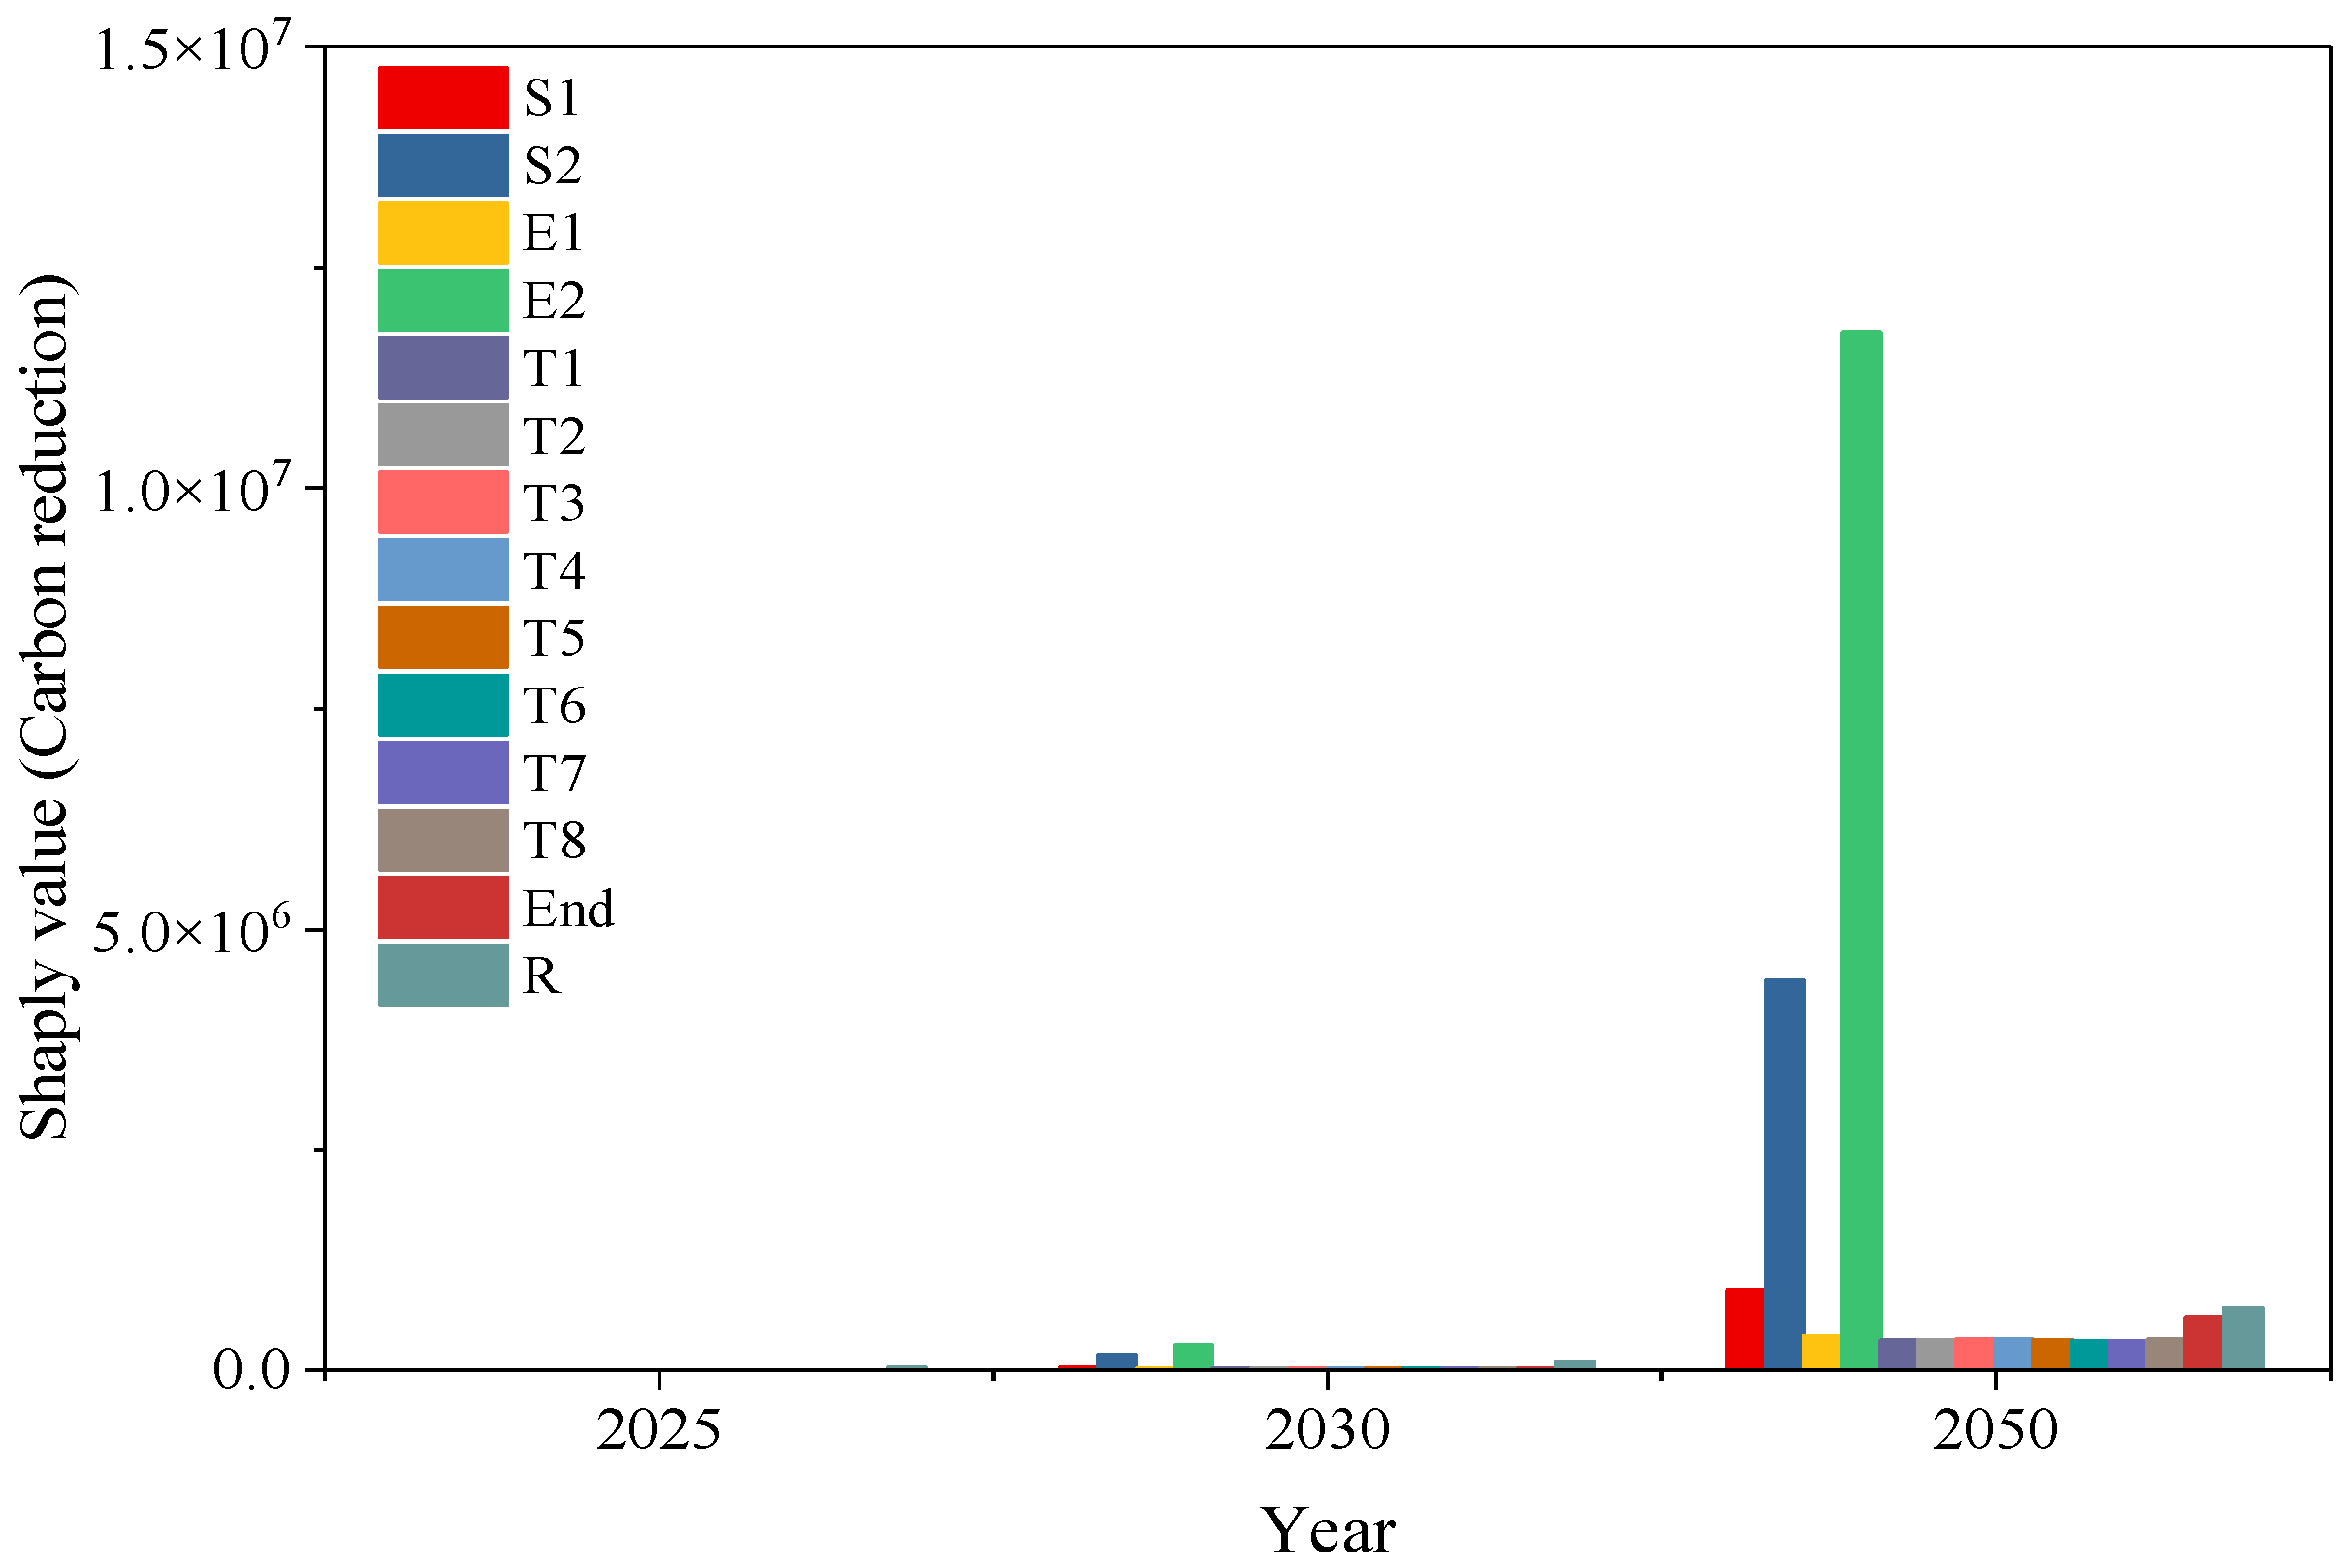
Applying cooperative game theory, we performed a Shapley value analysis through the exact enumeration of all 16,384 technology combinations to identify the fair marginal contribution of each mitigation technology across different time phases. As shown in Figure 5, comprehensive resource utilization technology (technology R, see Table S5 for its full description) emerges as the largest contributor to synergistic emission reduction in 2025, reflecting the outstanding near-term cost-effectiveness advantage of gasification slag and fly ash utilization. From 2030 onward, the marginal contributions of the CCUS–green hydrogen coupling technology S2 and the green electricity direct supply technology E2 rise progressively. By 2050, the combined contribution of green hydrogen substitution S1, CCUS–green hydrogen coupling S2, and green electricity E2 reaches 72% to 98%, establishing them as the dominant mitigation pathway. This finding corroborates the high total-effect indices of parameters P2, P3, and P4 in the Sobol analysis, lending support to the strategy of progressively scaling up novel low-carbon technology deployment around 2030 and achieving deep application by 2050.
Figure 5.
Temporal evolution of Shapley values for individual technologies.
3.3. Scenario Simulation Results
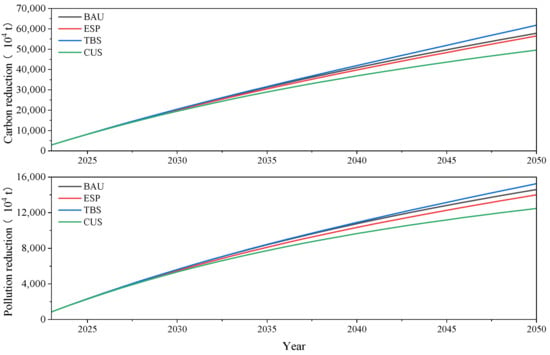
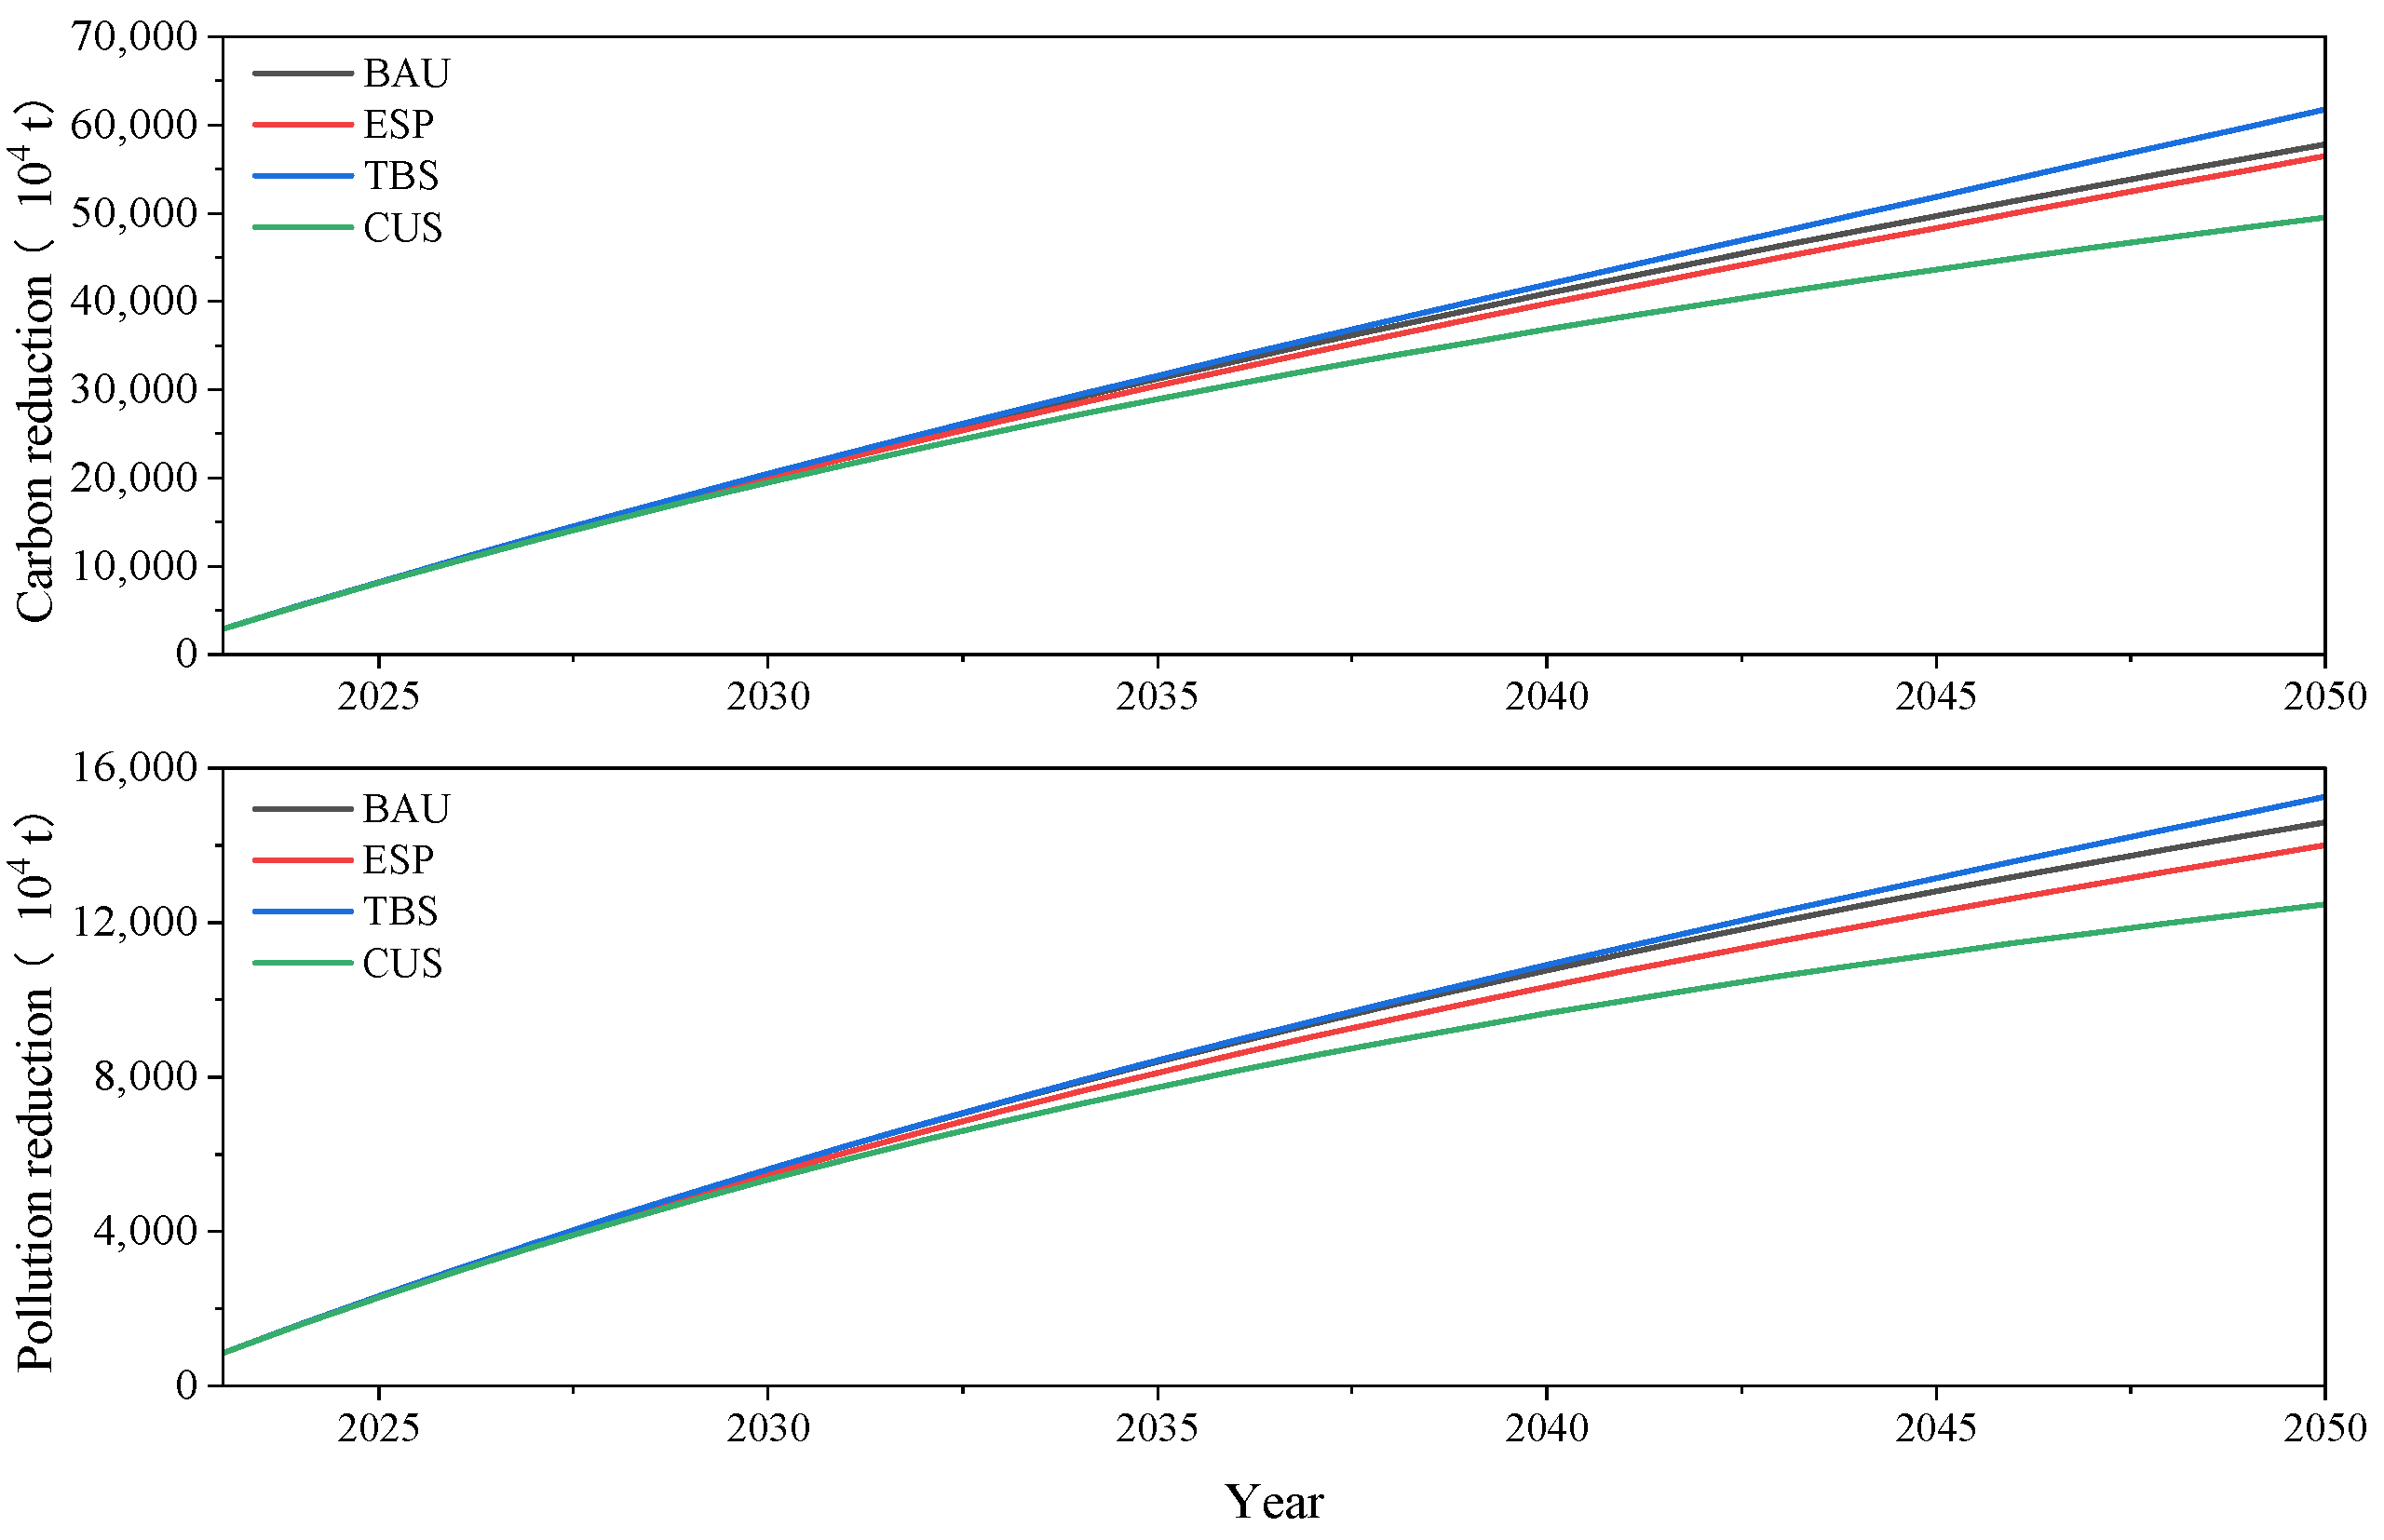
A system dynamics model with an annual time step simulated the dynamic evolution pathways of synergistic carbon and pollutant emission reduction under four scenarios from 2023 to 2050 (Figure 6). Under the BAU scenario, carbon emission reduction grew steadily yet remained insufficient to underpin deep decarbonization, reaching a cumulative total of approximately 577.72 Mt CO2 by 2050, a result consistent with the baseline scenario reported by Sun et al. (2025) [49]. The ESP scenario demonstrated substantial synergistic mitigation potential between 2025 and 2030; however, the marginal cost effectiveness declined by roughly 12% to 18% relative to the BAU scenario because high-cost technologies such as green hydrogen substitution, CCUS coupling, and end-of-pipe treatment had to be deployed ahead of schedule. In the TBS scenario, once the green hydrogen cost broke below the 6.8 CNY/kg threshold, synergistic benefits climbed rapidly, and the carbon emission reduction in 2050 was approximately 2.9 times that of the BAU scenario. Under the CUS scenario, the distribution interval of synergistic benefits in 2050 was the widest, with the span of carbon emission reduction between the fifth and 95th percentiles reaching ±35%, underscoring the compounding effect of multi-dimensional uncertainties.
Figure 6.
Dynamic evolution of synergistic benefits under the four scenarios.
Regarding the temporal deployment strategy, it is advisable around 2025 to follow the ESP pathway by strengthening the application of comprehensive resource utilization technologies while simultaneously launching demonstration deployments of green hydrogen substitution, CCUS coupling, and direct green electricity supply. Around 2030, the industry can return to a baseline development rhythm, continuing the large-scale rollout of resource utilization technologies and gradually expanding the engineering application of these novel low-carbon technologies. By 2050, an intensified development strategy should be adopted again to drive innovative breakthroughs and the deep deployment of green hydrogen substitution, CCUS coupling, and direct green electricity supply.
4. Discussion
4.1. Mechanisms of Uncertainty Impact
Both the Monte Carlo simulations and the Sobol analysis consistently indicate that policy uncertainty is the most influential dimension for synergistic benefits, accounting for approximately 35% of the variance, with technological uncertainty following closely at around 28%. The threshold effect of the carbon price is particularly noteworthy: once the carbon price exceeds 80 CNY per tonne, the economic viability of CCUS technology undergoes a structural transformation. This 80 CNY/t critical point is significantly lower than the assessed capture costs for CCUS in China’s coal chemical industry [51,52,53]. The discrepancy primarily arises because our model focuses on high-concentration emission sources, considers only the capture stage cost, and incorporates dedicated subsidies. It should be noted, however, that our estimated 80 CNY/t threshold applies to the capture stage only. Including CO2 transport and storage would raise the full-chain CCUS cost by approximately 30–80 CNY/t CO2, depending on transport distance and storage site conditions, shifting the economic viability threshold to around 120–150 CNY/t CO2. This range aligns with full-chain CCUS cost assessments reported for China‘s coal chemical clusters [51,52]. Nevertheless, the proximity of major bases (e.g., Ordos, Ningdong) to Ordos Basin storage sites could partially offset transport costs. We therefore recommend a progressive carbon pricing trajectory complemented by targeted CCUS subsidies, aiming for the carbon price to effectively break through this key threshold around 2030, while also considering differentiated support that accounts for full-chain costs and regional storage advantages.
4.2. Trade-Offs and Synergies
The Shapley value analysis reveals a significant trade-off between the short and long term. Comprehensive resource utilization technology R (gasification slag and fly ash comprehensive utilization) contributes the most in the near term (2025), but its marginal benefit declines year by year, reflecting the characteristic that end-of-pipe treatment and resource recovery pathways tend to deliver early results. Although the marginal contributions of green hydrogen substitution technology S1 and CCUS and green hydrogen coupling technology S2 are extremely low in 2025, with Shapley values approaching zero, their long-term contributions rise steadily and become absolutely dominant by 2050. This finding confirms that the model of reducing pollution through carbon mitigation is more aligned with long-term emission reduction needs [54,55,56]. The LMDI decomposition results offer further support at the driver level, showing that the contribution rate of the technology reduction effect rose from 21% to 47% during 2030 to 2050, surpassing the scale effect to become the largest emission reduction driver. It should be noted that although end-of-pipe technologies such as CCUS can achieve significant CO2 emission reductions, they may entail increased energy consumption and operating costs [57,58], whereas clean feedstock substitution pathways like green hydrogen, despite higher initial costs, yield more pronounced long-term synergistic benefits [59,60,61].
4.3. Policy Recommendations
Based on the findings that policy and technology uncertainties dominate the presence of threshold effects for carbon price and green hydrogen cost, and the identified short-term versus long-term trade-offs in technology portfolios, this study recommends reinforcing policy design in the areas of a dynamic response mechanism, risk-hedging strategies, regionally differentiated deployment, and watershed collaborative governance. At the policy design level, a dynamic threshold response mechanism should be established to automatically activate dedicated CCUS subsidies once the carbon price exceeds 80 CNY per tonne and to accelerate the commercialization of green hydrogen as its cost falls below 6.8 CNY per kilogram, thereby creating an effective linkage between price signals and technology deployment. To avoid the inherent uncertainty of relying on a single technology pathway, a technology portfolio fund should be set up to guide enterprises toward risk-hedging routes that integrate gasification slag utilization with CCUS and renewable energy. Spatially, differentiated deployment strategies should be adopted according to regional resource endowments. Regions abundant in wind and solar resources, including Ningxia, Qinghai, Inner Mongolia, and Gansu, should prioritize direct green electricity supply and the coupling of CCUS with green hydrogen, whereas traditional industrial clusters in Shanxi, Shandong, and Henan should emphasize resource comprehensive utilization and energy-saving retrofits in the near term while gradually incorporating novel low-carbon technologies. The effective implementation of these measures also depends on watershed-scale collaborative governance, which encompasses establishing a cross-provincial joint monitoring platform for pollutants and carbon emissions [62,63], implementing a synergistic water, carbon, and energy management mechanism [64,65], and taking the lead in introducing a full-life cycle carbon labeling system for coal chemical products in the Yellow River Basin [66].
4.4. Limitations and Future Research
This study has several limitations. Carbon emission data for some provinces prior to 2021 are incomplete, and future efforts should strengthen the retroactive compilation and verification of historical data. The model has not yet fully incorporated the uncertainty transmission effects along the upstream and downstream supply chain, such as the impact of coal price fluctuations on the competitiveness of coal chemical products. Market penetration pathways for emerging coal chemical products, including coal-to-fine chemicals, have not been integrated into the model framework, which may affect the accurate assessment of long-term emission reduction potential. Moreover, the system dynamics model employed is a simplified version and does not fully capture the complex nonlinear relationships inherent in real production systems. Future research could proceed along several directions: introducing artificial intelligence methods to predict the impacts of extreme climate events on the industry, developing a life cycle supply chain uncertainty analysis framework, and conducting empirical validation studies at the enterprise level.
5. Conclusions
This study constructed a multi-level uncertainty conduction model to systematically quantify the impacts of policy, technology, market, and ecological uncertainties on the synergistic pathways of pollution reduction and carbon mitigation in the coal chemical industry of the Yellow River Basin. The results indicate that policy and technology uncertainties are the dominant factors constraining synergistic benefits, with variance contribution rates of 35% and 28%, respectively. A carbon price of 80 CNY per tonne and a green hydrogen cost of 6.8 CNY per kilogram constitute two critical thresholds, triggering a structural leap in CCUS economic viability and the large-scale deployment of green hydrogen substitution, respectively, and revealing the nonlinear nature of synergistic governance dominated by nested multiple thresholds. The dynamic threshold response mechanism and technology portfolio hedging strategy we propose are expected to increase synergistic benefits by 22% to 35%, suggesting that proactively managing uncertainty itself can constitute a significant emission reduction gain. In terms of technology pathways, comprehensive resource utilization, CCUS coupled with green hydrogen, green hydrogen substitution, and direct green electricity supply exhibit a sequential, cascading temporal structure, requiring policy design to accommodate the integration of technologies at different maturity levels. Spatially, regions rich in wind and solar resources and traditional industrial agglomerations form a complementary pattern in emission reduction timelines and technology choices. We recommend establishing a life cycle carbon labeling system for coal chemical products in the Yellow River Basin, thereby promoting a shift in collaborative watershed governance from an administrative-driven to a standard-driven approach.
Despite these contributions, this study has several limitations, including incomplete historical data for some provinces, failure to address supply chain uncertainty and emerging product pathways, and simplifications in the system dynamics model. Future research will address these through AI-based extreme event prediction, life cycle supply chain analysis, and enterprise-level empirical validation.
Supplementary Materials
The following supporting information can be downloaded at https://www.mdpi.com/article/10.3390/app16136747/s1, Table S1: Coal chemical production in the Yellow River Basin (Mt) [1,2,3,4]; Table S2: Key parameters and reference sources [5,23,24,25,67,68,69]; Table S3: Carbon emission factors for different production processes [25,69,70,71,72,73]; Table S4: Pollutant emission factors in the production process of coal chemical products; Table S5: Emission reduction scenario development for the coal chemical industry in the Yellow River Basin [74,75,76,77]; Table S6: Costs of different emission reduction technologies [68,77,78,79,80,81,82,83,84,85,86,87]; Table S7: Probability distribution parameters; Table S8: Key parameters for the Sobol’ analysis; Table S9: Comparison of multi-level sensitivity analysis methods; Table S10: Emission reduction technology inventory for the Shapley value analysis; Table S11: Grouping of emission reduction technologies for Shapley value analysis; Table S12: Shapley values for different years; Table S13: Logistic S-curve diffusion parameters; Table S14: Technology penetration rates across scenarios.
Author Contributions
Y.S.: conceptualization; methodology; investigation; formal analysis; writing—original draft, writing—review and editing. Y.Z.: conceptualization, investigation, writing—review and editing. X.Z.: conceptualization, investigation, writing—review and editing. Q.Q.: methodology, writing—review and editing, supervision, data curation. L.B.: methodology, writing—review and editing, supervision, data curation. All authors have read and agreed to the published version of the manuscript.
Funding
This research was supported by the projects Assessment and Empirical Research on the Synergistic Capacity of Resource Dependent Industries for Pollution Reduction and Carbon Reduction in the Yellow River Basin (2022-YRUC-01-0404), and Technological System and Strategies of Synergistic Governance for Pollution Reduction and Carbon Reduction in the Yellow River Basin (2022-YRUC-01-0602-05), Research on Coal Chemical Industry Park Pollution Reduction and Carbon Reduction Synergistic Optimization Strategies Based on Artificial Intelligence (2024YSKY-21).
Data Availability Statement
The original contributions presented in this study are included in the article and Supplementary Material. Further inquiries can be directed to the corresponding authors.
Acknowledgments
Thanks for all funding support provided for this research.
Conflicts of Interest
The authors declare no conflicts of interest.
References
- Ministry of Natural Resources of the People Republic of China. China Mineral Resources Report 2024; Geological Publishing House: Beijing, China, 2024. Available online: https://www.docin.com/p-4767708673.html (accessed on 5 May 2026).
- Research Group on High-quality Development of Industries in the Yellow River Basin. Research Report on High-Quality Development of Industries in the Yellow River Basin (2023); Economics & Management Publishing House: Beijing, China, 2024. [Google Scholar]
- National Bureau of Statistics of China. Statistical Bulletin of the People’s Republic of China on National Economic and Social Development in 2023; National Bureau of Statistics of China: Beijing, China, 2024. Available online: https://www.stats.gov.cn/sj/zxfb/202402/t20240228_1947915.html (accessed on 5 May 2026).
- Yellow River Conservancy Commission of the Ministry of Water Resources. Yellow River Water Resources Bulletin (2024); Yellow River Conservancy Commission of the Ministry of Water Resources: Zhengzhou, China, 2025. Available online: http://yrcc.gov.cn/gzfw/szygb/202512/P020251216363246418011.pdf (accessed on 5 May 2026).
- Gong, Q.; Chan, Y.; Xia, Y.; Tang, W.; Ma, W. Analysis of the Synergies of Air Pollutant and Greenhouse Gas Emission Reduction in Typical Chemical Enterprises. Sustainability 2025, 17, 6263. [Google Scholar] [CrossRef] [Scilit]
- Xu, M.; Li, H.; Deng, X. Measuring the Synergistic Effect of Pollution and Carbon Reduction in China’s Industrial Sector. Sustainability 2024, 16, 1048. [Google Scholar] [CrossRef] [Scilit]
- Zhao, Y.; Yin, Z.; Zhang, X.; Kuang, Y.; Zhao, Y.; Liu, J.; Zhang, Q.; Li, Y. Collaborative control path of pollution and carbon reduction in industrial field in Hohhot–Baotou–Ordos region of Inner Mongolia. Heliyon 2024, 10, e40695. [Google Scholar] [CrossRef] [Scilit] [PubMed]
- Gao, Z.; Jia, Z.; Zhao, Y.; Hao, Y. Enhancing the Synergistic Pathways of Industrial Pollution and Carbon Reduction (PCR) in China: An Energy Efficiency Perspective. Energies 2025, 18, 2413. [Google Scholar] [CrossRef] [Scilit]
- Liu, H.; Tian, Z. Quantitative evaluation of co-benefits of pollution reduction and carbon emission reduction and improvement path from the perspective of performance. Resour. Sci. 2024, 46, 1239–1251. [Google Scholar] [CrossRef] [Scilit]
- Nie, C.; Lee, C. Synergy of pollution control and carbon reduction in China: Spatial-temporal characteristics, regional differences, and convergence. Environ. Impact Assess. Rev. 2023, 101, 107110. [Google Scholar] [CrossRef] [Scilit]
- Dong, H.; Dai, H.; Dong, L.; Fujita, T.; Geng, Y.; Klimont, Z.; Inoue, T.; Bunya, S.; Fujii, M.; Masui, T. Pursuing air pollutant co-benefits of CO2 mitigation in China: A provincial leveled analysis. Appl. Energy 2015, 144, 165–174. [Google Scholar] [CrossRef] [Scilit]
- Duan, Z.; Wei, T.; Xie, P.; Lu, Y. Co-benefits and influencing factors exploration of air pollution and carbon reduction in China: Based on marginal abatement costs. Environ. Res. 2024, 252, 118742. [Google Scholar] [CrossRef] [Scilit] [PubMed]
- Li, S.; Wang, S.; Wu, Q.; Zhao, B.; Jiang, Y.; Zheng, H.; Wen, Y.; Zhang, S.; Wu, Y.; Hao, J. Integrated Benefits of Synergistically Reducing Air Pollutants and Carbon Dioxide in China. Environ. Sci. Technol. 2024, 58, 14193–14202. [Google Scholar] [CrossRef] [Scilit] [PubMed]
- Xing, J.; Lu, X.; Wang, S.; Wang, T.; Ding, D.; Yu, S.; Shindell, D.; Ou, Y.; Morawska, L.; Li, S.; et al. The quest for improved air quality may push China to continue its CO2 reduction beyond the Paris Commitment. Proc. Natl. Acad. Sci. USA 2020, 117, 29535–29542. [Google Scholar] [CrossRef] [Scilit] [PubMed]
- Lo Piano, S.; Benini, L. A critical perspective on uncertainty appraisal and sensitivity analysis in life cycle assessment. J. Ind. Ecol. 2022, 26, 763–781. [Google Scholar] [CrossRef] [Scilit]
- Habibi, F.; Chakrabortty, R.K.; Abbasi, A. Towards facing uncertainties in biofuel supply chain networks: A systematic literature review. Environ. Sci. Pollut. Res. 2023, 30, 100360–100390. [Google Scholar] [CrossRef] [Scilit] [PubMed]
- Chen, L.; Wang, Y.; Peng, J.; Xiao, Q. Supply chain management based on uncertainty theory: A bibliometric analysis and future prospects. Fuzzy Optim. Decis. Mak. 2024, 23, 599–636. [Google Scholar] [CrossRef] [Scilit]
- Carnohan, S.A.; Trier, X.; Liu, S.; Clausen, L.P.W.; Clifford-Holmes, J.K.; Hansen, S.F.; Benini, L.; McKnight, U.S. Next generation application of DPSIR for sustainable policy implementation. Curr. Res. Environ. Sustain. 2023, 5, 100201. [Google Scholar] [CrossRef] [Scilit]
- Patrício, J.; Elliott, M.; Mazik, K.; Papadopoulou, K.-N.; Smith, C.J. DPSIR—Two Decades of Trying to Develop a Unifying Framework for Marine Environmental Management? Front. Mar. Sci. 2016, 3, 177. [Google Scholar] [CrossRef] [Scilit]
- Gong, H.; Hansen, T. The rise of China’s new energy vehicle lithium-ion battery industry: The coevolution of battery technological innovation systems and policies. Environ. Innov. Soc. Transit. 2023, 46, 44–57. [Google Scholar] [CrossRef] [Scilit]
- Grubb, M.; Drummond, P.; Poncia, A.; McDowall, W.; Popp, D.; Samadi, S.; Penasco, C.; Gillingham, K.T.; Smulders, S.; Glachant, M.; et al. Induced innovation in energy technologies and systems: A review of evidence and potential implications for CO2 mitigation. Environ. Res. Lett. 2021, 16, 043007. [Google Scholar] [CrossRef] [Scilit]
- Standing Committee of the National People’s Congress. Environmental Protection Tax Law of the People’s Republic of China (Revised in 2018); Standing Committee of the National People’s Congress: Beijing, China, 2018.
- Zhang, Y.; Yuan, Z.; Margni, M.; Bulle, C.; Hua, H.; Jiang, S.; Liu, X. Intensive carbon dioxide emission of coal chemical industry in China. Appl. Energy 2019, 236, 540–550. [Google Scholar] [CrossRef] [Scilit]
- Liu, X.; Zhu, B.; Zhou, W.; Hu, S.; Chen, D.; Griffy-Brown, C. CO2 emissions in calcium carbide industry: An analysis of China’s mitigation potential. Int. J. Greenh. Gas. Control 2011, 5, 1240–1249. [Google Scholar] [CrossRef] [Scilit]
- WRI. Greenhouse Gas Protocol Tool for Energy Consumption in China V2.1, WRI: Washington, DC, USA, 2013. Available online: http://www.ghgprotocol.org/calculation-tools (accessed on 3 May 2026).
- Ministry of Ecology and Environment of China. Guidelines for Greenhouse Gas Emission Accounting and Reporting of Power Companies; Ministry of Ecology and Environment of the People’s Republic of China: Beijing, China, 2021. Available online: https://www.mee.gov.cn/xxgk2018/xxgk/xxgk06/202112/W020211202787053248513.pdf (accessed on 27 May 2026).
- National Development and Reform Commission of China. Guidelines for Greenhouse Gas Emission Accounting and Reporting of Chemical Companies; National Development and Reform Commission of the People’s Republic of China: Beijing, China, 2013. Available online: http://www.gov.cn/gzdt/att/att/site1/20131104/001e3741a2cc13e13f1c04.pdf (accessed on 27 May 2026).
- National Energy Administration of China. Plans for China’s Coal Deep Processing S48 Industry Demonstration; National Energy Administration of China: Beijing, China, 2017. Available online: http://zfxxgk.nea.gov.cn/auto83/201703/W020170303357509200744.pdf (accessed on 15 May 2026).
- Cinda Securities. Financial Analysis Report of a Coal Chemical Company in China; Cinda Securities: Beijing, China, 2020; Available online: https://pdf.dfcfw.com/pdf/H3_AP202011181430589743_1.pdf?1605720153000.pdf (accessed on 15 May 2026).
- PingAn Securities. Financial Analyses of Coal Chemical Industry in China; PingAn Securities: Shenzhen, China, 2022; Available online: https://www.hstong.com/news/detail/22030213222622497 (accessed on 15 May 2026).
- ZhongTai Securities. Analysis Report of Coal-To-Coke Industry in China; ZhongTai Securities: Jinan, China, 2020; Available online: http://pdf.dfcfw.com/pdf/H3_AP202006151384987522_1.pdf (accessed on 15 May 2026).
- Shanghai Brilliance Credit Rating & Investors Service. Impacts of Electricity Price Adjustment on the PVC Industry; Shanghai Brilliance Credit Rating & Investors Service: Shanghai, China, 2015; Available online: http://www.shxsj.com/uploadfile/kanwu/1231-6.pdf (accessed on 15 May 2026).
- LeadLeo Research Institute. Status Analysis of China’s Ammonia Industry in 2019; LeadLeo Research Institute: Shenzhen, China, 2019; Available online: http://pdf.dfcfw.com/pdf/H3_AP202008191399559082_1.pdf (accessed on 15 May 2026).
- Sealand Securities. Financial Analyses of a Coal Chemical Company in China; Sealand Securities: Shenzhen, China, 2022; Available online: https://pdf.dfcfw.com/pdf/H3_AP202206191573190239_1.pdf (accessed on 15 May 2026).
- Maxim, L.; Spangenberg, J.H.; O’Connor, M. An analysis of risks for biodiversity under the DPSIR framework. Ecol. Econ. 2009, 69, 12–23. [Google Scholar] [CrossRef] [Scilit]
- Ndabula, C. Evidence of Climate and Environmental Change in Nigeria: Synthesis from the Driving Force, Pressure, State, Impact and Response (DPSIR) Framework. J. Environ. Earth Sci. 2021, 11, 7. [Google Scholar] [CrossRef] [Scilit]
- McKay, M.D.; Beckman, R.J.; Conover, W.J. A Comparison of Three Methods for Selecting Values of Input Variables in the Analysis of Output from a Computer Code. Technometrics 2000, 42, 55–61. [Google Scholar] [CrossRef]
- Saltelli, A. Making best use of model evaluations to compute sensitivity indices. Comput. Phys. Commun. 2002, 145, 280–297. [Google Scholar] [CrossRef] [Scilit]
- Saltelli, A.; Ratto, M.; Andres, T.; Campolongo, F.; Cariboni, J.; Gatelli, D.; Saisana, M.; Tarantola, S. Global Sensitivity Analysis. Biometrics 2009, 65, 1311–1312. [Google Scholar] [CrossRef] [Scilit]
- Sobol, I.M. Global sensitivity indices for nonlinear mathematical models and their Monte Carlo estimates. Math. Comput. Simul. 2001, 55, 271–280. [Google Scholar] [CrossRef] [Scilit]
- Shapley, L.S. A Value for N-Person Games; Princeton University Press: Princeton, NJ, USA, 2016; Volume 2, pp. 307–318. [Google Scholar] [CrossRef] [Scilit]
- Forrester, J.W. Industrial Dynamics: A Major Breakthrough for Decision Makers. In The Roots of Logistics; Springer: Berlin/Heidelberg, Germany, 2012; pp. 141–172. [Google Scholar] [CrossRef] [Scilit]
- Liu, Q.; Zheng, X.; Zhao, X.; Chen, Y.; Lugovoy, O. Carbon emission scenarios of China’s power sector: Impact of controlling measures and carbon pricing mechanism. Adv. Clim. Change Res. 2018, 9, 27–33. [Google Scholar] [CrossRef] [Scilit]
- Liu, S.; Ye, Z.; Zhou, J.; Liu, C.; Li, C.; Liang, G. Optimal deployment of CCUS networks coupled carbon capture technologies with tax incentive policy. Int. J. Green Energy 2025, 22, 2698–2716. [Google Scholar] [CrossRef] [Scilit]
- Sun, L.; Chen, W. Impact of carbon tax on CCUS source-sink matching: Finding from the improved ChinaCCS DSS. J. Clean. Prod. 2022, 333, 130027. [Google Scholar] [CrossRef] [Scilit]
- Fisher, J.C.; Pry, R.H. A simple substitution model of technological change. Technol. Forecast. Soc. Change 1971, 3, 75–88. [Google Scholar] [CrossRef] [Scilit]
- Geroski, P.A. Models of technology diffusion. Res. Policy 2000, 199, 603–625. [Google Scholar] [CrossRef] [Scilit]
- Lu, D.; Wang, A.; Gan, H.; Su, Y.; Ao, X. A multi-objective collaborative optimization method of ship energy efficiency based on NSGA-II and TOPSIS. Brodogradnja 2025, 76, 1–23. [Google Scholar] [CrossRef] [Scilit]
- Sun, Y.Y.; Zhang, Y.; Li, Y.C.; Qiao, Q.; Bai, L. Carbon and pollution mitigation pathways for coal chemical industry in the Yellow River Basin. Res. Environ. Sci. 2025, 38, 2569–2579. [Google Scholar] [CrossRef]
- Jain, S.; Rankavat, S. Analysing driving factors of India’s transportation sector CO2 emissions: Based on LMDI decomposition method. Heliyon 2023, 9, e19871. [Google Scholar] [CrossRef] [Scilit] [PubMed]
- Cai, B.; Li, Q.; Zhang, X.; Xu, X.; Guo, J.; Pang, L.; Liu, G.; Tan, Y.; Li, X.; Xu, L.; et al. Annual Report on China’s Carbon Dioxide Capture, Utilization and Storage (CCUS) (2024)—Study on Economic Feasibility of Regional CO2 Geological Storage in China; Chinese Academy for Environmental Planning, Ministry of Ecology and Environment: Beijing, China, 2024; Available online: http://www.caep.org.cn/ywdt/zhxx/202403/t20240304_1153921.html (accessed on 9 May 2026).
- Zhang, X.; Yang, X.; Lu, X.; Chen, J.; Cheng, J.; Diao, Y.; Fan, J.; Gao, L.; Gao, S.; Han, L.; et al. Annual Report on China’s Carbon Dioxide Capture, Utilization and Storage (2023). In Administrative Center for China’s Agenda 21, Global CCS Institute; Tsinghua University: Beijing, China, 2024; Available online: https://www.acca21.com.cn/trs/000100170002/16690.html (accessed on 9 May 2026).
- Zhong, L. Economic Assessment Study of Large-Scale Carbon Capture and Storage Demonstration Project Based on Full-Chain System Optimization; North China Electric Power University: Beijing, China, 2017. [Google Scholar]
- Asif, Z.; Chen, Z.; Wang, H.; Zhu, Y. Update on air pollution control strategies for coal-fired power plants. Clean. Technol. Environ. Policy 2022, 24, 2329–2347. [Google Scholar] [CrossRef] [Scilit] [PubMed]
- Pan, Y.; Liu, X.; Guo, C.; Guo, Y.; Welsch, E.; Feng, Z.; Ma, X.; Liu, G.; Xu, M.; Dai, H. Reducing coal use is key to curbing toxic trace elements emissions in China driven by carbon neutrality policy. Glob. Environ. Change 2025, 91, 102965. [Google Scholar] [CrossRef] [Scilit]
- Zhang, H.; Wang, Y.; Hao, C.; Lu, Y.; Jin, L.; Lian, C.; Jiang, H.; Wu, L.; Cao, D. Coal-carbon-pollution coordinated control of coal chemical industry under carbon peak and carbon neutrality constrains. Environ. Sci. 2023, 44, 1120–1127. [Google Scholar] [CrossRef] [Scilit] [PubMed]
- Baskaran, D.; Saravanan, P.; Nagarajan, L.; Byun, H.-S. An overview of technologies for capturing, storing, and utilizing carbon dioxide: Technology readiness, large-scale demonstration, and cost. Chem. Eng. J. 2024, 491, 151998. [Google Scholar] [CrossRef] [Scilit]
- Liu, S.; Wei, N.; Jiang, D.; Nie, L.; Cai, B.; Tao, Y.; Li, X. Emission reduction path for coal-based enterprises via carbon capture, geological utilization, and storage: China energy group. Energy 2023, 273, 127222. [Google Scholar] [CrossRef] [Scilit]
- Curcio, E. Techno-Economic Analysis of Hydrogen Production: Costs, Policies, and Scalability in the Transition to Net-Zero. Int. J. Hydrogen Energy 2025, 128, 473–487. [Google Scholar] [CrossRef] [Scilit]
- Jayachandran, M.; Gatla, R.K.; Flah, A.; Milyani, A.H.; Milyani, H.M.; Blazek, V.; Prokop, L.; Kraiem, H. Challenges and Opportunities in Green Hydrogen Adoption for Decarbonizing Hard-to-Abate Industries: A Comprehensive Review. IEEE Access 2024, 12, 23363–23388. [Google Scholar] [CrossRef] [Scilit]
- Marouani, I.; Guesmi, T.; Alshammari, B.M.; Alqunun, K.; Alzamil, A.; Alturki, M.; Hadj Abdallah, H. Integration of Renewable-Energy-Based Green Hydrogen into the Energy Future. Processes 2023, 11, 2685. [Google Scholar] [CrossRef] [Scilit]
- Collado, E.; Calderón, S.; Cedeño, B.; De León, O.; Centella, M.; García, A.; Sáez, Y. Open-source Internet of Things (IoT)-based air pollution monitoring system with protective case for tropical environments. HardwareX 2024, 19, e00560. [Google Scholar] [CrossRef] [Scilit] [PubMed]
- Sebastian, P.M.; Romeo, C.; Ursan, G.A.; Ramona, S. Remote Data Acquisition and Monitoring for an Integrated Air Pollutant Monitoring System. In Proceedings of the 2019 International Conference on Electromechanical and Energy Systems (SIELMEN), Craiova, Romania, 16–18 October 2019; pp. 1–6. [Google Scholar]
- Han, Y.; Jiang, Z.; Zhao, M.; Li, J. Analysis of coupling coordination development and obstacle factors in the water-energy-carbon-ecological environment nexus across China’s Yellow River basin. Sci. Rep. 2025, 15, 9234. [Google Scholar] [CrossRef] [Scilit] [PubMed]
- Li, J.; Han, Y.; Zhao, M.; Jiang, Z. Collaborative optimization path of the “water-carbon-ecology” system in the Yellow River Basin: Spatio-temporal evolution and driving factors. Front. Ecol. Evol. 2025, 13, 1586301. [Google Scholar] [CrossRef] [Scilit]
- Bishan, W.; Zhenling, L.; Ashraf, M.A. Establishment of the carbon label mechanism of coal chemical products based oncarbon footprint. Braz. Arch. Biol. Technol. 2016, 59, e16160509. [Google Scholar] [CrossRef] [Scilit]
- Guo, Y.; Peng, L.; Tian, J.; Mauzerall, D.L. Deploying green hydrogen to decarbonize China’s coal chemical sector. Nat. Commun. 2023, 14, 8104. [Google Scholar] [CrossRef] [Scilit] [PubMed]
- Zhang, Y.; Zhang, N.; Hongcai, D.; Siyu, Z.; Xiaoyu, W.; Meimei, X. Model construction and pathways of low-carbon transition of China’s power system. Electr. Power 2021, 54, 1–11. [Google Scholar] [CrossRef]
- Ministry of Ecology and Environment National Bureau of Statistics. Announcement on the Release of 2022 Electricity Carbon Dioxide Emission Factors; Ministry of Ecology and Environment National Bureau of Statistics: Beijing, China, 2023. Available online: https://www.mee.gov.cn/xxgk2018/xxgk/xxgk01/202412/t20241226_1099413.html (accessed on 1 June 2026).
- IKE Environmental Technology. Chinese Life Cycle Database V0.8; IKE Environmental Technology: Chengdu, China, 2014. [Google Scholar]
- Zhu, X.; Wang, S.; Wang, L. Life cycle analysis of greenhouse gas emissions of China’s power generation on spatial and temporal scale. Energy Sci. Eng. 2022, 10, 1083–1095. [Google Scholar] [CrossRef] [Scilit]
- Xu, K.; Chang, J.; Zhou, W.; Li, S.; Shi, Z.; Zhu, H.; Chen, Y.; Guo, K. A comprehensive estimate of life cycle greenhouse gas emissions from onshore wind energy in China. J. Clean. Prod. 2022, 338, 130683. [Google Scholar] [CrossRef] [Scilit]
- Zhang, N.; Xing, L.; Lu, G. Outlook and challenges for the development of medium–and long term energy and power transformation in China. Manag. Chin. Power Enterp. 2018, 13, 58–63. [Google Scholar]
- Ministry of Industry and Information Technology of the People’s Republic of China. Recommended Catalogue of National Industrial Energy-Saving Technologies and Equipment (2021); Ministry of Industry and Information Technology of the People’s Republic of China: Beijing, China, 2021. Available online: https://www.miit.gov.cn/zwgk/zcwj/wjfb/gg/art/2021/art_722250e2d62b49c5963d325477234d98.html (accessed on 1 June 2026).
- Ministry of Industry and Information Technology of the People’s Republic of China. Recommended Catalogue of Energy-Saving Technologies and Equipment in National Industry and Information Technology Sector (2022 Edition); Ministry of Industry and Information Technology of the People’s Republic of China: Beijing, China, 2022. Available online: https://www.miit.gov.cn/jgsj/jns/wjfb/art/2022/art_d293af44ea69438a9b4f989d01d4288b.html (accessed on 1 June 2026).
- DNV Energy Transition Outlook China 2024. 2024. Available online: https://www.dnv.com/energy-transition (accessed on 1 June 2026).
- Li, Y.; Wang, H.; Wang, Y.; Wang, M.; Yan, C.; Guo, Y.; Sun, J. Comprehensive utilization of coal electricity solid waste and its carbon emission on reduction effect. Coal Process. Compr. Util. 2025, 2, 100–107. [Google Scholar] [CrossRef]
- Sun, X.; Cheng, X.; Wang, S.; Wang, J.; Zhao, Y.; Zhang, B. Dynamic cost analysis of hydrogen production from wind power and photovoltaic power. Clean. Coal Technol. 2023, 29, 1–10. [Google Scholar] [CrossRef]
- Xu, J.; Ding, X.; Gong, Y.; He, G.; Hu, T. Economic analysis of hydrogen production plant with water electrolysis. Energy Storage Sci. Technol. 2022, 11, 2374–2385. [Google Scholar] [CrossRef]
- Jiang, S. Cost prediction: Green hydrogen vs grey/blue hydrogen. Green Pet. Petrochem. 2022, 7, 6–11. [Google Scholar] [CrossRef]
- Teng, X.; Zhang, G.; Hu, C.; Zhu, C.; Dan, Y.; Di, L.; Sha, L. Analysis on hydrogen energy economy and low cost of hydrogen source in typical cities of China. Chem. Ind. Eng. Prog. 2022, 41, 6295–6301. [Google Scholar] [CrossRef]
- Wang, Y.Z.; Ou, X.M.; Zhou, S. Future cost trend of hydrogen production in China based on learning curve. Clim. Change Res. 2022, 18, 283–293. [Google Scholar]
- Wang, H.X.; Xu, W.Y.; Zhang, Z.X. Development status and suggestions of green hydrogen energy produced by water electrolysis from renewable energy. Chem. Ind. Eng. Prog. 2022, 41, 118–131. [Google Scholar] [CrossRef]
- Zhang, Y.; Liu, M.; Huang, F.; Liang, X.; Xia, C.; Wang, L. Valuation and future perspectives of carbon capture, utilization, and storage in global context of carbon border tax. Clean. Coal Technol. 2025, 31, 176–187. [Google Scholar] [CrossRef]
- Zhang, X.; Li, Y.; Ma, Q.; Liu, L. Development of carbon capture, utilization and storage technology in china. Strateg. Study CAE 2021, 23, 70–80. [Google Scholar] [CrossRef] [Scilit]
- Yang, Q.; Xu, X.; Zhang, J.; Liu, C.; Zhang, D.; Zhou, H.; Mei, S.; Gao, M.; Liu, H. Thermodynamic and techno-economic analyses of a novel integrated process of coal gasification and methane tri-reforming to ethylene glycol with low carbon emission and high efficiency. Energy 2021, 229, 120713. [Google Scholar] [CrossRef] [Scilit]
- Sollai, S.; Porcu, A.; Tola, V.; Ferrara, F.; Pettinau, A. Renewable methanol production from green hydrogen and captured CO2: A techno-economic assessment. J. CO2 Util. 2023, 68, 102345. [Google Scholar] [CrossRef] [Scilit]

Disclaimer/Publisher’s Note: The statements, opinions and data contained in all publications are solely those of the individual author(s) and contributor(s) and not of MDPI and/or the editor(s). MDPI and/or the editor(s) disclaim responsibility for any injury to people or property resulting from any ideas, methods, instructions or products referred to in the content. |
© 2026 by the authors. Licensee MDPI, Basel, Switzerland. This article is an open access article distributed under the terms and conditions of the Creative Commons Attribution (CC BY) license.