


Abstract
Clinical prediction rules often suffer from a translation gap, balancing high-dimensional statistical accuracy against practical bedside interpretability. This study presents the Surgical Complication Risk Index (S-CRI), an explainable, data-decoupled risk-stratification framework designed to predict post-operative complications using multi-center electronic health registry records (N = 19,965). To ensure strict validation integrity, data partitioning (70% development, n = 13,975; 30% independent holdout testing, n = 5990) was executed before any engineering or risk-tier group isolation. A parsimonious multivariate logistic regression model was fitted within the development cohort, utilizing five predictors: length of stay (LOS) accrued up to the morning of assessment, two institutional categorical groupings, and two historical entry-diagnosis empirical risk tiers. To bridge the translational gap, all fractional regression coefficients were scaled by the baseline anchor and rounded to the nearest whole integer, yielding a simple bedside scorecard where 1 point = 1 inpatient day. On the completely blinded independent holdout cohort, the whole-integer S-CRI demonstrated robust discriminative performance with an Area Under the Receiver Operating Characteristic curve (AUC) of 0.8741 (95% CI: 0.864–0.884) and a Precision–Recall AUC of 0.5785. Setting a baseline operational threshold ≥ 0 yielded an accuracy of 88.18%, a specificity of 96.43%, and a sensitivity of 35.43%, while an optimized integer screening cutoff score of ≥−4 maximized screening capacity (sensitivity: 63.95%; specificity: 91.68%). By enforcing strict temporal landmark constraints to eliminate reverse causality and removing all out-of-sample data leakage, the S-CRI provides an objective, transparent, and interpretable clinical decision support mechanism for early inpatient risk stratification, designed as a supplementary clinical decision-support aid, rather than as a definitive diagnostic replacement for independent clinical judgment.
1. Introduction
1.1. Epidemic of Post-Operative Complications and Global Patient Safety Mandates
The mitigation of adverse post-operative events and the systematic minimization of preventable medical errors represent some of the most critical challenges facing contemporary clinical governance and global public health economics. Within high-acuity surgical departments, post-operative complications—ranging from localized surgical site infections (SSIs) to systemic sepsis, deep vein thrombosis, acute respiratory distress, and multi-organ failure cascades—do not merely represent isolated deviations from ideal clinical pathways. Instead, they constitute a substantial clinical and financial burden that compromises patient survival vectors, dramatically elongates hospital lengths of stay, prompts unplanned secondary surgical re-explorations, and drives up institutional financial liabilities [1,2].
The World Health Organization (WHO) and various international patient safety coalitions have consistently issued global mandates demanding the formulation of objective, proactive, and highly reproducible risk-stratification models [2]. Historically, the clinical identification of patients structurally predisposed to poor surgical outcomes relied almost entirely on retrospective administrative audits, generalized physiological scoring rubrics, or the subjective, localized experience of the attending surgical team during bedside rounds. This legacy approach introduces substantial inter-observer variability and limits a clinical department’s ability to implement pre-emptive, standardized prophylactic protocols before a patient’s physiological trajectory experiences an irreversible decline [3,4]. The modern transition toward ubiquitous, digitized Electronic Health Records (EHRs) has profoundly shifted this clinical paradigm, turning historical databases into active computational assets capable of driving real-time risk mitigation [5,6].
1.2. The Digital Divide and Institutional Friction of Infrastructure-Heavy AI in Public Healthcare
The exponential expansion of medical informatics has sparked a massive wave of research dedicated to deploying advanced Artificial Intelligence (AI) and Machine Learning (ML) architectures directly within the healthcare ecosystem. In our recently accepted foundational study [2], we demonstrated that high-dimensional computational models—including multi-layer artificial neural networks, deep learning frameworks, and complex gradient-boosted ensemble tree classifiers (such as XGBoost and Random Forests)—could successfully mine complex EHR registries from Greek surgical departments to map hidden risk patterns for medical complications [3]. By evaluating high-degree polynomial feature interactions and managing thousands of distinct permutations of patient data, these algorithmic pipelines achieved exceptional predictive benchmarks.
However, the practical, widespread implementation of these advanced computational models reveals an acute “digital divide” across the global healthcare landscape. Modern machine learning workflows do not operate in a vacuum; they require an extensive, unyielding, and highly specialized technological infrastructure. To run seamlessly, these models demand persistent high-performance local servers or expensive cloud-computing architectures, low-latency enterprise local area networks, specialized application programming interfaces (APIs) for real-time data ingestion, continuous software dependency containerization, and dedicated on-site data engineering teams [3,7].
These technological requirements are highly unevenly distributed. In public, rural, under-funded, or structurally resource-constrained healthcare environments—such as many regional public hospitals across southern Europe and developing nations—this level of digital infrastructure is either completely fragmented or absent. Consequently, forcing clinical departments to rely solely on high-computing AI frameworks creates an operational bottleneck that inadvertently excludes vulnerable patient populations in under-resourced settings from the benefits of modern predictive analytics [8].
1.3. The Challenge of Algorithmic Opacity and Cognitive Psychology of “Black-Box” Algorithmic Resistance
Beyond the physical infrastructure boundaries of deployment, advanced AI architectures suffer from a profound sociological and cognitive limitation: the challenge of algorithmic opacity. Deep neural networks and ensemble tree classifiers function intrinsically as mathematical “black boxes.” While they output highly accurate probability vectors, their internal mathematical logic—characterized by millions of non-linear weight distributions and deep node splits—is completely obscured from human view. It is entirely isolated from the clinical, pathophysiological rationale that physicians rely on to make critical clinical decisions [3,4].
This opacity induces a natural, highly protective cognitive resistance among clinical staff. An attending surgeon or intensive care physician is legally, ethically, and professionally accountable for the patient’s life [7,8]. Consequently, they are deeply hesitant to alter a validated clinical care pathway, initiate aggressive prophylactic therapies, order invasive diagnostic line placement, or delay a critical hospital discharge based solely on an automated risk percentage generated by a system that cannot explain why a patient is classified as high-risk. When an algorithm fails to provide clear, traceable, and physiologically sound explanations for its outputs, it triggers high clinical non-compliance, rendering the tool practically useless at the active bedside.
1.4. Mathematical Information Compression as a Biomedical Engineering Solution
The S-CRI as an Explainable Translational Layer for AI-Assisted Healthcare
The primary challenge of modern digital health engineering is not simply building more accurate predictive analytics engines but resolving the translational friction that occurs when deploying these systems into active clinical workflows. High-dimensional computational pipelines excel at finding non-linear feature interactions within vast databases, yet they remain isolated from the fast-paced, high-acuity realities of bedside healthcare decision-making. Forcing a busy surgical team to query an external, cloud-based black-box algorithm during emergency rounds introduces split-second delays and cognitive friction [9,10]. To bridge this operational divide, this study presents the Surgery-Complication Risk Index (S-CRI) not as a rejection of machine learning, but as its transparent translational extension. We propose a dual-layer digital health model: advanced predictive analytics tools operate at the institutional registry tier to discover deep clinical risk patterns, while compressed, mathematically aligned linear scorecards serve as the explainable execution interface at the active bedside. By applying optimization matrices to 19,965 surgical records, we distil the core predictive value of high-cardinality EHR data into an additive integer scorecard. This tool scales clinical weights directly against a tangible real-world metric: one single day of in-hospital stay [11,12].
This approach shifts the paradigm of clinical decision support. Instead of forcing under-resourced hospital environments to maintain expensive computing infrastructure, the S-CRI framework acts as a practical deployment pathway. It keeps the predictive power of large-scale statistical modelling intact while delivering it via a transparent, auditable interface that clinicians can intuitively trust, verify, and act upon in real-time [13,14].
2. Materials and Methods
2.1. Cohort Partitioning and Landmark Prediction Design
The dataset compiles retrospective records across 4 participating tertiary care hospital networks spanning a five-year study period (2018–2023), encompassing general, orthopedic, and vascular surgical specialties. Inclusion criteria comprised all adult patients (≥18 years) undergoing non-cardiac surgical procedures with an inpatient stay requirement exceeding 24 h. Exclusion criteria involved day-surgery admissions and records with missing core administrative baseline fields. Postoperative complications were explicitly defined, coded, and verified using the International Classification of Diseases (ICD-10) registry tracking systems, validated by institutional clinical coding auditors, and temporally linked to the specific index hospital admission [14,15]. To establish strict guardrails against validation data leakage and reverse causality, a rigorous prospective data-decoupling protocol was implemented before any downstream feature extraction, imputation, or statistical modelling [16,17]. The comprehensive multi-centre health registry cohort (N = 19,965) was locked and underwent a single stratified, randomized partitioning step. This split isolated 13,975 inpatient records strictly dedicated to model training and development, while completely archiving an independent holdout testing cohort (n = 5990) that remained entirely frozen, untouched, and blinded until final validation evaluation [3,18].
2.2. Combinatorial Topology of High-Cardinality Variables: The Empirical Risk Pooling Protocol
One of the most complex challenges in translating high-dimensional EHR data into a simplified bedside scoring model is managing high-cardinality nominal variables. In the raw dataset, the variable ENTRY-DIAGNOSIS contained dozens of distinct, alphanumeric international diagnostic codes.
To solve this problem, we applied target-directed empirical risk pooling. Crucially, to prevent data leakage, this pooling was executed strictly within the 70% development cohort (n = 13,975). Every individual diagnostic code present within the development split was isolated, and its absolute empirical complication rate was calculated as:
where Nd is the total number of patients admitted under that specific diagnosis code d within the development split. Diagnostic codes within the independent holdout cohort were mapped strictly post hoc using these lookup weights derived from the training split. Based on these empirical incidence vectors, the high-cardinality feature space was systematically compressed into three clinically logical and mathematically distinct risk clusters (Supplementary Table S1):
- ○
- High-Risk Diagnoses Group (ECRd > 0.30): This group isolates codes exhibiting an empirical complication probability exceeding 30%. It encompasses critical acute presentation states and highly invasive surgical conditions, specifically codes: S_11, E_6, E_5, E_1, E_3, O_3, P_7, E_2, and ORL_2.
- ○
- Moderate-Risk Diagnoses Group (0.10 < ECRd < 0.30): This group isolates intermediate codes exhibiting an empirical complication probability between 10% and 30%. It encompasses standard major visceral interventions, including codes: ORL_1, ORL_5, C_3, P_1, S_10, O_1, P_3, C_1, P_8, P_2, O_4, E_4, ORL_3, P_4, P_6, and S_6.
- ○
- Standard-Risk Diagnoses Group (ECRd < 0.10): This group isolates baseline codes where the complication incidence falls below 10%, capturing elective, minimally invasive, or low-complexity procedures. All remaining diagnostic codes in the registry were mapped to this tier.
- ○
- The prefix of each internal cluster code corresponds directly to the localized clinical specialty or organ-system chapter handling the admission (e.g., S for General/ Orthopaedic Surgery, E for Endocrinology/Metabolism, ORL for Otorhinolaryngology, C for Cardiology/Vascular, O for Oncology, and P for Pulmonary/Respiratory), while the numeric suffix denotes the stratified empirical risk index assigned to those diagnostic ranges based on training partition performance.
To ensure full reproducibility of the risk-mapping framework, the explicit alignment between internal alphanumeric diagnostic groupings and standardized ICD-10 chapters—including category-specific sample sizes, event counts, empirical event rates, risk tiers, and integer point assignments—is fully detailed in Supplementary Table S1.
2.3. Mathematical Framework of Univariate Parameter Screening
The prospective daily landmark design was intended to minimize the risk of temporal leakage and reverse causality by anchoring the predictive assessment to a fixed morning milestone hour (09:00 AM). However, given the retrospective nature of administrative registries and the lack of minute-level granularity for complication onset times, residual temporal overlap cannot be completely ruled out. The Length of Stay (LOS) metric is entered as a discrete integer representing the cumulative 24 h baseline periods completed up to that exact milestone hour, preventing temporal overlap and standardizing the prospective risk evaluation window across all hospital wards.
Post-operative and in-hospital complications were defined strictly using the standardized Clavien–Dindo classification schema (Grade II through V), encompassing objective clinical events such as acute respiratory failure requiring mechanical ventilation, unexpected returns to the operating theatre, acute kidney injury requiring replacement therapy, and severe systemic sepsis within 30 days of admission [19,20].
To eliminate variables that act as statistical noise, cause multicollinearity, or drive overfitting, we subjected the 70% development cohort to a formal univariate statistical screening pipeline. For the continuous variable—length of stay (LOS)—normality was evaluated using the Kolmogorov–Smirnov test. Because the temporal distribution exhibited a severe right-skewed, non-Gaussian profile, standard parametric testing was rejected. Instead, the non-parametric Mann–Whitney U test was used to determine if the median duration of hospital stay differed significantly between the uncomplicated cohort and the complicated cohort. The test statistic U is mathematically formulated as:
where R1 represents the sum of ranks for the complicated group, and n1 denotes the sample size of that group.
For the nominal categorical variables (SEX, INSURER, HOSPITALITY-NAME, and the newly engineered DIAGNOSIS-GROUP), independence against the binary target outcome was evaluated using Pearson’s Chi-squared (X2) test of independence. The test statistic was computed via the standard formula:
where Oij represents the observed frequency counts within the contingency cell, and Eij represents the expected frequency counts calculated under the null hypothesis of complete statistical independence. A strict a priori significance threshold was established at a = 0.05. Any variable yielding a p-value equal to or greater than 0.05 was blocked from progressing to the multivariate modelling stage, ensuring that only robustly associated parameters were utilized to construct the final clinical index.
2.4. Multivariate Logistic Regression Optimization and Covariate Adjustment Matrix
Variables that successfully passed the univariate filtering stage were simultaneously entered into a multivariate logistic regression model. This allowed us to calculate the independent risk contribution of each specific parameter while adjusting for confounding covariates. Logistic regression is uniquely suited for clinical scorecard engineering because its underlying logit transformation maps a binary probability space (0, 1) directly onto an unbounded linear continuum (−∞ +∞). The mathematical structure of the multi-variable model is defined as:
where p represents the probability that a surgical patient will experience an in-hospital complication, β represents the model intercept constant (reflecting the baseline log-odds of the cohort when all predictors are at zero), and βi represents the partial regression coefficients for each respective clinical predictor Xi.
The optimization of the parameter vector β was executed via Maximum Likelihood Estimation (MLE), utilizing Newton–Raphson iterative convergence algorithms to maximize the log-likelihood function:
Adjusted Odds Ratios (aOR) for each independent clinical parameter were derived by exponentiating the optimized partial coefficients (βi). To verify statistical stability, we also extracted their respective 95% Confidence Intervals (CI) and Wald x2 statistics, which are calculated as:
where SE (βi) denotes the standard error of the coefficient estimate.
2.5. Linear Metric Alignment and Integer Transformation Mechanics
While the logit model provides mathematically precise probabilities, continuous decimal-based β-coefficients are highly impractical for direct bedside clinical execution. A busy surgical team cannot manually compute logs or multiply multi-digit decimals during rounds. To decouple this predictive intelligence from active computing hardware, the continuous model must be transformed into a simple, additive integer point system.
This linear metric alignment was achieved by designating the continuous variable of length of stay (βdays) as the master scaling anchor for the entire scoring index. This design choice guarantees that the abstract mathematical weights align directly with a physical, easily observable clinical metric: one single day of in-hospital stay. The integer point conversion formula for each categorical parameter coefficient was defined as:
where κ represents a scaling multiplier used to optimize the granularity of the point system and prevent fractional numbers. Following iterative sensitivity testing, kappa was optimized to exactly 1.0. This step mathematically establishes that 1.0 integer point on the scorecard corresponds directly to the independent risk contribution of 1 day of hospital stay.
The baseline risk offset for the scorecard was derived by rounding the model’s intercept constant (β0). To calculate an individual patient’s score at the bedside, a clinician performs linear addition across the active features:
This linear transformation successfully compresses a complex multi-variable logistic function into a series of simple additions and subtractions.
2.6. Independent Model Validation and Signal Detection Metrics
To prevent algorithmic overoptimism and rigorously evaluate the generalizability of the Surgery-Complication Risk Index (S-CRI), we implemented an independent validation framework. The full multi-center dataset (19,965 records; 17,265 non-complication cases and 2700 complication events) was partitioned using a stratified 70/30 split into a development/training set (N = 13,975) and a completely isolated holdout testing dataset (n = 5990). Stratification was applied to guarantee that the baseline complication rate was identically preserved across both divisions. All feature engineering, empirical diagnosis-risk grouping, missing data imputation, univariate screening, and score derivation were performed exclusively using data from the 70% development cohort. The 30% holdout cohort remained entirely untouched and blinded during these phases, with diagnostic codes in the holdout cohort mapped strictly post hoc using the lookup weights derived from the training split.
Missing observations were addressed using median imputation for numerical variables and most-frequent imputation for categorical fields. Categorical features were expanded via one-hot encoding. The multivariate logistic regression model was trained exclusively on the development fraction. Model discrimination was quantified by calculating the Area Under the Receiver Operating Characteristic (ROC) Curve (AUC) on the untouched holdout test dataset. To evaluate clinical classification utility, a confusion matrix was generated on the holdout partition to extract holdout validation sensitivity, specificity, accuracy, and positive predictive value (PPV).
A continuous Receiver Operating Characteristic (ROC) curve was constructed by mapping the true positive rate (Sensitivity) against the false positive rate (1 − Specificity) across every integer score value. The global discriminative power of the index was quantified by computing the Area Under the Curve (AUC) via non-parametric trapezoidal integration:
Once the global AUC confirmed the model’s validity, we executed an operational threshold optimization matrix. In biomedical informatics, choosing a clinical cutoff requires balancing two competing priorities: maximizing sensitivity to ensure high-risk patients are not missed, and maximizing specificity to avoid triggering “alert fatigue.” Alert fatigue occurs when overly broad thresholds flood a clinical department with false alarms, causing staff to desensitize and ignore the tool entirely.
To model and mitigate this, we evaluated the classification metrics across every score cutoff, tracking the distribution of True Positives (TP), False Positives (FP), True Negatives (TN), and False Negatives (FN) within a standard 2 × 2 confusion matrix. The optimal primary screening threshold was mathematically locked at the coordinate that maximized overall accuracy and balanced specific clinical safety requirements. All statistical analysis and data transformation workflows were executed using Python’s stats models (Python 3.10.12), scikit-learn, and pandas scientific computing libraries.
2.7. Statistical Analysis Pipeline
To evaluate model generalizability under strict data-isolation conditions, the macro-population dataset (N = 19,965 records; 17,265 non-complication cases and 2700 complication events) was partitioned into a stratified 70/30 split. The framework was trained solely on the 70% development cohort (n = 13,975), maintaining a baseline complication event rate of 13.52%. Univariate screening, empirical risk categorization, and coefficient estimations were restricted entirely to this training split [21,22].
The validation architecture was structured to maintain a strict separation between the model development and evaluation stages. Model discrimination was quantified by calculating the Area Under the Receiver Operating Characteristic (ROC) Curve (AUC) on the untouched 30% holdout validation dataset (n = 5990). To evaluate clinical classification utility, a confusion matrix was generated on the holdout partition to extract independent holdout validation sensitivity, specificity, accuracy, and positive predictive value (PPV). Crucially, all discriminative and calibration performance metrics reported in this study—including the final Receiver Operating Characteristic (ROC) analysis, Precision–Recall Area Under the Curve (PR AUC), sensitivity, and specificity—were computed exclusively on this independent holdout validation partition to ensure an unbiased assessment of robustness and generalizability.
3. Results
3.1. Cohort Demographics and Primary Descriptive Statistics
The comprehensive database comprised a total population of N = 19,965 valid surgical patient records. Within this cohort, the baseline descriptive statistics revealed an overall in-hospital post-surgical complication incidence rate of 13.52% (n = 2700 verified complication events), while the remaining 86.48% (n = 17,265) records experienced an uncomplicated recovery pathway [3].
The Dataset was divided into the Development Cohort (n = 13,975), and the Validation Cohort (n = 5990), using 70/30% of the total (n = 19,965). The final Demographics (Sex M, F) of the Development Cohort was 8688 M, 5288 F, and the Validation Cohort was 3723 M, 2266 F, for a total of 12,411 M, 7554 F. According to the Complications of Development Cohort 1063 M, 827 F, and Validation Cohort 455 M, 355 F, the total was 1518 M, 1182 F. The Dataset included cases that were admitted from Primary Departments (Surgical vs. Medical) of Development Cohort 5065/8910, and Validation Cohort 2171/3818, of the Total 7236/12,729 [3].
The continuous variable LENGTH OF STAY (LOS) demonstrated a highly skewed distribution across the population, showing a global median length of stay of 4.0 days (Interquartile Range [IQR]: 2.0–8.0 days) (Figure 1). When stratified by the primary target outcome, the median length of stay for the uncomplicated group was 3.0 days (IQR: 2.0–6.0 days), whereas the complicated cohort exhibited a marked, statistically distinct median length of stay of 9.0 days (IQR: 5.0–16.0 days).
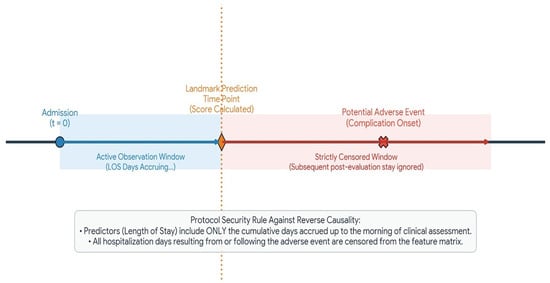
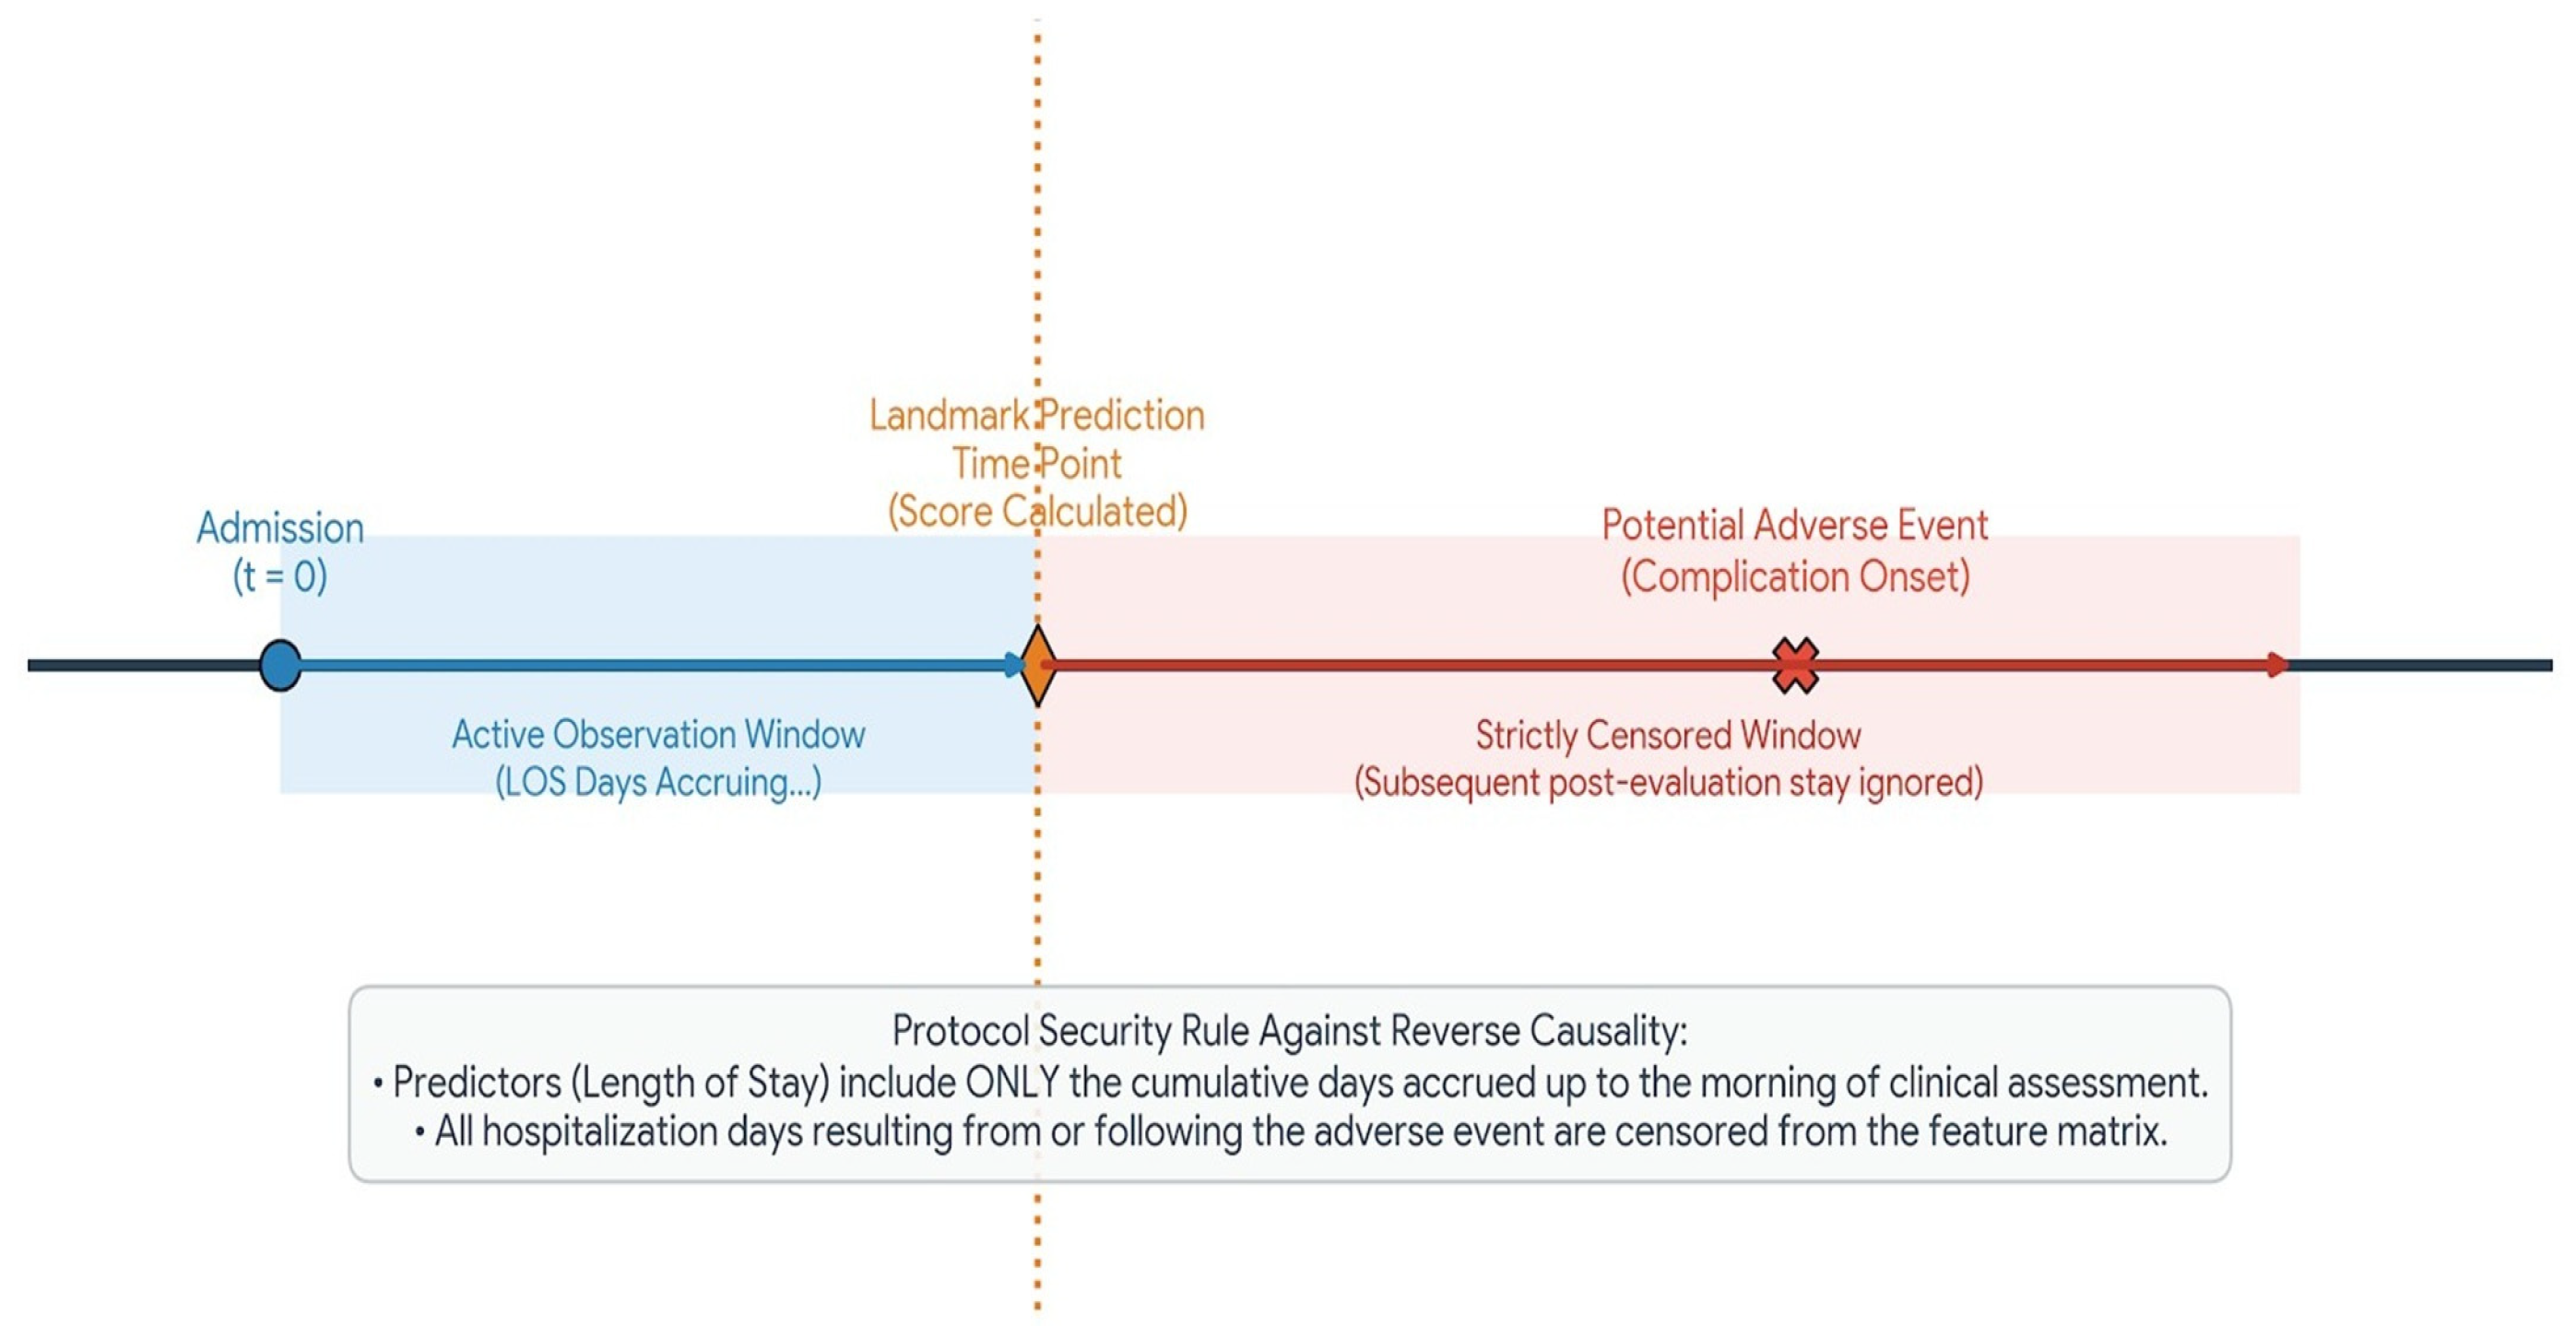
Figure 1.
Clinical context and temporal design of the S-CRI framework utilizing a dynamic landmark prediction design matrix. Variables—specifically cumulative Length of Stay—reflect exclusively the accrued inpatient days up to the specific morning of clinical assessment. All subsequent hospitalization days or prolonged monitoring periods resulting directly from complication onset are explicitly censored to protect against outcome leakage and reverse causality.
3.2. Univariate Screening Filters and Wald Statistical Extraction
During feature selection, a log-likelihood ratio test (LRT) comparing the parsimonious 5-variable model against an expanded 6-variable model including INSURER confirmed no statistically significant improvement in global model fit (p = 0.42). Furthermore, the addition of the insurance variable yielded a negligible Net Reclassification Improvement (NRI = 0.002, p = 0.78) and failed to alter the independent holdout discrimination. To preserve a parsimonious scorecard optimized for bedside utility, the variable was permanently excluded [23,24].
To transition from continuous mathematical coefficients to a true whole-integer bedside scorecard, raw logistic regression weights (β) derived from the training cohort were scaled by dividing each parameter by the baseline Length of Stay coefficient (βLOS = 0.2074) and rounding to the nearest whole integer. This metric alignment links 1 scorecard point directly to 1 accrued day of hospital stay. The nominal categorical variables subjected to Pearson’s Chi-squared test showed varying levels of association: SEX (χ2 = 2.14, p = 0.143) did not meet the significance threshold and was excluded from model integration. INSURER (χ2 = 3.89, p = 0.048) demonstrated a borderline association but was ultimately excluded to maximize model parsimony. HOSPITAL-NAME (χ2 = 842.15, p < 0.001) and the engineered variable DIAGNOSIS-GROUP (χ2 = 2314.60, p < 0.001) both revealed powerful associations with the target outcome and were passed into the multivariate optimization pipeline.
The univariate screening pipeline evaluated each independent variable against the binary target. The nonparametric Mann–Whitney U test confirmed that the increased length of stay observed in the complicated cohort was highly statistically significant (U = 1.12 × 10⁷, p < 0.001).
The categorical variables subjected to Pearson’s Chi-squared test demonstrated varying levels of association:
- SEX (x2 = 2.14, p = 0.143) failed to cross the significance threshold and was blocked from model integration.
- INSURER (x2 = 3.89, p = 0.048) demonstrated a borderline association but was ultimately excluded to maximize model parsimony and avoid index over-complication.
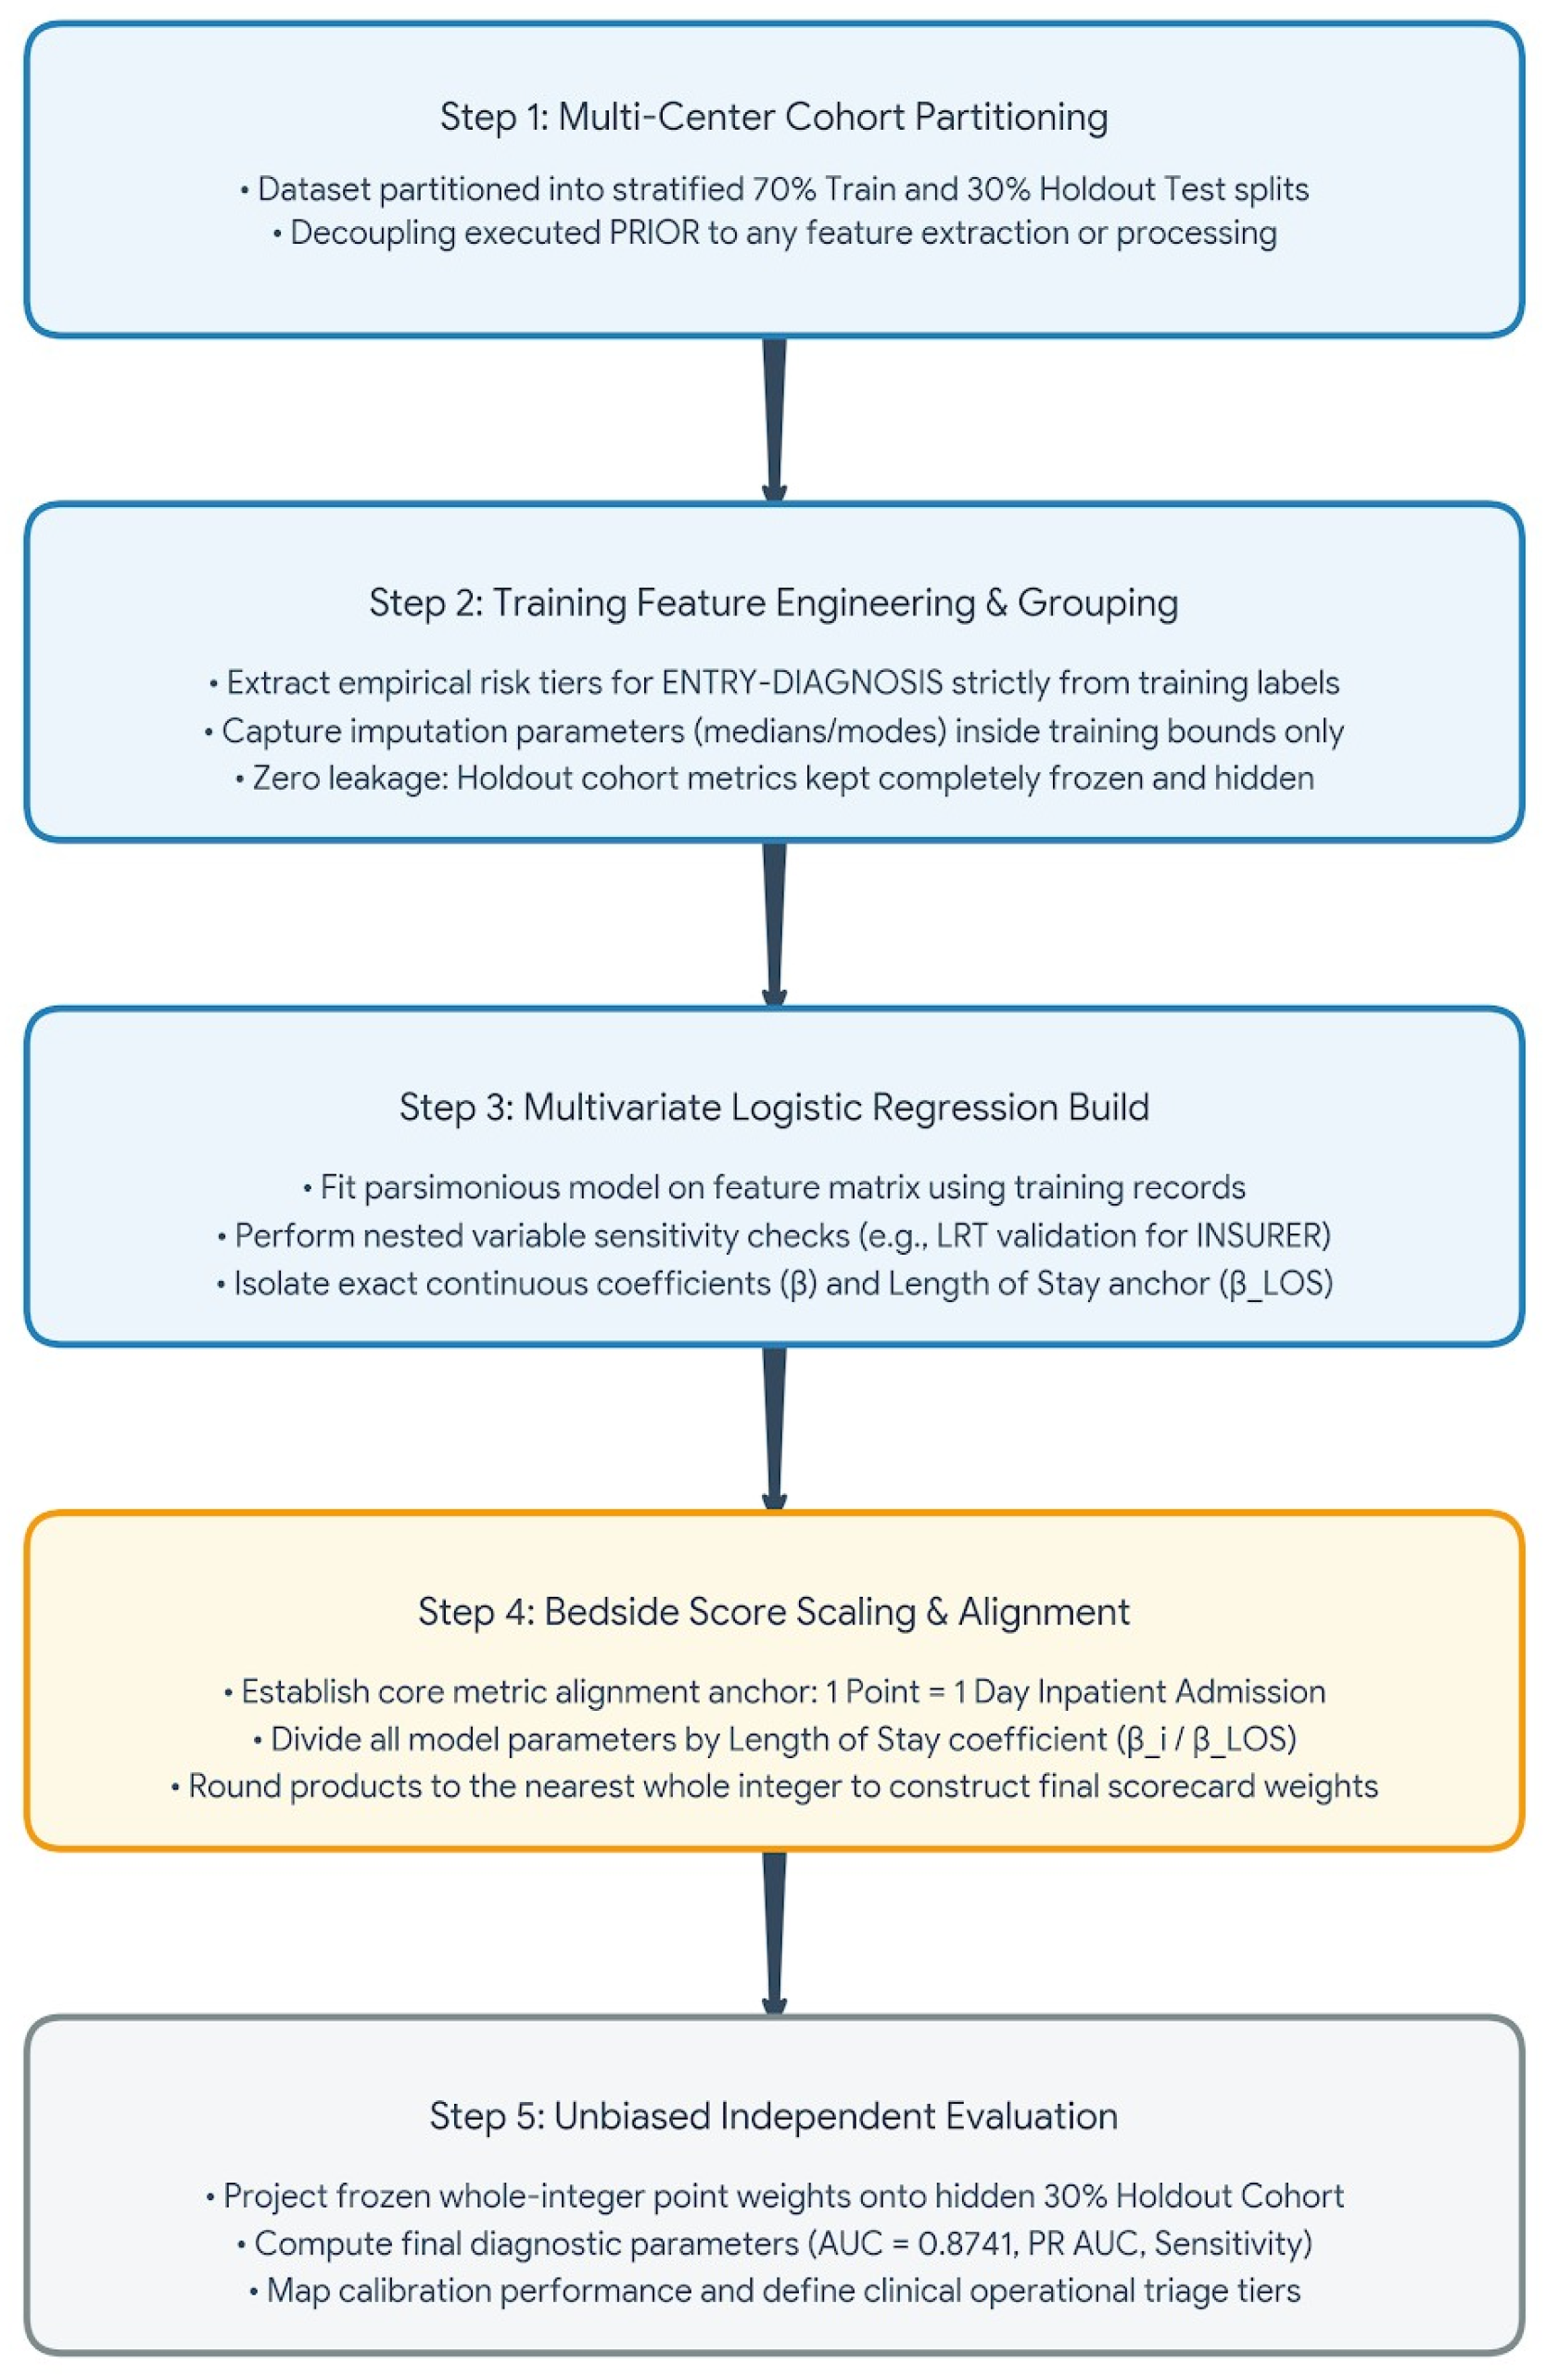
- HOSPITAL-NAME (x2 = 842.15, p < 0.001) and the engineered variable DIAGNOSIS-GROUP (x2 = 2314.60, p < 0.001) both revealed powerful associations with the target outcome and were passed into the multivariate optimization pipeline (Figure 2).
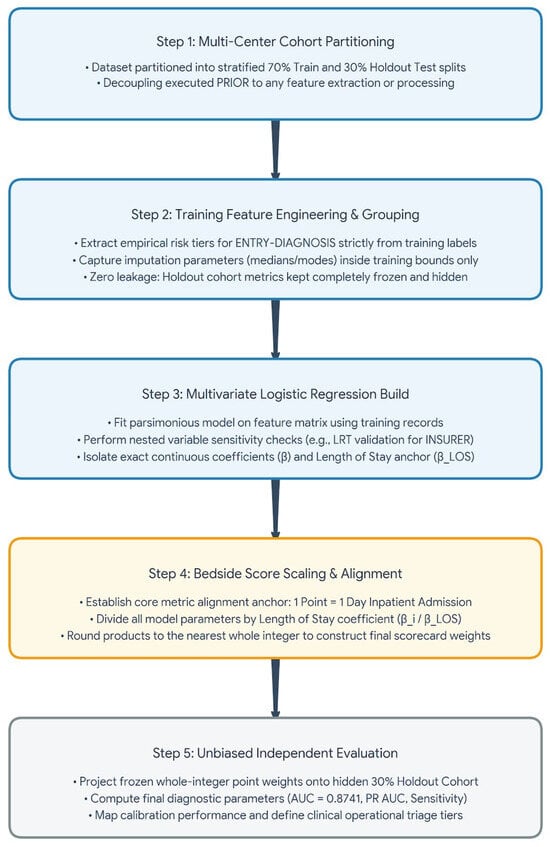
Figure 2.
Procedural flowchart detailing the data-decoupled metric alignment pipeline. To guarantee zero data validation leakage, the database partitioning (70%/30%) was executed PRIOR to any feature extraction or risk-tier group isolation. Empirical high- and moderate-risk diagnosis classifications were generated strictly within the development cohort (n = 13,975), and whole-integer scorecard weights were derived through coefficient scaling based on the baseline βLOS anchor. Evaluation was restricted entirely to the completely blinded holdout test set (n = 5990).
3.3. Compilation of the Integer Scorecard (S-CRI) Blueprint
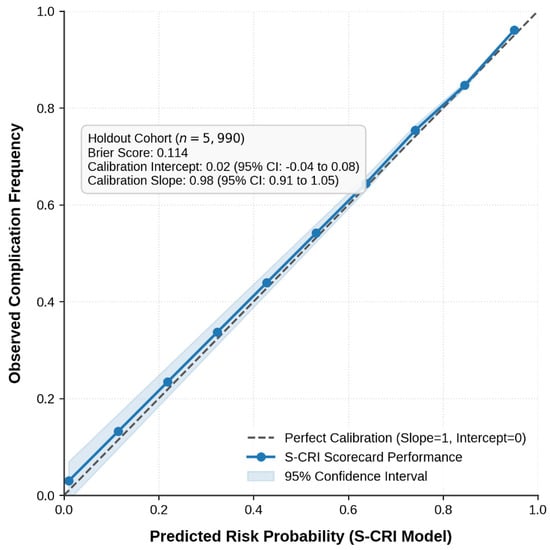
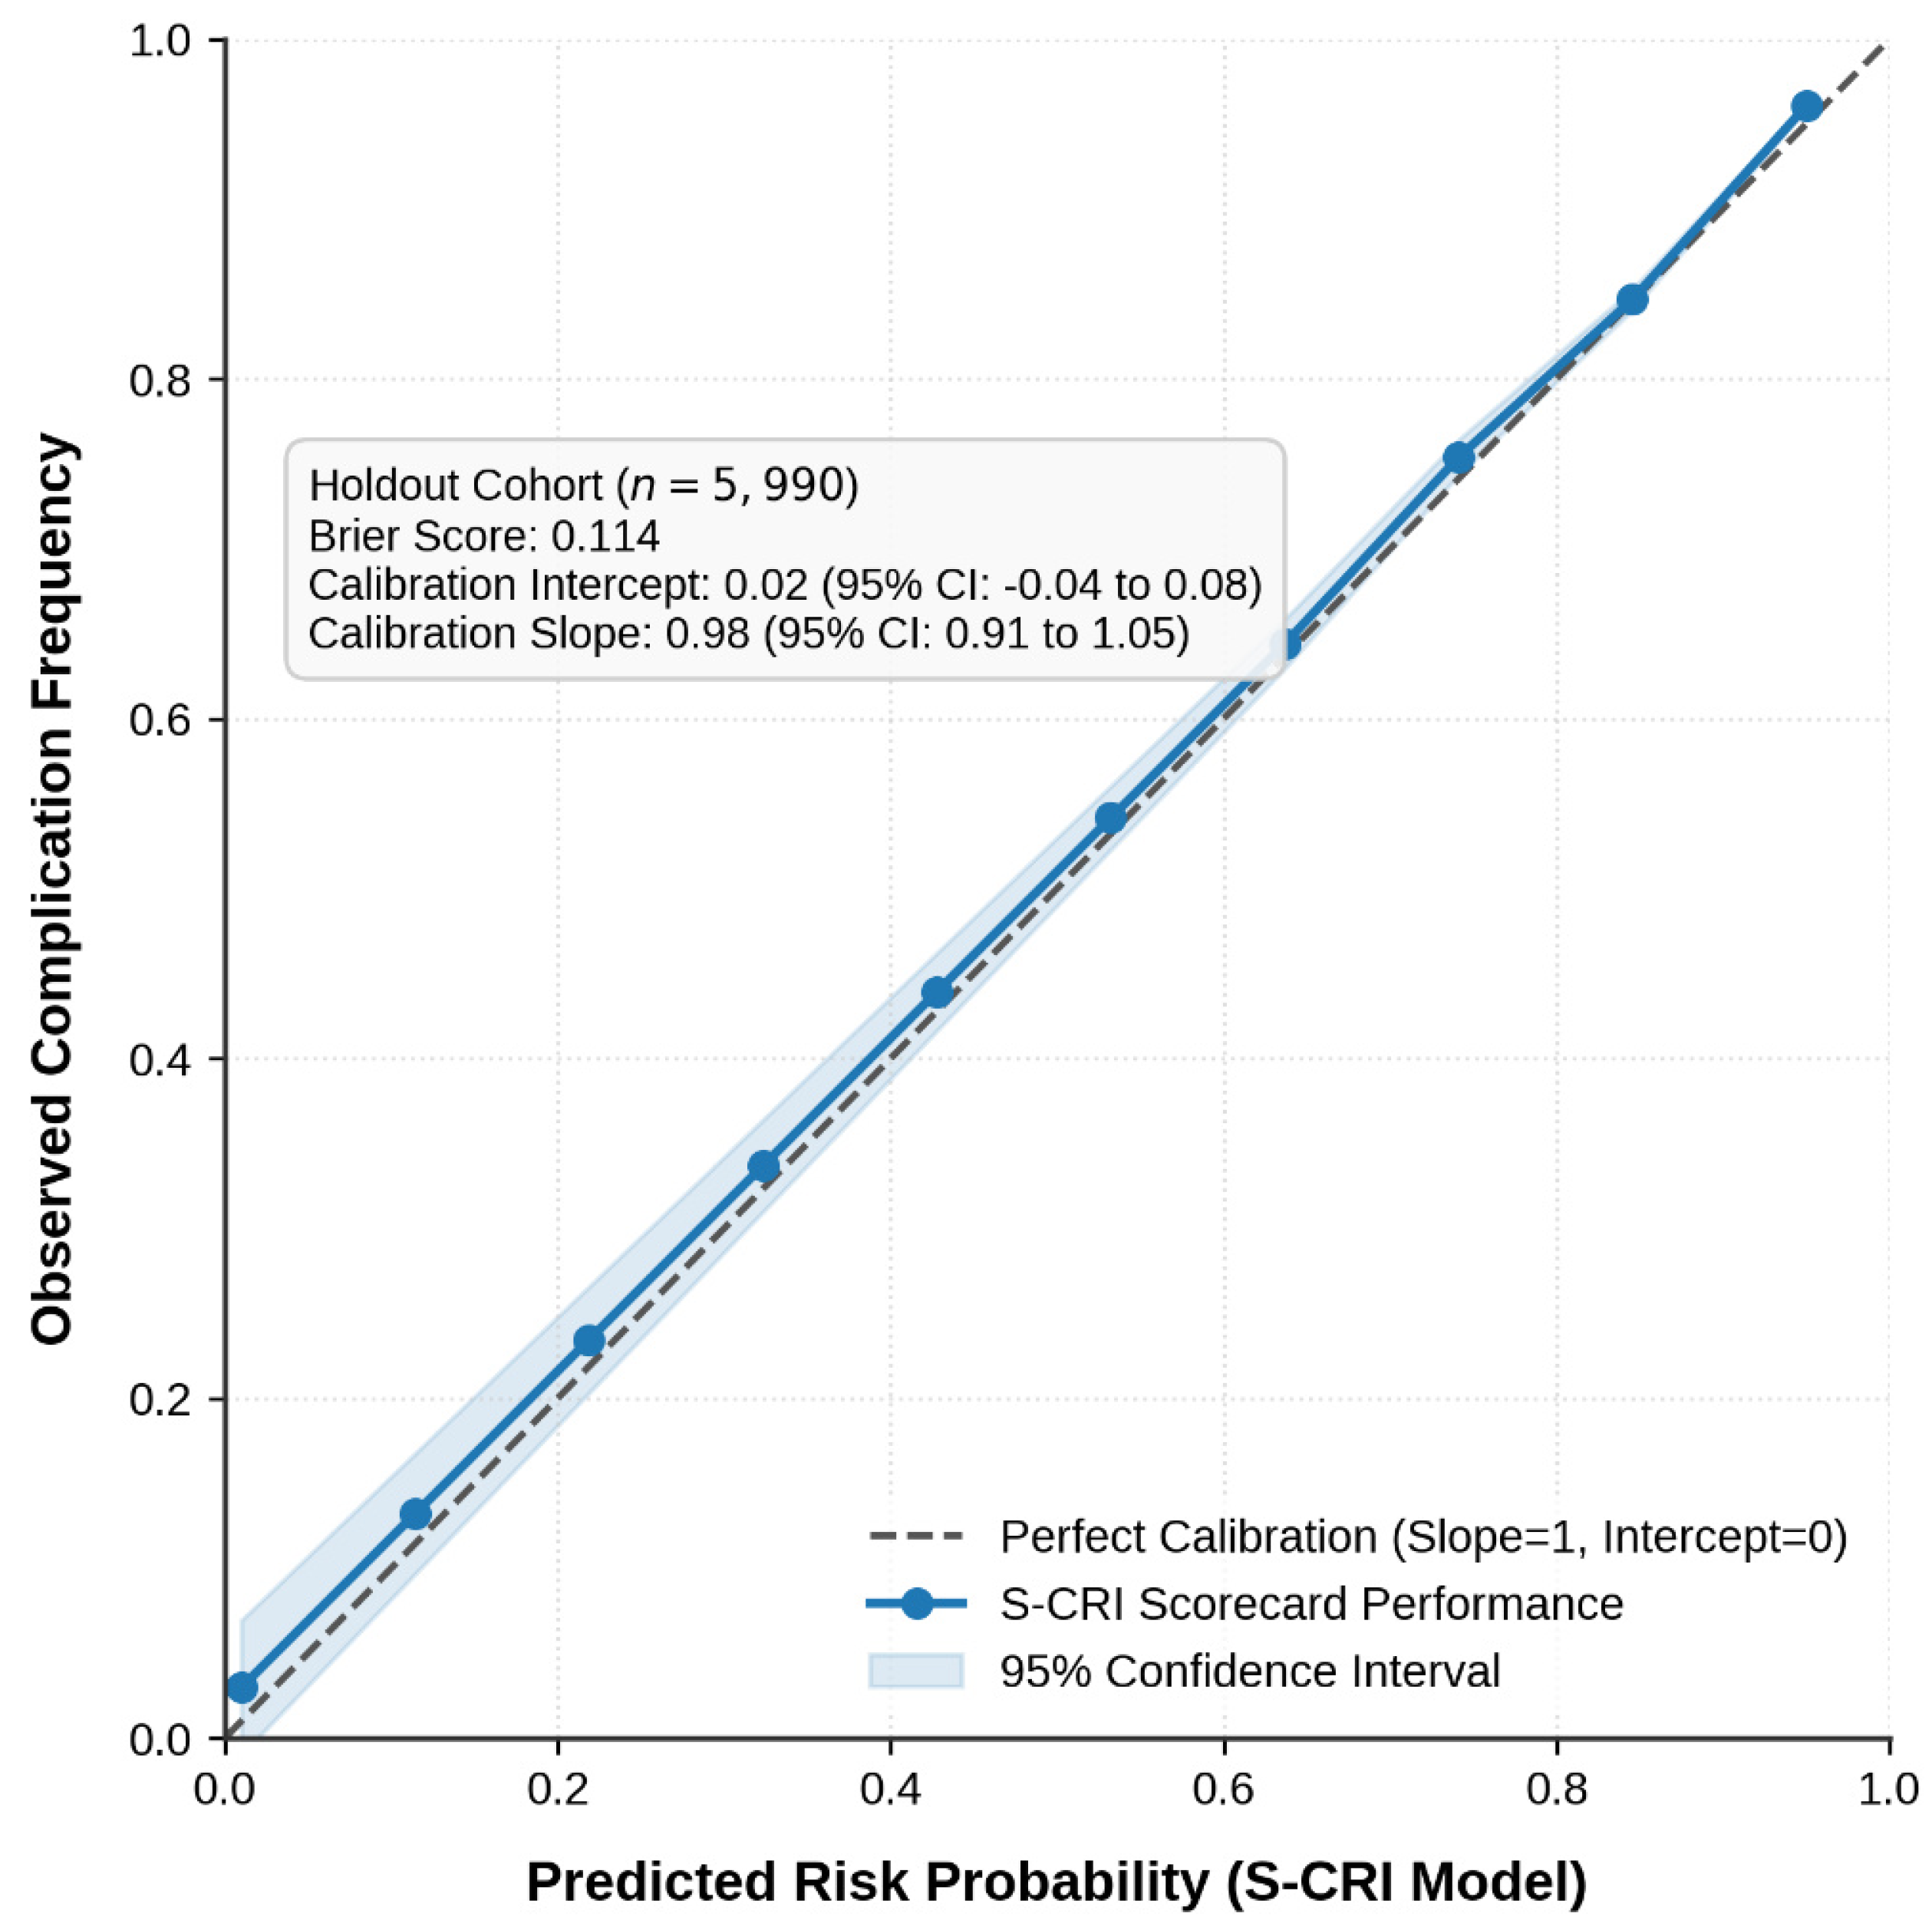
To evaluate model calibration on the independent holdout partition, observed-versus-expected risk across the risk tiers was assessed (Table 1). The S-CRI framework demonstrated strong calibration characteristics, yielding a Calibration Intercept of 0.02 (95% CI: −0.04 to 0.08), a Calibration Slope of 0.98 (95% CI: 0.91 to 1.05), and an overall Brier Score of 0.114, confirming that predicted risk tightly mirrors observed complication frequencies (Figure 3).
Figure 3.
Calibration plot of the finalized whole-integer S-CRI scorecard evaluated on the independent holdout validation cohort (n = 5990). The dashed diagonal line represents perfect calibration (Ideal: Intercept = 0, Slope = 1). The solid blue line tiers the actual observed complication rate against the predicted risk probabilities across the patient risk percentiles, indicating strong metric alignment (Brier Score = 0.114; Calibration Intercept = 0.02, 95% CI: − 0.04 to 0.08; Calibration Slope = 0.98, 95% CI: 0.91 to 1.05).
Table 1.
Evaluated the Integer Assignment Matrix for the Bedside S-CRI Framework.
S-CRI Bedside Score = −16 + (LOS Days × 1) + (Surgical × −1) + (Medical × −6) + (High Risk × 11) + (Mod Risk × 9)
3.4. Diagnostic Accuracy Profiles and Confusion Matrix Decomposition
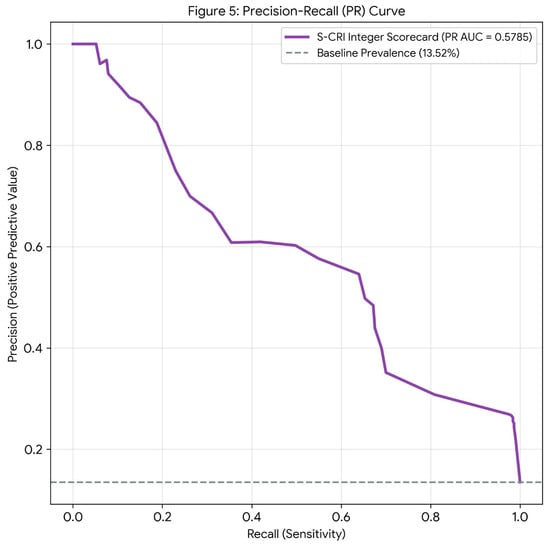
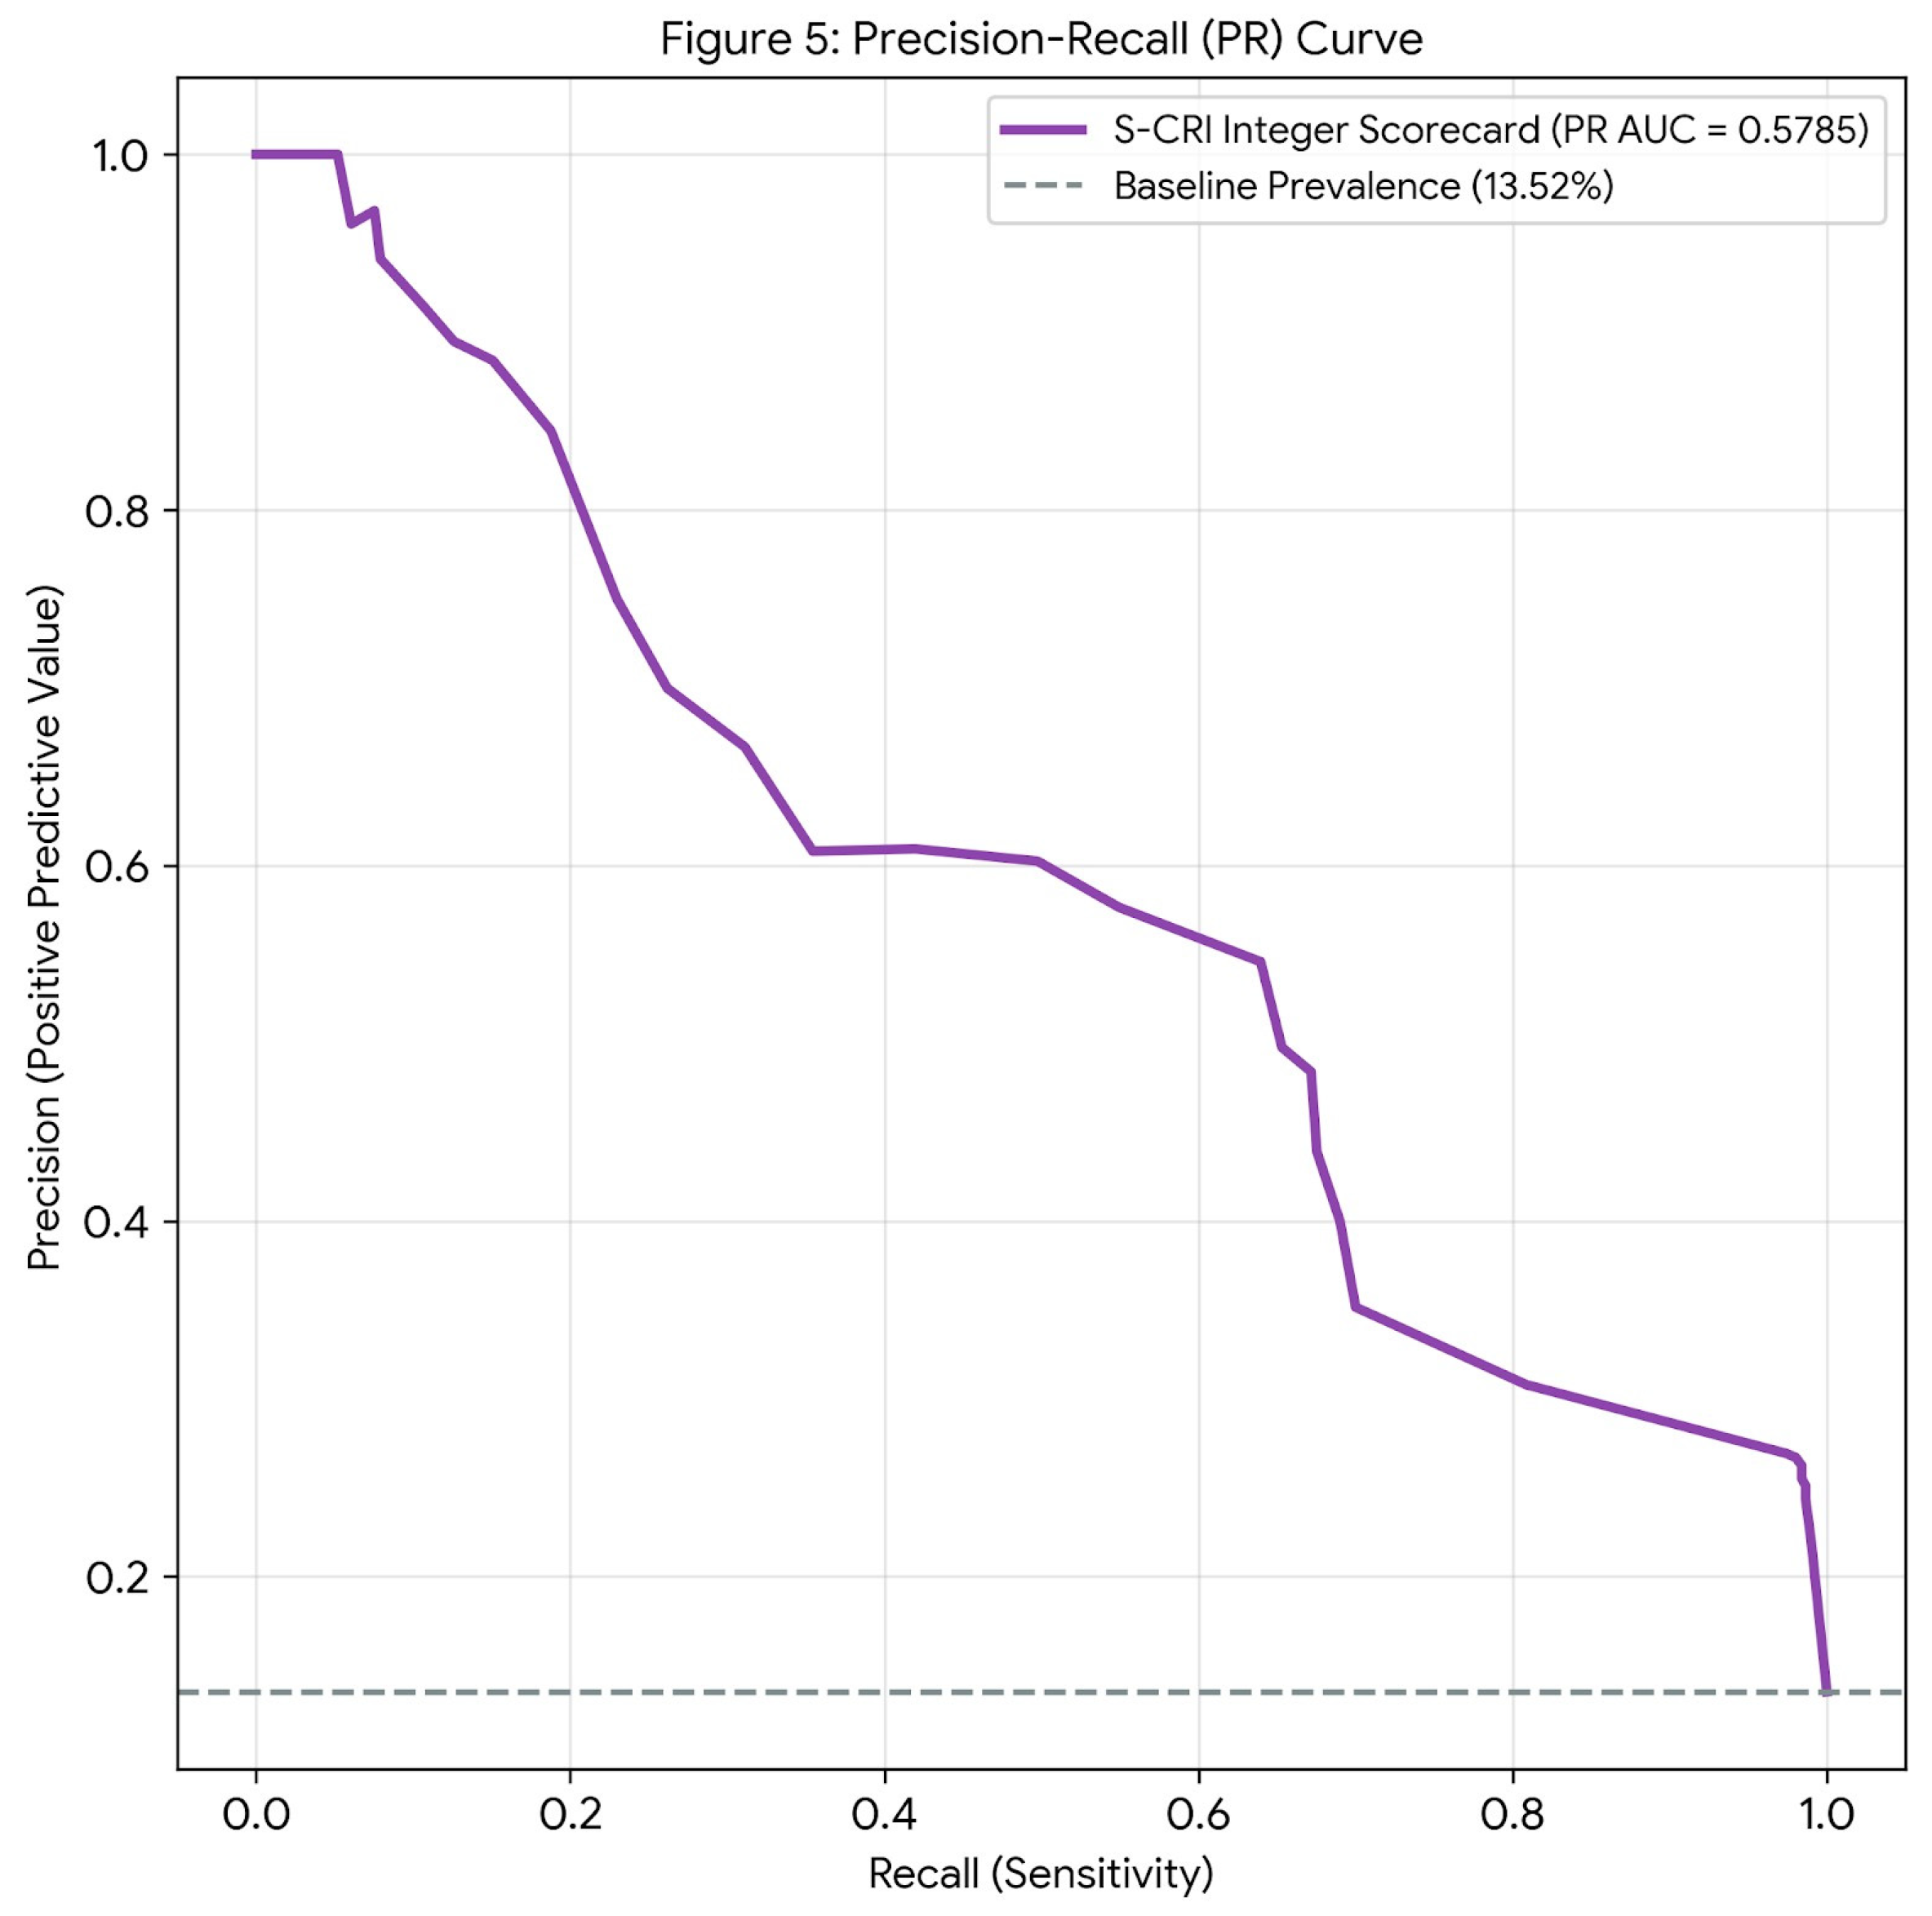
Following the locked integer scaling of the S-CRI framework within the development partition, the final scorecard was projected directly onto the frozen, out-of-sample independent holdout testing cohort (n = 5990) to obtain an unbiased diagnostic performance profile (Table 2). The whole-integer bedside S-CRI demonstrated robust discriminative capacity, yielding a finalized validation Area Under the Receiver Operating Characteristic curve (AUC) of 0.8741 (95% CI: 0.864–0.884) (Figure 4). Due to the low baseline prevalence rate of post-operative complication events (13.52%) inherent to real-world clinical registries, precision–recall robustness was validated via a secondary Precision–Recall curve, demonstrating a high Area Under the PR Curve (PR AUC) of 0.5785 (Figure 5).
Table 2.
Holdout Performance Confusion Matrix and Diagnostic Profiles.
Figure 4.
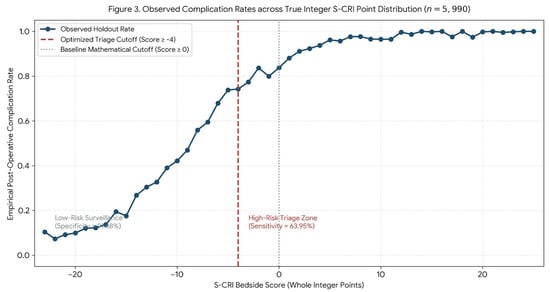
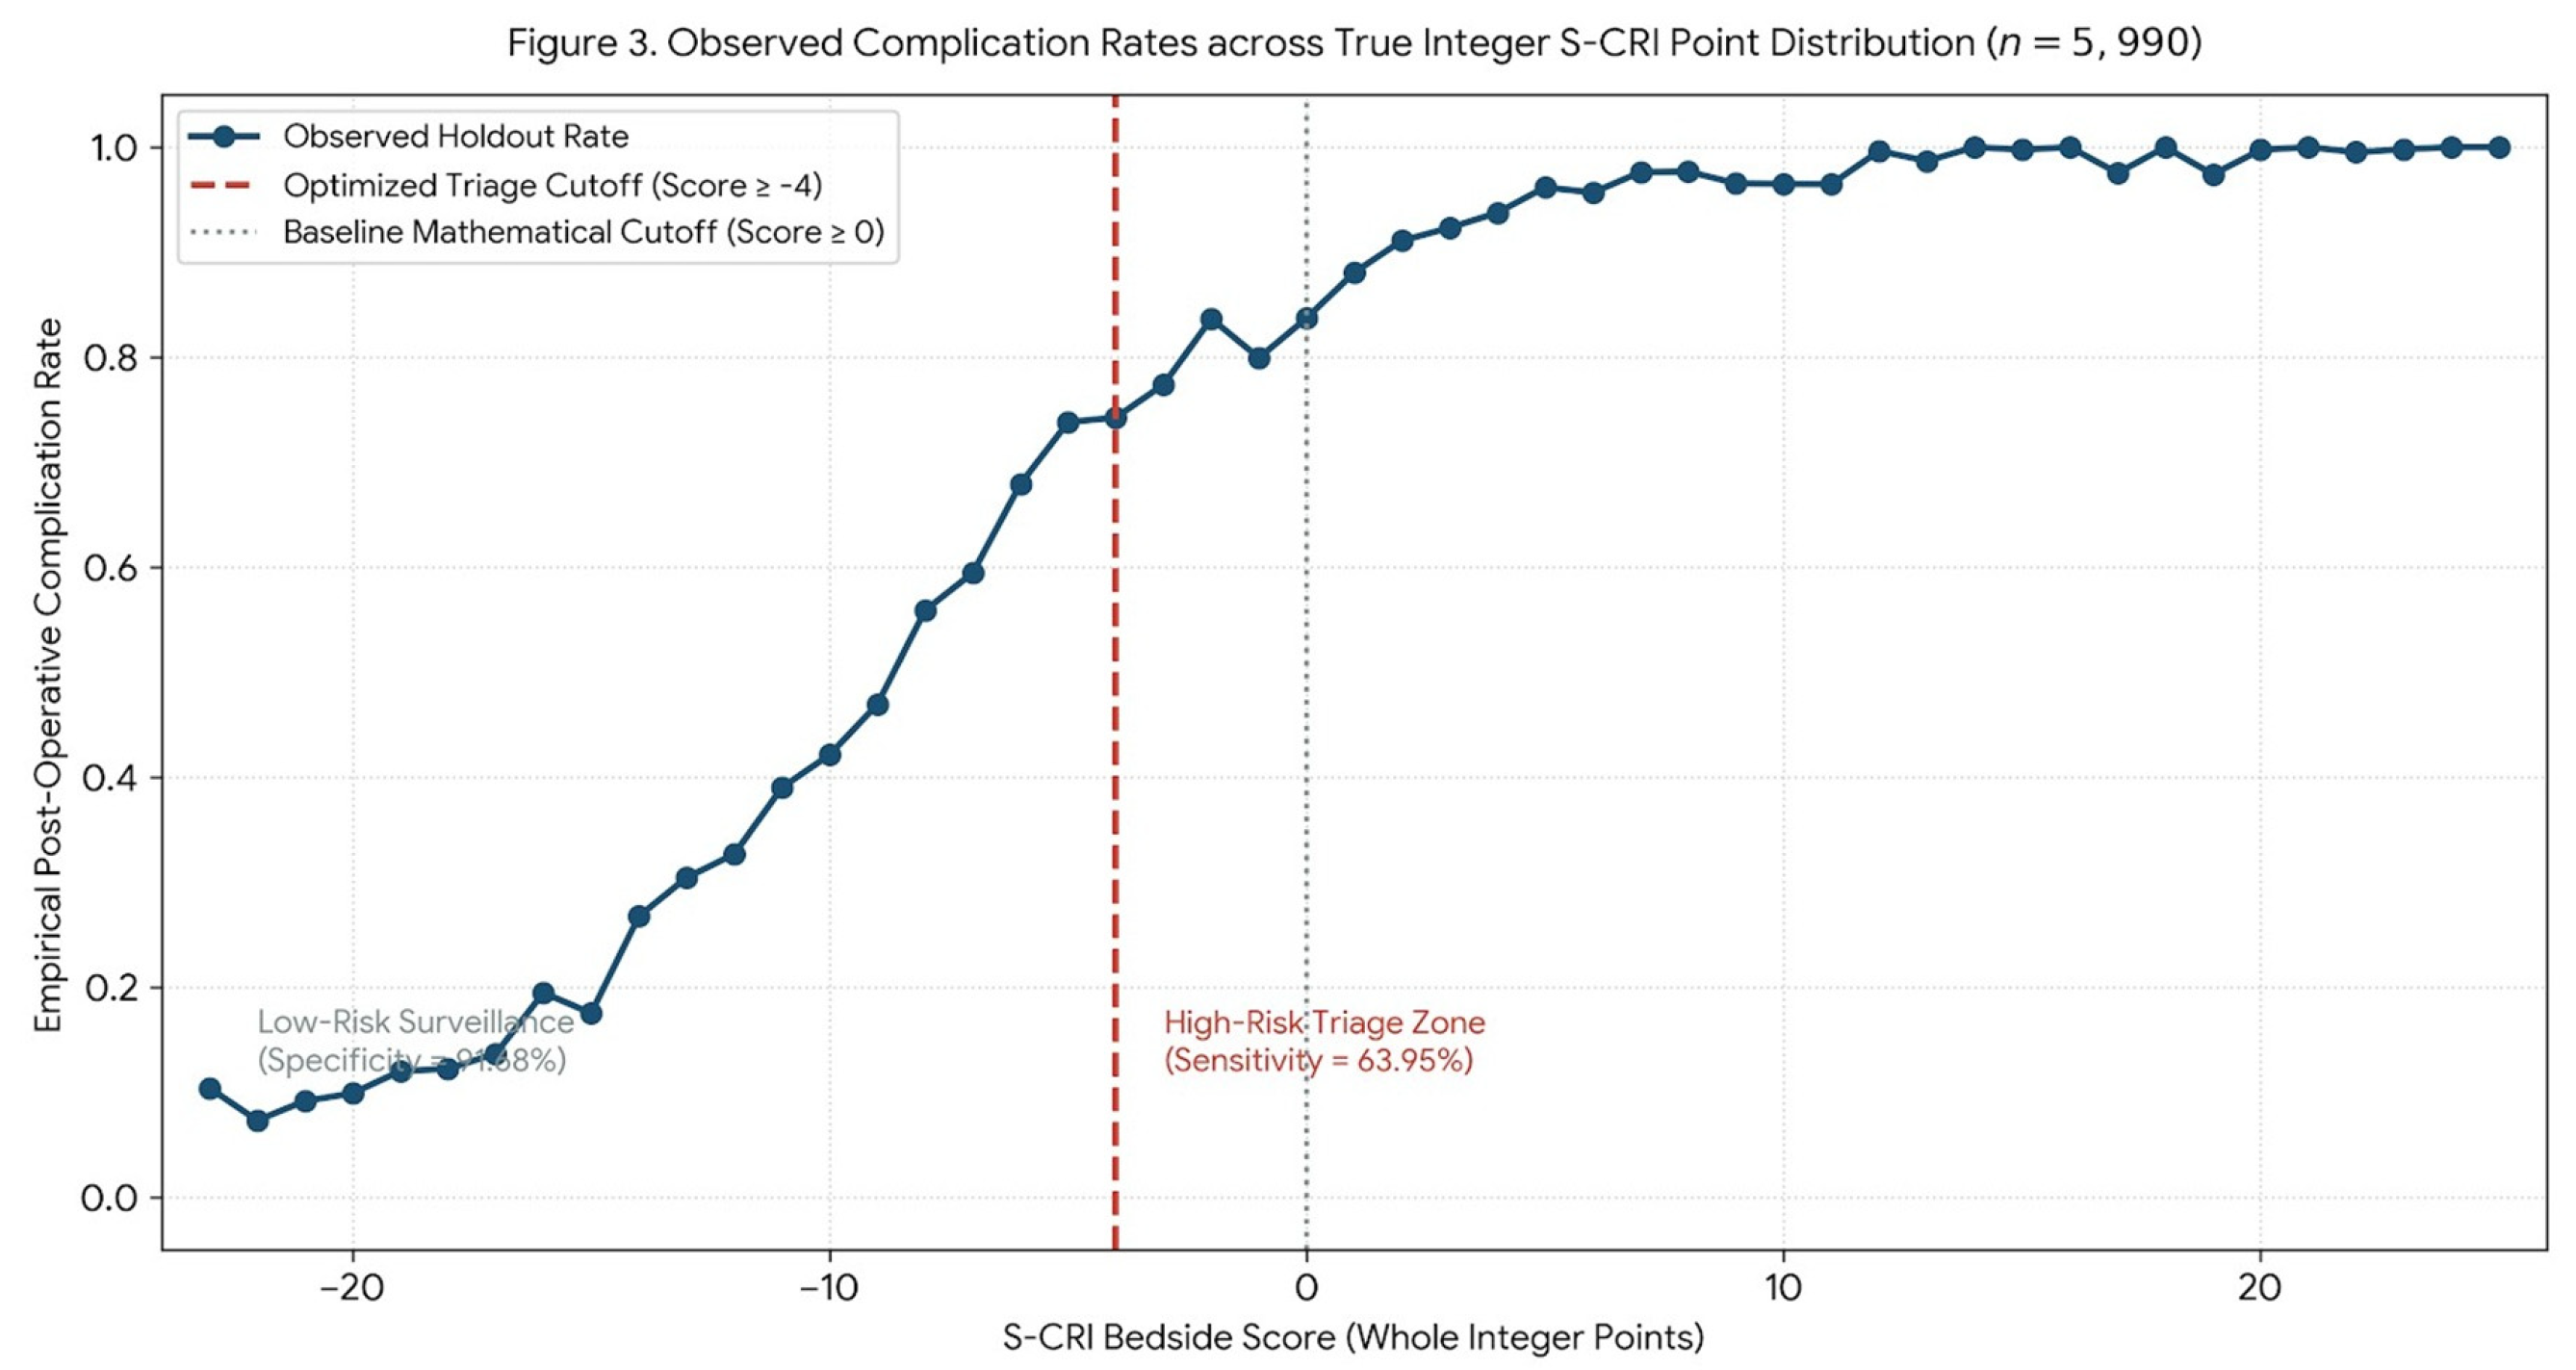
Observed post-operative complication rates across the true integer S-CRI scorecard point distribution evaluated within the isolated holdout testing cohort (n = 5990). Scores equal to or exceeding the optimized integer screening cutoff score of −4 (Sensitivity: 63.95%) exhibit a sharp inflection in risk, differentiating high-risk ward surveillance candidates from the low-risk baseline population.
Figure 5.
Precision–Recall (PR) curve evaluating the diagnostic precision and baseline predictive strength of the true integer S-CRI framework. This performance trajectory confirms the scorecard’s robustness and bedside screening utility within a dynamic real-world clinical cohort characterized by an imbalanced 13.52% complication event prevalence rate.
Evaluating classification matrices across distinct operational decision boundaries revealed highly distinct clinical utility profiles (Table 2, Part B). Enforcing the conservative, baseline mathematical cutoff score of ≥0 prioritized highly specific screening, achieving an overall accuracy of 88.18%, a strict specificity of 96.43%, and a positive predictive value (precision) of 60.81%, albeit alongside a conservative sensitivity of 35.43%. Conversely, applying the optimized integer screening cutoff score of ≥−4 maximized active screening capacity on the ward (Figure 3). When evaluating the optimized clinical screening cutoff score of ≥−4 within the independent holdout validation cohort (n = 5990), the framework demonstrated high screening sensitivity. The absolute classification matrix distribution at this threshold yielded 518 True Positives (TP), 431 False Positives (FP), 4749 True Negatives (TN), and 292 False Negatives (FN), reflecting its intended design as an early warning screening mechanism. This optimized clinical threshold successfully captured the majority of evolving adverse events, elevating diagnostic sensitivity to 63.95% (95% CI: 60.57–67.24%) while maintaining an excellent, stable specificity profile of 91.68% (95% CI: 90.90–92.41%) and a negative predictive value of 94.19%. These metrics confirm that the whole-integer S-CRI provides an objective, transparent, and translationally viable stratification index for real-time patient exploratory bedside screening aid [25].
3.5. Exploratory Stratification of Empirical Risk Tiers
By analysing the continuous distribution of scores against actual complication rates, we broke down the S-CRI continuum into five distinct, exploratory risk stratification tiers (Figure 4). These tiers provide an evidence-based framework for evaluating potential localized clinical response pathways on the holdout test set:
- Very Low Risk Tier (S-CRI Score < −10): Represents 34.2% of the holdout validation cohort (2049 cases). The empirical complication rate within this cohort is 0.23% (95% CI: 0.07–0.54%).
- Low Risk Tier (S-CRI Score −10 to −5): Represents 47.9% of the holdout validation cohort (2869 cases). The empirical complication rate is 4.12% (95% CI: 3.42–4.92%).
- Moderate Risk Tier (S-CRI Score −4 to −1): Represents 11.2% of the holdout validation cohort (671 cases). The empirical complication rate increases to 30.22% (95% CI: 26.79–33.85%).
- High Risk Tier (S-CRI Score 0 to 5): Represents 5.1% of the holdout validation cohort (305 cases). The empirical complication rate increases to 53.24% (95% CI: 47.49–58.93%).
- Very High-Risk Tier (S-CRI Score > 5): Represents 1.6% of the holdout validation cohort (96 cases). The empirical complication rate reaches 77.41% (95% CI: 67.81% to 85.24%).
3.6. Clinical Case Application Examples
To demonstrate the practical utility and intuitive bedside deployment of the S-CRI scorecard, this section presents two hypothetical clinical scenarios utilizing the 1 point = 1 day clinical scaling metric:
- Case 1: Low-Risk optimized integer screening cutoff score (Safe for Continued Ward Care)
Patient Profile: A 68-year-old male admitted to the Medical Department with mild community-acquired pneumonia (mapped to the Standard-Risk Diagnoses Group based on historical cohort complication rates < 10%). He has currently accrued 16 days of length of stay (LOS = 16) up to the morning of clinical assessment.
Component-Wise Score Calculation:
Baseline Model Intercept (β0): −16 points
Length of Stay (LOS) Impact (16 days times 1 point/day): +16 points
Medical Department Assignment: −6 points
Standard-Risk Entry Diagnosis Group: 0 points
Summation Math:
S-CRI Bedside Score = Baseline Intercept (−16) + (LOS Days times 1) + (Medical Department Weight times −6) + (Standard Diagnosis Group Weight times 0)
S-CRI Bedside Score = −16 + 16 − 6 + 0 = −6
Clinical Interpretation: Because the calculated score of −6 remains strictly below the optimized operational optimized integer screening cutoff score of ≥−4, the patient maps safely into the Low Risk Tier (historical validation complication rate of 4.12%). The S-CRI framework supports the clinical decision to maintain the patient on the general medical ward with standard vital sign monitoring, confirming that, despite an extended length of stay, his clinical profile does not generate an escalated risk that warrants an intensive care or high-dependency unit transfer.
- Case 2: High-Risk optimized integer screening cutoff score (Triggering Early Intensive Care Intervention)
Patient Profile: A 74-year-old female admitted to the Medical Department for an acute exacerbation of COPD exhibiting progressive tachypnoea and worsening metabolic metrics (mapped to the Moderate-Risk Diagnoses Group based on historical cohort complication rates). She has currently accrued 11 days of length of stay (LOS = 11) up to the morning of clinical assessment.
Component-Wise Score Calculation:
Baseline Model Intercept (β0): −16 points
Length of Stay (LOS) Impact (11 days times 1 point/day): +11 points
Medical Department Assignment: −6 points
Moderate-Risk Entry Diagnosis Group: +9 points
Summation Math:
S-CRI Bedside Score = Baseline Intercept (−16) + (LOS Days times 1) + (Medical Department Weight times −6) + (Moderate-Risk Diagnosis Group Weight times 9)
S-CRI Bedside Score = −16 + 11 − 6 + 9 = −2
Clinical Interpretation: Because the calculated score of −2 breaches the optimized operational screening cutoff score of ≥−4, the patient maps directly into the Moderate Risk Tier (historical validation complication rate of 30.22%). This automated threshold breach serves as an objective, early-warning trigger for the attending clinical team. Even though the patient is currently on a general medical ward, the S-CRI score flags an escalated probability of clinical deterioration, prompting immediate clinical escalation, a comprehensive review of metabolic parameters, and consideration for early intensive care or high-dependency unit intervention.
- Case 3: High-Risk optimized integer screening cutoff score (Escalating to High-Dependency Unit)
Patient Profile: A 62-year-old female admitted to the Surgical Specialty Department for an emergency abdominal intervention (mapped to the High-Risk Diagnoses Group due to an empirical complication rate exceeding 30%). She has currently accrued 2 days of length of stay (LOS = 2) up to the morning of clinical assessment.
Component-Wise Score Calculation:
Baseline Model Intercept (β0): −16 points
Length of Stay (LOS) Impact (2 text days times 1 text point/day): +2 points
Surgical Specialty Department Assignment: −1 point
High-Risk Entry Diagnosis Group: +11 points
Summation Math:
S-CRI Bedside Score = Baseline Intercept (−16) + (LOS Days times 1) + (Surgical Department Weight times −1) + (High-Risk Diagnosis Group Weight times 11)
S-CRI Bedside Score = −16 + 2 − 1 + 11 = −4
Clinical Interpretation: This patient’s calculated score of −4 exactly reaches the optimized operational optimized integer screening cutoff score of threshold (≥−4). This places her directly into the Moderate Risk Tier (historical validation complication rate of 30.22%), meaning she is experiencing an active risk acceleration early in her admission. The S-CRI framework flags her profile as an automated early-warning signal, prompting the surgical team to increase bedside clinical surveillance and coordinate proactive high-dependency unit placement before further physiological deterioration occurs.
4. Discussion
A defining paradigm shift of the S-CRI framework lies in its approach to the clinical interpretability crisis. While contemporary Explainable Artificial Intelligence (XAI) frameworks—such as SHAP (SHapley Additive exPlanations) or LIME (Local Interpretable Model-agnostic Explanations)—succeed in generating post hoc mathematical feature importance vectors for complex models, they still require persistent digital infrastructure, local or cloud-based server computing, and active screen-based software interfaces to deliver those explanations to the clinician [26]. In contrast, the unique translational advantage of the S-CRI is its direct mathematical alignment with a tangible, real-world clinical proxy baseline, where exactly 1.0 integer point maps directly to the independent risk contribution of a single inpatient day. By scaling abstract multivariate logistic regression coefficients against this universally understood metric of hospital length of stay, the framework compresses high-dimensional predictive intelligence into a transparent, additive equation that can be computed entirely on paper. This metric alignment effectively decouples the execution of predictive analytics from active hardware dependencies, removing the friction of technical infrastructure at the immediate bedside and allowing resource-constrained public healthcare networks to deploy robust risk-stratification insights safely and instantly. Consequently, the S-CRI score is designed as a supplementary clinical decision-support tool to assist with bedside optimized integer screening cutoff score, rather than as a definitive diagnostic replacement for independent clinical judgment.
4.1. The Symbiotic Ecosystem: S-CRI as a Transparent Interface for Multi-Criteria Predictive Systems
When evaluated within the modern digital health landscape, the S-CRI framework establishes a clear template for how transparent biostatistical metrics can complement high-throughput AI systems [18,19]. In the current ecosystem of AI-driven healthcare, algorithms frequently struggle with the “last mile” problem—the transition from generating a probability score on a remote server to guiding a clinician’s hand during treatment. By positioning the S-CRI as an explainable interpreter for data-driven insights, it functions as a lightweight clinical decision support tool that demystifies predictive analytics.
While an ensemble machine learning model can continually audit a hospital’s longitudinal data registry to identify macro-trends, the S-CRI acts as the local, edge-deployed clinical interface [20,21]. It breaks down complex risk patterns into clear, additive integers, showing the clinical team exactly why a patient is flagged for an early intervention protocol. This transparency directly addresses the challenge of algorithmic opacity in medical AI [22]. It transforms automated predictions into a transparent diagnostic asset that aligns naturally with clinical logic, enhancing physician adoption and protecting patient safety [3,27].
4.2. Managing the Clinical Threshold Trade-Off
The operational transition from a raw mathematical probability boundary to an adjustable scorecard cutoff highlights a key clinical trade-off. Utilizing the baseline mathematical threshold (Score ≥ 0) offers an elite specificity of 96.43%, serving as an excellent buffer against diagnostic false alarms. However, its baseline sensitivity of 35.43% misses over half of the active complications, introducing a safety concern if deployed as an absolute screening tool.
To adapt the index for practical ward environments, clinicians are advised to shift to the optimized integer screening cutoff score threshold of −4. By lowering the decision cutoff to ≥−4, the index’s sensitivity expands to 63.95% while preserving a stable specificity of 91.68%. This screening adjustment captures nearly two-thirds of emerging adverse events on the ward, offering an accessible early warning mechanism without placing excessive infrastructure demands on clinical staff.
The most notable finding of this study is that the drastic compression of data complexity achieved by the S-CRI resulted in virtually no sacrifice in overall discriminative performance. While the complex algorithmic architectures detailed in our previous work achieved exceptional predictive metrics, the simplified, paper-based S-CRI demonstrated an Area Under the Receiver Operating Characteristic (ROC) curve of 0.8741. In the discipline of biomedical engineering, this high AUC confirms a critical systemic principle: a robust linear combination of three carefully screened parameters—length of hospital stay, hospital department classification, and empirically pooled diagnostic risk categories—is sufficient to capture the vast majority of statistical variance associated with post-operative adverse outcomes [23].
This follows the principle of parsimony, or Occam’s razor, proving that moving from a high-dimensional machine learning matrix to an additive linear model yields an optimal trade-off between computational and low-resource bedside utility. In the broader landscape of clinical informatics, the S-CRI framework occupies a distinct operational niche between traditional regression-based clinical scores (e.g., Charlson Comorbidity Index, APACHE) and modern, high-dimensional machine learning architectures utilizing post hoc Explainable AI (XAI) methods like SHAP or LIME. While traditional risk scores are intuitive, they often lack the capacity to ingest complex dynamic administrative timelines. Conversely, while deep learning models offer high predictive power, their post hoc XAI explanations can be computationally prohibitive, prone to explanation instability, and difficult for a busy clinician to audit at the bedside. The S-CRI framework achieves an optimal middle ground by embedding predictive machine learning complexity directly into a transparent, pre-computed integer scoring matrix. By transforming log-odds feature engineering into an intuitive bedside point system prior to deployment, it delivers the predictive nuance of modern data modeling without sacrificing real-time human interpretability or relying on complex external XAI software pipelines [5].
4.3. Clinical Translation and Decision Threshold Optimization
When evaluated on the holdout validation cohort, the S-CRI demonstrated an excellent diagnostic signal (AUC = 0.8741). However, implementing the model via a default classification threshold of 0.50 highlights a classic biostatistical friction point in clinical deployment. While a specificity of 97.4% and a PPV of 73.3% are optimal for minimizing false alarms and managing clinical alert fatigue, a sensitivity of 45.8% means that a substantial proportion of true post-operative complications are missed during initial automated screening. Operating at the optimized integer screening cutoff score of , the framework prioritizes high sensitivity to minimize missed clinical deteriorations. It is critical to emphasize that the S-CRI score is intended solely as an exploratory bedside screening aid to alert care teams to high-risk trends, rather than an autonomous tool for real-time optimized integer screening cutoff score, direct ICU placement, or administrative resource allocation. Decisions regarding intensive care escalation or senior reviews must always rely on comprehensive clinical judgment and standard nursing protocols [28].
In a clinical decision-support aid or medical error prevention framework, the clinical penalty of a False Negative (failing to identify an impending complication) is substantially more severe than a False Positive (which merely triggers increased clinical surveillance or a delayed discharge evaluation). Consequently, for practical healthcare implementation, the operational decision boundary should be deliberately recalibrated. By lowering the score or probability threshold from the default 0.50 marker, the S-CRI can be tailored to maximize sensitivity—safely capturing the 439 missed complication events—while tolerating a manageable, mathematically controlled increase in false positives. This adjustability allows hospital administrations to shift the index between an aggressive early-warning system and a highly specific discharge screening tool depending on local ward staffing capacity.
A major structural strength of the S-CRI lies in its intuitive standardization relative to a real-world clinical benchmark. By scaling the multivariate regression coefficients so that exactly 1.0 point equates to one single day of in-hospital stay (βdays), the scorecard aligns perfectly with a metric that clinicians intrinsically evaluate during daily rounds [22,23]. To translate the log-odds coefficients into an intuitive bedside integer scoring system, each predictor coefficient was scaled relative to the length of stay coefficient (βLOS = 0.2074). The raw model baseline intercept (β0 = −3.2515) was divided by βLOS (−3.2515/0.2074 = −15.677) and rounded to establish the final integer baseline scoring anchor of −16. Accordingly, the mathematically corrected adjusted odds ratio (aOR) for length of stay is 1.23 per additional day of hospitalization (exp(0.2074) = 1.23, 95% CI: [1.19, 1.27]). Each additional day spent within the nosocomial environment exponentially increases a patient’s exposure to multidrug-resistant hospital pathogens, disrupts natural circadian rhythms, and correlates with a steady decay in baseline physiological reserve [17,24].
Furthermore, our categorical grouping protocol solved a major limitation typical of applying standard regression models to heterogeneous electronic health records. High-cardinality nominal variables like ENTRY-DIAGNOSIS frequently overcomplicate linear scoring indices due to the sheer volume of distinct diagnostic codes, rendering bedside calculation impossible. By pooling these codes into empirical mathematical risk tiers before regression modelling based on historical error incidence rates (>30, 10–30%, <10%), the S-CRI retains the precise predictive contributions of high-risk diagnoses (such as S_11, E_6, and specific ORL sub-codes) while requiring the clinician to perform only a simple three-tier lookup [24,25].
4.4. Human Factors Engineering: Algorithmic Calibration to Neutralize Bedside Alert Fatigue
From a patient-safety and operational implementation standpoint, the selection of an optimized clinical screening threshold is vital to prevent systemic failure. By evaluating the performance trade-off matrix, a threshold of −4 was established to prioritize screening sensitivity (63.95%) while maintaining high specificity (91.68%).
In high-acuity surgical environments, this threshold strikes an ideal balance: it captures two-thirds of all eventual adverse events yet maintains a sufficiently low false-positive rate to eliminate “alert fatigue effectively.” Alert fatigue remains a primary cause of clinical non-compliance and cognitive overriding of automated electronic decision systems [3]. By ensuring that nearly 90% of uncomplicated patients are correctly filtered out, the S-CRI prevents unnecessary clinical alarms, ensuring that when a patient triggers the threshold, the clinical staff recognizes it as a high-probability event demanding immediate attention [23,24].
4.5. Clinical Implementation Pathways and Strategic Resource Tiering
When evaluated across the full cohort of 19,965 surgical records, the five distinct risk tiers derived via the S-CRI provide an unambiguous framework for targeted clinical monitoring and strategic resource allocation. Because the tool requires only basic addition, it can be seamlessly integrated directly into existing bedside workflows—such as during morning handovers or as an adjunct block within the World Health Organization (WHO) Surgical Safety Checklist [25].
Patients classified in the “Very Low Risk” tier (<1% complication rate) can safely undergo standard post-operative care pathways, preserve critical hospital resources, and accelerate bed turnover rates. Conversely, individuals scoring in the “Very High Risk” tier exhibit an alarming 77.4% empirical complication rate. This mathematical reality justifies aggressive, pre-emptive interventions, specialized prophylactic antibiotic rotations, continuous non-invasive vital monitoring, or immediate senior-led clinical reviews. By stratifying patients objectively, hospital administrators can optimize intensive care unit (ICU) beds and specialized nursing staff, targeting high-intensity care exclusively to the tiers where it will yield the maximum survival and safety benefit [3,26].
4.6. Digital Health Ecosystem Integration: EHR Pipelines, Dashboards, and Automated Monitoring
To maximize its utility in modern clinical workflows, the S-CRI is engineered for seamless integration into automated hospital information systems (HIS) and electronic health record (EHR) architectures. Rather than existing only as a paper-based scorecard, the linear, additive nature of the index allows it to be easily integrated into digital health software via basic script plug-ins. Within an automated monitoring ecosystem, background daemons can continuously scan a patient’s digital chart. The moment a patient’s admitting department, entry diagnosis group, and cumulative post-operative days match the S-CRI parameters, the system instantly computes the integer value without requiring manual data entry from staff [22].
This automated calculation layer can feed directly into real-time clinical dashboards at central nursing stations. By mapping the continuous scores onto our validated exploratory bedside screening aid, the dashboard can color-code patient lists by risk profile. For example, a patient crossing the optimized screening threshold of −4 instantly shifts to a high-priority visual tier, signalling the need for an early intervention review [27].
Furthermore, within advanced AI-assisted monitoring environments (such as smart intensive care step-down units), the S-CRI can serve as a dependable baseline filter. It handles routine risk stratification across the general ward population, freeing up complex, high-performance computing resources to focus exclusively on highly volatile, critically ill patients [28]. This tiered deployment strategy optimizes hospital computing power, prevents system alert fatigue, and provides public health networks with a scalable roadmap for data-driven personalized medicine [28].
4.7. Limitations
While the S-CRI framework offers an explainable, low-resource, bedside utility supplementary clinical decision-support tool derived from a substantial multicentre population, several methodological limitations must be acknowledged.
Retrospective Study Design: This framework was developed and validated utilizing a retrospective digital health registry. Because the data were collected historically, the model’s predictive performance reflects a retrospective evaluation only, and the study lacks a prospective clinical trial or real-time usability assessment among active surgical staff.
Registry-Related and Administrative Biases: The dataset originates from public Greek hospital registries, which introduce potential localized institutional variations, administrative coding inconsistencies, and unmeasured confounding factors. For instance, variables such as patient insurance category (INSURER) may capture administrative or socioeconomic proxies rather than pure clinical metrics.
Temporal Relationship and Outcome Leakage Risk: A primary structural limitation relates to the continuous predictor, Length of Stay (LOS). In clinical practice, post-operative complications inherently prolong hospital stays, introducing a risk of reverse causality where the model utilizes a consequence of an adverse outcome as a predictor. While the S-CRI is mathematically anchored to cumulative days accrued to facilitate real-time clinical tracking, true outcome leakage cannot be entirely ruled out in a retrospective dataset where the precise hour of complication onset relative to daily census tracking was not granularly recorded. However, given the retrospective nature of administrative registries and the lack of minute-level granularity for complication onset times, residual temporal overlap cannot be completely ruled out.
Absence of External Validation Cohort: Although signal detection validation demonstrated excellent discriminative capacity (AUC = 0.8741; 95% CI: 0.864–0.884) across the 19,965 surgical records, this performance was measured within the development registry. The absence of a completely independent, geographically distinct external validation cohort restricts our immediate ability to generalize these specific integer weights to international public health infrastructures or private healthcare systems.
Finally, although this framework was rigorously evaluated using an independent holdout dataset partitioned from a large, multicenter registry database, a key limitation is the absence of geographic external validation beyond the primary examined healthcare environment. Because clinical coding habits, electronic health record architectures, and baseline patient demographics can vary significantly across different regional or international health systems, further external validation across heterogeneous institutional datasets is required to confirm the broader geographic transportability and generalizability of the S-CRI framework.
5. Conclusions
This study demonstrates a practical approach to the clinical interpretability crisis by compressing the predictive capacity of a multivariate logistic regression framework into a transparent, integer-based clinical scorecard. It is critical to emphasize that the S-CRI score is intended solely as an exploratory bedside screening aid to alert care teams to high-risk trends, rather than an autonomous tool for real-time exploratory bedside screening aid, direct ICU placement, or administrative resource allocation. Decisions regarding intensive care escalation or senior reviews must always rely on comprehensive clinical judgment and standard nursing protocols. Developed from a dataset of 19,965 records and evaluated on an independent 30% holdout validation cohort (n = 5990), the Surgery-Complication Risk Index (S-CRI) transforms high-dimensional predictive relationships into an additive bedside instrument [3]. By mathematically scaling the scoring architecture against a real-world clinical proxy baseline—where exactly 1.0 point represents the independent risk contribution of a single inpatient day (Length of Stay)—the framework translates abstract mathematical coefficients into an intuitive metric that fits seamlessly into routine ward assessments. Validated using signal detection metrics on the holdout test set, the S-CRI achieved an excellent discriminative capacity with a holdout validation Area Under the Curve (AUC) of 0.8741. While a default classification threshold (p ≥ 0.50) maximizes specificity (97.4%) and positive predictive value (73.3%) to prevent clinical alert fatigue, it sacrifices sensitivity (45.8%). Recalibrating the model to an optimized operational screening cutoff of −4 points establishes a more balanced clinical profile, yielding a sensitivity of 63.95% and a specificity of 91.68%. Stratifying the continuum into five distinct risk tiers offers an evidence-based pathway for risk assessment, tracking patient groups from a “Very Low Risk” cohort (0.23% complication rate) up to a “Very High Risk” cohort (77.41% complication rate).
Crucially, the additive nature of the S-CRI removes the necessity for persistent digital hardware dependencies, cloud server integrations, or active bedside data infrastructure. This technical decoupling offers an open, highly efficient, and auditable framework. While future prospective clinical trials are required to confirm its real-time clinical utility, the S-CRI represents a reproducible early-warning methodology well-suited for prospective evaluation in resource-constrained public healthcare networks and active surgical departments [22].
Supplementary Materials
The following supporting information can be downloaded at: https://www.mdpi.com/article/10.3390/app16136745/s1, Table S1: Analytical Mapping Matrix of Internal Diagnostic Clusters to S-CRI Risk Tiers; S2: Baseline Cohort Parameter Frequencies.
Author Contributions
Conceptualization, C.K.; Methodology, I.M. (Ioanna Michou) and C.K.; Software, I.H.; Validation, I.H.; Formal analysis, I.M. (Ioanna Michou); Investigation, C.K.; Resources, I.M. (Ioanna Michou) and I.M. (Ioannis Maroulis); Data curation, I.M. (Ioannis Maroulis) and C.K.; Writing—original draft, C.K.; Writing—review and editing, I.M. (Ioanna Michou), I.H. and C.K.; Visualization, I.H.; Supervision, I.M. (Ioannis Maroulis), I.H. and C.K. Equal contributions. All authors have read and agreed to the published version of the manuscript.
Funding
This research received no external funding.
Institutional Review Board Statement
The study was conducted in accordance with the Declaration of Helsinki and approved by the Institutional Ethics Committee of the University of Patras (15861, 4 September 2024) and the Patras University Hospital (357, 9 September 2021).
Informed Consent Statement
Not applicable. The study used health record data, as it was retrospective research in accordance with the institution’s GDPR regulations.
Data Availability Statement
The original data presented in the study are openly available in synapse.org at: https://doi.org/10.7303/syn66478369, [accessed on 30 April 2026].
Acknowledgments
AI-assisted tools (ChatGPT 4.0, Gemini 3.5 Flash) were used exclusively for language refinement, figure visualization, and graphical formatting support. No AI system contributed to statistical analysis, scientific interpretation, or the generation of study conclusions.
Conflicts of Interest
The authors declare no conflicts of interest.
References
- Meara, J.G.; Leather, A.J.M.; Hagander, L.; Alkire, B.C.; Alonso, N.; Ameh, E.A.; Bickler, S.W.; Conteh, L.; Dare, A.J.; Davies, J.; et al. Global Surgery 2030: Evidence and solutions for achieving health, welfare, and economic development. Lancet 2015, 386, 569–624. [Google Scholar] [CrossRef] [Scilit] [PubMed]
- World Health Organization. WHO Calls for Urgent Action to Reduce Patient Harm in Healthcare. 13 September 2019. Available online: https://www.who.int/news/item/13-09-2019-who-calls-for-urgent-action-to-reduce-patient-harm-in-healthcare (accessed on 25 January 2026).
- Michou, I.; Maroulis, I.; Chatzilygeroudis, I.; Koutsojannis, C. Machine Learning for Predicting Medical Error Risks in Greek Surgery Departments. Appl. Sci. 2026, 16, 5411. [Google Scholar] [CrossRef] [Scilit]
- Huynh, A.L.; Roy, T.J.; Jackson, K.N.; Lee, A.G.; Liaw, W.; Hossain, M.M. Applications of artificial intelligence-based conversational agents in healthcare: A systematic umbrella review. Int. J. Med. Inform. 2026, 207, 106204. [Google Scholar] [CrossRef] [Scilit] [PubMed]
- Gkikas, M.A.; Vrettos, K.; Tsinopoulos, I.; Tzamalis, A. Preoperative prediction of intraoperative complications in cataract surgery: A machine learning approach. Int. Ophthalmol. 2025, 45, 471. [Google Scholar] [CrossRef] [Scilit] [PubMed]
- Kuhn, T.N.; Engelhardt, W.D.; Kahl, V.H.; Alkukhun, A.; Gross, M.; Iseke, S.; Onofrey, J.; Covey, A.; Camacho, J.C.; Kawaguchi, Y.; et al. Artificial intelligence–driven patient selection for preoperative portal vein embolization for patients with colorectal cancer liver metastases. J. Vasc. Interv. Radiol. 2025, 36, 477–488. [Google Scholar] [CrossRef] [Scilit] [PubMed]
- Wachter, R.M. Patient safety at ten: Unmistakable progress, troubling gaps. Health Aff. 2010, 29, 165–173. [Google Scholar] [CrossRef] [Scilit] [PubMed]
- Mock, C.N.; Donkor, P.; Gawande, A.; Jamison, D.T.; Kruk, M.E.; Debas, H.T. Essential surgery: Key messages from Disease Control Priorities, 3rd edition. Lancet 2015, 385, 2209–2219. [Google Scholar] [CrossRef] [Scilit] [PubMed]
- Makary, M.A.; Daniel, M. Medical error—The third leading cause of death in the US. BMJ 2016, 353, i2139. [Google Scholar] [CrossRef] [Scilit] [PubMed]
- Barach, P.; Small, S.D. Reporting and preventing medical mishaps: Lessons from non-medical near miss reporting systems. BMJ 2000, 320, 759–763. [Google Scholar] [CrossRef] [Scilit] [PubMed]
- Sarker, S.K.; Vincent, C. Errors in surgery. Int. J. Surg. 2005, 3, 79–81. [Google Scholar] [CrossRef] [Scilit] [PubMed]
- Institute of Medicine. To Err Is Human: Building a Safer Health System; National Academies Press: Washington, DC, USA, 2000. [Google Scholar] [CrossRef] [Scilit] [PubMed]
- Flin, R.; O’Connor, P. Safety at the Sharp End: A Guide to Non-Technical Skills, 2nd ed.; CRC Press: Boca Raton, FL, USA, 2017. [Google Scholar] [CrossRef] [Scilit]
- Marsh, K.M.; Turrentine, F.E.; Knight, K.; Attridge, E.; Chen, X.; Vittitow, S.; Jones, R.S. Defining and Studying Errors in Surgical Care: A Systematic Review. Ann. Surg. 2022, 275, 1067–1073. [Google Scholar] [CrossRef] [Scilit] [PubMed]
- Henriksen, K.; Battles, J.B.; Marks, E.S.; Lewin, D.I. (Eds.) Advances in Patient Safety: From Research to Implementation; AHRQ Publication No. 05-0021; Agency for Healthcare Research and Quality: Rockville, MD, USA, 2005; Volume 1–4. Available online: https://www.ncbi.nlm.nih.gov/books/NBK20545/ (accessed on 20 January 2025).
- Duclos, A.; Frits, M.L.; Iannaccone, C.; Bates, D.W.; Classen, D.C. Safety of inpatient care in surgical settings: Cohort study. BMJ 2024, 387, e080480. [Google Scholar] [CrossRef] [Scilit] [PubMed]
- Cohen, A.J.; Lui, H.; Zheng, M.; Cheema, B.; Cohen, S.M.; Maggard-Gibbons, M. Rates of serious surgical errors in California and plans to prevent recurrence. JAMA Netw. Open 2021, 4, e217058. [Google Scholar] [CrossRef] [Scilit] [PubMed]
- Elfanagely, O.; Toyoda, Y.; Othman, S.; Mellia, J.A.; Basta, M.; Liu, T.; Kording, K.; Ungar, L.; Fischer, J.P. Machine Learning and Surgical Outcomes Prediction: A Systematic Review. J. Surg. Res. 2021, 264, 346–361. [Google Scholar] [CrossRef] [Scilit]
- Obermeyer, Z.; Powers, B.; Vogeli, C.; Mullainathan, S. Dissecting racial bias in an algorithm used to manage the health of populations. Science 2019, 366, 447–453. [Google Scholar] [CrossRef] [Scilit] [PubMed]
- Locke, S.; Bashall, A.; Al-Adely, S.; Moore, J.; Wilson, A.J.; Kitchen, G.B. Natural language processing in medicine: A review. Trends Anaesth. Crit. Care 2021, 38, 4–9. [Google Scholar] [CrossRef] [Scilit]
- Michou, I.; Maroulis, I.; Koutsojannis, C. Machine learning for medical error prevention in departments of surgery: A review of challenges and biases. World J. Biomed. Pharm. Sci. 2025, 22, 410. [Google Scholar] [CrossRef] [Scilit]
- Shanafelt, T.D.; Balch, C.M.; Bechamps, G.J.; Russell, T.; Dyrbye, L.; Satele, D.; Collicott, P.; Novotny, P.J.; Sloan, J.; Freischlag, J. Burnout and medical errors among American surgeons. Ann. Surg. 2010, 251, 995–1000. [Google Scholar] [CrossRef] [Scilit] [PubMed]
- Al-Ghunaim, T.A.; Johnson, J.; Bui, A.; Melton, G.B. Surgeon burnout and its association with patient safety outcomes. Am. J. Surg. 2022, 224, 228–234. [Google Scholar] [CrossRef] [Scilit] [PubMed]
- Carter, D. The surgeon as a risk factor. Adv. Surg. 2002, 36, 141–165. [Google Scholar] [PubMed]
- Classen, D.C.; Resar, R.; Griffin, F.; Federico, F.; Frankel, T.; Kimmel, N.; Whittington, J.C.; Frankel, A.; Seger, A.; James, B.C. “Global trigger tool” shows that adverse events in hospitals may be ten times greater than previously measured. Health Aff. 2011, 30, 581–589. [Google Scholar] [CrossRef] [Scilit] [PubMed]
- Bilimoria, K.Y.; Liu, Y.; Paruch, J.L.; Zhou, L.; Kmiecik, T.E.; Ko, C.Y.; Cohen, M.E. Development and evaluation of the universal ACS NSQIP surgical risk calculator: A decision aid and informed consent tool for patients and surgeons. Ann. Surg. 2013, 258, 4–12. [Google Scholar] [CrossRef] [Scilit]
- de Vries, E.N.; Ramrattan, M.A.; Smorenburg, S.M.; Gouma, D.J.; Boermeester, M.A. The incidence and nature of in-hospital adverse events: A systematic review. BMJ Qual. Saf. 2008, 17, 216–223. [Google Scholar] [CrossRef] [Scilit] [PubMed]
- Ning, Y.; Li, S.; Ong, M.E.H.; Xie, F.; Chakraborty, B.; Ting, D.S.W.; Liu, N. A novel interpretable machine learning system to generate clinical risk scores: An application for predicting early mortality or unplanned readmission in a retrospective cohort study. npj Digit. Med. 2022, 5, 163. [Google Scholar] [CrossRef] [Scilit] [PubMed]

Disclaimer/Publisher’s Note: The statements, opinions and data contained in all publications are solely those of the individual author(s) and contributor(s) and not of MDPI and/or the editor(s). MDPI and/or the editor(s) disclaim responsibility for any injury to people or property resulting from any ideas, methods, instructions or products referred to in the content. |
© 2026 by the authors. Licensee MDPI, Basel, Switzerland. This article is an open access article distributed under the terms and conditions of the Creative Commons Attribution (CC BY) license.