


Featured Application
The results support assessment of RC beams subjected to off-midspan accidental impact. Such assessment should include shorter-span-side shear transfer and asymmetric damage in addition to the central-impact force level.
Abstract
Reinforced concrete (RC) beams under impact are commonly assessed using central-impact configurations, but practical impacts may deviate from midspan and create unequal shear spans. This study investigates how impact eccentricity changes force transfer and damage development using a validated coupled smoothed particle hydrodynamics–finite element method (SPH-FEM) model. Concrete is modeled with SPH particles, while reinforcement, supports, and the impactor are modeled with FEM solid elements. After validation against central drop-weight tests, full-span eccentric-impact cases are compared with matched short-span references. The first contact-force peak changes only slightly with eccentricity, whereas the later response distribution changes more substantially. At the largest eccentricity, shorter-span shear reaches up to 2.23 times the central-impact value, showing shear-dominated redistribution. Absorbed energy per unit length also localizes on the shorter-span side and reaches up to 4.29 times the longer-span side value. Matched references show that full-span eccentric beams can develop up to higher local shear than symmetric short-span beams. Damage fields shift from symmetric central damage to asymmetric shorter-span-side damage with clearer fragmentation in low-strength cases. For off-midspan accidental-load assessment, the central-impact force level should be considered together with side-specific shear demand, the shorter-span shear-transfer path, and asymmetric damage.
1. Introduction
Concrete and reinforced concrete (RC) members can experience localized impact from falling objects, rockfall, vehicle or equipment collisions, debris, and construction operations. Such loading is short in duration, spatially concentrated, and coupled with inertia, stress-wave propagation, local crushing, and strain-rate effects. Early drop-weight studies established experimental procedures for concrete impact and discussed rate-dependent fracture and energy absorption [1,2]. Material-level studies showed rate effects in concrete compression and tension [3,4]. Reinforcing steel also changes its mechanical response with loading rate [5,6]. At the structural scale, missile and RC slab impact studies showed that local contact damage and wave propagation can control the observed response [7,8]. Other impact-damage studies reported spatially distributed damage patterns [9,10].
RC beams are useful impact-reference members because their geometry, reinforcement, support condition, and response measurements can be controlled. Existing central-impact beam studies show that global response histories, energy absorption, and damage mode are strongly linked to local shear damage [11,12,13], and that dynamic demand cannot be inferred from static load-carrying behavior alone [14,15,16]. They also indicate that reinforcement detailing and nonlinear stress redistribution affect this response [17,18,19]. Recent studies further extended the reference basis to residual capacity and deformable-impactor loading [20,21,22]. These studies establish central impact as a reference configuration for RC beam impact analysis.
Peak impact force and peak displacement are useful global response measures, but they do not fully describe how impact demand is transferred through a beam. During impact, diagonal cracking, local shear transfer, shear-plug tendency, stress redistribution, and support restraint may develop before a static-type mechanism is formed. Experimental observations by Saatci and Vecchio showed that shear mechanisms can dominate the impact behavior of RC beams [23]. Numerical studies have also emphasized the importance of constitutive modeling, shear reinforcement, and nonlinear stress redistribution in reproducing beam impact response [19,24,25]. Zhao et al. interpreted beam impact through local and member-level response phases and evaluated dynamic moment and shear demand using a modified-compression-field-theory-based failure criterion [26].
Most beam-impact tests place the impact point near midspan, where symmetry simplifies experimental validation and numerical calibration. In practice, over-height vehicle or equipment collisions with bridge girders or edge beams can occur away from midspan. Fu et al. reported that 309 of 1496 susceptible bridges in Maryland had been struck by over-height vehicles and 58 required repairs [27]. Rockfall, debris impact on RC protection or bridge members, and construction stage dropped objects can also place the contact point according to clearance, trajectory, obstacle position, slope geometry, or site accessibility [8,28].
When the impact point moves away from midspan, one shear span becomes shorter and the other becomes longer. The shorter-span side can provide a more direct force-transfer path to the closer support, while the contact section may have a lower bending moment than under central impact. The load-transfer pattern may shift from symmetric two-sided transfer to shear transfer on the shorter-span side. Studies on localized impact, punching, and slab damage show that concentrated force transfer can govern local damage and that impact damage can be spatially nonuniform [8,9,10,29,30]. Studies on support-region and inclined-section behavior indicate that force transfer near supports can become critical when transverse force and bending moment act together [31].
Studies that considered impact location or eccentric impact in RC beams and related RC members reported changes in global response, displacement, crack or damage pattern, strengthening effect, or torsional response [32,33]. Their emphasis is mainly on member-level response or strengthening behavior. Side-specific shear demand, energy localization, and damage asymmetry under eccentric impact have received less direct treatment.
Smoothed particle hydrodynamics (SPH) and related meshfree Lagrangian methods are suitable for impact problems involving large deformation, cracking, fragmentation, and material separation [34,35,36]. In the present model, concrete is represented by SPH particles, while reinforcement, supports, and the impactor are represented by finite element method (FEM) solid elements. The coupled SPH-FEM strategy follows established hybrid meshfree–mesh-based modeling concepts, with contact-force exchange and penalty-type interface transfer used to couple the particle and finite-element domains [37]. The present study uses this validated SPH-FEM implementation to evaluate eccentric RC beam impact.
For simply supported rectangular RC beams, central or near-midspan impact provides a symmetric validation benchmark but reduces the unequal-shear-span and full-span interaction effects that arise after the contact point shifts. The analysis examines how eccentricity changes global response magnitude and whether the post-peak load path shifts toward shorter-span shear demand, span-normalized energy localization, and asymmetric damage. A validated coupled SPH-FEM framework links contact-force pulse characteristics with sectional shear and bending-moment demand, span-normalized absorbed-energy density, matched short-span reference cases, and damage morphology. The matched short-span references provide a comparison with an isolated shorter-span idealization and identify where full-span interaction remains active.
2. Numerical Model Validation
2.1. Validation Experiment and Test Configuration
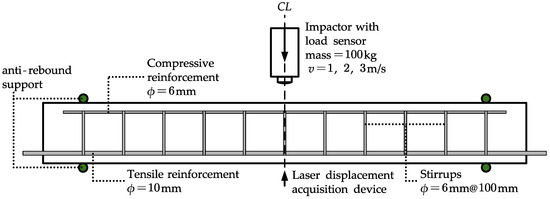
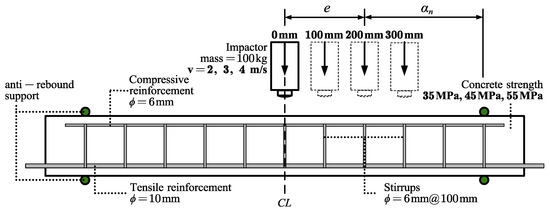
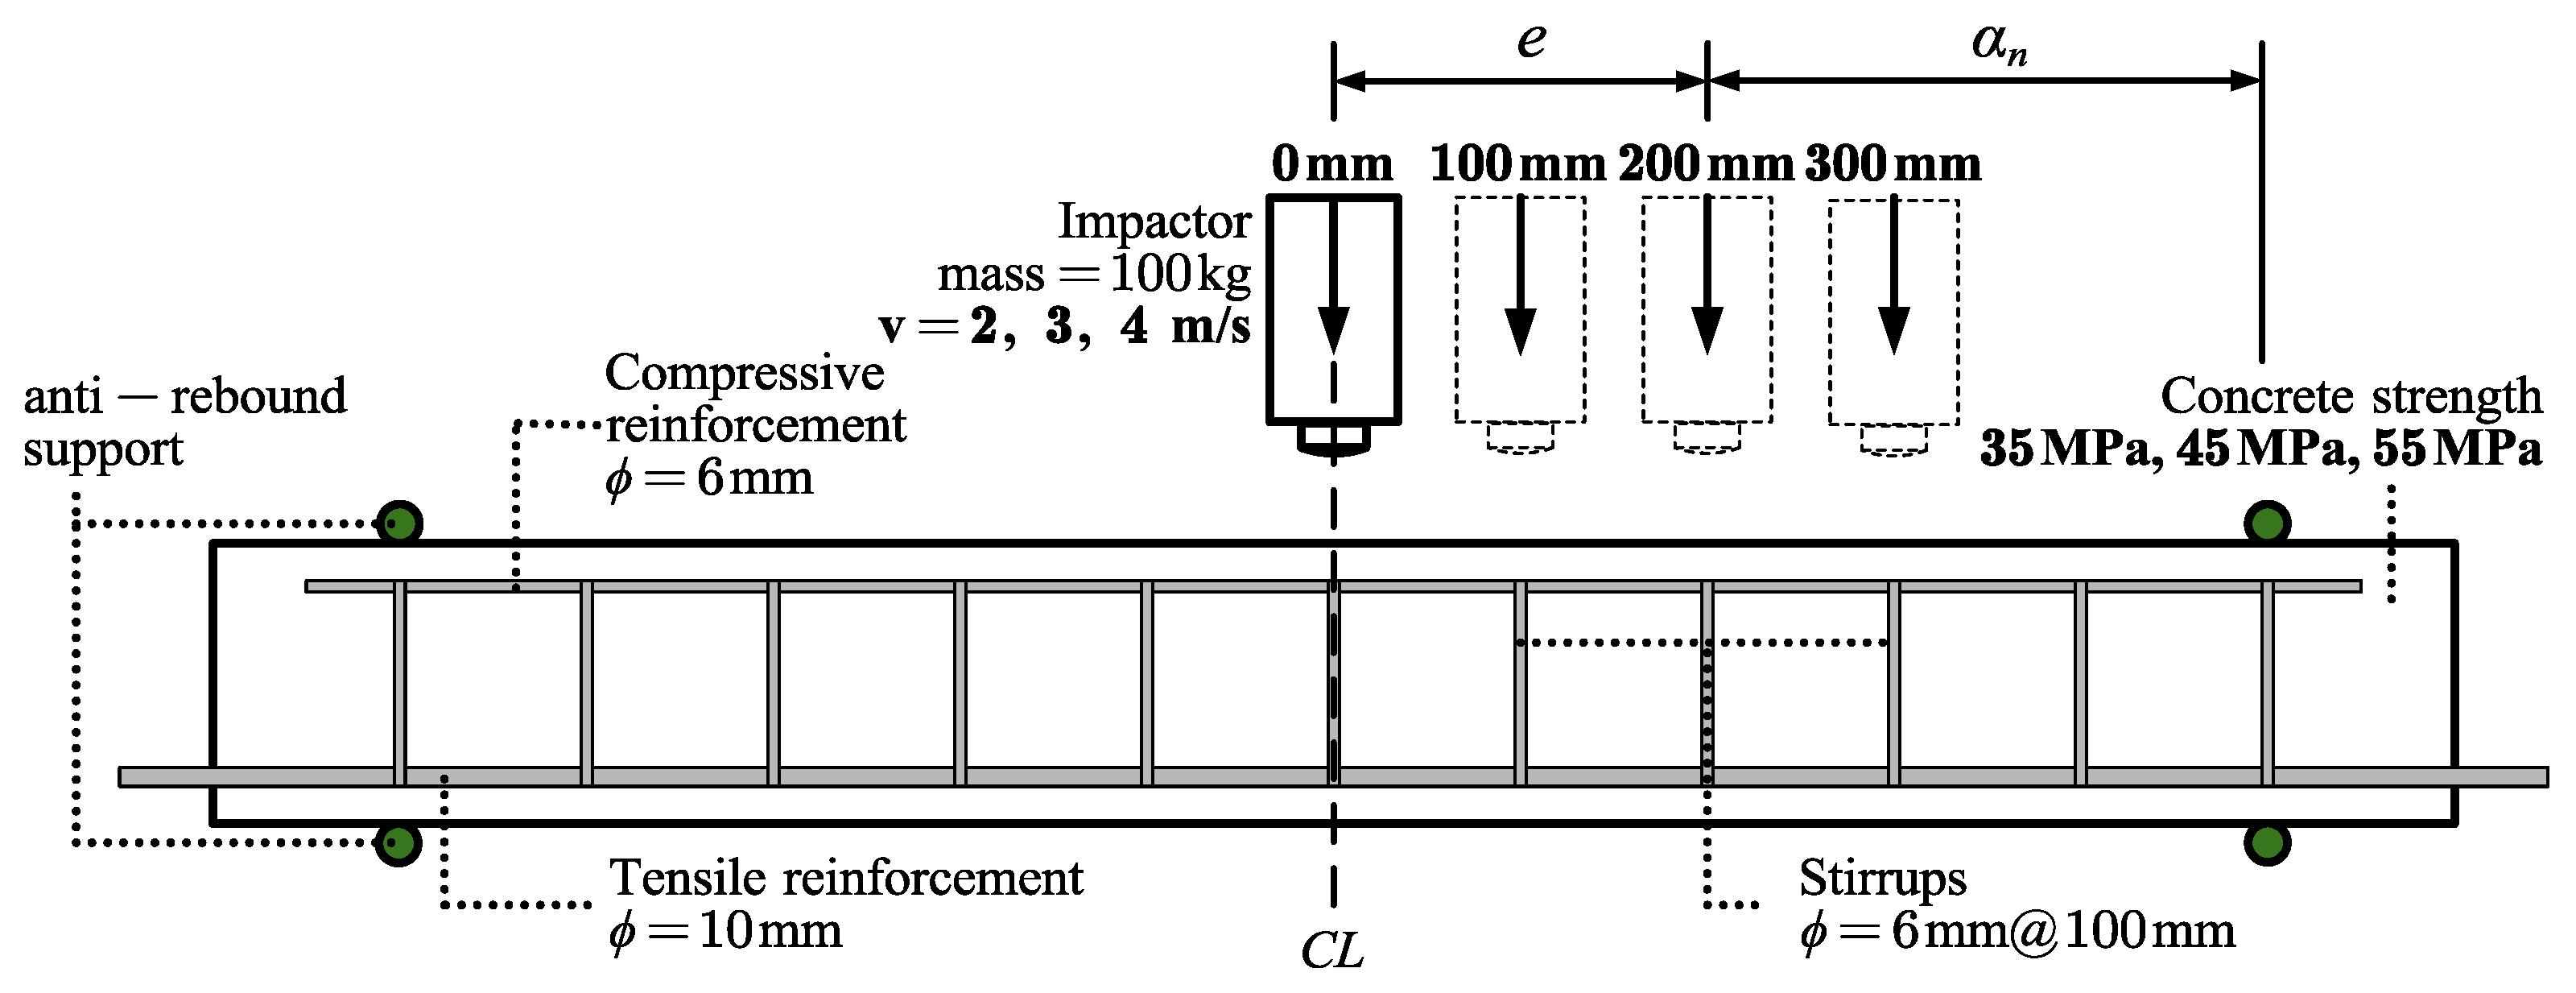
The numerical model was checked against the central drop-weight impact beam tests of Tamai et al. [38]. Figure 1 shows the test specimen, reinforcement layout, support arrangement, impactor, and measurement configuration used for validation. The specimen was a simply supported RC beam with dimensions of and a support span of . The source experiment reported measured concrete properties of , split tensile strength , and . The validation model used and as the reference input. The reinforcement consisted of SD295A tensile bars, SR235 compression bars, and double-legged SR235 stirrups spaced at .
Figure 1.
Test beam, reinforcement layout, and impact-test configuration used for model validation. Green circles indicate the anti-rebound support fixtures, and the dashed line labeled CL marks the beam centerline.
A drop weight equipped with a load sensor struck the beam at midspan. Three impact velocities, 1, 2, and , were used for the validation cases. The original experimental apparatus and velocity-control procedure are described in the cited experimental source. In the present numerical model, the reported experimental velocities were used directly as the prescribed initial velocities of the impactor. The midspan displacement was measured by a laser displacement device, and anti-rebound fixtures were installed near the support regions. The validation model reproduced the same beam geometry, support span, reinforcement layout, concrete reference properties, impactor mass, loading position, support arrangement, and displacement-measurement point. The numerical material parameters, discretization, interface setting, and explicit time increment are summarized in Table 1.
Table 1.
Geometry, material, and numerical parameters of the baseline model.
2.2. Hybrid SPH-FEM Analysis Model
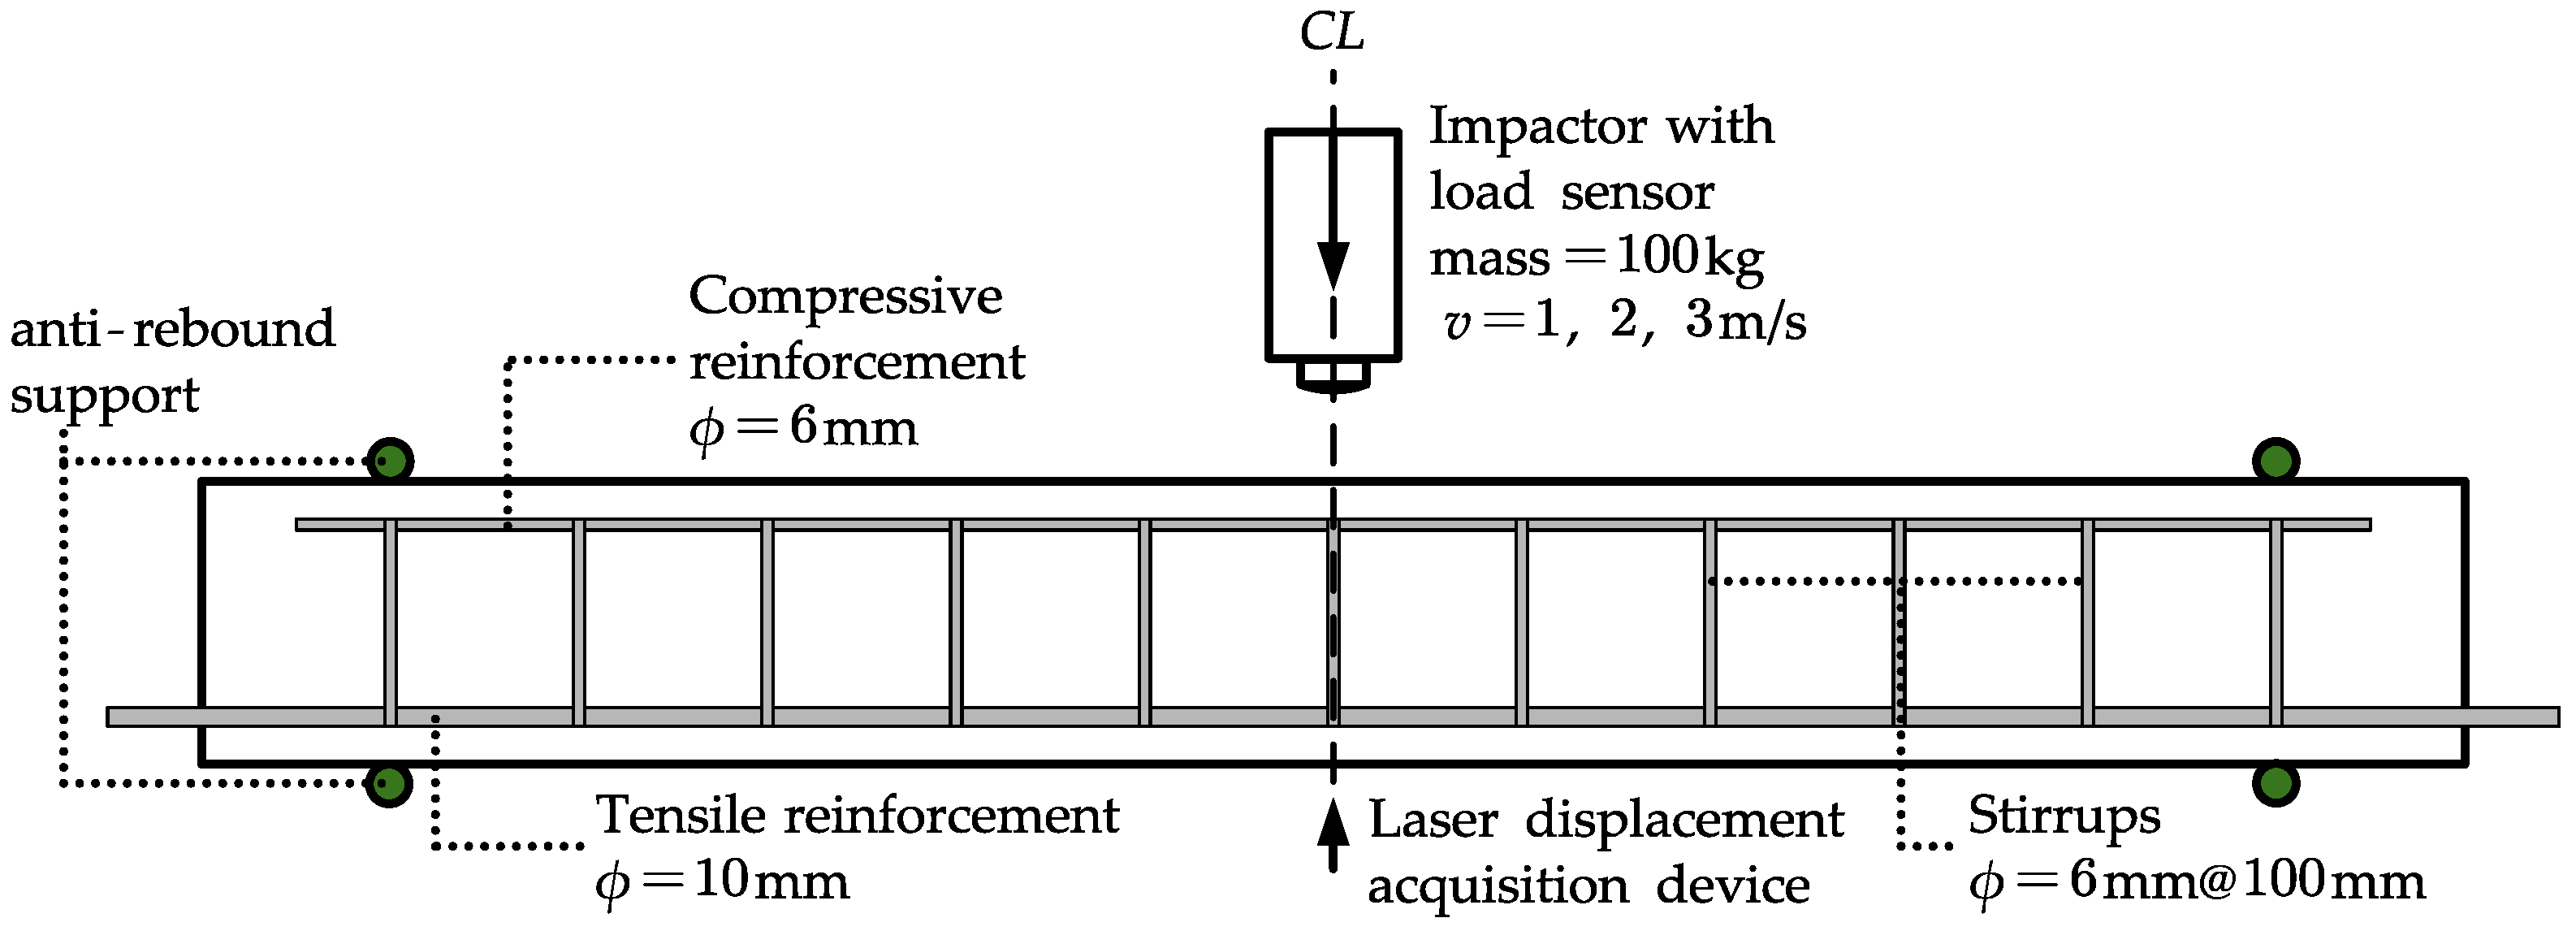
The validation and eccentric-impact simulations were performed using an in-house GPU-parallel explicit SPH-FEM solver implemented with Taichi (version 1.7.4; website: https://www.taichi-lang.org) [39]. The solver stores particle states, FEM nodal and element states, active interface interactions, and material history variables in GPU fields updated by parallel kernels. Concrete was discretized by SPH particles to represent localized crushing, damage spreading, and material separation. Reinforcement, the impactor, and support fixtures were discretized by eight-node solid finite elements, which provide a mesh-based description of the steel skeleton and boundary components.
The SPH and FEM domains were coupled through local interface force exchange. Contact interaction transfers normal compression and tangential sliding resistance between concrete particles and adjacent FEM surfaces. Bond transfer is applied at the reinforcement–concrete interface. The same contact and bond treatment was used in the validation and eccentric-impact simulations.
For a concrete particle i, the semi-discrete equation of motion is written as
where and are the particle mass and acceleration, is the internal force contribution from the SPH concrete domain, and is the total force transferred from adjacent FEM surfaces. For an FEM node a, the nodal balance is
where is the lumped nodal mass, and are the applied and element-resisting nodal forces, and is the interface reaction assembled from interacting concrete particles. The interface transfer terms are assembled locally with equal and opposite forces. The SPH particles and FEM nodes are then advanced using a common explicit time increment based on their lumped masses.
For the impactor–concrete and support–concrete interfaces, the contact contribution is evaluated within the interface force term . For each candidate FEM face, the outward face normal defines the local normal direction , and the face plane defines the tangential directions. Nearby FEM faces are searched for each concrete SPH particle. If the particle projection lies on a candidate face and the normal overlap is positive, contact is activated. The normal contact force is calculated as
Here, is the normal distance from particle i to the FEM face, is the particle radius, is the closing normal velocity, is the local normal penalty coefficient, and is the normal damping coefficient controlled by the contact damping ratio. The normal branch transfers compression only. Tangential sliding resistance is evaluated in the local tangent plane and limited by the effective Coulomb friction coefficient. The contact constants used in all validation and eccentric-impact cases were , , and .
Figure 2 summarizes the hybrid numerical model and the execution sequence of the GPU-parallel solver. The upper part identifies the SPH concrete beam and the FEM reinforcement, impactor, and supports used in the validation model. The lower part shows the calculation sequence from Taichi data preparation to SPH and FEM state updates, local force assembly, interface force transfer, explicit particle and nodal updates, and response extraction. The extracted histories and field quantities are later used to evaluate contact-force pulse response, sectional demand, energy distribution, and damage asymmetry.
Figure 2.
Hybrid SPH-FEM numerical model and GPU-parallel computational workflow used for impact simulations. The upper part shows the SPH concrete beam and the FEM reinforcement, impactor, and supports. The lower part shows Taichi data preparation, SPH and FEM state updates, interface force transfer, explicit particle and nodal updates, and response quantities extracted for eccentric-impact analysis. In the upper part, colors distinguish the SPH concrete, FEM reinforcement, impactor, and supports. In the lower part, boxes denote modules in the solution workflow, and arrows indicate the computational sequence and interface force transfer.
2.3. Material Models and Numerical Parameters
Concrete was described using the continuous surface cap model (CSCM) [40]. The model accounts for pressure-dependent response, tensile and shear damage, compressive compaction, and fracture-energy-based softening regularization. In the damage field figures, the plotted concrete damage is the CSCM scalar damage variable. It represents material degradation associated with tensile cracking, shear damage, and local crushing under fracture energy regularization. It is not a discrete crack width or crack path output. For the validation tests, the CSCM input parameters were generated from the measured compressive strength and elastic modulus of the specimen concrete. In the concrete-strength branch, the prescribed compressive strength was changed, and the derived CSCM parameters were updated consistently.
Reinforcement was modeled using a von Mises elastoplastic model. The impactor and support fixtures were represented by solid FEM bodies. The impactor density was assigned as an equivalent value so that the FEM body reproduced the total drop-weight mass. Steel–concrete bond was represented by a tabulated envelope with unloading and reloading rules.
Table 1 summarizes the main geometry, material, discretization, interface, and time-integration parameters of the baseline model. The same baseline discretization and interface settings were used for the central-impact validation cases and for the eccentric-impact simulation program. The variables changed in the parametric study were the prescribed impact velocity, concrete compressive strength, and impact eccentricity as defined in Section 3.
2.4. Validation Results and Response-History Comparison
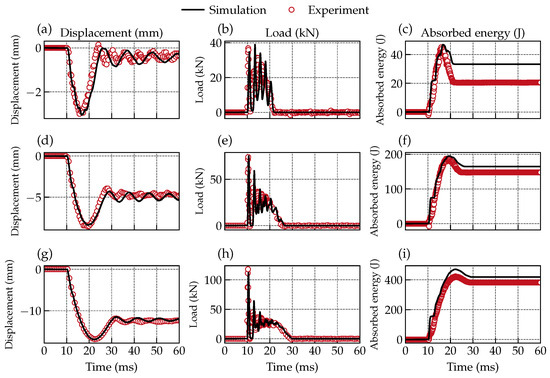
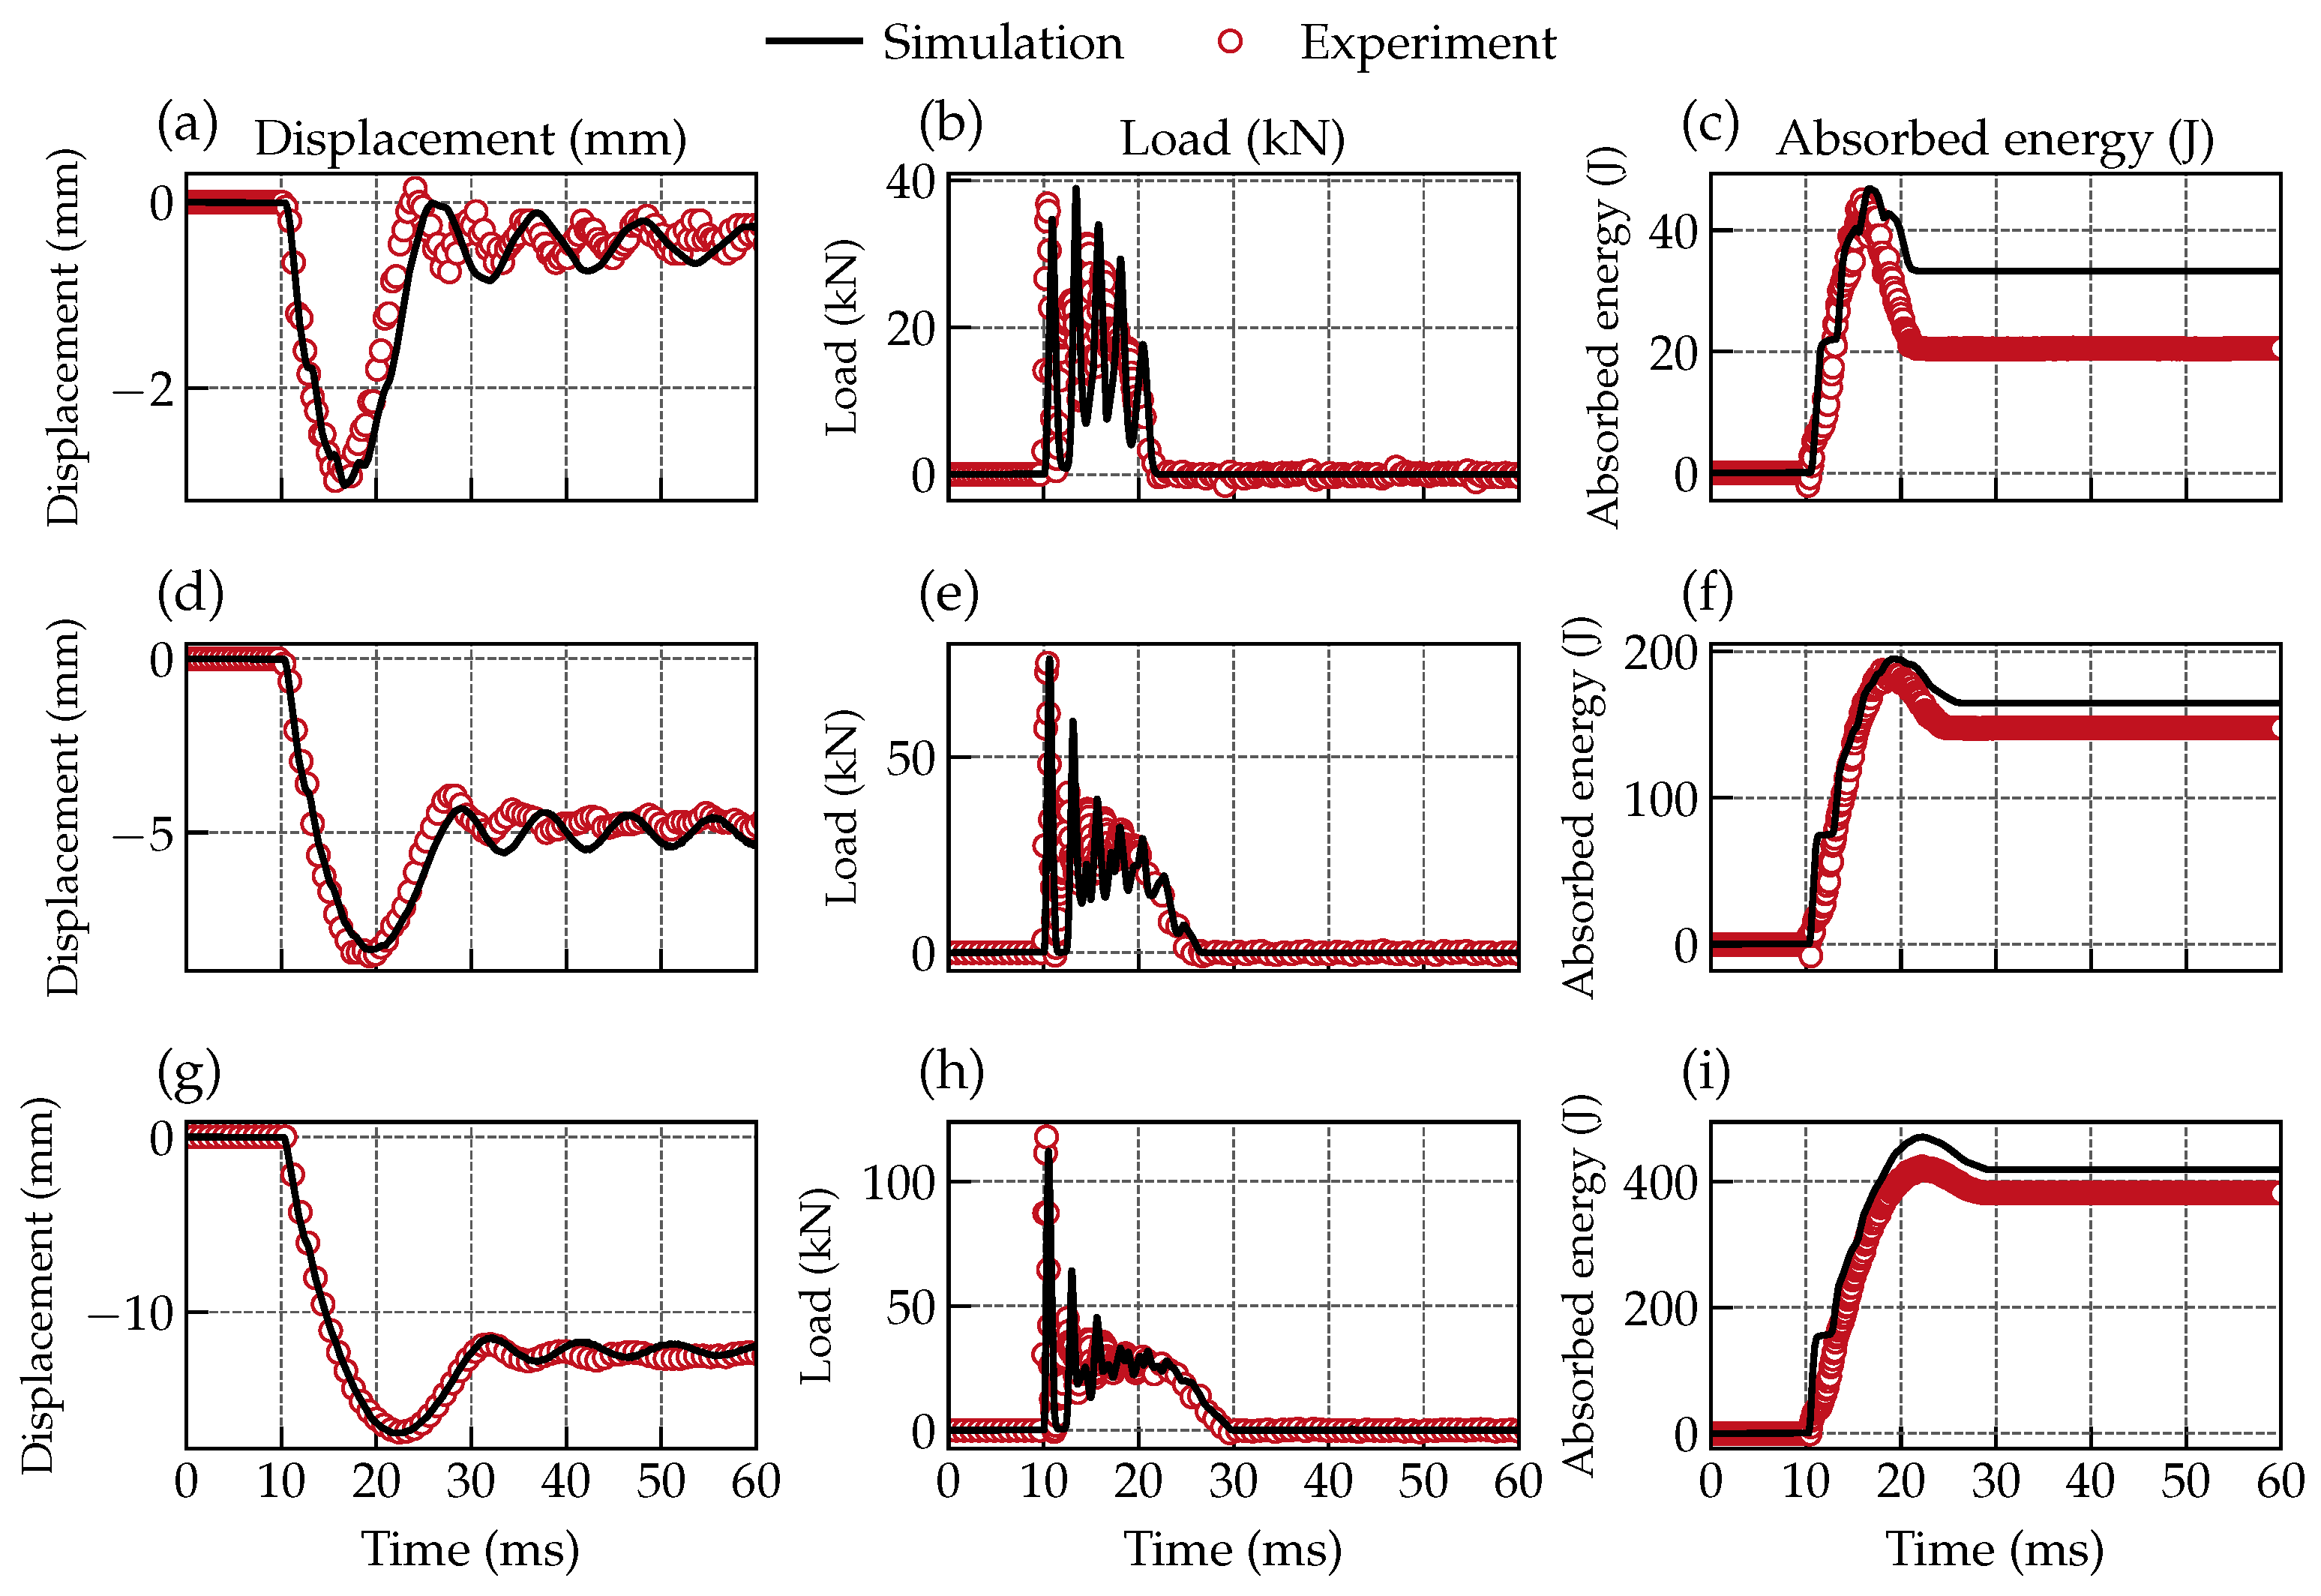
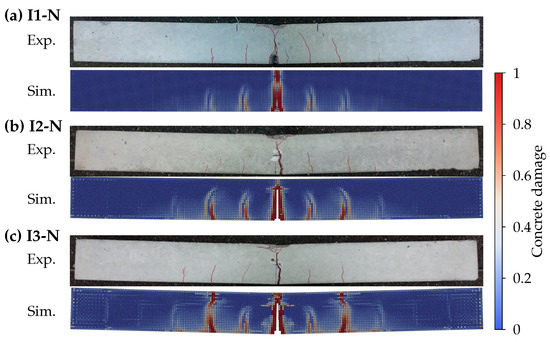
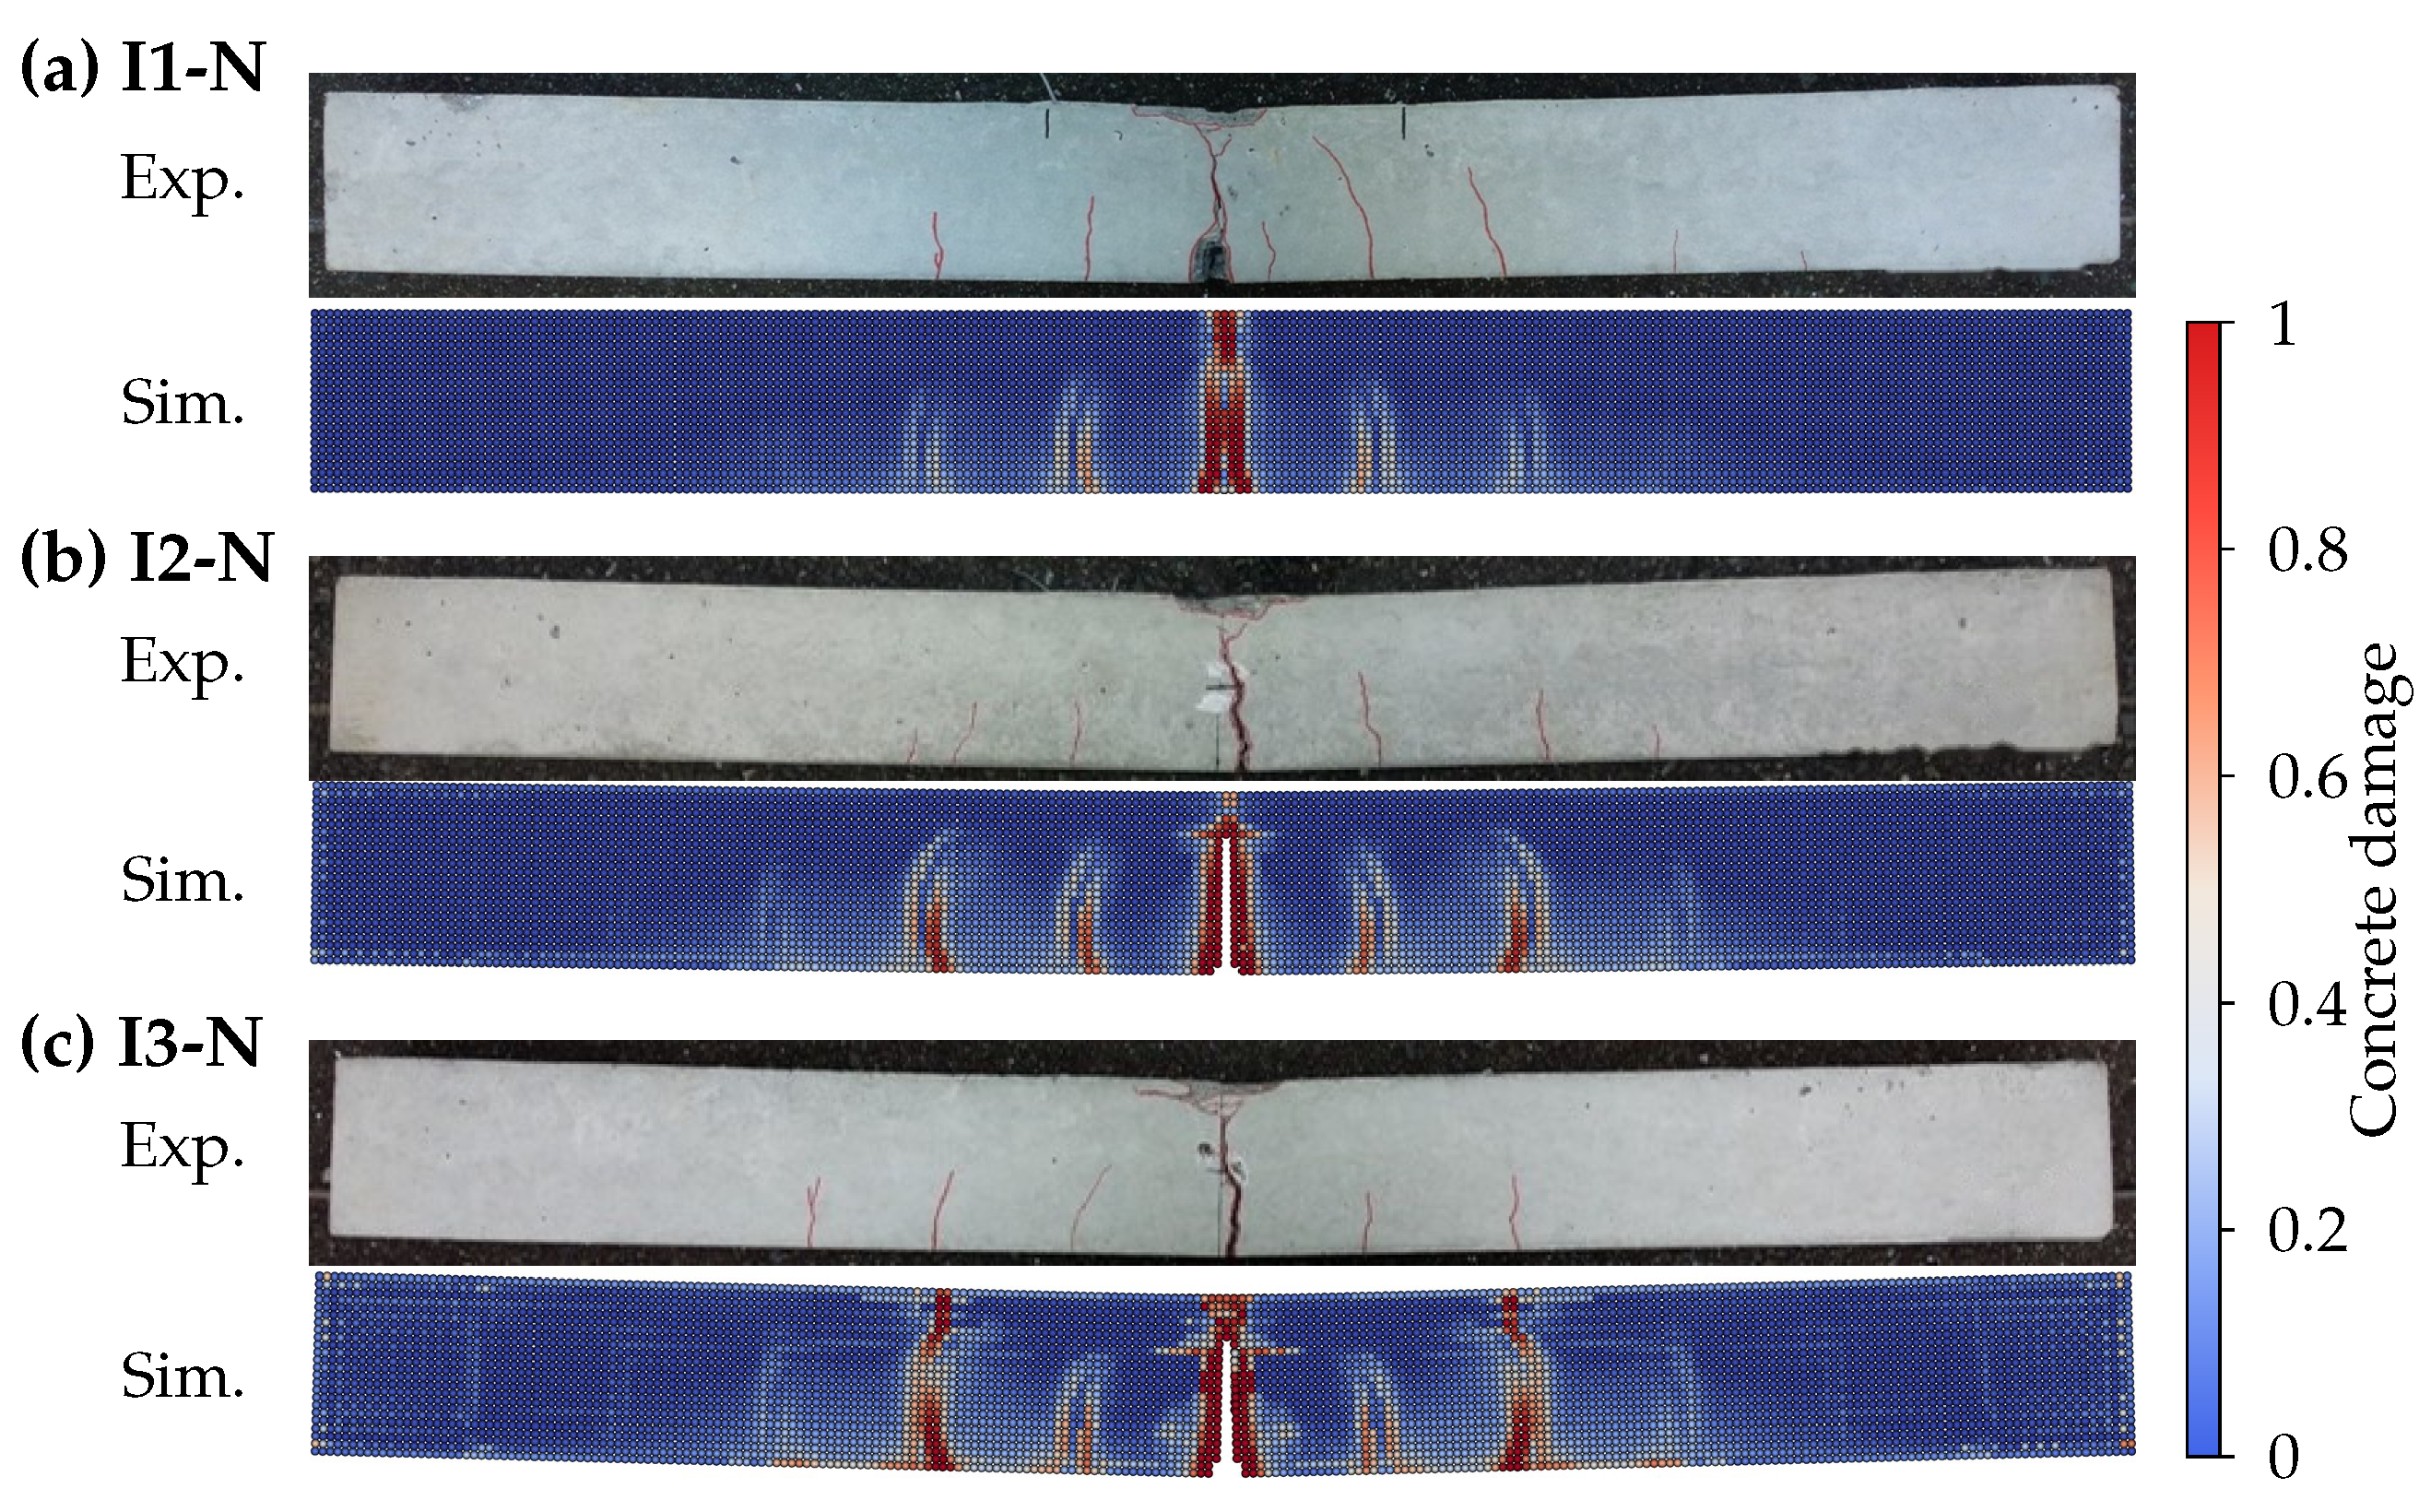
The representative validation test cases I1-N, I2-N, and I3-N were used to validate the impact response of the coupled SPH-FEM model. The validation is reported in three levels. Table 2 compares the main scalar response quantities, Figure 3 compares the displacement, impact-force, and absorbed-energy histories, and Figure 4 compares the observed crack patterns with the simulated damage fields. In Table 2, v denotes the impact velocity, denotes the maximum displacement, denotes the first peak impact force, and denotes the load-pulse duration. The error is reported as the absolute relative difference, .
Table 2.
Validation summary for representative validation test cases.
Figure 3.
Validation of displacement, impact-force, and absorbed-energy histories for representative validation test cases. Panels (a–i) correspond to I1-N, I2-N, and I3-N by row. The three columns show displacement, impact force, and absorbed energy. Red open circles denote experimental results, and black lines denote simulations.
Figure 4.
Experimental crack patterns and simulated concrete damage fields for representative validation test cases: (a) I1-N, (b) I2-N, and (c) I3-N. In each panel, the upper image shows the post-impact experimental crack pattern and the lower image shows the simulated concrete damage field. The color bar denotes the CSCM scalar concrete damage variable.
Table 2 shows good agreement between the experimental and simulated scalar responses. The errors are – for , – for , and – for . These comparisons indicate that the model captures the main displacement magnitude, initial impact-force scale, and force-pulse duration of the validation tests. They also establish the central-impact reference before the impact location is shifted in the eccentric-impact simulation program.
For the time-history comparison in Figure 3, absorbed energy is evaluated from the contact work of the impact force over the impact-point displacement. This gives a global force–displacement work history for validation against the measured impact response:
and the cumulative value for sampled histories is evaluated by the trapezoidal form:
Here, is the cumulative absorbed energy, is the impact onset time, t is the current time, is the integration variable, is the contact force, u is the impact-point displacement in the loading direction, the overdot denotes the time derivative, and j and k denote the time-sample index and the current sample, respectively. This global contact-work history provides the force–displacement energy quantity used for validation of the measured response. The regional absorbed-energy quantities used later for eccentric-impact energy-density analysis are extracted separately from the field histories. The later side-wise quantities are model-based internal deformation work indicators extracted from the simulated field histories.
Figure 3 compares the displacement, impact-force, and absorbed-energy histories. The simulation reproduces the displacement histories and the timing and magnitude of the main impact-force pulses for the three test velocities. The small lag is mainly associated with penalty-contact activation and local contact stiffness. The difference between the experimental force acquisition and the numerical force-output interval mainly affects curve smoothness and high-frequency contact-force details, with limited influence on the main lag. The common explicit time increment was . The time increment satisfies the Courant–Friedrichs–Lewy (CFL) condition for the adopted discretization. The agreement in displacement, first peak force, load-pulse duration, and absorbed-energy evolution provides the validation basis for the eccentric-impact simulations conducted in this study.
Figure 4 compares the experimental crack patterns with the simulated concrete damage fields. The experimental photographs show visible surface cracks, while the numerical contours show the CSCM scalar concrete damage variable. The contours are read as damage-zone maps. High-damage bands mark localized degradation associated with tensile cracking, shear damage, or crushing, not individual crack lines or crack-width measurements. In this qualitative comparison, the simulation captures the central damage zone and the wider damage distribution observed as the impact velocity increases from I1-N to I3-N.
2.5. Mesh Sensitivity Analysis for the I3-N Validation Test Specimen
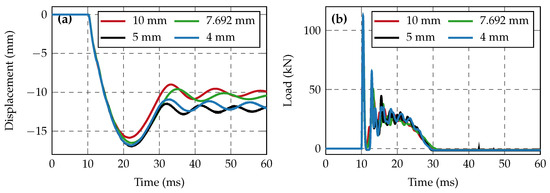
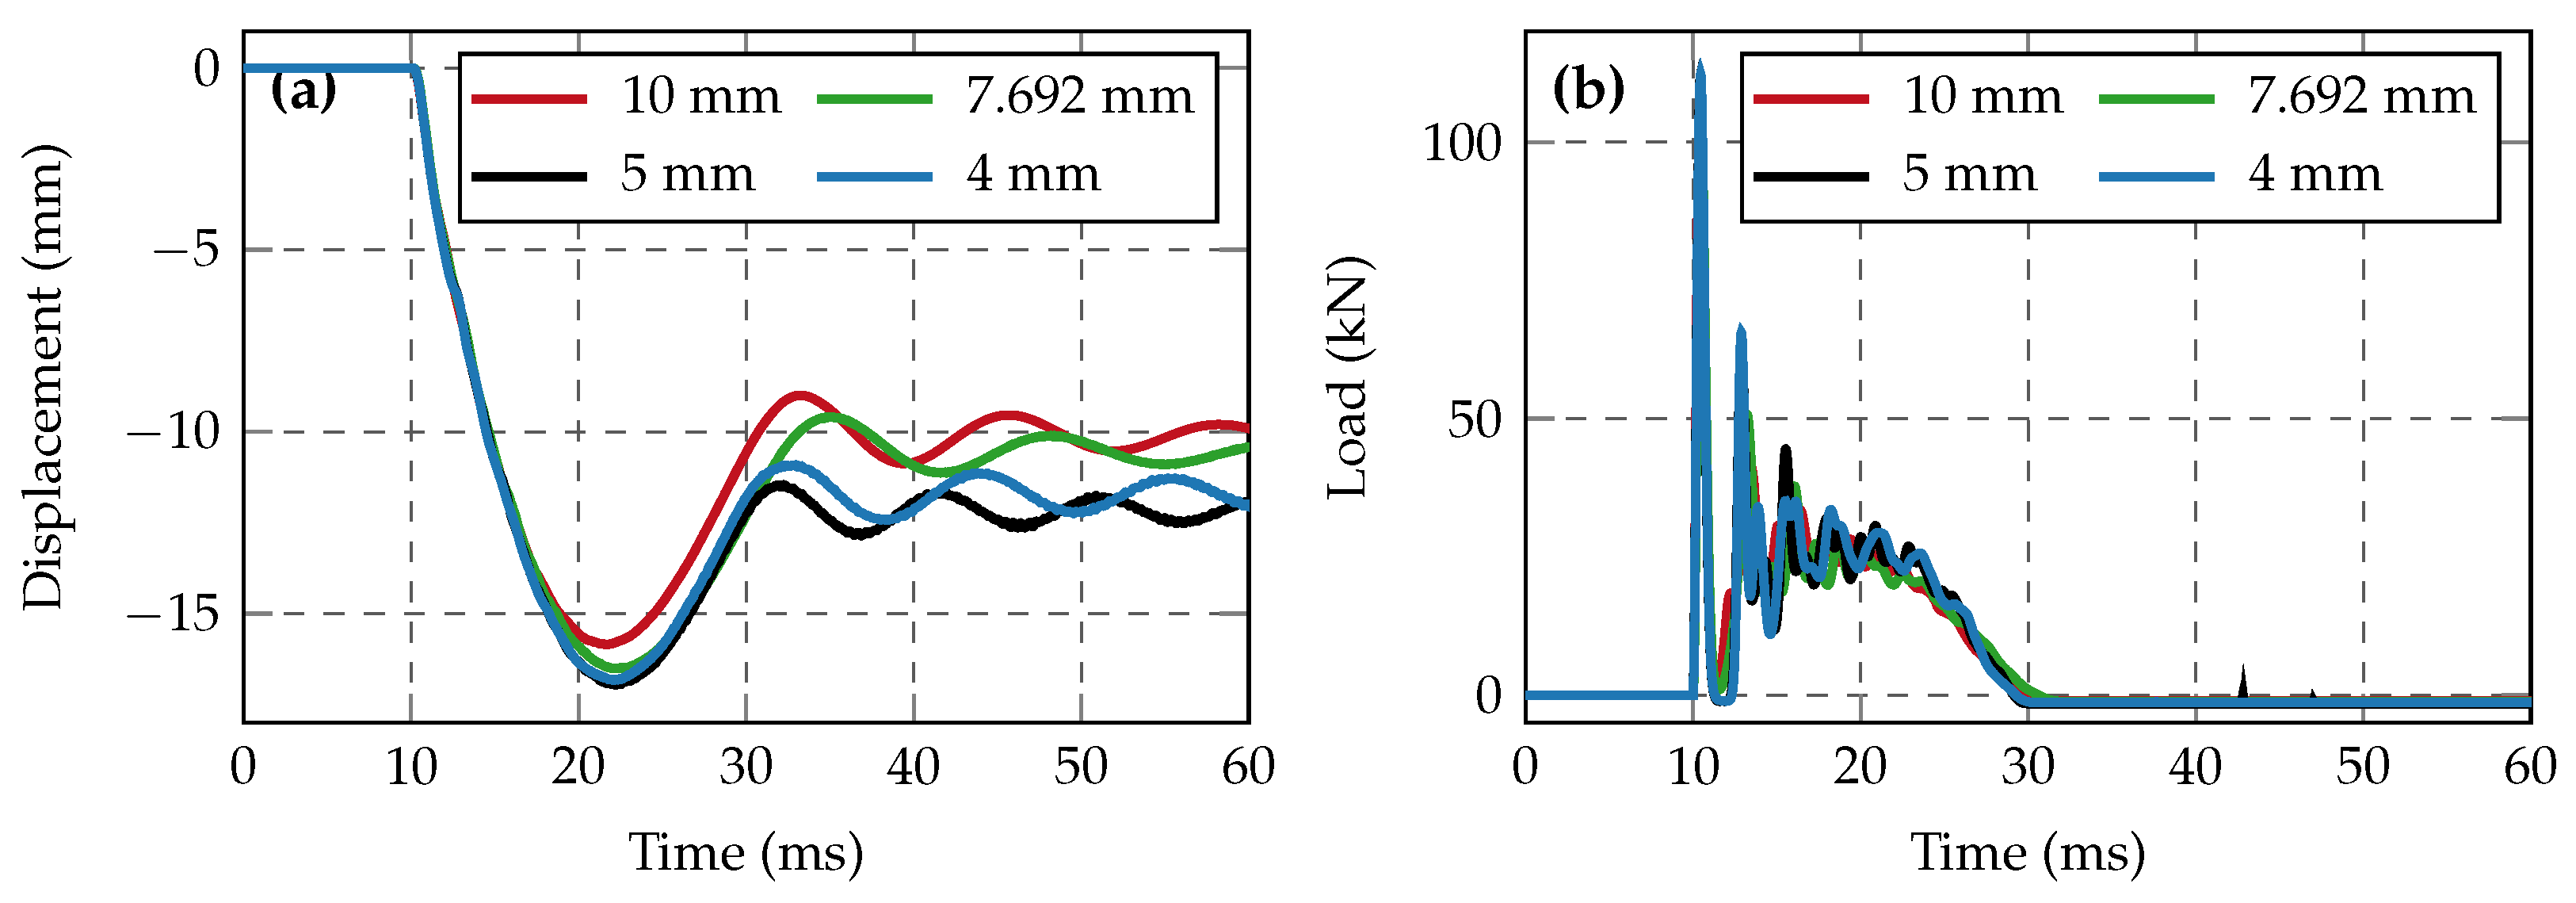
A representative mesh and particle-size sensitivity check was conducted for the I3-N central-impact test specimen, which corresponds to the , , and simulation case . Four discretization levels were compared: 10, , 5, and . Figure 5 compares the displacement and impact-force histories, and Table 3 summarizes the peak response quantities. As the discretization was refined to approximately , the displacement history, first impact-force peak, and peak displacement became nearly converged. The discretization required approximately for a single case, which was acceptable for the subsequent parametric simulations. Therefore, the mesh and particle size was adopted as the baseline discretization.
Figure 5.
Mesh and particle-size sensitivity histories for the I3-N central-impact test specimen (): (a) displacement history and (b) impact-force history.
Table 3.
Mesh and particle-size sensitivity results for the I3-N central-impact test specimen ().
3. Eccentric-Impact Simulation Program
3.1. Impact Eccentricity and Span Geometry
The support span is , where and are the left and right support coordinates. The midspan coordinate is
The impact eccentricity is the distance from the impact point to midspan:
The distances from the impact point to the left and right supports are
The shorter and longer impact-to-support distances are recorded as
In the discussion below, the two sides are described directly as the shorter-span side and the longer-span side.
For the full-span beam, . The central-impact case has and equal distances of from the impact point to the two supports. The eccentricity levels , , and correspond to , 200, and , respectively. If the impact point is shifted to the right of midspan, the distances from the impact point to the left and right supports are , , and . The corresponding shorter-span distances are , 300, and , and the longer-span distances are , 700, and . A shift to the left side gives the mirrored geometry with the same e, , and values.
Figure 6 shows the full-span beam model, the eccentricity levels, the velocity branch, and the concrete-strength branch used in the eccentric-impact simulations.
Figure 6.
Eccentricity levels and simulation parameters for the full-span eccentric-impact cases. The dashed line labeled CL marks the beam centerline and the reference for the eccentric offset. The dotted leader lines point to the component and parameter annotations. The arrows indicate the impact-velocity direction, i.e., the drop-weight falling direction. Green circles indicate the supports.
3.2. Full-Span Case Nomenclature and Parameter Matrix
The full-span eccentric-impact simulations were arranged to examine how impact velocity, concrete compressive strength, and impact eccentricity change the response of the validated RC beam model. The case names follow the format . Here, gives the impact velocity in , gives the concrete compressive strength in , and gives the eccentricity level. For example, denotes a full-span beam impacted at , with and . The levels , , , and correspond to , 100, 200, and , respectively.
Table 4 lists the processed full-span simulation cases. The velocity group changes the impact velocity from 2 to while keeping the concrete compressive strength at . The strength group changes the concrete compressive strength to 35 and at the fixed impact velocity of . The to cases belong to the velocity group and also provide the reference level for the strength comparison, so they are listed only once.
Table 4.
Parameter matrix of processed full-span simulation cases grouped by parameter group.
3.3. Response Indicators and Data Extraction
The eccentric-impact response is evaluated from four types of output: contact-force histories, sectional shear and bending-moment histories, absorbed energy on the two sides of the impact point, and damage-field snapshots. Together, these outputs show whether the shorter-span side develops larger sectional demand, absorbs more energy per unit length, and shows more visible damage than the longer-span side. This subsection defines how these outputs are extracted and converted into the response quantities used in the full-span discussion.
For contact-force histories, is the first force peak after impact onset. For the eccentric-impact cases, is the duration for which the impactor–beam contact force remains present during the main impact event. It is measured from impact onset to contact loss using the same force-history processing rule for all full-span cases.
Sectional force resultants are extracted every along the beam. At each calculation section, the recorded section resultants are the shear force and the bending moment . The first after impact are excluded from the envelope extraction to avoid letting the earliest contact shock dominate the sectional comparison. For every section on each side of the impact point, the largest absolute shear or bending-moment value reached after is recorded. Connecting these maximum values along the beam gives the shear and bending-moment envelopes. The envelopes therefore show the maximum sectional demand that may develop at each position, not the distribution at one single time.
In the formulas, subscript n refers to the shorter-span side and subscript f refers to the longer-span side. The peak shear envelopes on the two sides are
The corresponding bending-moment envelopes are
In the following text and tables, , , , and are used as shortened names for these four envelope values. For , both halves are . When an eccentric case is compared with , the half span on the same side as the eccentric shift is used as the baseline.
Two shear comparisons are made from these envelope values. The ratio tells whether the shorter-span side carries more shear than the longer-span side in the same case. The amplification shows how many times the shorter-span-side shear increases after the impact point moves away from midspan, using the central-impact case with the same velocity and concrete strength as the baseline:
The bending-moment ratio is calculated in the same way, using the moment envelope on the shorter-span side divided by that on the longer-span side:
The ratio indicates whether bending demand follows the same side-wise trend as shear demand.
Absorbed energy is converted to energy per unit span length before comparing the two sides. This is needed because one side becomes shorter and the other becomes longer after the impact point moves away from midspan. The regional energies and are extracted from the simulation field-output histories using the section-energy post-processing. Each SPH particle or FEM cell is assigned to one side according to its initial position, and this assignment is kept unchanged during the post-processing. For each output interval, the positive stress-work increment on side r is accumulated as
Here, q denotes a concrete SPH particle or reinforcement FEM cell, is its initial volume, is the average stress over output interval m, and is the strain increment over the same interval. Only positive increments are added, so the value represents accumulated absorbed deformation work rather than unloading recovery. The final absorbed energies on the shorter-span and longer-span sides are and , respectively. The absorbed energies per unit span length are
The shorter/longer energy-density ratio and the shorter-span-side energy-density amplification are
The ratio compares the absorbed energy per unit length on the shorter-span side with that on the longer-span side in the same case. The amplification shows how many times the shorter-span-side absorbed energy per unit length increases after the impact point moves away from midspan, using the central-impact case with the same impact velocity and concrete strength as the baseline.
The quantities , , , and are model-based post-processing indicators for comparing deformation-work localization within the simulation. They describe how the simulated internal work is distributed between the shorter-span and longer-span sides.
Damage and fragmentation are evaluated using selected damage-field snapshots, detached-fragment visualization, and splashed-particle statistics. The snapshots show local crushing below the impact point, damage spreading toward the shorter-span side, tensile-side cracking near the beam bottom, damage near the support, and detached fragment patterns. To quantify detached fragments, concrete SPH particles in the final frame that were located outside the main beam body and had a maximum absolute relative velocity component greater than were counted as splashed particles. The count records detached fragments in the final morphology and is read together with the scalar damage contour.
Table 5 summarizes the response quantities used later for the full-span eccentric-impact cases.
Table 5.
Full-span response quantities used in the eccentric-impact analysis.
The comparison with matched short-span reference beams is defined separately in Section 3.4.
3.4. Matched Short-Span Reference Cases
The matched short-span reference cases compare the shorter-span side of an eccentric full-span beam with a separate symmetric short-span beam. Close full-span and reference responses indicate a mainly local span effect, whereas larger full-span demand indicates that the longer-span side and original full-span boundary condition still affect the shorter-span-side response.
The comparison checks whether the symmetric short-span beam reaches the shorter-side demand obtained in the full-span eccentric beam. Any larger full-span demand reflects remaining effects of the longer span, support restraint, participating mass, and asymmetric damage.
For each eccentricity level , a reference level is introduced. The reference beam uses the same impact velocity and concrete strength as the paired full-span eccentric case. Its support span is chosen so that one half of the reference span is equal to the shorter impact-to-support distance of the paired full-span case:
The same end extension beyond each support is retained, so the total beam length of the reference model is . The reference set is prepared for the , and cases used in the matched comparison. Table 6 lists the paired cases and geometries.
Table 6.
Matched short-span reference cases and paired full-span eccentric cases.
Figure 7 shows the three matched short-span reference geometries used for this comparison.
Figure 7.
Matched short-span reference geometries: (a) , (b) , and (c) .
The comparison is made with actual shear and bending-moment values in physical units. For pair k, the full-span values are taken from the shorter-span side of the full-span eccentric beam:
The reference values are taken from the matching half of the symmetric short-span reference beam:
Here, and are the largest post- shear and bending-moment envelope values on the shorter-span side of the full-span eccentric case. and are the corresponding largest post- values in the matched half of the reference case.
The difference between the full-span case and the matched reference is reported as
A positive difference means that the full-span eccentric beam produces a larger value than the symmetric short-span reference. These differences are simple subtractions of the two actual values.
When envelope profiles are compared, the local coordinate s starts from the impact section and increases toward the compared support. If the reference half span is drawn on the opposite side, its profile is mirrored onto the same positive s direction. This lets the two local-span profiles be read on the same coordinate.
The matched-reference comparison uses three types of output. The first is the peak shear and bending-moment demand: and are taken from the shorter-span side of the full-span eccentric beam, and and are taken from the matched half span of the symmetric short-span reference beam. Their differences, and , show whether the full-span eccentric beam develops larger local demand than the reference beam with the same shorter span.
The second output is the local envelope profile plotted along s, which shows where the shear and bending-moment differences occur along the short span. The third output is the paired final damage field, which shows whether the difference in sectional demand is accompanied by more connected cracking, crushing, or detached fragments in the full-span eccentric beam.
4. Results and Discussion
4.1. Full-Span Contact-Force Overview
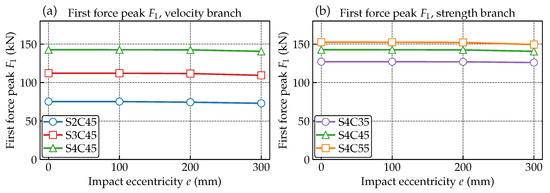
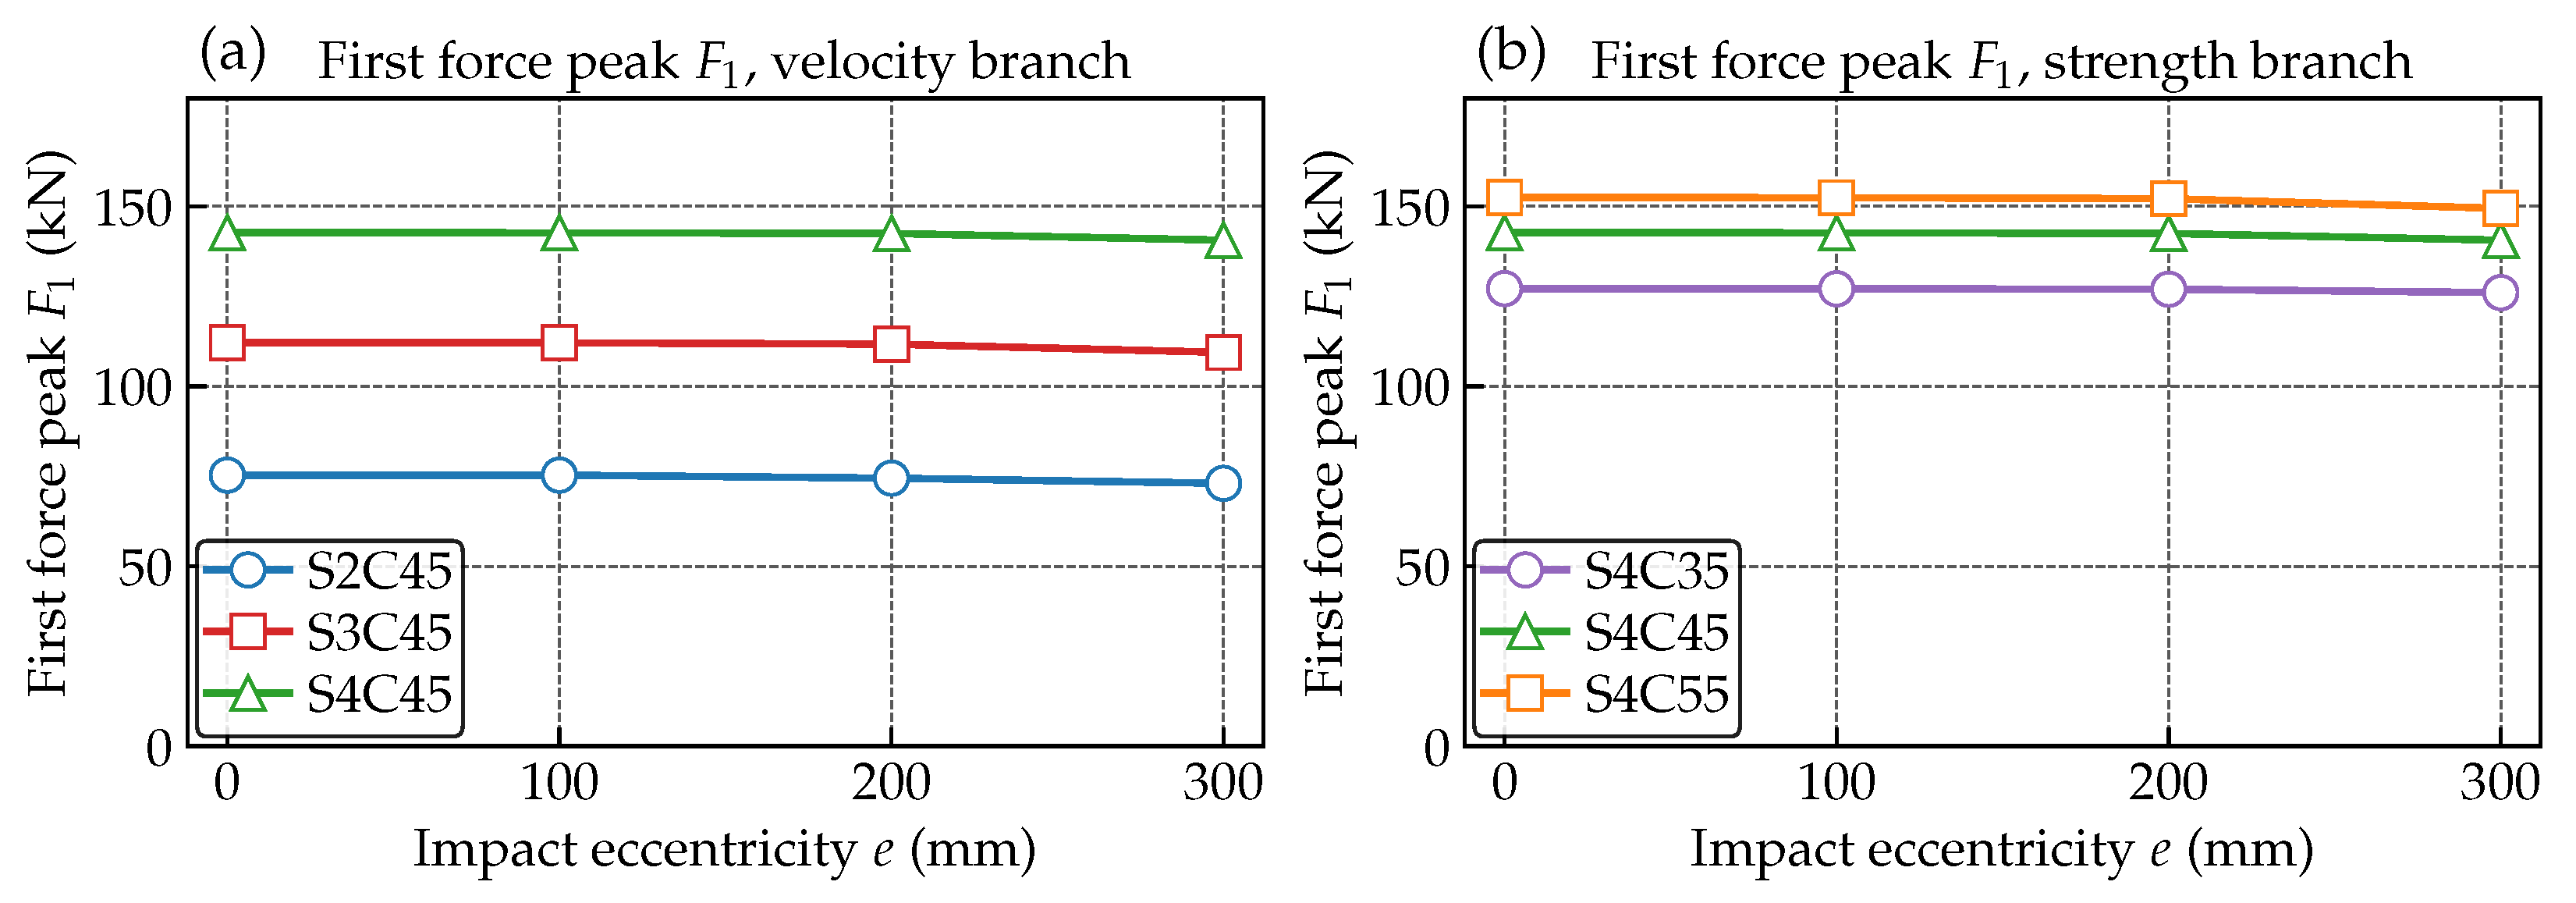
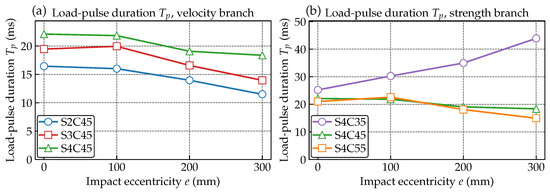
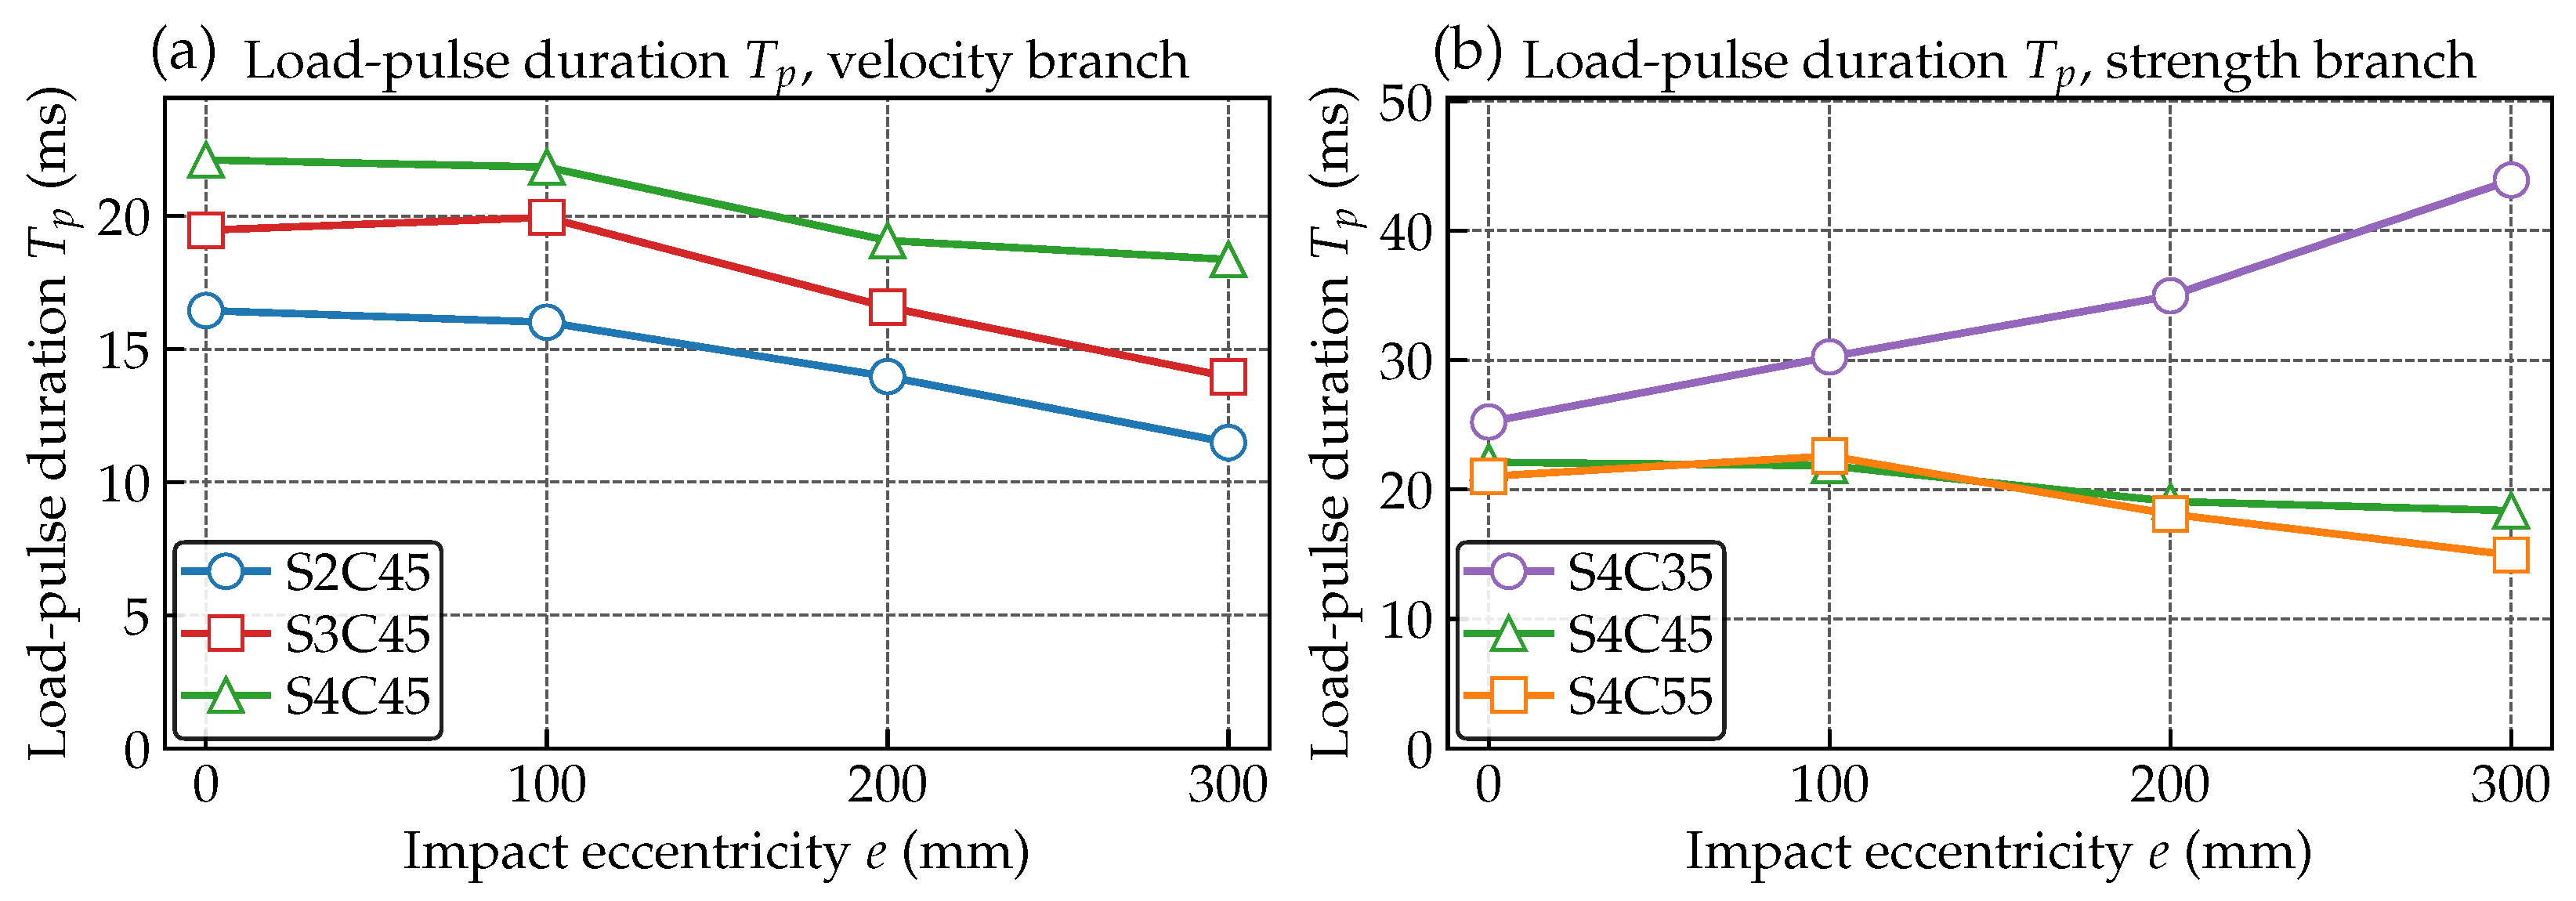
Table 7 lists two contact-force quantities for the full-span cases: the first force peak and the duration of the main contact pulse. Figure 8 and Figure 9 show how these two values change as the impact point moves away from midspan.
Table 7.
Full-span contact-force response quantities.
Figure 8.
Full-span first force peak versus impact eccentricity. Panel (a) shows the velocity branch at , and panel (b) shows the concrete-strength branch at .
Figure 9.
Full-span load-pulse duration versus impact eccentricity. Panel (a) shows the velocity branch at , and panel (b) shows the concrete-strength branch at .
The first force peak changes little as the impact point moves away from midspan. From central impact to the eccentric case, the first force peak decreases by , , and for the , , and velocity groups. In the strength branch, the corresponding decreases are , , and for , , and . These small changes indicate that the later shear, energy, and damage redistribution is governed mainly by the post-peak load-transfer process.
In the velocity branch, the main contact pulse becomes shorter as the impact point moves farther from midspan. The cases decrease from at central impact to at the eccentric case. The cases decrease from to , after a small increase at the eccentric case. The cases decrease from to . Thus, in the velocity branch, larger eccentricity shortens the main contact pulse.
The concrete-strength branch gives a different pattern. The low-strength cases keep contact for longer as eccentricity increases, with the pulse duration increasing from at central impact to at the eccentric case. By contrast, the cases decrease from to , and the cases decrease from to after a small increase at .
The strength branch shows that and are controlled by different response stages. The first force peak is mainly governed by the initial impact condition and local contact stiffness, before the asymmetric full-span load path has fully developed. The contact duration is controlled more by post-peak damage evolution. In the low-strength S4C35 cases, earlier local crushing and faster contact-stiffness degradation extend the low-amplitude contact stage before rebound or separation, increasing from to . In the higher-strength cases, local crushing is more limited and the drop weight separates more rapidly.
4.2. Sectional Shear and Bending-Moment Redistribution
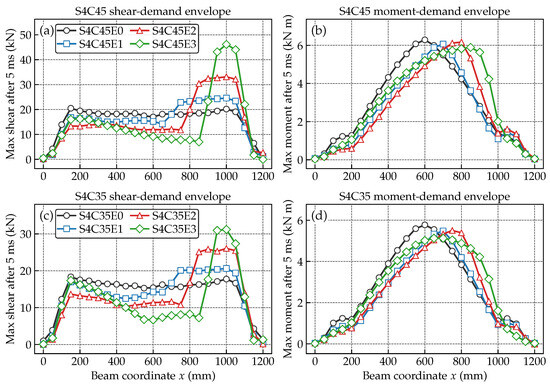
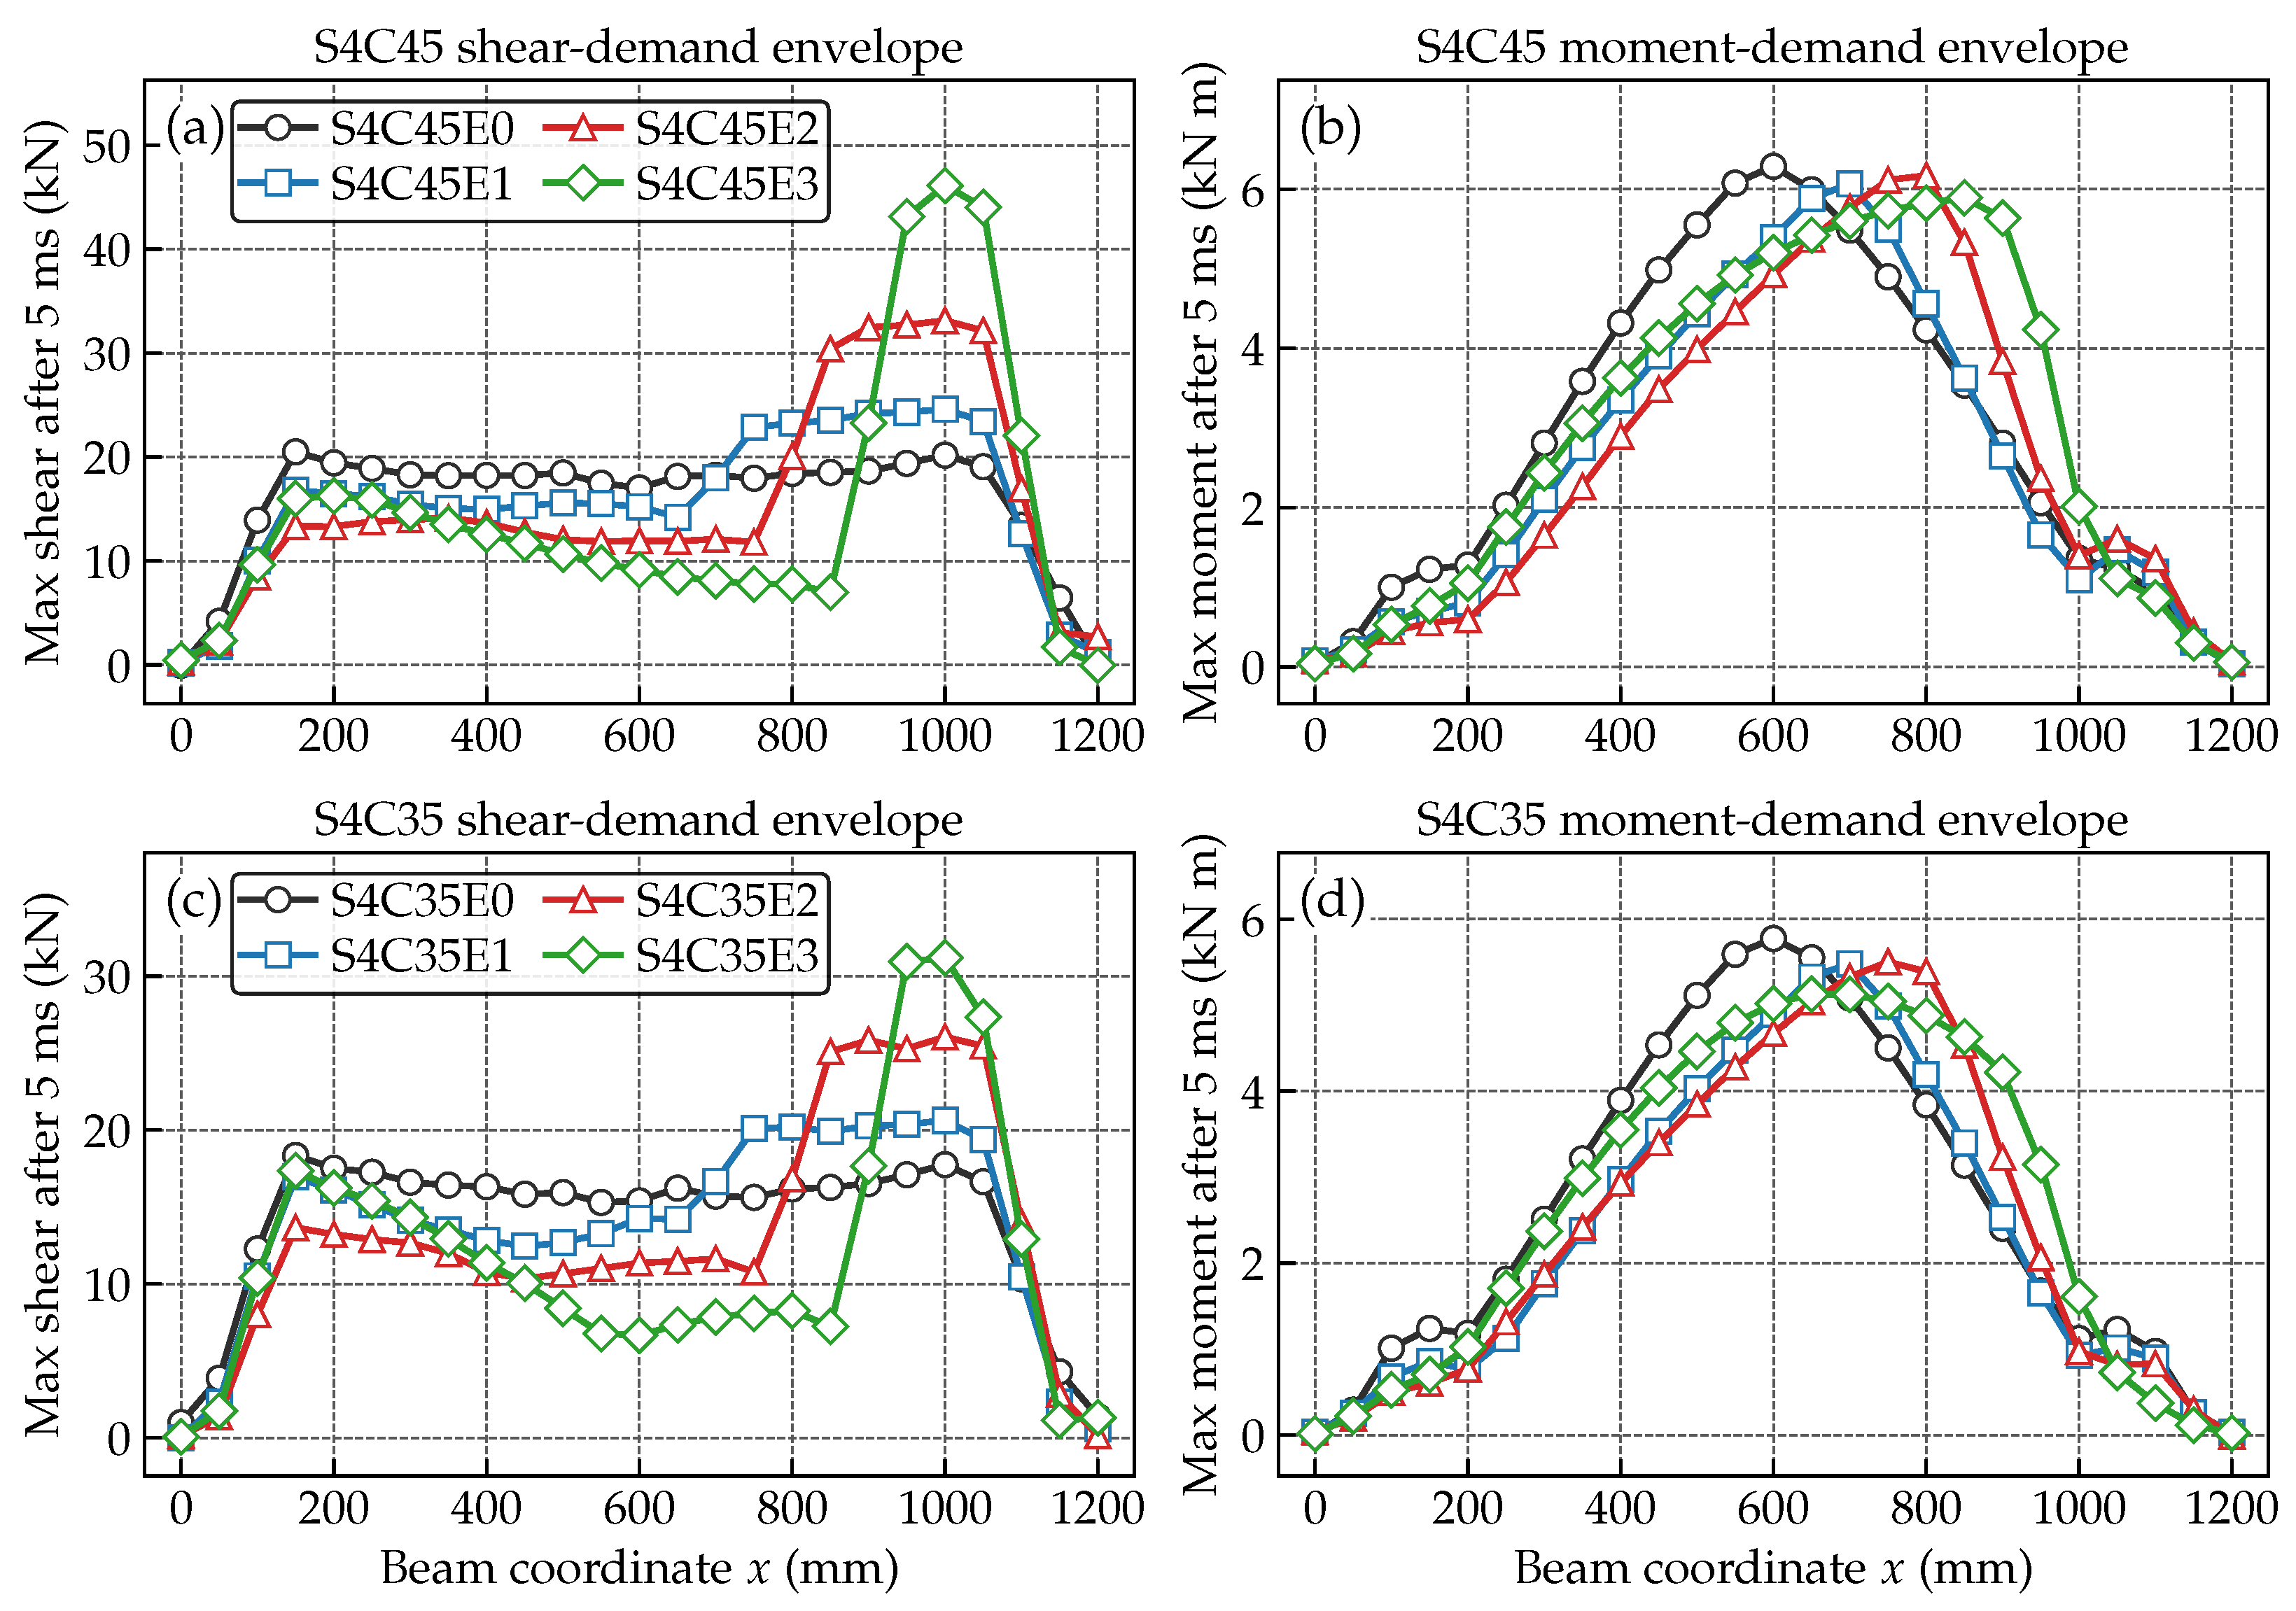
Figure 10 shows where the largest shear and bending-moment values appear along the beam after the early contact shock. These curves are maximum envelopes. At each section position, the plotted value is the largest absolute shear or bending moment recorded after . This envelope view shows where the beam may experience its maximum sectional demand during the impact response.
Figure 10.
Sectional shear and bending-moment demand envelopes for representative full-span eccentric cases. Panels (a,b) show the group, and panels (c,d) show the group. Values are post- maximum absolute section resultants along the beam coordinate.
The sectional plots focus on the cases because these cases show the clearest side-to-side redistribution and also allow the concrete-strength comparison.
To place the sectional envelopes in Table 8 on an engineering scale, JSCE-based static nominal references were calculated using the same section and actual/model material properties. The reference values are and for C35, and and for C45. Compared with these static references, the high-eccentricity cases reach or exceed the shear-reference scale, while the bending-moment demand does not increase with eccentricity.
Table 8.
Sectional demand envelopes and shorter/longer comparisons for selected full-span cases.
For the group, Table 8 shows a clear shift of shear toward the shorter-span side. At the eccentricity level, the shear on the shorter-span side becomes times the central-impact value. In the same case, the shorter-span shear is times the longer-span shear. The bending moment does not concentrate in the same way. At the largest eccentricity, the shorter-span bending moment is times the longer-span value, so bending remains slightly larger on the longer-span side. This contrast indicates that the eccentric response is governed mainly by shear redistribution. The sectional forces do not increase uniformly.
The concrete-strength branch gives the same main contrast. At the eccentricity level, the shorter-span shear is , , and times the corresponding central-impact value for , , and , respectively. In the same three cases, the shorter-span shear is , , and times the longer-span shear. The bending-moment comparison is much weaker, with the shorter-span moment remaining between and times the longer-span moment. These values show a shear-dominated redistribution toward the shorter-span side, while bending remains a broader beam-scale response.
The group also shows why the shorter-span shear should be read together with the shorter/longer shear comparison. From the to the eccentric case, the shorter-span shear increases from to . At the same time, the longer-span shear also rises from to . Because both sides increase, the shorter-to-longer shear comparison decreases slightly, from to , even though the shorter-span shear itself still increases. The longer-span rise is a late-stage feature of the low-strength, highly damaged case, while the dominant transfer route remains on the shorter-span side. From to , the contact duration increases from to , the splashed-particle count increases from 8205 to 9532, and the longer-side support-reaction impulse increases from to . These changes indicate stronger longer-span participation during the later damaged response.
In , this participation appears as a local peak in the post- shear envelope near , where the section history gives at about .
The envelope profiles in Figure 10 show the spatial form behind the values in Table 8. In the group, the shear envelope becomes increasingly concentrated along the shorter-span transfer route as eccentricity increases, with the largest separation appearing at the eccentricity level. The bending-moment envelopes do not show the same concentration. Their peaks remain distributed over a wider beam-scale region. For S4C35, the damage and fragment fields help explain the longer-span-side envelope feature.
4.3. Shorter-Span Absorbed-Energy Density Localization
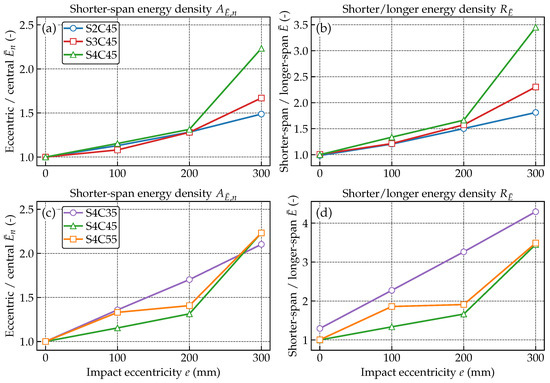
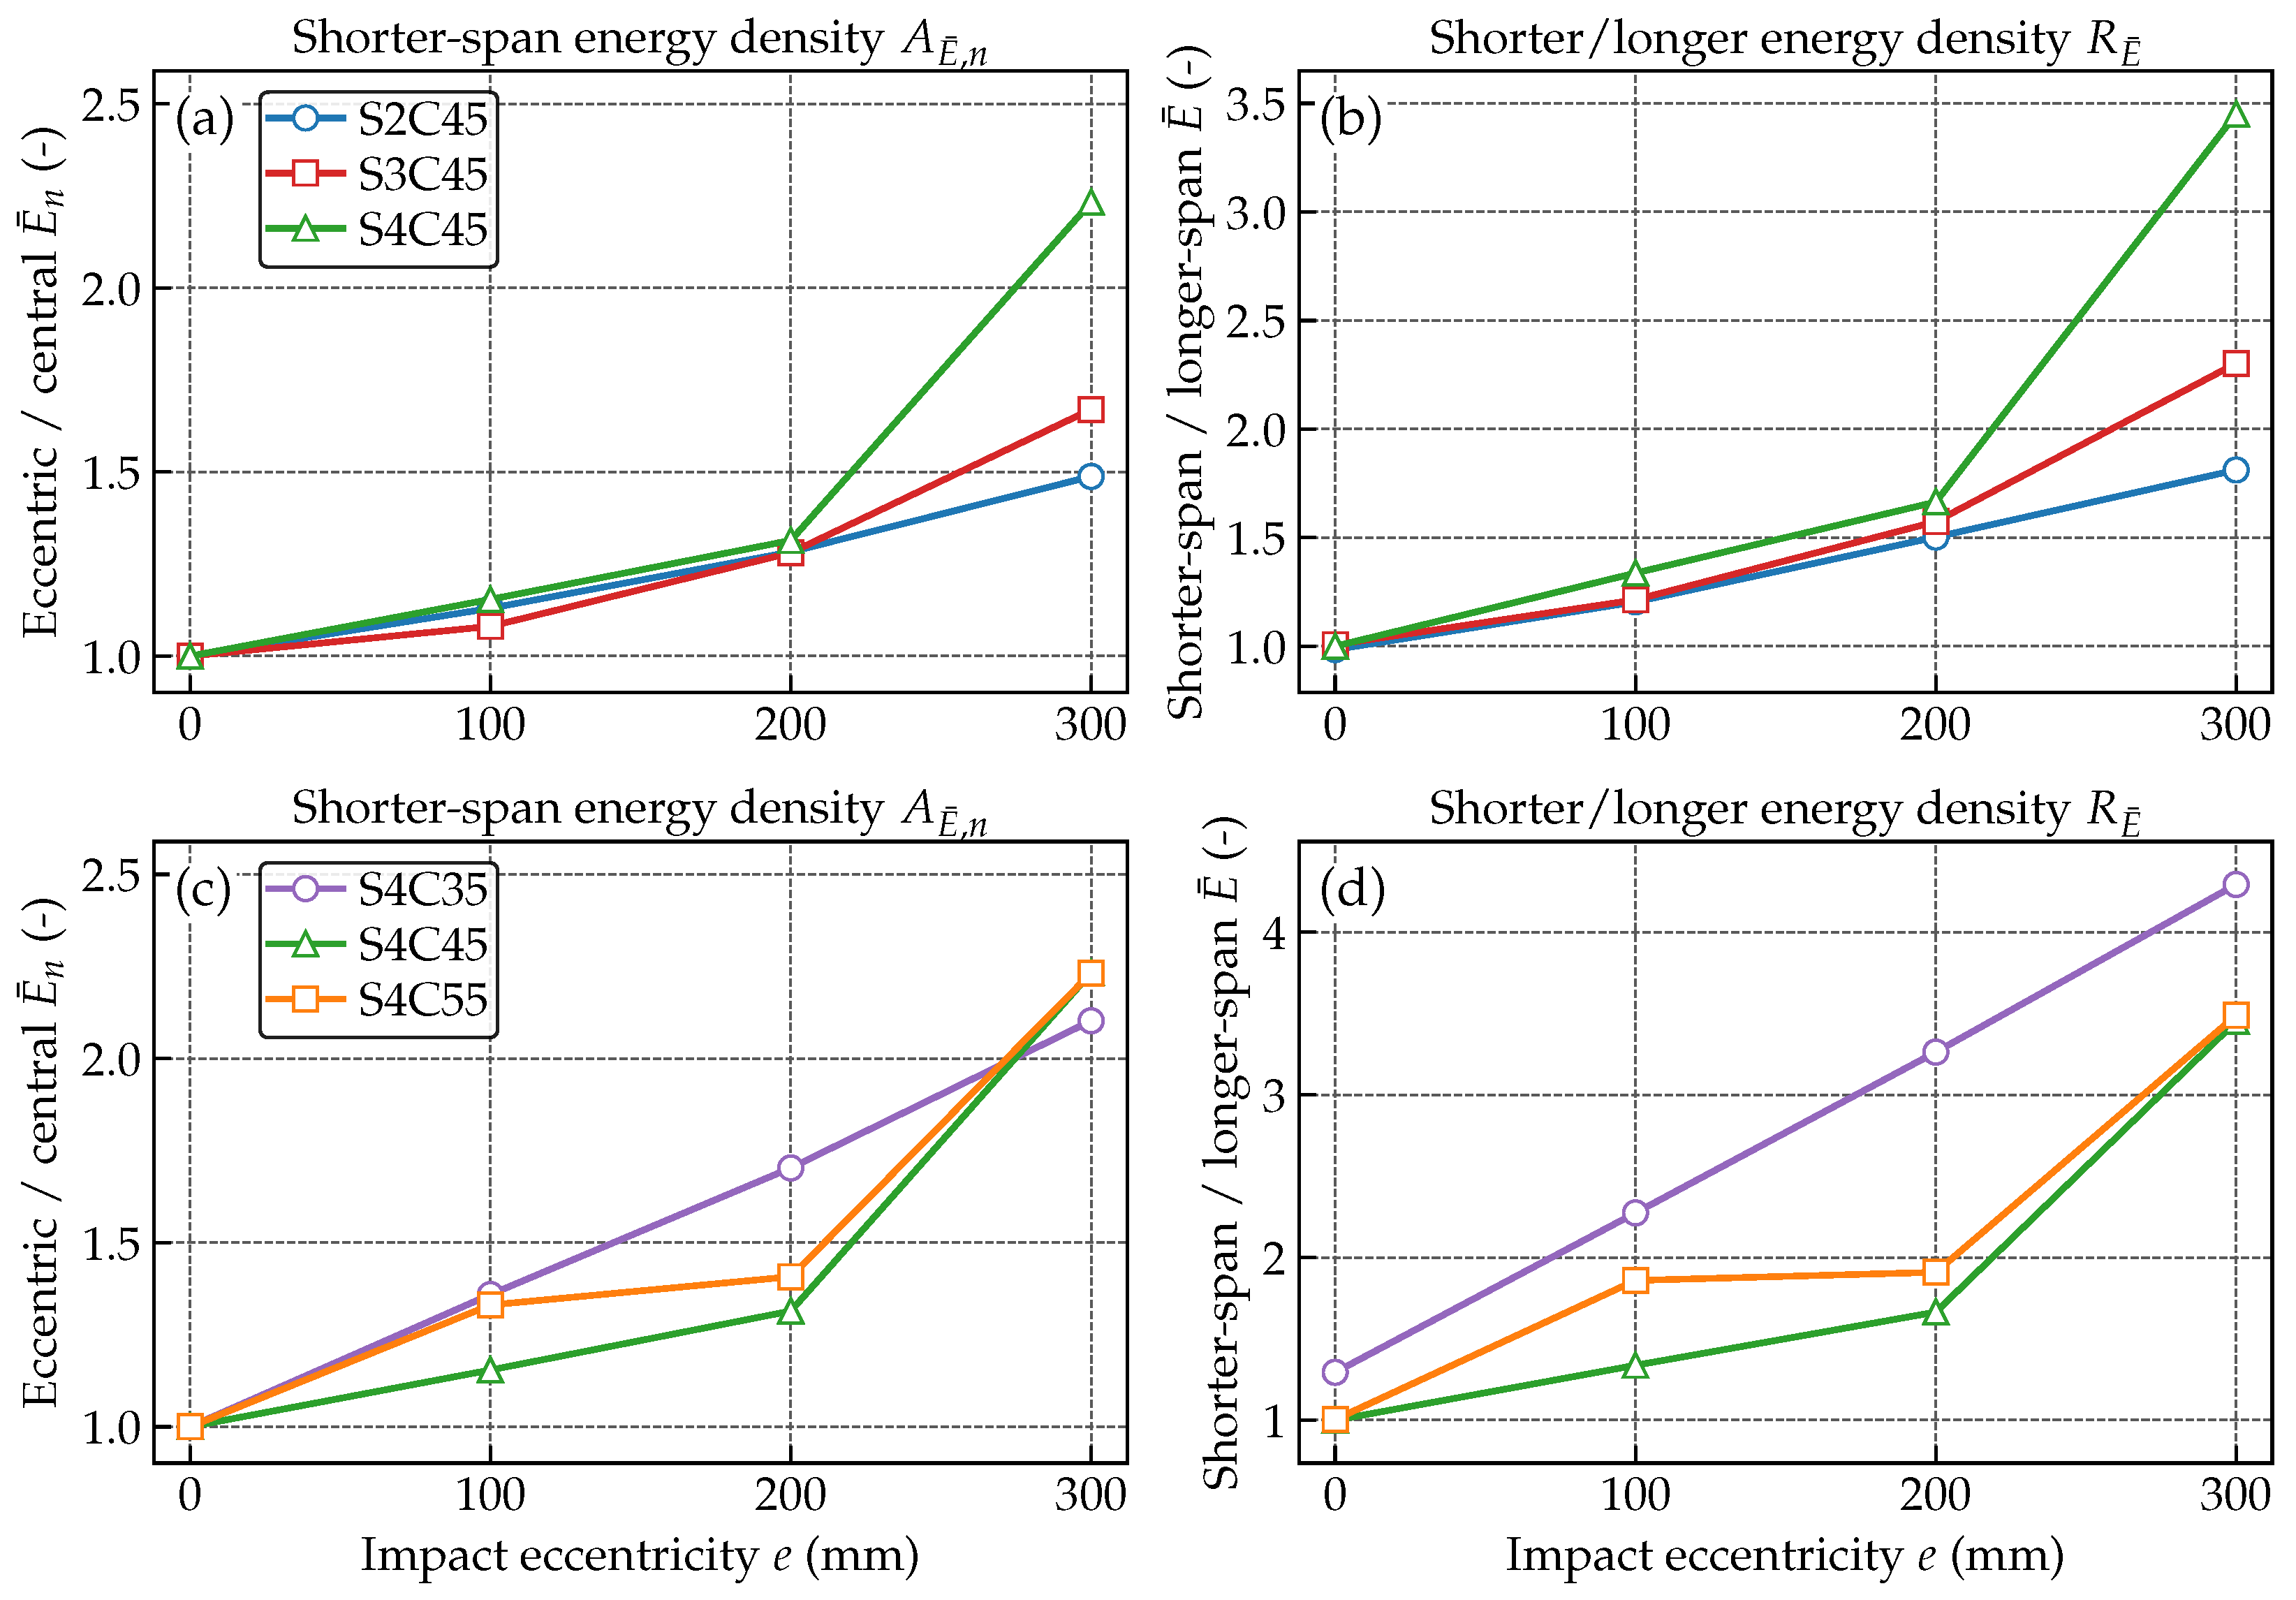
Figure 11 compares absorbed energy per unit span length, because the two sides of an eccentric beam have different lengths. The left-column plots show how many times the shorter-span-side absorbed energy per unit length increases after the impact point moves away from midspan. The right-column plots compare the absorbed energy per unit length on the shorter-span side with that on the longer-span side in the same case.
Figure 11.
Shorter-span absorbed energy density trends. Panels (a,b) show the velocity branch at , and panels (c,d) show the strength branch at . The left column gives the increase relative to the corresponding central-impact case, and the right column gives the shorter-span/longer-span comparison.
In the velocity branch, both energy comparisons increase as the impact point moves farther from midspan. At the eccentricity level, the absorbed energy per unit length on the shorter-span side is , , and times the corresponding central-impact value for , , and , respectively. In the same cases, the shorter-span side carries , , and times the absorbed energy per unit length of the longer-span side.
In the concrete-strength branch, the increase relative to the central-impact case remains close to to at the eccentricity level. The side-to-side comparison separates the strength groups more clearly. For , the shorter-span side carries times the absorbed energy per unit length of the longer-span side. The corresponding values are for and for .
The side-wise deformation-work results are consistent with the shear-envelope redistribution. The shorter-span side carries more shear and also absorbs more deformation work per unit length. The low-strength branch is especially sensitive in the side-to-side energy comparison, which explains why the damage fields later show more visible detached fragments.
4.4. Matched Short-Span Reference Comparison
The matched short-span cases compare the shorter-span side of the eccentric full-span beam with a separate symmetric short-span beam. Each reference beam has one half span equal to the shorter impact-to-support distance of its paired full-span case. The comparison uses shear and bending-moment values in physical units, so the two beams can be read directly.
The available matched-reference simulations cover the , 35 and cases. The full-span cases are retained in the strength comparison, but paired short-span references were not prepared for that strength level.
Table 9 compares the peak shear and bending-moment demand of each full-span eccentric case with its matched short-span reference. The table reports the actual values and their arithmetic differences. The shear and bending-moment trends are considered separately because the two resultants respond differently to the matched-span condition.
Table 9.
Peak shear and bending-moment demand in full-span eccentric cases and matched short-span references.
For the group, the case and especially the case show the clearest increase in shorter-span shear. In , the full-span eccentric beam reaches in shorter-span shear, while the matched short-span reference reaches . The difference is . This difference shows that the shorter-side shear demand in the full-span eccentric beam is still affected by the longer span, support restraint, participating mass, and asymmetric damage. The bending-moment difference is smaller in relative importance: the full-span value is , the reference value is , and the difference is . The case shows only a marginal shear increase, and the bending-moment differences remain secondary compared with the shear change.
For the group, the shorter-span shear is close to the reference at , increases at , and becomes clearly larger at . The pair gives for the full-span eccentric beam and for the reference. The pair gives and . The pair gives and . The bending-moment difference is local and secondary. The 100 and cases show only marginal moment differences, while the case shows a local moment increase that is still weaker than the shear separation.
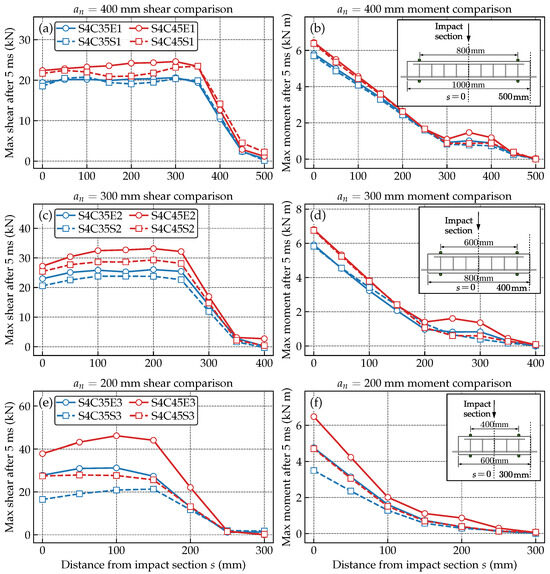
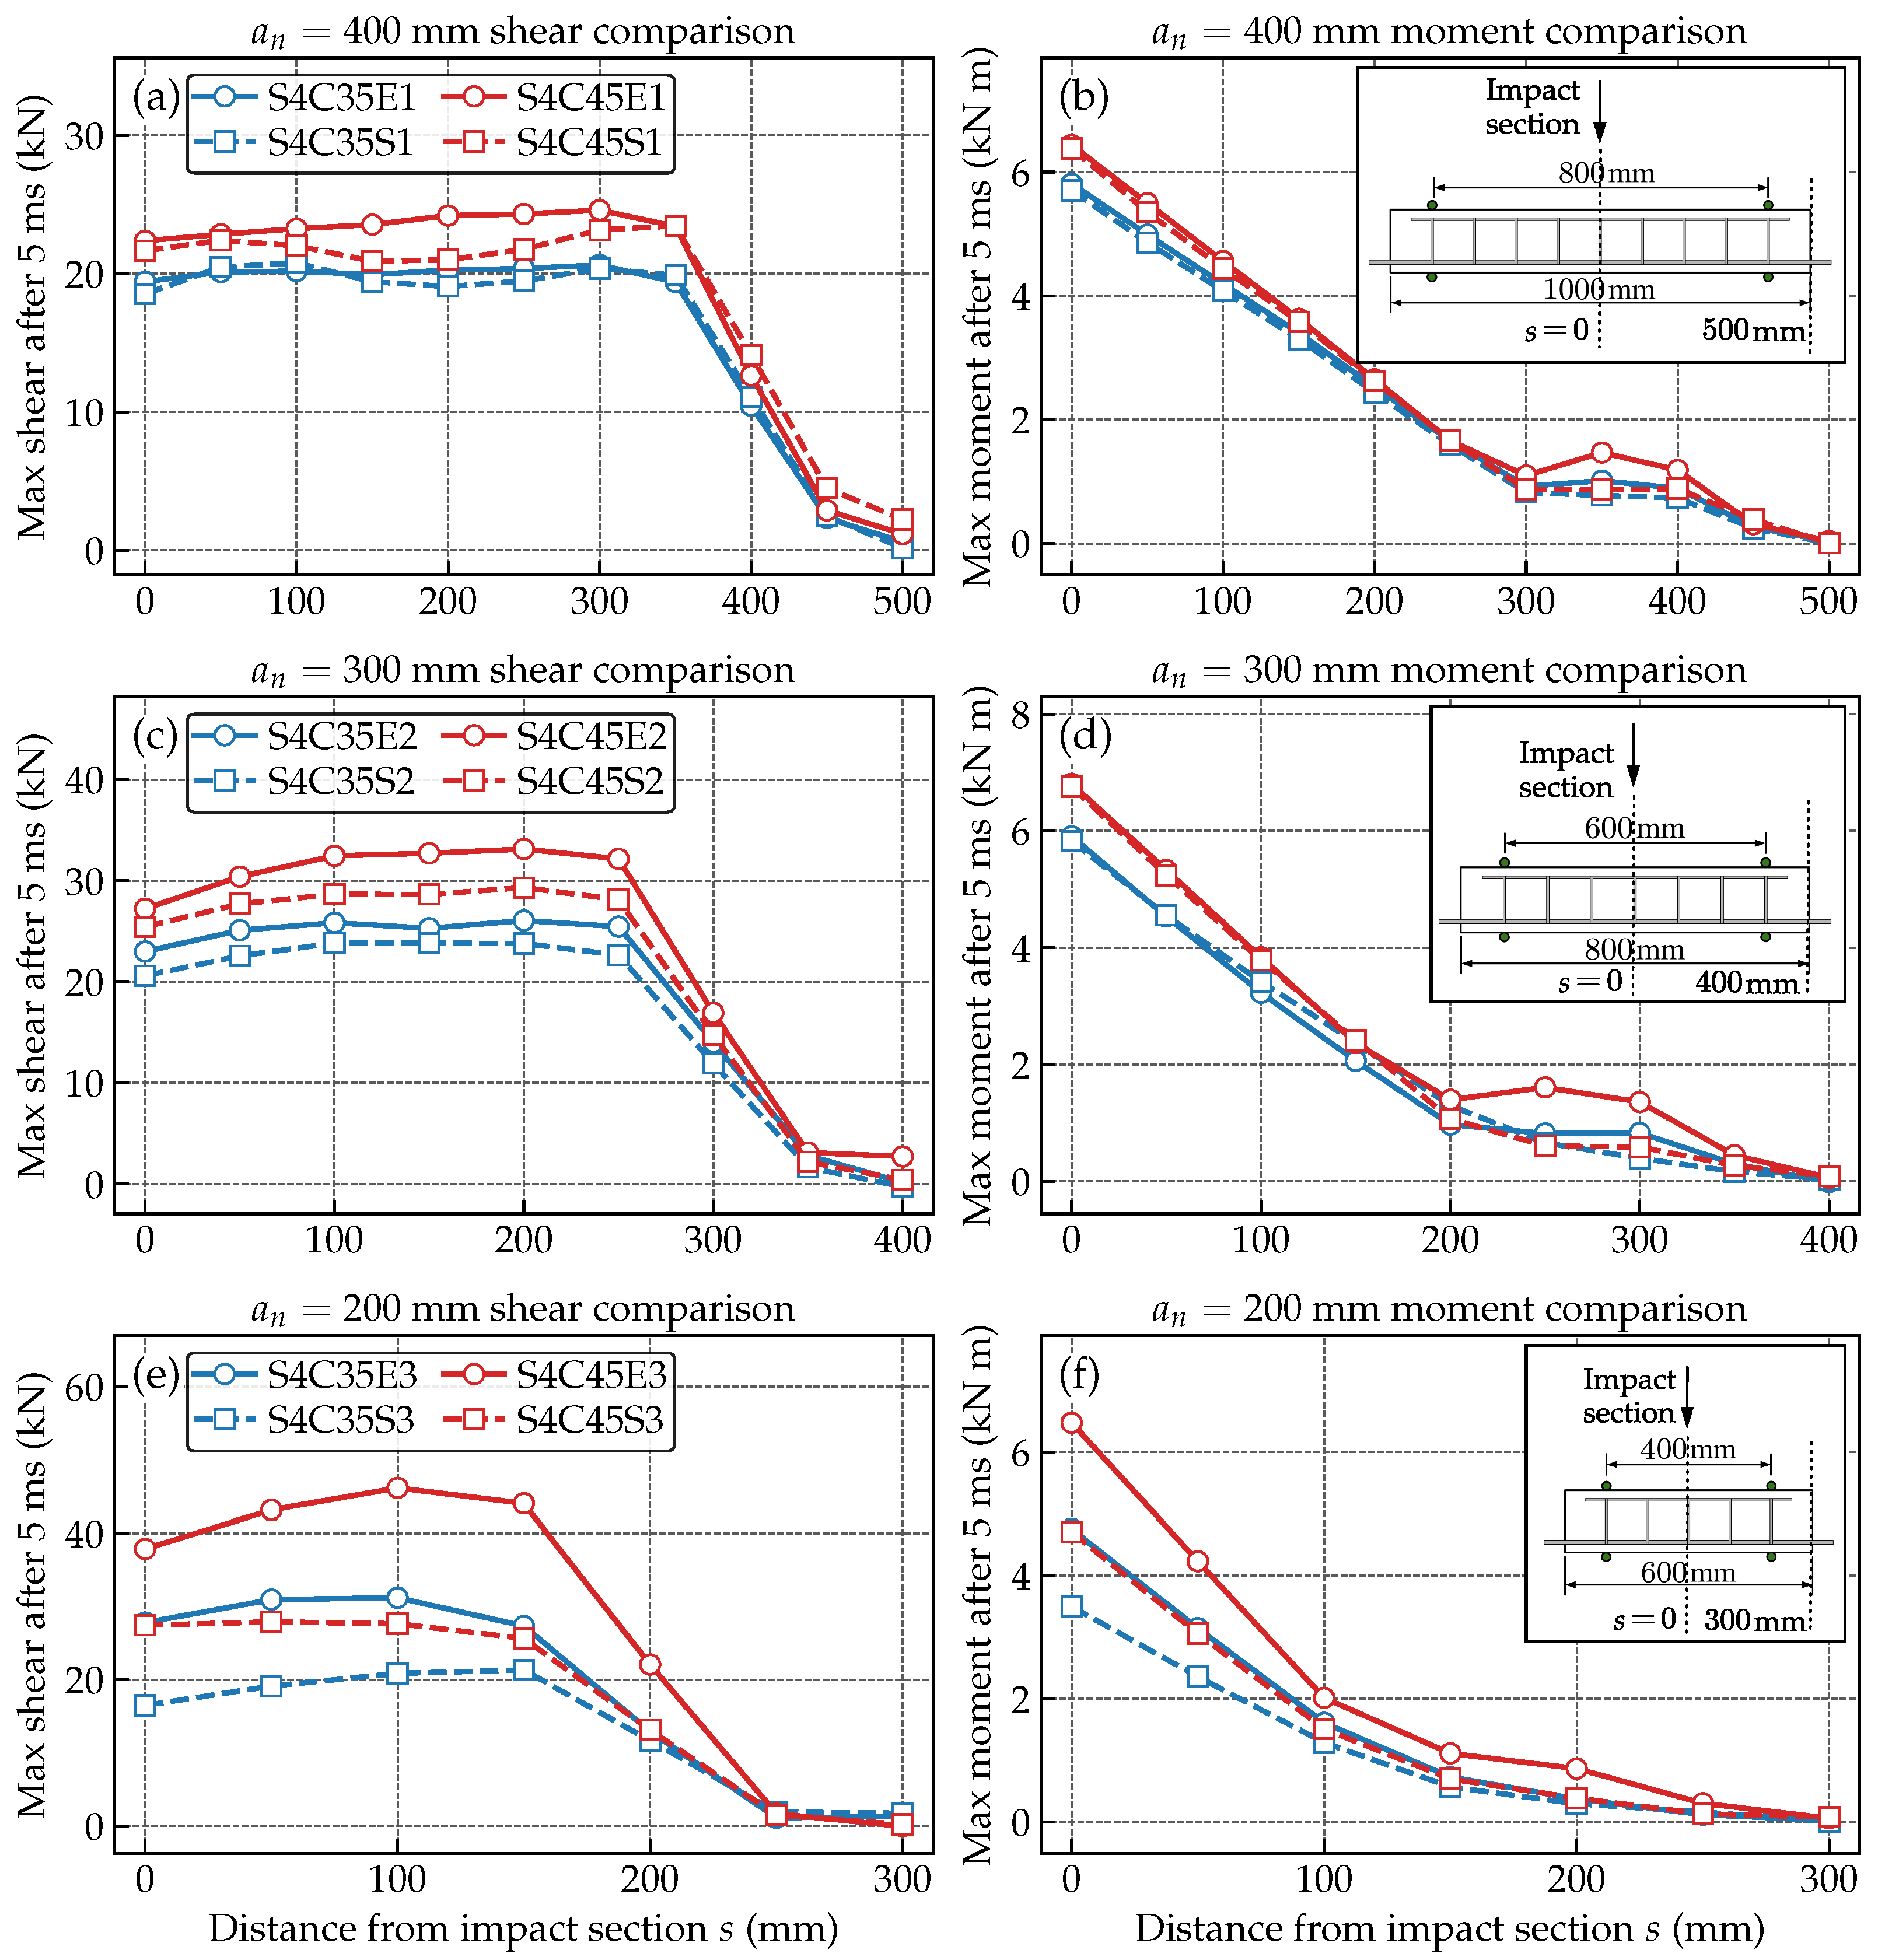
Table 9 gives the largest values, and Figure 12 shows where the differences occur along the short side. For the short span, the full-span and reference curves remain close, which agrees with the small peak differences in the table. For the short span, the full-span eccentric cases begin to stay above the references over much of the local span. For the short span, the separation is strongest, especially for , where the full-span shear curve stays well above the reference before dropping near the support-end region. The moment curves show a more local difference near the impact side and do not separate over the span as clearly as the shear curves.
Figure 12.
Paired local-span shear and bending-moment envelopes for full-span eccentric cases and matched short-span references: (a) shear for ; (b) bending moment for ; (c) shear for ; (d) bending moment for ; (e) shear for ; and (f) bending moment for . The short segment beyond the paired support is retained to show the full local profile. Solid lines denote full-span eccentric cases, and dashed lines denote matched short-span reference cases. The local coordinate s is measured from the impact section toward the compared support.
The increasing separation from 100 to eccentricity, especially in shear, shows that matching the short span length alone does not reproduce the full-span eccentric response. The longer side and the full-span deformation shape still affect the demand carried through the shorter-span side.
4.5. Damage Asymmetry and Fragmentation Pattern
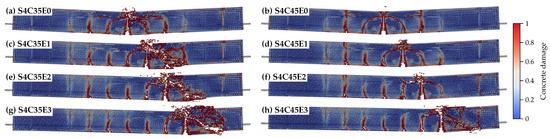
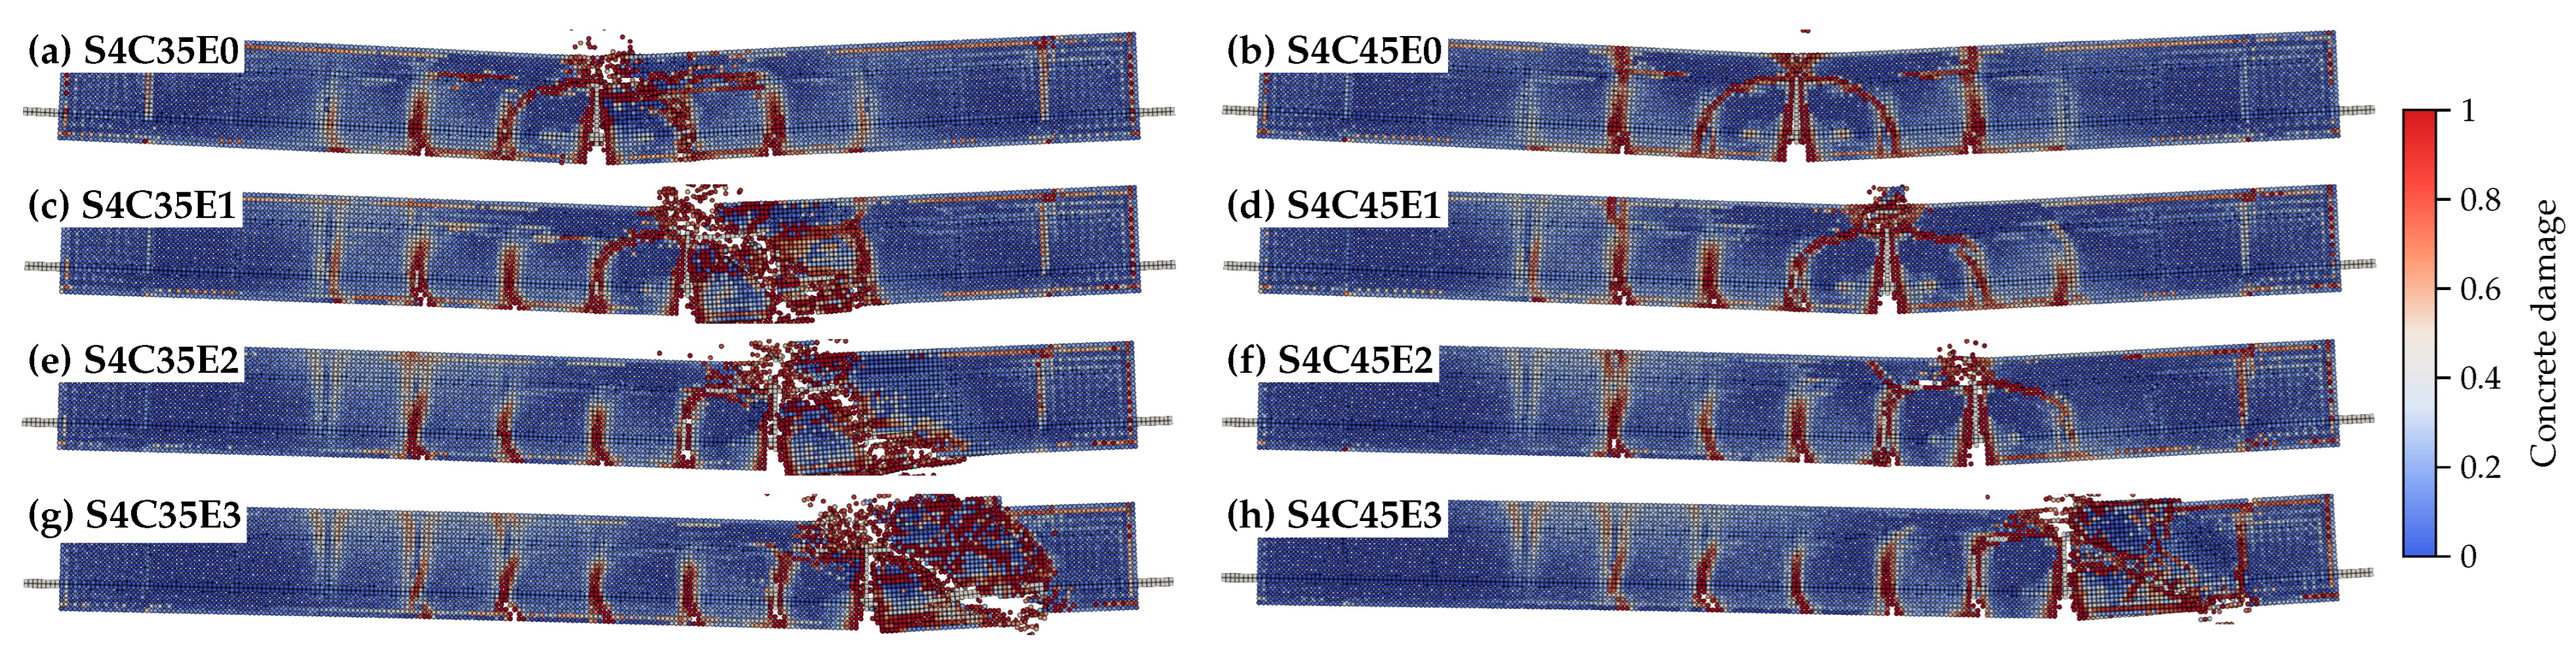
Figure 13 shows the final damage fields for the and groups. The panels are arranged by eccentricity level, with the cases in the left column and the cases in the right column. The comparison focuses on where the damage localizes, how far it spreads from the impact region, and whether detached fragments develop along the shorter-span transfer path.
Figure 13.
Final-frame damage fields for the and groups: (a) S4C35E0; (b) S4C45E0; (c) S4C35E1; (d) S4C45E1; (e) S4C35E2; (f) S4C45E2; (g) S4C35E3; and (h) S4C45E3. Rows correspond to –, and columns compare concrete strengths.
At central impact, the main damage remains centered around the impact section. As the impact point moves away from midspan, the dominant damage region shifts toward the shorter-span side. This shift is clearer in the low-strength group. At the largest eccentricity, develops a broad detached and splashed particle region near the shortened transfer path, while shows a more bounded damage zone. This visual difference is consistent with the longer contact duration of the low-strength branch and with the stronger absorbed-energy concentration reported above.
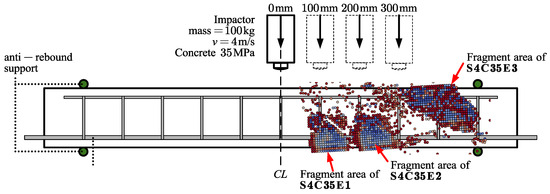
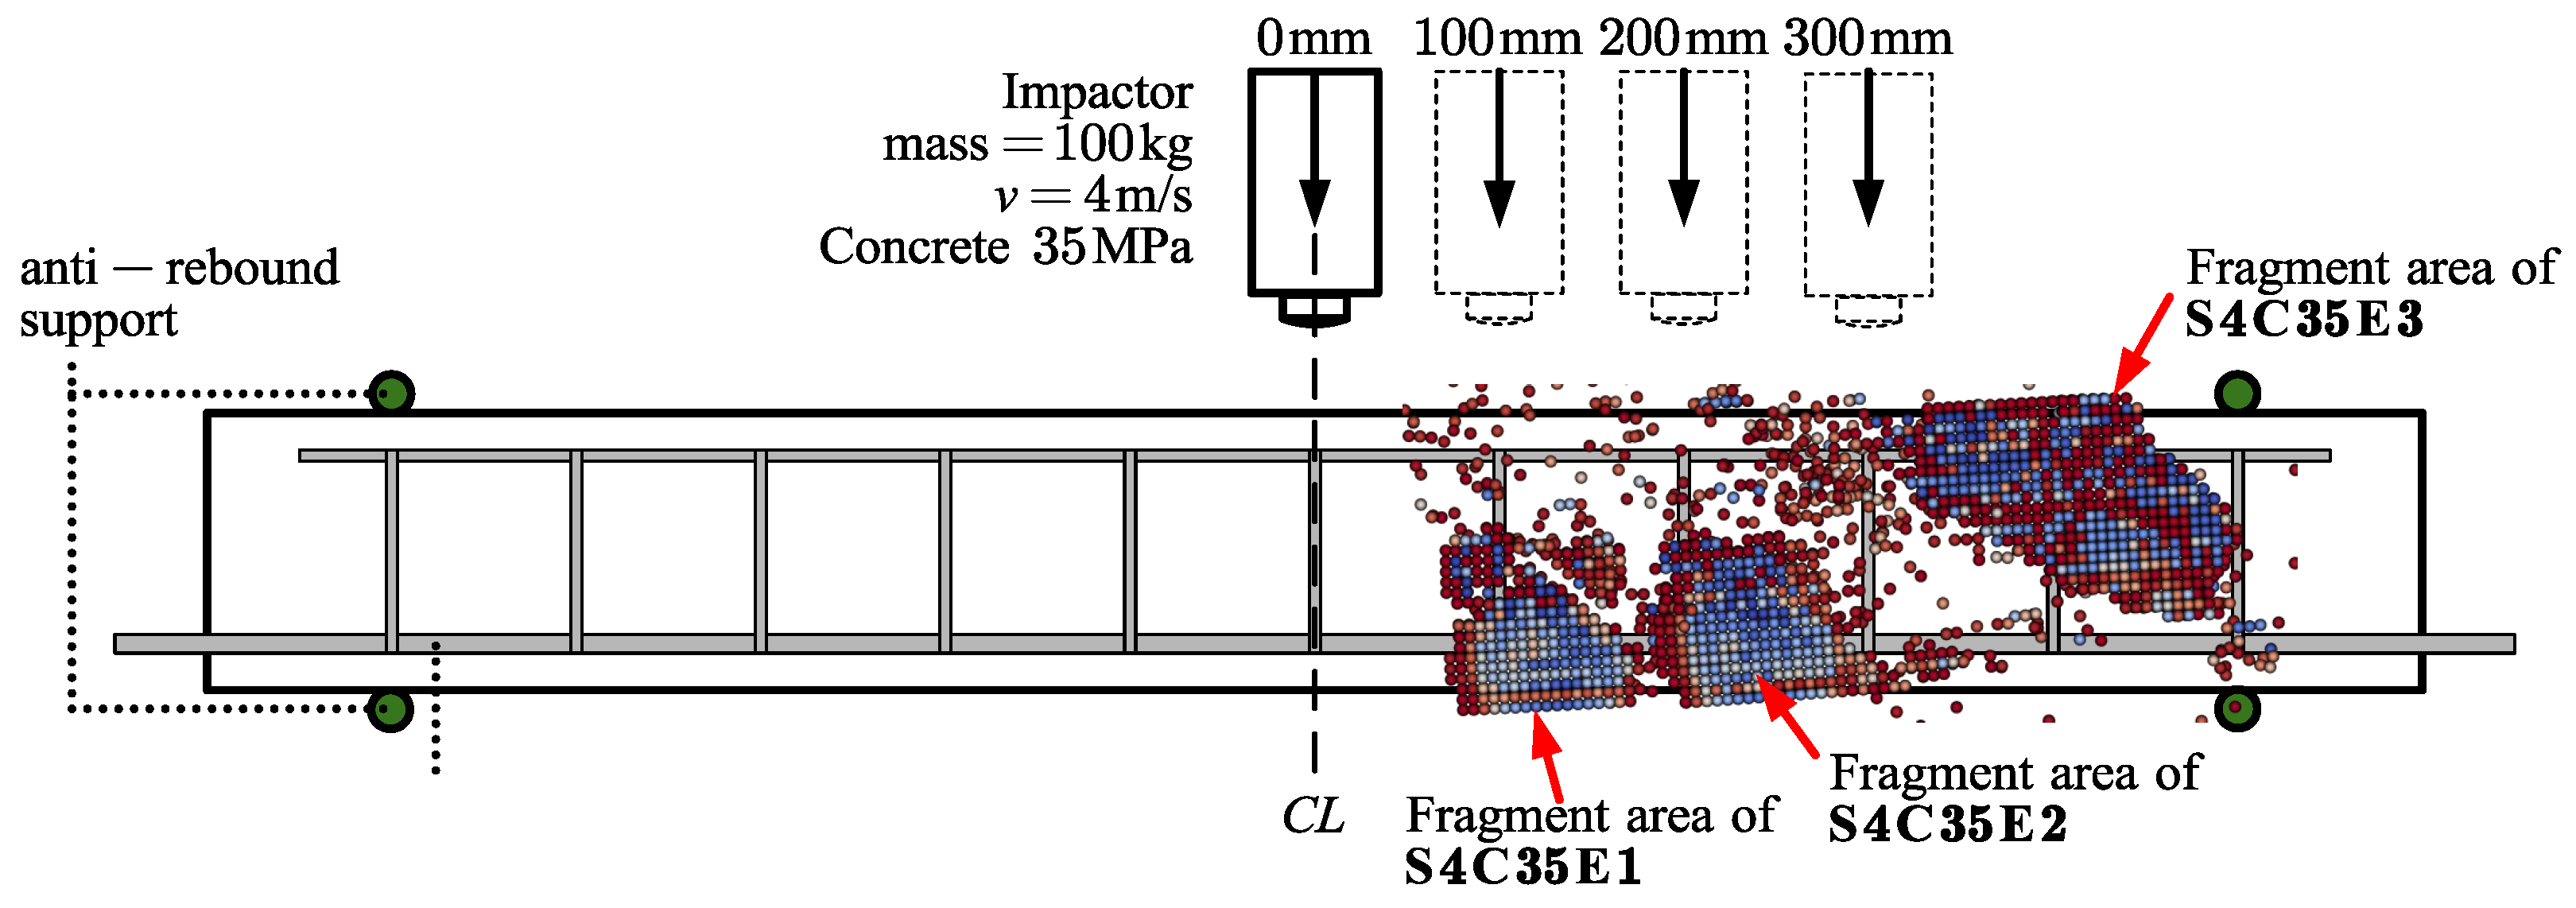
Figure 14 gives a closer view of detached fragments in the eccentric cases. The highlighted regions mark concrete pieces that separate from the main beam body after local crushing and rebound. As eccentricity increases, the detached region becomes more evident and shifts toward the shorter-span transfer path. The trend is consistent with the rise in shorter-span shear and absorbed energy per unit length.
Figure 14.
Detached fragment regions in the eccentric cases. The dashed line labeled CL marks the beam centerline and also serves as the reference origin for measuring the eccentric offset. Arrows indicate the impact-velocity direction, i.e., the drop-weight falling direction. Highlighted regions denote detached concrete fragments separated from the main beam body and are used to describe splashed-fragment morphology.
Measurable damage quantities, including damaged area or broken-out material, are commonly used for objective and quantitative assessment of impact damage [10,41]. In this study, detached fragment morphology was quantified by counting splashed concrete SPH particles at the final frame. Here, e is the impact eccentricity, is the number of splashed concrete particles, and is the total number of concrete SPH particles in the corresponding model. Because the concrete SPH particles have the same baseline size and density, a larger indicates a larger amount of detached concrete.
Table 10 shows that increases with eccentricity. Compared with the central-impact case, increases from 2019 in S4C35E0 to 9532 in S4C35E3, and increases from 1.798% to 8.488%. The particle count records the increase in detached material in the low-strength beam as the impact point moves farther from midspan.
Table 10.
Splashed concrete particle statistics for the S4C35 final-frame damage morphology.
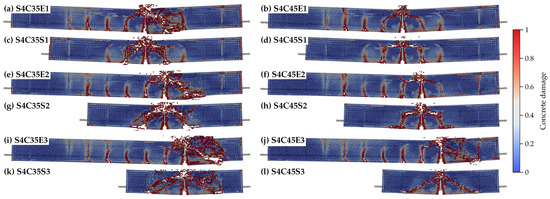
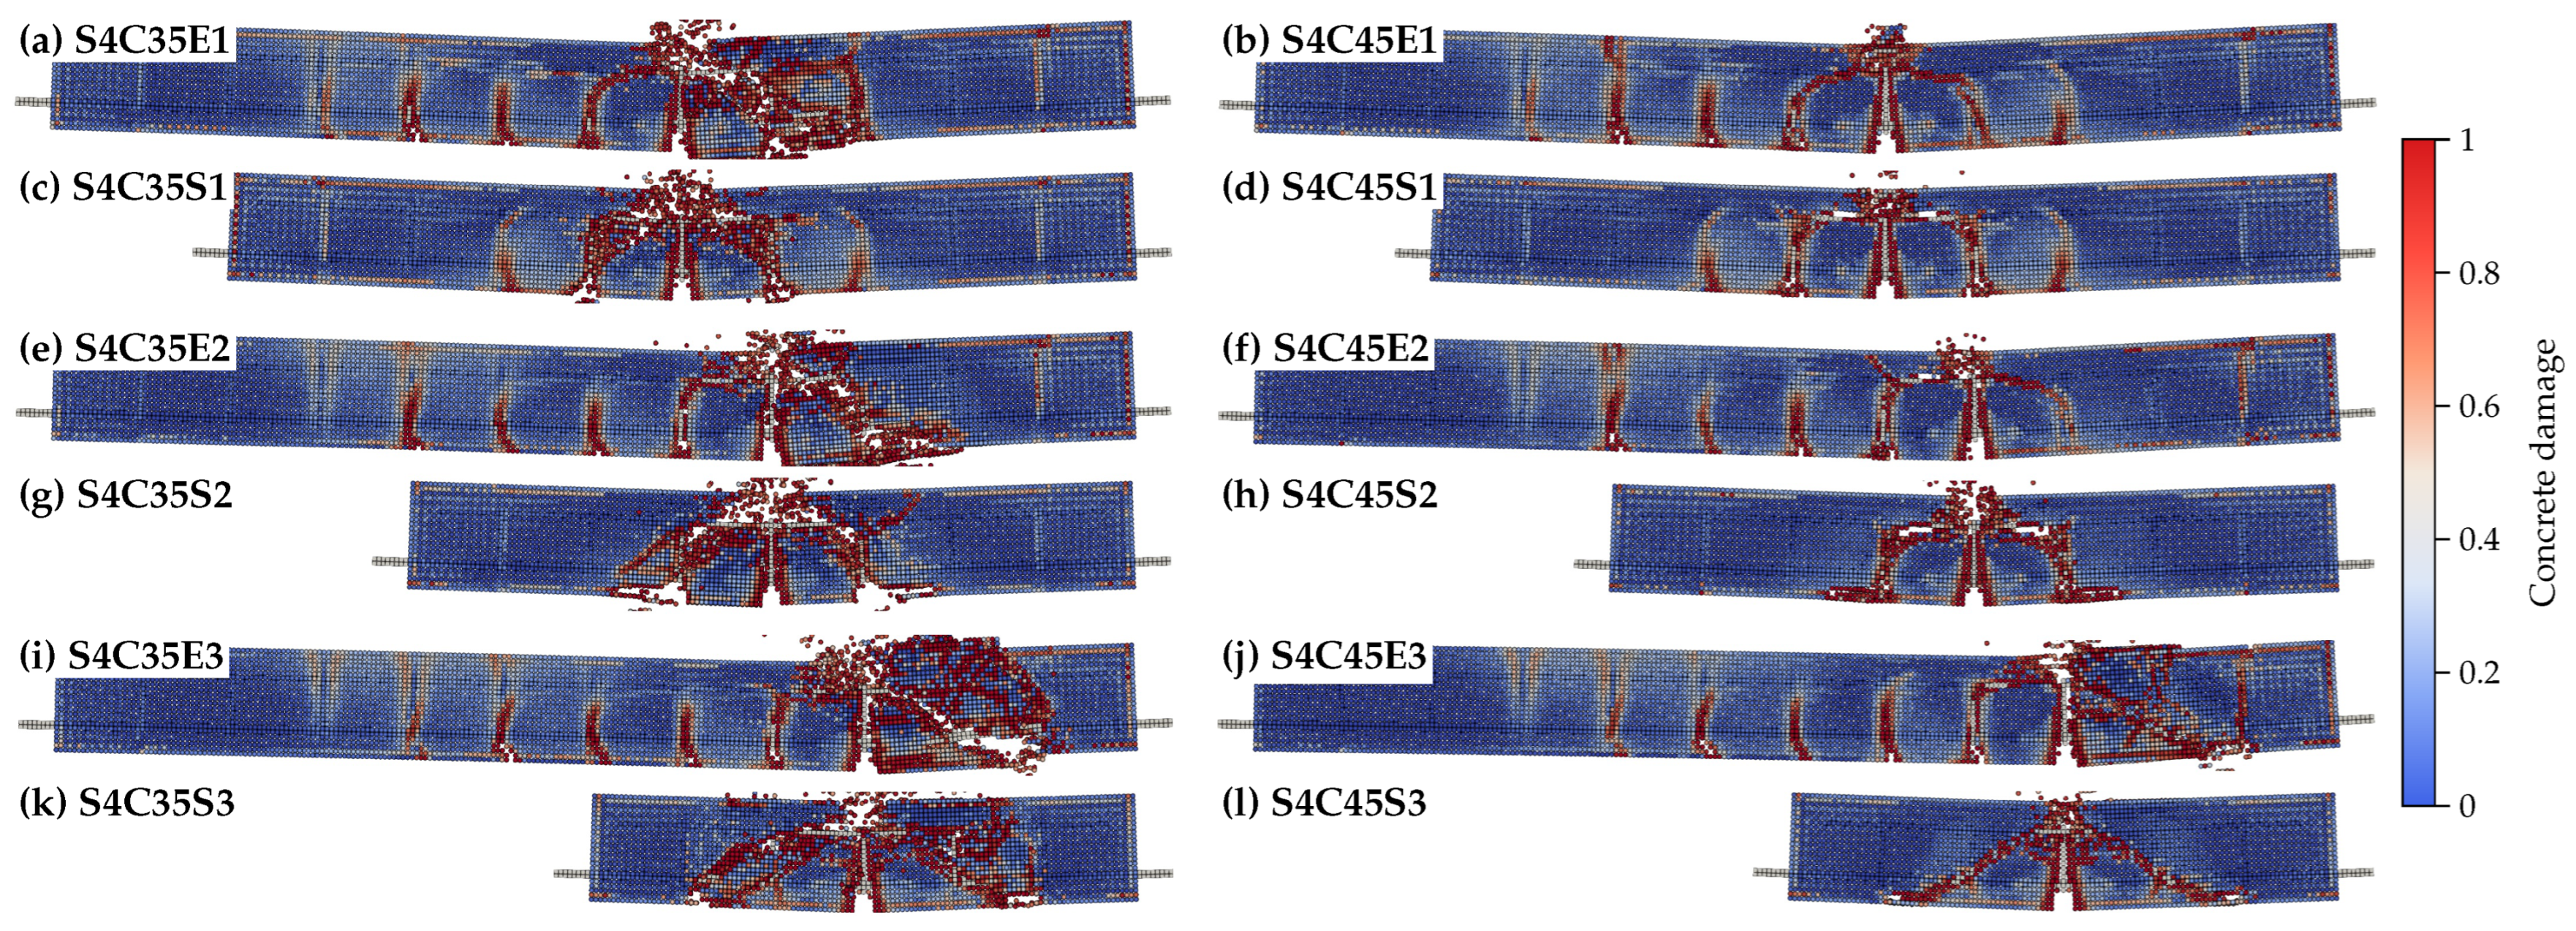
Figure 15 shows the damage counterpart of the matched-reference comparison. At the eccentricity level, the full-span eccentric and matched-reference damage fields remain broadly comparable, with visible differences mainly around the impact region. This agrees with the comparable or marginal peak-demand differences in Table 9. At , the full-span eccentric cases show more extension toward the shorter-span transfer route, while the matched references remain more compact around the local impact span. At , the contrast becomes clearer. The full-span eccentric cases develop a more connected shorter-span-side damage zone and more visible detached material than the corresponding matched short-span references. The larger and more connected damage zones in the full-span cases show that the longer side and the full-span deformation shape still affect damage development, even when the shorter span length is matched.
Figure 15.
Paired damage-field comparison between full-span eccentric cases and matched short-span references: (a) S4C35E1; (b) S4C45E1; (c) S4C35S1; (d) S4C45S1; (e) S4C35E2; (f) S4C45E2; (g) S4C35S2; (h) S4C45S2; (i) S4C35E3; (j) S4C45E3; (k) S4C35S3; and (l) S4C45S3. Each pair compares the full-span eccentric case with the reference beam with the same shorter span. The figure shows the final-frame damage morphology for each paired case.
4.6. Mechanism of Eccentricity-Induced Load-Path Redistribution
Published studies on off-midspan or eccentric impact of RC beams and related RC members have reported that changing the impact location can modify the dynamic response, displacement, damage pattern, strengthening effect, or torsional response [32,33,42,43]. In the present analysis, the impact-location effect is evaluated through side-specific shear envelopes, span-normalized absorbed-energy density, matched short-span references, and damage or detached-fragment morphology.
The present results show that the response is controlled by a load-path change associated with the shorter impact-to-support distance. The first force peak changes little as eccentricity increases, so the later redistribution is not driven mainly by a larger initial contact force. Contact duration reflects the later contact stage. In the velocity branch, the pulse generally becomes shorter as eccentricity increases. In the low-strength branch, however, the contact duration increases markedly, indicating earlier local crushing, post-peak contact-stiffness degradation, and longer fragment interaction before rebound or separation.
The sectional results identify the spatial redistribution. Moving the impact point away from midspan shortens one side, and this shorter side provides a more direct force-transfer route to the closer support. The increase in shorter-span shear relative to both the central-impact case and the longer-span side reflects this change. The bending response does not follow the same trend. The shorter-span bending moment remains close to or lower than the longer-span value, and the moment envelopes keep a broader beam-scale shape. The load-path change is shear dominated, and the sectional demands do not increase uniformly.
The model-derived absorbed energy indicators describe the deformation work associated with this shear redistribution. Because the two sides have different lengths, absorbed energy per unit length is the relevant comparison. After eccentricity is introduced, the shorter-span side absorbs more deformation work per unit length than in the corresponding central-impact case. It also absorbs more work per unit length than the longer-span side in the same eccentric case. This effect is strongest in the low-strength branch, where the damage fields show broader detached material.
The matched-reference and damage comparisons show how the local shorter span interacts with the remaining beam length. In the more eccentric pairs, the full-span eccentric beams develop larger shorter-span shear than the matched symmetric short-span references with the same local span length. The envelope profiles show that the difference is spatial, not just a single peak change. At and especially eccentricity, the full-span shear curve separates from the reference over much of the local span. The damage fields show the same tendency: the full-span eccentric beams develop more connected shorter-span-side damage and more visible detached fragments than their matched references. The longer side and the global deformation shape still participate in force transfer and damage development.
These findings indicate that eccentric impact promotes severe damage concentration within the shorter-span region. When off-midspan accidental impact is relevant, the local shear-resisting capacity of this region may need to be checked. If required, increasing local shear reinforcement or adopting localized strengthening measures, such as fiber-reinforced composite materials, may be considered as mitigation options for existing members. Previous studies have reported improved RC-beam impact resistance after fiber-composite strengthening [44]; the significant advances achieved and the proven remarkable effectiveness of CFRP in restoring the residual load-carrying capacity and damage resistance of deteriorated concrete structures have also been documented [45].
5. Conclusions
This study examined how impact eccentricity changes force transfer and damage development in RC beams using a validated coupled SPH-FEM model. The main conclusions are as follows.
- 1.
- The coupled SPH-FEM model reproduced the central-impact validation-test response with acceptable accuracy. The validation errors were – for maximum displacement, – for the first force peak, and – for load-pulse duration. The model also captured the main force-history, absorbed-energy, and damage-pattern features. The validation provides the basis for examining eccentric-impact response with the same model.
- 2.
- Impact eccentricity changed the load-transfer process more clearly than the initial contact-force scale. From central impact to the largest eccentricity, the first force peak changed only slightly, with the largest decrease remaining about among the analyzed branches. In contrast, the contact duration showed a clear strength-dependent response. In the low-strength branch, the main contact pulse increased from to , reflecting earlier local crushing, post-peak contact-stiffness degradation, and longer fragment interaction before rebound or separation.
- 3.
- Eccentric impact redirected shear demand toward the shorter-span side. At the largest eccentricity, the shorter-span shear reached up to times the corresponding central-impact value and up to times the longer-span side value. The bending response followed a different pattern. The shorter/longer moment ratio remained between and at the largest eccentricity. The load-path change is governed mainly by shear redistribution, and the sectional demands do not increase uniformly.
- 4.
- The model-derived absorbed energy indicators showed the same trend in deformation work. After normalizing by span length, absorbed energy concentrated on the shorter-span side. At the largest eccentricity, the shorter-span side absorbed up to times the energy per unit length of the longer-span side. This energy localization explains why the low-strength cases developed stronger detached fragment morphology.
- 5.
- The matched short-span comparison showed that the shorter-side response remained coupled with the full-span eccentric system. The full-span eccentric cases developed up to higher shorter-span shear and higher bending moment than the matched references. The shear difference was the dominant effect, while the moment difference remained more local. The paired damage fields showed the same tendency, with more connected shorter-span-side damage and more visible detached material in the full-span eccentric beams.
The results apply most directly to the assessment of off-midspan accidental impact in RC beams and similar beam members, such as bridge girders or edge beams struck by over-height vehicles or equipment, members exposed to rockfall or debris impact, and construction-stage dropped-object cases. The present comparison uses a representative beam configuration and model-parameter set. Future work can test the same indicators for other span ratios, reinforcement layouts, boundary conditions, impactor masses, and material ranges.
Author Contributions
Z.G.: Conceptualization, Methodology, Software, Validation, Formal analysis, Investigation, Data curation, Visualization, Writing—original draft preparation; C.L.: Conceptualization, Methodology, Software, Writing—review and editing, Supervision, Project administration; Y.S.: Methodology, Supervision, Project administration; H.T.: Resources, Supervision. All authors have read and agreed to the published version of the manuscript.
Funding
This research received no external funding.
Institutional Review Board Statement
Not applicable.
Informed Consent Statement
Not applicable.
Data Availability Statement
Data will be available on request.
Acknowledgments
The first author gratefully acknowledges the living allowance support from the China Scholarship Council (CSC), No. 202307000009.
Conflicts of Interest
The authors declare no conflicts of interest.
Abbreviations
The following abbreviations are used in this manuscript:
| CFL | Courant–Friedrichs–Lewy condition |
| CL | Centerline |
| CSCM | Continuous surface cap model |
| FEM | Finite element method |
| GPU | Graphics processing unit |
| RC | Reinforced concrete |
| SPH | Smoothed particle hydrodynamics |
References
- Bentur, A.; Mindess, S.; Banthia, N. The Behaviour of Concrete under Impact Loading: Experimental Procedures and Method of Analysis. Mater. Struct. 1986, 19, 371–378. [Google Scholar] [CrossRef] [Scilit]
- Banthia, N.; Mindess, S.; Bentur, A.; Pigeon, M. Impact Testing of Concrete Using a Drop-Weight Impact Machine. Exp. Mech. 1989, 29, 63–69. [Google Scholar] [CrossRef] [Scilit]
- Bischoff, P.H.; Perry, S.H. Compressive Behaviour of Concrete at High Strain Rates. Mater. Struct. 1991, 24, 425–450. [Google Scholar] [CrossRef] [Scilit]
- Malvar, L.J.; Ross, C.A. Review of Strain Rate Effects for Concrete in Tension. ACI Mater. J. 1998, 95, 735–739. [Google Scholar] [CrossRef] [Scilit] [PubMed]
- Malvar, L.J. Review of Static and Dynamic Properties of Steel Reinforcing Bars. ACI Mater. J. 1998, 95, 609–616. [Google Scholar] [CrossRef] [Scilit] [PubMed]
- Soroushian, P.; Choi, K.B. Steel Mechanical Properties at Different Strain Rates. J. Struct. Eng. 1987, 113, 663–672. [Google Scholar] [CrossRef] [Scilit]
- Li, Q.M.; Reid, S.R.; Wen, H.M.; Telford, A.R. Local Impact Effects of Hard Missiles on Concrete Targets. Int. J. Impact Eng. 2005, 32, 224–284. [Google Scholar] [CrossRef] [Scilit]
- Delhomme, F.; Mommessin, M.; Mougin, J.P.; Perrotin, P. Simulation of a Block Impacting a Reinforced Concrete Slab with a Finite Element Model and a Mass-Spring System. Eng. Struct. 2007, 29, 2844–2852. [Google Scholar] [CrossRef] [Scilit]
- Zineddin, M.; Krauthammer, T. Dynamic Response and Behavior of Reinforced Concrete Slabs under Impact Loading. Int. J. Impact Eng. 2007, 34, 1517–1534. [Google Scholar] [CrossRef] [Scilit]
- Hering, M.; Bracklow, F.; Scheerer, S.; Curbach, M. Reinforced Concrete Plates under Impact Load—Damage Quantification. Materials 2020, 13, 4554. [Google Scholar] [CrossRef] [Scilit] [PubMed]
- Kishi, N.; Mikami, H.; Matsuoka, K.G.; Ando, T. Impact Behavior of Shear-Failure-Type RC Beams without Shear Rebar. Int. J. Impact Eng. 2002, 27, 955–968. [Google Scholar] [CrossRef] [Scilit]
- Fujikake, K.; Li, B.; Soeun, S. Impact Response of Reinforced Concrete Beam and Its Analytical Evaluation. J. Struct. Eng. 2009, 135, 938–950. [Google Scholar] [CrossRef] [Scilit]
- Kishi, N.; Mikami, H. Empirical Formulas for Designing Reinforced Concrete Beams under Impact Loading. ACI Struct. J. 2012, 109, 509–520. [Google Scholar] [CrossRef] [Scilit]
- Cotsovos, D.M.; Stathopoulos, N.D.; Zeris, C.A. Behavior of RC Beams Subjected to High Rates of Concentrated Loading. J. Struct. Eng. 2008, 134, 1839–1851. [Google Scholar] [CrossRef] [Scilit]
- Cotsovos, D.M. A Simplified Approach for Assessing the Load-Carrying Capacity of Reinforced Concrete Beams under Concentrated Load Applied at High Rates. Int. J. Impact Eng. 2010, 37, 907–917. [Google Scholar] [CrossRef] [Scilit]
- Adhikary, S.D.; Li, B.; Fujikake, K. Dynamic Behavior of Reinforced Concrete Beams under Varying Rates of Concentrated Loading. Int. J. Impact Eng. 2012, 47, 24–38. [Google Scholar] [CrossRef] [Scilit]
- Kishi, N.; Bhatti, A.Q. An Equivalent Fracture Energy Concept for Nonlinear Dynamic Response Analysis of Prototype RC Girders Subjected to Falling-Weight Impact Loading. Int. J. Impact Eng. 2010, 37, 103–113. [Google Scholar] [CrossRef] [Scilit]
- Bhatti, A.Q.; Kishi, N.; Mikami, H.; Ando, T. Elasto-Plastic Impact Response Analysis of Shear-Failure-Type RC Beams with Shear Rebars. Mater. Des. 2009, 30, 502–510. [Google Scholar] [CrossRef] [Scilit]
- Ožbolt, J.; Sharma, A. Numerical Simulation of Reinforced Concrete Beams with Different Shear Reinforcements under Dynamic Impact Loads. Int. J. Impact Eng. 2011, 38, 940–950. [Google Scholar] [CrossRef] [Scilit]
- Soleimani, S.M.; Sayyar Roudsari, S. Analytical Study of Reinforced Concrete Beams Tested under Quasi-Static and Impact Loadings. Appl. Sci. 2019, 9, 2838. [Google Scholar] [CrossRef] [Scilit]
- Peterson, V.; Ansell, A.; Hallgren, M. On the Residual Static and Impact Capacity of Shear-Reinforced Concrete Beams Subjected to an Initial Impact. Appl. Sci. 2022, 12, 11377. [Google Scholar] [CrossRef] [Scilit]
- Márquez Duque, L.; Le Sourne, H.; Rigo, P. Experimental, analytical and numerical study of reinforced concrete beams impacted by deformable bodies at low velocities. Int. J. Impact Eng. 2024, 192, 105027. [Google Scholar] [CrossRef] [Scilit]
- Saatci, S.; Vecchio, F.J. Effects of Shear Mechanisms on Impact Behavior of Reinforced Concrete Beams. ACI Struct. J. 2009, 106, 78–86. [Google Scholar] [CrossRef] [Scilit] [PubMed]
- Saatci, S.; Vecchio, F.J. Nonlinear Finite Element Modeling of Reinforced Concrete Structures under Impact Loads. ACI Struct. J. 2009, 106, 717–725. [Google Scholar] [CrossRef] [Scilit]
- Cotsovos, D.M.; Pavlovic, M.N. Modelling of RC Beams under Impact Loading. Proc. Inst. Civ. Eng.-Struct. Build. 2012, 165, 77–94. [Google Scholar] [CrossRef] [Scilit]
- Zhao, D.B.; Yi, W.J.; Kunnath, S.K. Simplified Approach for Assessing Shear Resistance of Reinforced Concrete Beams under Impact Loads. ACI Struct. J. 2016, 113, 747–756. [Google Scholar] [CrossRef] [Scilit]
- Fu, C.C.; Burhouse, J.R.; Chang, G.L. Overheight Vehicle Collisions with Highway Bridges. Transp. Res. Rec. 2004, 1865, 80–88. [Google Scholar] [CrossRef] [Scilit]
- Mougin, J.P.; Perrotin, P.; Mommessin, M.; Tonnelo, J.; Agbossou, A. Rock fall impact on reinforced concrete slab: An experimental approach. Int. J. Impact Eng. 2005, 31, 169–183. [Google Scholar] [CrossRef] [Scilit]
- Micallef, K.; Sagaseta, J.; Fernandez Ruiz, M.; Muttoni, A. Assessing Punching Shear Failure in Reinforced Concrete Flat Slabs Subjected to Localised Impact Loading. Int. J. Impact Eng. 2014, 71, 17–33. [Google Scholar] [CrossRef] [Scilit]
- Hrynyk, T.D.; Vecchio, F.J. Behavior of Steel Fiber-Reinforced Concrete Slabs under Impact Load. ACI Struct. J. 2014, 111, 1213–1224. [Google Scholar] [CrossRef] [Scilit]
- Kos, Z.; Klymenko, Y.; Karpiuk, I.; Grynyova, I. Bearing Capacity near Support Areas of Continuous Reinforced Concrete Beams and High Grillages. Appl. Sci. 2022, 12, 685. [Google Scholar] [CrossRef] [Scilit]
- Kadhim, M.M.A.; Jawdhari, A.R.; Altaee, M.J.; Adheem, A.H. Finite Element Modelling and Parametric Analysis of FRP Strengthened RC Beams under Impact Load. J. Build. Eng. 2020, 32, 101526. [Google Scholar] [CrossRef] [Scilit]
- Ayaad, N.; Oukaili, N. Impact torsional behavior and strengthening of reinforced concrete spandrel beams. Case Stud. Constr. Mater. 2023, 19, e02591. [Google Scholar] [CrossRef] [Scilit]
- Johnson, G.R.; Stryk, R.A.; Beissel, S.R. SPH for High Velocity Impact Computations. Comput. Methods Appl. Mech. Eng. 1996, 139, 347–373. [Google Scholar] [CrossRef] [Scilit]
- Rabczuk, T.; Eibl, J. Simulation of High Velocity Concrete Fragmentation Using SPH/MLSPH. Int. J. Numer. Methods Eng. 2003, 56, 1421–1444. [Google Scholar] [CrossRef] [Scilit]
- Rabczuk, T.; Eibl, J.; Stempniewski, L. Numerical Analysis of High Speed Concrete Fragmentation Using a Meshfree Lagrangian Method. Eng. Fract. Mech. 2004, 71, 547–556. [Google Scholar] [CrossRef] [Scilit]
- Kuang, W.; Guo, T.; Chang, X.; Rui, Y. Fracture Behavior of Heterogeneous Layered Sandstone under Mixed Loading after Thermal Treatment: A Thermal–Mechanical Grain-Based FDEM Model. Comput. Geotech. 2025, 188, 107599. [Google Scholar] [CrossRef] [Scilit]
- Tamai, H.; Sonoda, Y.; Bolander, J.E. Impact Resistance of RC Beams with Reinforcement Corrosion: Experimental Observations. Constr. Build. Mater. 2020, 263, 120638. [Google Scholar] [CrossRef] [Scilit]
- Hu, Y.; Li, T.M.; Anderson, L.; Ragan-Kelley, J.; Durand, F. Taichi: A Language for High-Performance Computation on Spatially Sparse Data Structures. ACM Trans. Graph. 2019, 38, 1–16. [Google Scholar] [CrossRef] [Scilit]
- Murray, Y.D. Users Manual for LS-DYNA Concrete Material Model 159; Technical Report FHWA-HRT-05-062; Federal Highway Administration: McLean, VA, USA, 2007.
- Liu, C.; Gao, F.; Deng, S.; Wang, Z.; Lu, H.; Deng, G.; Wang, M. Investigation on the damage and assessment of steel-concrete-steel composite structures subjected penetration and explosive loadings. Structures 2026, 83, 110841. [Google Scholar] [CrossRef] [Scilit]
- Uludoğan, A.M.; Yılmaz, T.; Kamanlı, M.; Can, İ.; Erdem, E. Numerical Evaluation on Impact Behavior of Seismically and Non-Seismically Detailed RC Beams. Int. J. Struct. Civ. Eng. Res. 2024, 13, 57–65. [Google Scholar] [CrossRef] [Scilit]
- Abdulsahib, W.S.; Almuhsin, B.S.; Abduljabbar, M.S. Dynamic Response of Reinforced Concrete Beams Subjected to Low-Velocity Impact Loads Using Nonlinear Finite Element Analysis. Period. Eng. Nat. Sci. 2023, 11, 1–17. [Google Scholar] [CrossRef] [Scilit]
- Senesavath, S.; Tamai, H.; Lu, C.; Sonoda, Y. Strengthening of RC Beams with CFC Panels for Improving Impact Resistance. Appl. Sci. 2023, 13, 10625. [Google Scholar] [CrossRef] [Scilit]
- Chen, H.; Jiang, Y.; Chen, D.; Zhang, X.; Yan, P.; Wang, B.; Lin, Q. Strengthening effect of the CFRP method on fire-damaged segments. Tunn. Undergr. Space Technol. 2024, 154, 105871. [Google Scholar] [CrossRef] [Scilit]



Disclaimer/Publisher’s Note: The statements, opinions and data contained in all publications are solely those of the individual author(s) and contributor(s) and not of MDPI and/or the editor(s). MDPI and/or the editor(s) disclaim responsibility for any injury to people or property resulting from any ideas, methods, instructions or products referred to in the content. |
© 2026 by the authors. Licensee MDPI, Basel, Switzerland. This article is an open access article distributed under the terms and conditions of the Creative Commons Attribution (CC BY) license.