


Abstract
ETFE (EthylenTetraFluoroEthylen) cushion facade systems are increasingly adopted in contemporary architecture due to their lightweight properties and design flexibility. However, their thin, meltable structures present persistent uncertainties in fire safety. Specifically, the quantitative effects of fire origin, facade location, and passive–active fire protection measures on structural integrity, toxicity, and secondary fire risks remain underexplored. This study evaluates the fire performance of 15 ETFE cushion facade typologies under 135 scenarios, including fires originating externally, internally, and within the cushion, across middle, corner, and recessed facade locations. Simulations are conducted using artificial intelligence-based code generation to address the limitations of conventional fire modeling. Fire behavior is quantified via time to structural failure, burning duration, CO toxic gas production, dripping onset and mass, and normalized fire and dripping performance indices. Results show that passive measures provide limited structural delay and often increase burning duration and toxicity. Conversely, active systems demonstrate more balanced, scenario-dependent performance, reducing fire intensity, toxic gas emission, and melt-induced secondary risks. These findings highlight that effective fire safety in ETFE cushion facades requires holistic, location-sensitive and scenario-sensitive integration of passive and active measures rather than reliance on singular strategies, ensuring property protection and life safety in buildings.
1. Introduction
Buildings face life and structural safety risks from natural hazards such as earthquakes, hurricanes, and tsunamis, as well as human-induced events like fires and explosions [1]. Fire, caused by uncontrolled combustion, can lead to significant material damage and threaten human health and life [2]. Statistics show that 33.6% of fires occur in buildings (25.5% in residential and 8.1% in other facilities), followed by 11.5% in transportation, 1.1% in forests, 17.6% in grass and shrubs, 13.9% in waste areas, and 22.2% in other settings [3]. Fires in multistorey and high-rise buildings often result from electrical faults, cooking, smoking, sparks, and inadequate fire safety measures [4]. Fire protection and fire containment capabilities, along with fire suppression strategies, include passive measures that limit the growth and spread of fire, as well as active systems such as detection and suppression technologies, for example automatic extinguishing devices [5,6]. While regulations vary by country, combining both approaches is essential, particularly to prevent facade fires in high-rise buildings through appropriate design and building-specific precautions [7]. Fire prevention and suppression measures should be integrated into building design in accordance with the specific characteristics of the building while ensuring rapid evacuation; technologies such as intelligent evacuation guidance systems improve evacuation performance for life safety [8,9]. The fragility of modern facades can accelerate the spread of fire, cause structural damage, and increase the risk of loss of life; therefore, they must be designed using fire-resistant and low-flammability materials [10]. In relation to vertical fire spread in fire incidents, the lack of knowledge regarding facade fires based on cladding materials highlights the need for an engineering framework that addresses these gaps by providing necessary information, along with a database that enables risk assessment and quantitative measurement of fire performance [11]; it directly indicates the relationship between facade cladding materials and fire. External facade cladding systems are critical components in buildings due to fire incidents; therefore, alternative cladding products must comply with non-combustibility requirements and meet fire safety regulations [12]. Fire safety assessments are commonly conducted using scenarios, simulations, and modeling tools.
Fire scenario modeling commonly uses Computational Fluid Dynamics (CFD) [13]; Fire and Smoke Dynamics Modeling, CFD models such as the Fire Dynamics Simulator (FDS) and zone models like the Consolidated Fire and Smoke Transport (CFAST) model, along with their associated graphical user interfaces (PyroSim) and visualization tools (Smokeview); Egress and Evacuation Modeling, agent-based simulations Pathfinder, buildingEXODUS, and STEPS based on human behavior and movement during emergencies; Hydraulic Calculation Software, covering specialized tools for fire suppression system design (HASS, AutoSPRINK) and general water network analysis programs (Pipe Flow Professional, EPANET); Consequence and Risk Assessment Tools, focused on analyzing high-hazard industrial scenarios using software such as PHAST, FLACS, and ALOHA fire simulation and calculation tools are used [14].
Although Building Information Modeling (BIM) is less widely used in fire safety than in other fields, it can be applied through tools such as CYPEFIRE Design and FINEFIRE in line with regulatory requirements for passive and active measures. These tools generally provide user satisfaction, though they differ in usability aspects such as learnability, efficiency, memorability, and error feedback [15]. Existing fire analysis, calculation, and simulation tools often lack a comprehensive approach, struggle to incorporate new materials and complex building systems, and are difficult to learn and apply. They can be time-consuming, prone to errors, and limited in flexibility, making the modeling process complex. In this context, artificial intelligence (AI)-based fire assessment methods offer a modern alternative, enabling more flexible, faster, and reliable analyses.
Atrium fires are analyzed by creating a CFD database and, after training with a transposed convolutional neural network (TCNN), smoke movement and the estimation of available safe egress time are performed using AI within the context of performance-based design [16]. Aluminum lattice roof structures are analyzed in terms of structural response under fire scenarios, with modular AI generating predictions of global structural fire behavior from individual forecasts, allowing for different models and providing flexibility and adaptability [17]. Complex system interactions use multi-agent simulation (MAS) to develop a new fire emergency management model with AI in the context of fire safety, addressing challenges such as emergency management, data delays, insufficient coordination, and weak predictive capability [18]. AI predicts fires, allowing damages and losses to be prevented, and it is anticipated that models capable of forecasting impending fires (artificial neural network models) are possible and continue to develop [19]. In large building fires, the prediction of fire models and the assessment of smoke flow resulting from complex causes have been investigated using AI [20]. Fire resistance of reinforced concrete columns is evaluated and predicted using machine learning instead of costly, time-consuming, and limited fire experiments [21].
Studies demonstrated that AI-supported methods can be utilized in fire safety analyses. Conventional fire simulations require extensive time and highly accurate material data, making them limited for innovative, multi-layered systems such as ETFE cushions. This study identifies ETFE cushion facades as building components requiring tailored passive and active fire safety measures based on their material and structural characteristics. It offers a novel contribution by evaluating their fire behavior using AI-based calculation and assessment methods beyond traditional simulation approaches.
Pneumatic ETFE foil constructions are widely used in modern building envelopes due to their lightweight nature, high transparency, structural performance, mechanical strength in terms of durability, and self-cleaning properties [22,23]. Multilayer ETFE cushions are increasingly applied in roofs and facades [24]. ETFE foil is classified under standards such as DIN 4102 [25] (Class B1) (low flammability); NF P92-505 [26] (M2); ASTM E84-23a [27], Standard Test Method for Surface Burning Characteristics of Building Materials, Class A (low flame spread and smoke index); EN 13501-1 [28], Fire Classification of Construction Products and Building Elements-Part 1: Classification Using Data From Reaction to Fire Tests, Class B-s1-d0 (very limited contribution to fire with a weak quantity and speed of smoke emission, no dripping of flaming droplets); NFPA 701 [29], Standard Methods of Fire Tests for Flame Propagation of Textiles and Films; JIS A 1322 [30] Class 1; JIS K 7201-2 [31] (ISO 4590 [32]) Limited Oxygen Index 29.1% (nonflammable in air); AS1530.2 [33] Flammability Index of 1; AS/NZS 1530.3 [34] ignitability index of 0, spread of flame index of 0 and smoke developed index of 1; BS 476-6 [35] and BS 476-7 [36] class 0: a material of limited combustibility [37,38,39,40,41]. ETFE material does not exhibit resistance in fire conditions but rather reacts to fire. ETFE roofs and facades follow a different fire philosophy; instead of remaining stable until complete structural failure under fire, they are designed to improve fire safety conditions through a controllable and predictable burning behavior. Due to its structural properties, ETFE has a melting point of approximately 260–280 °C; it begins to soften and shrink at around 150–200 °C and melts within the range of approximately 250–280 °C. In building applications, ETFE does not fragment because it retracts away from the heat source without breaking; it does not cause sudden collapse, does not explode, and does not produce broken, rigid, or heavy fragments that could pose a hazard to users when falling [37]. In fire conditions, ETFE shrinks, allowing smoke and flames to be vented externally; instead of dripping onto occupants while melting, fragments disperse into the air together with the smoke, the fire does not spread across the material, and it is capable of self-extinguishing [42]. During fire exposure, the heat of hot smoke causes the ETFE foil to soften and tear, and it consequently exhibits a natural ventilation behavior by retracting and shrinking away from the fire source [38]. ETFE exhibits self-ventilating and self-extinguishing behavior, which enables it to limit the accumulation of high temperatures beneath a roof structure and thereby contributes to preventing structural collapse [39]. ETFE foil cushion elements, classified as low-flammability, may not always reach surface temperatures sufficient to cause melting due to smoke exposure; in this context, from a fire engineering perspective, the installation of automatic systems for smoke ventilation in facades or roofs may be considered when necessary [40]. ETFE material, when burning, releases toxic and corrosive hydrogen fluoride (HF), as is observed in fluoropolymers [43]. Due to the nature of fire, emissions of CO and CO2 may occur; in this case, gases released into the interior as a result of the combustion of multilayer ETFE cushions can also have asphyxiating and toxic effects on human health. In studies on multilayer ETFE foil cushion systems used as cladding in the building envelope [44], the fire response of a three-layer transparent ETFE foil cushion system and a three-layer densely printed system was investigated through two small-room fire tests. Depending on the flame and intensity of the fire, starting from the layer closest to the ignition point, thinning, expansion, and shrinkage of the ETFE cushion occur; subsequently, degradation is observed in the other layers, and as the material retracts or melts, dripping and loss of shape lead to fragmentation and the formation of an opening on the cushion surface. The system does not exhibit flashover behavior, and smoke and hot gases are discharged through the opening. Accordingly, material studies, experimental investigations, and relevant standards indicate that the fire performance of building envelopes composed of multilayer ETFE cushions is influenced by environmental factors such as the location of the fire, the placement of the cushion within the envelope, and the distance of the fire to the cushion. While such systems do not exhibit direct structural collapse, explosion, fragmentation, flame-propagating behavior, or burning particle fall-off, they may demonstrate molten dripping, shrinkage, loss of form, and the release of asphyxiating or toxic gases. It exhibits self-extinguishing behavior, with material softening and retracting from the fire source, which reduces fire intensity and enhances ventilation, further limiting fire spread [45]. ETFE does not produce flaming droplets or particles [46], has a relatively high ignition temperature, is difficult to ignite, generates low smoke, and shows good fire resistance, making it suitable for large-scale building applications based on material and manufacturer data [47]. However, as a polymer, it can soften and melt under high temperatures, resulting in dripping behavior despite not producing flaming droplets.
This study investigates the fire performance of ETFE cushion typologies incorporating different passive (10) and active (4) fire safety measures across eight evaluation parameters and 135 scenarios, considering variations in fire origin and facade position. While material fire properties are available from manufacturers, the academic literature on the fire behavior of ETFE cushion systems remains limited. Existing studies primarily rely on small-scale room tests on three-layer ETFE foil cushions, including densely printed variants [38], which represent the most recent and limited research on this topic.
The paper begins with an introduction covering fire safety, passive and active measures, AI-based fire simulations, ETFE fire behavior, and related studies. The methodology outlines numerical data for passive and active systems based on ETFE properties, the AI-based calculation strategy, heat flux modeling across scenarios, and key equations including burning mass (mfuel), failure time (tfail), dripping mass (mdrip), dripping time (tdrip), burn duration (tburn), CO equivalent emissions (COeq), fire performance index (FPI), and drip performance index (DPI). The results present ETFE cushion fire behavior under external, interior, and cushion-originated scenarios. The discussion compares burning behavior, CO toxicity, dripping effects, and statistical evaluations of normalized fire performance indices. Overall, the study demonstrates improved fire resilience of ETFE cushion facades, supporting their safer application in building envelopes.
2. Materials and Methods
The methodological framework consists of three main stages. The first stage includes three sub-stages: typology determination, scenario definition, and scenario generation (Figure 1). In S1.A, ETFE cushion typologies incorporating passive and active fire safety measures are defined. These include 14 modified configurations and one control case representing a standard two-layer, medium-thickness air-filled ETFE cushion, resulting in 15 total typologies. In S1.B, scenarios are established based on facade position (middle, corner, recessed) and fire origin (external, interior, and cushion). In S1.C, combining typologies with scenario variables yields 45 scenarios per fire origin type, resulting in a total of 135 scenarios.
Figure 1.
Theoretical framework and methodology of study.
The second stage (S2) involves creating a dataset based on the structural and material properties of the typologies (S2.A), assigning coefficients to each variable (S2.B), defining quantitative evaluation parameters (S2.C), and conducting AI-supported calculations (S2.D). For computational quantitative evaluation (S2.C), eight parameters are formulated: burning mass (mfuel); time to failure temperature (tfail), the duration until the cushion system loses its structural integrity; dripping mass (mdrip), the mass of the membrane falling due to melting; dripping time (tdrip), the time when dripping starts as a result of membrane melting; burn duration (tburn), the combustion duration if the cushion itself is considered a fuel element; CO equivalent emissions (COeq), the amount of carbon monoxide released during combustion (toxic effect); fire performance index (FPI), a normalized indicator of fire spread potential; and drip performance index (DPI), a normalized index indicating dripping risk. All calculations are performed using AI (S2.D). In the third stage (S3), fire resistance duration and dripping behavior are statistically evaluated using data from the previous stages, and their potential indirect effects on occupant safety and evacuation time are discussed. As shown in Figure 1, this approach provides a comprehensive and comparative assessment of the fire performance of 15 cushion typologies across different facade positions and fire scenarios.
2.1. AI-Based Approaches for Fire Modeling: An Alternative to CFD or Simulations
A multi-stage hybrid method integrating physics-based modeling with an artificial intelligence (AI) approach was developed to evaluate the fire performance of ETFE cushion facade systems. In the first stage, the input variables of the system are defined, where parameters such as ETFE inner and outer layer thicknesses, number of layers, gas infill type, facade location, fire scenario, and active fire protection systems constitute the model input space. These variables represent the fundamental physical and structural factors governing fire behavior. In the second stage, a physics-based model named “CFD-Mimic” is employed, in which the AI performs calculations related to fire performance. In terms of combustion behavior, parameters such as ignition time, burning duration, mass loss rate (MLR), carbon monoxide (CO) and carbon dioxide (CO2) concentrations and their effects on gas toxicity [48], as well as the first dripping time and droplet size during the dripping process of polymers under combustion conditions [49], are of critical importance. Therefore, in this study, similar to previous research, these evaluation criteria are adopted for ETFE, and the computational parameters are defined based on the literature data. Through this model, fire performance parameters such as tfail, tburn, tdrip, mdrip, COeq are calculated for each scenario. The outputs form a large synthetic dataset, which serves as the primary training data for the AI model. In the third stage, a multi-output deep artificial neural network (Multilayer Perceptron, MLP) is trained using this dataset. The network is designed with system parameters as inputs, while ReLU activation functions are used in the hidden layers to capture nonlinear relationships. The model simultaneously predicts fire performance variables, including FPI and DPI, enabling rapid assessment of ETFE behavior under different fire scenarios. In the fourth stage, uncertainty analysis is performed using the mean, standard deviation, and 95% confidence intervals to evaluate prediction reliability. Thus, the model provides both deterministic outputs and statistical confidence. In the final stage, a comparative fire safety assessment is conducted across scenarios. The large language model-based AI component is used as a support tool for scenario generation, data processing, coding, and result interpretation rather than direct prediction. This integrated framework combines physics-based modeling and AI to provide a fast, scalable, and uncertainty-aware fire performance evaluation method. Figure 2a shows the AI model and tools (in the figure, the colors of the arrows and frames represent the following: green indicates normalized indicator values; yellow represents variable scenarios based on façade location and fire exit position; red denotes the AI environment in which ChatGPT is used; and blue represents the Google Colab AI environment), while Figure 2b shows the AI model and networks generated by AI.
Figure 2.
Methodology of AI Model: (a) AI model and tools used in the study; (b) a neural network model implemented in code-based form (ChatGPT (GPT-5 Mini), Google Colab).
AI-based calculations use ChatGPT developed by OpenAI and Google Colab. ChatGPT text-to-code capabilities are referenced in code generation and automated data processing steps, enabling the calculation and visualization process to be reproducible and scalable. These codes are implemented in the Google Colab Python 3.12.12 environment and applied for pandas 2.2.2 (data processing), numpy 2.0.2 (numerical computation), matplotlib 3.10.0 and seaborn 0.13.2 (graph and heatmap visualizations). Parametric typology analyses are conducted using analytical and semi-empirical formulas, and AI-based calculations are applied depending on typology, number of layers, material thickness, and fire scenarios.
AI-based approaches are preferred over CFD and traditional fire simulation tools because they enable automatic execution of formulas and calculation steps through code generation rather than manual processing. This standardizes data handling, allowing fast, parameter-adjustable, and easily reconfigurable computations that can be reproduced quickly. It also enables rapid recalculation across different scenarios and typologies without repeated simulation runs, while automatically generating statistical outputs such as graphs and matrices. As a result, the analysis process becomes faster, more scalable, and more reproducible, significantly reducing reliance on time-consuming simulation environments.
2.2. Proposed ETFE Cushion Typologies with Integrated Passive–Active Fire Safety Measures
Building facades are modeled using 15 ETFE cushion typologies, including a control case and configurations with passive and active fire safety measures designed to improve fire performance. This framework enables a comparative assessment of facade systems based on both material properties and fire behavior. ETFE cushion systems consist of two or more ETFE layers [50,51]; manufacturer data indicate that they are composed of 2-, 3-, or 4-layer membrane systems [52]. Membrane layers are applied in the range of 100–200 μm [53] and 100–300 μm [54], whereas manufacturer data indicate thicknesses of 100 μm, 150 μm, 200 μm, 250 μm, and 300 μm [51], as well as 500 μm [55]. In this study, 100 μm ETFE foils representing the lowest thickness are used for the thin layer, 200 μm foils representing the medium thickness are used for the average layer, and 500 μm ETFE foils representing the highest thickness are used for the thick layer in the cases. Pneumatic inflatable membrane structures are pressurized with air [56] or nitrogen gas [57]. As seen in building examples such as the Allianz Arena Stadium in Munich, the Mercedes-Benz Stadium in Atlanta, the San Mamés Stadium, the Eden Project, and the Media-TIC building, whose facade is pressurized with nitrogen gas [58], inflatable cushion facades are generally pressurized with air, although nitrogen gas is also used in built applications. Thus, based on the literature data, material manufacturers’ information, and applications in built structures, the ETFE cushion cases in this study are defined in terms of material type (ETFE foil, intumescent or anti-drip foil), number of layers (2, 3, or 4 layers), and thickness variations (100 μm, 200 μm, 500 μm), as well as pressurization gas combinations (air and nitrogen). Case C consists of the commonly applied 2-layer, medium-thickness 200 μm ETFE material, while cases P1, P2, P3, P4, P5, P6, and P10 are generated based on these combinations. Due to the ability of intumescent coatings to improve the flame retardancy, self-extinguishing behavior, and anti-drip properties of fabrics depending on the material [59], three cases (P7, P8, P9) reinforced with insulating materials such as intumescent, anti-drip, or glass–wool to enhance fire resistance are defined in this study. These typologies are defined as structural configurations related to passive fire safety measures (P), while cases incorporating active fire suppression systems are defined as (A). For active systems, four typologies (A1, A2, A3, A4) are defined, incorporating water-based water sprinkler and environmentally safe water mist systems used in facades to prevent fire spread and extinguish fire [60,61], CO2 usage for fire suppression and dilution of accumulated toxic gases [62], and a combination of water sprinkler with inert (CO2) gas injection. These systems are defined to investigate fire behavior under the integration of active suppression mechanisms in addition to fire performance related to structural characteristics. Accordingly, a total of 15 different cushion typologies are defined within the scope of this study.
The reference control typology (C) represents a standard cushion system consisting of a two-layer, 200 µm ETFE membrane inflated with air and without any fire safety enhancements. It serves as the baseline for comparison and normalization across all scenarios. Passive typologies include 10 cushions (P1–P10) that address design strategies influencing fire performance before ignition. These variations include changes in ETFE membrane thickness, multilayer configurations, non-combustible interlayers, intumescent coatings, fiber-reinforced or anti-drip solutions to reduce dripping, and nitrogen (N2)-filled cushions. In the passive typologies, geometry and overall system configuration remains constant, while only material, layer, and gas filling properties are varied to assess their effects on fire behavior. P1 consists of a 2-layer air-pressurized cushion with inner and outer layers of equal thickness made of thin ETFE (100 µm). P2 is a 2-layer air-pressurized cushion with inner and outer layers of equal thickness made of thick ETFE (500 µm). P3 and P4 are cushions with differing thicknesses between the inner and outer ETFE layers: P3 has a thick inner membrane (500 µm) and thin outer membrane (100 µm), whereas P4 is the opposite, with a thin inner membrane (100 µm) and thick outer membrane (500 µm). P5 is a 3-layer air-pressurized cushion with a control ETFE membrane thickness of 200 µm. P6 is a 4-layer air-pressurized cushion with a control ETFE membrane thickness of 200 µm. P7 is a 2-layer air-pressurized cushion with a non-combustible glass–wool interlayer between the 200 µm ETFE membranes. P8 corresponds to the control typology but with intumescent coated ETFE layers, forming a 2-layer, 200 µm air-pressurized cushion. P9 is also based on the control typology but with anti-drip, fiber-reinforced ETFE layers, forming a 2-layer, 200 µm air-pressurized cushion. P10 is a cushion with the same properties as the control typology but inflated with nitrogen (N2) instead of air. Active measures consist of four cushion typologies (A1–A4) based on post-detection fire intervention strategies. Using the control ETFE cushion as a baseline, different suppression methods are evaluated, including water spray, inert gas injection, combined water–CO2 systems, and water mist. Specifically, A1 applies water sprinklers, A2 uses CO2 injection, A3 combines water and CO2, and A4 employs water mist. This setup enables comparison of their effects on burn duration, heat release, and toxic gas formation. Overall, the study includes one control (C), 10 passive, and 4 active typologies (Table 1), providing a comprehensive framework for evaluating fire safety strategies.
Table 1.
Physical characteristics of the 15 cushion typology, classified as control (C), passive (P1–P10) or active (A1–A4).
2.3. Numerical Values and Input Data for Calculations
2.3.1. Passive Fire Protection Measures Numerical Data
Passive fire safety calculations present all variables and parameters numerically. The fundamental material properties and numerical parameters of ETFE used in fire safety analyses are provided. Variables such as material thickness, density, specific heat capacity, service temperatures, melting points, and combustion characteristics are determined based on the relevant literature, manufacturer data, and standard test results, and systematically compiled for use in calculations. Since experimental data for some material properties are limited or unavailable, the necessary parameters for ETFE are derived using measurements obtained from PVC membrane materials with appropriate scaling factors.
ETFE foil thickness ranges between 12.5 μm, 25 μm, 37.5 μm, 50 μm, 75 μm, 100 μm, 125 μm, 250 μm, and 500 μm [63]. In this study, thickness values of 100 µm for thin membranes, 200 µm for average thickness, and 500 µm for thick membranes are adopted for cushions. The density of ETFE material ranges approximately between 1,73 and 1,77 g/cm3 [64]. The density of glass–wool material ranges from 10 to 120 kg/m3 [65]. For the typology with a glass–wool interlayer providing fire insulation, the density is taken as an average of 65 kg/m3, with a thickness of 0.01 m. For ETFE, an average density value of 1750 kg/m3 is used. ETFE has a specific heat capacity of 1172 J/(kg·K) [66], with values ranging from 1900 to 2000 JK−1kg−1 [67]. In this study, an average specific heat capacity of 1500 J/kgK is used. ETFE has a typical service temperature range of 89 K to 423 K (−185 °C to +150 °C) [68]. This upper temperature limit represents the maximum use temperature at which ETFE can no longer maintain its mechanical and structural integrity. Therefore, in this study, the temperature at which the structural integrity of ETFE is considered lost is limited to 423 K. According to ISO 1:1975 (and its updated version ISO 1:2022), the “standard reference temperature” is fixed at 20 °C [69,70]. In this study, this standard temperature value, approximately 293 K, is used as the initial temperature of the system. ETFE has a melting temperature range of 225 to 275 °C [71], and a melting point range of 255–280 °C [72]. In this case, the average of these temperature ranges (approximately 260 °C) is taken, and in this study, the melting temperature of ETFE is used as the corresponding approximate average value of 533 K. For 6 different polyvinyl chloride (PVC) variants, the mean mass loss rate (MLR) values are obtained from cone calorimeter tests at a heat flux of 50 kW/m2 on samples measuring 100 × 100 × 3 mm3, resulting in 0.10 g/s, 0.10 g/s, 0.08 g/s, 0.06 g/s, 0.07 g/s, and 0.07 g/s [73]. According to “AS 1530.2 Methods for Fire Tests on Building Materials, Components and Structures, Part 2: Test for Flammability of Materials”, the flammability index of PVC membrane material is expressed with a value of 8, while ETFE is expressed with a value of 6 [74]. For PVC, the measured average MLR over 100 mm2 is 0.08 g/s, which corresponds to 0.008 kg/m2s. Assuming this value corresponds to a flammability index of 8, the burn rate for ETFE material is taken as 0.006 kg/m2s. ETFE material has low flammability due to its high fluorine content. In standard cone calorimeter tests, MLR values are very low, and the measurements require high sensitivity, resulting in very limited data on MLR and associated burn rates for ETFE. In contrast, MLR measurements are widely available for more flammable polymers such as PVC or PE, but experimental data for ETFE remain scarce. Therefore, in this study, an approximate value for ETFE flammability coefficients is derived based on MLR measurements conducted for PVC, and calculations are performed using this value. MLR is determined through a combined validation of the literature data and a comparative scaling approach to reflect the low flammability characteristics of ETFE, due to the limited experimental data on the fire behavior of ETFE membrane materials. The coefficients defined as physical constants describing the fire performance of ETFE are treated as engineering-based model parameters used for the comparative assessment of the relative behavior of different ETFE cushion typologies under fire conditions.
PVC has a CO yield of 0.193 kg/kg, measured through combustion testing [75]. PVC membranes have a smoke developed index of 8 according to “AS 1530.2 Methods for Fire Tests on Building Materials, Components and Structures, Part 3: Simultaneous Determination of Ignitability, Flame Propagation, Heat Release and Smoke Release”, whereas for ETFE, it ranges between 0 and 1 [74]. Consequently, in this study, based on the proportionality of the PVC CO yield (8 to 0–1 ratio as 0.5), the CO yield for ETFE is estimated as approximately 0.012 kg CO/kg fuel and applied in the calculation formulas. A commonly used anti-dripping agent in the industry, polyethylene/polypropylene (PE/PP) containing 2% polytetrafluoroethylene, shows an 85% increase in time to first drip and approximately a 60% reduction in the number of drips [76]. In this context, since a wide variety of ETFE materials exhibit different layer properties, component properties, and ratios (e.g., increased fluorine content) and the anti-drip performance can vary depending on coatings and foils, it is assumed in this study that the drip performance of the anti-drip typology (P9) is 50% lower than the others (comparative performance difference). In the calculations, the anti-drip coefficient is set to 0.1 for the P9 typology and 0.2 for the other typologies. This allows the effect of a halved material dripping characteristic on fire behavior to be investigated.
Coatings are applied to materials in various industries such as construction, textile, electronics, and aerospace to reduce fire hazards and enhance fire resistance [77]. Intumescent coatings for passive fire protection form a thin layer that expands when exposed to fire, creating a protective barrier [78]. This research proposes a typology with intumescent coated ETFE to investigate its advantages over uncoated cushions. The coating effect on the membrane material (for calculating tfail) is set to 1.0 for all typologies, except for P8 (intumescent coated) and P9 (anti-drip), where it is increased to 1.1 to reflect the enhanced heat resistance. The coating effect (for calculating mdrip) is taken as 1.0 for all typologies, except for P7 (with glass–wool), where the drip reducing effect lowers it to 0.2, and P8 and P9, where partial drip limitation results in a value of 0.9. These numerical values and parameters serve as key references for predicting the combustion behavior of ETFE membrane materials and defining model inputs for calculations. Thus, AI input coefficients for ETFE cushion typologies are determined based on experimental findings, the literature data, and material properties, with each coefficient representing a typology-specific physical or chemical effect applied in the calculations.
Sensitivity analysis of the MLR and YCO values derived from PVC is conducted, and their impact on the model results is evaluated in relation to the dependencies arising from the mathematical structure of the model. In the model-based computational approach, variations in the MLR parameter exert an inverse and dominant effect on tburn. According to the model structure, tburn is linearly and inversely dependent on MLR; thus, an increase in MLR results in a proportional but opposite change in burn time. In contrast, the same parameter variation produces a nonlinear effect on COeq. The model formulation defines COeq as being proportional to MLR with a 0.7 power-law exponent, indicating a sublinear, nonlinear sensitivity of COeq to changes in MLR. Variations in the YCO parameter directly and linearly affect only COeq. Accordingly, YCO represents a primary linear driver in CO production prediction, exhibiting a strict 1:1 relationship, where unit changes in the input correspond directly to unit changes in the output. The relationship between YCO and COeq is therefore linear, without amplification or attenuation of uncertainty, resulting in direct propagation of input uncertainty to the output. The effect of MLR on tburn remains inversely proportional and linear, meaning uncertainties are transmitted without amplification and only with a directional inversion. However, the influence of MLR on COeq follows a 0.7 exponent power-law relationship, producing a sublinear damping effect in uncertainty propagation. In contrast, parameters such as tfail, tdrip, mdrip are not directly dependent on MLR or YCO; instead, they are governed by indirect factors including thermal load, material thickness, layer configuration, and system geometry. These variables therefore exhibit a multivariate sensitivity structure and are evaluated as secondary-level responses rather than direct elastic reactions to individual inputs. From an uncertainty propagation perspective, MLR-related uncertainties propagate linearly and inversely into tburn without any amplification effect. For COeq, the 0.7 power-law dependence on MLR introduces a damping behavior, reducing the impact of input uncertainty on the output. YCO-related uncertainty, however, is transferred directly and proportionally to COeq without modification. Additionally, FPI and DPI indices derived from tburn, mdrip, and tdrip serve as normalized, dimensionless performance indicators enabling scale-independent comparison across different system typologies. Overall, the model demonstrates stable numerical behavior in terms of uncertainty propagation, with no amplification effects. Uncertainties are either linearly transferred or partially attenuated due to nonlinear (power-law) relationships. This framework enables comparative performance assessment under data-limited conditions across different ETFE fire behavior typologies. Model parameters are integrated based on the literature data and standardized performance metrics. All results are further evaluated using confidence intervals. Nevertheless, to improve parameter reliability, future full-scale ETFE fire experiments are required for validation and potential calibration of the coefficients used in this study.
2.3.2. Active Fire Protection Measures Numerical Data
Active systems, which operate during a fire to detect flames or smoke, issue warnings, suppress the fire, and facilitate evacuation, are classified according to the Environmental Product Declaration (EPD) data from [79] as fire detection systems, fire alarm systems, fire suppression systems, standpipe and hose systems, fire ventilation systems, and portable fire extinguishers (water-based, foam, carbon dioxide, or dry/wet chemical). Calculations are carried out within the scope of 4 active suppression systems applicable to cushions. These include water sprinklers, inert gas (CO2), combined water and inert gas (CO2), and water mist. For cushion systems, the implementation of active suppression is proposed by introducing gaseous agents through the existing pressurization system of the cushion, while water-based agents are supplied via a secondary water suppression installation integrated into the cushion.
A water sprinkler system is a measure used for fire suppression on facade claddings, which affect fire behavior depending on the material’s amount, extent, location, and type, as well as how the material is fixed, and reduces the risk of life loss [80]. Drawing on fire incident data, the effectiveness of sprinkler systems varies between approximately 70.1–99.5% [81]; automatic extinguishing systems operate effectively in about 39.8% of cases [82]. Consequently, the continuous operation and regular maintenance of extinguishing systems is required. Accordingly, in this study, the effective suppression ratio for the water sprinkler system is represented by a coefficient of approximately 0.4 (A1). CO2 suppression systems require, in accordance with NFPA 12, an extinguishing concentration of at least 34% for flaming combustion [83]. This value represents only the design criterion of CO2 gas for fire suppression and not the actual extinguishing effectiveness; however, the concentration is used in this study as a relative effectiveness indicator within the fire performance factor, set at 0.35 (A2). The combined performance of the two systems, water sprinkler and CO2 (A3), is evaluated at approximately 0.5 (50%) by considering the cumulative effect of their respective fire performance factor coefficients. Although this value is not reported as a fixed total efficiency in the literature, it is employed as a reasonable and consistent representation of the fire suppression capacity provided by the systems in modeling and risk analysis. Water mist systems provide a significant contribution to fire suppression, with experimental results indicating that approximately 25–30% of the heat released during combustion is absorbed by the water mist [84]. Related to this research and to standards, “Fire Performance Factor (FPF)” is defined based on reported experimental studies in the literature, statistical fire data, and relevant standard design criteria in order to express the relative effectiveness of different active fire suppression systems within a comparable framework. It is formulated as a normalized coefficient to convert effectiveness values into a common comparative scale. In this context, reported experimental success rates or design-based performance indicators for each system are directly used; however, these values are transformed into representative performance coefficients in the range of 0–1 to account for uncertainties in real-world conditions, implementation variations, and maintenance/operation variables. Through this approach, the coefficients used for the A1 (0.4), A2 (0.35), A3 (calculated value 0.5), and A4 (0.3) typologies with active fire safety measures are not absolute efficiency values, but normalized performance indicators based on the literature, experimental results, or reports that enable the comparison of different active fire protection strategies.
For A3 typology, the combined fire performance of water sprinkler and CO2 systems is calculated not as a direct summation, but using a probabilistic combination approach assuming system independence, including an overlap effect and a 20% loss factor for redundant functionality (η = 0.2), as expressed in Equation (1). Due to partial overlap in suppression mechanisms, the systems are not treated as fully independent. When both systems operate simultaneously in the same fire scenario, water provides rapid cooling while CO2 suppresses flame chemistry, reducing burning rate, temperature, and toxic gas production. However, interactions such as CO2 dilution by sprinkler water and reduction in inerting efficiency due to decreased CO2 concentration also occur. Therefore, the overall efficiency is evaluated by considering both synergistic suppression effects and overlapping functional losses.
FPFA3 = (FPFA1 + FPFA2 − (FPFA1 × FPFA2))(1 − η) = (0.4 + 0.35 − (0.4 × 0.35))(1 − 0.2) = 0.488 ≈ 0.5
The calculation coefficients for the four active system typologies proposed in this study, derived from the literature data and AI-based predictions, are presented in Table 2.
Table 2.
Typology-specific factors for active fire performance of ETFE cushions.
2.4. Multi-Scenario Development Considering Fire Origin Based on Heat Flux and Cushion Position on the Facade
ETFE cushion units are positioned in various ways on building facades. In addition to variations in material and system properties, their location on the facade directly influences fire direction and spread. Therefore, to quantitatively assess the effects of facade position, the effective heat flux methodology is applied and integrated into the calculations. In evaluating the fire performance of ETFE cushions, the effective heat flux (qeff) on exposed surfaces is considered a key parameter for positioning, with coefficients applied relative to the reference heat flux. The effective heat flux is calculated by adjusting the reference heat flux value using multiplier coefficients based on the facade position and fire scenario.
In experimental cone calorimeter tests, the baseline value 50 kW/m2 is adopted [85], and for high-temperature tests on loaded wall specimens, a heat flux of 50 kW/m2 is applied [86]. This reference heat flux value is also used in the study, and calculations are performed by modifying the heat flux intensity according to scenario-specific factors. This value represents the heat flux (qref = 50 kW/m2) for a cushion positioned on the middle of facade and exposed to unidirectional fire impact. The effective heat flux is calculated using the following general expression. The effective heat flux (qeff) for a cushion based on its facade position is determined by the position-dependent factor (Φpos) and the fire scenario-dependent factor (Φfire) Equation (2).
qeff = qref · Φpos · Φfire
This study investigates the condition in which cushions are positioned in three different configurations on a building facade, namely middle (M) (Figure 3a), corner (C) (Figure 3b), and recessed (R) (Figure 3c) facade. The blue color represents the cushions arranged linearly on the facade, whereas the red color indicates the cushion placement (middle, corner, or recessed) determined according to the scenario. Heat flux values are calculated for 3 different positions defined according to the role of facade geometry in either amplifying or reducing fire effects.
Figure 3.
Cushion placement locations classified: (a) middle (M) facade location of cushion; (b) corner (C) facade location of cushion; (c) recessed (R) facade location of cushion.
Cushion systems located at the middle section of the building facade are generally exposed to a unidirectional fire effect, and this condition is represented by reference heat flux values. Cushions located at corners, where two differently oriented facades intersect, may be simultaneously exposed to radiative and convective heat effects originating from two separate facades, resulting in an effective heat flux that is approximately twice as high. In contrast, facade elements positioned in recessed or niche configurations experience a reduction in incident heat flux due to geometric shading effects. Accordingly, the position-dependent factor (Φpos) is defined as 1.00 for M, 1.75 for C, and 0.80 for R. The thermal effects experienced by ETFE cushion systems vary depending on the location of fire ignition. For this reason, three primary fire scenarios are defined based on the fire origin: externally induced facade fires, internally induced fires, and fires originating within the cushion itself. Externally induced facade fires represent flame exposure resulting from sources such as waste container fires or adjacent buildings. In these scenarios, ETFE surfaces are predominantly exposed to radiative heat flux, and a moderate effective heat flux is assumed. Internally induced fires, particularly those involving flame ejection through windows after flashover, constitute the most critical scenario for facade systems. In this case, ETFE cushions are subjected to both high radiative and convective heat, leading to the most unfavorable conditions in terms of perforation time and fire spread potential. Fires originating within the cushion occur under relatively limited oxygen conditions and are primarily characterized by a heat transfer mechanism dominated by convection. Although the magnitude of heat flux varies depending on fire location, the fire scenario-dependent factor (Φfire) is taken as 1.00 for externally induced facade fires, 1.50 for internally induced fires, and 0.90 for fires originating within the cushion. A higher heat flux coefficient is applied for internally induced fires due to increased flame contact and heat accumulation, whereas a lower multiplier is defined for the cushion fire scenario by considering limited oxygen availability and volume effects. The calculated effective heat flux values are presented in Table 3 below, and these factors are used in subsequent calculation equations.
Table 3.
Effective heat flux (qeff) values for different facade positions and fire scenarios.
Heat flux and fire behavior are influenced by the position of the cushion; therefore, in order to investigate this relationship, a multiplier coefficient is defined and incorporated into the relevant formulations. Heat flux values are directly used in the calculations of heating time, melting time, and burning duration for each typology. Through this approach, the same cushion typology can be reassessed for different facade positions, and the influence of position on fire performance is quantitatively demonstrated. Each fire scenario is represented by a distinct level of effective heat flux and is directly integrated into the calculations of the defined evaluation parameters. In this way, uncertainties related to the fire origin are addressed within a numerical and comparable framework.
2.5. Quantitative Fire Performance Assessment with Defined Indicators and Calculation Methods
A parametric framework is developed, and 8 quantitative evaluation parameters are employed in the study in order to enable the defined typologies to be analyzed in a material-based and scenario-dependent yet comparable manner. The formulas used in the calculations are based on physical quantities such as membrane thickness, number of layers, material density, and thermal properties. The calculations are performed using analytical, semi-empirical, or nonlinear formulations derived from fundamental material characteristics. To account for the effects of cushion typology, number of layers, surface coating, and active fire protection measures on fire-related parameters, empirical correction factors are applied; these factors capture influences that cannot be fully represented by analytical heat transfer calculations alone.
The effective thickness values of the cushions (deff) (Equation (3) for external fire scenarios, Equation (4) for interior fire scenarios, Equation (5) for cushion fire scenarios) are calculated in meters according to the fire exposed surface for externally induced (deff-ex), internally induced (deff-in), and cushion-originated (deff-cushion) fire scenarios. For cushion-originated fires (deff-cushion), the average of the inner and outer membrane surface thicknesses is used. Since the effective thickness value directly influences heat transfer and burning behavior, it is calculated based on the fire-exposed surface of the material and the corresponding average thickness.
deff = deff-ex, fire scenario (external)
deff = deff-in, fire scenario (interior)
deff = deff-cushion (deff-out + deff-in/2), fire scenario (cushion)
The calculation of combustible mass (mfuel) considers the contributions of ETFE (mfuel,ETFE) (Equation (6)) and glass–wool (mfuel,Glasswool) (Equation (7)), and the total combustible mass (mfuel,Total) is determined by accounting for both the ETFE material and the glass–wool layer (P7), 0 for other typologies. This approach defines the material combustibility capacity and the potential amount of energy released during a fire. Material densities are taken as (pETFE = 1750 kg/m3) for ETFE and (pGlasswool = 65 kg/m3) for glass–wool; thickness values are defined as the effective thickness (deff) for ETFE and 0.01 m for glass–wool; the number of layers is assumed as (nlayers) for ETFE and 1 for glass–wool (nGlasswool). The total burning mass (mfuel,Total) (Equation (8)) is obtained for all typologies as the sum of ETFE and glass–wool contributions. In this way, the combustible mass (kg/m2) incorporates thickness- and layer-dependent parameters according to the fire scenarios, reflecting the physical characteristics of each scenario.
mfuel,ETFE = pETFE · nlayers · deff
mfuel,Glasswool = pGlasswool · dGlasswool · nGlasswool (for P7)
mfuel,Total = mfuel,ETFE + mfuel,Glasswool
Time to reach the critical temperature (s) (tfail) is defined as the duration required for the material to reach its critical temperature when exposed to fire. It represents the perforation or damage time at which the ETFE cushion system loses its functionality under fire exposure. This parameter is calculated as a function of the effective heat flux and the thermophysical properties of the material, and it determines the fire resistance duration of the material as well as the time to reach the critical temperature. The parameter is calculated based on membrane thickness, material properties, and the incident effective heat flux, and it is of critical importance for maintaining facade integrity. The base time to reach the critical temperature is calculated using material density (p), specific heat capacity (cp = 1500 J/kgK), effective thickness (deff), critical temperature at which structural integrity is lost (Tfail = 423 K), initial temperature (T0 = 293 K), and effective heat flux (referance qeff = 50,000 W/m2, with variable values depending on position and scenario). To obtain the calculated time to reach the critical temperature (tfail) from the base value (tfail,base) (Equation (9)), multiplier components representing the coating factor (cf) and the active control system effect, defined as the active factor (af), are incorporated. As the material thickness, density, and heat capacity increase, the value of (tfail) (Equation (10)) increases accordingly.
tfail,base = p · cp · deff · (Tfail − T0)/qeff
tfail = tfail,base · (1 + 0.5 (nlayers − 2)) · cf · af
Mass of droplets released due to melting at high temperature (kg/m2) (mdrip) represents the mass discharged into the surroundings as a result of melting or dripping of combustible materials. This parameter estimates the amount of flaming droplets during a fire and, consequently, the potential for fire spread. It is calculated using the total combustible mass (mfuel,Total), the dripping factor (fdrip), the efficiency of active systems in preventing dripping (nactive), the number of layers (nlayers), and the dripping coating factor (cfdrip), which represents the effect of surface coatings in reducing dripping (Equation (11)). Dripping factor (fdrip) is 0.2 for all typologies, except for P9, which includes a drip-resistant membrane, for which a value of 0.1 is adopted.
mdrip = mfuel,Total · fdrip · (1 − nactive) · (1 + 0.05 (nlayers − 2)) · cfdrip
Dripping time (s) (tdrip,base) (Equation (12)) and (tdrip) (Equation (13)), represents the duration required for the material to reach its melting temperature and for dripping to initiate. The melting temperature (Tmelt = 533 K) is adopted for ETFE. Scenario factors (sf) and the effect values of active systems (nactive) may delay the onset of dripping. This time is of critical importance for understanding fire risk and material behavior. These parameters are particularly used in the assessment of potential harm to occupants caused by dripping, occupant safety, and secondary fire risks.
tdrip,base = p · cp · deff · (Tmelt − T0)/qeff
tdrip = tdrip,base · sf · (1 + nactive)for active typologies
Burn duration (s) (tburn), defined as the time required for the material to burn completely, is calculated in a nonlinear manner as a function of thickness and number of layers (Equation (14)). This approach reflects the fact that thicker and multilayer materials require longer burning times than would be predicted by a simple linear relationship. Exponential factors numerically represent the influence of material thickness and number of layers on burn duration; accordingly, the burning time increases in a nonlinear manner depending on material properties, while the total combustible mass and burn rate define the base duration. The burn rate for ETFE is (br = 0.006 kg/m2s). Active systems may either extend or reduce the burn duration. This calculation estimates the time over which the material will burn during a fire and, consequently, the overall fire duration. The burn duration increases with increasing total combustible mass and decreases with increasing burn rate, reflecting the direct proportionality to total combustible material and the inverse proportionality to burn rate embodied in the burn duration formulation.
tburn = mfuel,Total/br · (deff · 103)1.2 · (nlayers)0.9
The equivalent carbon monoxide release (kg/m2) (COeq) during a fire is calculated non-linearly (Equation (15)). The amount of toxic gas released during combustion depends on material properties and burn duration. CO production for ETFE is (YCO = 0.012). By numerically accounting for material thickness, number of layers, gas type, and the effects of active fire protection systems, the model simulates CO generation under specific combustion conditions. The numerical coefficients used in the formula are dimensionless multipliers that non-linearly represent the effects of material thickness, number of layers, burn rate, and active fire protection systems on CO production, in agreement with experimental observations. The influence of burn rate on CO production, which increases at higher burn rates, is represented by 0.7; the decrease in CO production with increasing material thickness and number of layers, due to retention of combustion products within the material and slower reaction kinetics, is represented by −0.5 and −0.7, respectively. This calculation is used to predict toxic gas generation for fire safety assessments.
COeq = YCO · (mfuel,Total/tburn)0.7 · (deff · 103)−0.5 · (nlayers)−0.7
Fire performance index (FPI) and drip performance index (DPI) represent the normalized elements calculated in the study to express the fire behavior of the material. These indices integrate different parameters, enabling a holistic assessment of the relative risk level of each typology in terms of facade fire. FPI consolidates the fire spread potential relative to the cushion’s burn duration into a single index. The coefficients used in the FPI and DPI calculations are dimensionless multipliers that determine the contribution of burn duration, droplet mass, and dripping time to the overall performance; for instance, in FPI, burn duration contributes 20%, while in DPI, droplet mass accounts for 60% and dripping time for 40% of the total. In fire safety analyses, the mass of droplets is a more critical indicator, as it directly poses physical and thermal risks to lower areas and materials during a fire, whereas the onset time of dripping only affects the process by delaying or accelerating it. Therefore, in the DPI calculation, the droplet mass is weighted at 60% and the dripping onset time at 40%. This distribution balances the relative importance of risk components, ensuring that the calculation aligns with design and risk analysis logic. Using FPI and DPI indices, the dataset is globally normalized across all typology–position–scenario combinations, producing comparable and scenario typology-specific numerical risk indicators. Values range between 0 and 1, with higher values indicating greater risk or performance impact. The FPI (Equation (16)) and DPI (Equation (17)) indices enable a numerical evaluation of material fire performance, allowing objective comparisons and safety assessments under different fire scenarios. A high FPI value indicates a high potential for fire spread, while a high DPI value signals additional risks due to falling material. Conversely, low values suggest limited associated risks and that existing mitigation measures may be sufficient.
FPI = 0.2 · (tburn,max/tburn)0.8
DPI = 0.6 · (mdrip/mdrip,max)0.7 + 0.4 (1 − (tdrip/tdrip,max)0.5)
These equations, taken as a whole, are used to quantitatively evaluate material performance under fire exposure, including fire resistance, burn duration, dripping behavior, and toxic gas production. The effects of active and passive mitigation measures on material performance are modeled using coating and active factors. In this way, the safety performance of materials under different fire scenarios is quantitatively demonstrated.
3. Results
ETFE cushion facade system fire performance is calculated comparatively using AI for 15 typologies under three fire scenarios and three facade positions, within the context of eight quantitative parameters. Based on the three main fire origin locations (External: E, Interior: I, Cushion: C), AI generated calculations for 135 scenarios across eight parameters (tfail, tburn, COeq, tdrip, mdrip), as shown in Table 4.
Table 4.
Fire scenario (tfail, tburn, COeq, tdrip, mdrip) results calculated by ChatGPT, Google Colab.
FPI and DPI values are presented in Table 5. The results are analyzed in four main evaluation groups: combustion behavior (mfuel, tfail, tburn), toxic CO emission effects (COeq), cushion dripping behavior (mdrip, tdrip), and normalized fire and dripping performance indices (FPI, DPI). This approach enables the assessment of fire safety performance measures across typologies, highlighting differences in fire and dripping behavior between them and allowing a comparative evaluation of the results.
Table 5.
Fire scenario normalized FPI and DPI results calculated by ChatGPT, Google Colab.
3.1. Fire Performance Analysis of Cushion Typologies Under External Fire Scenarios
Fire scenarios with an external origin highlight the critical influence of the outer ETFE membrane thickness, which directly determines the system’s thermal response and damage mechanisms. Performance differences among typologies are primarily governed by membrane thickness, number of layers, and the properties of the fire exposed outer surface. The C position has limited thermal mass; under external fire exposure, this results in minimal thermal delay and, particularly for C-C configurations, the combined radiative and convective heat from two directions leads to early loss of structural integrity. While C-M and C-R exhibit acceptable reference behavior in terms of tfail, corner positions remain among the most vulnerable systems. P1, due to its low thermal mass and limited thermal buffering capacity, produces the shortest tfail in external fire scenarios, with P1-C showing the earliest structural integrity loss. This clearly demonstrates that thin ETFE membranes are highly weak regarding structural delay under facade fires. P2, benefiting from increased thermal mass and heat capacity, significantly prolongs tfail. Among passive typologies, the longest tfail in external fires is observed for P2-M and P2-R, although this improvement does not fully eliminate secondary risks associated with increased fuel mass. Systems with different layer thicknesses show that P3, with a thin outer membrane, exhibits limited performance under external fire and behaves similarly to P1 in terms of tfail. Conversely, P4, with a thick outer membrane, extends tfail; however, early degradation of the inner membrane prevents complete elimination of dripping and secondary damage risks. This indicates that increasing thickness only in the outer layer provides a partial advantage in external fires. P5 and P6, with their multilayer structure, allow more gradual heat transfer between layers, resulting in more stable thermal behavior. In corner positions, tfail reductions for these typologies are limited, though absolute tfail values remain lower than those of thick single-layer systems. P7 extends tfail relative to the C, due to partial heat absorption by glass–wool fibers, but the overall thermal resistance increase is limited, preventing tfail from reaching the levels of P2 and P4. P8 delays heat transfer through an expanded surface layer during fire exposure and ranks among the top passive systems in tfail. P9 primarily improves dripping behavior while providing a limited but consistent tfail increase. P10, despite the oxygen dilution effect, performs similarly to the control typology in terms of structural delay. Among active systems, A1 significantly prolongs tfail in external fires by reducing membrane temperature. A2, although suppressing combustion reactions, lags behind A1 due to limited cooling effect. A3, combining cooling and inerting, achieves the longest tfail among all typologies, maintaining structural integrity most effectively in external fire scenarios. A4 extends tfail via surface cooling but does not reach the high values achieved by A3.
In the external fire scenario, tburn represents the burn behavior of the cushion system as a fuel element. For passive systems, an increase in the number of layers and total fuel mass leads to a longer tburn duration. In this context, P2, P5, and especially P6 stand out as passive systems with the longest tburn under external fire. This prolongation allows the fire to continue for a longer period and actively contributes to the facade systems fire load. However, an extended tburn does not necessarily indicate preserved structural integrity. Indeed, when examining the tfail parameter, it is observed that thick and multilayer systems, although exposed to fire for a longer period, lose structural integrity after a certain time (particularly at corner positions) due to the increased heat flux. This demonstrates that tburn and tfail must be evaluated independently. Conversely, P1 and P3 exhibit the shortest tburn due to their limited fuel mass. However, this short burn duration coincides with early tfail, rapid membrane melting, and high dripping risk caused by low thermal mass. Even though the fire duration is short in these typologies, early structural integrity loss does not imply that the system is safe against fire. For active systems, tburn is significantly reduced due to energy suppression mechanisms. Notably, A3 and A4 achieve the lowest tburn values in external fire scenarios, effectively limiting fire duration. In these typologies, tfail values are also observed to be significantly longer compared to passive systems. This indicates that active systems not only shorten burn duration but also maintain structural integrity for a longer time by reducing membrane temperature. Therefore, the primary function of active systems is to rapidly reduce fire load and delay structural damage rather than to extend combustion. The tfail and tburn results for the 15 typologies under external fire scenarios are presented in Figure 4.
Figure 4.
Burn duration and time to failure temperature values for external fire scenarios (ChatGPT, Google Colab).
COeq parameter (Figure 5) is directly influenced by both the burn rate and the oxygen conditions of the combustion environment. In the external fire scenario, thick and multi-layered passive typologies (particularly P2, P6) produce higher COeq values compared to C due to increased fuel mass. Although these typologies offer advantages in terms of tfail, they exhibit a less favorable profile in terms of toxicity. P8 and P9, through surface modifications, limit both the burn rate and secondary fires caused by dripping, thereby significantly reducing COeq values. P10, benefiting from oxygen dilution, achieves the lowest COeq among passive systems and emerges as the most favorable passive solution regarding toxicity. Among active systems, A3 and A4 reach the lowest COeq values in the external fire scenario, with A3 in particular directly suppressing combustion reactions and minimizing toxic gas production. The highest COeq values are observed at corner positions of passive typologies containing thick and multi-layered ETFE.
Figure 5.
CO equivalent emission values for external fire scenarios (ChatGPT, Google Colab).
In external fire scenarios, dripping behavior (tdrip, mdrip) (Figure 6) is critically important for assessing secondary fire and fire spread risks beneath the facade. P9, through direct material modification, produces the latest tdrip onset and the lowest mdrip values, making it the safest passive solution in terms of dripping. This highlights the direct influence of membrane material properties on fire behavior. P7 delays the onset of tdrip but does not completely eliminate mdrip. C, P1, and P3 typologies stand out as the riskiest systems due to early dripping and high mdrip values. Active systems, particularly those employing water-based interventions, significantly reduce mdrip values. Among them, A4 achieves the lowest mdrip in the external fire scenario, effectively minimizing secondary risks caused by dripping.
Figure 6.
Dripping mass and time values for external fire scenarios (ChatGPT, Google Colab).
FPI and DPI results are presented in Figure 7. FPI values are higher in passive systems with long tburn durations, with P2, P5, and P6 typologies exhibiting particularly high fire spread potential in the external fire scenario. Active systems (A1–A4), through their energy suppression effects, significantly reduce FPI values, with A3 achieving the lowest FPI overall. In terms of DPI, the best performance is observed in P9 and the active systems. The highest DPI values are seen in C, as well as in corner positions of P1 and P3 typologies.
Figure 7.
Normalized FPI and DPI values for external fire scenarios (ChatGPT, Google Colab).
System durability (tfail) is highest in A3, providing approximately 50–70% longer resistance compared to C, which offers critical additional time for maintaining facade structural integrity and ensuring safe occupant evacuation. The poorest performance is observed in P1, exhibiting tfail values similar to or shorter than C. In terms of burn duration (tburn), passive multilayer systems (P5, P6) display extended burn times (~20–30% increase), whereas active systems (A3, A4) rapidly suppress combustion, reducing the fire load. Regarding toxicity and combustion effects (COeq), the highest CO production occurs in P5 and P6, while active systems A2 and A3 achieve approximately 40–60% reduction in CO generation. For dripping behavior (tdrip, mdrip), P9 and A4 produce the lowest dripping mass, reducing it by roughly 60–80%. Considering FPI and DPI, passive control systems and thin membranes present higher risk, whereas active systems and P9 show lower risk, minimizing fire spread and secondary hazards from dripping.
External fire scenarios show that passive systems provide resistance and delay primarily through membrane thickness and layer count; however, these benefits often coincide with longer burn durations and increased toxicity. Active systems, by simultaneously reducing fire intensity, CO production, and dripping risk, offer a more comprehensive safety performance in external facade fires. In this context, the A3 typology, which combines water and inert gas interventions, emerges as the most balanced and safest solution for external fire conditions.
3.2. Fire Performance Analysis of Cushion Typologies Under Interior Fire Scenarios
Interior fire scenarios expose all ETFE cushion typologies to more severe thermal conditions compared to external fires due to the increased heat flux and the confined nature of the interior environment. In this context, since the fire directly impacts the inner surface, the primary parameters governing system performance are the inner ETFE membrane thickness and the applied passive or active interventions. When tfail and tburn are evaluated together for interior fire scenarios, it becomes evident that system behavior is predominantly determined by the inner ETFE membrane thickness and the total fuel mass. The C typology exhibited early tfail values due to rapidly rising temperatures inside the space. In corner positions, the accumulation of hot gases in the interior led to increased radiative loading on the facade surface, causing the C to lose structural integrity quickly. P1 showed the weakest performance among passive systems in interior fire conditions; its thin ETFE membrane with low thermal mass could not absorb the high interior heat flux, resulting in early tfail, short tburn, and high dripping potential. Similarly, P4 suffered notable performance loss in the interior fire scenario despite the advantage of a thick outer membrane, completely losing the relative benefit it exhibited in external fires. The short tfail values for P1 and P4 demonstrate that some typologies advantageous in external fires can become significantly disadvantaged under interior fire conditions. In contrast, P3, with a thick inner membrane, achieved the longest tfail among passive systems in interior fires. The increased inner membrane thickness provided higher thermal mass and delay, enabling structural integrity to be maintained for a longer duration. This typology clearly highlights the importance of directional optimization of membrane thickness for interior fire scenarios. P5 and P6 exhibited a more balanced combustion process in interior fires by distributing heat across layers. Particularly, P6, with its 4-layer structure, produced a more controlled relationship between tfail and tburn; however, the increased fuel mass led to a disadvantageous COeq profile. P7 extended tdrip and delayed dripping onset due to the glass–wool fibers partially retaining the melting ETFE mass. Nevertheless, the additional fuel load from the fibrous material and the abundant oxygen in the interior prevented significant improvement in COeq values. P8 slowed heat transfer through the formation of an expanded char layer on the surface, increasing tfail while reducing COeq and DPI values. P9 excelled in dripping behavior, producing the lowest mdrip and DPI among passive systems in the interior fire scenario. P10 reduced oxygen concentration in the interior, lowering combustion efficiency and limiting toxic gas production, achieving the best COeq performance among passive typologies, although it lagged behind thick inner membrane systems in structural delay. Active systems demonstrated markedly superior performance in interior fires. A1 reduced inner surface temperatures, extending tfail and decreasing dripping mass. A2 improved COeq values by lowering oxygen concentration. A3, combining both cooling and inerting effects, produced the lowest FPI and DPI in interior fire conditions and emerged as the most balanced active solution. A4 effectively limited dripping and surface damage, preventing fire spread across the facade system.
In terms of tburn (Figure 8), the multi-layered typologies with high fuel mass, P5 and P6, exhibit the longest burn durations in interior fire scenarios. This results in the fire persisting for a longer period and actively contributing to the facade system’s fire load. Active systems, however, reverse this trend by significantly reducing burn duration. Notably, A3 in the interior fire scenario both extends tfail and minimizes tburn, demonstrating a clear advantage over passive systems. This outcome highlights that active interventions not only shorten the fire duration but also help maintain structural integrity for a longer period.
Figure 8.
Burn duration and time to failure temperature values for interior fire scenarios (ChatGPT, Google Colab).
Interior fire scenarios highlight COeq (Figure 9) as a critical performance indicator due to the potential accumulation of toxic gases within the enclosed space. Multi-layered passive systems exhibit disadvantageous COeq profiles because extended burn durations and higher fuel mass increase toxic gas generation. In contrast, P8, P9, and P10 significantly reduce COeq in the interior environment. Among passive systems, P10 achieves the lowest COeq, demonstrating that oxygen dilution is an effective strategy for limiting toxic gas production in interior fire scenarios. Among active systems, A3 and A4 reduce COeq to the lowest levels, representing the safest solutions in terms of toxicity for interior fires.
Figure 9.
CO equivalent emission values for interior fire scenarios (ChatGPT, Google Colab).
Interior fire scenarios show that dripping behavior (tdrip, mdrip) (Figure 10) occurs earlier compared to external fires, with shorter tdrip times. This is due to the interior surface being directly exposed to high temperatures. Among passive systems, P9 both delays tdrip and minimizes mdrip, making it the safest solution regarding dripping. In contrast, C, P1, and P3 exhibit early dripping and high droplet mass, forming the most critical risk group. Active systems, particularly those using water-based interventions, significantly reduce mdrip; A4 stands out as the most effective system for limiting dripping mass in interior fire scenarios.
Figure 10.
Dripping mass and time values for interior fire scenarios (ChatGPT, Google Colab).
When FPI and DPI indices are evaluated together (Figure 11), it can be seen that multi-layered passive systems with long tburn exhibit higher fire spread potential in interior fire scenarios. In particular, P5 and P6 typologies clearly demonstrate this trend with high FPI values. In contrast, active systems significantly reduce FPI through energy suppression and modification of environmental conditions. The highest DPI risk is observed in C and P1. P9 and active systems achieve minimum DPI values, effectively limiting droplet-related risks.
Figure 11.
Normalized FPI and DPI values for interior fire scenarios (ChatGPT, Google Colab).
P3 among passive systems provides the longest tfail, while P1 and P4 exhibit early structural failure in interior fires. A3 achieves approximately 60% longer tfail compared to all passive typologies. In terms of tburn, multi-layered passive systems show an increase, whereas active systems exhibit about a 50% reduction, indicating a rapid decrease in fire load. P10 reduces COeq the most among the passive systems, while A3 and A4 achieve nearly a 50% reduction in toxic gas. Dripping behavior (tdrip, mdrip) is most reduced by A4 and P9 compared to C (~70–80%). Active systems minimize FPI and DPI, effectively controlling fire spread and dripping risks. Overall, the interior fire scenario represents a situation where passive measures alone are insufficient, and active interventions play a decisive role in controlling fire intensity, toxicity, and secondary damages. Considering structural delay, burn duration, and toxic gas production together, A3 emerges as the most balanced and safest solution for interior fires.
3.3. Fire Performance Analysis of Cushion Typologies Under Cushion Fire Scenarios
Fire scenarios occurring in the cushion are evaluated as the most critical and complex fire situation in ETFE cushions. Since the fire simultaneously affects both the inner and outer membrane surfaces, system behavior is no longer dependent on a single surface; the effective thickness is defined as the average of the inner and outer membrane thicknesses. This largely eliminates the advantages of passive typologies with a difference in membrane arrangements. C is among the earliest systems to show thermal damage in the cushion fire scenario; its limited thermal mass and lack of any suppression mechanism result in low tfail values. P1 and P2, despite providing relative advantages in external or interior fire scenarios, offer only limited improvement under symmetric heat exposure. Similarly, P3 and P4, which have surfaces of differing thickness, lose most of the performance differences observed in interior or external fires, providing only marginal delay compared to the control typology. In contrast, P5 and P6 distribute the fire effects more homogeneously across layers, exhibiting a more stable and controlled damage process. In these typologies, tfail extends more evenly compared to systems relying solely on single thickness increases; however, due to the increased total fuel mass, tburn duration also increases noticeably. This indicates that multi-layered passive systems provide structural delay while also increasing fire load. P7, with glass–wool fibers partially absorbing heat, extends tdrip and delays the onset of dripping. However, the additional fuel load introduced by the fibrous material causes a slight increase in COeq in the cushion fire scenario; therefore, P7 shows positive performance in dripping but neutral performance in toxicity. Surface-modified P8 and P9 achieve significant improvement in both dripping behavior and COeq in cushion fires. In particular, P9 stands out among passive systems as the most effective solution in limiting dripping risk, with low mdrip and low DPI values. P10 produces by far the lowest COeq values among passive systems in the cushion fire scenario. The reduction in oxygen concentration by inert gas directly limits combustion reactions and suppresses toxic gas formation. This result highlights inert gas-filled systems as a critical passive strategy, especially for fires developing in enclosed volumes. Active systems are the group that produces the most pronounced performance differences in cushion fire scenarios. A2 and A3, through inert gas injection, directly suppress combustion reactions, shorten tburn, and minimize COeq values. A3 exhibits the most balanced performance in terms of system durability, burn duration, toxicity, and dripping parameters. A4, through the effect of water mist, significantly reduces the melting membrane mass, lowering mdrip and the corresponding DPI values to the lowest levels in the cushion interior fire scenario. In cushion fire scenarios, tfail and tburn (Figure 12) depend more on the number of layers and active suppression mechanisms than on thickness differences, due to the averaging of effective thickness. In this context, P5 and P6 exhibit more stable behavior among passive systems, while active systems clearly achieve the highest tfail and lowest tburn combination.
Figure 12.
Burn duration and time to failure temperature values for cushion fire scenarios (ChatGPT, Google Colab).
COeq values (Figure 13a) represent the most critical condition among the three fire scenarios in this study. Among passive systems, P10 achieves the lowest COeq values due to the effect of inert gas filling, while among active systems, A2 and especially A3 act as the most effective solutions, reducing COeq to minimum levels. This indicates that inerting strategies are indispensable in interior cushion fire scenarios. Dripping behavior (tdrip, mdrip) (Figure 13b) reaches the highest risk levels in interior cushion fires. Symmetric heat exposure accelerates membrane melting and increases dripping potential. P9 is the passive typology where this risk is best controlled. A3 and A4 produce the lowest DPI values, minimizing the secondary fire risk beneath the cushion. FPI and DPI values for interior fire scenarios are presented in Figure 13c.
Figure 13.
Cushion-based fire scenario results as: (a) CO equivalent emission values for cushion fire scenarios; (b) dripping mass and time values for cushion fire scenarios; (c) FPI and DPI values for cushion fire scenarios (ChatGPT, Google Colab).
System durability (tfail) shows that, since the effective thickness is averaged, advantages in passive typologies with surfaces of varying thickness are reduced. P5 and P6 remain stable for slightly longer periods. A3 provides approximately 50–70% longer durability compared to C. While passive systems continue to exhibit high tburn durations, active systems rapidly reduce the fire load. Among passive systems, P10 achieves the lowest COeq, whereas active A2 and A3 minimize CO production across all scenarios (around 60–70% reduction compared to C). Dripping risk reaches the highest levels in fires originating within the cushions. The combination of A4 and A3 limits dripping by approximately 70–80% compared to C. Regarding FPI and DPI, A3 and A4 produce the lowest DPI values, while passive systems remain high-risk. Overall, the interior cushion fire scenario demonstrates that passive measures are limited, whereas active and inerting strategies substantially improve system performance. In this scenario, the A3 typology emerges as the most balanced and safest solution when all parameters are considered together.
3.4. AI Outputs Statistical Evaluation with Confidence Interval (CI)
In the context of AI-based CI computational results, the parameters tfail and tdrip are calculated with respect to scenario cases (E, I, C) and position-based configurations (M, C, R). Since the FPI and DPI are normalized indices, the CI was not computed. The CI could not be calculated for the tburn, COeq, and mdrip parameters, which are dependent on the mass of the ETFE foil and material properties, due to the absence of inter-scenario variance. This is because cushion systems with identical thickness and material type are defined based directly on the material itself and mass, and are independent of facade location or ignition point. In the model, since the cushion system typologies are based on the ETFE material type, number of layers, thickness, and mass, typologies with identical thickness and material properties exhibit identical thermal response and degradation behavior. For typologies with the same layer configuration, thickness, and material type, the material’s burn time (tburn), dripping mass (mdrip), and consequently emitted COeq are equal. While variation occurs among M, C, and R configurations due to positional effects, no inter-scenario variation arises among identical typologies across E, I, and C cases. To differentiate and further develop fire analysis based on cushion system typologies, various approaches are required, such as developing temporal or spatial scenarios, conducting separate analyses for each cushion location, performing location-based heat exposure assessments, and linking dripping behavior of mass to distinct time intervals through scenario-based modeling, as well as incorporating environmental conditions affecting fire behavior. By integrating such additional inputs and increasing model complexity, the realism of the model can be improved, enabling more accurate AI-based representation of highly complex fire processes. This represents an important research direction for future studies. In this context, CI was calculated for the tfail and tdrip parameters, which exhibit inter-scenario variance across the (E, I, C) cases.
For each case of CI, a dataset of three observations (n = 3) is used to determine the sample mean and standard deviation, and Student’s t-distribution is applied at a 95% confidence level to obtain conservative estimates due to the small sample size, instead of assuming a normal distribution. With degrees of freedom (dof = n − 1 = 2), a two-tailed test at the 95% confidence level is used. In this approach, the total 5% significance level in the tails is split equally, with 2.5% in each tail. Accordingly, the critical value from the t-distribution is t0.975,2 = 4.303, which is used as the reference limit in the analysis. For CI calculation, the sample mean () (Equation (18)) and sample standard deviation (s) (Equation (19)) are first computed for each scenario group. The standard error of the mean (SE) (Equation (20)) is then determined, and the confidence interval (Equation (21)) is calculated accordingly. Mean values and confidence intervals are obtained separately for each parameter under E, I, and C conditions, thereby quantitatively representing the statistical uncertainty of experimental variability.
CI results were used to conduct a one-way analysis of variance on the groups E, I, and C. The between-group sum of squares (SS_between) was computed from the deviations of group means from the overall mean, while the within-group sum of squares (SS_within) was obtained from the deviations of individual observations from their respective group means. These components were divided by their corresponding degrees of freedom to obtain the mean squares (MS_between and MS_within), and the F-statistic was derived as their ratio. The resulting F-value was converted into a p-value based on the F distribution, using degrees of freedom corresponding to (k − 1) for the number of groups and (N − k) for the total number of observations minus the number of groups. Unlike the other parameters, tfail and tdrip represent, in the context of (E, I, C) scenarios, the time to failure and the time to onset of dripping under fire conditions, depending on the ignition location of the cushions. Therefore, CI was calculated for these two parameters. The calculated CI results for tfail (Table S1) and tdrip (Table S2) are presented in Supplementary Materials. For tfail, the p-value was calculated as 0.000063, and for tdrip, the p-value was calculated as 0.000046. A significance level of p < 0.05 was adopted as the criterion for statistical significance. The results indicate significant differences between groups for the parameters tfail and tdrip, as evidenced by the low p-values (p < 0.05), suggesting that these variables are significantly influenced by group membership and exhibit a statistically significant relationship. The CI-based p-value results and confidence interval values for tfail are shown in Figure 14a, while those for tdrip are presented in Figure 14b.
Figure 14.
CI results: (a) tfail; (b) tdrip (ChatGPT, Google Colab).
Confidence interval-based error bars for tfail and tdrip reveal clear differences between the scenario groups for both variables. In particular, for tfail, the mean value of group I (1.08) is lower than those of groups E (1.63) and C (1.80), and the substantial separation of the confidence intervals indicates that the differences between groups cannot be explained solely by random sampling variability. Similarly, for the tdrip parameter, the mean value of group I (2.06) is markedly lower than those of groups E (3.09) and C (3.44), and the limited overlap between the error bars further supports that this distinction is statistically robust. The relatively narrow confidence intervals for both parameters indicate low uncertainty in the estimates and a high level of internal consistency within the measurements. In addition, the very low p-values obtained for tfail (p = 0.000063) and tdrip (p = 0.000046) confirm that the separation observed in the figures is statistically significant, demonstrating that these parameters possess a high discriminative ability in capturing differences between groups. Overall, the structure of the error bars and the distribution of the confidence intervals indicate that the I scenarios are systematically separated from the other scenario groups, and that both parameters reliably reflect the effect of scenario membership.
When the CI mean values and confidence intervals of the tfail and tdrip parameters are evaluated in an integrated manner, the ranking of the scenarios emerges as I, E, and C for both performance indicators. The I scenario demonstrates the most favorable performance, exhibiting the lowest mean values for both parameters and a clear separation of its confidence intervals from those of the other groups, indicating a more stable and reliable behavior. The E scenario shows an intermediate level of performance, with higher values than the I scenario but lower than the C scenario, while the C scenario exhibits the lowest performance, as it presents the highest mean values for both parameters. Accordingly, when statistically significant differences and the distribution of confidence intervals are taken into account, the I scenario ranks first in terms of overall reliability and performance, followed by the E scenario, with the C scenario ranking last. In this context, significant results were obtained regarding the time to failure and dripping time under fire conditions in the AI-based modeling of the fire behavior of ETFE cushion systems. In contrast, the absence of a pronounced variance among the E, I, and C scenarios for the parameters tburn, mdrip, and COeq indicates that these variables have limited discriminatory power within the current dataset, suggesting that improvement efforts should particularly focus on these performance metrics. This study represents an initial step toward AI-based modeling of fire behavior in ETFE materials and cushion systems and provides a potential foundation for future research. The findings indicate that some of the evaluated parameters exhibit statistically significant effects, while others are analyzed at a more limited level within the scope of the current modeling and dataset. This suggests that the effects of these parameters may be investigated in greater depth in future studies using more advanced modeling approaches and more comprehensive experimental datasets. In this context, it is recommended that the fire performance of the material be examined through more comprehensive modeling approaches and expanded experimental datasets, as such studies are expected to contribute to a more reliable and detailed assessment of the system behavior.
4. Discussion
ETFE cushion facades demonstrate that fire performance depends not only on material properties but also strongly on the fire origin scenario and the facade location. Comparing the three fire scenarios, external origin fires are primarily influenced by outer membrane thickness and surface modifications; interior origin fires are dominated by inner membrane characteristics along with heat and toxic gas accumulation in the enclosed space; and cushion fires show a significant reduction in the effectiveness of passive measures, with active and inerting strategies becoming dominant. Active systems (A1–A4) perform more resiliently against fire effects compared to passive typologies. This is evidenced by extended time to reach critical temperature (tfail), reduced total burning duration (tburn), decreased dripping mass (mdrip), and delayed dripping onset (tdrip). Moreover, active systems lower CO production (COeq), further enhancing fire safety performance. Across all three fire origin scenarios, active typologies consistently outperform passive ones in terms of fire resistance. Considering facade location, corner configurations represent the most adverse conditions due to increased heat flux and multidirectional exposure, while recessed facades help partially limit fire severity. Passive measures, through increased thickness, multilayer arrangements, and surface modifications, provide notable improvements in tfail and dripping behavior, yet they offer limited benefit in tburn and COeq due to higher fuel loads. Conversely, active systems reduce fire duration, toxic gas generation, and dripping risk simultaneously across all scenarios, delivering the most balanced and scenario-independent performance. In particular, the A3 hybrid system achieves the best holistic fire safety performance in all cases. This comprehensive analysis emphasizes that fire safety in ETFE cushion facades cannot rely on a single solution; scenario- and location-sensitive passive design decisions must be integrated with active intervention strategies to ensure effective protection.
4.1. Evaluation of Fire Performance Indicators in Cushion Typologies
The fire safety scores for 15 cushion typologies across three fire origin scenarios (external, interior, cushion) and three facade locations (C, M, R) are visualized for a total of 135 scenario cases (Figure 15). In the color scale, green represents high fire safety and red represents low fire safety. The scores are derived from each typology, tfail, tburn, tdrip, mdrip and primarily FPI and DPI parameters, numerically reflecting both fire resistance and secondary risk potential; a score of 1 indicates the safest condition, while 0 represents the highest risk. Key trends observed include: passive systems, particularly corner positions and thin ETFE membrane typologies, mostly showing reddish scores indicating low safety; multi-layered and surface-modified passive typologies exhibiting intermediate scores; and active systems (especially A3) consistently achieving green tones across all scenarios, indicating high fire safety. This visualization clearly highlights both the exposure differences due to facade location and the impact of passive versus active fire management strategies on overall system performance.
Figure 15.
Fire risk matrix based on 135 cushion scenarios (ChatGPT, Google Colab).
Fire Protection Scores (FPSs) are integrated performance indicators used in this model to reduce the fire response of different typologies and scenarios to a single comparative scale. Since FPI represents time-scale resistance (burning resistance/degradation delay) and DPI represents physically different processes such as mass loss and thermal behavior (dripping, melting/flow effects), they cannot be directly compared. The FPS formulation simplifies this complexity using the equation “1 − (FPI + DPI)/2”, where lower FPI/DPI values indicate higher safety performance and higher values indicate lower protection, thereby defining a unified risk/protection scale. This approach enables a consistent evaluation across multi-scenario (external, internal, cushion) and multi-position (M, C, R) configurations, allowing all combinations to be compared in terms of tburn, tfail, tdrip, and mdrip in a normalized manner. It provides a particular advantage in comparing passive (P) and active (A) systems: while active systems improve fire delay performance through tfail and tburn, they may also influence DPI through dripping and mass loss mechanisms. Similarly, passive systems enhance fire resistance through parameters such as layer thickness, material density, and configuration, but may in some cases increase dripping risk. Overall, FPS transforms a multi-variable fire behavior model into a decision-oriented engineering metric, enabling quantitative, comparable, and optimizable assessment of fire safety performance across different system designs.
4.2. Comparative Analysis of Passive and Active Fire Strategies in Building Envelope
Fire performance evaluation shows the advantage in fire evacuation time and the prevention of fire spread as numerical values. In terms of fire performance, green colors represent high fire safety performance (long tfail, low mdrip and COeq, low FPI/DPI, i.e., high fire safety score), whereas red colors indicate low fire safety performance (short tfail, high mdrip and COeq, high FPI/DPI, i.e., low fire safety score). All passive and active typology performance advantages are presented relative to the control typology (C). The near-zero or invisible bars observed for certain typologies across all performance charts arise from the normalization procedure; specifically, typologies with minimum failure times or maximum DPI values yield normalized metrics close to zero, reflecting the inherent data distribution rather than any computational error. Although the calculations are performed using AI-based methods instead of CFD, yielding consistent numerical results and reliable analyses, AI still requires further development to fully capture complex fire behavior.
In the context of external fire scenarios (Figure 16a), the highest evacuation time was observed for A3, providing a 50–70% increase in tfail compared to the control typology. This indicates the preservation of structural integrity on the facade, which translates into a critical additional evacuation time for building occupants. The shortest evacuation times were observed for P1 and C, representing the most critical risk group due to early structural loss. Among passive systems, thick interior membranes or multi-layered systems provide limited additional resistance, whereas thin membrane and control typologies carry a risk of early structural loss, especially in interior and cushion fire scenarios. In the context of fire spread prevention, A3 and A4 suppress combustion rapidly by lowering FPI and DPI values, whereas passive multi-layered systems prolong combustion and increase CO production. For interior fire scenarios (Figure 16b), P3 offers the longest tfail among passive systems because of thickness, while A3 provides approximately 60% longer resistance, significantly extending evacuation time. The typologies with the shortest evacuation times are P1 and P4, which shorten evacuation time and accelerate fire spread due to early structural loss and high dripping risk. Regarding fire spread prevention, A3 and A4 reduce COeq and mdrip values by 50–80%, thereby extending critical safe evacuation time in interior fires. The cushion fire scenario (Figure 16c) represents the most complex case, where variations in surface thickness significantly reduce passive advantages. In this scenario, A3 provides 50–70% longer tfail compared to all passive typologies, increasing evacuation time and controlling fire spread. In the Figure 16, the color tones progressing in order from green, yellow, orange, and red represent, from safer to more risky conditions, higher and better values in terms of advantage in evacuation time and prevention of fire spread, and from risky, lower and weaker negative outcomes. The shortest evacuation times are observed in thin or control passive typologies, which pose a critical risk due to early dripping and rapid combustion, affecting both evacuation and fire management. A3 and A4 reduce dripping by 70–80%, rapidly suppress fire load, limit structural damage, and maximize evacuation time.
Figure 16.
Advantage in fire evacuation time and prevention of fire spread as: (a) external; (b) interior; (c) cushion fire scenarios (ChatGPT, Google Colab).
The tfail value, used as an indicator of evacuation time, demonstrates a clear superiority for A3 across all scenarios; this corresponds to critical additional evacuation time for building occupants through the preservation of structural integrity on the facades. In terms of fire spread prevention, the fire control indicator derived from DPI and mdrip data shows that active systems provide a significant advantage over passive typologies. A3 and A4 reduce dripping and fire spread across the facade by approximately 60–80% throughout all scenarios, thereby demonstrating high performance in fire control. In A3, the combined use of CO2 based oxygen-depleting suppression systems and water sprinkler systems provides a complementary and integrated fire protection strategy, where CO2 reduces oxygen concentration (smothering effect) and water provides cooling and limits fire spread. This enables a multi-layered fire safety approach, particularly when both systems are applied within the same protected volume according to design and zoning principles. In cushion-type systems, CO2 can be activated via pressurization systems during fire events, while additional sprinkler lines may be installed within cushion layers or along the facade, allowing coordinated multi-stage protection. For structural applications, this hybrid strategy requires coordinated operation through detection and control systems, where different suppression mechanisms are activated at different fire development stages based on predefined trigger thresholds. In cushion membrane systems, the combined use of CO2 and water sprinklers may reduce thermal degradation and fire-induced structural impacts by lowering oxygen levels and surface temperatures, thereby contributing to structural integrity preservation. However, potential adverse effects, such as additional water loading and deformation of membrane surfaces, as well as CO2 dilution due to water spray, reduce suppression efficiency and system performance. Therefore, the proposed configuration must be validated through project-specific engineering analyses. Water sprinkler systems are an effective, environmentally friendly, and cost-efficient fire suppression method [87]. However, simulation-based studies indicate that combined water droplet and CO2 applications achieve faster extinguishment and higher effectiveness compared to single-agent systems [88]. In this context, to improve fire safety performance, the development of hybrid CO2 and sprinkler systems specifically adapted to cushion membrane structures is considered a key research and design direction. This includes integrated profiles and connection details that embed suppression components into structural elements and enable coordinated operation during fire events, thereby enhancing both suppression efficiency and structural performance. Active systems provide effective fire safety performance, while passive systems show limited improvement, such as surface modifications or fibrous intermediate layers. In this context, P1, P4, and C mostly fall within the red zone across scenarios, representing a high-risk group, indicating that passive-only configurations are generally insufficient, and active systems are therefore essential for adequate fire protection.
The AI fire model evaluated irregular dripping corresponding to the behavior represented by the mdrip variable in the AI-based model. It describes the non-uniform melting of ETFE layers under thermal exposure, leading to mass loss that occurs at a variable rather than constant rate over time. In the model, this behavior is governed by dripping characteristics, active effects, layer number, and coating-related modifiers. In particular, the definition of a distinct drip factor for P9 and the term (1 − active effect) in active systems indicate that dripping varies depending on system type. Accordingly, irregular dripping represents a nonlinear and heterogeneous, scenario-dependent evolution of mdrip linked to the mfuel. Structural deformation is not explicitly defined as a geometric or mechanical deformation variable in the code; instead, it is indirectly represented through tfail and partially tburn, reflecting loss of structural integrity over time. In particular, tfail (423 K) corresponds to the critical temperature at which ETFE loses its load-bearing and envelope integrity, representing the onset of structural failure. Layer configuration and coating properties further influence deformation delay, while active systems extend tfail through fire suppression effects, thereby delaying structural degradation. Overall, both irregular dripping and structural deformation are modeled using simplified, scaled, and factor-based semi-empirical indicators rather than fully resolved thermo-mechanical processes. While this approach improves computational efficiency and comparability, it does not capture the full temporal, feedback-driven, and spatially heterogeneous nature of the physical phenomena. Instead, these processes are represented as reduced-order performance proxies for multi-variable fire behavior.
Ongoing research on fire detection and suppression carries the potential to enhance life and property safety through improvements enabled by new technologies [89]. The analyses conducted in this study reveal two key implications for designers and decision-makers: First, the implementation of active fire safety systems increases human safety by extending evacuation times and effectively limiting fire spread across facades. Second, although passive systems provide partial improvements under certain conditions, a combined evaluation of all scenarios clearly highlights the limitations of these systems and identifies critical risk areas. In this context, the design of ETFE cushion facade systems (including membrane, pressurization gas, coating, and intermediate layer material properties; the cushions position on the facade; the fire origin; and the holistic integration of active measures) constitutes a powerful tool for ensuring fire safety and maximizing evacuation times in modern buildings.
4.3. Limitations
The fire performance of ETFE cushion systems was investigated in this study within a singular and controlled framework based on specific variables. Wind effects were neglected, and fire-stopping systems were not incorporated on the facade; the study focused solely on the comparative evaluation of individual cushion elements under the influence of passive and active fire safety measures according to predefined scenarios. Although passive and active fire safety measures in buildings typically operate interactively and in combination, this research focused on individual parameters rather than combined scenarios to more clearly reveal the effects of each variable. This approach allows for a systematic assessment of the individual impacts of variables, independent of complex system interactions. Due to the thin-sectioned nature of ETFE and the rapid, irregular, and short-duration fire behavior, conventional fire parameters such as heat release rate (HRR) and total heat release (THR) cannot be reliably or distinctively calculated, or remain negligible; therefore, these parameters were excluded from the evaluation in this study. The limited experimental and literature data on the fire performance of ETFE facade systems makes it challenging for traditional CFD-based approaches to realistically represent such lightweight, deformation-sensitive and shape-sensitive systems. Due to the scarcity of comparative data in the literature, the results presented in the discussion were normalized relative to one another. The main objective was to investigate the effect values of fire safety measures applicable to cushions. In this study, the limited available experimental data from the literature were used as a baseline; missing coefficients were derived using AI-based approaches based on the literature or manufacturer data, creating a modeling framework.
CFD models can successfully simulate general fire scenarios; however, certain physical processes are missing or idealized in innovative melting and dripping membrane systems such as ETFE cushion facades. CFD and simulation-based analyses for ETFE pneumatic cushion systems model fluid dynamics, temperature distribution, and early fire stages, but remain insufficient for capturing structural response due to the absence of air leakage or collapse mechanisms. As a result, membrane deformation, creep/viscoelastic effects, multilayer pressure transfer, internal pressure increase, and fire propagation within air gaps are not realistically represented. Unlike solid materials such as steel, timber, and concrete, where fire progresses in a more continuous manner, ETFE cushion systems involve enclosed air volumes and multilayer pneumatic behavior that cannot be directly captured in standard CFD/FEM models. These approaches rely on geometric idealization, simplified fluid–structure interaction (FSI), and limited thermal–mechanical coupling. Therefore, due to scale effects, boundary condition uncertainties, and inadequate representation of fire-induced pressure and softening, current simulations remain insufficient for accurate fire performance prediction.
In the context of the thermal performance of ETFE cushions, two-dimensional models with fixed boundary temperatures are inadequate in representing the actual combined convective and surface-to-surface radiative heat transfer within the cushion under 3D conditions [90]. In the context of the thermal behavior of ETFE cushions, computational modeling (IESs—Integrated Environmental Solutions) is the representation of curved geometries by planar rectangular surfaces and, consequently, the impact of this simplification on radiative heat transfer results [91]. In the context of the structural performance of ETFE cushions, the simulation of air exchange assumptions use a simplified model to validate the structural behavior and deformation tendency under suction loads [24]. In particular, in terms of fire performance, the introduction of a circular opening at the membrane center simulates air leakage at the scale of inflatable structures [92]. Additionally, numerical models are generally based on results of small-scale fire tests or on empirically determined heat release rates of ignited objects, and large geometric deformations occurring during combustion of thermoplastic material objects cannot be simulated [93]. Overall, the assumptions, idealizations, and limitations described in the sources demonstrate the lack of realism and insufficiency in simulating ETFE cushions.
Consequently, this study presents an AI approach developed within the constraints of existing limited data, and it is anticipated that the proposed modeling framework can be refined and expanded with experimental data obtained in future research.
5. Conclusions
The fire performance of ETFE cushion facade systems is analyzed across three different scenarios and facade locations in terms of passive and active safety measures. The findings indicate that the systems play a critical role not only in structural resilience but also in human safety and the control of fire spread. When used in AI-based fire simulations, the simulation limitations reduce the need for manual calculations and coding, facilitating data processing and statistical analysis through fast, repeatable, and scalable analyses. This study provides critical insights into fire performance of ETFE cushions. These include:
- Structural resilience and evacuation time (tfail): active systems maintain structural integrity longer compared to passive systems, providing additional critical time for evacuation and emergency response within the building. Thin membrane passive systems exhibit early structural failure in all scenarios, which limits evacuation time and creates high-risk conditions in areas close to the facade.
- Fire load and combustion duration (tburn): passive multi-layered systems exhibit long combustion durations, which concentrate the fire on the facade and increase the risk of secondary fires. Active systems, however, rapidly control combustion, reducing the fire load by nearly 50%, thereby limiting fire spread and extending the safe evacuation time.
- Toxic gas and CO production (COeq): high CO production is observed in multi-layered passive systems, whereas nitrogen-filled passive systems minimize CO emissions. Active systems achieve approximately 60–70% CO reduction across all scenarios, decreasing the toxic gas exposure during evacuation and providing a significant advantage for human safety.
- Melting, dripping and secondary fire risk (tdrip, mdrip): anti-drip properties and active systems reduce dripping by 60–80%. This minimizes the risk of secondary fires beneath the facade in interior cushion fire scenarios, limits horizontal and vertical fire spread, ensures sufficient evacuation time, and enhances occupant safety during the escape process.
- Fire spread potential and risk scores (FPI/DPI): passive systems and thin membranes remain in the high-risk category, whereas active systems and anti-drip typologies are classified as low-risk. This minimizes fire spread and dripping hazards, which is particularly critical for controlling fire and protecting evacuation routes in buildings with densely occupied interior spaces affected by the facade.
Overall, when the performance of all typologies is evaluated, water sprinkler and CO2 injected (A3) demonstrates the highest performance, whereas thin membrane surface typologies are the least effective. ETFE cushion facades employ passive and active fire safety systems that enhance structural resilience while extending evacuation times, thereby protecting human life and preventing fire spread across the facade. Active systems maximize emergency response and evacuation safety by reducing toxic gas production and limiting dripping hazards. For designers and decision-makers, these findings demonstrate that fire safety strategies in ETFE facades provide direct and critical life safety benefits for building occupants. The widespread implementation of these systems in modern buildings holds strategic importance for improving fire safety, extending evacuation and intervention times, and preventing potential economic losses and casualties.
Supplementary Materials
The following supporting information can be downloaded at: https://www.mdpi.com/article/10.3390/app16136582/s1, Table S1: CI results for tfail (s) parameter across scenarios; Table S2: CI results for tdrip (s) parameter across scenarios.
Author Contributions
Conceptualization, Y.B.; methodology, Y.B.; software, Y.B. and D.G.Y.; validation, Y.B. and D.G.Y.; formal analysis, Y.B. and D.G.Y.; investigation, D.G.Y.; resources, Y.B. and D.G.Y.; data curation, Y.B. and D.G.Y.; writing—original draft preparation, Y.B. and D.G.Y.; writing—review and editing, Y.B. and D.G.Y.; visualization, Y.B. and D.G.Y.; supervision, D.G.Y. All authors have read and agreed to the published version of the manuscript.
Funding
This research received no external funding.
Institutional Review Board Statement
Not applicable.
Informed Consent Statement
Not applicable.
Data Availability Statement
The original contributions presented in the study are included in the article; further inquiries can be directed to the corresponding author.
Acknowledgments
During the preparation of this manuscript/study, the authors used [ChatGPT-5 mini, Google Colab, Python 3.12.12, pandas 2.2.2, numpy 2.0.2, matplotlib 3.10.0, seaborn 0.13.2] for the purposes of [computational fire analysis with calculation and translate]. The authors have reviewed and edited the output and take full responsibility for the content of this publication.
Conflicts of Interest
The authors declare no conflicts of interest.
Abbreviations
The following abbreviations are used in this manuscript:
| AI | Artificial Intelligence |
| AS | Australian Standard |
| BIM | Building Information Modeling |
| CFAST | Consolidated Fire and Smoke Transport |
| CFD | Computational Fluid Dynamics |
| CI | Confidence Interval |
| DIN | Deutsches Institut für Normung |
| DPI | Drip Performance Index |
| EN | European Norm/European Standard |
| EPDs | Environmental Product Declarations |
| ETFE | EthylenTetraFluoroEthylen |
| FDS | Fire Dynamics Simulator |
| FPI | Fire Performance Index |
| HRR | Heat Release Rate |
| ISO | International Organization for Standardization |
| LLM | Large Language Model |
| MAS | Multi-Agent Simulation |
| MLP | Multilayer Perceptron |
| MLR | Mass Loss Rate |
| NFP | Norme Française de Prévention |
| NFPA | National Fire Protection Association |
| PE | Polyethylene |
| PVC | PolyVinylChloride |
| TCNN | Transposed Convolutional Neural Network |
| THR | Total Heat Release |
References
- Kodur, V.; Kumar, P.; Rafi, M.M. Fire Hazard in Buildings: Review, Assessment and Strategies for Improving Fire Safety. PSU Res. Rev. Int. J. 2020, 4, 1–23. [Google Scholar] [CrossRef] [Scilit]
- Gravit, M.V.; Kotlyarskaya, I.L.; Zybina, O.A.; Korolchenko, D.A.; Nuguzhinov, Z.S. Fire Resistance of Building Structures and Fire Protection Materials: Bibliometric Analysis. Fire 2025, 8, 10. [Google Scholar] [CrossRef] [Scilit]
- CTIF (Center for Fire Statistics). International Association of Fire and Rescue Services, Center of Fire Statistics Word Fire Statistics. Report No 30. 2025. Available online: https://ctif.org/sites/default/files/2025-08/CTIF_Report30.pdf (accessed on 29 January 2026).
- Abdul Aziz, N.A.; Mohd Nordin, R.; Ismail, Z.; Yunus, J.; Hashim, N. Preliminary Investigation on Possible Fire Causation in Multistorey Buildings in Selangor. Int. J. Real. Estate Stud. 2022, 16, 83–91. [Google Scholar] [CrossRef]
- Mróz, K.; Hager, I.; Korniejenko, K. Material Solutions for Passive Fire Protection of Buildings and Structures and Their Performances Testing. Procedia Eng. 2016, 151, 284–291. [Google Scholar] [CrossRef] [Scilit]
- Danzi, E.; Fiorentini, L.; Marmo, L. FLAME: A Parametric Fire Risk Assessment Method Supporting Performance Based Approaches. Fire Technol. 2021, 57, 721–765. [Google Scholar] [CrossRef] [Scilit]
- Dabous, S.A.; Shikhli, A.; Shareef, S.; Mushtaha, E.; Obaideen, K.; Alsyouf, I. Fire Prevention and Mitigation Technologies in High-rise Buildings: A Bibliometric Analysis from 2010 to 2023. Ain Shams Eng. J. 2024, 15, 103010. [Google Scholar] [CrossRef] [Scilit]
- E Silva, V.P.; Fakury, R.H. Brazilian Standards for Steel Structures Fire Design. Fire Saf. J. 2002, 37, 217–227. [Google Scholar] [CrossRef] [Scilit]
- Balboa, A.; González-Villa, J.; Cuesta, A.; Abreu, O.; Alvear, D. Testing a Real-time Intelligent Evacuation Guiding System for Complex Buildings. Saf. Sci. 2020, 132, 104970. [Google Scholar] [CrossRef] [Scilit]
- Nguyen, K.T.Q.; Weerasinghe, P.; Mendis, P.A.; Ngo, T.D. Performance of Modern Building Façades in Fire: A Comprehensive Review. Electron. J. Struct. Eng. 2016, 16, 69–87. [Google Scholar] [CrossRef] [Scilit]
- McLaggan, M.S.; Hidalgo, J.P.; Osorio, A.F.; Heitzmann, M.T.; Carrascal, J.; Lange, D.; Maluk, C.; Torero, J.L. Towards a Better Understanding of Fire Performance Assessment of Façade Systems: Current Situation and a Proposed New Assessment Framework. Constr. Build. Mater. 2021, 300, 124301. [Google Scholar] [CrossRef] [Scilit]
- Thevega, T.; Jayasinghe, J.A.S.C.; Robert, D.; Bandara, C.S.; Kandare, E.; Setunge, S. Fire Compliance of Construction Materials for Building Claddings: A Critical Review. Constr. Build. Mater. 2022, 361, 129582. [Google Scholar] [CrossRef] [Scilit]
- Wen, J.X. Fire Modelling: The Success, the Challenges, and the Dilemma from a Modeller’s Perspective. Fire Saf. J. 2024, 144, 104087. [Google Scholar] [CrossRef] [Scilit]
- Yadav, J.; Sharma, A.; Gabhane, A.; Katoch, U.; Kumawat, D.; Aravindan, N. A Comprehensive Review of Software and Tools for Fire and Safety Design and Calculations. Int. J. Res. Appl. Sci. Eng. Technol. 2025, 13, 255–263. [Google Scholar] [CrossRef] [Scilit]
- Beşiroğlu, Ş.; Serteser, N. Evaluation of Fire Safety Performance of Buildings with Building Information Modeling (BIM). J. Fac. Eng. Archit. Gazi Univ. 2024, 40, 501–514. [Google Scholar] [CrossRef] [Scilit]
- Su, L.-C.; Wu, X.; Zhang, X.; Huang, X. Smart Performance-based Design for Building Fire Safety: Prediction of Smoke Motion via AI. J. Build. Eng. 2021, 43, 102529. [Google Scholar] [CrossRef] [Scilit]
- Nan, Z.; Orabi, M.A.; Huang, X.; Jiang, Y.; Usmani, A. Structural-fire Responses Forecasting via Modular AI. Fire Saf. J. 2023, 140, 103863. [Google Scholar] [CrossRef] [Scilit]
- Liu, G.; Chen, Z.; Wang, X.; Liu, X.; Chen, Z.; Luo, T. Research on Fire Safety Emergency Management Model Based on Multi-Agent Simulation. In Proceedings of the 10th International Symposium on Advances in Electrical, Electronics and Computer Engineering (ISAEECE), Xi’an, China, 20–22 June 2025; pp. 166–169. [Google Scholar] [CrossRef] [Scilit]
- Zhang, C. Review of Structural Fire Hazards, Challenges, and Prevention Strategies. Fire 2023, 6, 137. [Google Scholar] [CrossRef] [Scilit]
- Zhang, Y.; Geng, P. Artificial Intelligence Based Smoke Flow Mechanism Analysis and Prediction Patterns of Fire for Large Space Building. Alex. Eng. J. 2024, 100, 322–330. [Google Scholar] [CrossRef] [Scilit]
- Çiftçioğlu, A.Ö.; Naser, M.Z. Fire Resistance Evaluation Through Synthetic Fire Tests and Generative Adversarial Networks. Front. Struct. Civ. Eng. 2024, 18, 587–614. [Google Scholar] [CrossRef] [Scilit]
- Hu, J.; Chen, W.; Zhao, B.; Yang, D. Buildings with ETFE Foils: A Review on Material Properties, Architectural Performance and Structural Behavior. Constr. Build. Mater. 2017, 131, 411–422. [Google Scholar] [CrossRef] [Scilit]
- Wang, H.; Flor, J.-F.; Sun, Y.; Wu, Y. Numerical Investigations on the Thermal Performance of Adaptive ETFE Foil Cushions. Energy Procedia 2019, 158, 3191–3195. [Google Scholar] [CrossRef] [Scilit]
- Zhao, X.; Zhao, B.; Chen, W.; Cai, J.; Zhang, Y.; Wagner, R. Structural Effect of Internal Layer in ETFE Cushion: Experimental and Simulation Analysis. J. Build. Eng. 2025, 108, 112881. [Google Scholar] [CrossRef] [Scilit]
- DIN 4102-1:1998-05; Fire Behaviour of Building Materials and Building Components—Part 1: Building Materials; Concepts, Requirements and Tests. DIN Deutsches Institut für Normung e.V.: Berlin, Germany, 1998. Available online: https://www.dinmedia.de/en/standard/din-4102-1/5241696 (accessed on 8 June 2026).
- NF P92-505; Safety Against Fire. Building Materials. Reaction to Fire Tests. Test Used for Thermalmelting Materials. Dripping Test. Association Française de Normalisation (AFNOR): Paris, France, 1995. Available online: https://www.boutique.afnor.org/en-gb/standard/nf-p92505/safety-against-fire-building-materials-reaction-to-fire-tests-test-used-for/fa036061/274 (accessed on 8 June 2026).
- ASTM E84-23a; Standard Test Method for Surface Burning Characteristics of Building Materials. ASTM International (Advancing Standards Transforming Markets): West Conshohocken, PA, USA, 2023. Available online: https://store.astm.org/e0084-23a.html (accessed on 8 June 2026).
- EN 13501-1:2018; Fire Classification of Construction Products and Building Elements—Part 1: Classification Using Data from Reaction to Fire Tests. European Committee for Standardization (CEN): Brussels, Belgium, 2018.
- NFPA 701; Standard Methods of Fire Tests for Flame Propagation of Textiles and Films. National Fire Protection Association (NFPA): Quincy, MA, USA, 2023. Available online: https://www.nfpa.org/codes-and-standards/nfpa-701-standard-development/701 (accessed on 8 June 2026).
- JIS A 1322:1966; Testing Method for Incombustibility of Thin Materials for Buildings. Japanese Standards Association (JSA): Tokyo, Japan, 1966. Available online: https://webdesk.jsa.or.jp/books/W11M0090/index/?bunsyo_id=JIS+A+1322:1966 (accessed on 8 June 2026).
- JIS K 7201-2:2021; Plastics—Etermination of Burning Behaviour by Oxygen İndex—Part 2: Ambient-Temperature Test. Japanese Standards Association (JSA): Tokyo, Japan, 2021. Available online: https://webdesk.jsa.or.jp/books/W11M0090/?bunsyo_id=JIS+K+7201-2:2021 (accessed on 8 June 2026).
- ISO 4590:2016; Rigid Cellular Plastics—Determination of the Volume Percentage of Open Cells and of Closed Cells. International Organization for Standardization: Geneva, Switzerland, 2016. Available online: https://www.iso.org/standard/60771.html (accessed on 8 June 2026).
- AS 1530.2:1993; Methods for Fire Tests on Building Materials, Components and Structures—Part 2: Test for Flammability of Materials. Standards Australia: Sydney, Australia, 1993. Available online: https://store.standards.org.au/product/as-1530-2-1993 (accessed on 8 June 2026).
- AS/NZS 1530.3:1999; Methods for Fire Tests on Building Materials, Components and Structures—Part 3: Simultaneous Determination of İgnitability, Flame Propagation, Heat Release and Smoke Release. Standards Australia: Sydney, Australia, 1999. Available online: https://store.standards.org.au/product/as-nzs-1530-3-1999 (accessed on 8 June 2026).
- BS 476-6:1989+A1:2009; Fire Tests on Building Materials and Structures-Method of Test for Fire Propagation for Products. British Standards Institution (BSI): London, UK, 1989. Available online: https://knowledge.bsigroup.com/products/fire-tests-on-building-materials-and-structures-method-of-test-for-fire-propagation-for-products (accessed on 8 June 2026).
- BS 476-7:1997; Fire Tests on Building Materials and Structures-Method of Test to Determine the Classification of the Surface Spread of Flame of Products. British Standards Institution (BSI): London, UK, 1997. Available online: https://knowledge.bsigroup.com/products/fire-tests-on-building-materials-and-structures-method-of-test-to-determine-the-classification-of-the-surface-spread-of-flame-of-products (accessed on 8 June 2026).
- Yap, S. TE Membrane, The Future of ETFE Roof & Facade—Fire Safety. In ETFE, ETFE Design, Tensile Fabric Structure. 30 April 2026. Available online: https://temembrane.com/the-future-of-etfe-roof-facade-fire-safety/ (accessed on 30 May 2026).
- Architen Landrell. ETFE Foil: A Guide to Design, Fire Performance. 2022. Available online: https://www.architen.com/articles/etfe-foil-a-guide-to-design/ (accessed on 15 January 2026).
- IIBEC (International Institute of Building Enclosure Consultants). A Case History Review of ETFE on Today’s Current Projects. 22 May 2016. Available online: https://iibec.org/publication-post/a-case-history-review-of-etfe-on-todays-current-projects-2/ (accessed on 30 May 2026).
- Fabrix360, ETFE Fire Behavior. Available online: https://www.fabrix360.com/etfe-fire-behavior (accessed on 30 May 2026).
- Fabritecture, Knowledge Lab ETFE. Available online: https://fabritecture.com/knowledge-base/etfe/ (accessed on 31 May 2026).
- Charbonneau, L.; Polak, M.A.; Penlidis, A. Mechanical Properties of ETFE Foils: Testing and Modelling. Constr. Build. Mater. 2014, 60, 63–72. [Google Scholar] [CrossRef] [Scilit]
- Engineered Polymers Limited, Ethylene Tetrafluoroethylene (ETFE). Available online: https://engpoly.co.uk/etfe/ (accessed on 30 May 2026).
- Maywald, C. 7—Ethylene Tetra Fluoroethylene (ETFE) Fire Performance. In Membranes for Structures; de Llorens, J.I., Ed.; Woodhead Publishing Series in Civil and Structural Engineering; Woodhead Publishing: Cambridge, UK, 2025; pp. 169–177. [Google Scholar] [CrossRef] [Scilit]
- Yap, S. ETFE Roofs Structure: Fire Safety and Beyond, TE Membrane. 2024. Available online: https://temembrane.com/etfe-roofs-structure-fire-safety-and-beyond/ (accessed on 15 January 2026).
- Vector Foiltec, Texlon® ETFE, Fire Safety. Available online: https://lightspanetfe.com/etfe-systems-what-is-etfe/ (accessed on 15 January 2026).
- SD Titan Metal Co., Ltd. (Shandong Titan Metal Co., Ltd.). What is the Fire Rating of ETFE Membrane? 2025. Available online: https://www.sdtitan.com/blog/what-is-the-fire-rating-of-etfe-membrane-1110665.html (accessed on 16 January 2026).
- Yin, L.; Jiang, Y.; Qiu, R. Combustion Behaviors of CIGS Thin-film Solar Modules from Cone Calorimeter Tests. Materials 2018, 11, 1353. [Google Scholar] [CrossRef] [Scilit] [PubMed]
- Wang, Y.; Duan, L.; Zhou, A.; Yao, H.; Lu, Y. Simulated Effects of Main Properties and Heat Flux on First Dripping Behaviors of Polymers Impinged by Small Flames. Fire Saf. J. 2024, 144, 104115. [Google Scholar] [CrossRef] [Scilit]
- Song, Y.; Chen, W.; Zhao, B.; Hu, J.; Zhao, X. Experimental and Numerical Study on Creep Deformation and Failure Characteristics of ETFE Cushion Structures. Eng. Struct. 2025, 323, 119233. [Google Scholar] [CrossRef] [Scilit]
- Hu, J.; Chen, W.; Cai, Q.; Gao, C.; Zhao, B.; Qiu, Z.; Qu, Y. Structural Behavior of the PV-ETFE Cushion Roof. Thin-Walled Struct. 2016, 101, 169–180. [Google Scholar] [CrossRef] [Scilit]
- Novum Structures, Air Filled Pillows. Available online: https://novumstructures.com/eu/air-filled-pillow/ (accessed on 1 June 2026).
- Robinson-Gayle, S.; Kolokotroni, M.; Cripps, A.; Tanno, S. ETFE Foil Cushions in Roofs and Atria. Constr. Build. Mater. 2001, 15, 323–327. [Google Scholar] [CrossRef] [Scilit]
- Tensaform, Fabric Material Specifications, ETFE Specifications, ETFE General Material Tech Datas. Available online: https://www.tensaform.com/en-US/etfe-specifications/2484 (accessed on 1 June 2026).
- TCI RevealTM ETFE 500 Micron, Ethylene Tetrafluoroethylene Film for Use in Architectural Applications. Available online: https://www.textilescoated.com/uploads/files/Reveal_ETFE_500_DS.pdf (accessed on 1 June 2026).
- Wang, X.; Chen, Y.; Yang, Q. Effect of Inflating Air on the Static Behavior of ETFE Cushions. J. Mech. Mater. Struct. 2024, 19, 157–186. [Google Scholar] [CrossRef] [Scilit]
- Gómez-González, A.; Neila, J.; Monjo, J. Pneumatic Skins in Architecture. Sustainable Trends in Low Positive Pressure Inflatable Systems. Procedia Eng. 2011, 21, 125–132. [Google Scholar] [CrossRef] [Scilit]
- Juaristi, M.; Monge-Barrio, A. Adaptive Façades in Temperate Climates. An in-use Assessment of an Office Building. In Proceedings of the 11th Conference on Advanced Building Skins, Bern, Switzerland, 10–11 October 2016; pp. 419–428. [Google Scholar] [CrossRef]
- Wattanatanom, W.; Charuchinda, S.; Potiyaraj, P. Flame Behavior and Mechanical Properties of Polyester Fabrics Coated with Intumescent Coatings via Layer-by-layer Assembly. Text. Res. J. 2019, 89, 4691–4701. [Google Scholar] [CrossRef] [Scilit]
- Meraner, C.; Skilbred, E.S.; Arsava, K.S. Experimental Investigation of Water-Based Fire Suppression Systems on External Façade Fires. Fire Technol. 2024, 60, 3629–3648. [Google Scholar] [CrossRef] [Scilit]
- Farrell, K.; Hassan, M.K.; Hossain, M.D.; Ahmed, B.; Rahnamayiezekavat, P.; Douglas, G.; Saha, S. Water Mist Fire Suppression Systems for Building and Industrial Applications: Issues and Challenges. Fire 2023, 6, 40. [Google Scholar] [CrossRef] [Scilit]
- Ge, L.; Shao, Y.; Wang, Y.; Zhang, G.; Zhang, Z.; Liu, L. Experimental Research on Inerting Characteristics of Carbon Dioxide used for Fire Extinguishment in a Large Sealed Space. Process Saf. Environ. Prot. 2020, 142, 174–190. [Google Scholar] [CrossRef] [Scilit]
- Fluoever, Fluoplus® ETFE Film. Available online: https://en.fluoever.com/ProductsSt/gxnfbm/274.html (accessed on 7 January 2026).
- Wanhao (China Membrane Structure Design and Manufacturing Expert). Etfe-Lightweight and Transparent House/Wall System. 2020. Available online: https://www.whmembrane.com/industry-information/etfe-lightweight-and-transparent-house-wall-system.html (accessed on 7 January 2026).
- İzocam. Izocam Glasswool, Safety Data Sheet According to Annex II to REACH—Regulation (EU) 2020/878. 2024. Available online: https://www.izocam.com.tr/pdffiles/msdspdf/%C4%B0ZOCAM_GW_MSDS_EN557.pdf (accessed on 21 January 2026).
- TefzelTM ETFE, Fluoropolymer Film, Chemours. Available online: https://www.teflon.com/en/-/media/files/teflon/tefzel-etfe-film-properties.pdf?rev=c686ed003c894735a6beae80dc36b4e7& (accessed on 7 January 2026).
- Domerama, ETFE Technical Specs. Available online: https://www.domerama.com/coverings/etfe/etfe-technical-specs/ (accessed on 7 January 2026).
- Fabrix360, What is ETFE? Available online: https://www.fabrix360.com/what-is-etfe (accessed on 7 January 2026).
- ISO 1:1975; Standard Reference Temperature for Industrial Length Measurements, 1st ed. International Organization for Standardization: Geneva, Switzerland, 1975. Available online: https://www.iso.org/standard/3561.html (accessed on 7 January 2026).
- ISO 1:2022; Geometrical Product Specifications (GPS)—Standard Reference Temperature for the Specification of Geometrical and Dimensional Properties. International Organization for Standardization: Geneva, Switzerland, 2022. Available online: https://www.iso.org/standard/80702.html (accessed on 7 January 2026).
- Netzsch Polymers, ETFE: Ethylene-Tetrafluoroethylene. Available online: https://polymers.netzsch.com/Materials/Details/37 (accessed on 7 January 2026).
- Afton Plastics, ETFE-Ethylene Tetrafluoroethylene (Commonly Referred to as Tefzel®), DuPont TEFZEL® ETFE Data Sheet. Available online: https://cdn.thomasnet.com/ccp/10001122/59217.pdf (accessed on 7 January 2026).
- Zhou, X.; Hu, Z.; Jiang, F.; Yang, Q.; Gao, M. Influence of Phosphomolybdates on Flame Retardancy and Smoke Suppression of PVC Matrix Flame Retardant Composites. Molecules 2025, 30, 4269. [Google Scholar] [CrossRef] [Scilit] [PubMed]
- Makmax Australia, Fire Performance of Different Membranes. 2022. Available online: https://www.makmax.com.au/fire-performance-of-different-membranes/ (accessed on 7 January 2026).
- Nist (National Fire Research Laboratory). Test11_PVC_R1, Report Process Script Version: NFRL_Report_8.5.1. 2023. Available online: https://www.nist.gov/el/fcd/vertical-upward-flamespread-parallel-panels/test11pvcr1 (accessed on 8 January 2026).
- Behzadfar, E.; Kim, K.; Lee, B.; Jordan, A.M.; Lhost, O.; Jaffer, S.A.; Bates, F.S.; Macosko, C.W. Effects of a Layered Morphology on Drip Suppression in Burning Polymers. ACS Appl. Polym. Mater. 2021, 3, 1664–1674. [Google Scholar] [CrossRef] [Scilit]
- Patel, R.; Chaudhary, M.L.; Patel, Y.N.; Chaudhari, K.; Gupta, R.K. Fire-Resistant Coatings: Advances in Flame-Retardant Technologies, Sustainable Approaches, and Industrial Implementation. Polymers 2025, 17, 1814. [Google Scholar] [CrossRef] [Scilit] [PubMed]
- Nazrun, T.; Hassan, M.K.; Hasnat, M.R.; Hossain, M.D.; Ahmed, B.; Saha, S. A Comprehensive Review on Intumescent Coatings: Formulation, Manufacturing Methods, Research Development, and Issues. Fire 2025, 8, 155. [Google Scholar] [CrossRef] [Scilit]
- Dormohamadi, M.; Kanafani, K.; Birgisdottir, H.; Dragsted, A.; Hoxha, E. Assessing Environmental Impacts of Active Fire Protection and Egress Systems Using Environmental Product Declarations: A Review. Clean. Environ. Syst. 2025, 17, 100280. [Google Scholar] [CrossRef] [Scilit]
- Pedersen, K.; Nguyen, K.; Hunt, A. A Risk-Based Approach to Assess the Effectiveness of Sprinklers in Buildings with Combustible Cladding. Fire 2025, 8, 119. [Google Scholar] [CrossRef] [Scilit]
- Frank, K.; Gravestock, N.; Spearpoint, M.; Fleischmann, C. A Review of Sprinkler System Effectiveness Studies. Fire Sci. Rev. 2013, 2, 6. [Google Scholar] [CrossRef] [Scilit]
- Minnesota State Fire Marshal Division. Sprinkler Effectiveness, A Study of the Numbers Behind Sprinkler Saves. National Fire Sprinkler Association. 2019. Available online: https://nfsa.org/wp-content/uploads/2019/12/Sprinkler_Effectiveness_2004-2018.pdf (accessed on 4 January 2026).
- Hirsch, D.; Hshieh, F.-Y.; Beeson, H.; Pedley, M. Carbon Dioxide Fire Suppressant Concentration Needs for International Space Station Environments. J. Fire Sci. 2002, 20, 391–399. [Google Scholar] [CrossRef] [Scilit]
- Gupta, M.; Rajora, R.; Sahai, S.; Shankar, R.; Ray, A.; Kale, S.R. Experimental Evaluation of Fire Suppression Characteristics of Twin Fluid Water Mist System. Fire Saf. J. 2012, 54, 130–142. [Google Scholar] [CrossRef] [Scilit]
- Lázaro, D.; Alonso, A.; Lázaro, M.; Jiménez, M.Á.; Alvear, D. Experimental and Analytical Study of the Influence of the Incident Heat Flux in Cables Heat Release. J. Therm. Anal. Calorim. 2023, 148, 10491–10504. [Google Scholar] [CrossRef] [Scilit]
- Maharjan, S.; Gunawardena, T.; Mendis, P. Review of Experimental Testing and Fire Performance of Mass Timber Structures. J. Compos. Sci. 2025, 9, 290. [Google Scholar] [CrossRef] [Scilit]
- Abdulrahman, S.A.; Chetehouna, K.; Cablé, A.; Skreiberg, Ø.; Kadoche, M. A Review on Fire Suppression by Fire Sprinklers. J. Fire Sci. 2021, 39, 512–551. [Google Scholar] [CrossRef] [Scilit]
- Shah, H.R.; Wang, K.; Lang, X.Q.; Wang, J.W.; Jun Wang, J.; Fang, J.; Zhang, Y.M.; Aldossary, O.M. Comprehensive Assimilation of Fire Suppression Modeling and Simulation of Radiant Fire by Water and Its Synergistic Effects with Carbon Dioxide. Energies 2020, 13, 5850. [Google Scholar] [CrossRef] [Scilit]
- Gollner, M.J. Detection and Suppression of Fires: A Cornerstone of Fire Protection Engineering. Fire Technol. 2016, 52, 1193–1196. [Google Scholar] [CrossRef] [Scilit]
- Zheng, Z.; Zhao, B.; Dai, J.; Chen, W.; Li, Y.; Jia, S.; Li, R. Experimental and Numerical Evaluations on Thermal Performance of ETFE Cushion Buildings. Energy Build. 2026, 361, 117364. [Google Scholar] [CrossRef] [Scilit]
- Dimitriadou, E.A.; Shea, A. Computational Modelling of the Thermal Behaviour of an ETFE Cushion Using IES. In Portugal SB13—Contribution of Sustainable Building to Meet EU 20-20-20 Targets; Chapter 3—High Performance Sustainable Building Solutions; Bragança, L., Pinheiro, M., Mateus, R., Eds.; iiSBE Portugal: Guimarães, Portugal, 2013; pp. 175–181. Available online: https://www.irbnet.de/daten/iconda/CIB_DC26391.pdf (accessed on 1 June 2026).
- Yan, F.; Sun, G.; Xue, S. Study on Membrane Damage and Collapse of Air-Supported Structures under Fire Conditions. Fire 2022, 5, 162. [Google Scholar] [CrossRef] [Scilit]
- Butler, K.M.; Ohlemiller, T.J. Some Difficult Problems in the Modeling of Fire Spread. In Proceedings of the 7th World Congress on Computational Mechanics, Los Angeles, CA, USA, 16–22 July 2006; Available online: https://tsapps.nist.gov/publication/get_pdf.cfm?pub_id=861396 (accessed on 1 June 2026).
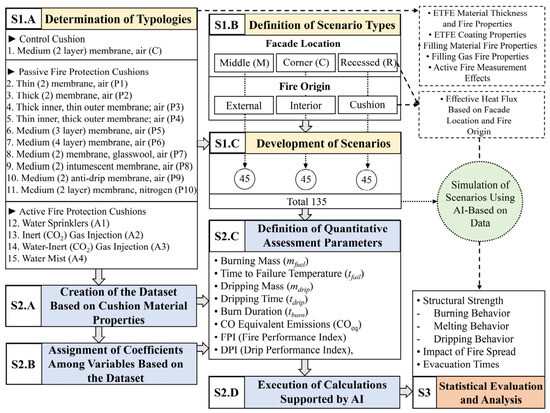
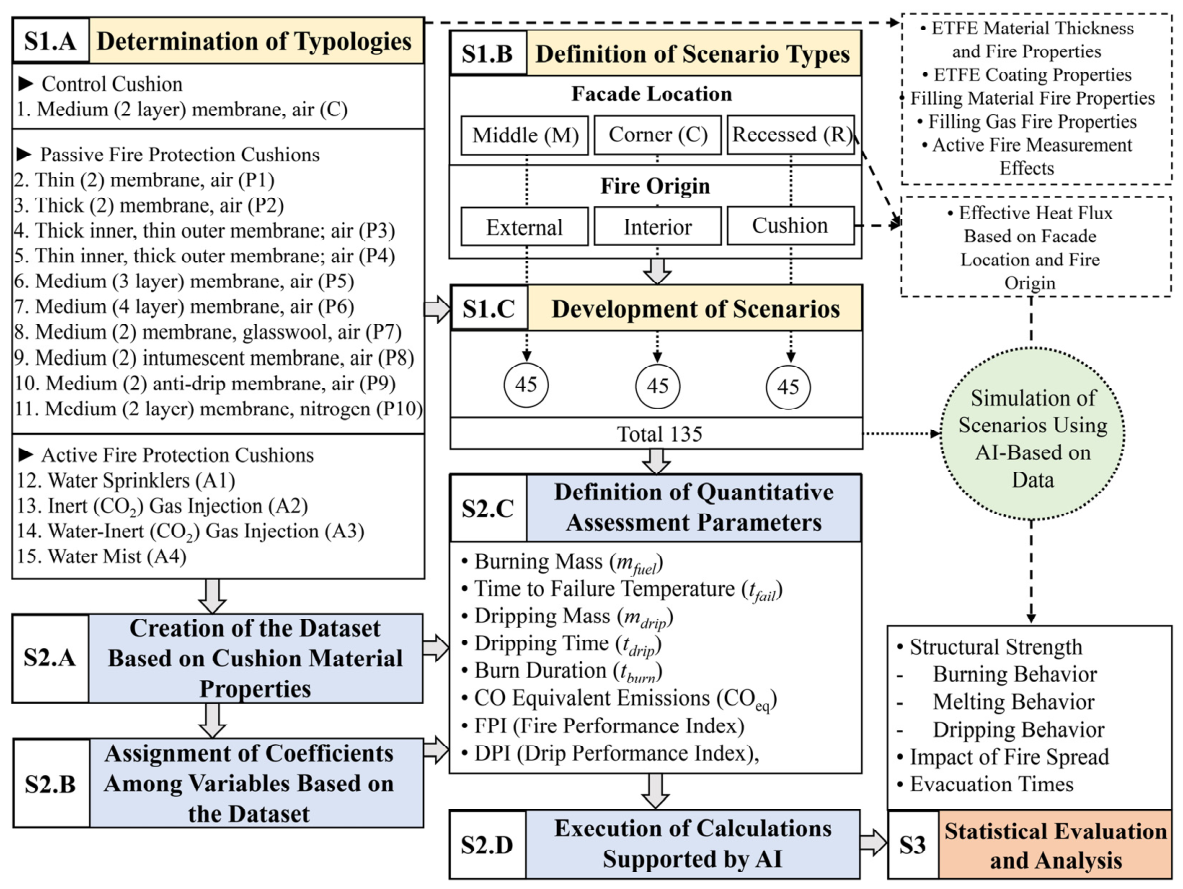
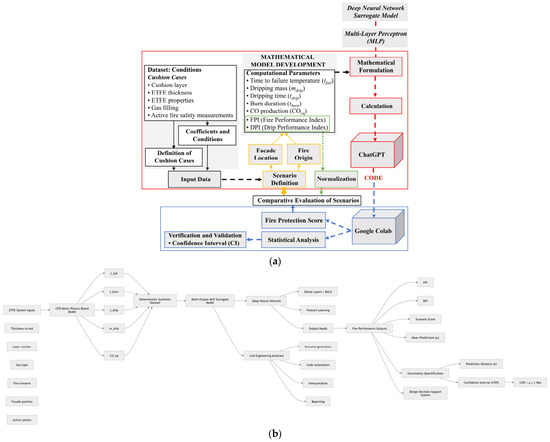
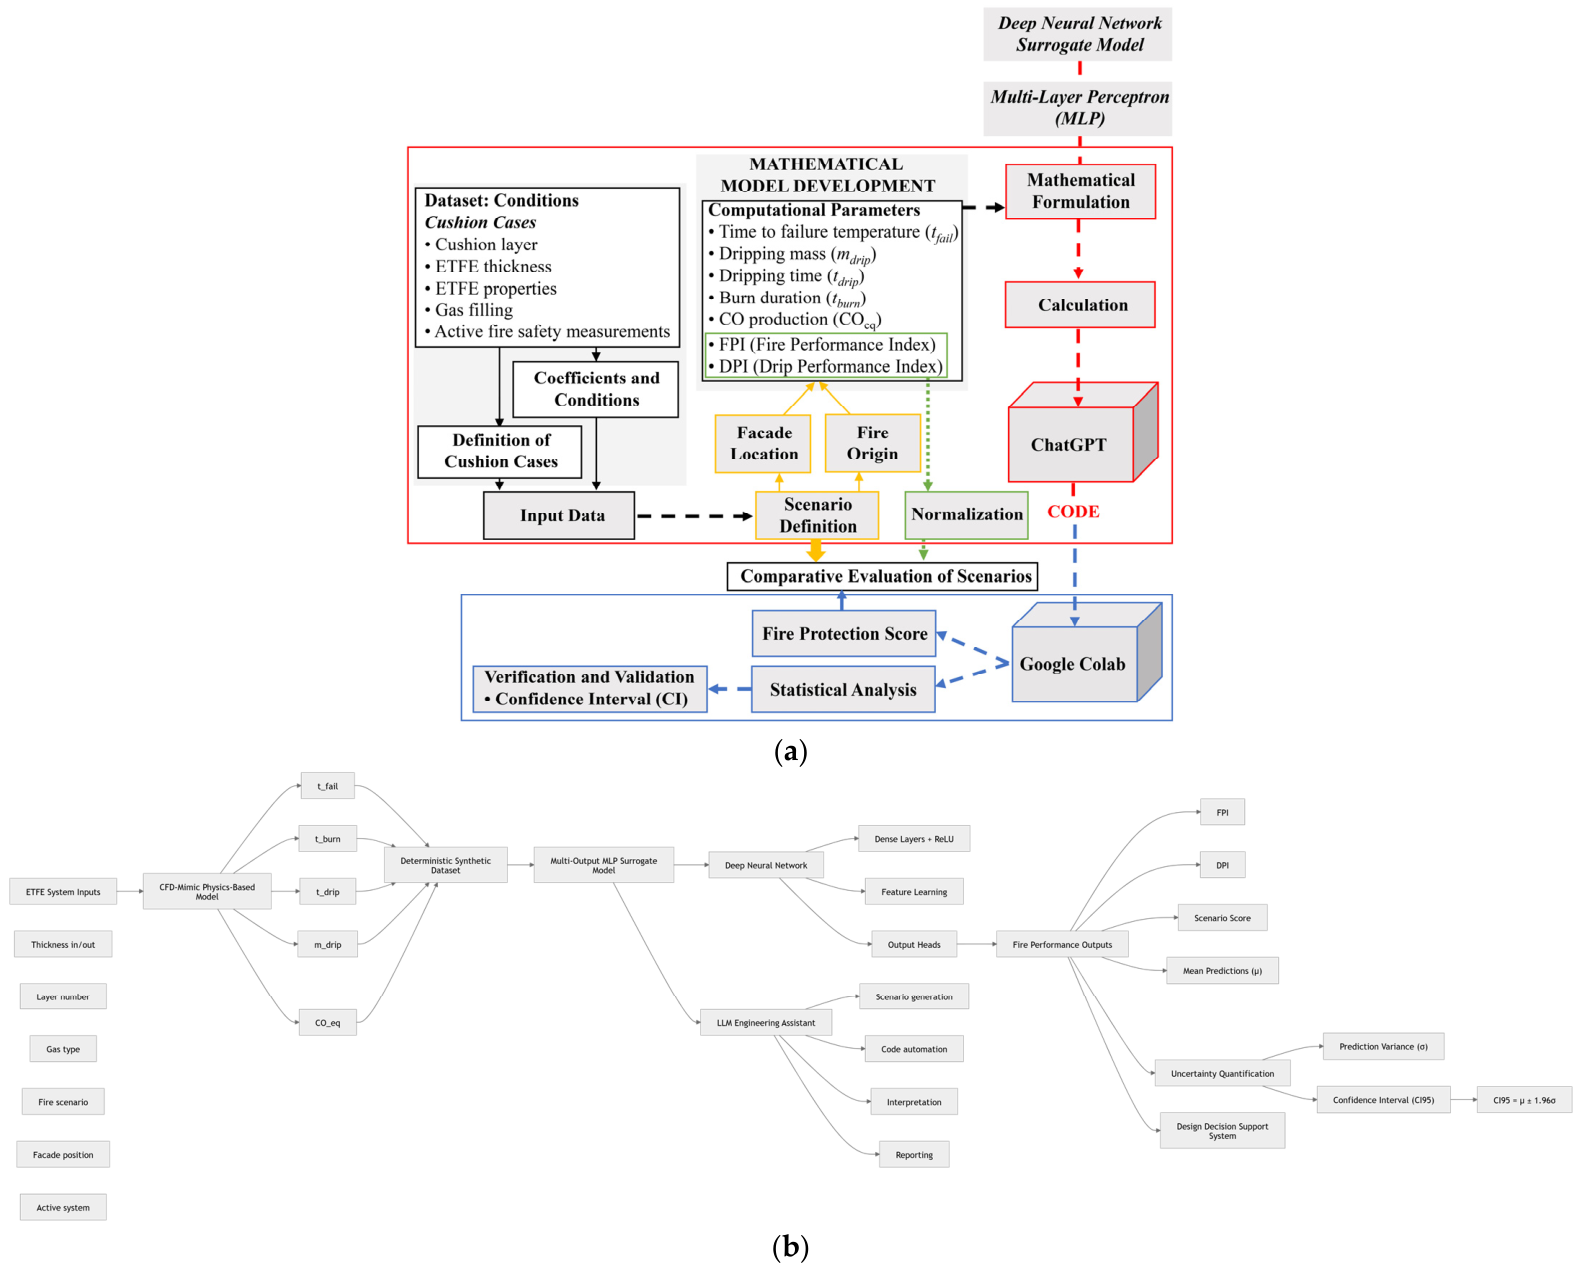
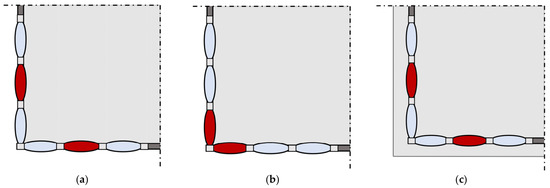
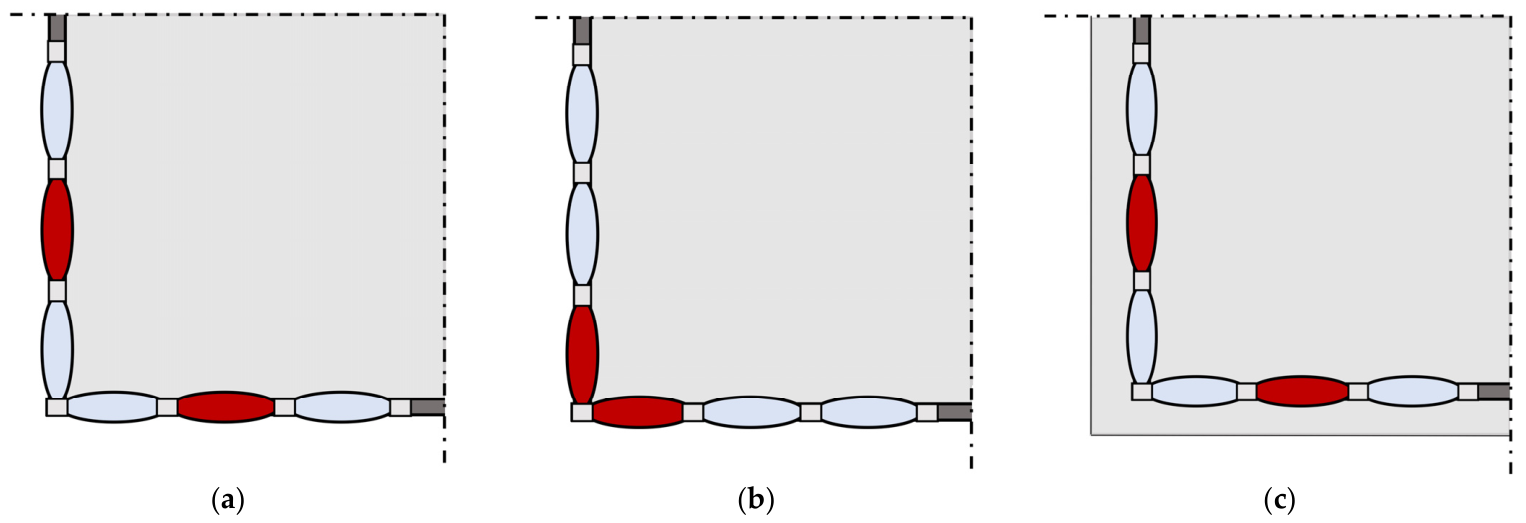
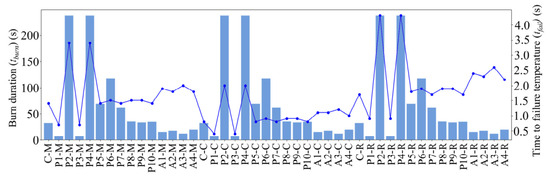
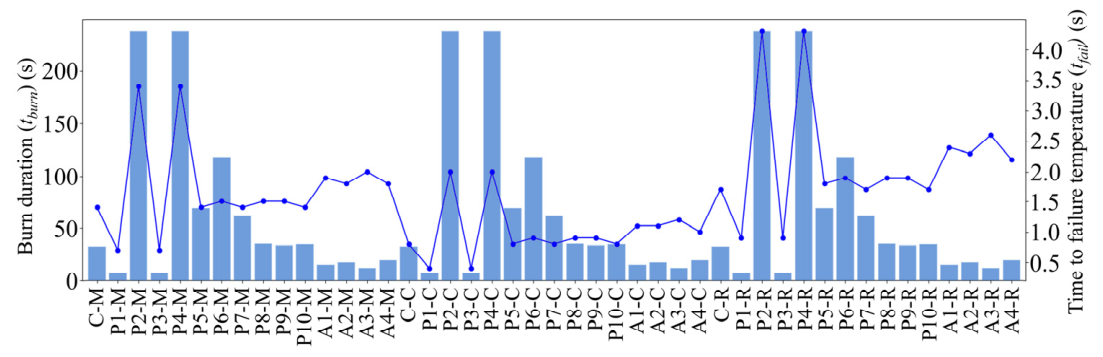
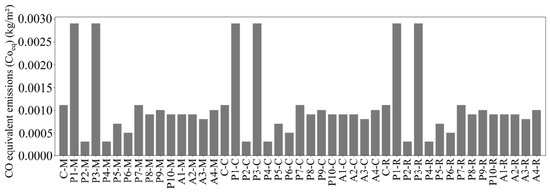
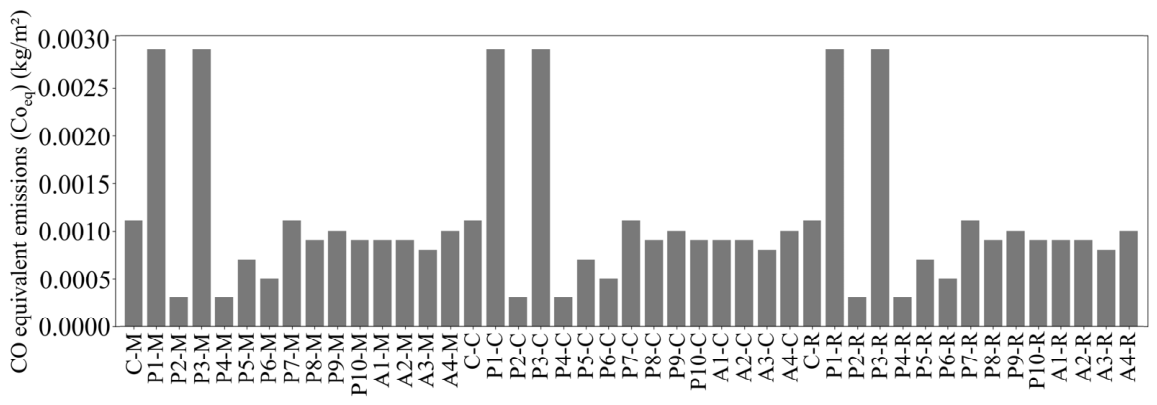
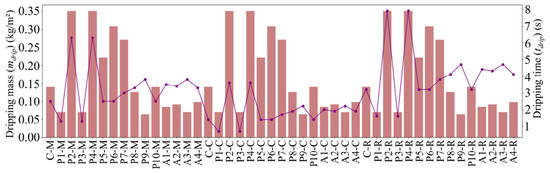
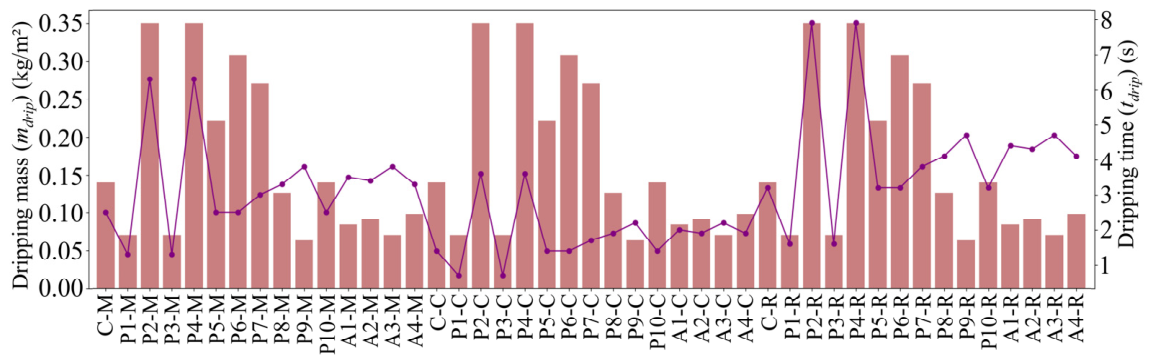
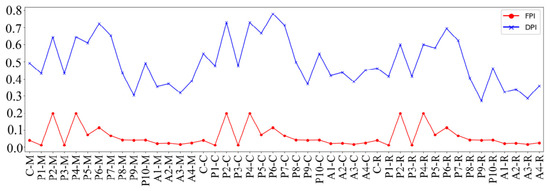
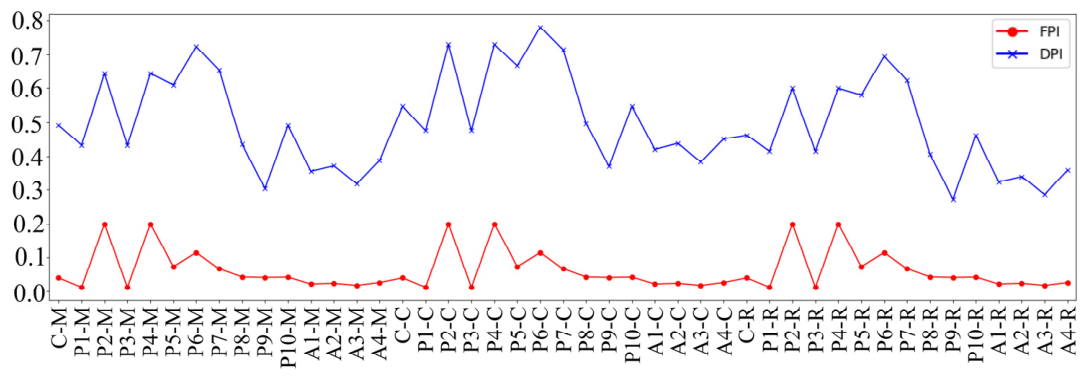
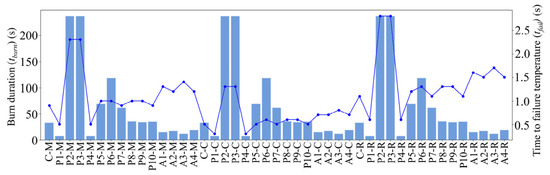
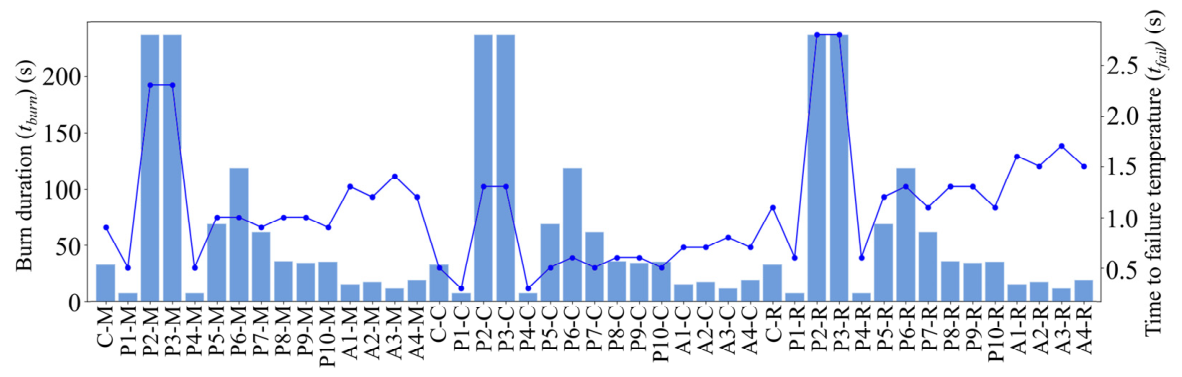
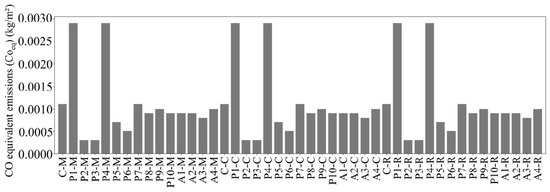
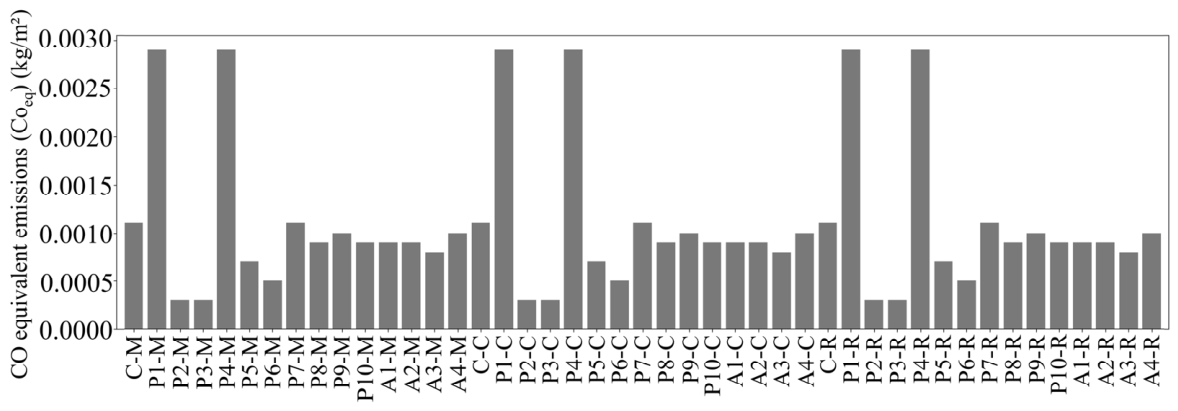
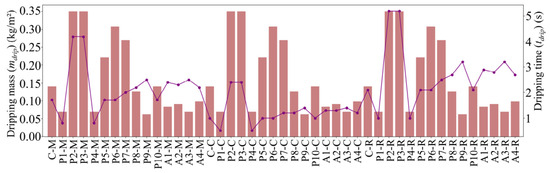
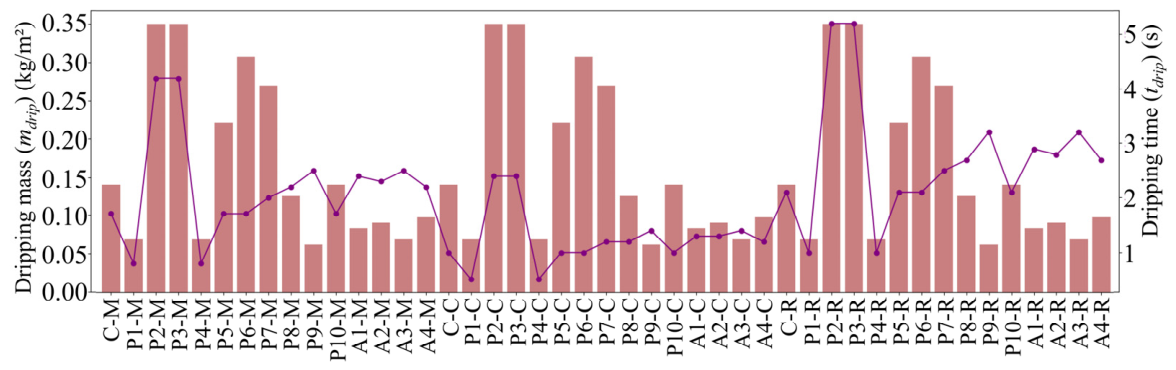
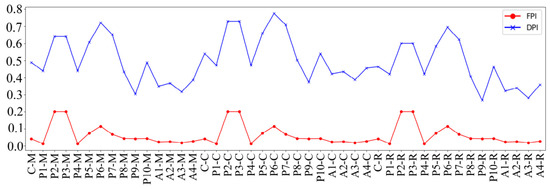
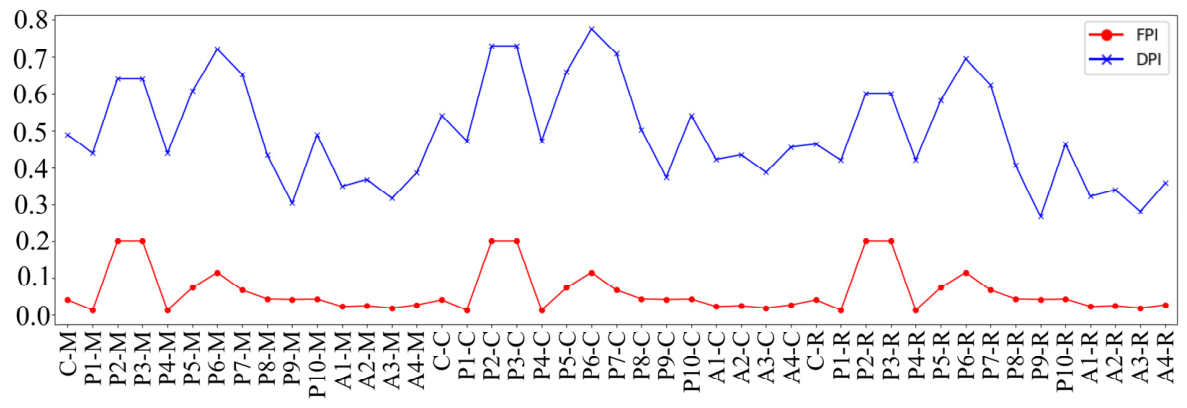
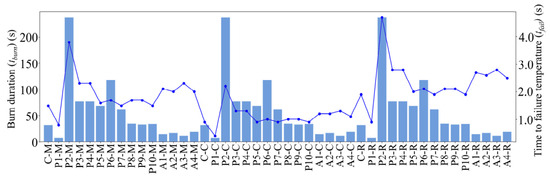
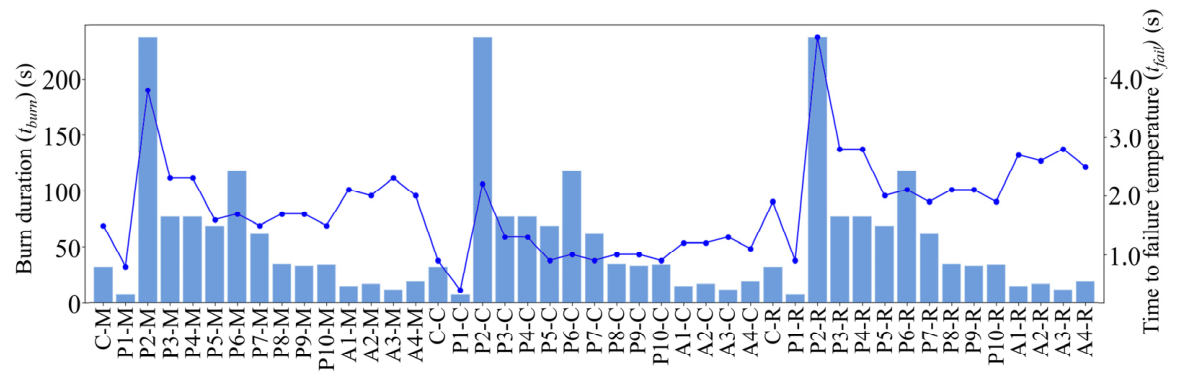
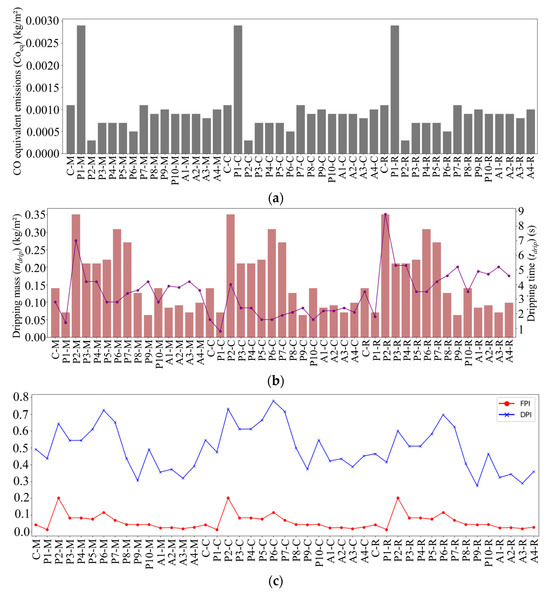
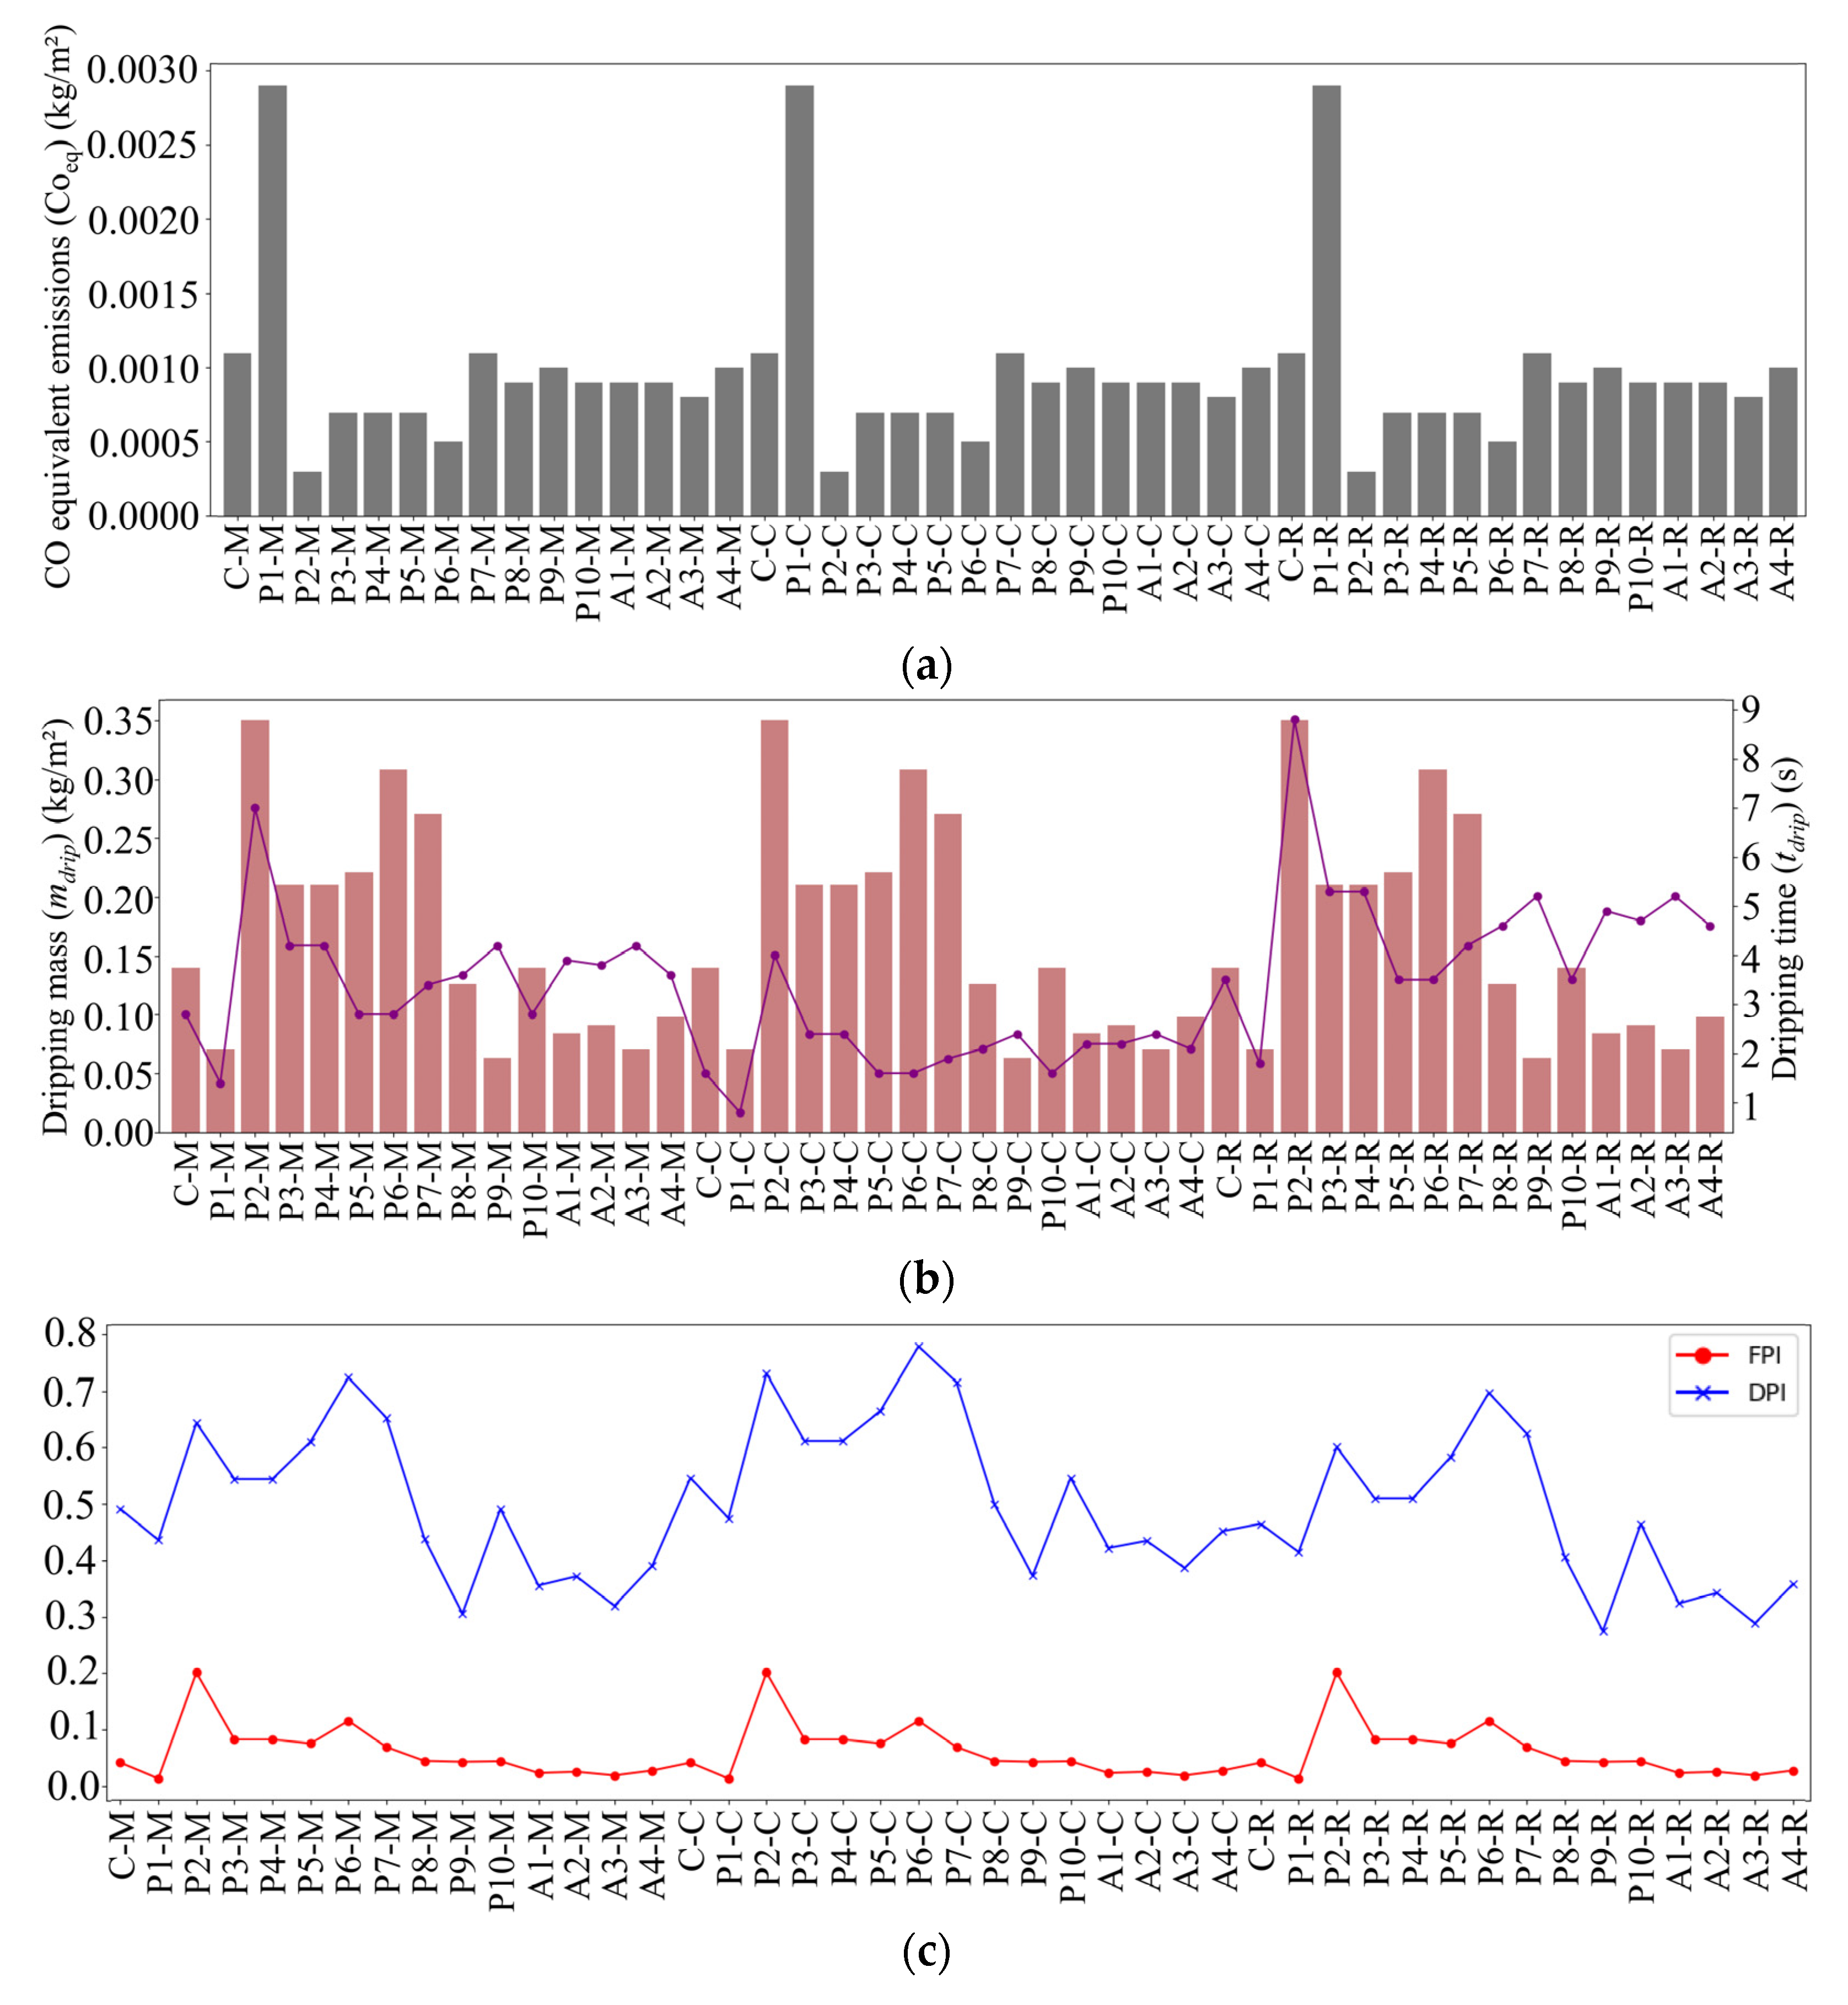
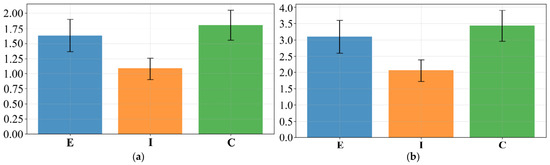
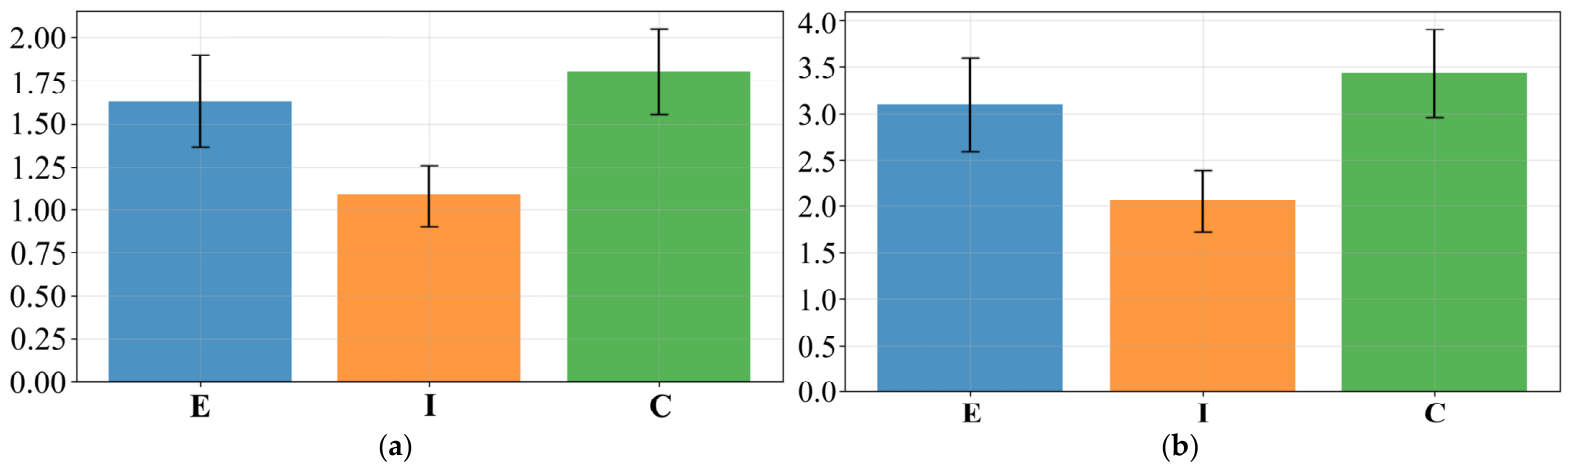
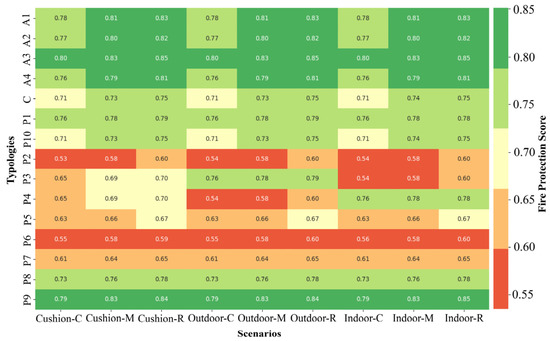
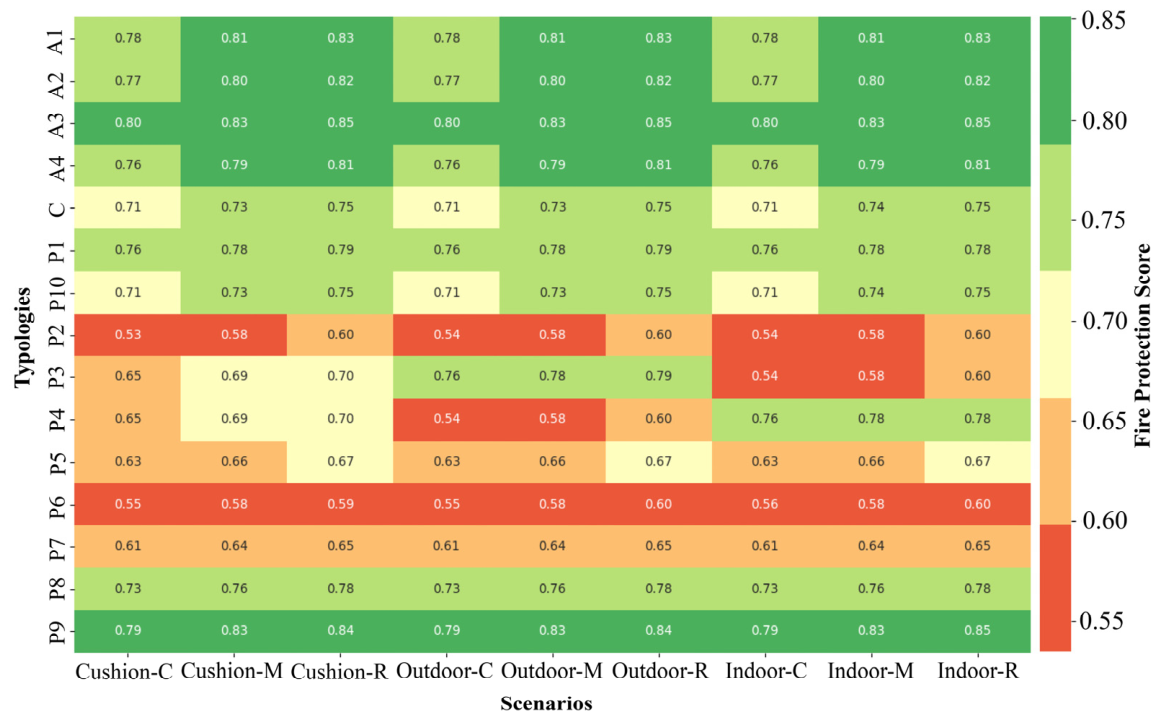
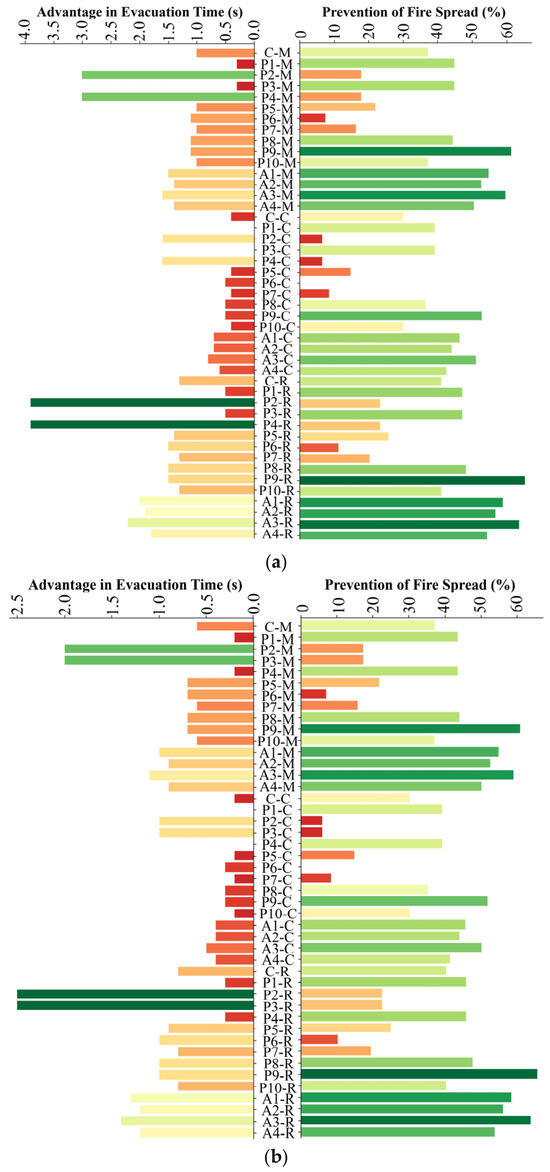
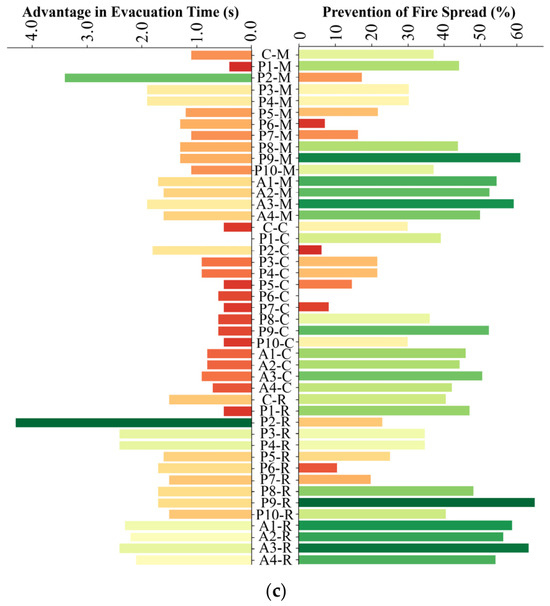
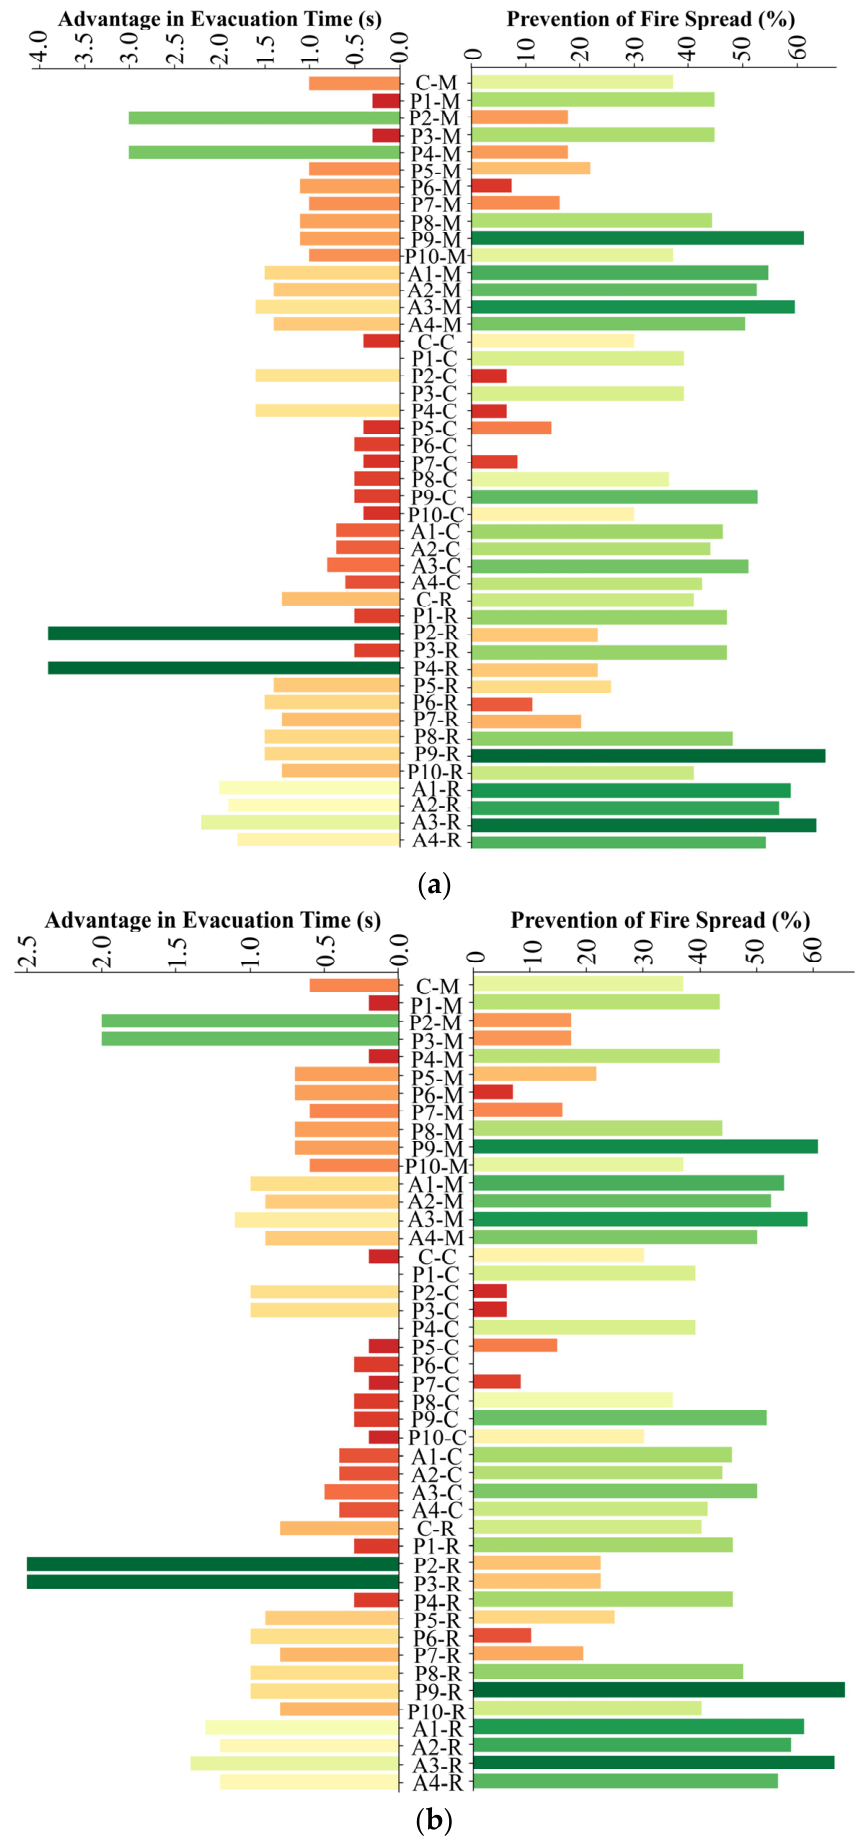
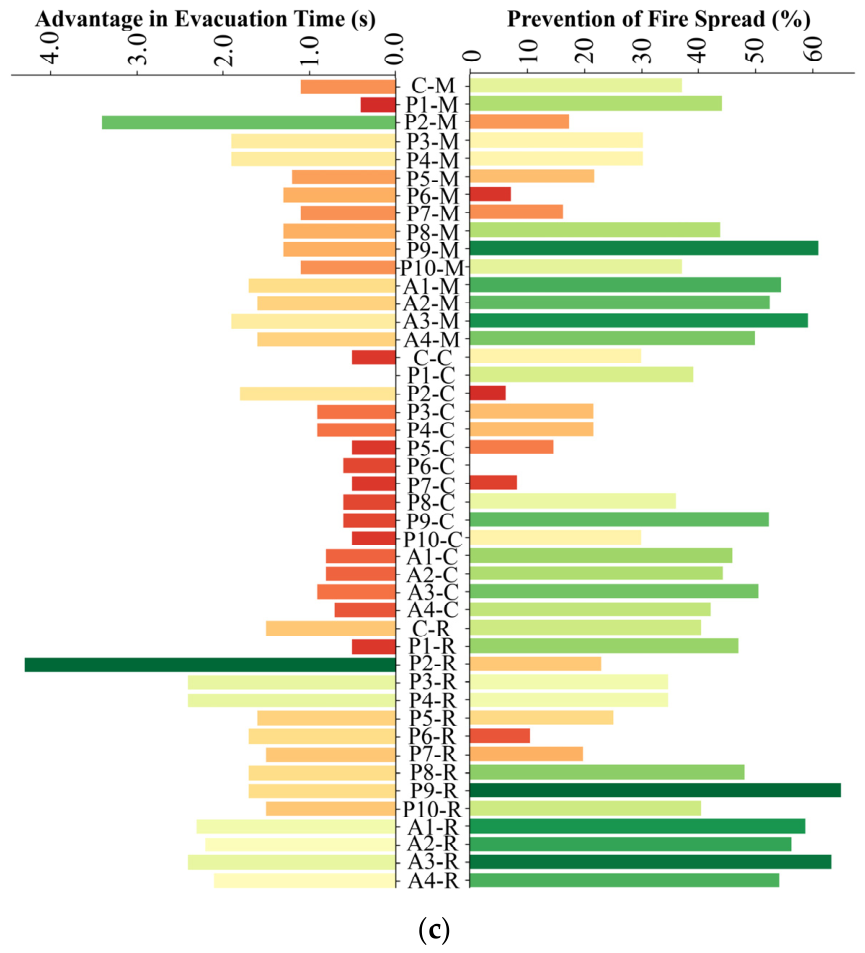
















Disclaimer/Publisher’s Note: The statements, opinions and data contained in all publications are solely those of the individual author(s) and contributor(s) and not of MDPI and/or the editor(s). MDPI and/or the editor(s) disclaim responsibility for any injury to people or property resulting from any ideas, methods, instructions or products referred to in the content. |
© 2026 by the authors. Licensee MDPI, Basel, Switzerland. This article is an open access article distributed under the terms and conditions of the Creative Commons Attribution (CC BY) license.