Article

A Sub-Mother UAV Swarm Deployment and Routing for Power Grid Emergency Communication

1
Xingyi Power Supply Bureau of Guizhou Power Grid Co., Ltd., China Southern Power Grid Co., Ltd., JuShan Avenue, Xingyi 562400, China
2
Liupanshui Power Supply Bureau of Guizhou Power Grid Co., Ltd., China Southern Power Grid Co., Ltd., No. 45 Zhongshan Middle Road, Liupanshui 553001, China
3
Marine Engineering College, Dalian Maritime University, Dalian 116026, China
*
Authors to whom correspondence should be addressed.
Appl. Sci. 2026, 16(13), 6581; https://doi.org/10.3390/app16136581
Submission received: 20 March 2026 / Revised: 20 June 2026 / Accepted: 25 June 2026 / Published: 1 July 2026

Abstract

This paper investigates the coordinated deployment and routing of communication equipment by a Sub-mother UAV swarm in power-grid emergency communication scenarios. Considering mission timeliness and payload constraints, a heterogeneous MUAV–SUAV coordinated deployment-and-routing model is established to minimize the total system cost, including platform flight cost, SUAV activation cost, and penalty cost caused by delayed deployment. To solve this problem, a two-stage optimization framework is proposed. In the first stage, an improved K-means clustering algorithm with neighborhood search (K-means-NS) is developed to divide deployment points into feasible sub-regions while satisfying SUAV endurance constraints and maintaining the deployment–retrieval payload balance required by the MUAV. In the second stage, the MUAV inter-region visiting sequence is treated as a routing subproblem, and an improved adaptive genetic algorithm (IAGA) is designed to optimize the coordinated routes of the MUAV and SUAVs within each sub-region. The IAGA adopts hybrid encoding, feasible-solution adjustment, elitist selection, and adaptive crossover–mutation operations to improve search efficiency under complex constraints. Numerical experiments on small-, medium-, and large-scale scenarios show that the proposed method can generate feasible sub-region divisions and coordinated routing schemes. Compared with GA and G-PSHA, IAGA reduces the total flight cost by approximately 21.2%, 10.5%, and 23.2% relative to GA and by approximately 0.2%, 2.5%, and 8.1% relative to G-PSHA in the three scenarios, respectively. Sensitivity analysis further indicates that stricter mission-timeliness requirements increase penalty costs, highlighting the importance of timely communication-device deployment in emergency restoration.

1. Introduction

In recent years, extreme natural disasters such as earthquakes, floods, and ice storms have frequently damaged power infrastructure and communication networks, creating serious challenges for emergency repair and grid restoration [1,2]. In post-disaster power-grid scenarios, temporary communication equipment must be rapidly deployed to support repair command, on-site information backhaul, and emergency decision-making [3,4]. However, damaged roads, disrupted traffic, and inaccessible repair sites often make conventional ground-based communication support difficult to implement [5,6]. In addition, emergency communication tasks are usually subject to strict timeliness requirements, and delayed deployment may reduce the effectiveness of disaster-response operations [7,8]. Therefore, aerial emergency communication deployment has become an important solution for restoring communication services in disaster areas.
Sub-unmanned aerial vehicles (SUAVs) have advantages in high mobility, flexible vertical take-off and landing capability, and access to scattered task points, but their payload capacity and endurance are limited [9,10]. Mother unmanned aerial vehicles (MUAVs), in contrast, have stronger carrying capacity and longer endurance and can transport communication devices and multiple SUAVs to the disaster area [11,12,13,14]. A coordinated MUAV–SUAV system can therefore combine the long-distance transportation and carrying capability of the MUAV with the local flexible deployment capability of SUAVs. In the considered power-grid emergency communication scenario, the MUAV carries communication devices and SUAVs to the task area, while SUAVs perform local delivery and activation of communication devices. The MUAV also participates in inter-region movement, device replenishment, and retrieval operations. This coordinated mechanism is suitable for rapid communication restoration in no-signal or weak-signal areas [15,16].
The coordinated deployment and routing of MUAV–SUAV systems is related to several research streams, including UAV routing, heterogeneous fleet routing, truck–drone logistics, time-window routing, location-routing problems, and emergency communication deployment. Existing studies have investigated truck–drone cooperative delivery, two-echelon routing, drone scheduling, and route optimization under operational constraints [17,18,19,20,21]. Adaptive genetic algorithms have also been used for heterogeneous multi-UAV task assignment [22], while exact and heuristic approaches have been developed for multi-echelon drone-routing and truck–drone scheduling problems [23,24]. More specifically, Ref. [25] considers heterogeneous truck–drone cooperative delivery and pickup services. In addition, recent location-sizing and routing studies have shown the effectiveness of integrating location decisions with routing optimization in complex logistics systems [26]. However, most existing methods are designed for conventional logistics delivery or homogeneous vehicle routing settings. They usually do not jointly consider the deployment and retrieval of emergency communication devices, the dynamic payload evolution of a MUAV, SUAV activation cost, rendezvous coordination, and time-window penalties caused by delayed communication-device activation. These features make the present power-grid emergency communication problem different from standard vehicle routing or truck–drone delivery problems.
Compared with Ref. [25], the present problem introduces two additional couplings. First, the MUAV payload changes dynamically because communication devices are deployed and retrieved during the mission. This makes the feasibility of sub-region division dependent on the deployment–retrieval payload balance. Second, emergency communication devices must be deployed and activated within mission time windows; otherwise, penalty costs are incurred.
To address the above issues, this paper studies a heterogeneous MUAV–SUAV coordinated deployment-and-routing problem with payload constraints and mission time-window penalties. The objective is to minimize the total system cost, including platform flight cost, SUAV activation cost, and delayed-deployment penalty cost. The proposed framework is intended to provide decision support for power-grid emergency communication restoration by balancing deployment urgency, UAV resource allocation, and operational cost.
The main contributions of this paper are summarized as follows.
First, a heterogeneous MUAV–SUAV coordinated deployment-and-routing model is established for power-grid emergency communication scenarios. Different from conventional logistics routing models, the proposed model considers communication-device deployment and retrieval, MUAV payload evolution, SUAV dispatching, platform-dependent flight costs, and mission time-window penalties within a unified cost-minimization framework.
Second, a K-means clustering algorithm with neighborhood search (K-means-NS) is developed to generate feasible sub-regions before route optimization. The algorithm adjusts noise points through neighborhood search so that the generated sub-regions satisfy SUAV endurance constraints, SUAV payload constraints, and the MUAV deployment–retrieval payload balance. This provides feasible regional inputs for subsequent coordinated routing.
Third, an improved adaptive genetic algorithm (IAGA) is designed for coordinated MUAV–SUAV route optimization within and between sub-regions. The IAGA adopts hybrid encoding, feasible-solution adjustment, elitist selection, adaptive crossover–mutation operations, and a historical-improvement-based mutation operator. These mechanisms jointly optimize the MUAV visiting sequence and SUAV task assignment under coupled payload and time-window constraints.
The remainder of this paper is organized as follows. Section 2 describes the problem and formulates the heterogeneous MUAV–SUAV coordinated deployment-and-routing model. Section 3 presents the two-stage solution framework, including K-means-NS clustering and IAGA-based route optimization. Section 4 reports numerical experiments, algorithm comparisons, and sensitivity analysis. Section 5 concludes the paper and discusses future research directions.

2. Problem Description

This paper investigates the optimal cost problem for the coordinated deployment and necessary retrieval of communication equipment in disaster areas by MUAV collaborating with multiple SUAVs, under the dual constraints of mission timeliness and payload capacity. The total system cost primarily includes the MUAV’s flight cost, the fixed dispatch cost for SUAVs, the SUAVs’ flight cost, and penalty costs incurred due to deployment delays at deployment points. Therefore, the problem studied in this paper is defined as a heterogeneous MUAV–SUAV coordinated deployment-and-routing problem with payload constraints and mission time-window penalties. For consistency, the MUAV denotes the mother UAV, the SUAV denotes the sub-UAV, a deployment point denotes a task point where a communication device is delivered and activated, a retrieval point denotes a task point where an existing communication device is picked up, and a sub-region denotes a task area assigned for coordinated MUAV–SUAV operation.
The following modeling assumptions are adopted in this study:
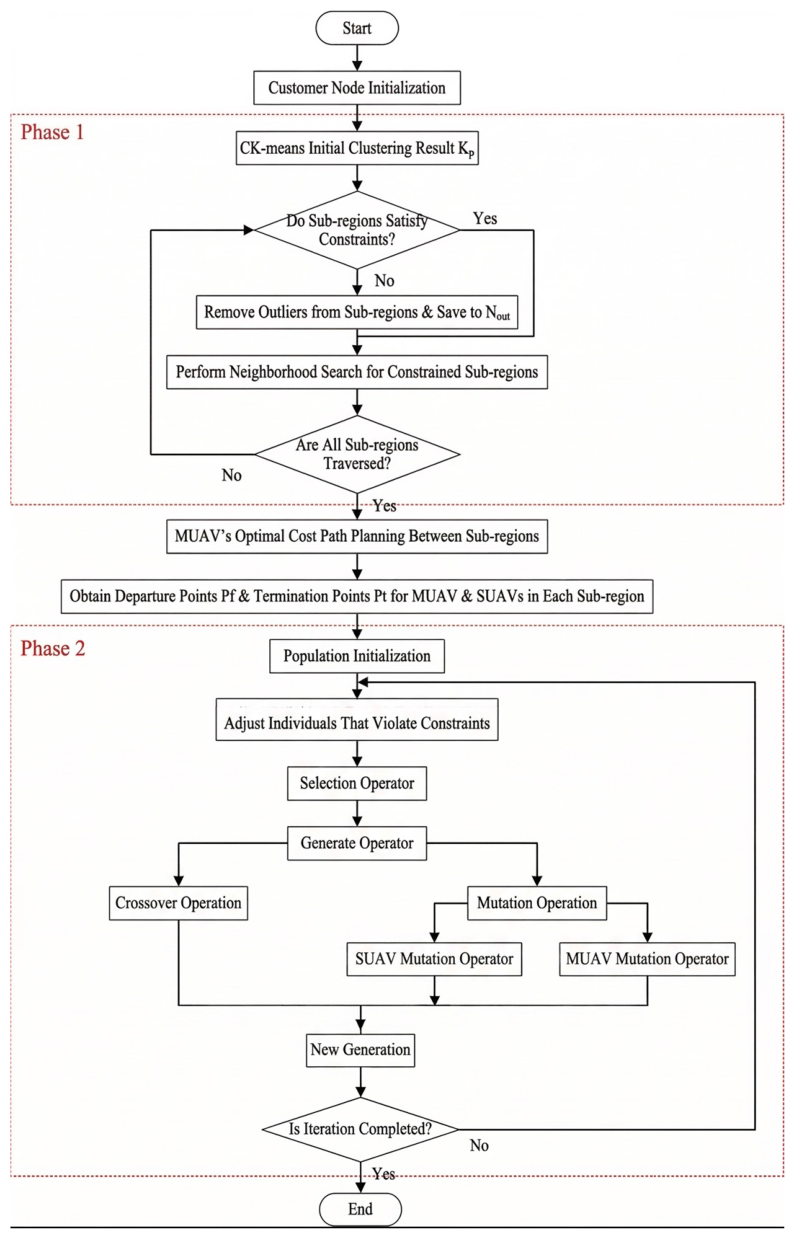
The analytical description below follows a two-stage deployment-and-routing logic. The first stage divides the task area into feasible sub-regions. The second stage optimizes the coordinated routes of MUAVs and SUAVs within and across these sub-regions, as shown in Figure 1.
  • Each dispatch of a SUAV from the MUAV to execute a task incurs a fixed cost, regardless of the flight distance or duration.
  • The number of key devices retrieved by the unmanned platform within a sub-area and the number of new devices to be deployed must satisfy a dynamic payload and capacity balance constraint for the platform.
  • The deployment time of the MUAV or SUAV at any deployment point must be completed within the specified time window; exceeding this window incurs a corresponding penalty cost.
  • To simplify the model, both the MUAV and SUAVs are assumed to fly at constant speeds; dynamic speed variations are not considered at this stage. This assumption simplifies the calculation of flight time and operational cost but may affect cost estimation and route-feasibility evaluation in real post-disaster environments, where UAV speed and endurance can be influenced by wind, payload variation, battery state, altitude, route geometry, and weather. Variable speed and payload-dependent endurance will be considered in future work.
  • When the MUAV and a SUAV rendezvous at a predetermined meeting point, the party arriving first enters a waiting state (incurring no additional cost) until the other arrives, after which the handover of communication equipment (for replenishment or retrieval) is completed.

2.1. Modeling of a Heterogeneous Unmanned Platform Emergency System with Mission Timeliness Constraints

In this paper, the heterogeneous platform coordinated scheduling optimization problem is decomposed into two subproblems: MUAV path planning and SUAV path planning. As the MUAV’s payload constraint is introduced, its path planning between sub-regions must not only consider flight distance but also satisfy real-time capacity limitations.
The parameters and their meanings are defined in Table 1.

2.2. SUAV Deployment Task Model for Communication Equipment Under Mission Timeliness and Payload Constraints

The parameters and meanings of the SUAV are shown in Table 2:
The SUAV deployment subproblem aims to minimize the operational cost of the SUAV swarm within each sub-region. The objective function consists of three components: the fixed SUAV dispatch cost, the SUAV flight cost, and the penalty cost caused by exceeding the mission time window. Based on the parameters and decision variables defined above, the SUAV deployment subproblem is formulated in the following standard optimization form:
min   S A = k K S A k
       D a k = ( p i , p j ) p a , i j D a ( p i , p j ) k s . t .   D a k D max a        D max a = Q max Q a ( p f ) × D max
Q a k Q max a
d i k Q max a
a A X a k | A |
i p s d i k = a A Q a k a A Q max a
a A p i P s , i j X a ( p i , p j ) k = 1
a A p i P s , i j p j P s , i j X a ( p i , p j ) k = N s k
Among them, (1) is the objective function; constraint condition (2) indicates that the actual flight distance of the SUAV does not exceed its maximum flight distance; constraint condition (3) states that the actual payload capacity of the a-th SUAV cannot exceed the SUAV’s maximum payload capacity; constraint (4) specifies that the weight of a single communication device must not exceed the ideal maximum payload capacity of each SUAV; in order to minimize the number of round trips and thus reduce the total flight distance, constraint condition (5) stipulates that each SUAV can take off at most once within one region; constraint condition (6) indicates that the total weight of communication devices in that region must not exceed the combined maximum payload capacity of all SUAVs; and (7) and (8) ensure that all deployment points with deployment demands are served by SUAVs exactly once where the binary domains are X a k { 0 , 1 } and X a ( p i , p j ) k { 0 , 1 } , for all a A , k K , and p i , p j P k .

2.3. Modeling for MUAV Path Planning in Communication Equipment Deployment Under Payload Constraints

MUAV parameters and descriptions are shown in Table 3:
The binary decision variables used in the SUAV and MUAV routing models are listed separately in Table 4.
The MUAV routing subproblem determines both the intra-region retrieval route and the inter-region visiting sequence of the MUAV. The objective function includes the MUAV flight cost within sub-regions, the MUAV flight cost between sub-regions, and the penalty cost associated with delayed deployment. Based on the parameters and decision variables defined above, the MUAV routing subproblem is formulated in the following standard optimization form:
min   S T = k K ( p i , p j ) p t , i j S i ( p i , p j ) k X i ( p i , p j ) k + S o ( k i , k j ) X o ( k i , k j ) + s p ( τ j e X i ( p i , p j ) k ) +
s . t .   0 k K a A Q a k Q max t
0 Q k t Q max t
0 Q k t + a A Q a k Q q k Q max
b i k Q max t
k K i P q b i k Q max t
p i P q , i j X i t ( p i , p j ) k = 1
p i P q , i j p j P q , i j X i t ( p i , p j ) k = N t k
k i K , i j X o ( k i , k j ) = 1
k j K k i K , i j X o ( k i , k j ) = N k
Among them, (9) is the objective function; (10) indicates that the total weight of communication devices to be delivered within the entire deployment area does not exceed the MUAV’s ideal maximum payload capacity; (11) states that before serving the k-th sub-region, the MUAV’s load does not exceed its ideal maximum payload capacity; (12) ensures that after completing the deployment and retrieval tasks in each sub-region, the load inside the MUAV will not exceed its ideal maximum payload capacity; (13) specifies that the weight of a single communication device to be picked up cannot exceed the MUAV’s ideal maximum payload capacity; (14) states that the total weight of communication devices to be picked up in the entire task area must not exceed the MUAV’s ideal maximum payload capacity; and constraints (15) and (16) ensure that each retrieval point is served exactly once by the MUAV, while constraints (17) and (18) jointly ensure that each sub-region is visited exactly once by the MUAV. where the binary domains are X i ( p i , p j ) k { 0 , 1 } and X o ( k i , k j ) { 0 , 1 } .
Finally, the overall objective function integrates the SUAV-related cost and the MUAV-related cost. The total system cost is minimized as follows:
min S = S A + S T
From an engineering perspective, the objective functions evaluate both flight distance and the operational cost of heterogeneous MUAV–SUAV cooperation. The time-window penalty reflects the additional loss caused by delayed communication-device deployment, while the deployment–retrieval payload balance ensures that the MUAV has sufficient capacity for both newly deployed and retrieved devices. Therefore, payload constraints are directly related to route feasibility, since a shorter route may still be infeasible if the MUAV or SUAV payload limit is violated. In addition, the rendezvous waiting condition is treated as an operational assumption without introducing additional waiting cost in the present model.
Remark: This paper extends the Time-dependent Collaborative SUAV Path Planning Problem (TDCDPPP) proposed in reference [25] by further introducing the payload constraint of the MUAV and the mission timeliness constraint for sub-regions. The inclusion of these two types of constraints increases the complexity of the problem and enhances its alignment with real-world scenarios. The payload constraint not only limits the total amount of communication equipment the MUAV can carry in a single trip but also, by influencing the total equipment allocation between the MUAV and UAVs within each sub-region, inversely determines the feasibility of the initial sub-region division in the first stage. Meanwhile, the mission timeliness constraint requires all equipment to be deployed within specified time windows, imposing stricter timing requirements on the coordinated path planning of the MUAV and UAVs. These constraints render the Heterogeneous Collaborative Optimization Algorithm (HDFOS) from reference [25] unable to directly solve the new problem. Therefore, this paper proposes improvements in a two-stage algorithm: First, a new clustering algorithm is introduced to generate an initial sub-region division that satisfies both payload and timeliness constraints. Second, in the path optimization stage, the strategy of separately solving the paths for the MUAV and UAVs, as used in the original algorithm, is abandoned. Instead, a unified encoding scheme and an integrated mutation operator are designed, merging the path planning for the heterogeneous platforms into a single IAGA framework for simultaneous optimization. Through carefully designed genetic operators and adaptive mechanisms, this algorithm achieves a higher-quality coordinated scheduling solution while effectively controlling computational complexity.

3. Optimal Cost Path Planning Algorithm Design

This section develops a path planning algorithm to minimize the cost of collaborative deployment and retrieval of communication devices by multiple MUAVs and SUAVs, as described earlier. Due to the differing roles of MUAVs and SUAVs, we continue to use a two-stage approach that first clusters the target locations and then solves the path planning problem. The basic steps of the algorithm are as follows: first, deployment points are divided into several sub-regions that satisfy constraints (2–4, 6, 11–13); then, the optimal path for MUAV between sub-regions is solved. Here, since only the flight between sub-regions by MUAV is considered, only path cost is involved. The MUAV inter-region visiting sequence can be abstracted as a TSP subproblem, because only the visiting order and path cost between sub-regions are considered at this stage.
The algorithm framework is shown as follows:

3.1. Clustering Algorithm Design

Due to the addition of MUAV payload capacity constraints in this paper, clustering must comprehensively consider the total weight of communication devices delivered by SUAVs (i.e., satisfying constraints (2–4) and (6)) and the weight of communication devices retrieved by MUAV (i.e., satisfying constraints (11–13)). To avoid a situation in any sub-region where the total weight of communication devices to be delivered is less than the total weight of communication devices to be retrieved, which would lead to exceeding the MUAV’s payload capacity constraint, this paper must ensure that after clustering, the total weight of communication devices to be deployed in each sub-region is not less than the total weight of communication devices to be retrieved. The increase in constraint conditions and the heightened coupling between MUAVs and SUAVs make the clustering problem significantly more complex, rendering the clustering method proposed in [25] inadequate. Following this line of thinking, this subsection improves upon the Ck-means algorithm by adding neighborhood search to the original algorithm, designing a K-means clustering algorithm based on neighborhood search.
Objective function
J ( K ) = min j = 1 n k p i k j | | p i μ ( j ) | | 2 2
( p i k i ) | | p i μ ( j ) | | 2 D max a
0 i p q b i k Q max t
0 j p s d j k a A Q max a
i p q b i k j p s d j k
( k K ) ( i p q b i k + j p s d j k ) > 0
Among them, (20) is the objective function for clustering; (21) indicates that the distance between any deployment point with deployment demand within a sub-region and its cluster center does not exceed the maximum flight range of the SUAV; (22) states that the total demand of deployment points requiring retrieval deployment in sub-region k does not exceed the MUAV’s maximum load capacity; (23) states that the total demand of deployment points requiring deployment in the k-th sub-region does not exceed the combined maximum payload capacity of all SUAVs; (24) states that the total demand for deployment within sub-region k is not less than the total demand for retrieval; (25) ensures that no sub-region consists solely of deployment points with no demand.
Specific clustering steps are as follows:
(a)
Cluster the deployment points using the CK-means algorithm to obtain an initial clustering result. Since the state of each deployment point is determined by its deployment quantity and retrieval quantity, any deployment point p i can be uniquely represented by a two-dimensional array, that is p i ( w s i , w q i ) , where w s i and w q i denote the deployment quantity and retrieval quantity of deployment point p i , respectively. It should be noted that the clustering result at this stage already satisfies the payload capacity and range constraints of the SUAVs. Therefore, it is only necessary to further adjust the clustering to meet the MUAV’s payload capacity constraint. As the MUAV has no range limitation, the process essentially involves reassigning those deployment points that only require retrieval service, represented as p i ( 0 , w q i ) , which do not satisfy the requirements within the current clusters.
(b)
Calculate the distances from each cluster center to all others, obtaining a distance matrix between the cluster centers.
(c)
Calculate the deployment volume j p s d j k and the retrieval volume i p q b i k within each sub-region to obtain a set of sub-regions that satisfy constraint (24) (valid) and a set of sub-regions that do not satisfy constraint (24).
(d)
Process each sub-region within the set. First, calculate the distances from all deployment points satisfying p i ( 0 , w q i ) to the cluster center within each sub-region. Then sort these distances in descending order.
(e)
For each illegal sub-region, sequentially strip away deployment points that satisfy p i ( 0 , w q i ) until the sub-region becomes legal. The stripped deployment points are collectively referred to as noise points.
(f)
Legitimate sub-regions perform a neighborhood search around their cluster centers. Under the premise of satisfying constraint (24), noise points near the cluster center are incorporated into the sub-region. This process continues until all noise points have been assigned, completing the regional division.
The pseudocode is provided in Algorithm 1.
Algorithm 1: K-means-NS Pseudocode
Input :   The   weight   demand   of   the   communication   devices   to   be   deployed   for   the   i - th   deployment   d i ;   the   weight   demand   of   the   communication   device   to   be   retrieved   for   the   i - th   deployment   b i ;   the   ideal   maximum   payload   capacity   of   the   a - th   SUAV   Q max a ;   the   expected   maximum   load   capacity   of   the   MUAV   Q max t ;   the   set   of   subregions   obtained   via   the   CK - means   algorithm   K p = { k p 1 , k p 2 , , k p n }
  •        I t e r = 1 (Iter is the iteration count)
  •            While   I t e r s i z e ( K p )
  •                    If   within   subregion   k p i t e r :   i p q b i k > Q max t   | |   i p q b i k > j p s d j k
  •                      D ←Calculate the distance from each point to all cluster centers
  •                       While   i p q b i k > Q max t   | |   i p q b i k > j p s d j k
  •                                                N o i     Remove   the   farthest   point   p i ( 0 , w q i )   from   subregion   k p i t e r and store   it   in   the   noise   point   set   N o i
  •                                                k p i t e r ← Update deployment points within the subregion
  •                                          End while
  •                                      Else continue
  •                                      End if
  •                                       I t e r = I t e r + 1
  •                                  End while
  •                                   I t e r 0 = 1
  •                                   I t e r = 1
  •                                   While   I t e r 0 s i z e ( N o i )
  •                                           While   I t e r s i z e ( K p )
  •                                                     If   adding   the   noise   point   to   subregion   k p i t e r satisfies the constraints
    i p q b i k Q max t   &&   i p q b i k j p s d j k
  •                                                                          k p i t e r     N o i ( I t e r 0 )
  •                                                                    End if
  •                                                                     I t e r = I t e r + 1
  •                                                                End while
  •                                                                 I t e r 0 = I t e r 0 + 1
                                                                                                                                    End while
Output :   The   set   of   subregions   K p , K p = { k p 1 , k p 2 , , k p n } ; the set of cluster centers C ,   C = { c 1 , c 2 , , c n } ;   the   set   of   noise   points   N o i
Note: Not all noise points in N o i can be assigned to feasible sub-regions after neighborhood search. If a noise point cannot be inserted into any sub-region without violating constraint (24), it is temporarily kept outside the sub-region set rather than being forced into an infeasible cluster. Since the MUAV is not subject to the SUAV range constraint, these unassigned noise points are subsequently treated as independent MUAV service points and are considered together with the cluster centers during the MUAV inter-sub-region route planning. The MUAV route is then solved under the premise of satisfying the MUAV payload constraint.

3.2. Design of a Coordinated Deployment Path Planning Algorithm for Heterogeneous Platforms Within Sub-Regions

First, the traversal order between sub-regions is solved using the ant colony algorithm. Then, within each sub-region, an IAGA is designed to solve the path planning problem for MUAVs and SUAVs with the minimum cost. The SUAV intra-region routing subproblem is related to the 2p-mVRPTW class because it involves multiple SUAVs, pickup-and-delivery operations, and mission time-window constraints. Therefore, this paper takes the minimum-cost path planning of the SUAV swarm within a sub-region as an example to illustrate the algorithm design in detail. The specific algorithm design is as follows:
  • Encoding method and initialization:
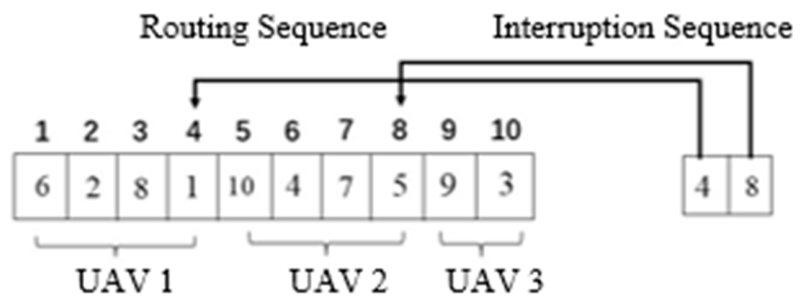
This paper still adopts the sequence encoding method, setting the population size to N p . Each individual’s gene consists of two parts, the routing sequence and the breakpoint sequence, and is initialized using prior knowledge. The individual gene is illustrated in Figure 2 below:
The ‘Routes sequence’ defines the overall task visiting order, and the ‘Interruption sequence’ separates the routes of individual SUAVs.
The launch point is the location of the deployment point within this region that has deployment or retrieval needs and is closest to the landing point of the previous sub-region (or the starting point where the warehouse is located). The endpoint is the cluster center point of the sub-region.
The hybrid encoding jointly represents the MUAV visiting sequence and the SUAV task assignment in one chromosome, which allows the fitness function to evaluate heterogeneous platform coordination directly. The feasibility flag is used to distinguish feasible and infeasible individuals after repair, so that infeasible solutions caused by payload or range violations can be retained with lower priority instead of being immediately discarded. Compared with a conventional adaptive GA, this design preserves population diversity while guiding the search toward feasible coordinated routes under the coupled MUAV–SUAV constraints.
2.
Population Individual Adjustment
For individuals that do not satisfy the constraint conditions (2–4, 6), the adjustment strategy from [25] is still employed to modify them, aiming to make each individual feasible. However, due to the randomness inherent in the initial path permutation and the demand of each deployment point, a small number of individuals may still fail to meet the constraints even after adjustment. Therefore, in this paper, and considering the need for genetic diversity, such individuals are defined as infeasible solutions but are nonetheless retained within the population. To distinguish between feasible and infeasible solutions, the encoding of an individual’s gene is adjusted as follows in this paper. It is stipulated that the first code of the individual’s gene serves as a flag bit. If the flag bit is 0, the solution represented by that individual’s gene is a feasible solution; if the flag bit is −1, it represents an infeasible solution.
3.
Adaptive Configuration
Inspired by the adaptive setup in genetic manipulation in ref. [22], this paper dynamically adjusts the number of crossover offspring and mutation offspring within the iteration period. The adaptive formula is as follows:
N c r = r o u n d [ ( N p γ ) e ( N i t e r N g ) ]
N m u = N p γ N c r
Here, N g denotes the total number of iterations, N i t e r denotes the current iteration number, r o u n d [ ] represents the rounding operation, N c r is the number of offspring obtained through the crossover operator, γ is the number of offspring selected by the selection operator to enter the next generation, and N m u is the number of offspring obtained through the mutation operator.
4.
Selection Operator Design
First, an elitism approach is adopted to select N e optimal feasible individuals to enter the next generation. Infeasible individuals, which typically violate payload or range constraints, are retained by relaxing these constraints during fitness evaluation. They are then evaluated for fitness in the same way as other feasible individuals, so that all individuals in the population can participate in selecting the remaining γ N e individuals to enter the next generation through a roulette wheel selection method.
5.
Reproduction Operator Design
The design of reproduction operators mainly includes the design of the crossover operator and the mutation operator.
(a)
Crossover Operator Design
Two individuals are randomly selected as parents from within feasible solutions, between feasible and infeasible solutions, and within infeasible solutions, respectively, to perform crossover and generate offspring, aiming to achieve global optimization of the algorithm. The specific operation is as follows:
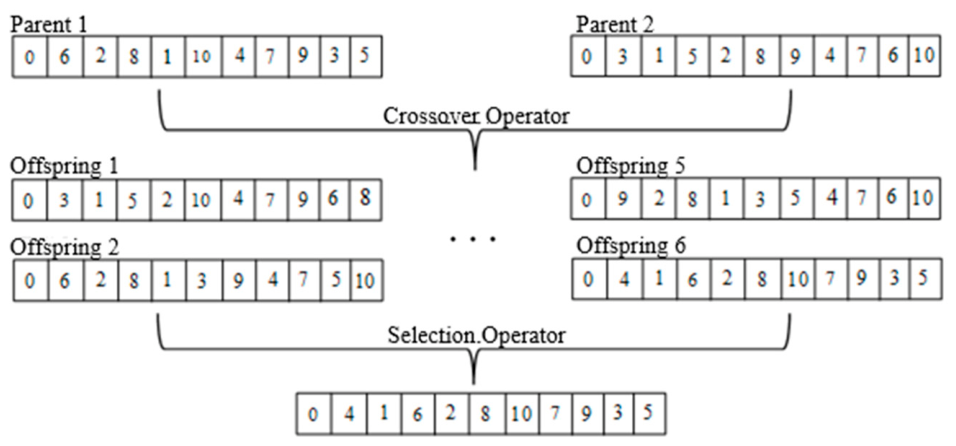
A conventional crossover algorithm randomly selects a segment of the parents for crossover, generating two offspring. This approach results in low utilization of parental genes and low crossover efficiency. Therefore, to fully utilize the genes of each parent pair, this paper employs a method where a pair of genomes, each with a gene count of n g , are crossed over group by group, with each group consisting of n c genes. This generates a set of offspring numbering n g n c , from which the best individual is selected as the offspring. Taking n c = 4 as an example, the specific operation is illustrated in the following Figure 3:
(b)
Mutation Operator Design
(i)
For the optimal cost path planning problem for MUAVs, the mutation operator in this paper adopts a commonly used multi-point mutation method. This involves randomly selecting a parent and rearranging chromosomes from multiple parent individuals to generate new offspring.
(ii)
For the optimal cost path planning problem involving multiple UAVs, considering that the selection of mutation individuals in existing mutation operators is random and cannot evolve in a specific direction to find better solutions, this paper treats the path segment of each UAV as an operator. By altering the path of each UAV to achieve optimal individual cost, the overall optimal cost for the UAV swarm is ultimately realized. However, considering the high time complexity of mutating the gene segments of all UAV individuals, inspired by the pheromone setting in ant colony optimization algorithms, this paper uses the change in fitness value of each UAV in the parent individual as a reference for selecting each UAV’s path segment in the next iteration. The roulette wheel algorithm is employed to select only one UAV’s path segment for rearrangement in each iteration. Consequently, a larger change in the fitness value of a UAV’s path segment indicates greater room for improvement, and thus a higher probability of being selected in the next iteration, allowing the parent individual to exhibit a trend of evolution towards optimizing the objective function. This operator thereby serves the algorithm’s function of local search.
The pseudo code is provided in Algorithm 2:
Algorithm 2: IAGA pseudo code.
Input :   Sub - region   set   K p , K p = { k p 1 , k p 2 , , k p n } ;   Cluster   center   set   C , C = { c 1 , c 2 , , c n }
;   Number   of   SUAVs   N a ;   Population   size   N p ;   Number   of   iterations   x ;   Noise   point   N o i
  • P f p ←Calculate the deployment point in the next sub-region that is closest to the previous sub-region1.
  • C ←The cluster center set C serves as the destination
  •   I t e r 0 = 1   ( I t e r 0 is the iteration count)
  • While   I t e r 0 S i z e o f ( K p )
  •         R, Dr       Initialize the population to obtain path genes R and interrupted genes Dr 
  •             I t e r 1 = 1
  •        While   I t e r 1 x
  •               i = 1
  •               While   i N p
  •                  If   R i , D r i Constraints are not met
  •                    R i , D r i ←Adjust the path genes and interrupted genes of individuals that do not meet the constraints
  •                 End if
  •                  F i t ( i ) ← Calculate the fitness value for each individual
  •                  k p i ← Assign labels to the deployment points in each subregion
  •        End while
  •   ### Design of Selection Operator ###
  •         N e   Select   the   optimal   individual   N e through elitism
  •         R ,   Dr     Select   γ N e individuals as offspring using the roulette wheel method
  • ### Design of Crossover Operator ###
  •         I t e r 2 = 1
  •         For   I t e r 2 = 1 : N c r
  •                N o f f ← Two individuals are selected as parents to generate offspring
  •                R ,   Dr     Select   the   optimal   individual   from   the   offspring   population   N o f f
  •         End for
  • ### Design of Mutation Operator ###
  •         I t e r 3 = 1
  •        If  MUAV route genes
  •               For   I t e r 3 = 1 : N m u
  •                 R, Dr ← Parent individuals
  •            End for
  •        Else if  SUAV path genes
  •             For   I t e r 3 = 1 : N m u
  •                  R m u , D r m u ← Parent individuals
  •                  I t e r 4 = 1
  •                  For   I t e r 3 = 1 : y
  •                         R m u , D r m u ←Mutation of parent genes
  •                 End for
  •                  R   ,   Dr   R m u , D r m u
  •             End for
  •           End if
  •         End while
  •         The optimal cost Dr and route planning R for the MUAV and multiple SUAVs in the region
  • End while
Output :   the   optimal   cost   D r z   and   the   route   planning   sequence   R z for the MUAV and multiple SUAVs performing deployment and retrieval tasks within the region.
From the design of the adaptive function, as the number of iterations increases, the number of offspring generated by the crossover operator decreases, while the number generated by the mutation operator increases. This achieves a shift in the entire algorithm from global to local optimization, which will effectively address the shortcomings of traditional genetic algorithms, such as poor local search capability and slow convergence speed. The computational complexity of IAGA depends on the population size, the maximum number of generations, the chromosome length, and the fitness-evaluation procedure; therefore, the original linear-complexity statement has been removed.
It should be noted that the proposed IAGA is a heuristic algorithm and therefore does not provide a theoretical guarantee of global optimality. Nevertheless, its convergence behavior and solution quality are supported by several algorithmic mechanisms. First, the elitist selection strategy preserves the best feasible individuals found so far, preventing the current best solution from being lost during iteration. Second, the adaptive crossover and mutation mechanism balances global exploration and local exploitation by emphasizing crossover in the early stage and mutation-based refinement in the later stage. Third, infeasible individuals are retained with a feasibility flag, which helps maintain population diversity while guiding the search toward feasible solutions. Therefore, although the optimality gap cannot be theoretically guaranteed, the convergence curves and multi-scale numerical experiments in Section 4 empirically demonstrate that IAGA achieves stable convergence and improved solution quality compared with the benchmark algorithms. Further theoretical analysis of optimality gaps and convergence bounds will be considered in future work.


4. Numerical Experiments and Analysis

The objective of this section is to validate the effectiveness of the proposed algorithm in solving the optimal cost problem for the sub-mother UAV swarm collaborative deployment system through numerical simulation experiments. First, the effectiveness of the designed K-means-NS algorithm is verified. Then, the performance of IAGA is evaluated by comparing it with other algorithms. Finally, the solution to the problem proposed in this paper using IAGA is provided.
The collaborative deployment and retrieval system still consists of 4 SUAVs and 1 MUAV. The SUAV parameters are set according to a representative urban cargo SUAV, with a maximum payload capacity of 10 kg per SUAV. The MUAV maximum payload capacity is set to 250 kg. For the cost settings, the MUAV flight cost per unit time is set to 24.72 CNY/h, the SUAV flight cost per unit time is set to 9.12 CNY/h, and the fixed dispatch cost per SUAV is set to 1 CNY/h.
The average flight speed of the SUAVs is 30 km/h, with a full-load endurance of 20 km. The MUAV’s average flight speed is 20 km/h. When the deployment time of the MUAV or SUAV at a deployment node exceeds the allowed limit, the unit penalty cost is 1000 CNY/h.
The selected area sizes represent small-, medium-, and relatively large-scale emergency communication restoration tasks. The UAV payload, endurance, flight-speed, and cost parameters are set according to practical UAV specifications and relevant references, so that the numerical scenarios reflect typical heterogeneous MUAV–SUAV deployment conditions while maintaining controllable benchmark complexity.
It should be noted that the numerical experiments in this study are mainly based on randomly generated instances with limited problem scales. The current experimental design is intended to provide preliminary validation of the feasibility and comparative performance of the proposed framework under different scenario sizes, rather than exhaustive benchmark testing. A more robust experimental design, including multiple random seeds, larger-scale instances, averaged performance results, standard deviations, and computational time, will be conducted in future work to further evaluate the generalizability and stability of the proposed method.

4.1. Validation of the K-Means-NS Algorithm Effectiveness

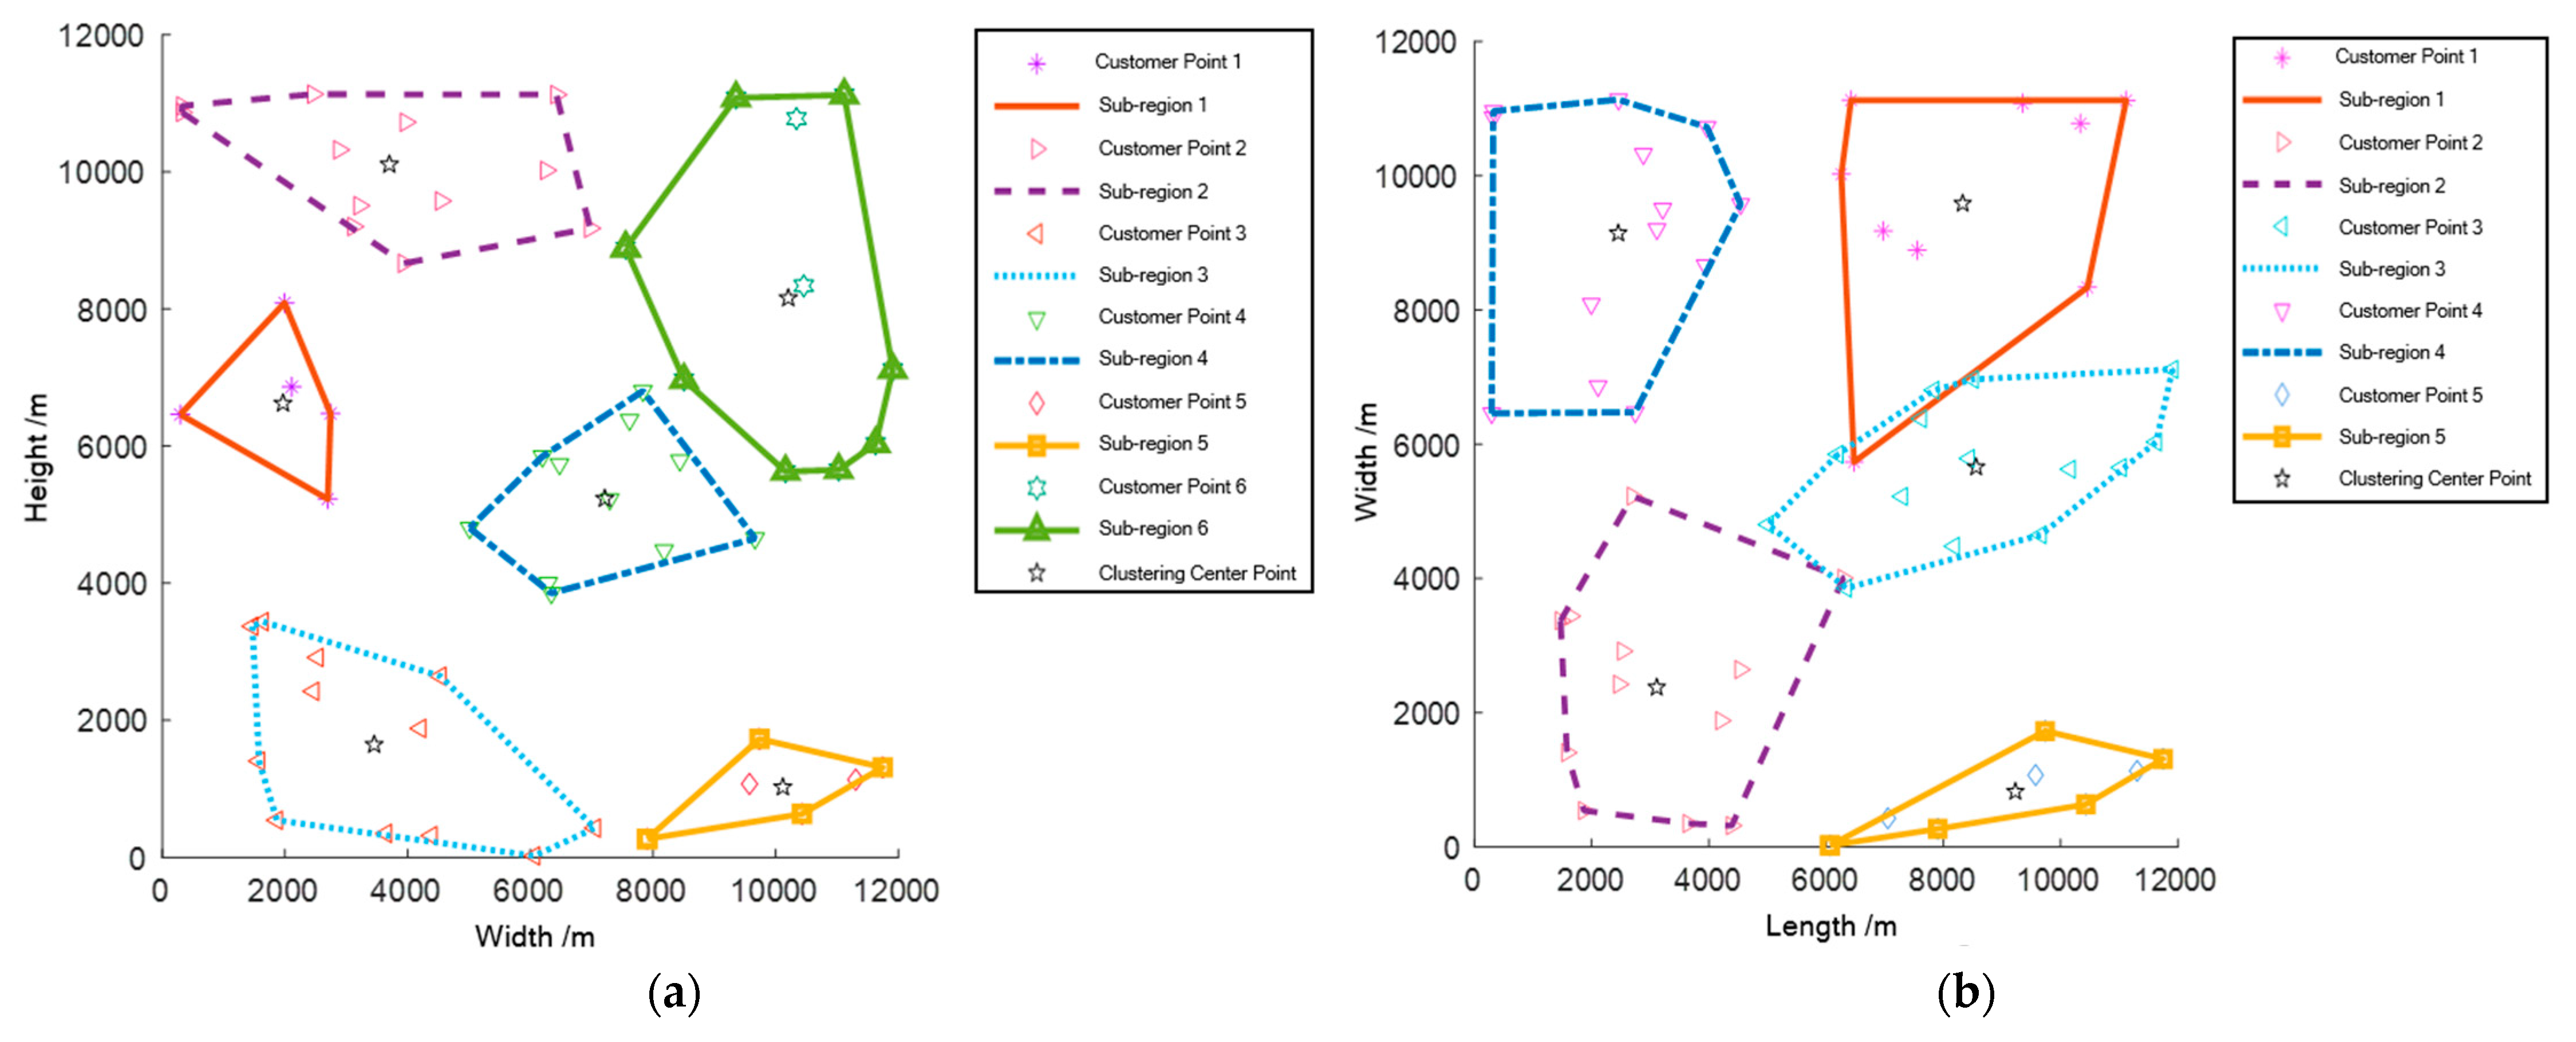
Within a deployment area of 1.2 km × 1.2 km, 60 deployment points were randomly generated. Among these, 50 points are deployment points requiring deployment from SUAVs and MUAVs respectively, while the remaining deployment points are set as non-demand points. The weight of communication devices for deployment and the weight for retrieval at each deployment point are randomly distributed between 1 and 5 kg. The clustering results of the Ck-means algorithm and the K-means-NS algorithm are shown in Figure 4:
The data comparison between the K-means-NS algorithm and the Ck-means algorithm is shown in Table 5:
As can be seen from Algorithm 1, in sub-region 4 divided by the Ck-means algorithm, the total weight of communication devices for deployment is less than the total weight for MUAV retrieval. After re-dividing the sub-regions using the K-means-NS algorithm, all sub-regions satisfy constraints (21–25). Furthermore, the reassignment of noise points improves the feasibility of the sub-region division. Figure 4 and Table 5 demonstrate the effectiveness of the K-means-NS algorithm.

4.2. Effectiveness Analysis of IAGA

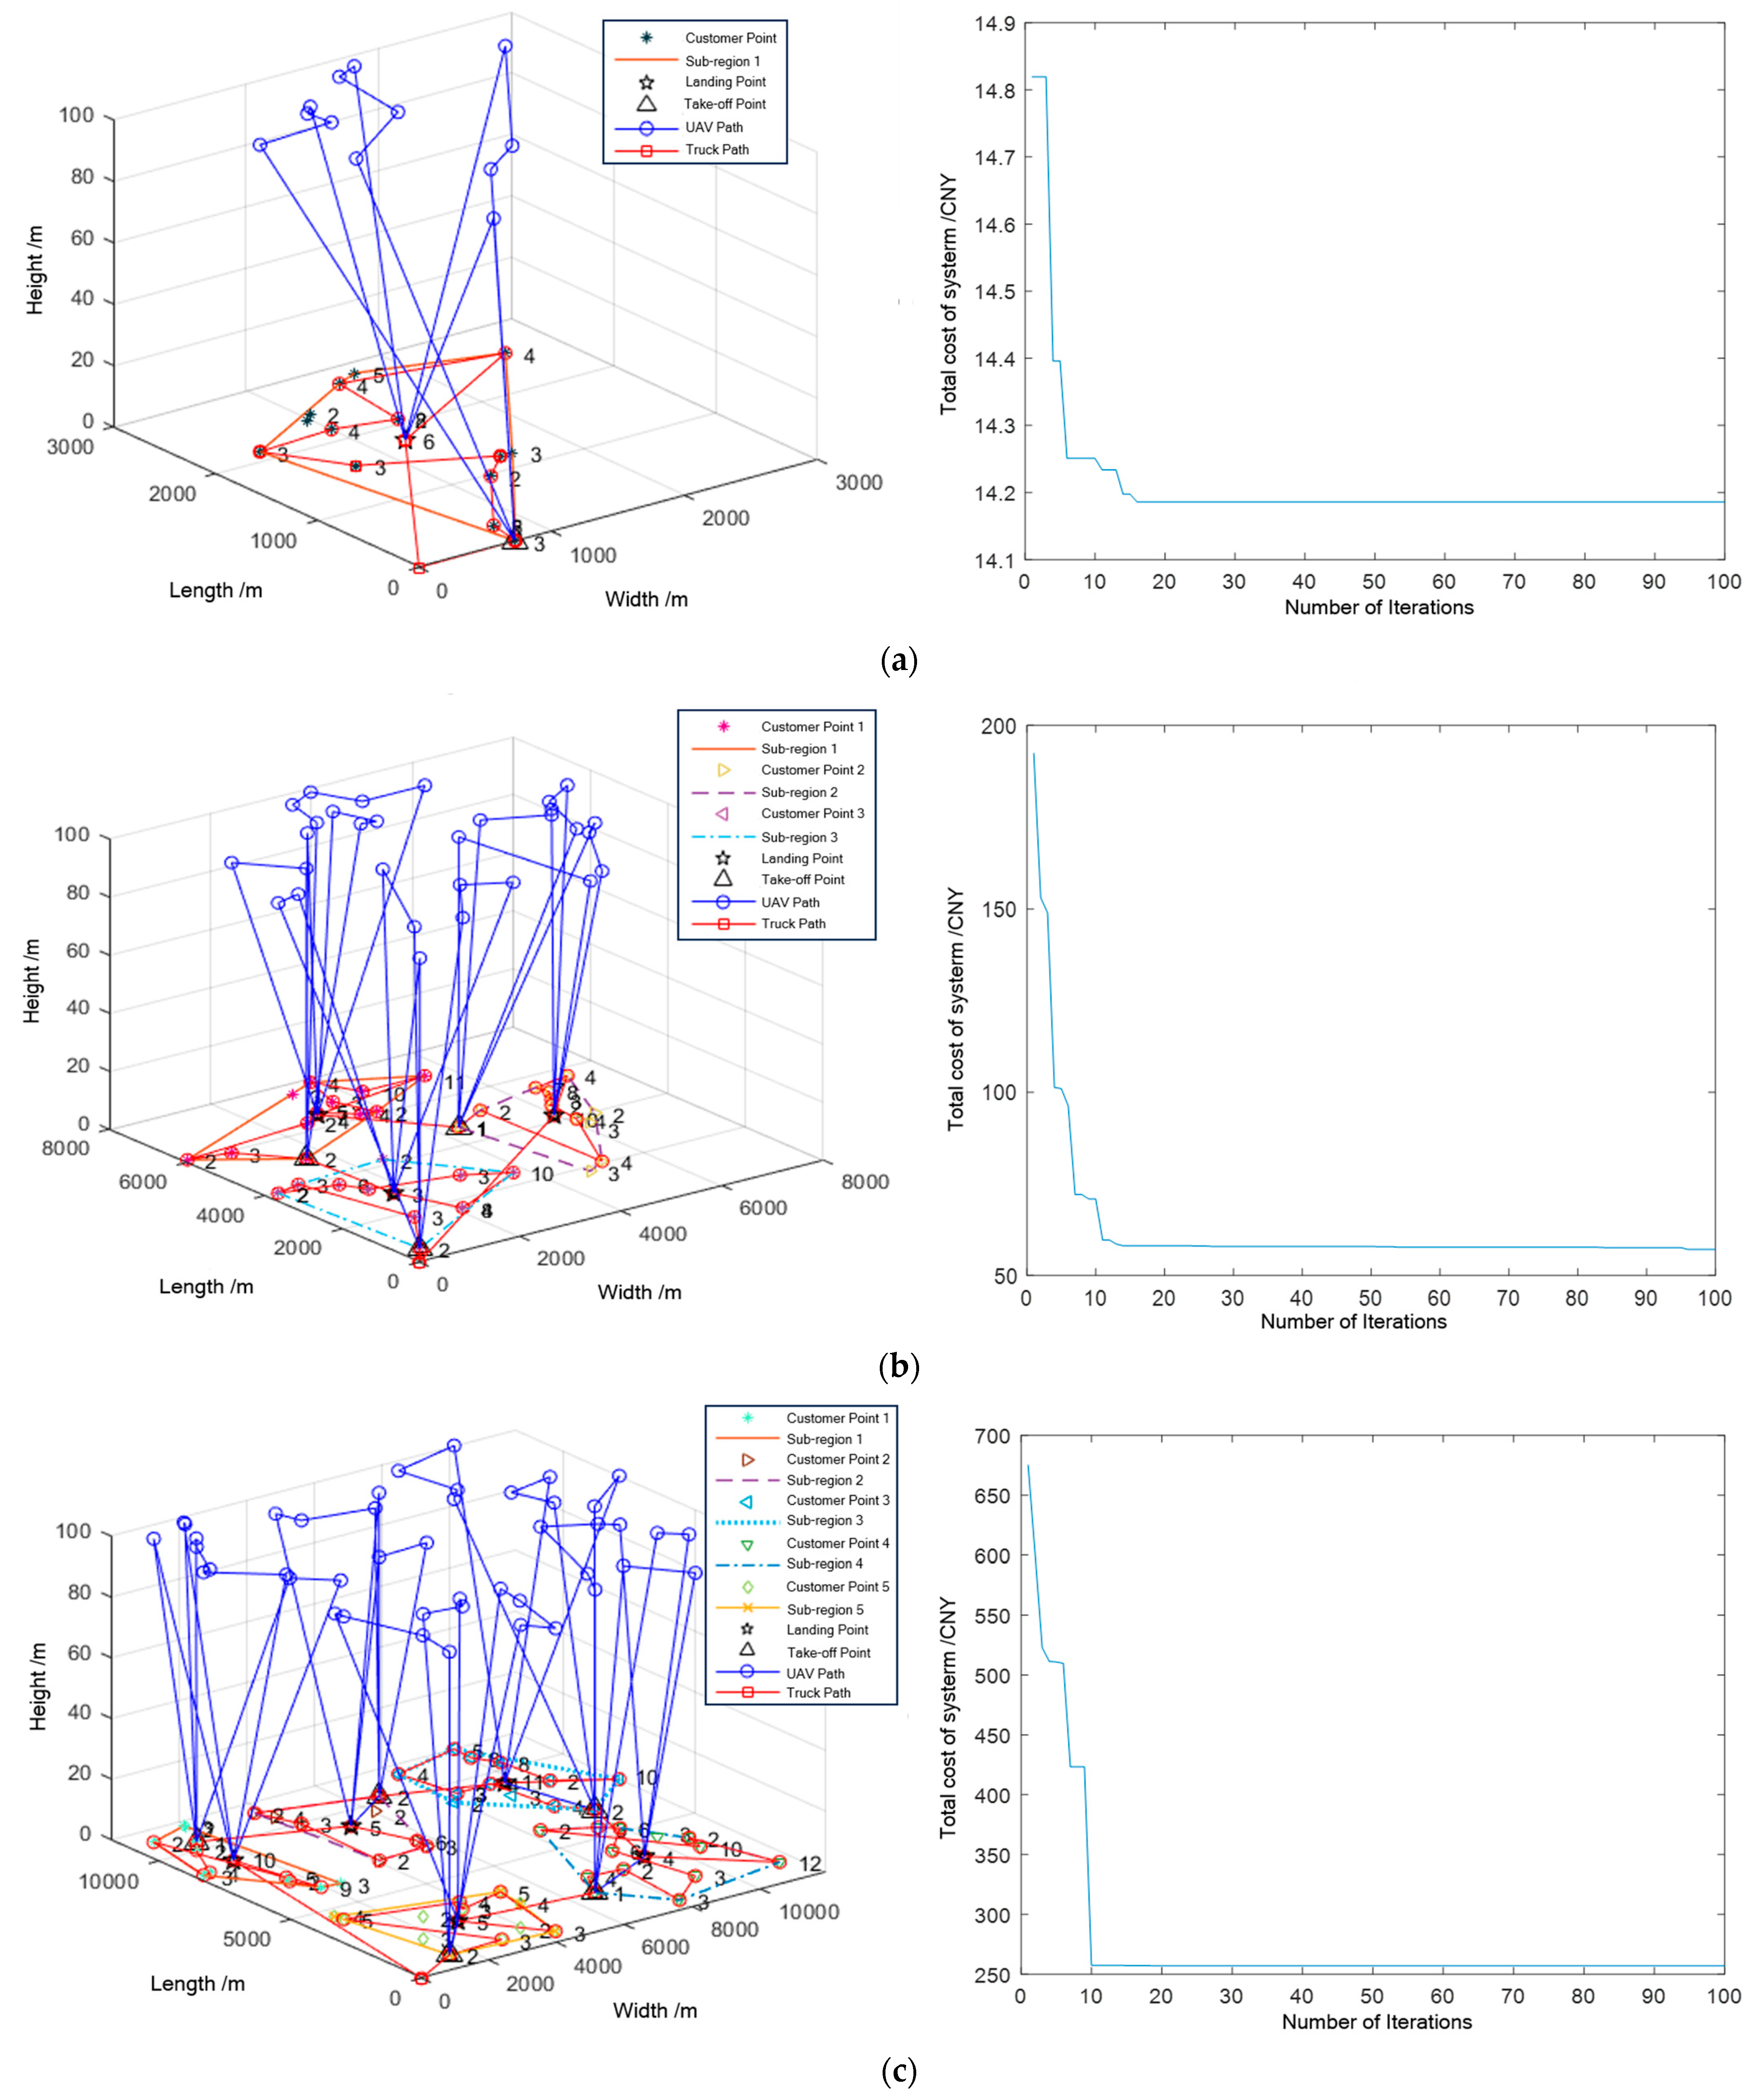
In this section, test cases are randomly generated for three different scales: a small-scale area (3 km × 3 km, with 15 deployment points each for deployment and retrieval demands), a medium-scale area (8 km × 8 km, with 30 deployment points each for deployment and retrieval demands), and a large-scale area (12 km × 12 km, with 60 deployment points each for deployment and retrieval demands). The optimal costs for these cases are solved respectively to validate the effectiveness of the algorithm proposed in this paper. The details are illustrated in Figure 5:
As can be seen from Figure 5, the proposed algorithm effectively solves the optimal cost problem for the deployment and retrieval of communication devices by a sub-mother UAV swarm. This problem involves different mission time-window settings, and the algorithm successfully obtains the optimal costs under the constant-speed assumption. It is observed that in the randomly generated small-scale, medium-scale, and large-scale deployment areas mentioned above, the optimal costs obtained by the algorithm are 14.1858CNY, 57.0703CNY, and 256.856CNY, respectively.

4.3. Performance Analysis of the Algorithm

In this section, the optimization capability and convergence speed of the proposed algorithm are evaluated through numerical simulations, and its performance in solving the sub-mother UAV swarm path planning problem within sub-regions is compared with that of the genetic algorithm (GA) and the G-PSHA mentioned in reference [25].
To assess the performance of IAGA, three scenarios with different scales are considered: a small-scale area (3 km × 3 km, with 12 deployment points each for deployment and retrieval demands), a medium-scale area (8 km × 8 km, with 30 deployment points each for deployment and retrieval demands), and a large-scale area (12 km × 12 km, with 45 deployment points each for deployment and retrieval demands). IAGA, GA, and G-PSHA are each run 10 times in this system, and the average values are taken. For a fair comparison, IAGA, GA, and G-PSHA are tested on the same randomly generated instances under the same population size, maximum number of iterations, stopping criterion, and computing environment. GA and G-PSHA follow their original crossover and mutation settings, whereas IAGA adopts the adaptive crossover–mutation mechanism described in Section 3.2. The results are as follows:
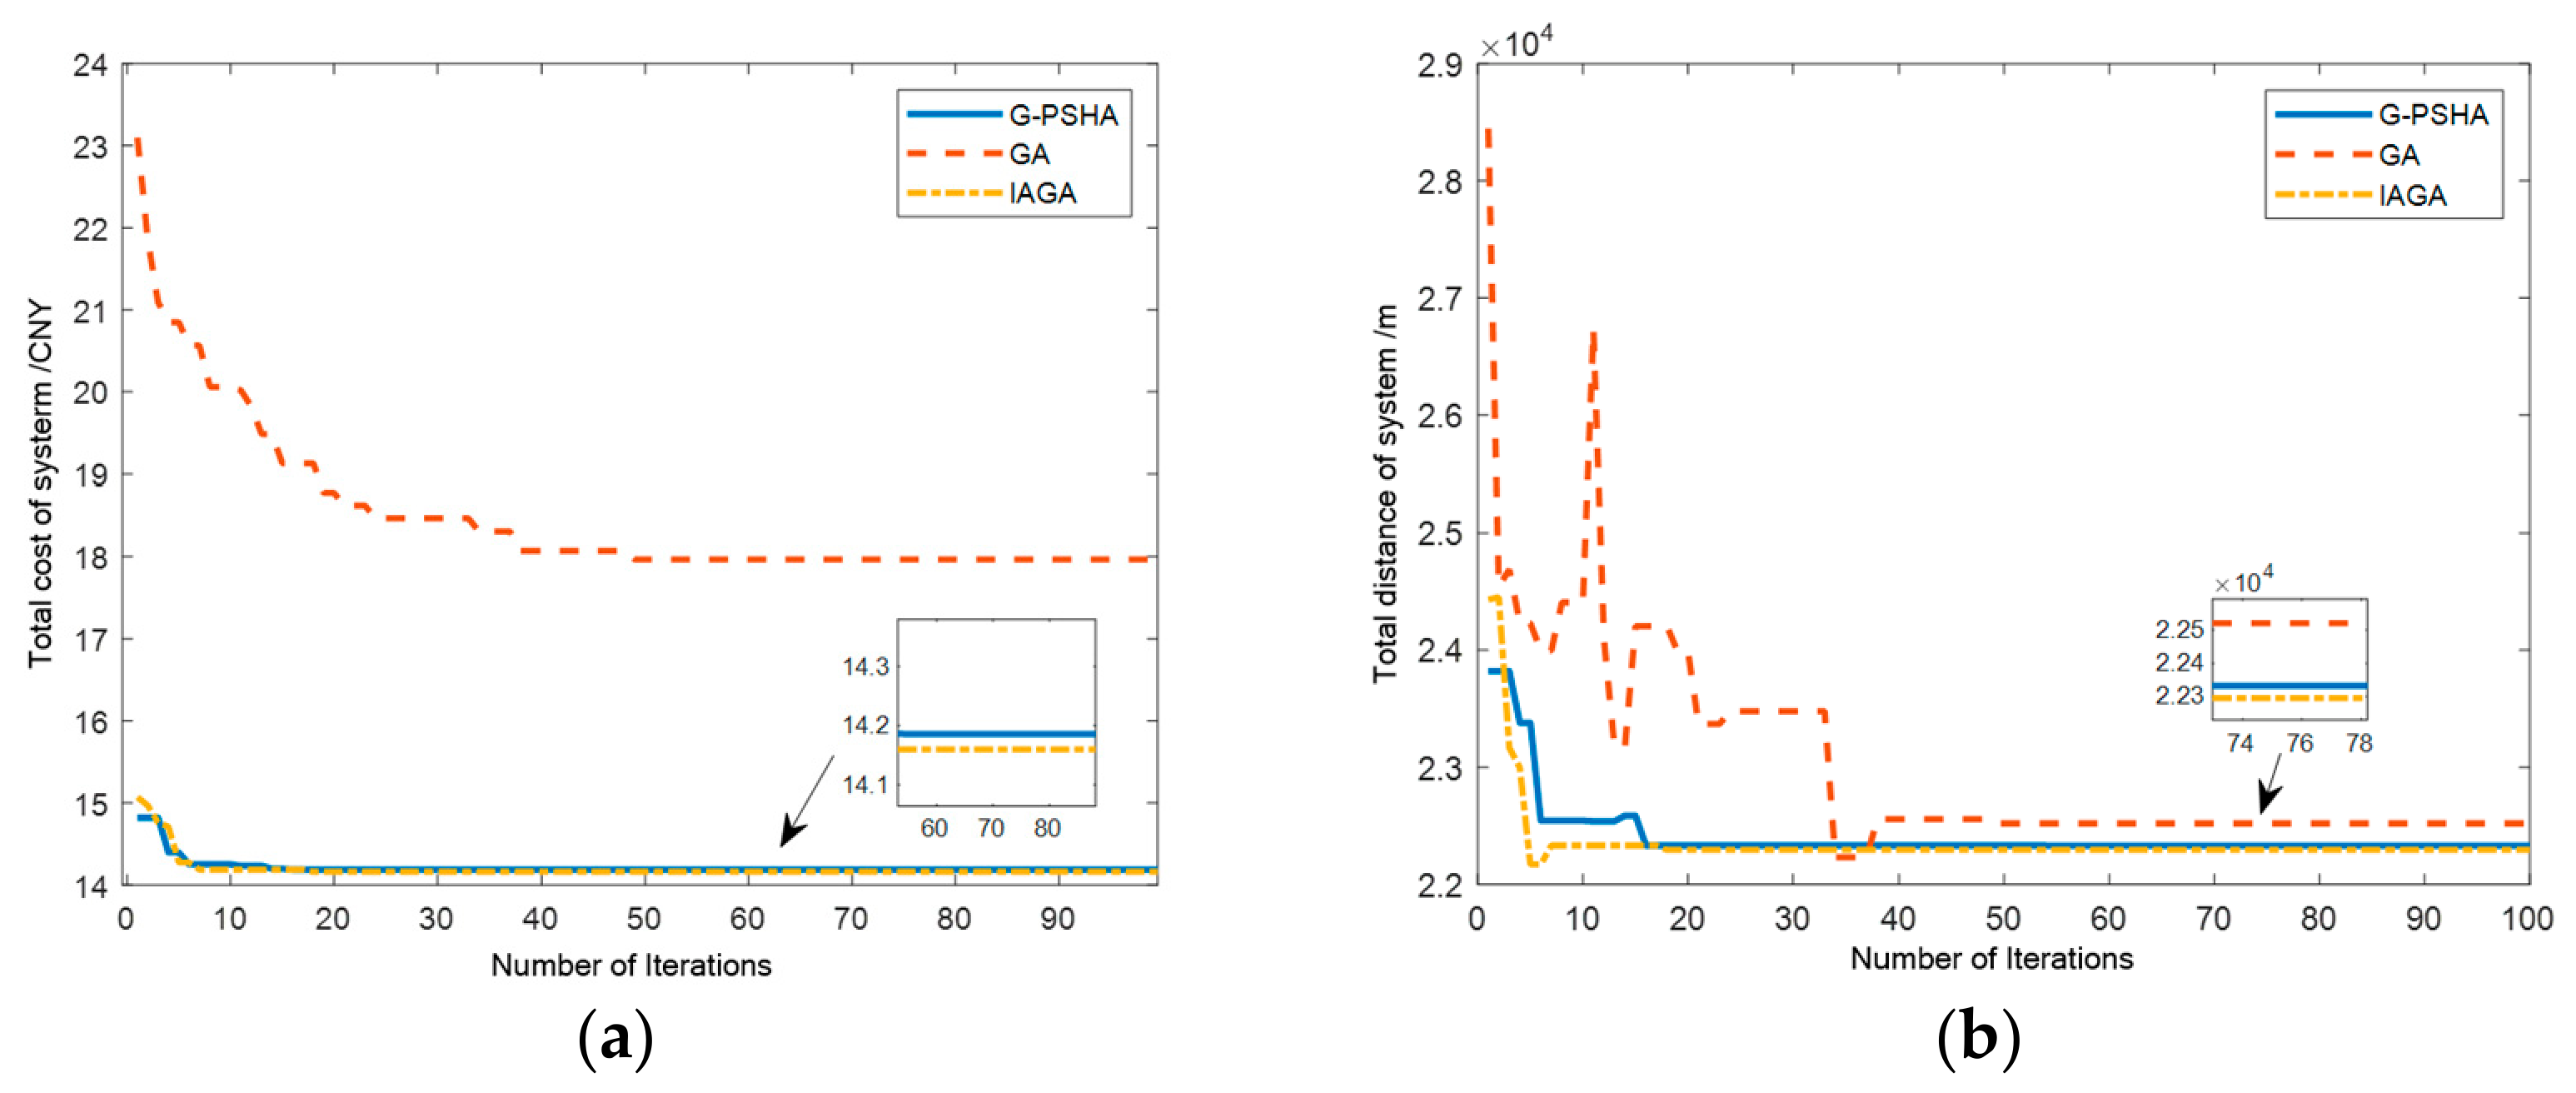
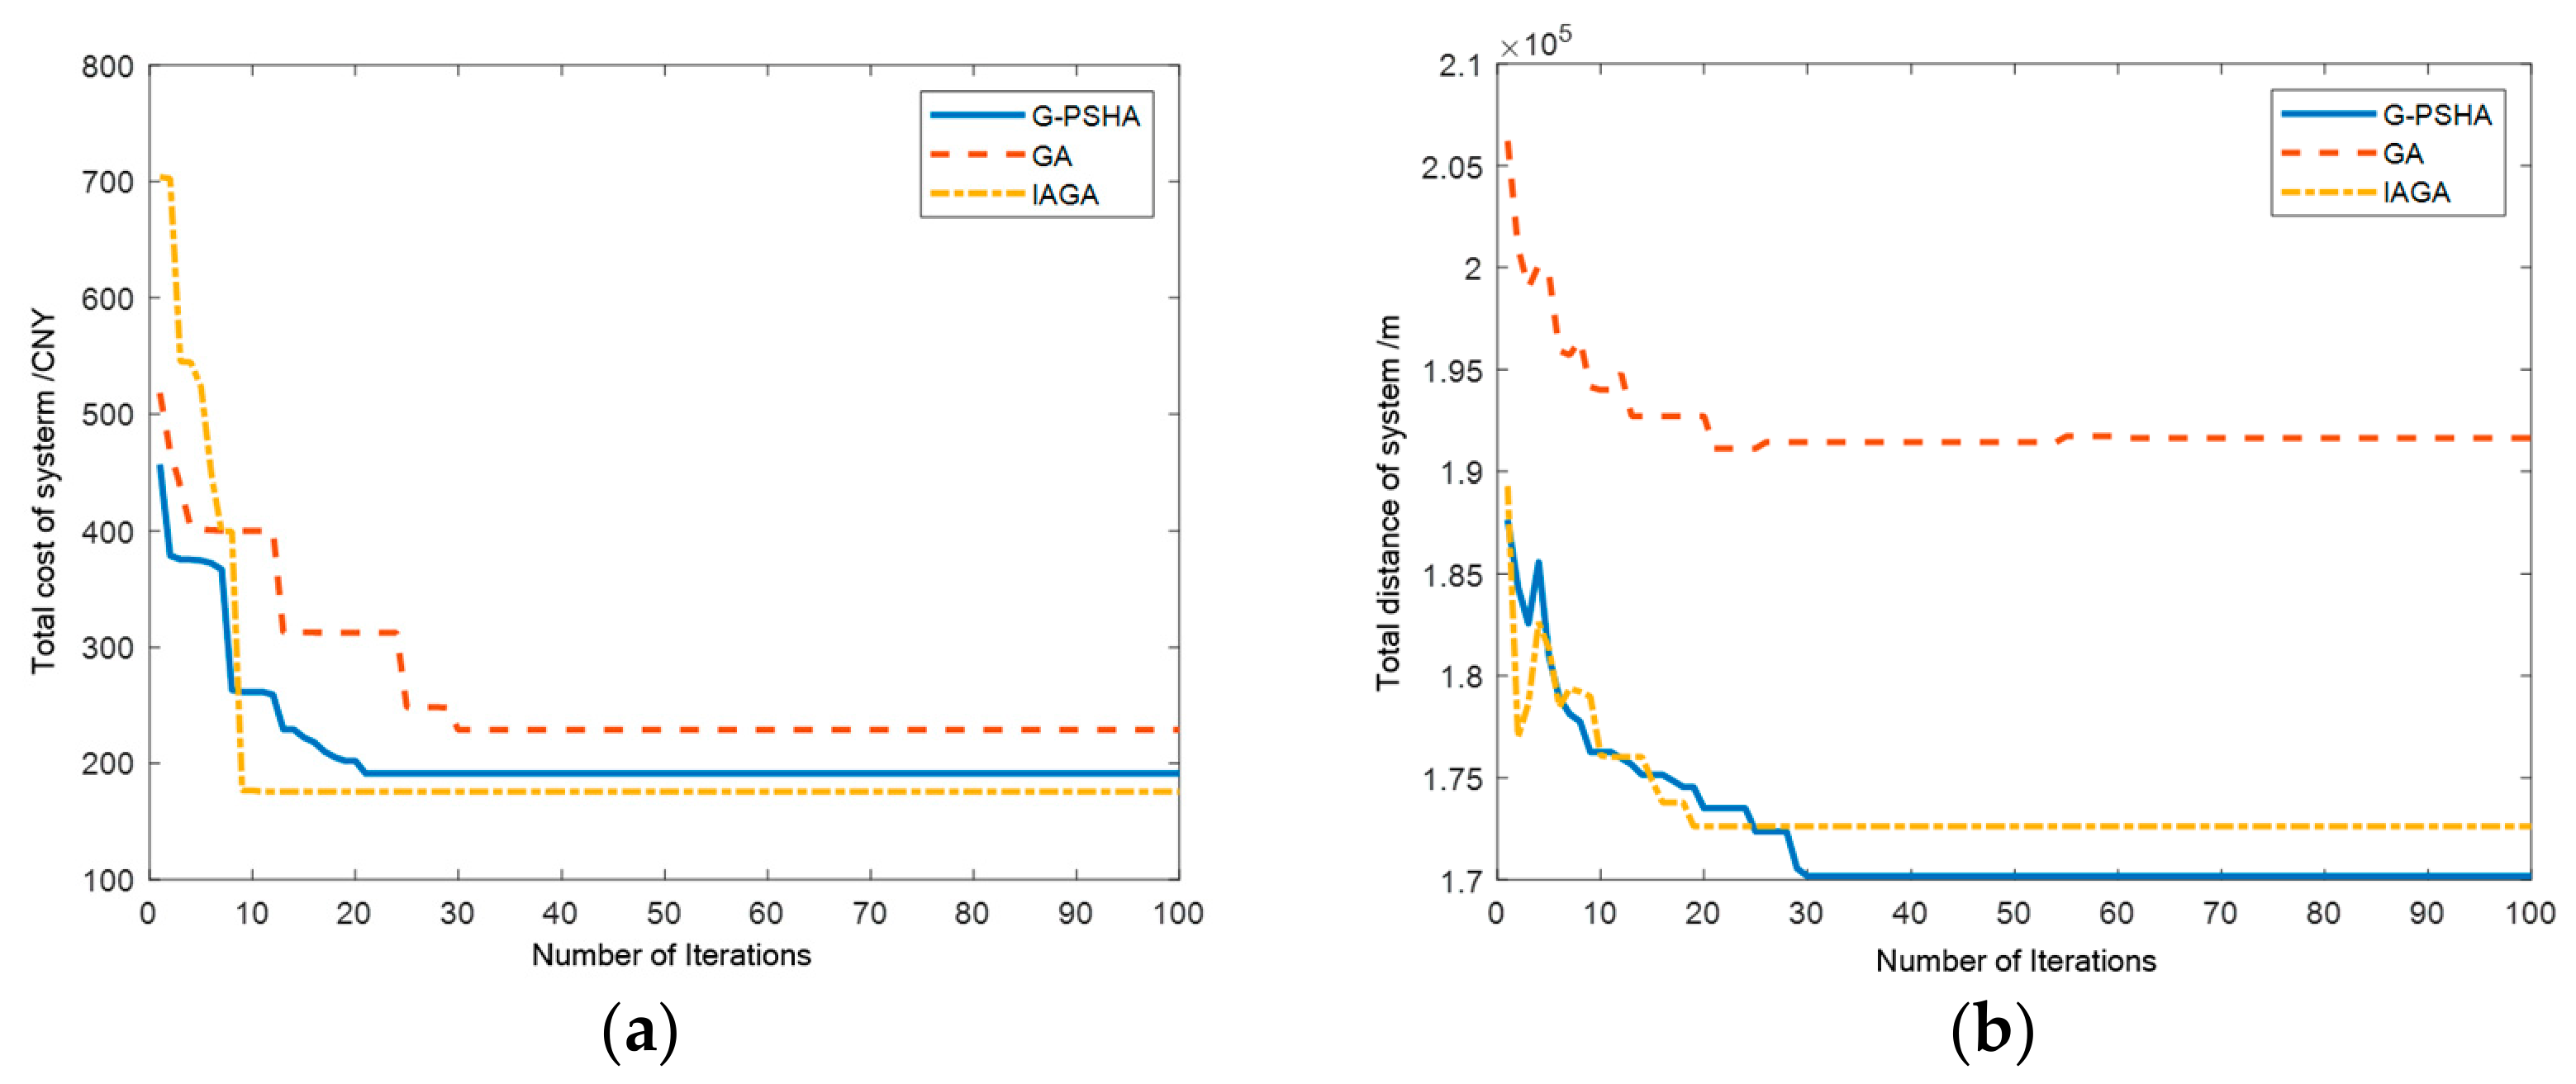
Figure 6, Figure 7 and Figure 8 illustrate the optimization process across the three scenarios, while Table 5, Table 6 and Table 7 present the corresponding data for each scenario.
Based on the numerical simulation results for the small-scale scenario, compared to GA, both IAGA and G-PSHA exhibit faster convergence, beginning to stabilize from the 7th and 6th iteration, respectively. This accelerated convergence is attributed to the introduction of the adaptive function, which promotes rapid convergence, and the enhancements made to the crossover and mutation operators, increasing the efficiency of each iteration. This demonstrates that the IAGA proposed in this paper effectively mitigates the slow convergence typically associated with traditional GA. Compared to the final result of 14.19 achieved by G-PSHA, IAGA obtains a result of 14.16, indicating stronger optimization capability. This validates the effectiveness of the genetic algorithm improvements proposed in this paper under small-scale conditions.
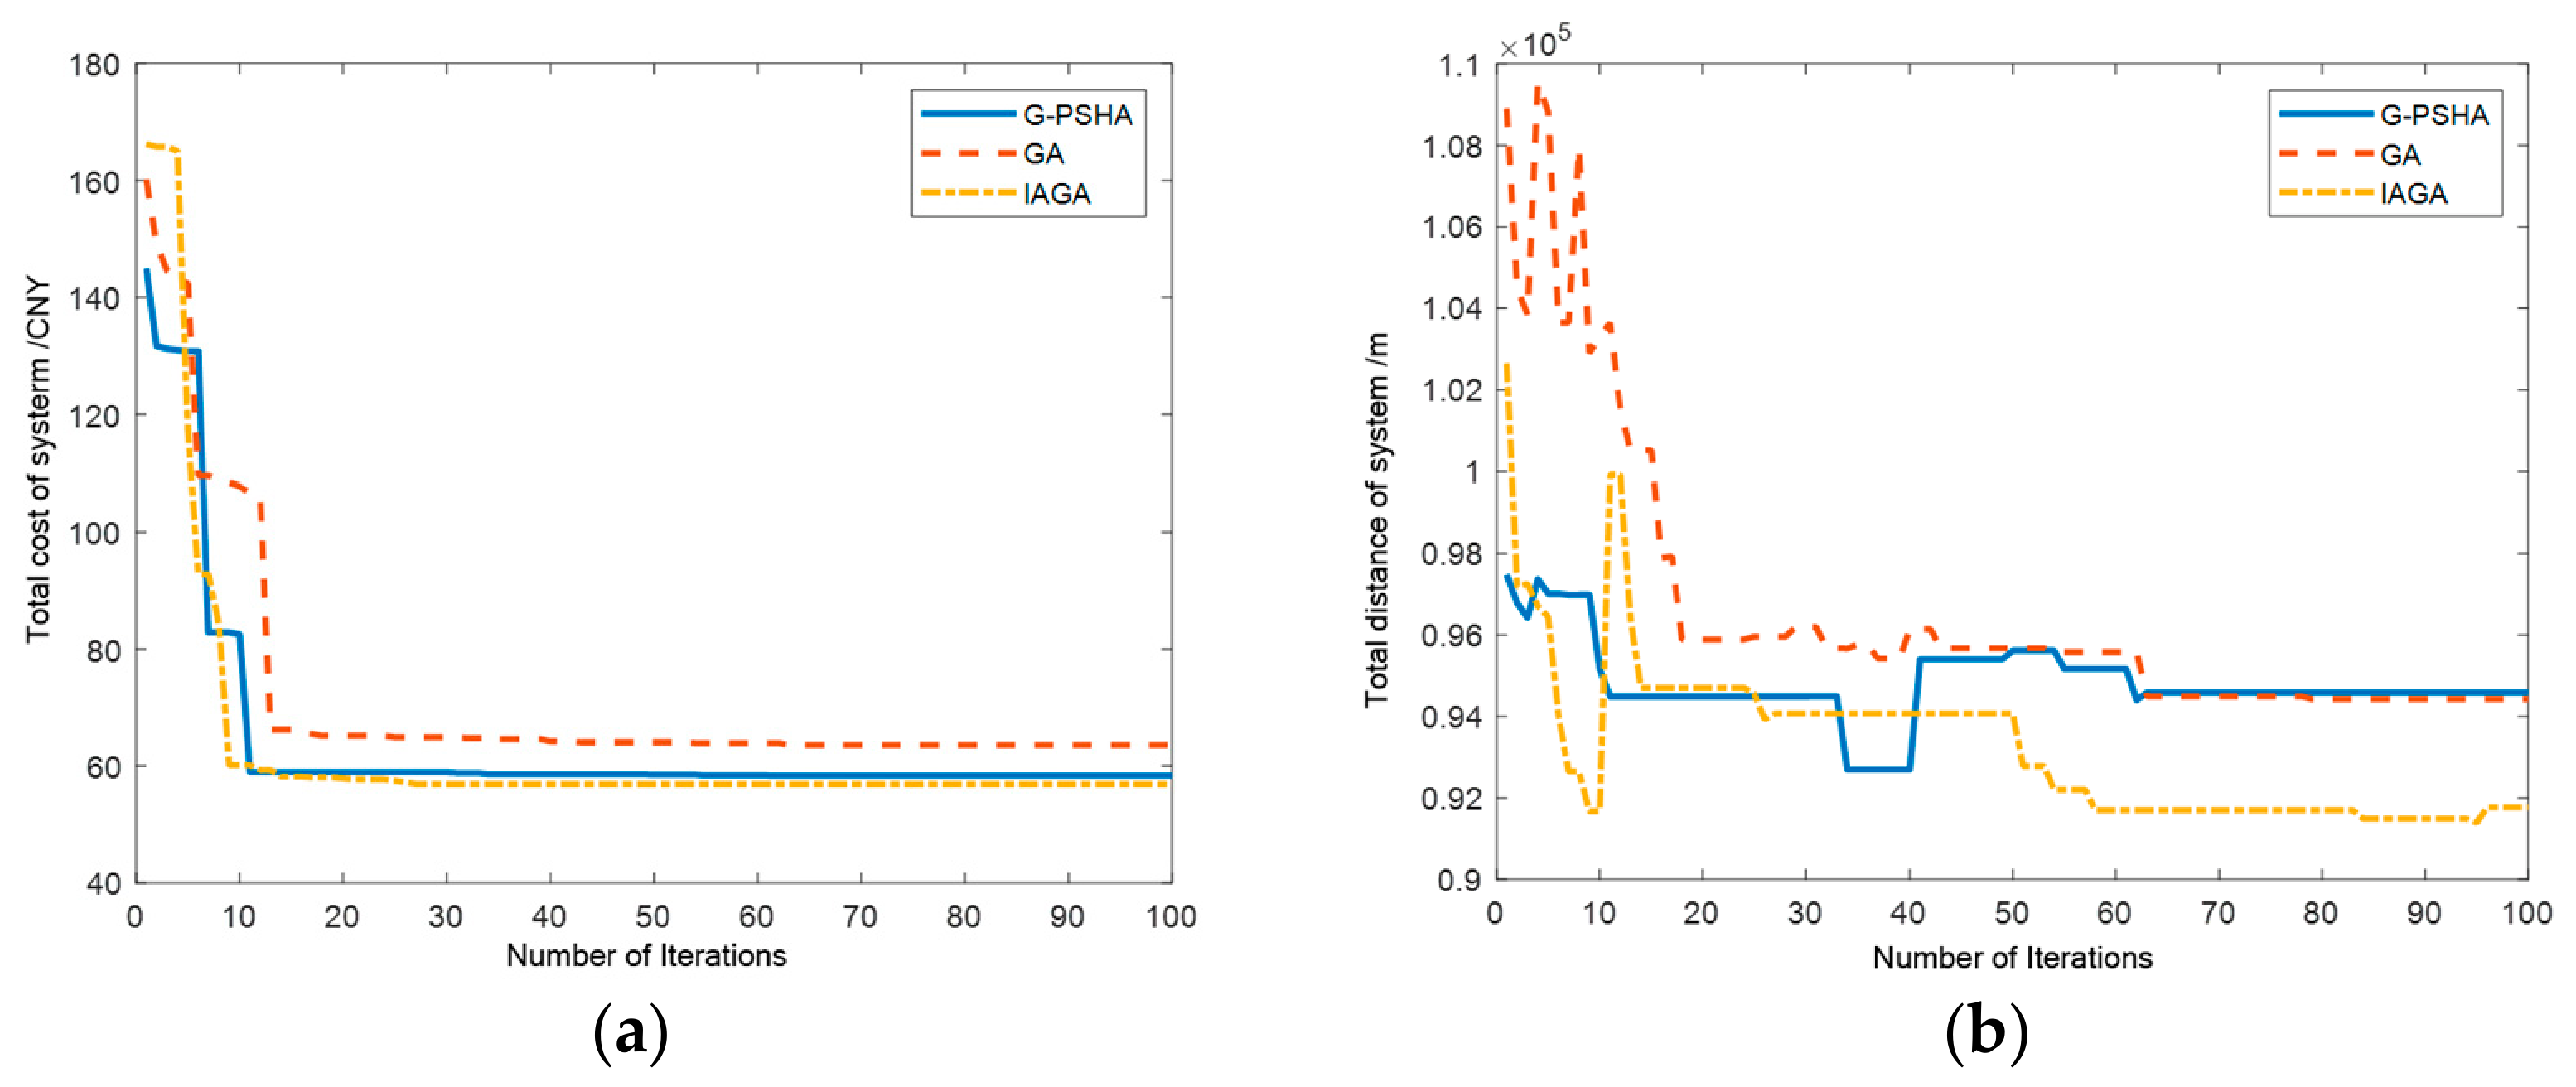
For the medium-scale scenario, Figure 7 compares the convergence behavior, total cost, and total flight distance of the three algorithms, while the detailed optimization results are summarized in Table 7, it can be observed that the convergence speeds of all three algorithms decrease. Specifically, G-PSHA shifts from starting to converge at the 6th iteration in the small-scale scenario to the 13th iteration in the medium-scale scenario, while IAGA shifts from the 7th iteration to the 9th iteration. Therefore, compared to G-PSHA, IAGA demonstrates stronger robustness in convergence speed. Meanwhile, by comparing the total costs, the solution obtained by IAGA is shown to be more optimal.
For the large-scale scenario, it can be observed that IAGA outperforms the other two algorithms in terms of both convergence speed and optimization capability. A comparison between the total cost and total distance further indicates that cost optimality and distance optimality are not necessarily consistent. Although G-PSHA obtains the shortest total distance, its total cost is not the lowest, because the objective function considers not only flight distance but also platform-dependent flight cost, SUAV activation cost, and time-window penalty cost. In particular, the MUAV and SUAVs have different unit flight costs, and dispatching more SUAVs may reduce local travel distance but simultaneously increase fixed activation costs. Conversely, allowing the SUAV swarm to travel a longer distance can still be economically preferable when it avoids excessive MUAV movement or reduces penalty costs caused by delayed deployment. This explains why, as shown in Table 8, the flight distance of the SUAV swarm can be longer than that of the MUAV while its operational cost remains significantly lower. Therefore, the proposed model does not simply pursue the shortest route; instead, it balances distance, heterogeneous platform cost, SUAV activation, and timeliness penalty to obtain a lower total deployment cost.
In addition, the improvement of IAGA mainly comes from the second-stage coordinated route optimization. The hybrid encoding enables the MUAV visiting sequence and SUAV task assignment to be optimized jointly, while the adaptive crossover–mutation mechanism and historical-improvement-based mutation operator enhance local search. These designs help reduce unnecessary SUAV dispatches, improve SUAV task allocation, and lower delayed-deployment penalties under the coupled payload and time-window constraints.
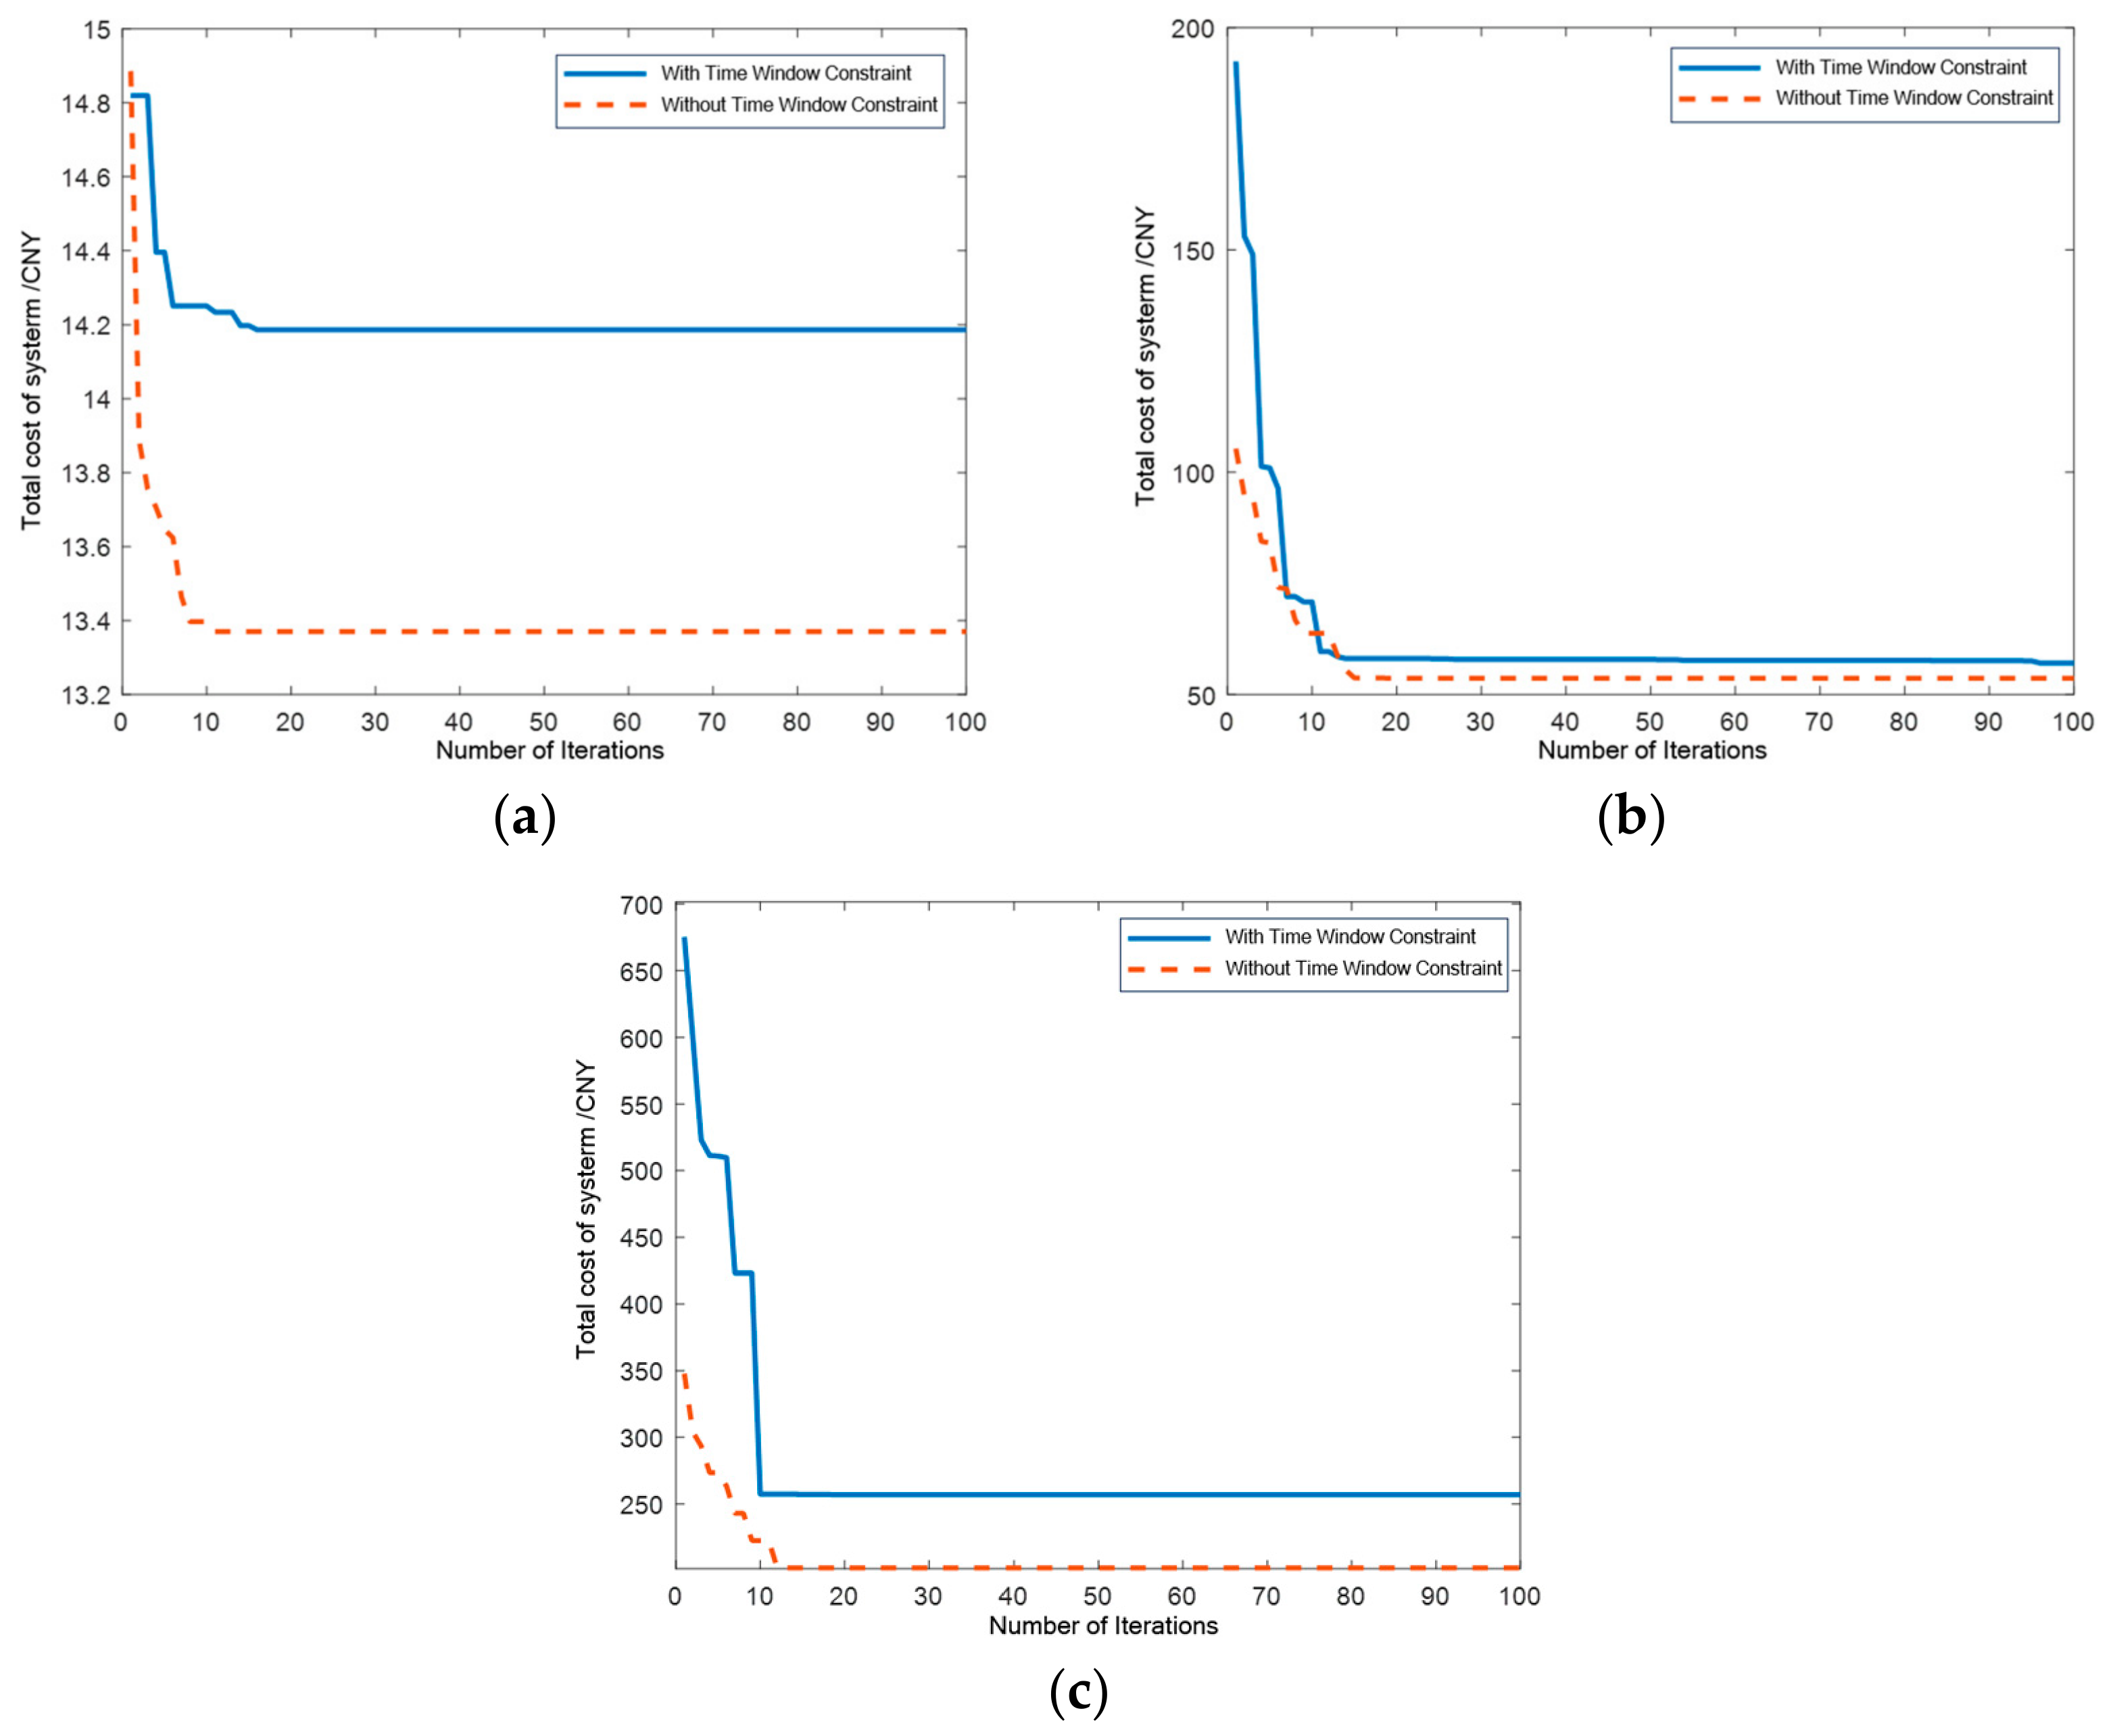
Figure 9 further compares the optimal system costs obtained with and without time-window constraints under the three deployment scales. The introduction of time-window constraints increases the total system cost because delayed arrivals generate additional penalty costs and restrict the range of feasible routing decisions. More importantly, the cost difference becomes more relevant as the task scale increases, since a larger number of deployment points makes it more difficult for the MUAV and SUAVs to complete all communication-device deployment tasks within the prescribed time limits. This result reveals a practical trade-off between deployment urgency and operational cost: stricter time requirements can accelerate emergency communication restoration but may require additional SUAV dispatches, more direct flight routes, or higher penalty expenditures. Therefore, emergency decision-makers should jointly determine the allowable deployment time, available UAV resources, and acceptable operational cost according to the urgency of communication restoration. Future work will further examine the influence of other factors, such as penalty cost, the number of SUAVs, SUAV payload, MUAV payload, SUAV endurance, and communication-device weight.
Therefore, the improvement of IAGA over G-PSHA primarily stems from its enhanced local search capability (via the historical-improvement-based mutation) and its integrated optimization framework that better balances SUAV activation costs and time-window penalties under payload constraints.

5. Conclusions

This paper proposes a two-stage coordinated deployment and routing framework for a sub–mother UAV swarm in power-grid emergency communication scenarios. The K-means-NS algorithm generates feasible sub-regions while satisfying SUAV endurance and payload constraints and maintaining the deployment–retrieval payload balance, whereas the IAGA optimizes the coordinated routes of the MUAV and SUAVs under mission timeliness constraints. In the small-, medium-, and large-scale scenarios, IAGA reduces the total flight cost by approximately 21.2%, 10.5%, and 23.2% compared with GA and by approximately 0.2%, 2.5%, and 8.1% compared with G-PSHA, respectively, demonstrating its effectiveness across different problem scales. These findings suggest that the proposed framework can provide decision support for emergency communication restoration by balancing deployment urgency, UAV resource allocation, and total operating cost.
Nevertheless, the current model assumes constant UAV speeds, simplified energy consumption, and deterministic task information, and the numerical experiments are mainly based on randomly generated instances.
Future work will incorporate variable UAV speeds, payload-dependent energy consumption, uncertain mission conditions, communication-coverage constraints, and validation using real or realistic power-grid emergency data to further improve the practical applicability of the proposed framework.

Author Contributions

Conceptualization, Y.G., Y.S. and W.Y.; methodology, M.H., J.L. and W.Y.; software, S.Y.; validation, X.L., Y.Z. and J.L.; formal analysis, C.L.; investigation, Y.X. and Y.G.; resources, Y.S. and W.Y.; data curation, C.L., M.H. and Y.Z.; writing—original draft preparation, J.L.; writing—review and editing, Y.X.; visualization, Y.Z., W.Y. and S.Y.; supervision, W.Y.; project administration, W.Y.; funding acquisition, C.L. All authors have read and agreed to the published version of the manuscript.

Funding

This research was funded by the China Southern Power Grid Co., Ltd. Technology Project (No. GZKJXM20240598) and Liaoning Provincial Natural Science Foundation (General Program, 2025-MSLH-107).

Institutional Review Board Statement

Not applicable.

Informed Consent Statement

Not applicable.

Data Availability Statement

The original contributions presented in the study are included in the article, further inquiries can be directed to the corresponding author.

Conflicts of Interest

Authors Youfang Gu, Yu Song, Minkun He, JunChen Li, Shun Yang, XinYue Li and Yao Zhao were employed by the company China Southern Power Grid Co., Ltd. The authors declare that this study received funding from China Southern Power Grid Co., Ltd. The funder was not involved in the study design, collection, analysis, interpretation of data, the writing of this article or the decision to submit it for publication.

References

  1. Mebrat, M.Y.; Ahmed, M.W.; Ectors, W. Business applications of cargo drones in the EU. Transp. Res. Procedia 2025, 84, 448–455. [Google Scholar] [CrossRef]
  2. Jin, Z.; Ng, K.K.H.; Zhang, C.; Chan, J.J.; Qin, Y. A multistage stochastic programming approach for drone-supported last-mile humanitarian logistics system planning. Adv. Eng. Inform. 2025, 65, 103201. [Google Scholar]
  3. Lu, Y.; Yang, J.; Yang, C. A humanitarian vehicle routing problem synchronized with drones in time-varying weather conditions. Comput. Ind. Eng. 2023, 184, 109563. [Google Scholar] [CrossRef]
  4. Kumbhani, C.; Kant, R.; Shankar, R. Prioritizing sustainable solutions to mitigate risks in drone-based last-mile delivery. Sustain. Futur. 2025, 9, 100536. [Google Scholar]
  5. Ropero, F.; Muñoz, P.; R-Moreno, M.D. TERRA: A path planning algorithm for cooperative UGV–UAV exploration. Eng. Appl. Artif. Intell. 2019, 78, 260–272. [Google Scholar] [CrossRef]
  6. Jung, S. MILP-based cost and time-competitive vehicle routing problem for last-mile delivery service using a swarm of UAVs and UGVs. J. Air Transp. Manag. 2025, 124, 102736. [Google Scholar]
  7. Kuo, R.J.; Lu, S.H.; Lai, P.Y.; Mara, S.T.W. Vehicle routing problem with drones considering time windows. Expert Syst. Appl. 2022, 191, 116264. [Google Scholar] [CrossRef]
  8. Fan, H.; Sun, X.; Zhang, Y.; Ren, X.; Tian, P. Vehicle Path Problem with Mixed Time Window under Time-varying Road Network. Comput. Eng. Appl. 2022, 58, 292–302. [Google Scholar]
  9. Sushma, M.B.; Mashhoodi, B.; Tan, W.; Liujiang, K.; Xu, Q. Spatial drone path planning: A systematic review of parameters and algorithms. J. Transp. Geogr. 2025, 125, 104209. [Google Scholar] [CrossRef]
  10. Dorling, K.; Heinrichs, J.; Messier, G.G.; Magierowski, S. Vehicle routing problems for drone delivery. IEEE Trans. Syst. Man. Cybern. Syst. 2016, 47, 70–85. [Google Scholar] [CrossRef]
  11. Kong, J.; Wang, H.; Xie, M. Autonomous delivery vehicle routing problem with drones based on multiple delivery modes. Comput. Oper. Res. 2025, 179, 107032. [Google Scholar] [CrossRef]
  12. Mahmoudi, B.; Eshghi, K. Energy-constrained multi-visit TSP with multiple drones considering non-customer rendezvous locations. Expert Syst. Appl. 2022, 210, 118479. [Google Scholar]
  13. Ghiani, G.; Guerriero, E.; Manni, E.; Pareo, D. Combining autonomous delivery robots and traditional vehicles with public transportation infrastructure in last-mile distribution. Comput. Ind. Eng. 2025, 203, 111001. [Google Scholar] [CrossRef]
  14. Baldisseri, A.; Siragusa, C.; Seghezzi, A.; Mangiaracina, R.; Tumino, A. Truck-based drone delivery system: An economic and environmental assessment. Transp. Res. Part D Transp. Environ. 2022, 107, 103296. [Google Scholar] [CrossRef]
  15. Wu, Y.; Wu, S.; Hu, X. Cooperative path planning of UAVs & UGVs for a persistent surveillance task in urban environments. IEEE Internet Things J. 2020, 8, 4906–4919. [Google Scholar] [CrossRef]
  16. Murray, C.C.; Chu, A.G. The flying sidekick traveling salesman problem: Optimization of drone-assisted parcel delivery. Transp. Res. Part C Emerg. Technol. 2015, 54, 86–109. [Google Scholar] [CrossRef]
  17. Liu, Y.; Liu, Z.; Shi, J.; Wu, G.; Pedrycz, W. Two-echelon routing problem for parcel delivery by cooperated truck and drone. IEEE Trans. Syst. Man. Cybern. Syst. 2020, 51, 7450–7465. [Google Scholar]
  18. Boysen, N.; Briskorn, D.; Fedtke, S.; Schwerdfeger, S. Drone delivery from trucks: Drone scheduling for given truck routes. Networks 2018, 72, 506–527. [Google Scholar] [CrossRef]
  19. Agatz, N.; Bouman, P.; Schmidt, M. Optimization approaches for the traveling salesman problem with drone. Transp. Sci. 2018, 52, 965–981. [Google Scholar] [CrossRef]
  20. Yurek, E.E.; Ozmutlu, H.C. Traveling salesman problem with drone under recharging policy. Comput. Commun. 2021, 179, 35–49. [Google Scholar] [CrossRef]
  21. Wang, Y.; Wang, Z.; Hu, X.; Xue, G.; Guan, X. Truck–drone hybrid routing problem with time-dependent road travel time. Transp. Res. Part C Emerg. Technol. 2022, 144, 103901. [Google Scholar]
  22. Ye, F.; Chen, J.; Tian, Y.; Jiang, T. Cooperative task assignment of a heterogeneous multi-UAV system using an adaptive genetic algorithm. Electronics 2020, 9, 687. [Google Scholar] [CrossRef]
  23. Lichau, S.; Sadykov, R.; François, J.; Dupas, R. A branch-cut-and-price approach for the two-echelon vehicle routing problem with drones. Comput. Oper. Res. 2025, 173, 106869. [Google Scholar] [CrossRef]
  24. Gao, J.; Zhen, L.; Laporte, G.; He, X. Scheduling trucks and drones for cooperative deliveries. Transp. Res. Part E Logist. Transp. Rev. 2023, 178, 103267. [Google Scholar] [CrossRef]
  25. Yue, W.; Li, B.; Zhang, X.; Yang, Q. HDFOS: Path planning for heterogeneous truck-drone cooperative delivery and pickup services. Intel. Serv. Robot. 2025, 18, 775–798. [Google Scholar] [CrossRef]
  26. Croella, A.L.; Fraccascia, L. A location-sizing and routing model for a biomethane production chain fed by municipal waste. Comput. Ind. Eng. 2024, 198, 110714. [Google Scholar] [CrossRef]
Figure 1. Two-phase solution algorithm flowchart.
Applsci 16 06581 g001
Figure 2. Schematic diagram of individual gene sequence encoding.
Applsci 16 06581 g002
Figure 3. Selection crossover operator operation diagram. The ellipsis indicates intermediate offspring generated by the crossover operator that are omitted for clarity.
Applsci 16 06581 g003
Figure 4. Clustering results: (a) Ck-means clustering; (b) K-means-NS clustering. The coordinate axes are expressed in meters.
Applsci 16 06581 g004
Figure 5. IAGA path planning results and iteration process: (a) Small area scenario (3 km × 3 km); (b) medium area scenario (8 km × 8 km); (c) large area scenario (12 km × 12 km).
Applsci 16 06581 g005
Figure 6. Small area scenario: (a) Comparison of total cost; (b) comparison of total distance.
Applsci 16 06581 g006
Figure 7. Medium area scenario: (a) Total cost comparison; (b) total distance comparison.
Applsci 16 06581 g007
Figure 8. Large area scenario: (a) Total cost comparison; (b) total distance comparison.
Applsci 16 06581 g008
Figure 9. Optimal cost comparison between scenarios with and without time window constraints across different ranges: (a) Cost comparison with and without time windows in the small-scale area; (b) cost comparison with and without time windows in the medium-scale area; (c) cost comparison with and without time windows in the large-scale area.
Applsci 16 06581 g009
Table 1. Symbols and descriptions of system.
ParameterDescription
N The total number of points requiring deployment or redeployment of communication equipment
P Set of the total number of points requiring deployment of communication equipment P = p 1 , p 2 , , p N
A Set of SUAVs, A = a 1 , a 2 , , a n
K Subset of deployment point regions, K = k 1 , k 2 , , k n , k i represents the i-th sub-region
C Set of cluster centers, C = c 1 , c 2 , , c n , c i represents the cluster center of the i-th sub-region
N k Number of deployment point sub-regions
N s Number of deployment points with deployment demands
P s Set of deployment points with deployment demands, P s = { p 1 , p 2 , , p N 1 }
N q Number of retrieval points of communication equipment
P q Set of deployment points with deployment requirements, P q = { p 1 , p 2 , , p N 2 }
N s q Number of deployment points with either deployment or redeployment
P s q Set of deployment points with either deployment or redeployment, P s q = { p 1 , p 2 , , p N 3 } , satisfying P s q = P s P q
P w Set of deployment points with no demand status, P w = P P s P q
P f Takeoff point for the SUAV swarm within the region
P l Landing point for the SUAV swarm within the region
v a SUAV flight speed
v t MUAV flight speed
P a Set of points traversed by SUAVs within a sub-region, P a = P f P s P l
P t Set of points traversed by the MUAV within a sub-region, P t = P f P q P l
P t o t a l Set of all points, P t o t a l = P f P P l
e Maximum allowed deployment time for the MUAV or SUAV at a deployment point
s p Penalty cost per unit time when the MUAV or SUAV exceeds the maximum deployment time
τ c Actual deployment time of the MUAV or SUAV at deployment point p c
Table 2. SUAV parameters and descriptions.
ParameterMeaning
S A Total flight cost of the SUAV swarm within the region
S A k Total flight cost of the SUAV swarm within region k
S a K Total flight distance of the a-th SUAV within the area
S a k Flight cost of the a-th SUAV within region k
S a ( p i , p j ) k Flight cost of the a-th SUAV from point p i to point p j in region k
D a ( p i , p j ) k Distance traveled by the a-th SUAV from point p i to p j in sub-region k
D max a Ideal maximum flight range of the a-th SUAV
D max Maximum flight distance under ideal maximum payload capacity and energy consumption of the SUAV
s d Flight cost per unit time for the SUAV
s f i x a Fixed dispatch cost for the SUAV
Q a k Actual payload capacity of the a-th SUAV at takeoff in sub-region k
Q max a Ideal maximum payload capacity of the a-th SUAV
d i k Weight of the communication device to be delivered to the i-th deployment point with deployment demand in sub-region k
N s k Number of deployment points with deployment demand in region k
Table 3. MUAV parameters and descriptions.
ParameterDescription
S T Total flight cost of the MUAV
S i k Total flight cost of the MUAV within sub-region k
S o Total flight cost of the MUAV between sub-regions
s c Flight cost per unit time for the MUAV
S i ( p i , p j ) k Flight cost for the MUAV from retrieval-demand deployment point p i to retrieval-demand deployment point p j within sub-region k
S o ( k i , k j ) Flight cost for the MUAV from sub-region K i to sub-region K j
Q max t Ideal maximum load capacity of the MUAV
Q k t Total load of the MUAV before arriving at the k-th sub-region
Q q k Weight of communication devices to be picked up by the MUAV in the k-th sub-region
b i k Weight of the communication device to be picked up from the i-th deployment with retrieval demand in sub-region k
D i ( p i , p j ) k Distance traveled by the MUAV from deployment point p i to p j (both with retrieval demand) in sub-region k
N t k Number of customers with retrieval demand in sub-region k
D o ( k i , k j ) Distance traveled by the MUAV from sub-region K i to sub-region K j
D Total flight distance of all unmanned vehicles in the collaborative deployment and retrieval system
S Total flight cost of all unmanned vehicles in the collaborative deployment and retrieval system
Table 4. Decision variables used in the model.
VariableDescription
X a k binary variable that equals 1 if SUAV a is dispatched in sub-region k; otherwise 0
X a ( p i , p j ) k binary variable that equals 1 if SUAV a travels from node p i to p j in sub-region k; otherwise 0
X i ( p i , p j ) k binary variable that equals 1 if MUAV travels from p i to p j in sub-region k; otherwise 0
X o ( k i , k j ) binary variable that equals 1 if MUAV moves from sub-region k i to k j ; otherwise 0
Table 5. Comparison of clustering results.
MethodSub-Region No.Total Weight of Communication Devices for SUAV Deployment Within the Sub-Region (kg)Total Weight of Communication Devices for MUAV Retrieval Within the Sub-Region (kg)Distance from the Farthest Point to the Cluster Center in the Sub-Region (m)
Ck-meansSub-region 114.787814.73681681.2
Sub-region 236.833229.89783483.6
Sub-region 335.626726.52753799.5
Sub-region 429.881533.60922518.3
Sub-region 517.207114.37332337.5
Sub-region 634.631217.44012750
K-means-NSSub-region 131.488823.67044272
Sub-region 237.125425.57333573.3
Sub-region 339.242835.66413649.5
Sub-region 437.378732.76263443
Sub-region 523.731718.91443261.6
Table 6. Optimization results of different algorithms for small area scenarios.
MethodSUAV/MUAV No.Flight Cost S a K / S T / C N Y Total Flight Cost S / C N Y Total Flight Distance D / m
G-PSHASUAV 12.0114.1922,332
SUAV 21.93
SUAV 31.98
SUAV 41.09
MUAV7.16
GASUAV 11.7717.9722,521
SUAV 21.87
SUAV 33.09
SUAV 44.07
MUAV7.17
IAGASUAV 11.9814.1622,295
SUAV 22.00
SUAV 31.92
SUAV 41.09
MUAV 7.15
Table 7. Optimization results of different algorithms for medium area scenarios.
MethodSUAV/MUAV No.Flight Cost S a K / S T / C N Y Total Flight Cost
S / C N Y
Total Flight Distance
D / m
G-PSHASUAV16.1158.3294,586
SUAV27.09
SUAV37.18
SUAV41.93
MUAV36.01
GASUAV15.8863.5694,431
SUAV22.21
SUAV37.46
SUAV412.27
MUAV35.74
IAGASUAV17.0256.8991,775
SUAV23.61
SUAV37.18
SUAV44.33
MUAV34.93
Table 8. Optimization results of different algorithms for large area scenarios.
MethodsSUAV NumberFlight Cost S a K / S T / C N Y Total Flight Cost
S / C N Y
Total Flight Distance
D / m
G-PSHASUAV111.95191.26170,170
SUAV211.37
SUAV310.35
SUAV40
MUAV157.59
GASUAV110.38228.85191,630
SUAV20
SUAV311.96
SUAV417.79
MUAV188.72
IAGASUAV17.02175.73170,830
SUAV23.61
SUAV37.18
SUAV44.33
MUAV142.06
Disclaimer/Publisher’s Note: The statements, opinions and data contained in all publications are solely those of the individual author(s) and contributor(s) and not of MDPI and/or the editor(s). MDPI and/or the editor(s) disclaim responsibility for any injury to people or property resulting from any ideas, methods, instructions or products referred to in the content.