


Abstract
Tourism recommendation must capture evolving preferences and dependencies among successive activities. This study proposes a place-transition-aware tourism recommendation framework integrating dual-side dynamic profiling, Event Evolutionary Graph-based path behavior reasoning, and XGBoost re-ranking. Using travel notes, attraction reviews, and attribute data from Wuhan, China, the framework models dynamic user preferences and attraction states. Sequential visit transitions and co-visitation associations among tourism places are organized in Neo4j. Behavioral continuity is defined as the explicit sequential and co-visitation dependencies linking users’ previous attraction visits to subsequent candidate attractions. In this framework, a place transition denotes a topological behavioral relation between place-related events rather than a geographic route, road-network path, or coordinate-based distance relationship. A time-aware relation-weighted path score is combined with profile features in a 35-dimensional vector for candidate ranking. The framework achieved the highest Top-5 performance among the evaluated models, with an F1@5 of 0.2714. Its F1@5 was significantly higher than those of GRU4Rec, SASRec, and LightGCN, but not significantly different from BERT4Rec, which obtained slightly higher Top-10 results. The path score achieved a ROC–AUC of 0.7811 and increased Top-5 path coverage from 0.5997 to 0.6475. These findings indicate that dynamic profiling supports relevance discrimination, whereas path behavior reasoning improves behavioral coherence and interpretability. The conclusions are limited to the present moderate-scale offline dataset.
1. Introduction
With the rapid growth of online tourism platforms and location-based digital tourism services, tourism behavior data have exhibited increasingly dynamic, sequential, and place-dependent characteristics [1,2]. Tourists’ preferences, visit sequences, and contextual demands evolve across temporal conditions, visited places, and behavioral stages, making the representation of transitions and associations among tourism places an important issue in smart tourism recommendation.
Existing tourism recommendation studies have mainly focused on tourist interest modeling based on collaborative filtering, matrix factorization, and deep learning approaches, achieving considerable progress in preference learning [3]. Some studies have employed temporal attention mechanisms and recurrent neural networks to model users’ long-term and short-term interests [4,5]. However, in tourism scenarios, tourist demands are often influenced by multiple factors, including emotional fluctuations, temporal and situational constraints, and behavioral processes. Consequently, static profiles or sequence representations derived solely from interaction order may be insufficient to jointly characterize preference evolution, contextual constraints, and accumulated tourism experiences.
Contemporary sequential models such as SASRec and BERT4Rec capture temporal dependencies in user interactions [6,7], while graph-based methods such as LightGCN and KGAT learn high-order user–item or user–entity relationships [8,9]. Knowledge graph-based and explainable recommendation studies further show that structured entity relations can alleviate semantic sparsity and provide traceable evidence for recommendation decisions [10,11,12,13,14]. However, these approaches generally represent behavioral dependencies through latent sequence states or graph embeddings, rather than explicitly organizing tourism activities as event-level transitions connected by sequential and co-visitation relations. In tourism scenarios, destination choices may depend not only on interaction order but also on emotional feedback, travel context, attraction states, and associations between previously visited places and subsequent candidates. Tourism experiences can be regarded as accumulated preference evidence that combines episodic experience with affective evaluation. When tourists make subsequent destination choices, recently expressed and repeatedly reinforced interests are more likely to remain relevant, whereas the behavioral influence of older and unrepeated experience evidence may gradually attenuate. In the proposed framework, emotional feedback determines the direction and initial strength of experience-derived preference evidence, while elapsed time controls its subsequent attenuation. The emotional memory-decay mechanism is therefore introduced as a computational abstraction inspired by cognitive memory decay, rather than as a claim that tourist interests strictly reproduce a psychologically measured forgetting curve. It retains repeatedly expressed long-term preferences while reducing the contribution of outdated evidence.
To address these issues, this study proposes a place-transition-aware tourism recommendation framework integrating dynamic profiling and path behavior reasoning. The place-transition-aware perspective refers to the relational analysis of sequential visit transitions and co-visitation associations among tourism places. Attractions are treated as identifiable place entities, and the observed relations among them form a topological place-transition network. The framework does not use geographic coordinates, road-network distances, or metric spatial proximity as predictive features. User preferences are represented through BERT-supported semantic features [15], temporal decay, and contextual constraints, while attraction profiles integrate perceptual, basic, and temporal attributes. An Event Evolutionary Graph is constructed in Neo4j to organize sequential and co-visitation relations among validated tourism events [16,17,18]. A time-aware relation-weighted path score is then extracted as explicit behavioral-association evidence [19] and combined with the profile features through an XGBoost re-ranking model.
The main contributions of this study are summarized as follows:
- A dual-side dynamic profiling method considering emotional memory decay is proposed to jointly represent tourist demands and dynamic attraction attributes.
- An Event Evolutionary Graph-based path behavior reasoning mechanism is constructed to represent sequential and co-visitation associations and to introduce explicit behavioral evidence into recommendation ranking.
- A place-transition-aware tourism recommendation framework is developed to integrate dynamic profile features and a relation-weighted path feature through interpretable XGBoost re-ranking.
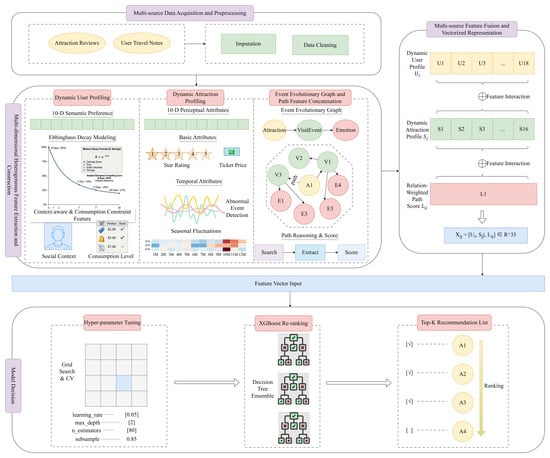
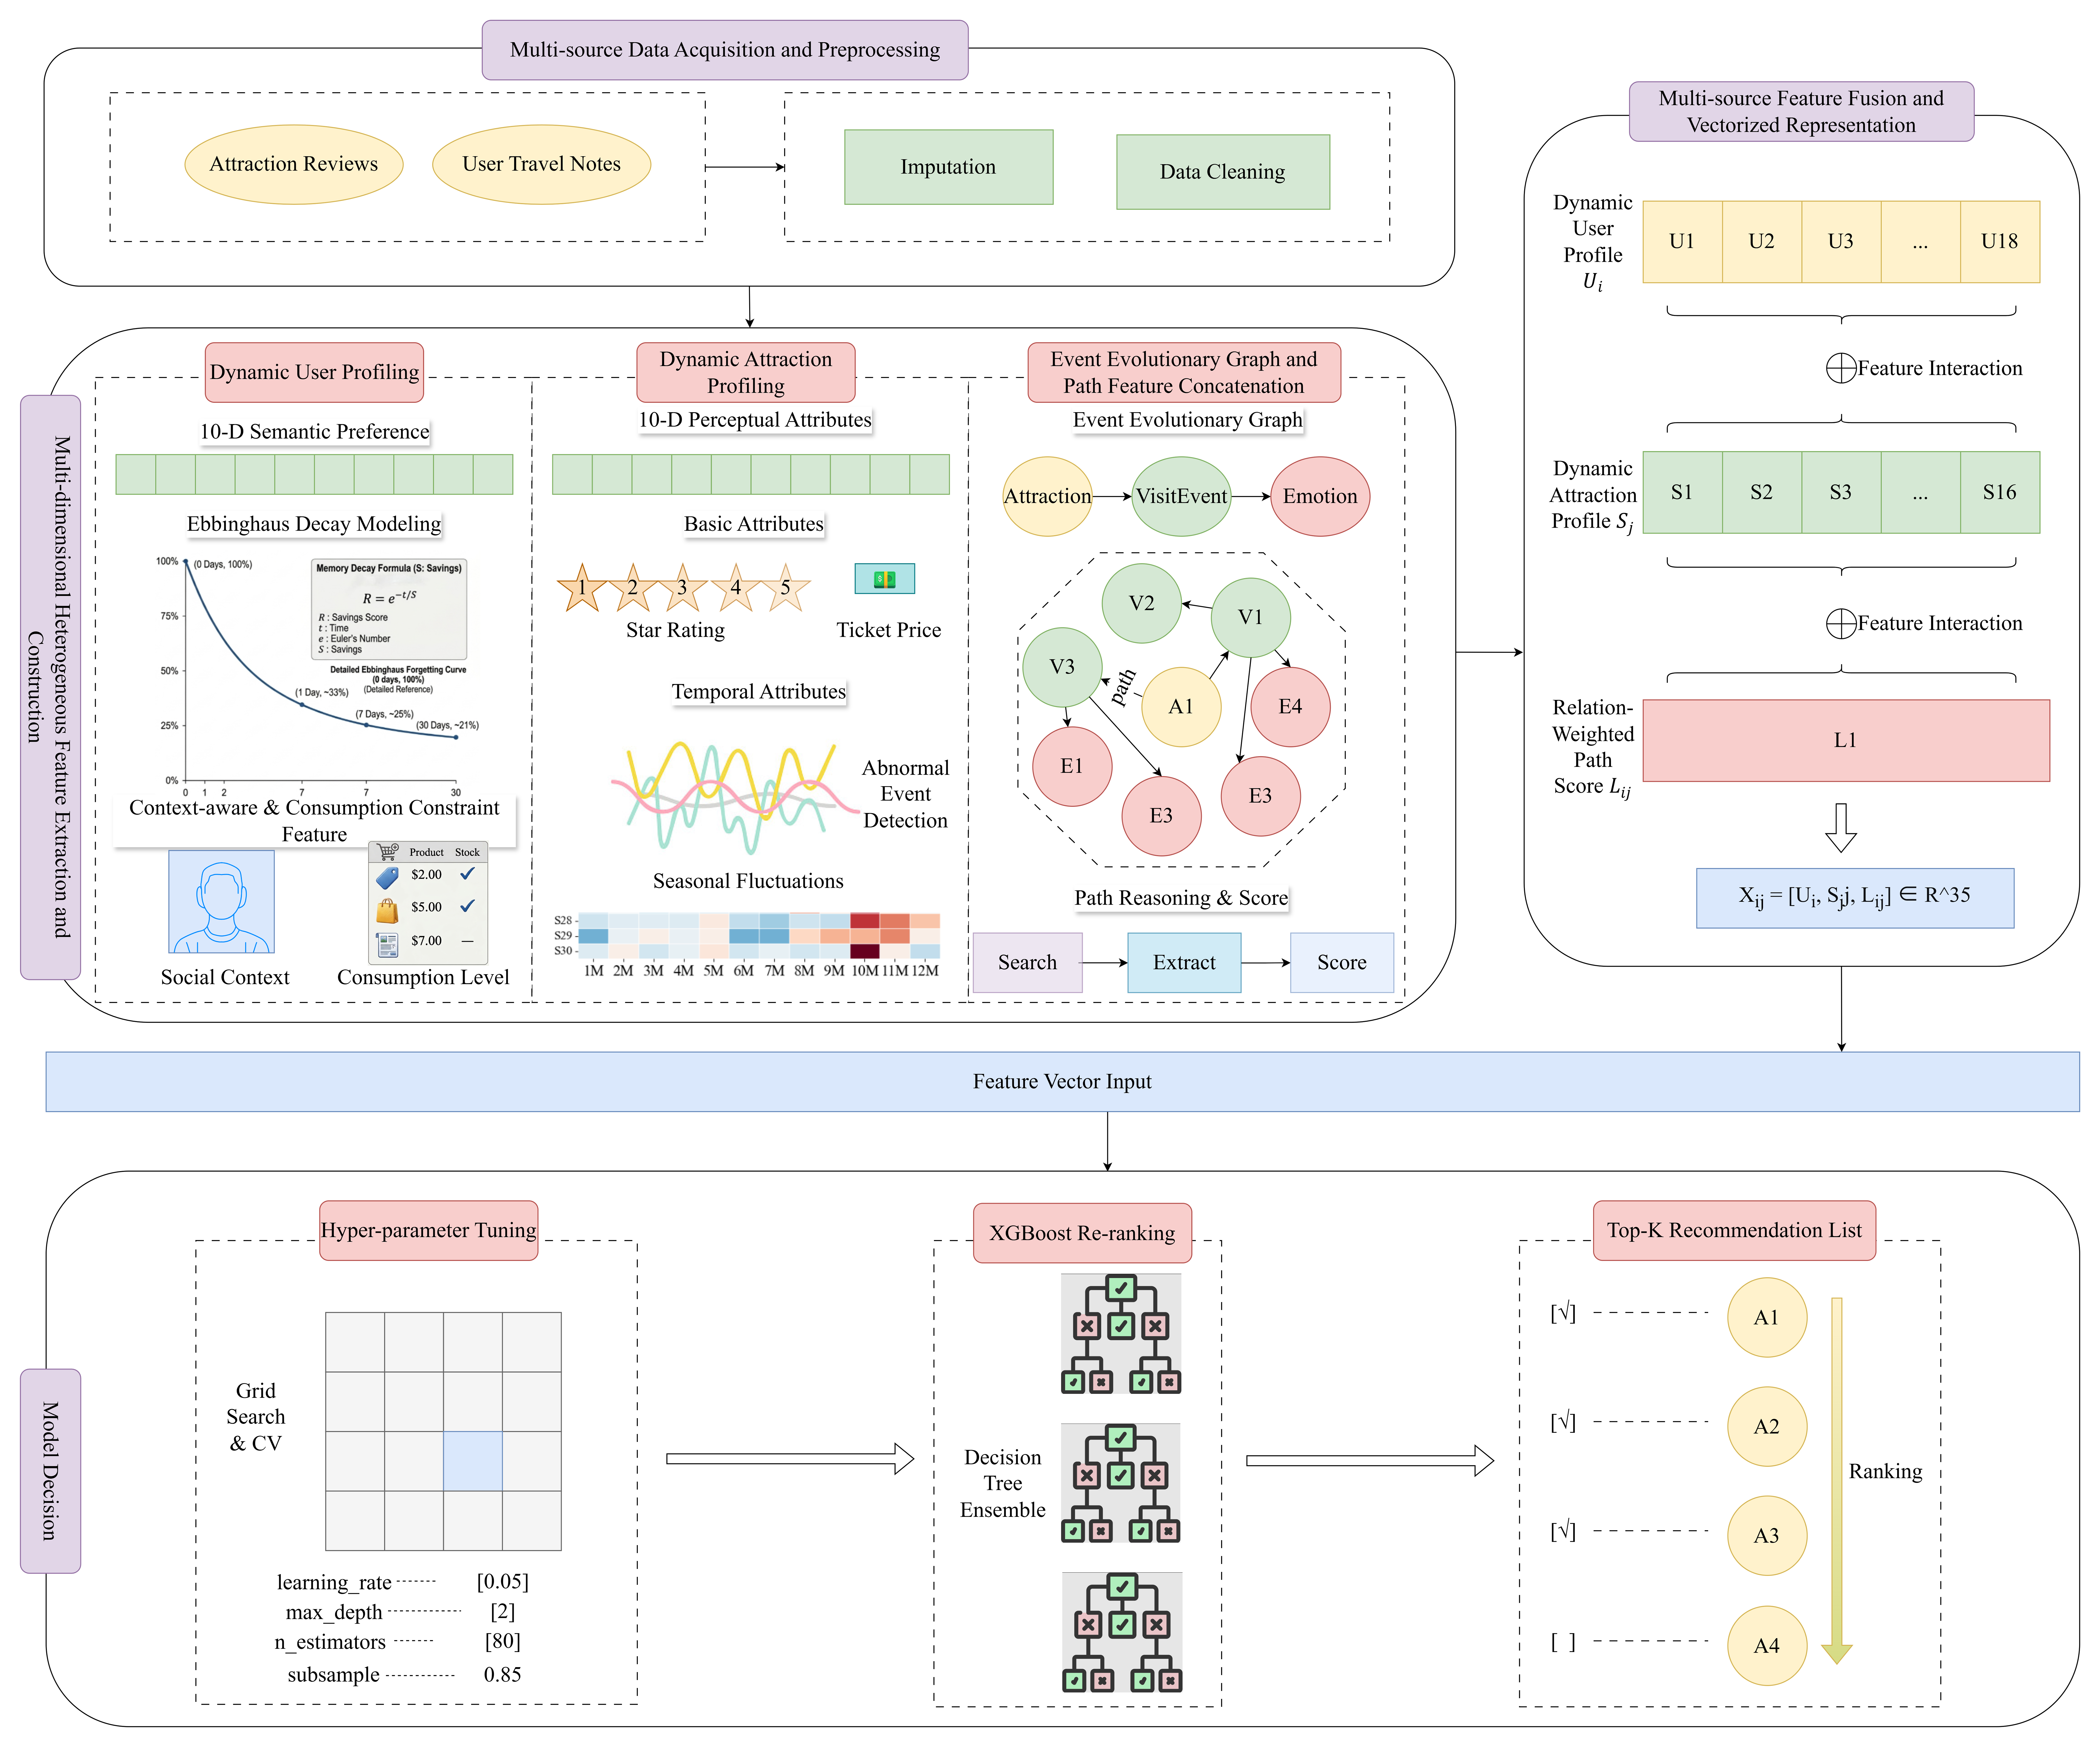
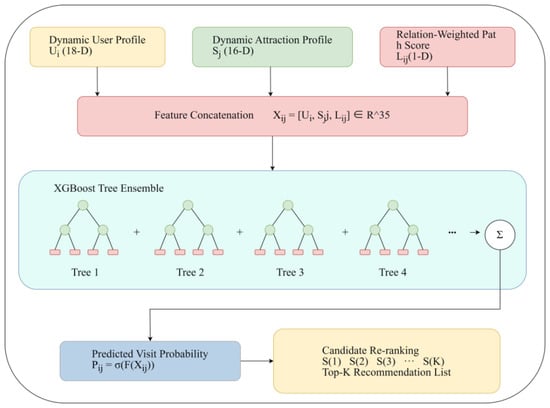
The overall technical framework of this study is illustrated in Figure 1.
Figure 1.
Place-transition-aware tourism recommendation framework integrating dynamic profiling, Event Evolutionary Graph-based path behavior reasoning, and XGBoost re-ranking.
2. Related Work
User profiling is a central approach for representing individual preferences in recommender systems [20,21]. Early methods mainly constructed static profiles from demographic attributes or historical interaction frequencies, whereas tourism preferences often evolve with travel stages, contextual conditions, and accumulated experiences [22,23]. Sequential models such as SASRec and BERT4Rec improve the representation of temporal dependencies through self-attention and bidirectional sequence modeling [6,7], but their preference representations are primarily inferred from ordered interactions. In tourism scenarios, the retention and attenuation of interests may also be affected by emotional feedback and previous travel experiences. Existing time-aware profiling methods commonly apply predefined temporal weights but provide only a limited representation of how accumulated preference evidence weakens over time or is reinforced through repeated expressions. The present study interprets historical travel experiences as affectively evaluated preference evidence: sentiment polarity determines the signed contribution of an experience, repeated expressions reinforce the corresponding interest dimension, and elapsed time reduces the contribution of older evidence. On this basis, an emotional memory-decay mechanism is employed to combine relatively stable long-term preferences with recent interest changes.
Knowledge graph-based recommendation uses structured entity relations to alleviate semantic sparsity and support interpretable association modeling [10,11,12,13,14]. Many conventional knowledge-graph recommenders encode user–item–entity relations through graph embeddings or relatively fixed relation structures; these representations capture semantic associations but do not directly describe the ordered transition of tourism events. Beyond conventional embedding-based approaches, knowledge-enhanced interactive recommendation also combines structured knowledge with causal or reinforcement-learning mechanisms [24]. GNN-based approaches emphasize high-order interaction learning through message propagation [8,9,25], temporal knowledge graph models incorporate time-dependent entity relations and path reasoning [19,26,27,28], and LLM-enhanced methods mainly strengthen semantic representation, contextual reasoning, and explanation generation [29,30]. Recent situation-aware and smart-urban recommender studies further emphasize users’ current goals, environmental constraints, graph integration, explainability, real-time processing, privacy, and governance [31,32], while cultural-tourism research demonstrates the value of situational conditions in personalized experience recommendation [33]. These developments improve structural, temporal, or semantic modeling, but their primary representations remain user–item interactions, evolving entity relations, or latent semantic knowledge. The present study instead organizes validated tourism activities as event-level transitions connected by sequential and co-visitation relations. Event Evolutionary Graphs provide a structural basis for representing such event dependencies [16,17,18], from which a time-aware relation-weighted path feature is extracted as explicit evidence linking users’ previous activities with candidate attractions.
For medium-scale tourism datasets containing heterogeneous structured features, ensemble learning provides a practical means of modeling nonlinear feature interactions [34,35,36]. XGBoost is particularly suitable for integrating numerical, categorical, semantic, temporal, and graph-derived features within a unified ranking model [37,38]. In this study, it is used as an interpretable re-ranking model rather than as a sequence encoder or graph-reasoning mechanism. The methodological focus therefore lies in coupling dynamic profiling, attraction-state representation, and an explicit relation-weighted path feature, rather than claiming that XGBoost is universally preferable to sequential or graph-based recommendation models. When the user-side and attraction-side representations are discussed jointly, they constitute the dual-side dynamic profiling component of the proposed framework.
3. Multi-Dimensional Tourist–Attraction Profiling and Feature Construction
3.1. Data Sources and Preprocessing
This study constructs a multi-source tourism dataset from travel notes, attraction reviews, and attraction attribute records associated with Wuhan, China. User-side data are used to extract interest preferences, activity sequences, travel contexts, and consumption characteristics, while attraction-side data support the construction of basic, perceptual, and temporal attributes. The main dataset and ranking-experiment statistics are summarized in Table 1.
Table 1.
Statistical summary of the tourism dataset and ranking experiment.
Travel notes were first used to construct dynamic profiles and extract validated attraction-visit events, while attraction reviews supported perceptual and temporal feature construction. For the ranking experiment, each user’s validated visits were ordered chronologically. Earlier visits formed the behavioral history, whereas subsequent eligible visits were used as validation or test targets. For each target, the model ranked candidate attractions that had not appeared in the corresponding historical sequence. To ensure a consistent comparison, only queries for which all evaluated models could rank the same candidate attractions were retained. This chronological construction prevents future visits from being used when generating profile or path features for an earlier recommendation time.
To ensure data quality, the raw textual data are first cleaned by removing advertising content, duplicated texts, and special symbols. Missing values are processed according to their data types. Numerical attributes, such as attraction prices and ratings, are imputed using the median values of the corresponding attributes calculated from the training set. For textual data, a deterministic rule-based supplementation procedure is adopted. After text cleaning, a travel note or review is considered invalid when its main-text field is empty, and the corresponding record is excluded from text-based feature extraction. When the attraction description field is empty, the available fields within the same record are concatenated in a fixed order—attraction name, category, tags, and location information—to construct the textual input; unavailable auxiliary fields are skipped. After preprocessing, word segmentation, sentiment analysis, and feature extraction are further performed on user travel notes and attraction reviews to provide a data foundation for subsequent profiling modeling.
3.2. User Profiling Construction
User profiling is employed to characterize tourists’ interest preferences and behavioral characteristics. In this study, the user profile is represented as a feature vector Ui integrating multi-dimensional attributes and is modeled from three aspects: semantic preference features, dynamic interest features, and contextual as well as consumption constraint features.
3.2.1. Semantic Preference Features
BERT-based contextual representations are used to support semantic matching between user travel notes and tourism interest dimensions. The dimensions were established through a corpus-guided procedure that combined recurrent-theme identification with manual semantic consolidation. Semantically overlapping themes were merged, while themes with limited coverage or weak relevance to tourism preferences were removed. This procedure yielded ten dimensions: photography, foodie, shopping, nature, history, adventure, relaxation, family, nightlife, and luxury. A manually checked lexicon containing representative and semantically related expressions was constructed for each dimension, and travel-note expressions were mapped to the corresponding dimensions using their contextual representations. For user i, the original preference score on dimension k, denoted as Pi,k, is calculated as follows:
where denotes the number of travel notes associated with user i, denotes the frequency of topic-related keywords belonging to dimension k in the m-th travel note of user i, and represents the corresponding sentiment polarity score, with values ranging from [−1, 1].
This procedure converts each user’s travel notes into a ten-dimensional semantic preference vector. Table 2 presents the original preference scores of five representative users.
Table 2.
Raw preference scores Pi,k for five representative users across ten interest dimensions.
3.2.2. Dynamic Interest Evolution and Emotional Memory Decay
Dynamic user profiling combines a long-term preference component derived through exponential decay with a short-term component estimated using a seven-day linear weighting window. Because the original preference score Pi,k incorporates sentiment polarity, temporal decay is applied to sentiment-weighted preference evidence rather than to raw interaction counts. Here, emotional memory decay refers to the time-dependent attenuation of sentiment-weighted experience evidence rather than a direct simulation of human cognitive forgetting. The coefficients β and γ control the decay rate and the balance between the two components, respectively, and are selected using the training data as described in Section 5.1.
(1) Long-Term Interest Modeling
The long-term component represents relatively stable user preferences. The contribution of each historical travel note is attenuated according to the interval between its publication time and the profile reference time. The calculation is defined as follows:
where denotes the decay coefficient controlling the attenuation rate of long-term interests, and represents the number of days between the travel-note publication time and the profile reference time. A larger β produces faster attenuation, whereas a smaller value preserves historical evidence for a longer period. This component reduces the influence of older evidence while retaining preferences that are repeatedly expressed across historical records.
Through the exponential decay mechanism, the weights of historical behavioral features gradually decrease over time, while long-term stable interests still retain a certain degree of influence.
(2) Short-Term Interest Modeling
The short-term component captures recent preference changes using a seven-day linear weighting window:
Behaviors occurring at the profile reference time (d = 0) receive a weight of 1. The weight decreases linearly to 0 at d = 7 and remains bounded at 0 for d > 7. This component therefore emphasizes preference evidence within the seven-day window without assigning negative weights to earlier behaviors or replacing the long-term representation.
(3) Weighted Fusion
The final dynamic preference score is obtained by combining the long-term and short-term components:
where γ controls their relative contributions. A value of 0 retains only the long-term component, a value of 1 retains only the short-term component, and intermediate values combine both. Under the selected setting of β = 0.001 and γ = 0.75, the distributions of the normalized dynamic user profiles are summarized in Table 3.
Table 3.
Descriptive statistics of normalized temporal preference profiles across users.
The dispersion varies across the ten dimensions. Photography, nature, history, and nightlife exhibit relatively greater user-level variation, whereas adventure, relaxation, and luxury remain sparse for most users. No duplicate ten-dimensional profile vectors were observed, and the mean and median pairwise Euclidean distances were 0.389 and 0.329, respectively. These results indicate that user differentiation arises primarily from cross-dimensional profile combinations. The resulting ten-dimensional dynamic user profile is used as the user-side preference input to the XGBoost re-ranking model.
3.2.3. Travel-Context and Consumption Features
Tourism choices are influenced not only by interest preferences but also by travel companions and consumption-related considerations. These factors are therefore incorporated into dynamic user profiling as travel-context and consumption features.
(1) Travel Context Features
Travel-note expressions are used to identify five travel contexts: couple, family, friends, parent–child, and solo travel. The identified category is represented through one-hot encoding and incorporated into the user-side feature vector to distinguish behavioral preferences under different companion contexts.
(2) Consumption Features
Consumption-related expressions in travel notes are mapped to high, medium, or low consumption levels. The resulting categorical feature is encoded and included in the user-side vector to represent differences in tourism expenditure preferences.
Together, the five-dimensional travel-context representation and three-dimensional consumption representation form the eight contextual features included in the dynamic user profile Ui.
3.3. Attraction Profiling Construction
Attraction profiling represents tourism resources through basic, perceptual, and temporal attributes. For attraction j, these attributes form the attraction-side vector Sj. Basic attributes include administrative rating, historical review popularity, and ticket price; perceptual attributes map attraction reviews to the same ten-dimensional semantic space used in dynamic user profiling; and temporal attributes describe seasonal intensity, abnormal popularity gain, and anomaly-warning indicator. This organization enables semantic matching between users and attractions while retaining attraction-specific objective and temporal information.
3.3.1. Basic Attribute Representation
(1) Rating and Popularity Features
Attraction ratings reflect the fundamental service quality and overall attractiveness of tourism resources. In this study, attraction administrative ratings (e.g., 5A and 4A) are extracted as basic attraction attribute features. Meanwhile, the historical cumulative number of attraction reviews is utilized to characterize attraction popularity. Considering the large variation in review counts among different attractions, normalization is applied to the review quantity to reduce the influence of extreme values on model training.
(2) Economic Features
Ticket price is an important constraint factor affecting tourists’ decision-making processes. Therefore, official attraction ticket prices are extracted and normalized in this study. Together with the consumption constraint features in user profiling, this feature is utilized to characterize the matching relationship between users’ consumption abilities and attraction consumption levels.
3.3.2. Perceptual Attributes Based on Review Mining
To support direct semantic matching between user interests and attraction characteristics, attraction review texts are mapped onto the same ten interest dimensions defined in Section 3.2.1 using the corresponding topic-related keywords. These shared dimensions represent preference-related semantics perceived from attraction reviews, whereas objective and temporal characteristics are modeled separately through the basic and temporal attributes. For attraction j, the perceptual attribute score on dimension k is calculated as follows:
where denotes the number of reviews associated with attraction j, denotes the frequency of topic-related keywords belonging to perceptual dimension k in the n-th review of attraction j, and represents the sentiment polarity score of the corresponding review, with values ranging from ([−1, 1]).
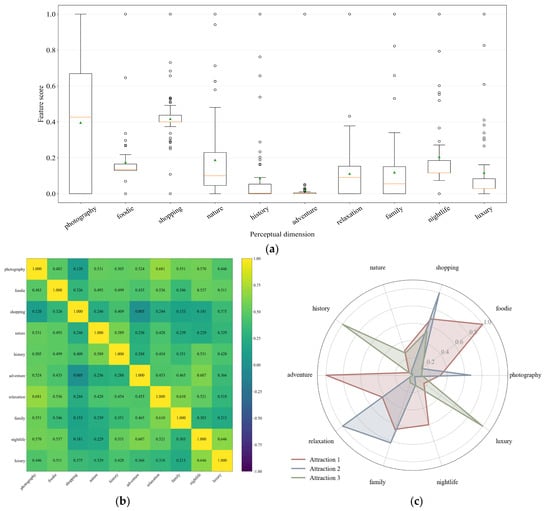
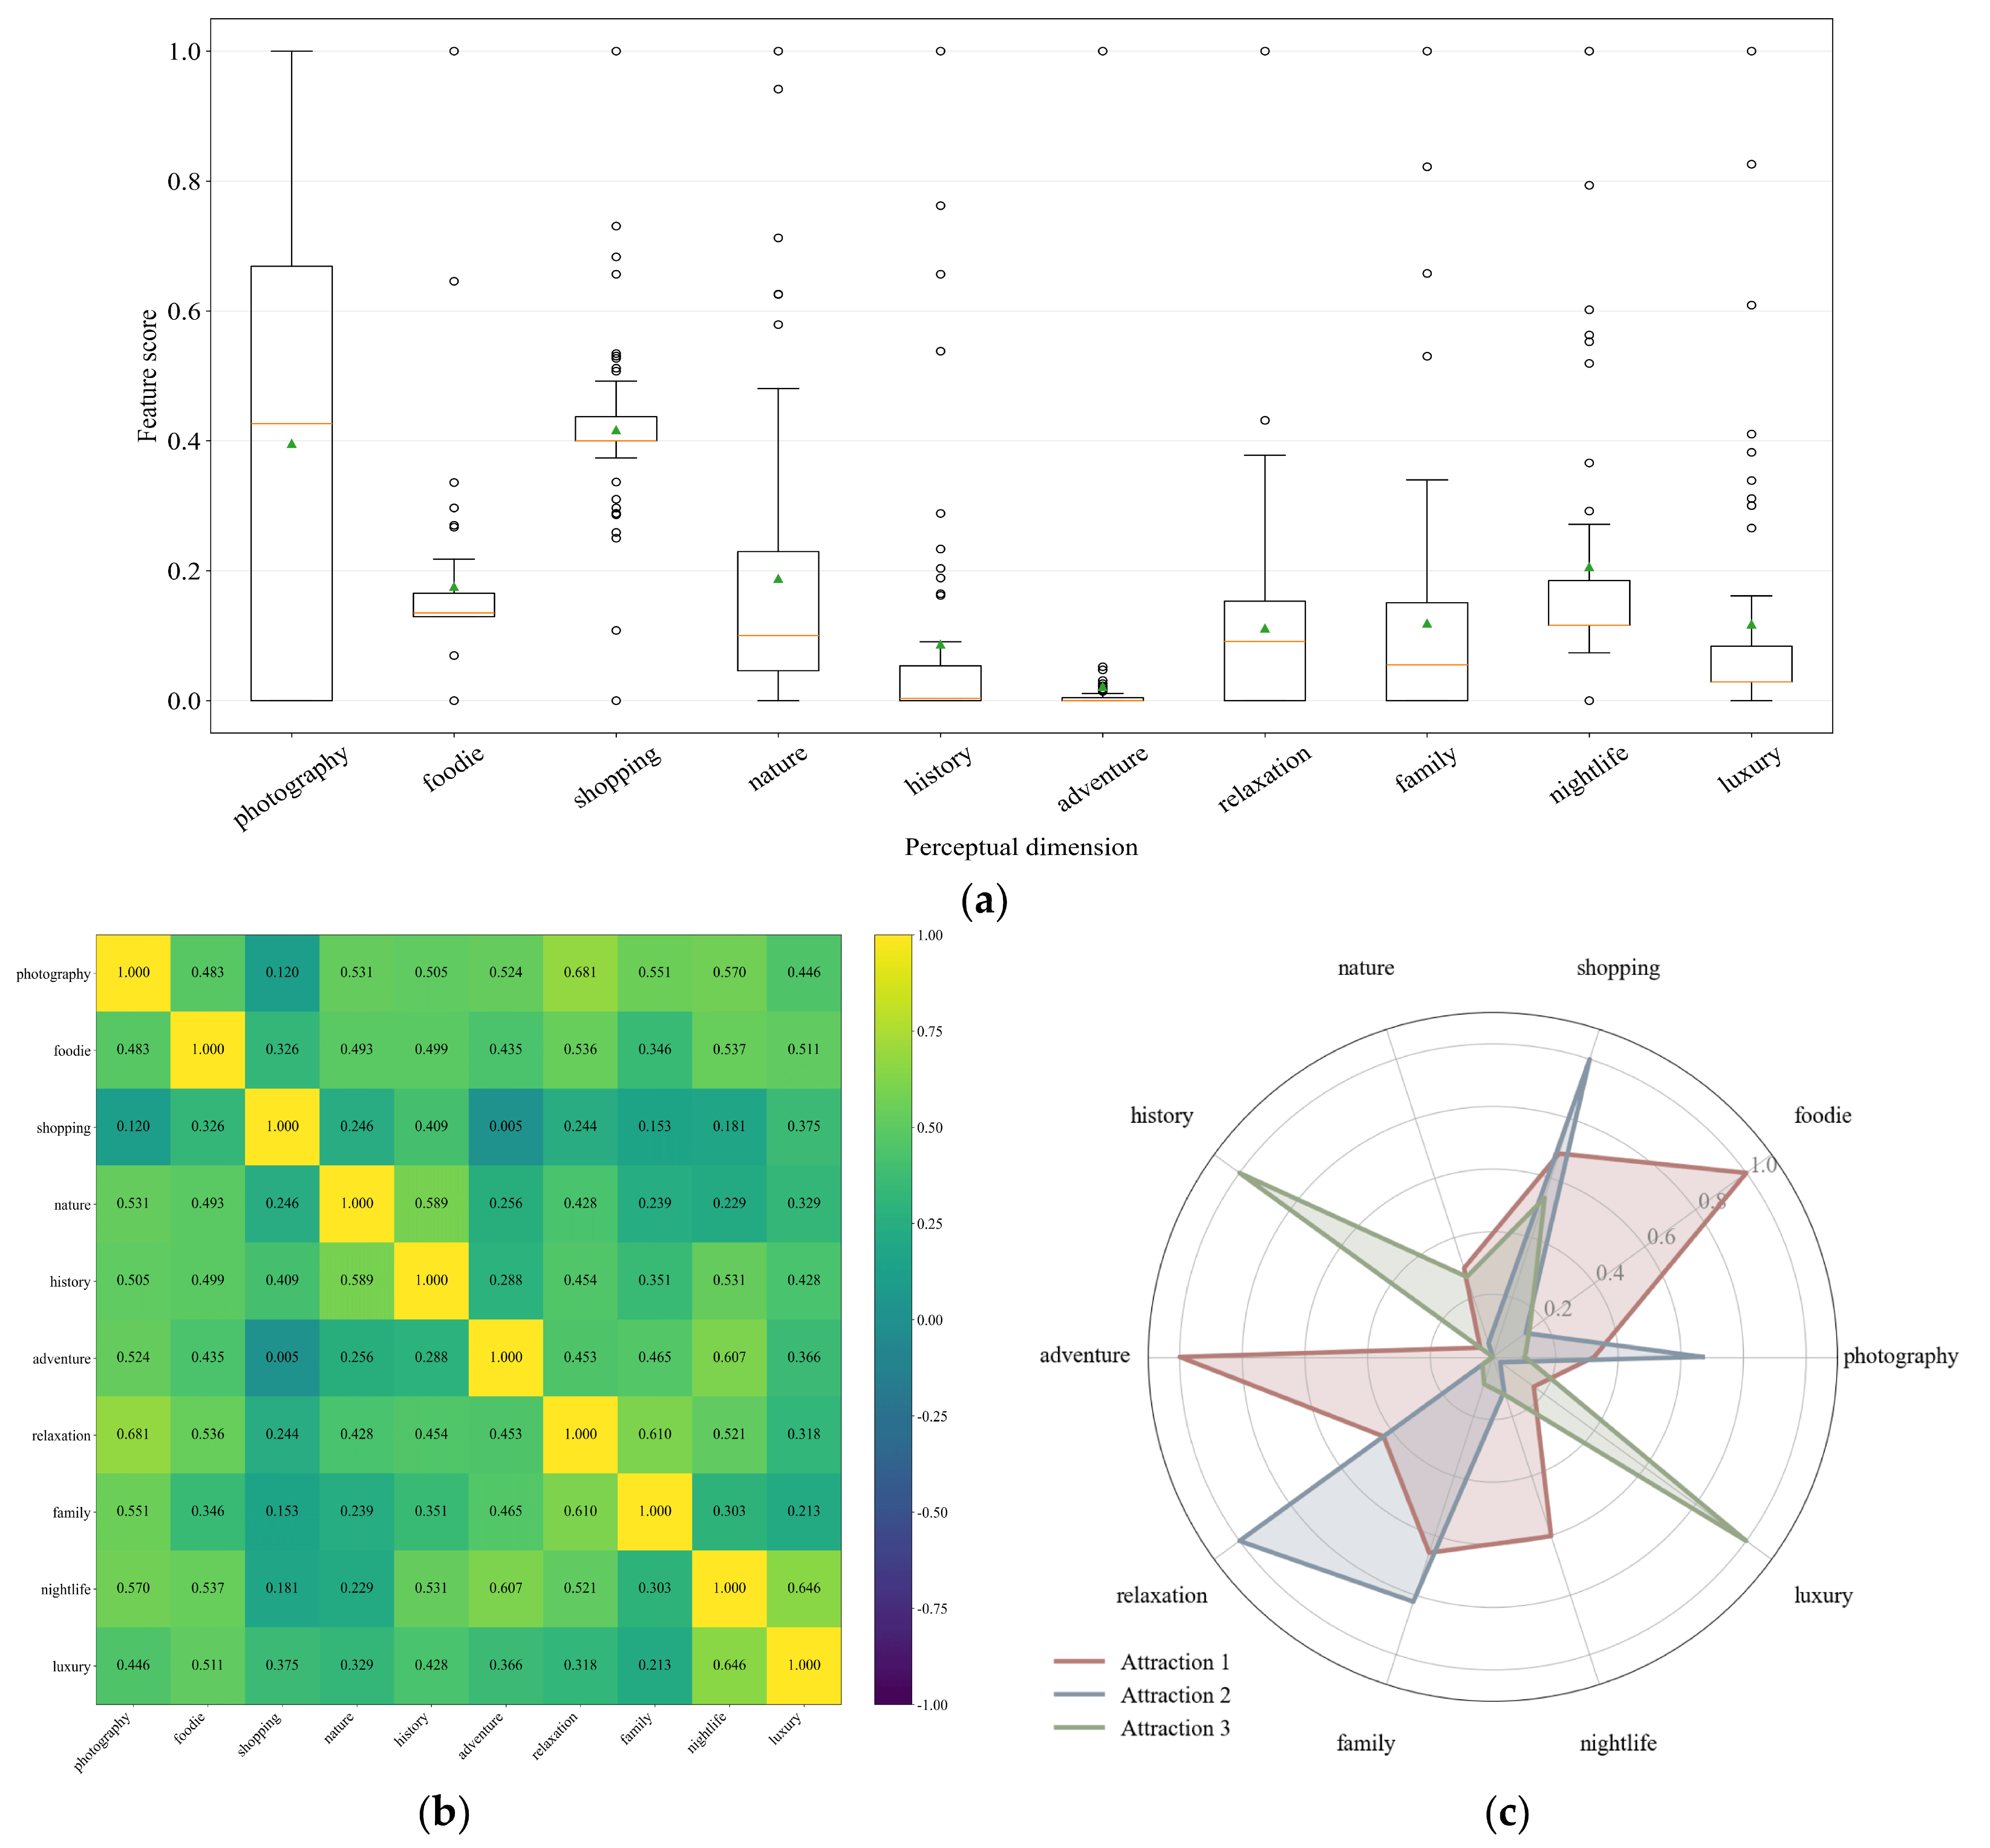
This procedure converts attraction reviews into ten-dimensional perceptual vectors. To assess feature differentiation and inter-dimensional redundancy, the vectors of all 62 attractions were examined using descriptive statistics and Spearman correlation analysis. Table 4 summarizes the distribution of each dimension, while Figure 2a,b present the corresponding boxplots and correlation matrix.
Table 4.
Descriptive statistics of the attraction perceptual dimensions.
Figure 2.
Attraction perceptual feature space: (a) distributions of the ten perceptual dimensions; (b) Spearman correlation matrix; (c) perceptual profiles of three representative attractions.
As shown in Table 4 and Figure 2a, the ten dimensions exhibit different levels of concentration and dispersion. Their mean values range from 0.021 to 0.417, while the interquartile ranges vary from 0.005 to 0.669. Adventure is concentrated near the lower bound for most attractions, whereas photography exhibits a broader distribution. Figure 2b shows that the largest off-diagonal Spearman coefficient is 0.681, observed between photography and relaxation, and all off-diagonal coefficients remain below 0.70. These results indicate that the dimensions preserve related but non-identical semantic information without severe inter-dimensional redundancy.
Figure 2c further illustrates the perceptual patterns of three representative attractions. Attraction 1 shows a relatively high adventure weight, Attraction 2 is mainly associated with relaxation, and Attraction 3 exhibits a prominent history attribute. These examples provide an intuitive complement to the overall statistical analysis.
3.3.3. Temporal Attribute Representation in Dynamic Attraction Profiling
Dynamic attraction profiling incorporates three temporal attributes: monthly seasonal intensity, abnormal popularity gain, and a binary anomaly-warning indicator.
(1) Seasonal Fluctuations
Attraction popularity may exhibit periodic seasonal variations. Monthly review counts are therefore used to construct the seasonal intensity sequence of attraction j:
where Zj,m denotes the standardized seasonal intensity of attraction j in month m. The monthly review volumes of each attraction are standardized using their within-attraction mean and standard deviation, thereby characterizing the relative monthly variation in each attraction rather than its absolute review volume.
For each user–attraction sample, the seasonal intensity corresponding to the recommendation month is selected and included as one temporal attraction feature.
To statistically examine whether the seasonal intensities differed across months, the standardized seasonal intensity matrix comprising 62 attractions and 12 months was analyzed using the Friedman test. Kendall’s W was additionally reported to quantify the degree of concordance in monthly variation across attractions. Because the Friedman test is based on within-attraction ranks, row-wise standardization does not alter the ordering of monthly observations for each attraction.
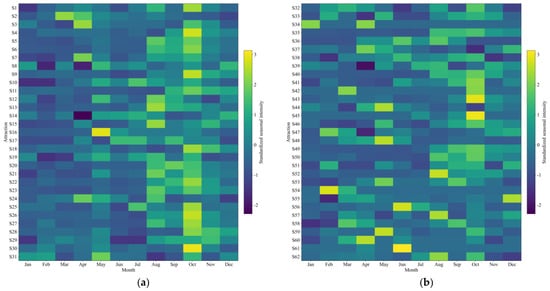
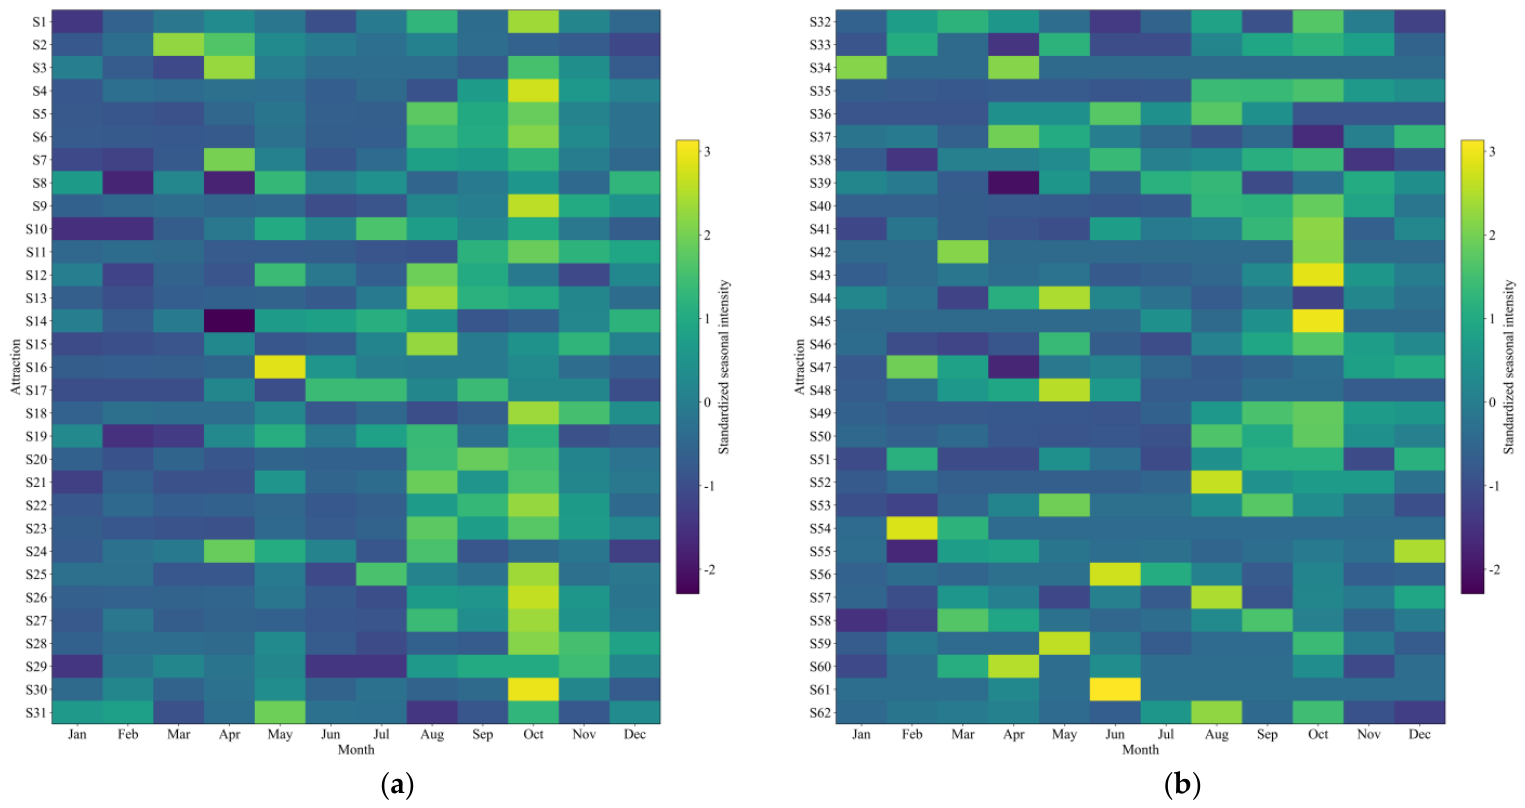
Figure 3 presents the standardized monthly seasonal intensity patterns of the 62 attractions. The Friedman test revealed an overall difference in seasonal intensity across the twelve months (χ2(11) = 126.493, p < 0.001), while Kendall’s W was 0.185. The statistically detectable difference was accompanied by limited concordance in monthly patterns across attractions, indicating that the timing of seasonal changes was not fully consistent among attractions. October had the highest average rank (9.702), followed by August (7.903) and May (7.452), whereas January had the lowest average rank (4.210). Figure 3a,b further show that the timing and magnitude of seasonal peaks vary across attractions rather than following a uniform annual pattern.
Figure 3.
Standardized monthly seasonal intensity patterns of the 62 attractions: (a) S1–S31; (b) S32–S62.
(2) Abnormal Popularity Gain
In addition to periodic fluctuations, attraction popularity may also be influenced by factors such as holidays, weather variations, and unexpected events. An abnormal popularity gain feature is therefore constructed to quantify positive deviations from an attraction-specific temporal baseline.
The review records are first aggregated into weekly review counts. For attraction j in week t, the moving mean and moving standard deviation are calculated from the preceding eight weeks, while the current week is excluded from its own rolling baseline. This implementation prevents the observation being evaluated from affecting its reference statistics. Subsequently, an abnormal popularity gain index, denoted as , is defined as follows:
where denotes the weekly review count of attraction j in week t, while and denote the moving mean and moving standard deviation calculated from the preceding eight weeks, respectively. The small positive constant ε is introduced to avoid division by zero when the rolling standard deviation approaches zero. A positive value indicates that the current weekly review volume exceeds its recent baseline, and a larger value represents a more pronounced positive deviation.
(3) Anomaly-Warning Indicator
To convert abnormal popularity gain into an interpretable binary feature, a one-sided rolling 3σ rule is applied to identify pronounced positive deviations. When the weekly review count exceeds moving mean by more than three moving standard deviations, the warning indicator is assigned a value of 1; otherwise, it is set to 0. The calculation process is defined as follows:
Alternative anomaly detection methods include robust statistical rules based on the interquartile range or median absolute deviation, as well as unsupervised approaches such as Isolation Forest and Local Outlier Factor. Although these approaches can accommodate non-Gaussian or nonlinear anomaly patterns, they require additional parameterization or yield scores that are less directly interpretable against an attraction-specific temporal baseline. The rolling sigma rule was retained because it requires no labeled anomalies and produces a transparent binary feature based on each attraction’s recent history.
To examine the sensitivity of the anomaly-warning indicator to the threshold setting, the anomaly detection procedure was repeated using 2.0σ, 2.5σ, and 3.0σ. Review records were deduplicated and aggregated into weekly counts, and only weekly observations with valid preceding eight-week baselines were included. A total of 5989 valid weekly observations were retained for comparison. As shown in Table 5, the three thresholds identified 433, 342, and 257 abnormal observations, corresponding to anomaly rates of 7.23%, 5.71%, and 4.29%, respectively. The Jaccard overlap with the 3σ anomaly set was 0.594 for 2σ and 0.751 for 2.5σ.
Table 5.
Sensitivity of anomaly detection to different rolling sigma thresholds.
The number of detected anomalies decreased as the threshold increased. Compared with the 2.5σ setting, the 3σ rule reduced the number of flagged observations by 24.85% while retaining substantial overlap between the two anomaly sets. Therefore, the 3σ threshold was retained as a conservative criterion for identifying pronounced positive deviations while limiting the inclusion of minor fluctuations.
Ultimately, the attraction profile vector Sj is constructed through the above procedures, and its formulation is defined as follows:
where denotes the three-dimensional basic attribute vector, denotes the ten-dimensional perceptual attribute vector, and denotes the three-dimensional temporal attribute vector comprising seasonal intensity, abnormal popularity gain, and the anomaly-warning indicator.
3.4. Event Evolutionary Graph and Path Association Feature Construction
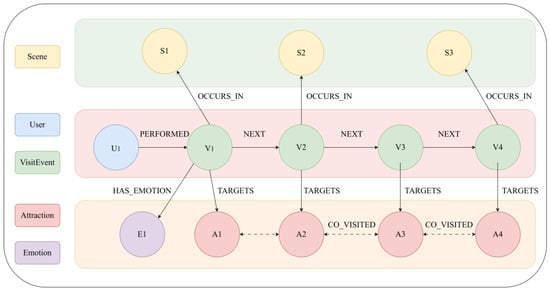
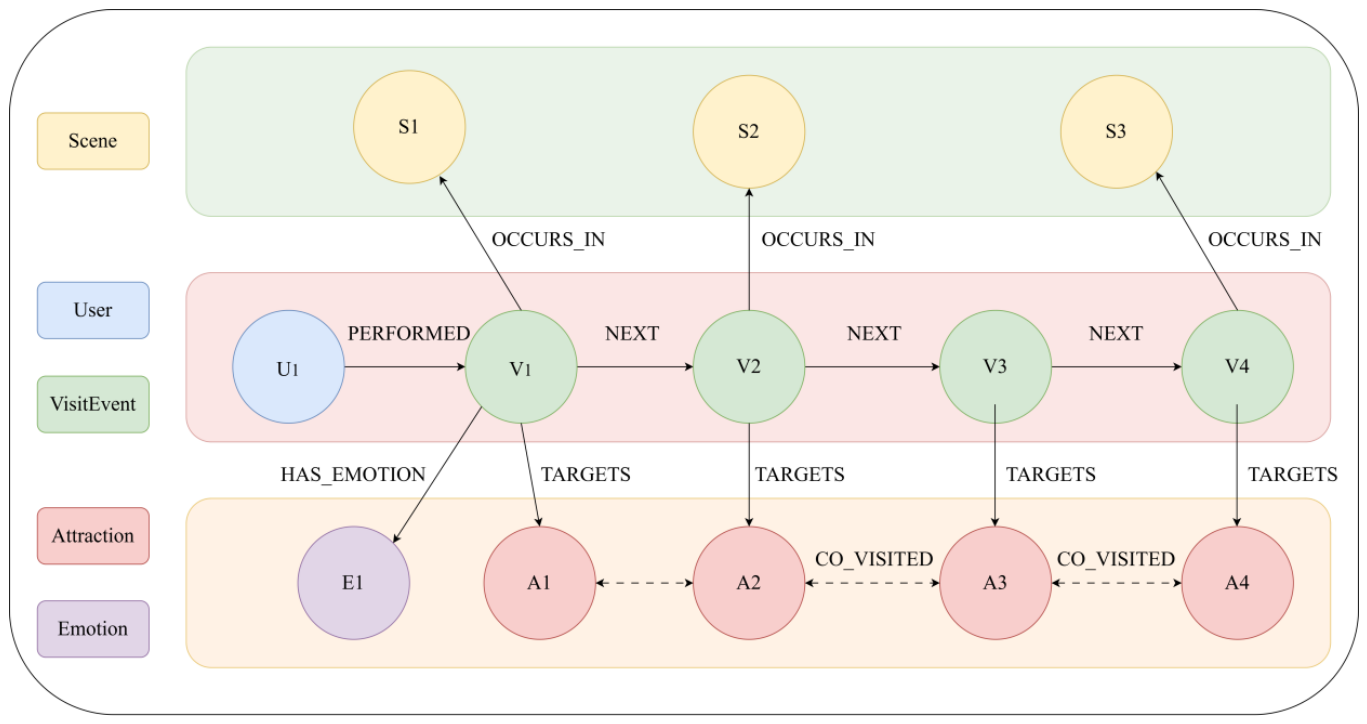
To represent behavioral continuity, an Event Evolutionary Graph was constructed by organizing users, travel-note scenes, validated visit events, attractions, and emotional feedback within a unified graph structure. In this study, behavioral continuity refers to the explicit sequential and co-visitation dependencies linking user i’s previous attraction visits to candidate attraction j, rather than thematic similarity or physical route proximity. As illustrated in Figure 4, the graph contains five node types—User, Scene, VisitEvent, Attraction, and Emotion—and six relation types—PERFORMED, OCCURS_IN, TARGETS, HAS_EMOTION, NEXT, and CO_VISITED. The VisitEvent–Attraction structure, together with NEXT relations between VisitEvent nodes and CO_VISITED relations between Attraction nodes, forms a place-transition network. A path in this network denotes a chain of behavioral relations connecting historical visit events with a candidate attraction; it is not a geographic travel route, navigation path, or shortest path in a road network.
Figure 4.
Node and relation schema of the Event Evolutionary Graph.
The semantic meanings and construction rules of the node and relation types are summarized in Table 6.
Table 6.
Node and relation types in the Event Evolutionary Graph.
The graph connections were generated directly from the validated visit-event records. PERFORMED, OCCURS_IN, TARGETS, and HAS_EMOTION were created according to the user, scene, attraction, and sentiment identifiers associated with each event. NEXT was created between adjacent events after the events within each travel note were ordered by their recorded sequence. CO_VISITED was created between distinct attractions appearing in the same travel note, and repeated co-visitation evidence was aggregated at the attraction-pair level. For feature computation at recommendation time t, only user events and relation evidence available before t were retained. Within the travel note containing the target event, a relation was included only when all of its associated events occurred before the target event position.
After construction, the Event Evolutionary Graph was stored in Neo4j, and Cypher queries were used to retrieve valid historical paths connecting user i’s previous visits to candidate attraction j. PERFORMED and TARGETS were assigned unit weights because they represent explicit structural connections. The NEXT weight was calculated from the mean semantic-extraction confidence of its two adjacent visit events, whereas the CO_VISITED weight was obtained by logarithmically normalizing the historical co-visitation frequency of the corresponding attraction pair. OCCURS_IN and HAS_EMOTION were retained for scene organization and semantic interpretation but were excluded from path-score calculation. The resulting time-aware relation-weighted path score is calculated as follows:
where and denote the semantic-extraction confidence scores of two adjacent visit events and , respectively.
where denotes the historical co-visitation frequency of attractions a and b before reference time t, and denotes the maximum co-visitation frequency among all attraction pairs available before t. Logarithmic normalization limits the dominance of highly frequent attraction pairs while preserving the ordering of co-visitation strengths.
where denotes the set of valid historical paths connecting user i and candidate attraction j before reference time t, is the number of relations in path p, is the weight of relation r, and is the geometric mean of the relation weights along the path.
Accordingly, Lij is a one-dimensional behavioral path association feature rather than a geographic distance, road-network path, or direct measure of thematic similarity. It is subsequently concatenated with the dynamic user profile Ui and the dynamic attraction profile Sj for recommendation re-ranking.
3.5. Integrated Feature Representation and Sample Construction
After constructing the dynamic user profile Ui, dynamic attraction profile Sj, and path association feature Lij, the three components are concatenated to form the integrated feature vector Xij:
where Ui contains 18 user-side features, Sj contains 16 attraction-side features, and Lij is a one-dimensional relation-weighted path feature, yielding a 35-dimensional representation.
Each user–attraction pair is assigned a binary label yij ∈ {0,1}. An observed visit by user i to attraction j is labeled as a positive sample (yij = 1), whereas an attraction without an observed visit record for that user is treated as a candidate negative sample (yij = 0). For each positive sample, three negative samples are randomly selected from the corresponding user’s unvisited attractions, maintaining a positive-to-negative ratio of 1:3. Although binary labels are used to train the XGBoost scoring model, the predicted positive-class probabilities are subsequently used to rank candidate attractions rather than to produce only a binary recommendation decision. In addition, continuous features are normalized using Min–Max normalization to reduce numerical differences among different feature scales.
4. Place-Transition-Aware Tourism Recommendation Model
4.1. Overall Framework of the Recommendation Model
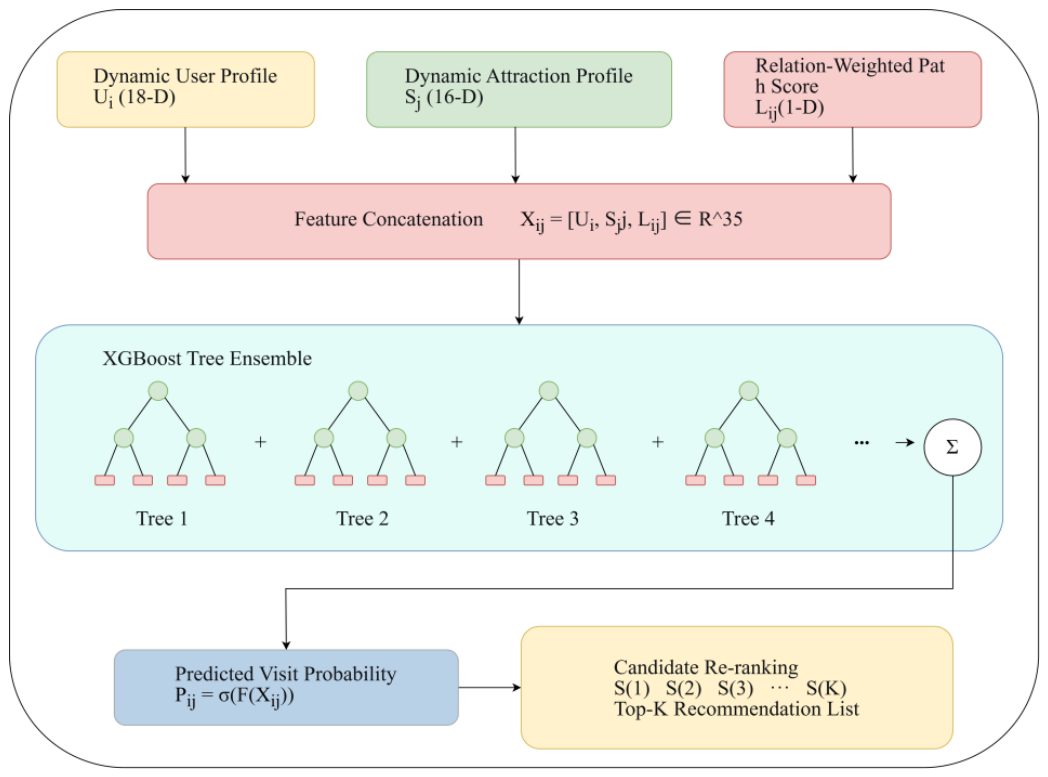
To represent evolving user demands and explicitly incorporate behavioral path associations, this study constructs a place-transition-aware tourism recommendation model integrating dynamic user profiles, dynamic attraction profiles, and a relation-weighted path feature, as illustrated in Figure 5. The overall framework of the model consists of a data input layer, a feature learning layer, a feature integration layer, and a recommendation output layer.
Figure 5.
Overall architecture of the place-transition-aware tourism recommendation model integrating dynamic user profiling, dynamic attraction profiling, path behavior reasoning, and XGBoost re-ranking.
During the data input stage, the dynamic user profile Ui, dynamic attraction profile Sj, and path association feature Lij constructed in Section 3 are incorporated into the model. In the feature integration layer, the three components are concatenated into the 35-dimensional vector Xij. During model training, XGBoost learns nonlinear interactions among user-side, attraction-side, and path-association features and estimates the probability that user i will visit candidate attraction j. Finally, candidate attractions are ranked in descending order according to their predicted probabilities, and a Top-K recommendation list is generated.
4.2. Model Input Representation and Feature Composition
During model input, the dynamic user profile Ui, dynamic attraction profile Sj, and path association feature Lij are concatenated to form the 35-dimensional vector Xij, as defined in Equation (11).
(1) User-Side Vector Ui
The dynamic user profile Ui contains 18 features. The first ten dimensions are the final dynamic interest scores obtained by combining the long-term and short-term preference components described in Section 3.2.2. The remaining eight dimensions comprise the five-dimensional travel-context representation and the three-dimensional consumption representation described in Section 3.2.3. The latter two categorical components are represented using one-hot encoding.
(2) Attraction-Side Vector Sj
The dynamic attraction profile Sj contains 16 features: three basic attributes, ten perceptual attributes, and three temporal attributes. The basic attributes comprise administrative rating, normalized historical review popularity, and normalized ticket price. The perceptual attributes represent attraction-review semantics in the same ten-dimensional interest space as the dynamic user profile. The temporal attributes comprise monthly seasonal intensity, abnormal popularity gain, and the binary anomaly-warning indicator.
(3) Path Association Feature Lij
The path association feature is the one-dimensional time-aware relation-weighted path score derived from the Event Evolutionary Graph. It integrates path length, the semantic-extraction confidence associated with NEXT relations, and the historically observed co-visitation strength associated with CO_VISITED relations, using only evidence available before recommendation time t.
Ultimately, a 35-dimensional comprehensive feature vector is constructed in this study, and its detailed composition is presented in Table 7.
Table 7.
Composition of the 35-dimensional integrated feature vector.
The resulting vector Xij is used as the input to the XGBoost re-ranking model described in Section 4.3.
4.3. XGBoost-Based Candidate Scoring and Model Interpretation
XGBoost is used as the candidate-scoring model because the 35-dimensional input vector contains heterogeneous user-side, attraction-side, and graph-derived features whose interactions may be nonlinear. The ensemble score is expressed as follows:
where M is the number of trees, denotes the m-th regression tree, and is the 35-dimensional feature vector for user i and candidate attraction j.
Model training minimizes the sum of the binary logistic loss and tree-complexity regularization:
where denotes the training set, yij ∈ {0,1} is the observed visit label, is the predicted visit probability, is the binary logistic loss, and penalizes the complexity of tree m. The binary logistic loss for sample n is defined as:
The tree-complexity regularization is defined as:
where denotes the number of leaves in tree m, is the score of leaf q, and the regularization coefficients penalize excessive tree complexity and large leaf weights.
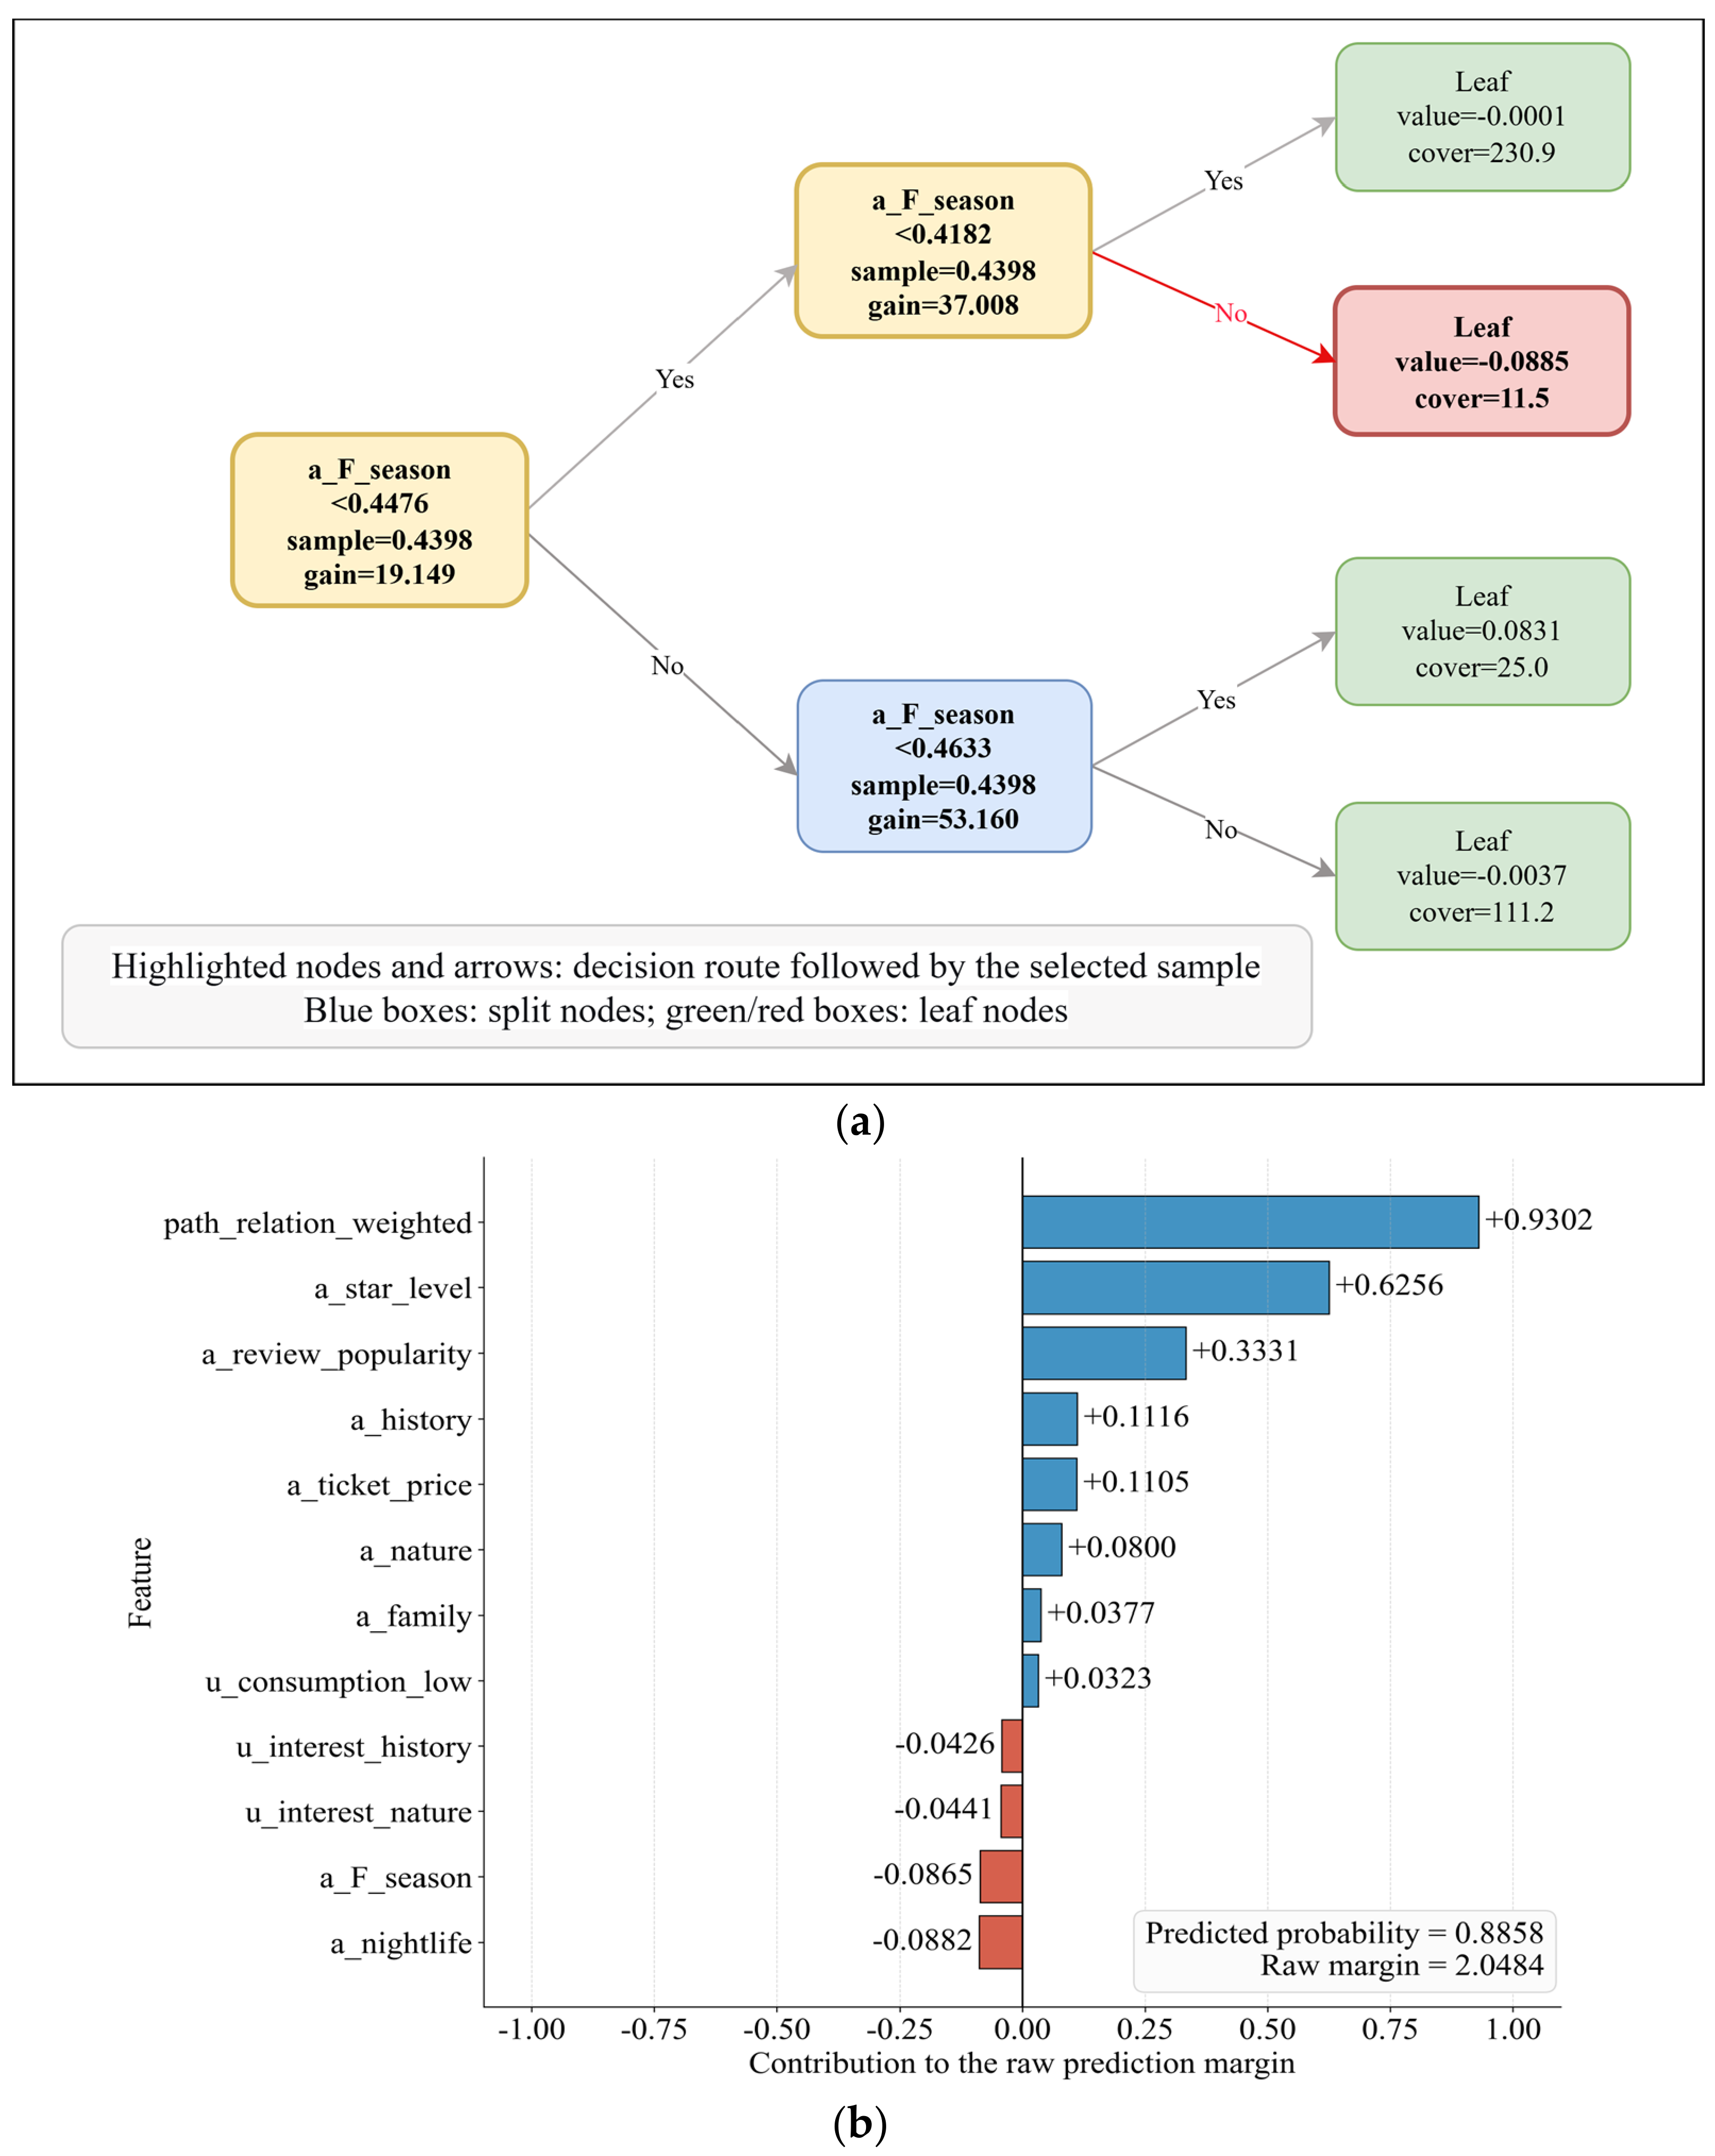
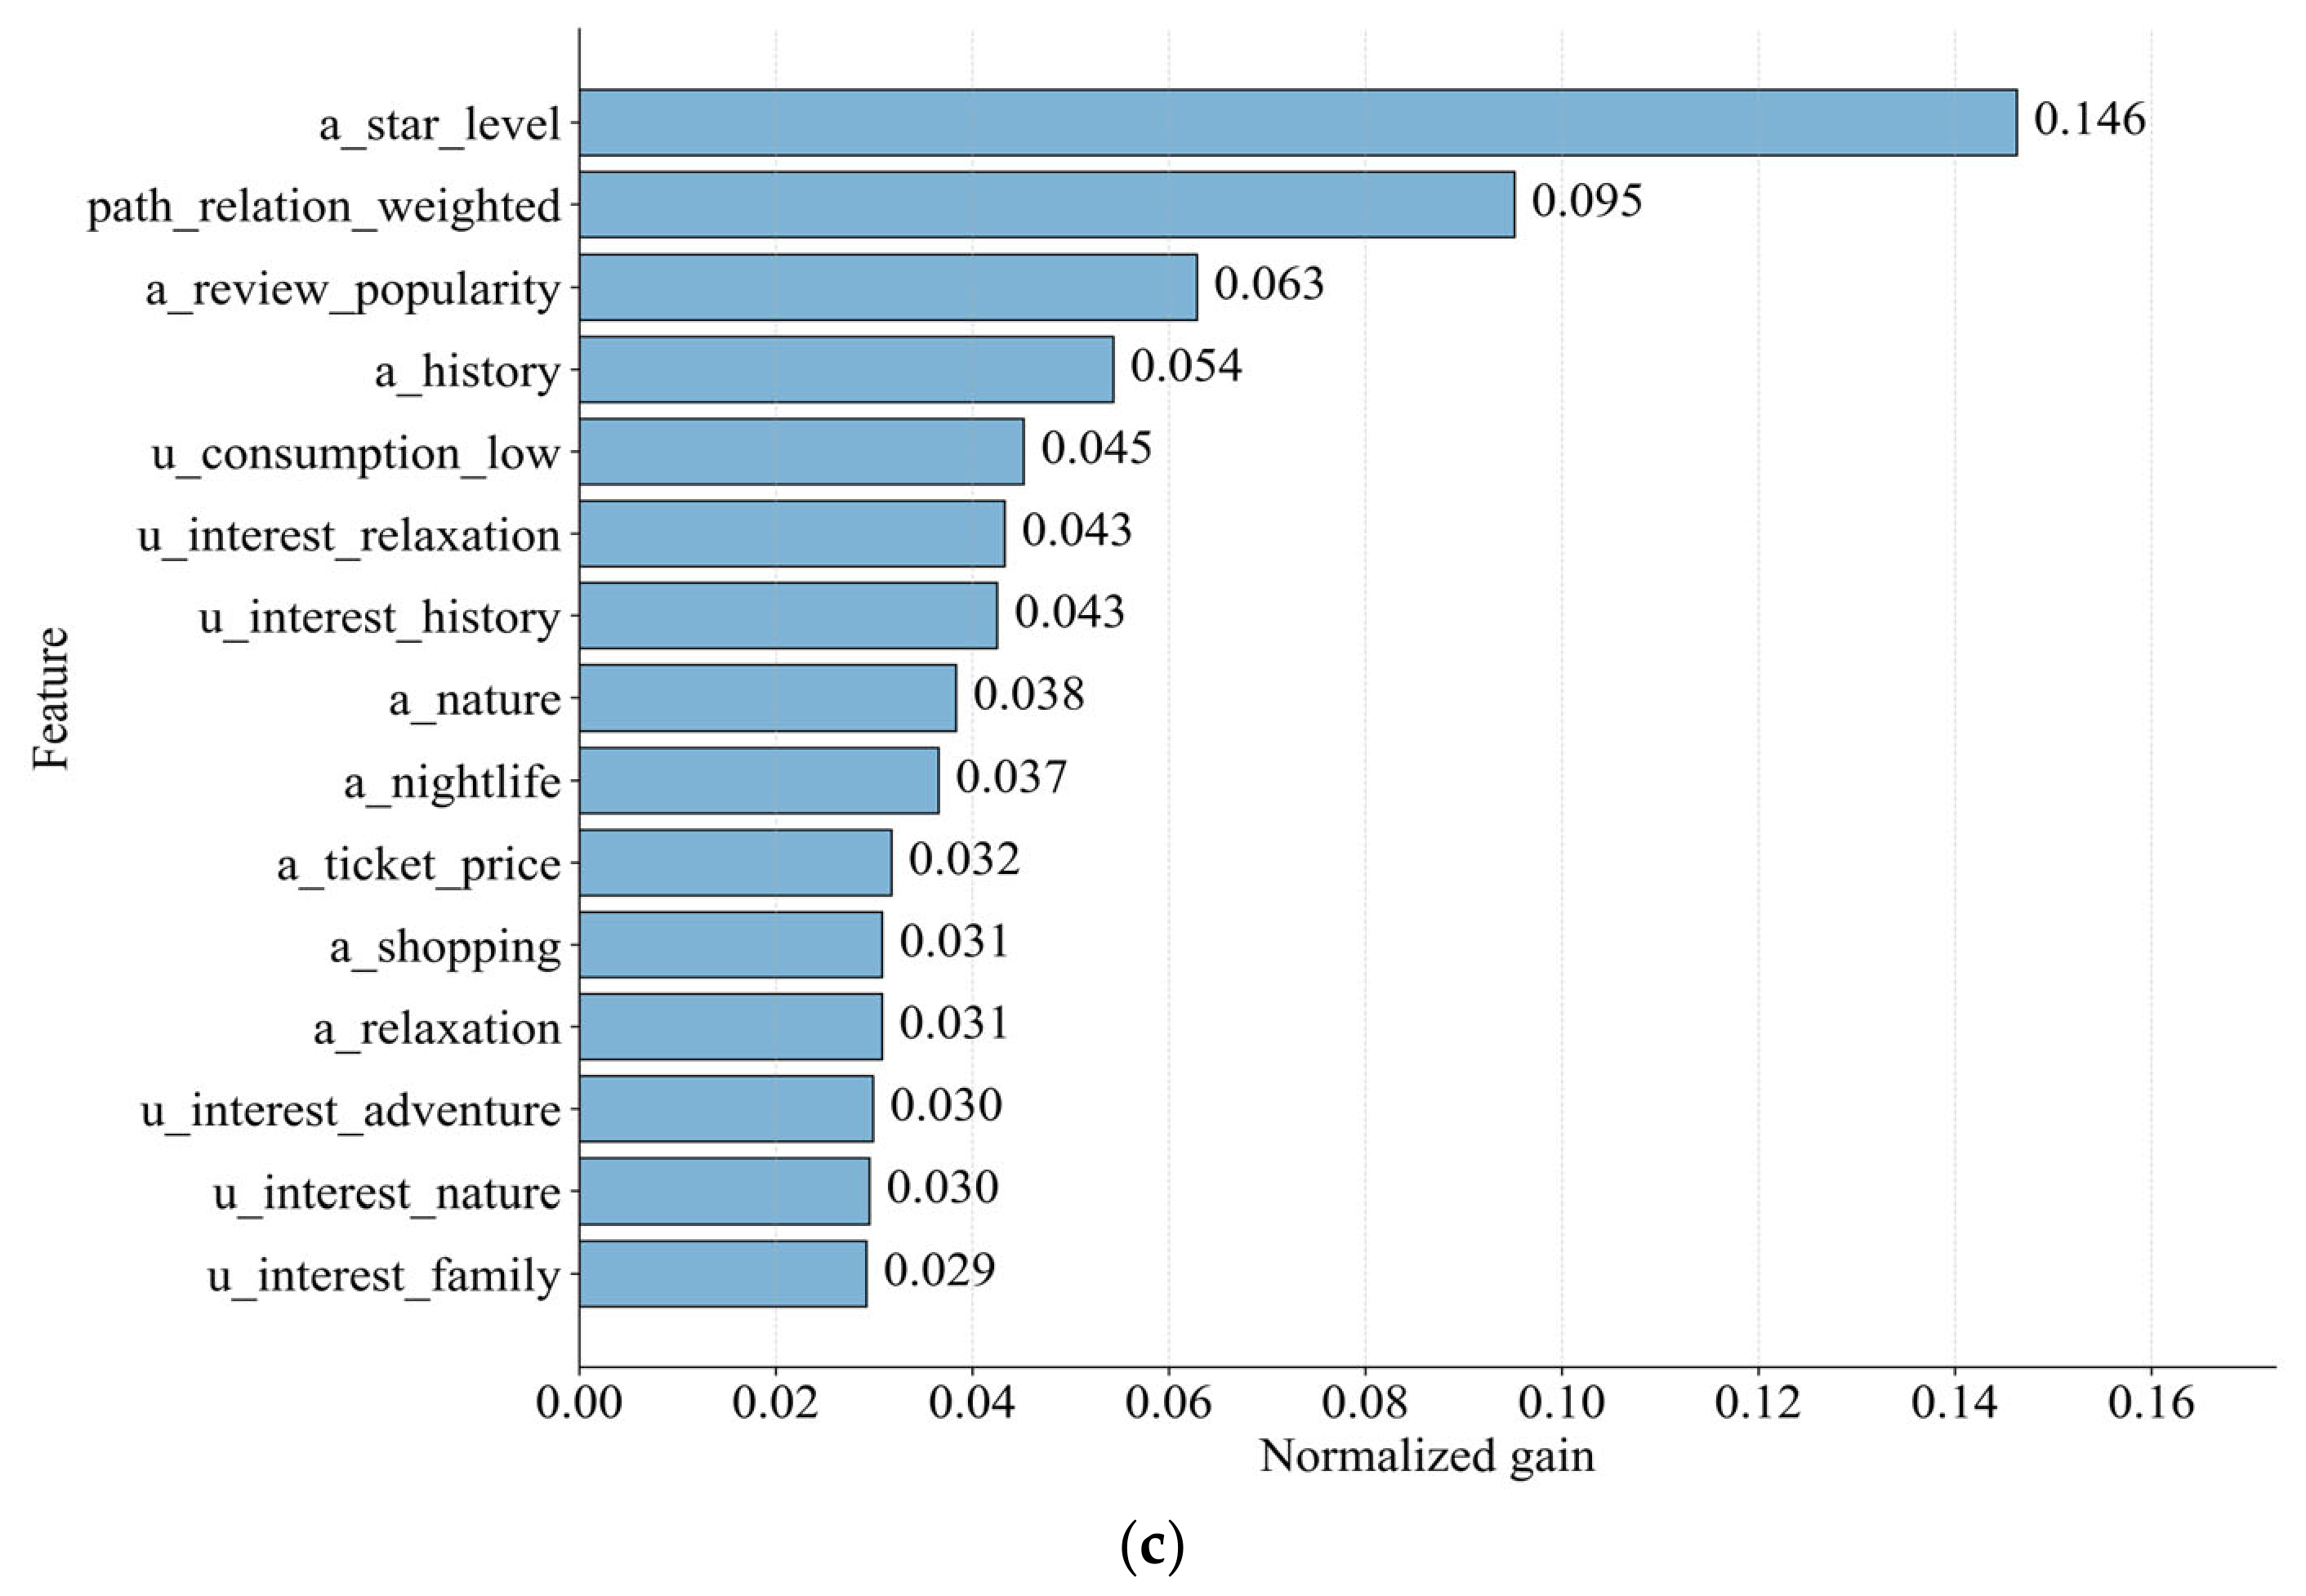
The trained model is interpreted using a representative decision tree, sample-level TreeSHAP contributions, and gain-based global feature importance, which respectively illustrate an individual tree structure, the feature contributions to a specific recommendation, and the overall use of features across the ensemble.
4.4. Candidate Re-Ranking and Top-K Recommendation Generation
For user i and candidate attraction j, the raw ensemble score is converted into a visit probability:
Given the candidate set, attractions are ranked in descending order of , and the first K items form the Top-K recommendation list. The relation-weighted path score is not applied as an additional post-processing rule; instead, it enters Xij together with the dynamic user and attraction profiles and affects the ranking through the learned XGBoost function.
5. Experimental Results and Analysis
5.1. Parameter Selection
Before optimizing the XGBoost hyperparameters, a sensitivity analysis was conducted for the temporal decay coefficient β and the long–short-term fusion coefficient γ. The candidate values were β ∈ {0, 0.001, 0.003, 0.005, 0.01, 0.02, 0.05} and γ ∈ {0, 0.25, 0.5, 0.75, 1.0}, resulting in 35 parameter combinations. All combinations were evaluated on the fixed training set using five-fold stratified group cross-validation, while feature composition, data partition, and XGBoost configuration remained unchanged. The test set was not involved in parameter selection.
The mean cross-validation F1-scores of the 35 combinations ranged from 0.7868 to 0.8015. The numerically highest mean F1-score was obtained at β = 0.005 and γ = 0, whereas the configuration β = 0.001 and γ = 0.75 achieved a nearly identical F1-score of 0.8011 ± 0.0346, differing by only 0.0004. The latter configuration also yielded a higher Recall of 0.8423 and a higher ROC–AUC of 0.9237, together with a lower F1 standard deviation. Considering these results together with the need to retain both long- and short-term preference components, β = 0.001 and γ = 0.75 were selected as a balanced parameter setting rather than the uniquely optimal combination.
After fixing the temporal preference parameters, the XGBoost hyperparameters were selected on the development data without using the test set. The final configuration is presented in Table 8.
Table 8.
Final parameter configuration of the proposed framework.
5.2. Comparison with Contemporary Recommender Models
The proposed framework was compared with GRU4Rec [39], SASRec [7], BERT4Rec [6], and LightGCN [40], which represent recurrent, self-attention-based, bidirectional Transformer-based, and graph collaborative recommendation approaches. All models ranked the same candidate attractions from an identical candidate pool, and results are reported as mean ± standard deviation. Table 9 reports the detailed comparison results.
Table 9.
The comparison with contemporary recommendation models.
The proposed framework achieved the highest numerical Top-5 results and showed lower variability across random seeds than the four baseline models. BERT4Rec obtained the highest Top-10 results, whereas the proposed framework ranked second. This pattern indicates that the proposed framework is competitive for compact recommendation lists under the current data setting, while BERT4Rec retains an advantage when the list length is increased.
The bootstrap 95% confidence interval of the proposed framework’s F1@5 was [0.2325, 0.3071]. After Holm correction, its F1@5 was significantly higher than those of SASRec, GRU4Rec, and LightGCN, with adjusted p-values of 0.0142, 0.0070, and 0.0002, respectively. The numerical difference from BERT4Rec was not statistically significant (p = 0.0830). At K = 10, the difference between BERT4Rec and the proposed framework was also not statistically significant (p = 0.5648).
5.3. Ablation and Path-Sensitivity Analysis
To clarify the complementary roles of the main information sources, four ablation variants were constructed. Exp1 removed the ten-dimensional dynamic interest features and ten-dimensional attraction perceptual attributes; Exp2 removed the travel-context, consumption, and basic attraction attributes; Exp3 removed the three temporal attraction attributes; and Exp4 removed the relation-weighted path score. All variants used the same data partitions and XGBoost configuration as the full model. Table 10 presents the ablation experiment results.
Table 10.
Results of the ablation experiments.
The full model obtained the highest Precision@5, Recall@5, and F1@5, and removing any of the four evaluated feature groups produced a numerical decrease in F1@5. In particular, removing the relation-weighted path feature reduced F1@5 from 0.2714 ± 0.0063 to 0.2690 ± 0.0025. Although the pairwise F1@5 differences did not remain statistically significant after Holm correction, the consistent Top-5 advantage of the full model indicates that the framework benefits from complementary information rather than depending on a single dominant feature group. The relatively small and partly reversed differences at K = 10 further suggest that the contribution of the integrated features is concentrated near the front of the recommendation list.
The path feature performs a function that is not fully measured by target-hit-based Top-K metrics. Precision@K, Recall@K, and F1@K record whether the observed target enters a recommendation list, but they do not evaluate whether the recommended attractions are explicitly connected to the user’s historical activities. An additional path-sensitive analysis was therefore conducted to examine whether the Event Evolutionary Graph provides valid behavioral evidence and improves the internal behavioral coherence of the ranked list. Table 11 presents the results of this path-sensitive analysis.
Table 11.
Test-set comparison of ranking quality and path-behavior consistency.
Independent examination of the path signal showed that the relation-weighted path score distinguished observed targets from negative candidates with a ROC–AUC of 0.7811, and 73.33% of the observed test targets were connected to users’ historical behaviors through valid graph paths. These results indicate that the extracted paths contain discriminative behavioral information beyond incidental graph connectivity.
After the path feature was introduced into the re-ranking model, F1@5 increased numerically from 0.2690 ± 0.0025 to 0.2714 ± 0.0063. MRR, Hit@1, and NDCG@5 also increased numerically, indicating a tendency to place observed or behaviorally associated targets closer to the front of the recommendation list. The Top-5 path coverage increased by 4.78 percentage points, while the Top-10 path coverage increased by 3.44 percentage points. The average relation-weighted path strength of the recommended attractions also increased significantly at both cutoffs. These results indicate that path reasoning provides a modest contribution to target-hit accuracy while primarily changing the composition of the ranked list by favoring attractions supported by explicit sequential or co-visitation evidence.
The two components consequently play different roles: dynamic user and attraction profiles represent current preference relevance, whereas path behavior reasoning supplies explicit evidence of behavioral continuity. Their contributions are complementary rather than interchangeable.
5.4. Recommendation Case and Model Interpretation
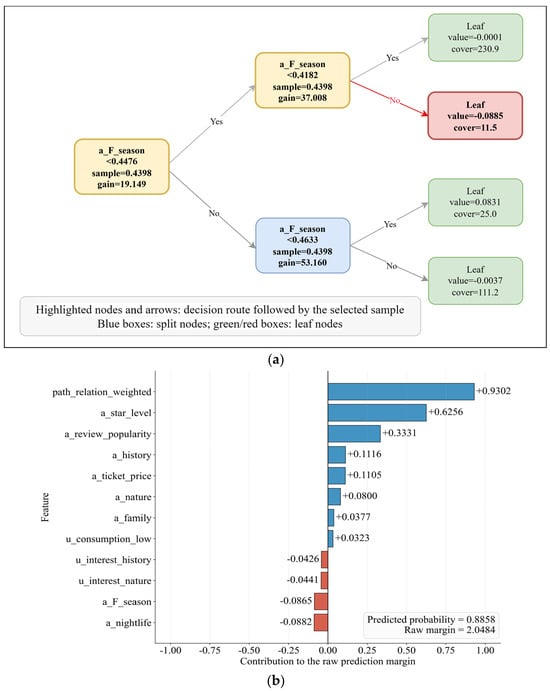
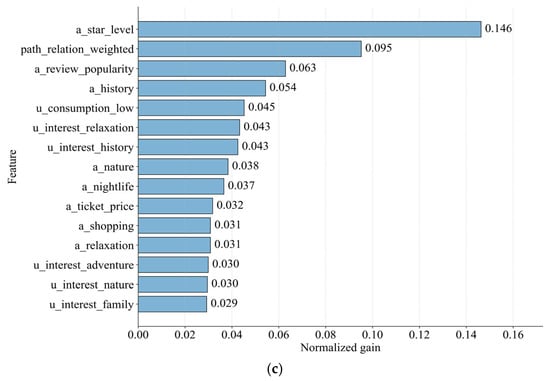
The XGBoost re-ranking process was examined using a correctly recommended user–attraction pair. In this case, the Hubei Provincial Museum was ranked first with a predicted visit probability of 0.8858. Figure 6 presents a representative decision tree, sample-level TreeSHAP contributions, and gain-based global feature importance.
Figure 6.
Interpretation of the XGBoost re-ranking process: (a) representative decision tree and the branch sequence traversed by the selected user–attraction pair; (b) sample-level TreeSHAP contributions; and (c) global feature importance measured by normalized gain.
As shown in Figure 6a, the selected sample passed through two splits based on seasonal intensity and reached a leaf value of −0.0885. The negative contribution illustrates that the displayed tree represents only one component of the ensemble rather than the complete recommendation decision. Figure 6b shows that the relation-weighted path score made the largest positive contribution to the complete prediction, followed by attraction administrative rating and review popularity. These variables also appeared among the influential features in Figure 6c.
6. Discussion
6.1. Methodological Interpretation
The comparison with contemporary recommender models indicates that the proposed framework and sequence-based methods rely on different forms of evidence. SASRec and BERT4Rec mainly learn latent dependencies from ordered interactions [6,7], whereas recent situation-aware research emphasizes users’ current goals, constraints, and environmental conditions [31]. The proposed framework extends this perspective by jointly incorporating dynamic user preferences, changing attraction states, and explicit NEXT and CO_VISITED relations. Its higher Top-5 values, together with the nonsignificant difference from BERT4Rec, indicate competitiveness for compact recommendation lists under the present setting. More importantly, the results show that explicit profile and event-path features provide a viable alternative to purely latent sequence representations when recommendation relevance and inspectable behavioral evidence need to be considered together. From a place-based analytical perspective, the framework models the relational topology of transitions among tourism places. It should not be interpreted as a coordinate-based GIS model or a metric spatial recommendation method. Rather, it provides a relational representation of transitions among identifiable tourism places that can complement metric GIS analyses of distance, accessibility, and route structure.
The profile-related findings are consistent with context-aware tourism studies that incorporate situational conditions into personalized cultural-experience recommendation [33]. The proposed framework differs from predominantly user-centered or context-centered approaches by representing both sides of the recommendation process. Dynamic user profiles describe preference evolution and travel context, while dynamic attraction profiles describe perceptual semantics and short-term attraction states in a corresponding feature space. Although no single feature group produced an independently significant gain, this dual-side representation provides a coordinated mechanism for aligning evolving tourist demands with attraction semantics and temporal availability. The ablation results therefore support the combined use of these features, although they do not justify attributing the overall performance to any single module.
Graph-based and temporal knowledge-graph recommenders commonly represent high-order or time-dependent relations through learned embeddings [25,26,27,28]. The Event Evolutionary Graph instead preserves inspectable event-level paths and converts their relation strengths into an explicit scoring feature. The path feature produced modest numerical improvements in both F1@5 and F1@10; in particular, F1@5 increased from 0.2690 ± 0.0025 to 0.2714 ± 0.0063. Although the pairwise F1 differences did not remain statistically significant after Holm correction, the relation-weighted path score distinguished observed targets from negative candidates with a ROC–AUC of 0.7811 and significantly increased path coverage and mean path strength. These findings indicate that the path feature contributes modestly to target ranking while also introducing an additional recommendation-quality dimension: whether highly ranked attractions are supported by explicit sequential or co-visitation evidence. The TreeSHAP and decision-tree analyses further demonstrate that this evidence can be examined together with profile and attraction features for an individual recommendation.
6.2. Practical Implications and Limitations
The framework can be integrated into an existing tourism platform as an interpretable re-ranking layer without replacing its candidate-generation system. Updated travel notes, reviews, and validated visit events can refresh the profiles and Event Evolutionary Graph, while historical paths and feature contributions can support recommendation explanation and provide supplementary evidence for attraction promotion or visitor-flow monitoring. This modular design constitutes a practical advantage because it allows semantic, temporal, and behavioral evidence to be introduced into an existing recommendation workflow with relatively clear functional boundaries. Nevertheless, the framework depends on sufficient textual evidence, review histories, and graph connections, and may be less effective for cold-start users, newly added attractions, or candidates without valid historical paths. Cross-city transfer, online effectiveness, scalable graph retrieval, broader comparisons with temporal knowledge-graph and path-reasoning recommenders, privacy, fairness, and real-time deployment remain to be evaluated [32].
7. Conclusions
This study proposed a place-transition-aware tourism recommendation framework that integrates dual-side dynamic profiling, Event Evolutionary Graph-based path behavior reasoning, and XGBoost re-ranking. Dynamic user profiles describe changes in tourist interests, travel context, and consumption preferences, while dynamic attraction profiles represent attraction semantics, basic attributes, and temporal states. The relation-weighted path score represents the topological associations formed by sequential visit transitions and co-visitation relations among tourism places. These associations are behavioral and place-based rather than coordinate- or distance-based.
On the Wuhan dataset, the proposed framework achieved the highest Precision@5, Recall@5, and F1@5 among the evaluated models. Its F1@5 was significantly higher than those of GRU4Rec, SASRec, and LightGCN, whereas the difference from BERT4Rec was not statistically significant. BERT4Rec obtained slightly higher Top-10 results, but the difference was also not significant. These results show that the proposed framework is competitive when the recommendation list is relatively short, while its advantage over bidirectional sequential models remains dependent on the evaluation setting.
The ablation results suggest that dynamic interest, travel-context, consumption, attraction, and temporal features provide complementary information for candidate ranking, although the contribution of each feature group was not independently significant. Removing the relation-weighted path feature reduced F1@5 from 0.2714 ± 0.0063 to 0.2690 ± 0.0025. The path score also achieved a ROC–AUC of 0.7811 and increased Top-5 path coverage from 0.5997 to 0.6475. These findings indicate that the path feature provides a modest numerical contribution to target ranking while increasing the proportion of recommended attractions supported by explicit sequential or co-visitation evidence and providing additional information for interpreting individual recommendations.
The current findings are limited to a moderate-scale offline dataset from a single city. Further research is needed to examine cross-city transferability, cold-start conditions, scalable graph retrieval, and online recommendation performance. Within the present experimental setting, the study provides a feasible way to combine evolving user preferences, attraction-state information, and explicit behavioral-path evidence in an interpretable tourism recommendation process.
Author Contributions
Conceptualization, W.X.; methodology, W.X.; validation, W.X. and Z.D.; formal analysis, R.W. and W.W.; investigation, W.X. and Z.D.; resources, W.L.; data curation, W.X. and R.W.; writing—original draft preparation, W.X.; writing—review and editing, W.X. and W.L.; visualization, W.X. and Z.D.; supervision, W.L.; project administration, W.L.; funding acquisition, W.L. All authors have read and agreed to the published version of the manuscript.
Funding
This research was funded by the Wuhan Key Research and Development Program (Technology Innovation Project), grant number 2024050702030122, titled “Intelligent Collaborative Governance Platform for Urban Tourism Industry Based on Behavior Perception”.
Institutional Review Board Statement
Ethical review and approval were waived for this study based on applicable Chinese laws and regulations. According to Article 13(6) of the Personal Information Protection Law of the People’s Republic of China, separate individual consent is not required when reasonably processing personal information publicly disclosed by natural persons for academic research purposes. In addition, Article 1036(2) of the Civil Code of the People’s Republic of China states that researchers shall not bear civil liability for reasonably processing publicly available information voluntarily disclosed by individuals. The present study involves only the secondary analysis of publicly available online tourism texts and attraction-related data. All data were anonymized and de-identified prior to analysis, and no identifiable personal information was used. Therefore, ethics committee approval was not required for this study.
Informed Consent Statement
Not applicable.
Data Availability Statement
Data supporting the results reported in this article were collected from publicly accessible user-generated content on mainstream tourism and social media platforms. All data were legally and manually gathered under ethical principles, with no violation of user privacy, personal information, or copyright regulations. Data were used exclusively for non-commercial academic research purposes only. Owing to privacy and ethical restrictions, as well as platform terms of service, the raw data are not publicly available. However, data can be made available from the corresponding author upon reasonable request.
Conflicts of Interest
The authors declare no conflicts of interest.
References
- Hamid, R.A.; Albahri, A.S.; Alwan, J.K.; Al-Qaysi, Z.; Albahri, O.; Zaidan, A.; Alnoor, A.; Alamoodi, A.; Zaidan, B. How smart is e-tourism? A systematic review of smart tourism recommendation system applying data management. Comput. Sci. Rev. 2021, 39, 100337. [Google Scholar] [CrossRef] [Scilit]
- Solano-Barliza, A.; Arregocés-Julio, I.; Aarón-Gonzalvez, M.; Zamora-Musa, R.; De-La-Hoz-Franco, E.; Escorcia-Gutierrez, J.; Acosta-Coll, M. Recommender systems applied to the tourism industry: A literature review. Cogent Bus. Manag. 2024, 11, 2367088. [Google Scholar] [CrossRef] [Scilit]
- Ricci, F.; Rokach, L.; Shapira, B. Recommender systems: Techniques, applications, and challenges. In Recommender Systems Handbook; Springer: Berlin/Heidelberg, Germany, 2021; pp. 1–35. [Google Scholar] [CrossRef] [Scilit]
- Quadrana, M.; Cremonesi, P.; Jannach, D. Sequence-aware recommender systems. ACM Comput. Surv. 2018, 51, 1–36. [Google Scholar] [CrossRef] [Scilit]
- Wang, S.; Hu, L.; Wang, Y.; Cao, L.; Sheng, Q.Z.; Orgun, M. Sequential recommender systems: Challenges, progress and prospects. arXiv 2019, arXiv:2001.04830. [Google Scholar]
- Sun, F.; Liu, J.; Wu, J.; Pei, C.; Lin, X.; Ou, W.; Jiang, P. BERT4Rec: Sequential recommendation with bidirectional encoder representations from transformer. In Proceedings of the 28th ACM International Conference on Information and Knowledge Management; ACM: New York, NY, USA, 2019; pp. 1441–1450. [Google Scholar] [CrossRef] [Scilit]
- Kang, W.-C.; McAuley, J. Self-Attentive Sequential Recommendation. In Proceedings of the 2018 IEEE International Conference on Data Mining (ICDM), Singapore, 17–20 November 2018; pp. 197–206. [Google Scholar]
- Lyu, Z.; Wu, Y.; Lai, J.; Yang, M.; Li, C.; Zhou, W. Knowledge enhanced graph neural networks for explainable recommendation. IEEE Trans. Knowl. Data Eng. 2022, 35, 4954–4968. [Google Scholar]
- Anand, V.; Maurya, A.K. A Survey on Recommender Systems Using Graph Neural Networks. ACM Trans. Inf. Syst. 2025, 43, 1–49. [Google Scholar]
- Guo, Q.; Zhuang, F.; Qin, C.; Zhu, H.; Xie, X.; Xiong, H.; He, Q. A survey on knowledge graph-based recommender systems. IEEE Trans. Knowl. Data Eng. 2020, 34, 3549–3568. [Google Scholar] [CrossRef] [Scilit]
- Chicaiza, J.; Valdiviezo-Diaz, P. A comprehensive survey of knowledge graph-based recommender systems: Technologies, development, and contributions. Information 2021, 12, 232. [Google Scholar] [CrossRef] [Scilit]
- Rajabi, E.; Etminani, K. Knowledge-graph-based explainable AI: A systematic review. J. Inf. Sci. 2024, 50, 1019–1029. [Google Scholar] [CrossRef] [Scilit] [PubMed]
- Zhang, Y.; Chen, X. Explainable recommendation: A survey and new perspectives. Found. Trends Inf. Retr. 2020, 14, 1–101. [Google Scholar] [CrossRef] [Scilit]
- Ai, Q.; Azizi, V.; Chen, X.; Zhang, Y. Learning heterogeneous knowledge base embeddings for explainable recommendation. Algorithms 2018, 11, 137. [Google Scholar] [CrossRef] [Scilit]
- Devlin, J.; Chang, M.W.; Lee, K.; Toutanova, K. BERT: Pre-training of deep bidirectional transformers for language understanding. In Proceedings of the 2019 Conference of the North American Chapter of the Association for Computational Linguistics; Association for Computational Linguistics: Minneapolis, MN, USA, 2019; pp. 4171–4186. [Google Scholar]
- Liu, D.; He, M.; Luo, J.; Lin, J.; Wang, M.; Zhang, X.; Pan, W.; Ming, Z. User-event graph embedding learning for context-aware recommendation. In Proceedings of the 28th ACM SIGKDD Conference on Knowledge Discovery and Data Mining; Association for Computing Machinery: New York, NY, USA, 2022; pp. 1051–1059. [Google Scholar] [CrossRef] [Scilit]
- Zhou, B.; Hua, B.; Gu, X.; Lu, Y.; Peng, T.; Zheng, Y.; Shen, X.; Bao, J. An end-to-end tabular information-oriented causality event evolutionary knowledge graph for manufacturing documents. Adv. Eng. Inform. 2021, 50, 101441. [Google Scholar] [CrossRef] [Scilit]
- Ding, X.; Li, Z.; Liu, T.; Liao, K. ELG: An event logic graph. arXiv 2019, arXiv:1907.08015. [Google Scholar]
- Zhao, Y.; Wang, X.; Chen, J.; Wang, Y.; Tang, W.; He, X.; Xie, H. Time-aware path reasoning on knowledge graph for recommendation. ACM Trans. Inf. Syst. 2022, 41, 1–26. [Google Scholar] [CrossRef] [Scilit]
- Wu, W.; Ghazali, M.; Huspi, S.H. A review of user profiling based on social networks. IEEE Access 2024, 12, 122642–122670. [Google Scholar] [CrossRef] [Scilit]
- Huang, J. Personalized recommendation method for cultural creative products in tourism cities based on user profiles. Procedia Comput. Sci. 2024, 243, 1133–1142. [Google Scholar] [CrossRef] [Scilit]
- Wu, Y.; Li, K.; Zhao, G.; Qian, X. Personalized long- and short-term preference learning for next POI recommendation. IEEE Trans. Knowl. Data Eng. 2020, 34, 1944–1957. [Google Scholar] [CrossRef] [Scilit]
- Wang, R.; Wang, S.; Lu, W.; Peng, X.; Zhang, W.; Zheng, C.; Qiao, X. Intention-aware user modeling for personalized news recommendation. In Proceedings of the International Conference on Database Systems for Advanced Applications; Springer Nature: Cham, Switzerland, 2023; pp. 179–194. [Google Scholar]
- Nie, W.; Wen, X.; Liu, J.; Chen, J.; Wu, J.; Jin, G.; Lu, J.; Liu, A.-A. Knowledge-enhanced causal reinforcement learning model for interactive recommendation. IEEE Trans. Multimed. 2023, 26, 1129–1142. [Google Scholar] [CrossRef] [Scilit]
- Pu, D.; Zhang, Y.; Qian, Z.; Xie, G.; Pu, D. A Graph Neural Network Recommendation Algorithm Based on Multi-Scale Attention and Contrastive Learning. Sci. Rep. 2025, 15, 32207. [Google Scholar] [CrossRef] [Scilit] [PubMed]
- Wang, Z.; Li, A. Temporal knowledge graph reasoning: A survey. In Proceedings of the 2025 IEEE 10th International Conference on Data Science in Cyberspace, Baoding, China, 15–17 August 2025; pp. 78–85. [Google Scholar]
- Ren, H.; Cui, L. Recommendation System Based on Temporal Knowledge Graph Path Reasoning. In Proceedings of the 2023 International Conference on Power, Communication, Computing and Networking Technologies; Association for Computing Machinery: New York, NY, USA, 2023; pp. 1–5. [Google Scholar]
- Zhang, Y.; He, Z.; Lou, Y.; Long, H.; Gao, F. Temporal Knowledge Graph Recommendation with Sequence-Aware and Path Reasoning. Data Knowl. Eng. 2025, 161, 102522. [Google Scholar] [CrossRef] [Scilit]
- Wu, L.; Zheng, Z.; Qiu, Z.; Wang, H.; Gu, H.; Shen, T.; Qin, C.; Zhu, C.; Zhu, H.; Liu, Q.; et al. A Survey on Large Language Models for Recommendation. World Wide Web 2024, 27, 60. [Google Scholar] [CrossRef] [Scilit]
- Wang, Q.; Li, J.; Wang, S.; Xing, Q.; Niu, R.; Kong, H.; Li, R.; Long, G.; Chang, Y.; Zhang, C. Towards Next-Generation LLM-Based Recommender Systems: A Survey and Beyond. arXiv 2024, arXiv:2410.19744. [Google Scholar]
- Aliberti, L.; D’Aniello, G.; Gaeta, M. Situation-aware recommender systems: A systematic review and framework for trustworthy recommendations. Artif. Intell. Rev. 2026, 59, 101. [Google Scholar] [CrossRef] [Scilit]
- Alharthi, S.; El-Saddik, A. Personalization in smart urban environments: A taxonomy and survey of recommender systems. Comput. Urban Sci. 2026, 6, 8. [Google Scholar] [CrossRef] [Scilit]
- Casillo, M.; Colace, F.; Conte, D.; Lombardi, M.; Santaniello, D.; Valentino, C. A context-aware recommender system-based framework for improving cultural experiences. User Model. User-Adapt. Interact. 2025, 36, 1. [Google Scholar] [CrossRef] [Scilit]
- Yang, Y.; Lv, H.; Chen, N. A survey on ensemble learning under the era of deep learning. Artif. Intell. Rev. 2023, 56, 5545–5589. [Google Scholar] [CrossRef] [Scilit]
- Dong, X.; Yu, Z.; Cao, W.; Shi, Y.; Ma, Q. A survey on ensemble learning. Front. Comput. Sci. 2020, 14, 241–258. [Google Scholar]
- Mienye, I.D.; Sun, Y. A survey of ensemble learning: Concepts, algorithms, applications, and prospects. IEEE Access 2022, 10, 99129–99149. [Google Scholar] [CrossRef] [Scilit]
- Zhang, P.; Jia, Y.; Shang, Y. Research and application of XGBoost in imbalanced data. Int. J. Distrib. Sens. Netw. 2022, 18, 15501329221106935. [Google Scholar] [CrossRef] [Scilit]
- Chen, T.; Guestrin, C. XGBoost: A scalable tree boosting system. In Proceedings of the 22nd ACM SIGKDD International Conference on Knowledge Discovery and Data Mining; Association for Computing Machinery: New York, NY, USA, 2016; pp. 785–794. [Google Scholar] [CrossRef] [Scilit]
- Hidasi, B.; Karatzoglou, A.; Baltrunas, L.; Tikk, D. Session-Based Recommendations with Recurrent Neural Networks. In Proceedings of the 4th International Conference on Learning Representations (ICLR), San Juan, Puerto Rico, 2–4 May 2016. [Google Scholar]
- He, X.; Deng, K.; Wang, X.; Li, Y.; Zhang, Y.; Wang, M. LightGCN: Simplifying and Powering Graph Convolution Network for Recommendation. In Proceedings of the 43rd International ACM SIGIR Conference on Research and Development in Information Retrieval (SIGIR ’20); Association for Computing Machinery: New York, NY, USA, 2020; pp. 639–648. [Google Scholar] [CrossRef] [Scilit]

Disclaimer/Publisher’s Note: The statements, opinions and data contained in all publications are solely those of the individual author(s) and contributor(s) and not of MDPI and/or the editor(s). MDPI and/or the editor(s) disclaim responsibility for any injury to people or property resulting from any ideas, methods, instructions or products referred to in the content. |
© 2026 by the authors. Licensee MDPI, Basel, Switzerland. This article is an open access article distributed under the terms and conditions of the Creative Commons Attribution (CC BY) license.