


Abstract
Decision-making in cyber defense exercises (CDX) is shaped by technical, emotional, motivational, and collaborative human factors under uncertainty and time pressure. This study proposes a human-centered Adaptive Neuro-Fuzzy Inference System (ANFIS) framework to model and predict Counterfactual Decision Reflection (CDR) outcomes in CDX environments. Two complementary datasets representing technical, emotional, motivational, and teamwork-related dimensions were collected from the international Lithuanian Armed Forces cyber defense exercise Amber Mist 2024 and analyzed using Spearman correlation, 3D regression surface modeling, fuzzy rule extraction, and ANFIS prediction to investigate the relationship between human factors and CDR. The results demonstrated that teamwork, communication, and collaboration have a stronger influence on decision stability than isolated technical competencies. Baseline ANFIS evaluation indicated that triangular membership functions provided the best generalization, while generalized bell functions achieved the lowest training errors. To improve model robustness, multiple synthetic data augmentation methods were evaluated. The augmented ANFIS models substantially improved predictive performance, reducing testing error values significantly. The findings confirm that synthetic-data-enhanced neuro-fuzzy modeling provides an effective and interpretable framework for analyzing human-centered cybersecurity decision-making processes in cyber defense exercises.
1. Introduction
The increasing complexity of cyber threats, the growing sophistication of attack vectors, and the accelerated digitalization of critical infrastructures have significantly increased the importance of human-centered cybersecurity capabilities [1,2,3,4,5,6,7,8,9,10,11,12,13,14,15,16]. While technological solutions such as intrusion detection systems, firewalls, and automated response mechanisms have significantly improved defensive capabilities, empirical evidence increasingly highlights that the human factor remains a key determinant in cybersecurity outcomes [2,3,4,5,6,7,8,9,10]. In highly dynamic cybersecurity environments, specialists are required to process incomplete information, operate under severe time constraints, coordinate within multidisciplinary teams, and continuously adapt their decisions in response to rapidly evolving situations [11,12,13]. Consequently, understanding the mechanisms that shape human decision-making in cyber defense exercises (CDX) has become an important research challenge in both cybersecurity and human-factor analytics [11,12,13,14,15,16,17,18,19,20].
Cyber defense exercises provide controlled, realistic environments for evaluating technical competencies, teamwork, communication, situational awareness, and decision-making performance under operational stress conditions [4,5,6,7,8,9,10,11]. Unlike traditional cybersecurity assessments focused primarily on technical outcomes, CDX environments enable the investigation of behavioral and psychological dimensions influencing cyber defense effectiveness [1,12,13,14,15,16,17,18,19,20]. Previous studies have demonstrated that stress, fatigue, communication quality, cognitive workload, collaboration, leadership, and emotional regulation significantly affect decision quality and operational performance in cybersecurity contexts [2,3,4,5,6,7,8,11,12,13,16,21,22,23,24,25]. However, despite the growing recognition of human-centric cybersecurity research, many existing studies still rely on conventional statistical approaches or isolated technical metrics that insufficiently capture the non-linear and context-dependent nature of human decision behavior [2,3,4,13,23,26,27].
Decision-making in cyber defense environments represents a complex phenomenon because it emerges from the interaction of multiple heterogeneous variables [4,5,6,7,8,9,10,11,12,13,14,15,16,17,18,19,20,21,22]. These variables often exhibit uncertainty, ambiguity, and nonlinear relationships that are difficult to model using traditional deterministic methods [28,29,30]. Furthermore, cybersecurity behavioral datasets are frequently characterized by small sample sizes, sparse observations, and ordinal-scale measurements, which additionally complicate reliable prediction and interpretation [10,12,16]. Therefore, there is a need for intelligent modeling approaches capable of simultaneously handling uncertainty, nonlinear dependencies, and interpretability requirements [31,32,33,34,35,36,37,38,39,40,41,42,43].
Fuzzy logic–based methods have been widely applied in complex decision-making environments due to their ability to model uncertainty, nonlinear relationships, and human-centered reasoning processes [31,43,44]. Adaptive Neuro-Fuzzy Inference System (ANFIS) models provide a suitable methodological framework for addressing these challenges because they combine the learning capability of artificial neural networks with the transparency and interpretability of fuzzy logic systems [45,46,47,48]. ANFIS combines the linguistic interpretability of Takagi-Sugeno-Kang fuzzy inference with the adaptive parameter learning of neural networks and enables the modeling of complex nonlinear relationships between human-factor variables and decision outcomes while preserving explainable rule-based inference structures [45]. Compared with conventional machine learning approaches, neuro-fuzzy systems are particularly advantageous in human-centered cybersecurity research because they can represent vague linguistic concepts through interpretable fuzzy membership functions and IF–THEN rules [44,45]. As a result, ANFIS has increasingly attracted attention in domains involving uncertainty, behavioral analytics, and decision-support modeling [47,48,49].
Nevertheless, the application of ANFIS to cybersecurity behavioral modeling remains limited, particularly in the context of cyber defense exercises. Existing studies do not investigate how combinations of technical, emotional, motivational, and collaborative factors influence reflective decision-making behavior in realistic cyber defense scenarios. Moreover, the problem of limited sample sizes remains insufficiently addressed in cybersecurity human-factor research, leading to unstable model generalization and overfitting. Synthetic data augmentation methods provide a potential solution for improving predictive robustness by increasing distributional diversity and reducing learning instability in small-scale datasets [50,51,52,53,54,55,56,57,58,59,60]. However, comparative evaluations of these augmentation approaches within neuro-fuzzy cybersecurity models remain unclear.
This study addresses these research gaps by proposing a human-centered neuro-fuzzy modeling framework for predicting decision reflection quality through Counterfactual Decision Reflection (CDR) outcomes in cyber defense exercises. The research utilizes two complementary datasets that were compiled from participants’ self-assessment responses during the international Lithuanian Armed Forces cyber defense exercise Amber Mist, conducted in 2024 in Vilnius, Lithuania. Dataset DS6 represents technical knowledge, professional experience, emotional state, communication, and collaboration variables, and dataset DS12 represents stress, motivation, trust, fatigue, leadership orientation, responsibility, teamwork, and collaboration dimensions. The dependent variable, Counterfactual Decision Reflection, represents the participant’s willingness to reconsider or revise previously made operational decisions during cyber defense exercises.
The main objective of the study is to investigate how human-factor interactions influence decision reflection processes in CDX environments and to evaluate the effectiveness of ANFIS-based predictive modeling under limited-data conditions. To achieve this objective, the study applies multiple fuzzy membership functions, including Gaussian, Generalized Bell, Triangular, and Trapezoidal configurations, and systematically compares their predictive performance using MAE, RMSE, and MAPE metrics. Furthermore, the study evaluates the impact of multiple synthetic data augmentation methods on model robustness and generalization capability.
This paper makes the following scientific contributions. First, the study provides an integrated human-factor analysis of cybersecurity decision-making by combining technical, emotional, motivational, and collaborative dimensions within a unified neuro-fuzzy framework. Second, the study demonstrates the applicability of explainable ANFIS modeling for capturing nonlinear and uncertain behavioral relationships in cyber defense environments. Third, the research systematically evaluates the effectiveness of synthetic data augmentation techniques and membership function types for improving predictive stability and reducing overfitting in small-sample cybersecurity behavioral datasets.
The remainder of the paper is organized as follows. Section 2 presents an overview and analysis of the related works, including investigations of human factors in cybersecurity, decision-making, fuzzy inference systems, and synthetic data augmentation approaches. Section 3 describes CDX, datasets, ANFIS configuration, fuzzy membership functions, and evaluation metrics. Section 4 presents the empirical results, including descriptive statistics, correlation analysis, 3D regression surface modeling, fuzzy rule extraction, baseline ANFIS evaluation, and augmented validation experiments. Section 5 discusses the implications of the obtained findings from both methodological and cybersecurity perspectives. Finally, Section 6 summarizes the main conclusions.
2. Related Works
Cyber defense exercises have been established as one of the most effective ways for developing practical cybersecurity competencies. They have evolved from simple technical assessments to complex, multi-dimensional training environments that evaluate both technical competencies and human factors. Seker et al. provided a comprehensive framework for CDX planning, execution, and evaluation, emphasizing the importance of structured approaches to exercise design [1]. This work highlights that effective CDX must balance technical challenge with realistic operational constraints while maintaining clear learning objectives. Steps for designing CDX were presented by Patriciu et.al. [27]. The authors defined the goals of CDX, such as improving specific skills, practical experience in various security-related tasks, and testing certain capabilities. They pointed out that an appropriate mechanism for gathering feedback from the participants must be implemented. Tobey proposed the Job Performance Modeling approach, which utilizes critical incident vignettes to model mission-critical cybersecurity roles and improve competence assessment [26]. Mäses et al. identified success factors for designing effective cybersecurity exercises focusing on incident response, proposing that exercise effectiveness depends on clearly defined scenarios, appropriate difficulty scaling, and meaningful feedback mechanisms [12,36]. Babayeva et al. contributed to exercise design by developing an ontology for cyber defense exercises, providing a structured vocabulary for describing exercise components, scenarios, and outcomes. This ontology facilitates more systematic exercise design and enables better comparison of results across different exercise implementations [10]. Research has also increasingly addressed methodological frameworks for evaluating participants’ performance during CDX. Brilingaitė et al. developed a framework for evaluating participant performance using questionnaires, interviews, and direct observation methods [39]. Hussain et al. investigated observation and evaluation congruence in cyber exercises [35], while Granåsen proposed combined evaluation methodologies integrating network logs, automated scoring, manual assessment, and observational analysis [13]. Khan proposed to use Kirkpatrick’s model for evaluating cybersecurity awareness training [61]. However, previous studies identified several limitations, including fragmented evaluation processes and insufficient integration of behavioral and emotional factors into assessment methodologies [37,38].
The role of human factors in cybersecurity has received increasing attention as organizations recognize that technological solutions alone cannot address sophisticated cyber threats. Ejiofor et al. examined training and awareness programs for cybersecurity analysts, emphasizing that effective security depends critically on human vigilance, decision-making capabilities, and continuous learning [21]. Hámornik and Krasznay provided a team-level perspective on human factors in cyber defense, identifying key dimensions including communication effectiveness, shared mental models, and role clarity [62]. Their research demonstrated that team performance in Security Operation Centers is strongly predicted by measures of collective cognition and coordination, rather than individual technical skills alone. Deline et al. focused specifically on team cognition in cyber defense contexts, examining how social support behaviors influence collective decision-making effectiveness [7,8]. Their findings suggest that successful cyber defense teams develop shared situation awareness through continuous communication and mutual support. Lugo et al. investigated the role of cognition, experience, and education in cyber threat identification, demonstrating that decision-making quality depends on both individual cognitive capabilities and experiential learning [16]. Ask et al. conducted a systematic review of human-human communication in cyber threat situations, revealing that communication patterns significantly influence response effectiveness and decision quality [4]. Hagen et al. examined cognitive biases and trust issues in AI-driven cybersecurity systems, highlighting how human decision-makers interact with automated tools [24]. Their research suggests that understanding cognitive biases is essential for designing systems that support rather than undermine human decision-making in cyber defense contexts.
Another important research direction concerns the integration of human-centered and emotional dimensions into cybersecurity decision-making analysis. Stress, motivation, fatigue, responsibility, desire to win, and interpersonal collaboration significantly influence decision quality during high-pressure cyber operations. Damasio and Carvalho emphasized that emotions and feelings constitute essential mechanisms of behavioral regulation and adaptive decision-making [40]. Kahneman’s dual-process theory provides a complementary cognitive lens, distinguishing between System 1—fast, automatic, and intuition-driven thinking—and System 2—slow, deliberate, and analytically driven thinking [41]. In CDX environments, participants frequently oscillate between these two modes, deploying rapid heuristic judgments under pressure while periodically engaging analytical reasoning for complex strategic decisions. Kannengiesser and Gero [20] extended dual-process theory to design thinking, establishing links between cognitive science and complex problem-solving domains, which directly informs CDX scenario design and competency modeling [42].
Advances in cybersecurity education research, artificial intelligence and fuzzy computing methods have gained considerable attention for modeling uncertainty and complex human behavior. Among these approaches, Adaptive Neuro-Fuzzy Inference Systems have demonstrated strong capabilities for prediction, classification, and decision-support tasks in cybersecurity applications. ANFIS combines the learning capability of artificial neural networks with the interpretability and uncertainty-handling mechanisms of fuzzy inference systems, making it particularly suitable for modeling human-centric decision processes characterized by nonlinear relationships [45]. Upadhyay et al. demonstrated that ANFIS outperforms traditional Fuzzy Inference Systems in predicting cybersecurity risk, utilizing input parameters such as authentication strength, traffic anomalies, and network load [63]. Bajeh et al. employed an ANFIS model to classify malware into multiple categories. The model achieved 94% classification accuracy with an RMSE of 0.19 [64]. However, the authors noted that classification performance degraded as dataset size increased, highlighting a key scalability limitation of ANFIS architectures in high-dimensional cybersecurity environments.
One of the methodological limitations in cybersecurity behavioral research is the relatively small size of experimentally collected datasets. Human-centered CDX studies often involve limited numbers of participants due to organizational, logistical, operational constraints and privacy restrictions. Small datasets may reduce model generalization capability and increase the risk of overfitting in machine learning and neuro-fuzzy systems. To address this challenge, synthetic data augmentation techniques have become increasingly important in recent artificial intelligence research. Data augmentation methods such as Synthetic Minority Oversampling Technique (SMOTE), Adaptive Synthetic Sampling (ADASYN), Gaussian Copula modeling, Conditional Tabular Generative Adversarial Networks (CTGAN), and hybrid fuzzy-clustering approaches have been widely used to improve dataset balance, diversity, and predictive robustness in classification and forecasting tasks [50,51,52,53,54,55,56,57,58,59,60,61]. We adopted synthetic augmentation as a methodological component, generating training data that reflects the cognitive and emotional dynamics observed during CDX participation.
This study addresses research gaps by proposing a human-centered ANFIS model that ingests augmented synthetic CDX behavioral data, including human factors, emotional state indicators, and team collaboration metrics, to predict and explain Counterfactual Decision Reflection in cyber defense scenarios. The proposed framework contributes to the development of interpretable and adaptive cybersecurity competence assessment methodologies capable of capturing both technical and behavioral dimensions of participant performance and contributes to intelligent systems literature.
3. Materials and Methods
This section presents the methodological framework of the study and consists of the following parts: CDX and human factor overview, the data collection instrument and two data sets description, ANFIS architecture, model training and evaluation. The present study adopts a quantitative, model-based design in which empirical data collected from CDX participants are used to train and validate an ANFIS predictive model of decision-making quality. Human decision-making is complex and cannot be fully captured by quantitative methods. However, we assume that meaningful patterns in decision quality can still be identified and modeled to produce useful predictions and insights. Fuzzy logic is used to support this approach, as it allows human factors to be represented in a more practical way. Instead of forcing them into strict categories, fuzzy sets capture their continuous, overlapping, and often linguistically expressed nature, preserving their meaning more accurately [31,43].
3.1. CDX Context and Human Factor
Cyber defense exercises are a practical way to learn how to increase the cyber resilience of an organization and to prepare the team for a potential cyber threat or attack [1,6,8,10,12,13,14,15,16,17]. Figure 1 illustrates the conceptual structure and interaction model of a cyber defense exercise, highlighting the roles and relationships among participating teams. The Blue Team (BT) operates as the defensive unit responsible for protecting critical infrastructure, detecting and responding to attacks, and maintaining system resilience through coordinated decision-making. In contrast, the Red Team (RT) simulates adversarial behavior by identifying vulnerabilities and executing realistic attack scenarios, including social engineering and physical security testing. The Green Team (GT) provides technical infrastructure support by simulating operational environments and ensuring system availability for defensive activities. The critical IT infrastructure shown in the center of Figure 1 serves as the primary asset targeted by the RT and protected by the BT. The Exercise Control group (EXCON) oversees the entire exercise, ensuring coordination, scenario management, and overall execution through planning and reporting functions. Within EXCON, the White Team (WT) is responsible for observing and judging participant performance, while the Evaluation (EVAL) team conducts systematic assessment and provides structured feedback. Communication flows, including tickets and reports, facilitate interaction between teams and support situational awareness and decision-making processes. Overall, the model reflects a dynamic and interdependent environment in which technical actions and human factors jointly influence the effectiveness of cyber defense operations.
Figure 1.
Conceptual structure of a cyber defense exercise.
In cyber defense exercises, decision-making represents a complex, multidimensional process that integrates not only technical proficiency but also cognitive, strategic, and behavioral factors. Figure 2 presents a structured model of the decision-making core process in CDX, emphasizing sequential stages and associated human factors. The process begins with situation awareness, in which the BT and GT develop an understanding of the operational environment through alertness, experience, intuition, analytical thinking, and agility. This stage is followed by threat identification, primarily conducted by the BT, where experience, collaboration, and communication play a critical role in recognizing potential cyber threats. Subsequently, impact assessment evaluates the potential consequences of identified threats, incorporating human factors such as stress, judgment, and risk perception. The fourth stage, response planning, involves selecting appropriate mitigation strategies, where decision fatigue, collaboration, and leadership significantly influence outcomes. Action execution follows, engaging both the BT and GT, and relies on professional skills, focus, and coordination to implement defensive measures effectively. The final stage, post-incident review, includes both the WT and EXCON, focusing on feedback culture, learning, and resilience development. The model highlights the iterative and interconnected nature of decision-making, where each stage influences subsequent actions and overall performance. Overall, the figure demonstrates how cognitive, emotional, and organizational human factors are embedded throughout the CDX decision-making lifecycle.
Figure 2.
Model of the decision-making core process in cyber defense exercises.
3.2. CDX Data Collection Instrument
The data used in this study were collected from participants of the international Lithuanian Armed Forces cyber defense exercise “Amber Mist 2024”. It is an annual international cyber defense exercise coordinated by the Lithuanian Armed Forces. The 2024 interaction brought together cybersecurity professionals from 12 countries, including representatives from Lithuania’s public and private sectors, academia, and leading information technology enterprises. Data were collected from 24 participants. The data collection instrument was a structured post-exercise questionnaire. Although the number of collected responses is relatively small, the sample size should be interpreted in the context of cyber defense exercises and human factors research, where access to qualified participants is limited by operational, organizational, and security constraints. Studies conducted in realistic cyber defense environments frequently rely on relatively small specialized populations of experts rather than large-scale survey samples [13,39,48]. In human factors and cyber range research, sample sizes of 30–40 participants are commonly considered appropriate, as the target population is limited and often difficult to access.
The collected data indicated that participants from the GT constituted 38% of the survey sample, followed by the BT with 33% and the Red Team (RT) with 4%, whereas the remaining 25% of respondents belonged to other team categories. Regarding institutional affiliation, 46% of respondents represented the military sector, while the government and education sectors each accounted for 25% of the sample. Participants from the private sector comprised 4% of the respondents. This distribution is consistent with the primary objectives of the exercise, which are predominantly oriented toward the needs and interests of military, governmental, and academic institutions.
Demographic analysis revealed that 46% of participants belonged to the 20–30 years age group, making it the largest age category in the sample. Participants aged 31–40 and 41–50 years each accounted for approximately 25% of the respondents, indicating a relatively balanced representation of mid-career age groups. The lowest representation is observed in the 51–60 age category, comprising 4% of the sample (Figure 3a).
Figure 3.
Demographic and professional characteristics of Amber Mist 2024 participants: (a) age distribution; (b) professional experience distribution; and (c) cybersecurity proficiency level distribution.
Analysis of professional experience revealed that 52% of respondents had between one and five years of cybersecurity experience, whereas 31% reported no prior experience in the field (Figure 3b). Participants with 16–20 years of experience constituted a smaller proportion of the sample (9%), while the lowest representation (4% each) was observed among respondents with 6–10 and 11–15 years of experience. These findings indicate that the participant population was predominantly composed of early-career cybersecurity professionals and individuals with limited practical experience.
Consistently, self-assessment results showed that 42% of participants considered themselves to possess an intermediate level of expertise, while 33% identified as entry-level practitioners (Figure 3c). These findings are in agreement with the reported years of experience, suggesting that the majority of participants were at the initial or developing stages of their professional careers. By comparison, respondents who classified themselves as having advanced or professional expertise accounted for 25% of the sample, which corresponds closely to the proportion of participants reporting more than 10 years of cybersecurity experience. Overall, the results indicate that most Amber Mist 2024 participants were in the early and intermediate phases of their cybersecurity careers.
Two datasets, namely Dataset DS6 and Dataset DS12, were constructed based on the provided responses. The structure of the datasets is presented in Table 1 and Table 2. All Likert-scale items use a 5-point response format anchored at 1 (strongly disagree/very low) and 5 (strongly agree/very high), consistent with best-practice recommendations for Likert instrument design in cybersecurity human factors research.
Table 1.
Structure and description of dataset DS6.
Table 2.
Structure and description of dataset DS12.
We operationalize decision reflection quality using the Counterfactual Decision Reflection (CDR) variable derived from participants’ responses to the question: “If you could go back and change a major decision you made at cyber defense exercises, what would you do?” This question encodes information about participants’ metacognitive awareness of their own decision-making process, which is a subject of this research. Counterfactual Decision Reflection is linked to decision-making, as it captures an individual’s retrospective evaluation of whether an alternative course of action could have produced a more desirable outcome [65,66]. By reconsidering previous choices and their consequences, CDR reflects a key component of adaptive decision-making that supports learning, judgment refinement, and future decision improvement. From a neuroscientific perspective, reflective reassessment of previous actions contributes to the continuous updating of internal cognitive models, enabling individuals to adapt their future behavior based on experience and feedback. While a single-item measure does not capture all dimensions of reflective cognition, it provides a concise and operationally relevant indicator of decision reflection and has been used in exploratory studies involving expert populations and complex real-world environments. Ethical approval for participant data collection was obtained through informed consent procedures, whereby participants were contacted and voluntarily agreed to participate prior to completing the survey data collection.
Spearman’s rank-order correlation coefficient was employed to assess the associations between variables. Spearman’s method is better suited for relatively small sample sizes and does not assume normality or linear relationships. Therefore, it is better suited for capturing monotonic dependencies among human-factor variables that were measured using ordinal Likert-type scales.
3.3. ANFIS Architecture
The Adaptive Neuro-Fuzzy Inference System is a hybrid approach that combines fuzzy logic with neural networks to model complex nonlinear systems. It integrates human-like reasoning through fuzzy if–then rules with data-driven learning capabilities to establish accurate input–output mappings. Typically based on the Takagi–Sugeno model [46], ANFIS is structured as a multilayer network performing fuzzification, rule evaluation, normalization, and output aggregation. Its main advantage lies in a hybrid learning algorithm that combines gradient descent and least squares estimation to efficiently optimize both premise and consequent parameters. This learning process operates through forward and backward passes and supports both offline and online training, making ANFIS suitable for both static and adaptive applications. ANFIS was employed for fuzzy inference in this research due to its ability to integrate the adaptive learning capabilities of neural networks with the interpretability of fuzzy logic, enabling effective modeling of complex nonlinear relationships.
ANFIS is implemented as a five-layer feedforward network, where each layer corresponds to a stage of fuzzy inference, enabling interpretable and adaptive modeling (Figure 4). This adaptive neuro-fuzzy framework [45] employs fuzzy if–then rules parameterized by tailored membership functions, to construct accurate mappings between input and output variables. Rules are represented as follows:
where is vector of inputs characterized by an appropriate membership function, and are the coefficients of linear Takagi–Sugeno consequents.
Figure 4.
ANFIS five-layer architecture for prediction of Counterfactual Decision Reflection.
Layer 1 (Fuzzification) converts crisp inputs into membership grades using parameterized membership functions .
Layer 2 (Rule Strength) computes rule strengths by combining membership values:
Layer 3 (Normalization) normalizes these firing strengths to represent relative rule contributions:
Layer 4 (Consequents) computes rule outputs using linear functions of inputs with trainable parameters:
Layer 5 (Output Layer) aggregates all rule outputs into a final crisp result:
Four membership function types—i.e., Gaussian, Generalized Bell, Triangular, Trapezoidal—were systematically evaluated in this study, each defining how an input variable’s crisp value maps to linguistic degrees of membership in fuzzy sets. The Gaussian membership function is fully differentiable over the entire domain and ensures smooth transitions with continuous overlap between adjacent fuzzy sets, making it well-suited for gradient-based optimization in adaptive systems.
where m is the mean of the Gaussian function and σ is standard deviation and represents the spread of the curve.
The generalized bell membership function is parameterized by three variables controlling its width, slope, and center, offering a smooth and flexible shape that balances interpretability with differentiability for adaptive fuzzy modeling.
where a, b and c are the parameters of the bell-shaped membership function. The triangular membership function is defined by three parameters and exhibits a piecewise-linear structure, providing a simple and computationally efficient approximation of fuzzy sets with limited smoothness.
where a and c define the base of triangle, b defines the height of the triangle.
The trapezoidal membership function is defined by four parameters and exhibits a piecewise-linear structure with a flat plateau of full membership, enabling clear interpretability and efficient computation in fuzzy rule-based systems.
where a and d define the base of trapezoidal, and b and c represent the highest membership value. All membership function parameters are initialized based on the input data distribution and subsequently optimized during the training stage. These parameters are iteratively adjusted using learning algorithms to minimize the modeling error and accurately capture the nonlinear relationships between input variables and the output.
3.4. Synthetic Data Augmentation
The use of synthetic data in this study is justified by the limited size of the original CDX dataset (N = 24), which is insufficient for training robust predictive models and capturing nonlinear relationships between human factors and decision-making outcomes. Synthetic instances were generated to address class imbalance in the target variable CDR and to improve the representativeness of minority classes, thereby reducing model bias. A total of N = 200 instances was selected as a balanced augmentation size, providing sufficient data for stable model training while preserving the original dataset’s underlying distribution. The choice of N = 200 synthetic observations was motivated by methodological considerations commonly reported in small-sample machine learning and synthetic data augmentation studies, where an augmentation factor of 8–10 times the original sample size provides a meaningful increase in data density while maintaining a strong connection to the statistical structure of the original dataset. Importantly, the synthetic data complements rather than replaces empirical observations, enabling a more continuous and reliable representation of the decision-making landscape.
Six synthetic data generation methods were implemented to expand the dataset for augmented model training. Synthetic data were generated using a diverse set of methods—SMOTE, ADASYN, Gaussian Copula, CTGAN, Fuzzy Clustering, and SMOTEBoost—to capture both local interpolation structures and global data distributions, thereby ensuring a comprehensive representation of the underlying feature space. The selection of these complementary techniques enables robust comparison across statistical, machine learning, and fuzzy-based paradigms, reducing methodological bias and enhancing the reliability and generalizability of the modeling results.
Synthetic Minority Over-sampling Technique (SMOTE) [50] reduces class imbalance by creating synthetic minority class CDR examples in feature space based on k-nearest neighbor interpolation. ADASYN [53,54] extends SMOTE by weighting generation toward hard-to-learn instances identified by local classifier error. SMOTEBoost [50,52] integrates SMOTE with the AdaBoost algorithm to improve classification performance on imbalanced datasets by generating synthetic minority class samples during the boosting process. Gaussian Copula [55] preserves multivariate dependence structure through copula-based sampling. The multivariate dependence structure of the training data is captured by transforming Spearman rank correlations into the Gaussian copula space via the normal quantile transformation. Synthetic samples are generated from the fitted multivariate Gaussian copula and back-transformed to the original marginal distributions via empirical quantile matching. Conditional Tabular GAN (CTGAN) [56,57,58] uses conditional generative adversarial networks for tabular data synthesis. For each CDR class, the class-specific mean vector and covariance matrix are estimated from training instances belonging to that class, and new samples are drawn from the resulting multivariate Gaussian distribution with added noise. Fuzzy Cluster synthesis leverages soft cluster memberships to generate samples consistent with the data’s latent structure [59,60]. Synthetic samples are generated by sampling cluster centers with probabilities proportional to their mean fuzzy membership weights, adding Gaussian noise to cluster centers, and assigning output values as the cluster-mean CDR with added noise.
3.5. Evaluation of Performance
Model performance was assessed using three standard error metrics, i.e., mean absolute error (MAE), root mean squared error (RMSE), and mean absolute percentage error (MAPE), computed on the original CDR scale (1–3). These metrics quantify the deviation between predicted and observed values and provide complementary information about the accuracy and reliability of the proposed models.
The MAE measures the average magnitude of the errors between predicted and observed values without considering their direction. It provides a linear measure of the average prediction error.
where n is the number of observations, and and are the observed and predicted values, respectively. The RMSE measures the square root of the average squared differences between predictions and observations. Because the errors are squared before averaging, RMSE penalizes large errors more strongly than MAE.
The MAPE expresses prediction accuracy as a percentage, making it useful for comparing model performance across different datasets.
All three metrics are computed separately for the training set and test set. We have used ratios of 70% and 30% for the synthetic and real datasets, respectively. Given the limited size of the real-world dataset, k-fold cross-validation was employed to ensure the statistical stability and generalizability of the model’s predictive performance. The full factorial design comprises 6 synthetic augmentation methods and 4 membership function types, i.e., 24 model configurations, all evaluated on the same test set. For each dataset and augmentation method, the ANFIS model was evaluated using five independent train–test partitions. Mean values, standard deviations, and 95% confidence intervals were calculated for MAE, RMSE, and MAPE. In addition, Friedman tests were performed to determine whether the observed performance differences among membership function types were statistically significant.
4. Results
This section provides an integrated analysis and comparative discussion of the empirical findings derived from two complementary CDX participant datasets, DS6 and DS12. Dataset DS6 focused on technical knowledge, professional experience, emotional state, and team communication and collaboration, while DS12 probed the internal motivational and affective architecture of the CDX participants, including stress, desire to win, trust in oneself, worry, desire to be a leader, fatigue, desire to demonstrate own abilities, motivation to solve problems, sense of responsibility in the team, belief in teamwork, and belief in collaboration. The same CDR outcome variable was used with the following values: 1 = I will not change my decision; 2 = I will change my decision a little bit; 3 = I will change my decision definitely.
4.1. Descriptive Statistics
Table 3 and Table 4 present the descriptive statistics for all variables across the CDX participants. Datasets DS6 and DS12 each comprise 24 complete observations, with 6 and 12 variables, respectively. DS6 includes five independent Likert-scale variables (TKS, PE, ES, WTC, COL) while DS12 extends the human factors representation to 11 variables (STR, DWE, TIM, WOR, DLE, FAT, DAB, MSP, RST, TWK, COL) all measured on a 1–5 scale. In both datasets, the dependent variable CDR is operationalized on a 1–3 ordinal scale.
Table 3.
Descriptive statistics of the DS6 dataset.
Table 4.
Descriptive statistics of the DS12 dataset.
DS6 statistics indicates that participants reported high levels of technical knowledge/skills (TKS: mean = 4.42, SD = 0.78), professional experience (PE: mean = 4.25, SD = 1.15), within-team communication (WTC: mean = 4.50, SD = 0.66), and collaboration (COL: Mean = 4.33, SD = 0.92), with median values at the upper bound (Mdn = 5), suggesting a generally strong self-assessment across core competencies. In contrast, emotions (ES: mean = 2.63, SD = 1.14, Mdn = 2) and Counterfactual Decision Reflection (CDR: mean = 1.88, SD = 0.68, Mdn = 2) exhibit lower central tendencies and broader dispersion, indicating greater variability and a moderate inclination toward decision revision among participants.
DS12 statistics reveal that motivation to solve problems (MSP: mean = 4.38, SD = 0.82), responsibility within the team (RST: mean = 4.46, SD = 0.78), trust in myself (TIM: mean = 4.00, SD = 0.89), teamwork (TWK: mean = 4.08, SD = 0.50), and collaboration (COL: mean = 4.21, SD = 0.66) exhibit high central tendencies with relatively low dispersion, indicating consistently strong positive perceptions across key human-factor dimensions. In contrast, stress (STR), desire to win exercises (DWE), fatigue (FAT), and desire to be a leader (DLE) demonstrate moderate means and higher variability, while worry (WOR: mean = 2.46, SD = 1.14) and Counterfactual Decision Reflection (CDR: mean = 1.88, SD = 0.68, Mdn = 2) remain comparatively lower, suggesting heterogeneous emotional responses and a moderate propensity for decision reconsideration.
4.2. Correlation Analysis
First of all, the relationships between key variables affecting performance in cyber defense exercises were examined by applying Spearman correlation analyses, which utilized data from both datasets. Spearman’s rank correlation coefficient was selected as the appropriate statistical method due to its robustness with ordinal data and non-parametric distributions that are commonly found in behavioral assessments. The analysis addresses the central research question: Which human factors exert the greatest predictive influence on the Counterfactual Decision Reflection outcome variable, and how do their interactions modulate model outputs?
The correlation analysis of DS6 reveals a structured pattern of monotonic relationships among technical competencies, emotions and team interaction variables in cyber defense exercises (Figure 5a). Moderate positive correlations are observed between technical knowledge/skills (TKS) and professional experience (PE) (ρ = 0.49), as well as between within-team communication (WTC) and collaboration (COL) (ρ = 0.44), indicating coherent clustering of expertise-related and team-oriented attributes. Emotional state (ES) shows a moderate association with within-team communication (WTC) (ρ = 0.36), linking affective factors to communication dynamics under pressure. In contrast, the decision reflection variable (CDR) exhibits weak relationships with individual technical attributes, including TKS (ρ = 0.21), PE (ρ = 0.06), and ES (ρ = 0.09), suggesting limited direct influence. Negative correlations between CDR and team interaction variables—WTC (ρ = −0.24) and COL (ρ = −0.23)—indicate that stronger communication and collaboration are associated with greater decision stability. Overall, the results highlight that team-based dynamics play a more critical role in stabilizing decision outcomes than individual technical competencies.
Figure 5.
Spearman correlation matrix of (a) dataset DS6 and (b) dataset DS12.
The correlation analysis based on DS12 reveals a coherent structure of human-factor interactions in cyber defense exercises (Figure 5b). Strong positive relationships (ρ ≥ 0.50) are observed among stress (STR), fatigue (FAT), trust in myself (TIM), worry (WOR) and motivational constructs such as desire to win (DWE) and to demonstrate abilities (DAB), indicating a unified cognitive–emotional load dimension. Teamwork (TWK) and collaboration (COL) show moderate positive associations with several variables, suggesting their integrative role within team-based performance. Importantly, Counterfactual Decision Reflection (CDR) exhibits consistent negative correlations with stress-related factors, particularly responsibility in team (RST), demonstrating my own abilities (DAB), and stress (STR), indicating that higher pressure reduces adaptive reconsideration of decisions. In contrast, collaboration (COL) shows a weak positive relationship with CDR, highlighting its potential role in supporting reflective decision-making processes. These findings confirm that the interplay between psychological pressure and collaborative dynamics shapes decision-making in CDX environments.
The relationships between CDR and the different human factors were examined and are presented in Figure 6 and Figure 7. The relationships were characterized by constructing three-dimensional (3D) surface models from the observed empirical samples using quadratic regression combined with radial basis function interpolation. The 3D surfaces generated for dataset DS6 illustrate the relationships between all independent variables and CDR, whereas dataset DS12 focuses specifically on variables associated with human, motivational, and emotional factors. The black points in the Figure 6 and Figure 7 represent the original experimental observations, while the contour lines connect locations with equal predicted values of the Desire to Change Decision variable, facilitating the interpretation of response gradients and regions with similar decision-reflection levels.
Figure 6.
3D surface plots of variables’ relationships in dataset DS6: (a) WTC-ES-CDR; (b) PE-TKS-CDR; (c) COL-WTC-CDR.
Figure 7.
3D surface plots of variables’ relationships in dataset DS12: (a) FAT-STR-CDR; (b) WOR-TIM-CDR; (c) DAB-DWE-CDR.
Analysis of the results of dataset DS6 revealed a weak and partially inconsistent relationship between emotional state (ES) and Counterfactual Decision Reflection (CDR) as reflected by low correlation coefficients (r = 0.09). Conversely, higher levels of within-team communication (WTC) are associated with lower CDR values, indicating greater decision stability among CDX participants (Figure 6a), with a Spearman’s rank-order correlation coefficient of r = −0.24.
The PE–TKS–CDR relationship (Figure 6b) shows a moderate association between technical knowledge and skills (TKS) and Counterfactual Decision Reflection (CDR). Increased TKS corresponds to greater decision stability. The correlation between professional experience (PE) and CDR is low (r = 0.06), indicating a weak and inconsistent relationship between these variables.
The COL-WTC-CDR relationship reveals a moderate negative correlation between within-team communication (WTC), collaboration (COL), and Counterfactual Decision Reflection (CDR), indicating that increases in social interaction variables consistently translate into higher decision stability (Figure 6c).
Summarizing the results obtained within the analyzed DS6 dataset, it can be noted that decision reflection outcomes are not strongly driven by individual technical-factor variables alone, indicating the importance of incorporating additional human-factor or team-dynamic variables to more accurately model decision-making processes in cyber defense exercises.
Analysis of dataset DS12 revealed a weak correlation between stress (STR), fatigue (FAT), and Counterfactual Decision Reflection (CDR) (Figure 7a). Nevertheless, an increase in FAT was associated with higher CDR values, suggesting reduced decision stability and greater decision uncertainty among CDX participants as fatigue levels increased. The results also indicate that stress had a negligible impact on the decision-making process.
A similar observation can be made from the relationship between trust in myself (TIM), worry (WOR), and Counterfactual Decision Reflection (CDR). As WOR levels increase, CDR values also rise (Figure 7b), indicating reduced decision stability among CDX participants, while trust in myself showed no significant association with decision-making outcomes.
The relationship between the desire to win exercises (DWE), demonstration of abilities (DAB), and Counterfactual Decision Reflection (CDR) exhibited low correlation magnitudes (r = 0.16 and r = 0.20, respectively). An increase in DWE is associated with higher CDR values, suggesting reduced decision stability when the desire to win increases (Figure 7c). In contrast, higher DAB values are associated with lower CDR values, indicating greater decision stability of the participants who aim to demonstrate their abilities during exercises.
4.3. Assessment of Synthetic Data
Prior to the development of the ANFIS model, a systematic evaluation of the statistical consistency of the synthetic datasets generated by the six data augmentation methods described in Section 3.4 was conducted. Three complementary metrics were employed for evaluation: the two-sample Kolmogorov–Smirnov (KS) test, the Wasserstein distance, and the Mean Absolute Difference of Correlations (MADcorr). The two-sample KS test was used to determine whether the empirical distributions of the synthetic and original datasets differed significantly, thereby providing a nonparametric measure of distributional similarity. The Wasserstein distance quantified the difference between the corresponding probability distributions by evaluating the minimum transport cost required to transform one distribution into the other. In addition, MADcorr was examined to evaluate the extent to which the monotonic relationships among variables present in the original data were retained in the augmented datasets. Together, these complementary measures enabled a multidimensional assessment of synthetic data quality, encompassing distributional agreement, probabilistic similarity, and the preservation of inter-variable dependencies.
Table 5 presents consistency metrics for the DS6 and DS12 synthetic data augmentation methods. The results of the DS6 dataset consistency metrics show that Gaussian Copula, CTGAN, SMOTE, and ADASYN produced synthetic samples that were statistically consistent with the original DS6 dataset, with all KS test p-values exceeding 0.05. Gaussian Copula achieved the highest distributional similarity (mean Wasserstein distance = 0.122), whereas ADASYN most accurately preserved the original correlation structure (MADcorr = 0.084). Fuzzy Cluster showed moderate consistency with the original dataset, whereas SMOTEBoost exhibited statistically significant deviations from the original distributions and the largest distortion of feature relationships, indicating lower synthetic data fidelity.
Table 5.
Distribution consistency metrics for synthetic data augmentation methods.
Analysis of DS12 dataset consistency metrics revealed that Gaussian Copula and SMOTEBoost produced the most consistent synthetic datasets overall, with the lowest mean KS statistics (0.077 and 0.080, respectively) and non-significant minimum p-values (0.563), indicating that the marginal distributions of all variables were statistically indistinguishable from the original data. SMOTEBoost additionally achieved the lowest mean Wasserstein distance (0.152) and MADcorr (0.146), suggesting it slightly outperformed Gaussian Copula in preserving correlation structure, while Gaussian Copula showed marginally better Wasserstein performance of 0.167 but a higher MADcorr (0.152). ADASYN preserved correlation structure best (MADcorr = 0.098) despite a moderately higher KS statistic of 0.114 and a non-significant minimum p-value of 0.385, indicating reasonable preservation of correlations but slightly larger marginal distributional shifts. Fuzzy Cluster and SMOTE performed worse, with higher KS statistics (0.101 and 0.197, respectively), and lower minimum p-values (0.190 and 0.099). Fuzzy Cluster also showed substantial correlation distortion (MADcorr = 0.289). CTGAN performed worst across all metrics, with the highest KS statistic (0.224), a significant minimum p-value (<0.001), the largest Wasserstein distance (0.464), and high MADcorr (0.294), indicating poor preservation of both distributions and correlations. Overall, copula- and resampling-based methods, i.e., Gaussian Copula, SMOTEBoost, and ADASYN, better preserved the statistical properties of the original dataset than cluster-based (Fuzzy Cluster) or GAN-based (CTGAN) approaches.
Figure 8 presents the Spearman correlation matrix of the six variables (TKS, PE, ES, WTC, COL, and CDR) for the Gaussian Copula synthetic data generated for dataset DS6 and the absolute pairwise differences between these correlations and those of the original DS6 dataset. Correlation structure preservation analysis reveals that most correlation differences are small, with the majority of off-diagonal values falling below 0.10, suggesting that the Gaussian Copula method closely approximates the original correlation structure for most variable pairs. The largest discrepancies occur for relationships involving CDR, particularly CDR–WTC and ES–CDR, indicating that the synthetic data underestimates or overestimates the strength of these specific associations relative to the original dataset.
Figure 8.
Spearman correlation matrix of (a) DS6 Gaussian Copula synthetic dataset (a) and correlation differences between original DS6 and Gaussian Copula synthetic dataset (b).
Analysis of the augmented data also included a visual comparison of the feature distributions across all six DS6 dataset variables. Figure 9 shows a comparison of the relative frequency distributions between the original survey data (blue) and a synthetically generated dataset (orange) using the Gaussian Copula technique. Across most variables, the synthetic data closely approximates the distributional shape of the original responses, with minor deviations observed in the CDR variable, where the synthetic data is more evenly distributed across all three categories.
Figure 9.
Comparison of the relative frequency distributions between the original DS6 dataset and Gaussian Copula augmented dataset variables for: (a) TKS, (b) PE, (c) ES, (d) WTC, (e) COL, (f) CDR.
To evaluate the structural consistency of the generated synthetic data, Spearman rank correlation coefficients were calculated for the DS12 Gaussian Copula synthetic dataset. Figure 10 presents the Spearman correlation matrix obtained from the Gaussian Copula data and the absolute differences between the correlation coefficients of the synthetic and original datasets. The Gaussian Copula dataset reproduced the main dependency patterns observed in the original DS12 data. Several strong positive associations were maintained, including relationships among stress, motivation, and teamwork-related variables. The absolute-difference heatmap reveals that the preservation of individual pairwise correlations is not uniform across all variables. While many correlation coefficients remain relatively close to those observed in the original dataset, several variable pairs exhibit larger deviations. This is reflected in the Mean Absolute Difference of Correlations, which reached 0.152 for the Gaussian Copula dataset. The obtained value indicates a moderate level of correlation preservation, suggesting that the synthetic dataset captures the overall structure of the original data but does not fully reproduce all pairwise relationships with high precision.
Figure 10.
Spearman correlation matrix of (a) the DS12 Gaussian Copula synthetic dataset and (b) correlation differences between the original DS12 and the Gaussian Copula synthetic dataset.
To evaluate the distribution consistency of the generated synthetic data, the frequency distributions of all DS12 variables were compared between the original dataset and the Gaussian Copula synthetic dataset. Figure 11 presents the distribution of responses across the Likert scale categories for each variable. Overall, the Gaussian Copula method successfully reproduced the principal distributional characteristics of the original dataset. The highest level of consistency was observed for the teamwork and responsibility-related variables (RST, TWK, and COL), where the synthetic distributions almost completely overlapped. Moderate deviations were observed for several variables, including STR, WOR, and CDR. Although the overall distributional shape remained similar, some response categories were slightly overrepresented or underrepresented in the synthetic data.
Figure 11.
Comparison of the relative frequency distributions between the original DS12 dataset and Gaussian Copula augmented dataset variables for: (a) STR, (b) DWE, (c) TIM, (d) WOR, (e) DLE, (f) FAT, (g) DAB, (h) MSP, (i) RST, (j) TWK, (k) COL, (l) CDR.
4.4. ANFIS Results
ANFIS is employed in this study as a predictive modeling framework to estimate decision-making outcomes in cyber defense exercises by capturing nonlinear relationships between human factor variables and CDR metrics. ANFIS architecture and corresponding hyperparameter values are summarized in Table 6. The research consists of four sequential stages: first, applying ANFIS for baseline decision prediction using the original datasets DS6 and DS12; second, analyzing the extracted fuzzy rules; third, evaluating the model performance using synthetically generated data; and fourth, comparing performance with three machine learning algorithms: Support Vector Machine (SVM), Random Forest, and Extreme Gradient Boosting (XGBoost).
Table 6.
ANFIS architecture and hyperparameters.
Figure 12 illustrates the relationship between the number of training epochs and the Root Mean Square Error obtained by ANFIS models employing four different membership function types: Gaussian, Generalized Bell, Triangular, and Trapezoidal. The analysis was conducted separately for the DS6 and DS12 original datasets to evaluate convergence behavior and training efficiency. For both datasets, a substantial reduction in RMSE was observed during the early stages of training. The largest improvement occurred within the first 50–75 epochs, indicating that the ANFIS models rapidly captured the underlying nonlinear relationships among the variables. Beyond this point, the rate of improvement gradually decreased, suggesting convergence toward stable error values.
Figure 12.
ANFIS training RMSE as a function of the number of training epochs for different membership function types on the DS6 (a) and DS12 (b) datasets.
For the DS6 dataset, the generalized bell MF achieved the lowest RMSE of 0.33 after 100 epochs, followed by the Gaussian MF (RMSE = 0.42). The triangular and trapezoidal MFs exhibited slower convergence and higher errors, with the trapezoidal MF (RMSE = 0.65) outperforming the triangular MF (RMSE = 0.77).
A similar trend was observed for the DS12 dataset, with the generalized bell MF achieving the lowest RMSE of 0.42 after 125 epochs, followed by the Gaussian MF (RMSE = 0.54), whereas the triangular and trapezoidal MFs yielded higher RMSE values of 0.68 and 0.70, respectively. An important observation is that the RMSE curves become nearly flat after 100 epochs for DS6 and 125 epochs for DS12. Additional training beyond these points yields only marginal improvements, suggesting that the ANFIS models have largely converged. Consequently, increasing the number of epochs beyond these thresholds is unlikely to produce substantial gains in predictive accuracy while increasing computational cost. Therefore, 100 and 125 training epochs were adopted for the DS6 and DS12 datasets, respectively.
4.4.1. Baseline ANFIS Performance
The baseline performance evaluation of the ANFIS model was performed to assess the predictive capability of the model before the application of synthetic data augmentation and rule analysis. The model was trained and evaluated using the original datasets to determine how accurately it can capture the underlying input–output relationships before any further rule analysis and synthetic data experiments are performed. The obtained results serve as a benchmark for comparison with subsequent stages and help identify the initial predictive capability of the ANFIS model under the given experimental conditions. Table 7 presents the baseline ANFIS performance on original data (N = 24, 70/30 split) before synthetic augmentation. Four different membership functions, i.e., Gaussian, Generalized Bell, Triangular, and Trapezoidal, were used in the analysis.
Table 7.
Baseline ANFIS performance for DS6 and DS12.
Analyzing results obtained from the dataset DS6, it can be noted that the ANFIS model with triangular membership functions demonstrated the most balanced predictive performance on the test set, achieving the lowest RMSE (1.0021) and MAPE (41.24%), whereas the generalized bell membership function yielded the best fit on the training set. The comparative analysis of ANFIS models employing different membership functions revealed distinct trade-offs between training accuracy and generalization performance. Specifically, the generalized bell membership function achieved the lowest training errors (MAE = 0.2648, RMSE = 0.3296), indicating excellent fitting capability; however, this advantage did not transfer to the test set, where increased errors suggest potential overfitting. In contrast, the triangular membership function demonstrated the most balanced predictive performance, yielding the lowest RMSE (1.0021) and MAPE (41.24%) on the test data, thereby indicating improved generalization under limited sample conditions. The Gaussian model achieved the lowest test MAE (0.7930), but exhibited higher variance across metrics, while the trapezoidal function showed consistently weaker performance. Overall, these results suggest that simpler, piecewise-linear membership functions may provide more robust generalization in small-sample ANFIS applications, particularly when modeling human-factor-driven decision processes with discrete output scales.
Analysis of DS12 results revealed that ANFIS models across multiple membership functions indicate a clear distinction between model fitting and generalization capabilities. The generalized bell membership function achieved the lowest training errors (MAE = 0.34, RMSE = 0.42), suggesting strong approximation capacity; however, its degraded performance on the test set (RMSE = 1.16) indicates overfitting under small-sample conditions. In contrast, the triangular membership function provided the most robust generalization, yielding the lowest test RMSE (1.03) and MAPE (44.29%), despite slightly higher training errors. The Gaussian function achieved a competitive MAE on the test set (0.87), while the trapezoidal function exhibited consistently weaker performance across all metrics. Findings obtained from DS12 confirmed the suitability of simpler membership functions for modeling human-factor-driven decision processes in constrained datasets.
The cross-model comparison demonstrates that in both configurations, the generalized bell membership function achieved the lowest training errors, confirming its strong approximation capability; however, this advantage systematically degraded on the test set, indicating overfitting under small-sample conditions. In contrast, the triangular membership function consistently provided the most balanced generalization performance across both models, achieving the lowest RMSE (1.0021 and 1.0314) and MAPE (41.24% and 44.29%) on the test sets. Notably, the extended human-factor model based on the DS12 dataset resulted in slightly higher prediction errors than the model based on DS6, suggesting that increasing input dimensionality without expanding sample size may reduce model stability. Overall, the results indicate that simpler, piecewise-linear membership functions are more robust for modeling decision-making processes in cyber defense exercises, particularly when dealing with limited, discrete-scale datasets.
4.4.2. Derived Fuzzy Rules and Analysis
The fuzzy rule base for the DS6 and DS12 datasets was derived using a data-driven Adaptive Neuro-Fuzzy Inference System, where the structure of the rules emerges from the distribution of input variables. Each rule follows a first-order Takagi–Sugeno formulation, linking combinations of human factor variables to the output variable representing Counterfactual Decision Reflection. To assess the reliability of the derived rules, a confidence analysis was performed. The input variables were fuzzified over a normalized Likert scale (1–5), with three linguistic terms: Low, Medium, and High. To ensure deterministic rule extraction from discrete observations, each input value was assigned to the linguistic term with the highest membership degree, resolving boundary overlaps by assigning them to the central medium category.
Firstly, a triangular membership function was used for analysis. This type of function produces more transparent and discretely separable ANFIS rules when the input space is partitioned into clearly interpretable Low, Medium, and High regions. In contrast, Gaussian and generalized bell membership functions generate smoother overlaps between adjacent linguistic regions, which usually increases rule activation continuity and improves model stability. However, this increased smoothness may reduce direct interpretability because each observation can partially activate a larger number of rules.
A total of 16 rules out of the theoretical 243 rules were activated using triangular membership functions for dataset DS6 (Table 8). The dominant rules are concentrated around high levels of technical knowledge and skills (TKS) and professional experience (PE), combined with medium-to-high levels of within-team communication (WTC) and collaboration (COL). The most frequently observed outcome is CDR = 2, indicating a moderate level of decision revision. Lower confidence is observed in rules where the same combination of antecedents leads to heterogeneous CDR outcomes, indicating reduced rule stability. The representation of the five ANFIS fuzzy rules derived from dataset DS6 is shown in Table 8.
Table 8.
Representation of the fuzzy rules derived from dataset DS6.
Comparison of the fuzzy rule characteristics was made when different membership functions were used for dataset DS6 (Table 9). The number of triggered rules, coverage, overlap, and interpretability were used for analysis. Results show that all membership functions yield the same theoretical rule count of 243, but the number of activated rules on DS6 varies substantially across membership function types. Triangular and trapezoidal membership functions activate fewer rules, indicating more compact rule bases, with triangular achieving very high interpretability and low overlap, while trapezoidal provides high coverage with low-to-medium overlap. In contrast, Gaussian and generalized bell membership functions activate more rules, which increases rule overlap but reduces interpretability relative to the simpler shapes. Overall, the results suggest a trade-off between compactness and transparency for triangular/trapezoidal membership functions versus broader coverage for Gaussian/generalized bell membership functions.
Table 9.
Comparison of fuzzy rule characteristics for dataset DS6.
For the DS12 dataset, the theoretical ANFIS rule base consists of 177,147 possible rules due to the combination of 11 input variables and three linguistic terms per variable. A total of 22 rules were activated for dataset DS12 when a triangular membership function was used. It must be noted that rules are highly sparse due to the high dimensionality and limited sample size. Most rules exhibited low coverage values, typically corresponding to one or two observations only. The dominant rules are concentrated around medium-level values of most input variables, indicating that balanced human factors are the primary drivers of Counterfactual Decision Reflection (CDR ≈ 2–3).
Rules associated with higher motivation, responsibility, and teamwork consistently demonstrate more stable and predictable decision outcomes. In contrast, rules with identical antecedents but varying CDR values exhibit lower confidence, reflecting inherent variability in human decision-making. Overall, the results suggest that decision behavior in cyber defense exercises is governed more by the interaction of multiple moderate factors than by extreme individual conditions. The representation of the five ANFIS fuzzy rules derived from dataset DS12 is shown in Table 10.
Table 10.
Representation of the fuzzy rules derived from dataset DS12.
Comparison of the fuzzy rule characteristics was made when different membership functions were used for dataset DS12 (Table 11). Results show that triangular membership functions generated the most compact rule base. The sharp partition boundaries produced localized rule activation regions with minimal overlap, leading to very high interpretability but reduced robustness. Trapezoidal membership functions slightly increased rule generalization by introducing wider plateau regions, which reduced fragmentation and improved rule stability. In contrast, Gaussian and generalized bell membership functions substantially increased the number of activated rules because each observation partially activated multiple neighboring linguistic regions. This produced smoother inference surfaces and greater rule overlap, and predictive robustness under small-sample conditions.
Table 11.
Comparison of fuzzy rule characteristics for dataset DS12.
The results demonstrate that triangular and trapezoidal functions are preferable when transparent and easily interpretable fuzzy rules are required, whereas Gaussian and generalized bell functions are more suitable for robust prediction and smoother generalization in high-dimensional cybersecurity decision-making models.
4.4.3. Analysis of ANFIS Performance with Augmented Data
To assess the performance of membership functions, repeated cross-validation was performed. For each ANFIS configuration, MAE, RMSE, and MAPE were computed, and 95% confidence intervals were estimated. This procedure enabled evaluation of both predictive accuracy and variability across data partitions.
Among the evaluated augmentation techniques used for dataset DS6, SMOTEBoost and CTGAN achieved the most accurate overall predictive performance (Table 12 and Table 13). The best global result was obtained using the SMOTEBoost method with the generalized bell MF, reaching MAE(test) = 0.40, RMSE(test) = 0.55, and MAPE(test) = 27.73%, representing a substantial reduction compared with the original dataset configuration. Similarly, CTGAN combined with the triangular and trapezoidal membership functions achieved highly competitive results, with MAPE(test) values of 26.87% and 26.84%, respectively, indicating that generative adversarial synthetic modeling effectively preserved the nonlinear structure of the human-factor relationships. ADASYN also demonstrated strong predictive stability, particularly with the trapezoidal MF, where MAE(test) = 0.45 and RMSE(test) = 0.57 were achieved. The Gaussian Copula approach produced moderately stable results across all MF types, with relatively small variation between configurations, suggesting robust probabilistic preservation of feature distributions.
Table 12.
ANFIS performance results for DS6 training data, including 95% confidence intervals.
Table 13.
ANFIS performance results for DS6 testing data, including 95% confidence intervals.
The 95% confidence intervals (CI) obtained for both training and testing datasets indicate that the ANFIS models exhibited generally stable predictive performance across the considered synthetic data generation methods and membership functions. During training, CTGAN combined with the trapezoidal membership function achieved the lowest average errors, while Gaussian Copula and SMOTE-Boost also showed relatively narrow confidence intervals, suggesting consistent model behavior. Similar trends were observed on the testing data, where SMOTE-Boost and CTGAN produced the lowest mean error values together with comparatively tight CI, indicating good generalization capability and reduced variability between repeated runs. In contrast, the Fuzzy Cluster approach consistently exhibited the widest confidence intervals for both training and testing metrics, particularly for MAPE and RMSE, reflecting higher uncertainty and lower robustness of the resulting models. Overall, the substantial overlap among the confidence intervals suggests that differences attributable to the membership function type were relatively minor, whereas the synthetic data generation method exerted a more pronounced influence on model accuracy and stability, with SMOTE-Boost, CTGAN, Gaussian Copula, and ADASYN demonstrating the most reliable performance.
The comparison of membership functions revealed that smoother and adaptive fuzzy representations generally improved ANFIS robustness when combined with augmented datasets. In the original dataset, the triangular membership function achieved the lowest testing MAPE (41.24%), whereas in synthetic data scenarios, the generalized bell and trapezoidal membership functions frequently outperformed alternative configurations. The differences between membership function types became considerably smaller after augmentation, indicating that synthetic data reduced sensitivity to membership function selection and improved overall model stability. Furthermore, the reduction of the train–test performance gap across augmented datasets suggests that synthetic sampling methods successfully mitigated overfitting effects commonly associated with small-scale cyber defense exercise datasets.
Figure 13 presents the p-values obtained for the MAE, RMSE, and MAPE test metrics on the DS6 dataset across the six synthetic data generation methods. All methods yielded p-values greater than 0.05, indicating that no statistically significant differences were observed between the distributions of the original and synthetic data.
Figure 13.
p-values for DS6 dataset test metrics across membership functions.
Results show that Fuzzy Cluster and SMOTEBoost exhibited the highest p-values (0.98 for all three metrics), suggesting the strongest agreement and the greatest stability of model performance. SMOTE and ADASYN also demonstrated consistently high p-values (0.80), whereas Gaussian Copula produced comparatively lower values (0.53–0.61), indicating a higher degree of variability, although still within the range supporting statistical similarity. Overall, the results confirm that the prediction errors obtained from ANFIS models trained on synthetic datasets are statistically consistent with those obtained from the original data, thereby supporting the validity of the synthetic data generation approaches for preserving model performance characteristics.
Next, augmented ANFIS validation was performed on the DS12 dataset with synthetic data generated using different approaches (Table 14 and Table 15). The comparative evaluation was conducted across the same four membership functions and metrics. The obtained results demonstrate that synthetic data augmentation substantially improved ANFIS predictive performance compared with the original DS12 dataset.
Table 14.
ANFIS performance results for DS12 training data, including 95% confidence intervals.
Table 15.
ANFIS performance results for DS12 testing data, including 95% confidence intervals.
The baseline ANFIS model trained on the original DS12 dataset produced relatively high testing errors, with MAE(test) values ranging from 0.82 to 0.95, RMSE(test) from 1.03 to 1.16, and MAPE(test) from 44.29% to 63.90%. Although the original dataset with the generalized bell membership function achieved comparatively low training errors (MAE(train) = 0.34; RMSE(train) = 0.42), it simultaneously generated the highest testing error (MAPE(test) = 63.90%), indicating substantial overfitting caused by the limited dataset size and insufficient distributional diversity. Among all evaluated configurations, the SMOTE method combined with the trapezoidal membership function achieved the best overall predictive performance, reaching MAE(test) = 0.39, RMSE(test) = 0.53, and MAPE(test) = 19.22%, representing a major improvement over the original dataset configuration. Similarly, ADASYN demonstrated highly competitive results, particularly with the generalized bell and triangular membership functions, where MAE(test) = 0.40 and RMSE(test) = 0.53–0.55 were achieved with MAPE(test) values between 21.28% and 22.77%. The CTGAN-based augmentation also produced strong predictive stability, especially with the generalized bell MF, yielding MAE(test) = 0.41, RMSE(test) = 0.55, and MAPE(test) = 21.76%, confirming the effectiveness of generative adversarial synthetic modeling in preserving nonlinear human-factor interactions.
In contrast, Gaussian Copula and Fuzzy Cluster methods produced more moderate predictive improvements, with testing MAPE values generally remaining within the 28–31% interval. Nevertheless, these approaches still significantly outperformed the original dataset models, indicating that even probabilistic and clustering-based augmentation strategies contribute to reducing model variance and improving generalization. The comparison of membership functions further revealed that adaptive and smoother fuzzy representations, particularly generalized bell and trapezoidal membership functions, consistently achieved good performance when combined with augmented datasets. Moreover, the reduced discrepancy between training and testing errors across synthetic datasets suggests that data augmentation effectively mitigated overfitting and stabilized ANFIS learning behavior.
The 95% confidence intervals obtained for both the training and testing DS12 datasets reveal notable differences in the stability and generalization capability of ANFIS models across the considered synthetic data generation methods and membership functions. During training, CTGAN exhibited relatively narrow confidence intervals, particularly with Gaussian and generalized bell membership functions, indicating low variability and robust model performance, while SMOTE and ADASYN demonstrated favorable stability, characterized by moderate CI widths and comparatively low error values. Similar trends were observed on the testing data, where ADASYN and CTGAN achieved the narrowest confidence intervals and relatively low MAE, RMSE, and MAPE values, suggesting good generalization and reduced sensitivity to data partitioning. In contrast, Gaussian Copula and Fuzzy Cluster consistently produced wider confidence intervals for both training and testing metrics, especially for MAPE and RMSE, indicating greater uncertainty and lower consistency in predictive performance.
Figure 14 presents the p-values obtained for the ANFIS model using different synthetic data augmentation methods and evaluated through the MAE, RMSE, and MAPE performance metrics for DS. All p-values exceeded the significance threshold of 0.05, indicating that no statistically significant differences were observed among the evaluated membership function types across the tested augmentation methods. These findings suggest that the predictive performance of the ANFIS model is robust with respect to the selection of membership functions, demonstrating consistent behavior across different synthetic data generation techniques.
Figure 14.
p-values for DS12 dataset test metrics across membership function.
ANFIS performance summary of membership functions for DS6 and DS12 was made and is shown in Table 16. The performance differences among the evaluated membership function types were relatively small for both datasets. Summarized performance results of the DS6 dataset showed that the trapezoidal membership function achieved the lowest average MAPE (29.29 ± 2.08), whereas Gaussian and generalized bell functions demonstrated comparable predictive accuracy and stability. Overall, the low standard deviation values indicate that ANFIS performance remained consistent across different synthetic data augmentation methods. Analysis of the DS12 summarized results shows that generalized bell achieved the lowest mean MAPE value of 25.49 ± 7.00, indicating the highest predictive accuracy according to this metric. Gaussian exhibited the lowest MAE variability SD = 0.09 and the second-lowest MAPE standard deviation among the evaluated membership functions, following generalized bell. The mean MAE values of all four membership function types were nearly identical (≈0.47), suggesting that the overall performance of the ANFIS model was only minimally influenced by the choice of membership function.
Table 16.
ANFIS performance summary of membership functions for DS6 and DS12 datasets.
Overall, the findings confirm that synthetic data augmentation substantially enhances ANFIS-based prediction accuracy for cyber defense exercise decision modeling. The results indicate that hybrid oversampling and generative augmentation approaches, particularly SMOTE, SMOTEBoost, ADASYN, and CTGAN, are highly effective in preserving complex nonlinear dependencies among technical, emotional, and collaborative human-factor variables in the DS6 dataset as well as stress, motivation, teamwork, emotional, and collaboration-related variables in the DS12 dataset, leading to more reliable prediction of Counterfactual Decision Reflection outcomes. Consequently, augmented neuro-fuzzy modeling provides a reliable and scalable approach for improving predictive robustness in small-sample cybersecurity behavioral datasets.
4.4.4. Comparative Evaluation with ML Models
To benchmark the ANFIS model, three machine learning (ML) algorithms, namely SVM, RF, and XGBoost, were evaluated using 5-fold cross-validation on the original DS6 and DS12 datasets. Model performance was assessed using MAE, RMSE, and MAPE metrics for both training and testing datasets. Results are shown in Table 17.
Table 17.
Performance of the ML models.
For the DS6 dataset, the Random Forest model achieved the best training and testing performance, obtaining the lowest MAE of 0.231 ± 0.036, RMSE of 0.293 ± 0.043, and MAPE of 15.285 ± 2.385% for the testing dataset. The training dataset yielded an MAE of 0.558 ± 0.116, RMSE of 0.722 ± 0.192, and MAPE of 38.923 ± 13.857%, slightly outperforming both Random Forest and SVM. These results suggest that Random Forest provided the most balanced trade-off between model fitting and generalization for the DS6 dataset.
For the DS12 dataset, a different pattern was observed. XGBoost achieved very low training errors (MAE = 0.007 ± 0.005, RMSE = 0.009 ± 0.006, MAPE = 0.472 ± 0.317%), indicating an almost perfect fit to the training data. Nevertheless, its testing performance showed the highest test errors among the evaluated models. This discrepancy suggests pronounced overfitting caused by the limited sample size and increased dimensionality of the DS12 dataset. In contrast, the SVM model demonstrated the strongest generalization performance on DS12. It achieved the lowest testing MAE of 0.617 ± 0.169, RMSE of 0.746 ± 0.169, and MAPE of 40.729 ± 7.263%, outperforming both Random Forest and XGBoost. The relatively small gap between training and testing errors indicates greater robustness and stability under limited-data conditions.
A comparison of the prediction results obtained using ML and ANFIS models revealed that ML algorithms consistently outperformed ANFIS in terms of generalization accuracy on both DS6 and DS12 datasets. However, ANFIS offers several advantages that are particularly relevant for human-centered and small-sample applications. Unlike conventional ML algorithms, ANFIS combines the learning capability of neural networks with the interpretability of fuzzy inference systems, enabling the incorporation of expert knowledge through linguistic rules and membership functions. This transparency facilitates the understanding of relationships among input variables and provides greater explainability of the prediction process, which is often lacking in black-box ML models such as Random Forest and XGBoost. Furthermore, ANFIS is well suited to handling uncertainty, imprecision, and subjective assessments represented by Likert-scale data, making it an attractive approach for modeling human factors in cyber defense exercises. Therefore, while ML methods demonstrated superior predictive accuracy, ANFIS provides valuable interpretability and knowledge representation capabilities that may be advantageous in decision-support applications where model transparency and explainability are as important as predictive performance.
5. Discussion
The present study investigated the influence of technical, emotional, motivational, collaborative, and communicational human factors on decision reflection processes during cyber defense exercises using two complementary datasets, DS6 and DS12, and a neuro-fuzzy modeling framework. The obtained results confirm the initial working hypothesis that decision-making behavior in CDX environments cannot be sufficiently explained by technical competencies alone, but instead emerges from complex interactions among cognitive, emotional, and team-oriented variables. The findings further demonstrate that ANFIS models provide a suitable methodological framework for capturing nonlinear and context-dependent relationships characteristic of cybersecurity decision processes.
The descriptive statistics revealed consistently high self-assessment scores for technical knowledge, professional experience, teamwork, responsibility, and collaboration across both datasets, while emotional and reflective dimensions exhibited substantially greater variability. These findings revealed that CDX participants often demonstrate strong technical readiness but heterogeneous psychological responses under operational pressure. In particular, the relatively low and dispersed Counterfactual Decision Reflection values indicate that participants differed considerably in their willingness to reconsider or revise previous decisions, emphasizing the dynamic and individualized nature of cyber defense exercises.
The correlation analyses provide important insights into the mechanisms underlying decision stability in CDX environments. Within DS6, weak direct correlations between CDR and purely technical variables indicate that technical expertise alone has limited explanatory power for reflective decision behavior. Instead, the negative associations observed between CDR and teamwork-related variables suggest that stronger within-team communication and collaboration contribute to greater decision stability and reduced need for post hoc decision revision. These findings emphasize the critical role of team coordination, shared situational awareness, and communication quality in cybersecurity operations and incident response environments. From a broader perspective, the results support socio-technical interpretations of cyber defense performance, where collective interaction mechanisms become more influential than isolated individual expertise.
The DS12 analysis further extends this interpretation by demonstrating that stress, fatigue, motivation, responsibility, and self-confidence form an interconnected cognitive–emotional structure influencing decision reflection outcomes. Strong positive relationships among stress-related and motivational constructs indicate that CDX participants experience psychological load as a multidimensional phenomenon rather than as isolated variables. At the same time, the observed negative relationships between CDR and stress-related factors suggest that elevated psychological pressure may reduce adaptive reconsideration of decisions. This observation corresponds with dual-process decision-making theories, particularly Kahneman’s System 1 and System 2 framework, where high-pressure environments often promote rapid intuitive judgments while limiting reflective analytical reassessment. Consequently, the findings imply that excessive cognitive–emotional load may reduce the flexibility of decision adaptation during cyber defense operations.
The 3D regression and RBF surface analyses additionally demonstrated that the relationships between human factors and decision reflection are predominantly nonlinear, weak-to-moderate, and context-dependent. None of the analyzed variable combinations produced strong deterministic prediction surfaces, while several interaction patterns exhibited localized effects rather than globally monotonic trends. These results suggest that human behavior in CDX environments is governed by higher-order interactions and latent contextual dependencies that cannot be adequately captured through traditional linear statistical approaches alone. The observed weak explanatory power of several regression surfaces further confirms the complexity and stochastic nature of human-centered cybersecurity decision-making.
The ANFIS modeling results substantially reinforce these observations. Across both datasets, generalized bell membership functions achieved the lowest training errors, indicating strong approximation capability; however, their degraded testing performance revealed clear overfitting tendencies under small-sample conditions. In contrast, triangular membership functions consistently demonstrated more balanced generalization performance, particularly in the original DS6 and DS12 datasets, achieving the lowest testing RMSE and MAPE values. This finding suggests that simpler piecewise-linear fuzzy partitions may provide greater robustness when modeling sparse behavioral datasets with discrete Likert-scale variables. The results also highlight an important methodological trade-off between model interpretability and predictive smoothness. While Gaussian and generalized bell functions improved continuity and stability of rule activation, triangular functions generated more transparent and interpretable fuzzy rules suitable for human-centric cybersecurity analysis.
The derived fuzzy rules further revealed that balanced combinations of medium-to-high teamwork, communication, motivation, and responsibility variables were consistently associated with stable decision outcomes. Importantly, the dominant rules across both DS6 and DS12 converged around moderate CDR values rather than extreme outcomes, suggesting that cyber defense decision-making is primarily characterized by partial adaptation and incremental reflection rather than radical decision reversal.
The theoretical number of fuzzy rules increases exponentially with the number of input variables, and only a small subset of rules of DS12 was activated because many possible input combinations were not represented in the empirical data. Such rule sparsity is characteristic of high-dimensional feature spaces and may increase the risk of overfitting due to the limited support available for some rule combinations. To mitigate this risk, model performance was evaluated on separate test datasets using multiple membership function types. The sparse activation of the DS12 rule space additionally demonstrates the challenges associated with high-dimensional fuzzy inference under limited observational conditions. The observed sparsity may also be interpreted as evidence that only a limited subset of human-factor combinations meaningfully contributes to decision reflection behavior. From a human-centered modeling perspective, this is advantageous because it enables the identification of influential factor interactions while avoiding the interpretation of thousands of theoretically possible but empirically unsupported rules. The extracted rules remain highly valuable from an explainable AI perspective because they provide interpretable representations of the latent behavioral structures underlying CDX participant decisions.
One of the most significant findings of the study is the substantial improvement achieved through synthetic data augmentation. The original datasets produced clear overfitting symptoms, with large discrepancies between training and testing errors across all membership functions. However, the application of synthetic generation methods, including SMOTE, ADASYN, CTGAN, Gaussian Copula, Fuzzy Cluster, and SMOTEBoost, improved ANFIS generalization capability. In dataset DS6, SMOTEBoost combined with generalized bell membership functions achieved the strongest predictive performance, whereas in DS12 the best results were obtained using SMOTE with trapezoidal membership functions. Although synthetic augmentation improved model stability and expanded the effective training space, the predictive performance remained strongly dependent on the characteristics of the original dataset, highlighting that synthetic data should be viewed as a complementary rather than a substitute source of information. Therefore, the generalizability of the proposed ANFIS framework beyond the investigated CDX settings remains to be established through validation on larger and more diverse datasets.
The comparative performance of augmentation approaches also provides important methodological implications. Hybrid oversampling and generative adversarial approaches, such as SMOTEBoost and CTGAN, demonstrated good capability to preserve complex nonlinear interactions among emotional, motivational, technical, and collaborative variables. In contrast, probabilistic and clustering-based methods such as Gaussian Copula and Fuzzy Cluster produced more moderate improvements, although still outperforming the baseline models. These findings indicate that preserving latent interaction structures is essential for reliable human-factor prediction in cybersecurity contexts. More broadly, the results support the integration of synthetic-data-enhanced neuro-fuzzy modeling into future cybersecurity behavioral analytics frameworks.
6. Conclusions
This study presents a human-centered neuro-fuzzy modeling framework for analyzing and predicting decision-making behavior in cyber defense exercises using two complementary datasets that capture technical, emotional, motivational, and collaborative human factors. The obtained results demonstrate that decision reflection outcomes in CDX are not primarily determined by technical competencies alone, but instead emerge from complex nonlinear interactions among psychological, cognitive, and team-oriented variables. The findings confirm the multidimensional and socio-technical nature of cybersecurity decision-making processes. The analysis showed that teamwork, communication, responsibility, motivation, stress, and self-confidence have a stronger influence on decision stability than isolated technical expertise. These findings suggest that future cyber defense exercises should incorporate structured communication protocols, collaborative decision checkpoints, and team-synchronization mechanisms in addition to technical training objectives. The identified relationships between teamwork, collaboration, and decision stability may guide exercise designers in developing targeted interventions aimed at reducing decision uncertainty and improving operational effectiveness.
Nonlinear regression and RBF surface analyses confirmed that these relationships are context-dependent and cannot be adequately modeled using conventional linear approaches, supporting the use of ANFIS for this task.
The ANFIS models achieved acceptable predictive accuracy, with generalized bell and triangular membership functions providing the best balance between accuracy and generalization. Extracted fuzzy rules showed that stable decision outcomes are associated with balanced, medium-to-high levels of collaboration, communication, motivation, and responsibility, while decision adaptation is typically moderate rather than extreme. From a decision-support perspective, the extracted fuzzy rules may be embedded into real-time decision support systems capable of monitoring human-factor indicators during exercises.
A study demonstrated that synthetic data augmentation improves ANFIS robustness and predictive performance in small cybersecurity datasets. Methods such as SMOTE, ADASYN, CTGAN, and SMOTEBoost reduced overfitting and improved generalization across both datasets. Although the obtained results demonstrate the feasibility of predicting Counterfactual Decision Reflection using ANFIS and synthetic data augmentation techniques, the findings should be considered exploratory due to the limited size of the original datasets. Further validation using larger and more diverse samples collected from multiple cyber defense exercises is required to confirm the robustness, external validity, and generalizability of the proposed framework.
Author Contributions
Conceptualization, K.K. and D.M.; methodology, K.K. and D.M.; software, K.K.; validation, K.K. and D.M.; formal analysis, K.K.; investigation, K.K.; resources, K.K.; data curation, K.K.; writing—original draft preparation, K.K.; writing—review and editing, D.M.; visualization, K.K.; supervision, D.M.; project administration, D.M. All authors have read and agreed to the published version of the manuscript.
Funding
This research received no external funding.
Institutional Review Board Statement
Not applicable.
Informed Consent Statement
Not applicable.
Data Availability Statement
The data presented in this study are available on reasonable request from the corresponding author.
Conflicts of Interest
The authors declare that they have no conflicts of interest.
References
- Seker, E.; Ozbenli, H.H. The Concept of Cyber Defence Exercises (CDX): Planning, Execution, Evaluation. In Proceedings of the 2018 International Conference on Cyber Security and Protection of Digital Services (Cyber Security), Glasgow, UK, 11–12 June 2018; IEEE: Piscataway, NJ, USA, 2018; pp. 1–9. [Google Scholar]
- Corradini, I.; Nardelli, E. Advances in Human Factors in Cybersecurity. In Proceedings of the AHFE 2020 Virtual Conference on Human Factors in Cybersecurity, Virtual, 16–20 July 2020; Advances in Intelligent Systems and Computing, USA; Springer: Berlin/Heidelberg, Germany, 2020. [Google Scholar]
- Ayyad, W.R.; Al-Haija, Q.A.; Al-Masri, H.M.K. Chapter 11 of the title. Human factors in cybersecurity. In Smart and Agile Cybersecurity for IoT and IIoT Environments; IGI Global: Palmdale, PA, USA, 2024; pp. 235–256. [Google Scholar]
- Ask, T.F.; Lugo, R.G.; Knox, B.J.; Sütterlin, S. Human-Human Communication in Cyber Threat Situations: A Systematic Review. In Proceedings of the HCI International 2021—Late Breaking Papers: Cognition, Inclusion, Learning, and Culture: 23rd HCI International Conference, HCII, Virtual Event, 24–29 July 2021. [Google Scholar]
- Hasmady, A.; Subramaniam, S.A.; Mohamad Nor, N.; Wahab, Y.A. From Military Training to Cognitive Readiness: The Role of Military Leader. Int. J. Acad. Res. Bus. Soc. Sci. 2025, 15, 1–30. [Google Scholar] [CrossRef] [Scilit]
- Čiurlienė, K. Holistic view on decision-making in Cyber Defense Exercises: A case study based in Amber Mist. In Proceedings of the 2025 IEEE Open Conference of Electrical, Electronic and Information Sciences (eStream), Vilnius, Lithuania, 24 April 2025; IEEE: Piscataway, NJ, USA, 2025; pp. 1–6. [Google Scholar]
- Deline, S.; Guillet, L.; Rauffet, P.; ClémentNobles, C.; Robinson, N. The Missing Engineering Discipline in Cybersecurity: Human Factors Engineering. In Proceedings of the Human Factors and Ergonomics Society, Lübeck, Germany; SAGE Publications: Los Angeles, CA, USA, 2024. [Google Scholar]
- Deline, S.; Guillet, L.; Rauffet, P.; Guerin, C. Team Cognition in a Cyber Defence Context: Focus on Social Support Behaviours; Springer: Berlin/Heidelberg, Germany, 2021; Volume 23, pp. 51–63. [Google Scholar]
- Takehara, I.; Kami, Y.; Kamei, H.; Kida, K.; Saisho, K. Development of Score Measurement and Attack Functions in a Security Exercise System Enable Trial-and-Error. In Proceedings of the 16th IIAI International Congress on Advanced Applied Informatics (IIAI-AAI), Takamatsu, Japan, 6–12 July 2024; IEEE: Piscataway, NJ, USA, 2024; pp. 206–211. [Google Scholar]
- Babayeva, G.; Maennel, K.; Maennel, O.M. Building an Ontology for Cyber Defence Exercises. In Proceedings of the 2022 IEEE European Symposium on Security and Privacy Workshops (EuroS&PW), Genoa, Italy, 6–10 June 2022. [Google Scholar]
- Noureddine, M.; Keefe, K.; Sanders, W.H.; Bashir, M. Quantitative security metrics with human in the loop. In Proceedings of the HotSoS ’15: Symposium and Bootcamp on the Science of Security, Urbana, IL, USA, 21–22 April 2015. [Google Scholar]
- Mäses, S.; Maennel, K.; Brilingaitė, A. Trends and challenges for balanced scoring in cybersecurity exercises: A case study on the example of Locked Shields. Front. Educ. 2022, 7, 958405. [Google Scholar] [CrossRef] [Scilit]
- Granåsen, M.; Granåsen, D. Measuring team effectiveness in cyber-defense exercises: A cross-disciplinary case study. Cogn. Technol. Work 2016, 18, 121–143. [Google Scholar]
- Kunz, T.; Fisher, C.; Novara-Gsell, J.L.; Nguyen, C.; Li, L. A Multiagent Cyber Battle Sim for RL Cyber Operation Agents. In Proceedings of the 2022 International Conference on Computational Science and Computational Intelligence (CSCI), Las Vegas, NV, USA, 14–16 December 2022; IEEE: Piscataway, NJ, USA, 2022; pp. 897–903. [Google Scholar]
- Smeets, M. The Role of Military Cyber Exercises: A Case Study of Locked Shields. In Proceedings of the 14th International Conference on Cyber Conflict: Keep Moving! CyCon, Tallinn, Estonia, 31 May–3 June 2022; IEEE: Piscataway, NJ, USA, 2022; pp. 9–25. [Google Scholar]
- Lugo, R.; Juozapavičius, A.; Lapin, K.; Ask, T.; Knox, B.; Sütterlin, S. Human-Centric Approach to Cyber Threat Identification: The Role of Cognition, Experience, and Education in Decision-Making. J. Cases Inf. Technol. 2025, 27, 1–13. [Google Scholar]
- Holm, H.; Sommestad, T. Realistic and balanced automated threat emulation. Comput. Secur. 2025, 151, 604. [Google Scholar] [CrossRef] [Scilit]
- Crameri, L.; Hettiarachchi, I.; Hanoun, S. A review of individual operational cognitive readiness: Theory development and future directions. Hum. Factors Ergon. Soc. Sage J. 2021, 63, 66–87. [Google Scholar]
- Tait, J.L.; Aisbett, B.; Corrigan, S.L.; Drain, J.R.; Main, L.C. Recovery of Cognitive Performance Following Multi-Stressor Military Training. Hum. Factors 2024, 66, 389–403. [Google Scholar] [PubMed]
- Martin, K.; Périard, J.; Rattray, B.; Pyne, D.B. Physiological Factors Which Influence Cognitive Performance in Military Personnel. Hum. Factors 2020, 62, 93–123. [Google Scholar] [PubMed]
- Ejiofor, O.; Obu, A.; Yusuf, T.; Tonui, I.; Yusuf, B. Human factors in cybersecurity: Training and awareness for analysts. Comput. Sci. IT Res. J. 2025, 6, 252–265. [Google Scholar] [CrossRef] [Scilit]
- Klein, G. Naturalistic decision making. Hum. Factors 2008, 50, 456–460. [Google Scholar] [CrossRef] [Scilit] [PubMed]
- Pfaller, T.; Skopik, F.; Smith, P.; Leitner, M. Towards Customized Cyber Exercises using a Process-based Lifecycle Model. In Proceedings of the EICC ’24 2024 European Interdisciplinary Cybersecurity Conference, Xanthi, Greece, 5–6 June 2024. [Google Scholar]
- Hagen, R.A.; Øverlier, L.; Helkala, K. Human Factors in AI-Driven Cybersecurity: Cognitive Biases and Trust Issues. Digit. Threat. Res. Pract. 2025, 6, 1–20. [Google Scholar] [CrossRef] [Scilit]
- Croskerry, P.; Petrie, D.A.; Reilly, J.B.; Tait, G. Deciding about fast and slow decisions. Acad. Med. 2014, 89, 197–200. [Google Scholar] [CrossRef] [Scilit] [PubMed]
- Tobey, D.H. A Vignette-based Method for Improving Cybersecurity Talent Management through Cyber Defense Competition Design. In Proceedings of the 2015 ACM SIGMIS Conference on Computers and People Research (SIGMIS-CPR ’15), Newport Beach, CA, USA, 4–6 June 2015; Association for Computing Machinery: New York, NY, USA, 2015; pp. 31–39. [Google Scholar]
- Furtună, A.; Patriciu, V.-V.; Bica, I. A structured approach for implementing cyber security exercises. In Proceedings of the 2010 8th International Conference on Communications, Bucharest, Romania, 10–12 June 2010; IEEE: Piscataway, NJ, USA, 2010; pp. 415–418. [Google Scholar]
- Ay, T.; Özdemir, A. Perception of Cognitive Biases in Decision-Making Scale (PCBDM-S): Development and initial validation of a self-report measure for assessing cognitive bias perception. Curr. Psychol. 2025, 44, 12820–12834. [Google Scholar]
- Klein, G.A. Decision Making in Action: Models and Methods (Cognition and Literacy), 1st ed.; Ablex Publishing: New York, NY, USA, 1993; p. 480. [Google Scholar]
- Lerner, J.S.; Li, Y.; Valdesolo, P.; Kassam, K.S. Emotion and decision making. Annu. Rev. Psychol. 2015, 66, 799–823. [Google Scholar] [CrossRef] [Scilit] [PubMed]
- Zadeh, L.A. Fuzzy sets. Inf. Control 1965, 8, 338–353. [Google Scholar] [CrossRef] [Scilit]
- Szollosi, A.; Newell, B.R. People as Intuitive Scientists: Reconsidering Statistical Explanations of Decision Making. Trends Cogn. Sci. 2020, 24, 1008–1018. [Google Scholar] [CrossRef] [Scilit] [PubMed]
- Lamond, D.; Thompson, C. Intuition and analysis in decision making and choice. J. Nurs. Scholarsh. Off. Publ. Sigma Theta Tau Int. Honor Soc. Nurs. 2000, 32, 411–414. [Google Scholar] [CrossRef] [Scilit]
- Lipshitz, R.; Klein, G.; Orasanu, J.; Salas, E. Taking stock of naturalistic decision making. J. Behav. Decis. Mak. 2001, 14, 331–352. [Google Scholar] [CrossRef] [Scilit]
- Hussain, A.; Kuhn, K.; Shaikh, S.A. Games for Cybersecurity Decision-Making. In HCI in Games: Second International Conference, HCI-Games 2020. In Proceedings of the 22nd HCI International Conference, HCII 2020, Copenhagen, Denmark, 19–24 July 2020. [Google Scholar]
- Mäses, S.; Maennel, K.; Toussaint, M.; Rosa, V. Success Factors for Designing a Cybersecurity Exercise on the Example of Incident Response. In Proceedings of the 2021 IEEE European Symposium on Security and Privacy Workshops (EuroS&PW), Vienna, Austria; IEEE: Piscataway, NJ, USA, 2021; pp. 259–268. [Google Scholar]
- Piplai, A.; Anoruo, M.; Fasaye, K.; Joshi, A.; Finin, T.; Ridley, A. Knowledge Guided Two-player Reinforcement Learning for Cyber Attacks and Defenses. In Proceedings of the 21st IEEE International Conference on Machine Learning and Applications, ICMLA 2022, Nassau, Bahamas, 12–14 December 2022; IEEE: Piscataway, NJ, USA, 2022; pp. 1342–1349. [Google Scholar]
- Takehara, I.; Ishizuka, M.; Kamei, H.; Kida, K.; Saisho, K. Evaluation of Processing Time in Trial-and-Error Function of Security Exercise System for Security Beginners. In Proceedings of the Congress in Computer Science, Computer Engineering, & Applied Computing (CSCE), Las Vegas, NV, USA, 24–27 July 2023; IEEE: Piscataway, NJ, USA, 2023; pp. 871–876. [Google Scholar]
- Brilingaitė, A.; Bukauskas, L.; Juozapavičius, A. A framework for competence development and assessment in hybrid cybersecurity exercises. Comput. Secur. 2020, 88, 101607. [Google Scholar] [CrossRef] [Scilit]
- Damasio, A.; Carvalho, G. The nature of feelings: Evolutionary and neurobiological origins. Nat. Rev. Neuroscene 2013, 14, 143–152. [Google Scholar] [CrossRef] [Scilit]
- Kahneman, D. Thinking, Fast and Slow, 1st ed.; PFarrar, Staus and Giroux: New York, NY, USA, 2011; p. 485. [Google Scholar]
- Kannengiesser, U.; Gero, J.S. Design thinking, fast and slow: A framework for Kahneman’s dual-system theory in design. Des. Sci. 2019, 5, 10. [Google Scholar] [CrossRef] [Scilit]
- Wu, H.; Xu, Z. Fuzzy Logic in Decision Support: Methods, Applications and Future Trends. Int. J. Comput. Commun. Control 2020, 16, 1–28. [Google Scholar] [CrossRef] [Scilit]
- Ali, O.A.M.; Ali, A.Y.; Sumait, B.S. Comparison between the effects of different types of membership functions on fuzzy logic controller performance. Int. J. 2015, 76, 76–83. [Google Scholar]
- Jang, J.S.R. ANFIS: Adaptive-network-based fuzzy inference system. IEEE Trans. Syst. Man. Cybern. 1993, 23, 665–685. [Google Scholar] [CrossRef] [Scilit]
- Takagi, T.; Sugeno, M. Fuzzy identification of systems and its applications to modeling and control. IEEE Trans. Syst. Man Cybern. 1985, 15, 116–132. [Google Scholar] [CrossRef] [Scilit]
- Slavyanov, K.; Dimov, R. Application of fuzzy logic in cybersecurity decision making and analysis after a cyber incident detection. Environment. Technologies. Resources. In Proceedings of the International Scientific and Practical Conference 2024, Veliko Tarnovo, Bulgaria, 27–28 June 2024. [Google Scholar]
- Sielskaitė, Š.; Kalibatienė, D. The Impact of Human Factors on Software Development Processes Applying the Agile and Waterfall Methodologies: A Case Study Using Real Data. Int. J. Comput. Commun. Control 2025, 20, 1–19. [Google Scholar] [CrossRef] [Scilit]
- Rahman, S.; Ahmed, M.R.; Kaiser, M.S. ANFIS based cyber physical attack detection system. In 2016 5th International Conference on Informatics, Electronics and Vision (ICIEV), Dhaka, Bangladesh, 13–14 May 2016; IEEE: Piscataway, NJ, USA, 2016; pp. 944–948. [Google Scholar]
- Chawla, N.; Bowyer, K.; Hall, L.O.; Kegelmeyer, W.P. SMOTE: Synthetic Minority Over-sampling Technique. J. Artif. Intell. Res. 2002, 16, 321–357. [Google Scholar] [CrossRef] [Scilit]
- Chawla, N.; Lazarevic, A.; Hall, L.O.; Bowyer, K. SMOTEBoost: Improving Prediction of the Minority Class in Boosting. In Proceedings of the European Conference on Principles of Data Mining and Knowledge Discovery, Cavtat-Dubronik, Croatia, 22–26 September 2003; IEEE: Piscataway, NJ, USA, 2003; pp. 107–119. [Google Scholar]
- Moniz, N.; Ribeiro, R.P.; Cerqueira, V.; Chawla, N. SMOTEBoost for Regression: Improving the Prediction of Extreme Values. In Proceedings of the 2018 IEEE 5th International Conference on Data Science and Advanced Analytics (DSAA), Turin, Italy, 1–4 October 2018; Springer: Berlin/Heidelberg, Germany, 2018; pp. 150–159. [Google Scholar]
- He, H.; Bai, Y.; Garcia, E.A.; Li, S. ADASYN: Adaptive synthetic sampling approach for imbalanced learning. In Proceedings of the 2008 IEEE International Joint Conference on Neural Networks (IEEE World Congress on Computational Intelligence), Hong Kong, China, 1–8 June 2008; IEEE: Piscataway, NJ, USA, 2008; pp. 1322–1328. [Google Scholar]
- Chen, Z.; Zhou, L.; Yu, W. ADASYN−Random Forest Based Intrusion Detection Model. In Proceedings of the 2021 4th International Conference on Signal Processing and Machine Learning, Beijing, China, 18–20 August 2021. [Google Scholar]
- Li, L.; Yu, Y.; Liang, W.; Zou, F. A novel approach for estimating multi-attribute Gaussian copula graphical models. Stat. Probab. Lett. 2025, 222, 110413. [Google Scholar] [CrossRef] [Scilit]
- Xu, L.; Skoularidou, M.; Cuesta-Infante, A.; Veeramachaneni, K. Modeling Tabular data using Conditional GAN. Neural Inf. Process. Syst. 2019, 6, 1–15. [Google Scholar]
- Alabdulwahab, S.; Kim, Y.-T.; Seo, A.; Son, Y. Generating Synthetic Dataset for ML-Based IDS Using CTGAN and Feature Selection to Protect Smart IoT Environments. Appl. Sci. 2023, 13, 10951. [Google Scholar]
- Ung, T.T.; Nguyen, C.T.; Le, T.D.D.; Pham, T.; Bui, T.L. A Hybrid Balancing Method for IDS Datasets Using CTGAN + K-Means. In Proceedinigs of the 2nd International Conference on Cryptography and Information Security (VCRIS), Hanoi, Vietnam, 30–31 October 2025; IEEE: Piscataway, NJ, USA, 2025; pp. 1–6. [Google Scholar]
- Chiu, S. Fuzzy Model Identification Based on Cluster Estimation. J. Intell. Fuzzy Syst. 1994, 2, 267–278. [Google Scholar] [CrossRef] [Scilit]
- Ryoke, M.; Nakamori, Y.; Suzuki, K. Adaptive fuzzy clustering and fuzzy prediction models. In Proceedings of the IEEE International Conference on Fuzzy Systems, Yokohama, Japan, 20–24 March 1995; IEEE: Piscataway, NJ, USA, 1995; pp. 2215–2220. [Google Scholar]
- Khan, N.F.; Ikram, N.; Murtaza, H.; Javed, M. Evaluating protection motivation based cybersecurity awareness training on Kirkpatrick’s model. Comput. Secur. 2023, 125, 103049. [Google Scholar]
- Hámornik, B.P.; Krasznay, C. A Team-Level Perspective of Human Factors in Cyber Security: Security Operations Centers. In Advances in Human Factors in Cybersecurity; Nicholson, D., Ed.; AHFE 2017. Advances in Intelligent Systems and Computing; Springer: Berlin/Heidelberg, Germany, 2018; Volume 593, pp. 224–236. [Google Scholar]
- Upadhyay, H.; Sunori, S.K.; Mittal, A.; Juneja, P. Cybersecurity risk prediction using fuzzy logic based models. In Proceedings of the 8th International Conference on Trends in Electronics and Informatics (ICOEI), Tirunelveli, India; IEEE: Piscataway, NJ, USA, 2025; pp. 717–722. [Google Scholar]
- Bajeh, A.O.; Olaoye, M.O.; Mobolaji, D.M.; Usman-Hamza, F.E.; Olatinwo, I.S.; Sadiku, P.O.; Sakariyah, A.B. An adaptive neuro-fuzzy inference system for multinomial malware classification. J. Niger. Soc. Phys. Sci. 2025, 7, 2172. [Google Scholar]
- Roese, N.J. Counterfactual thinking. Psychol. Bull. 1997, 121, 133–148. [Google Scholar] [CrossRef] [Scilit] [PubMed]
- Epstude, K.; Roese, N.J. The Functional Theory of Counterfactual Thinking. Personal. Soc. Psychol. Rev. 2008, 12, 168–192. [Google Scholar] [CrossRef] [Scilit]
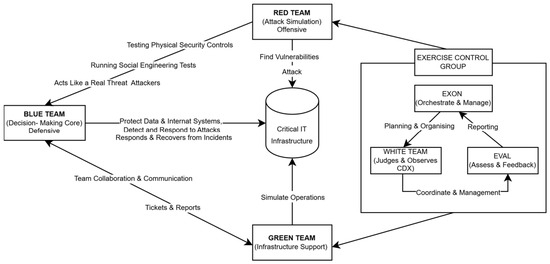
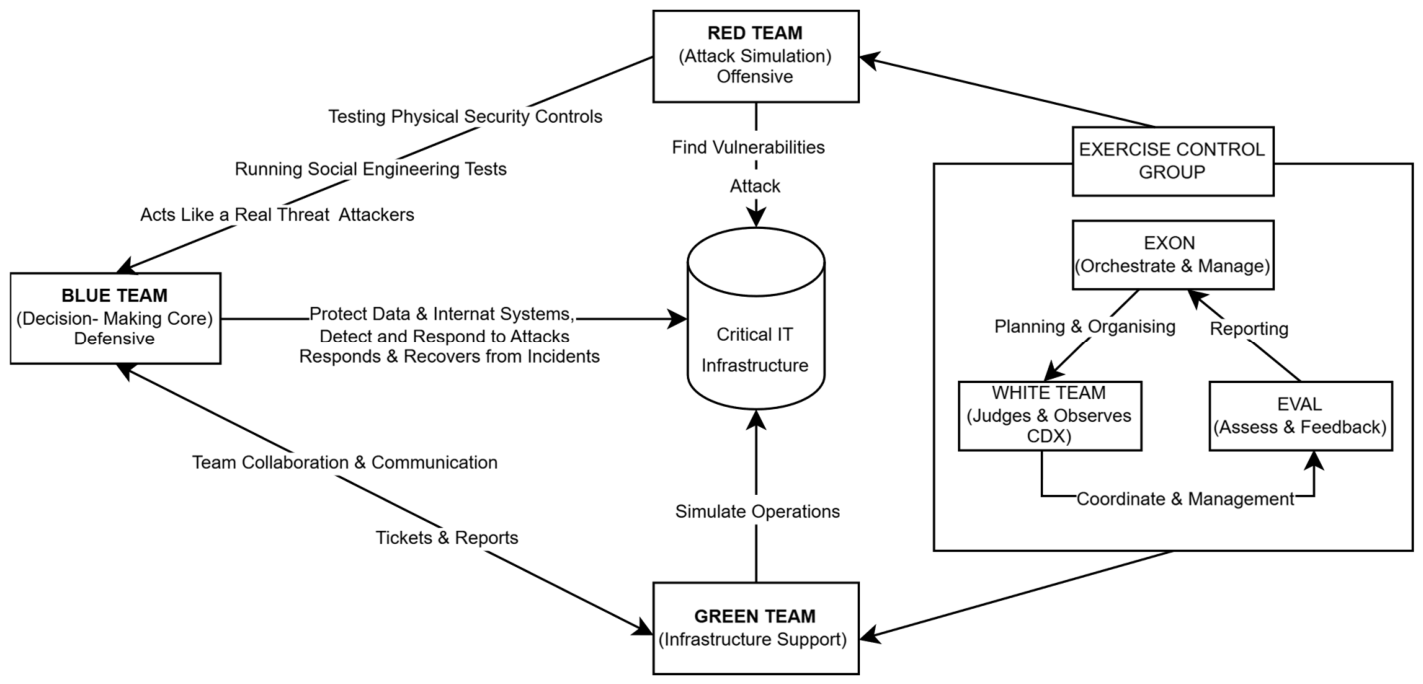
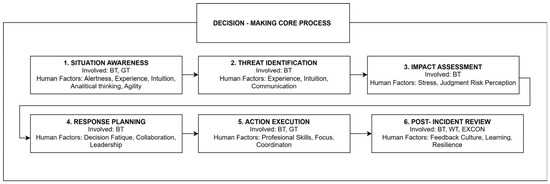
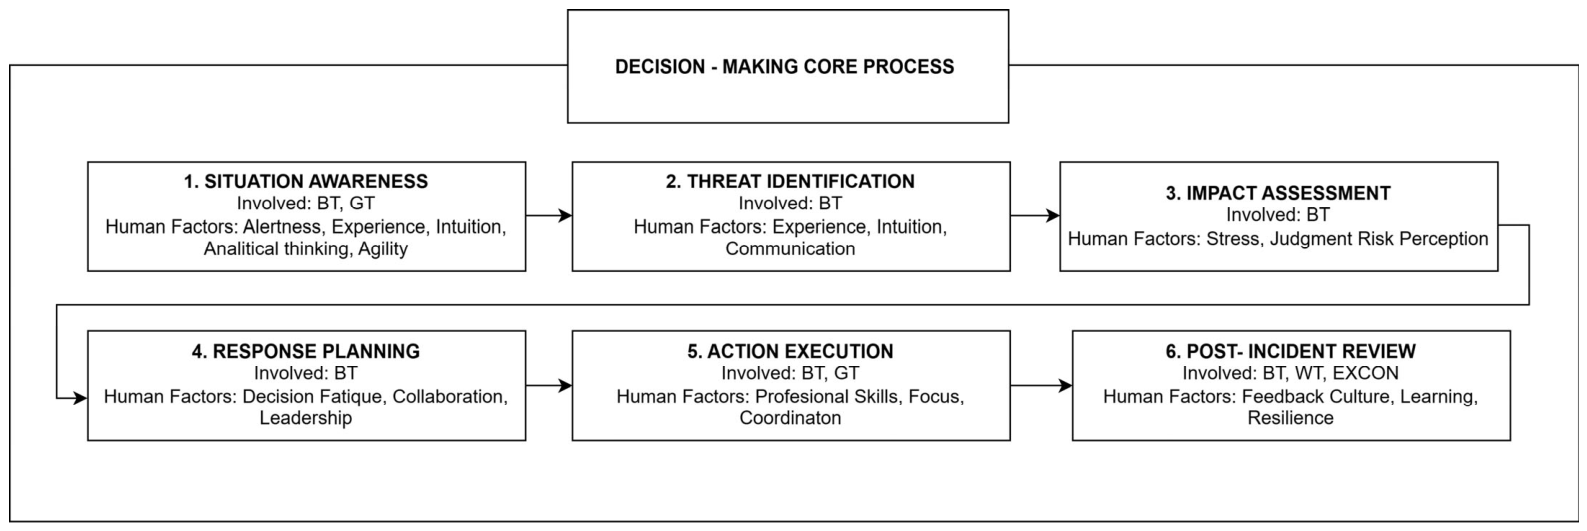
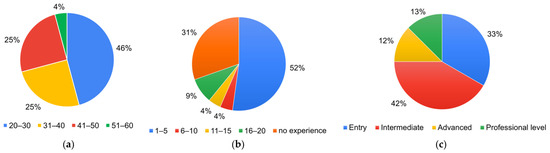
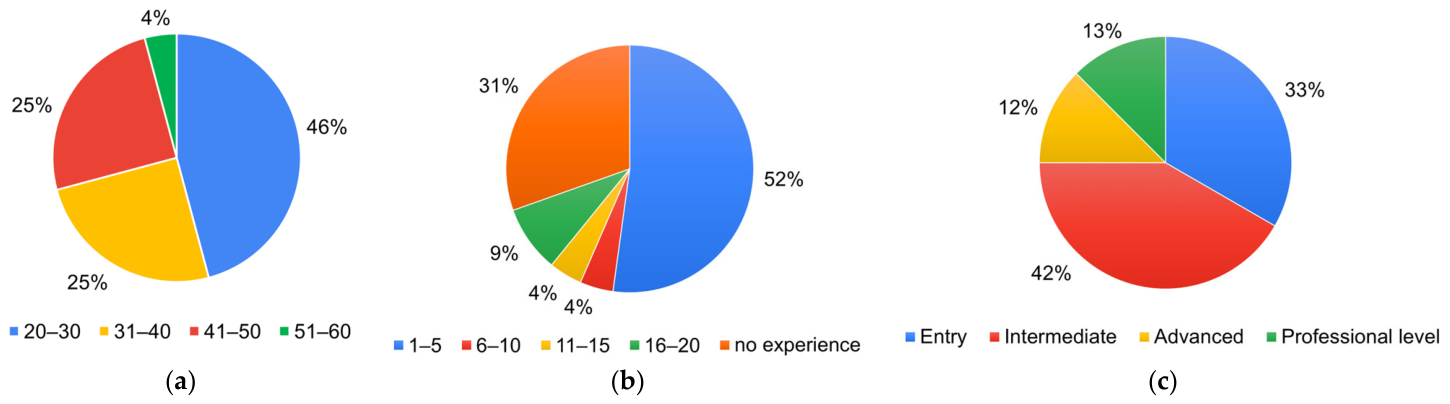
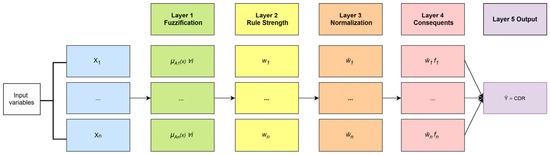
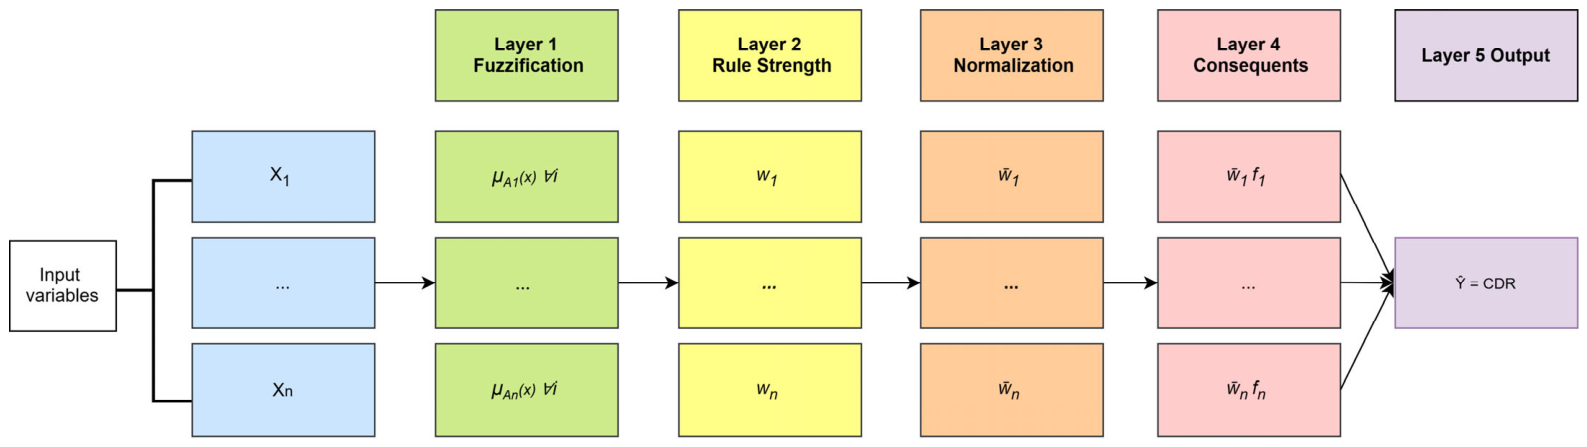
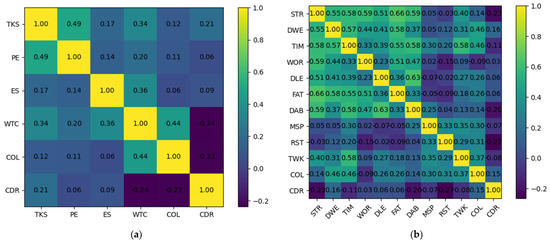
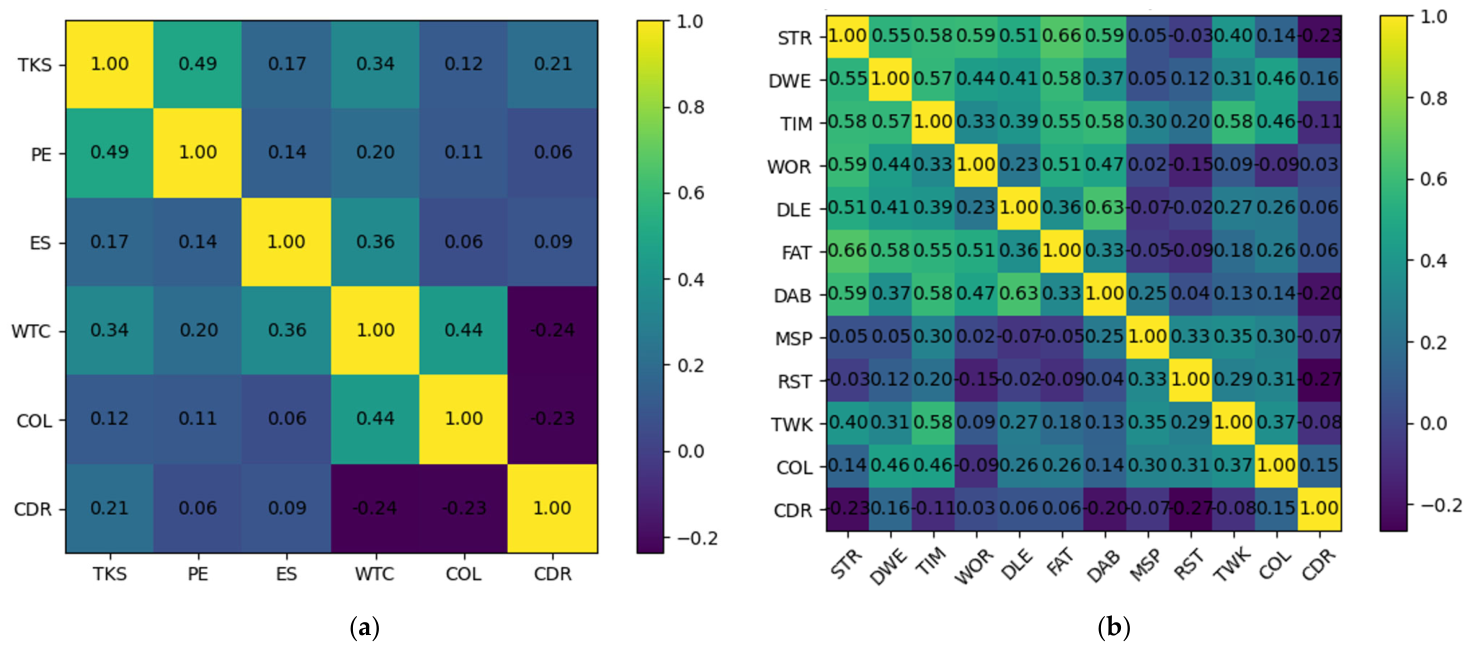
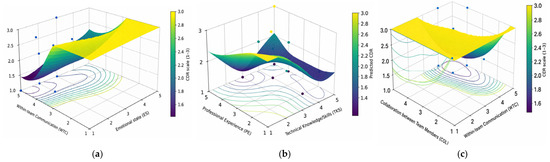
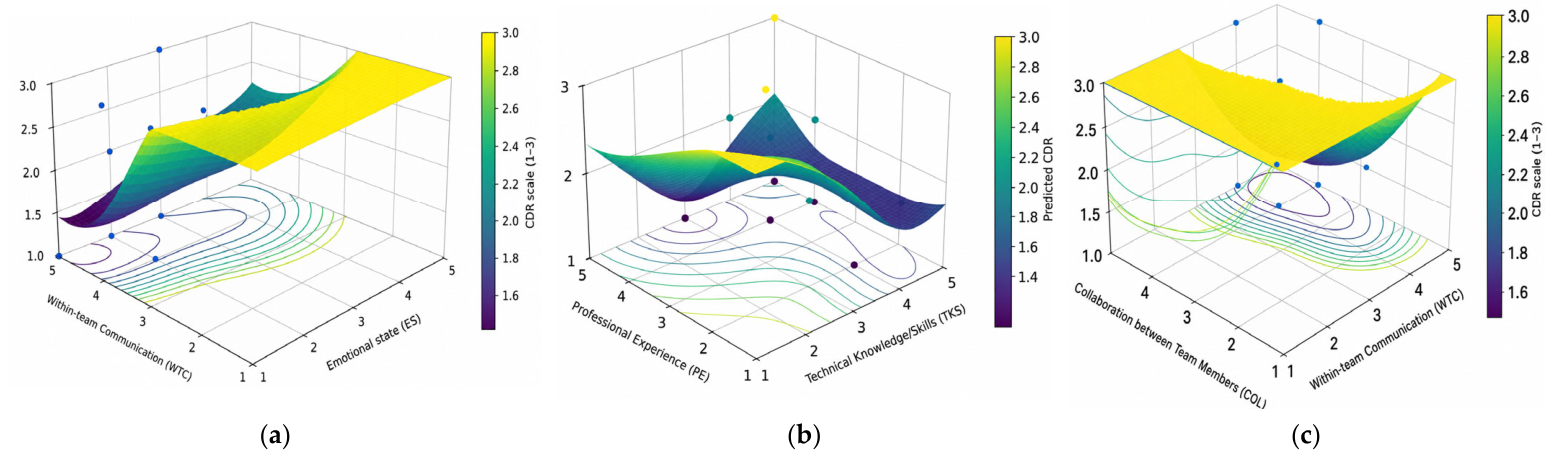
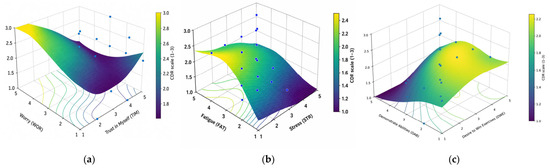
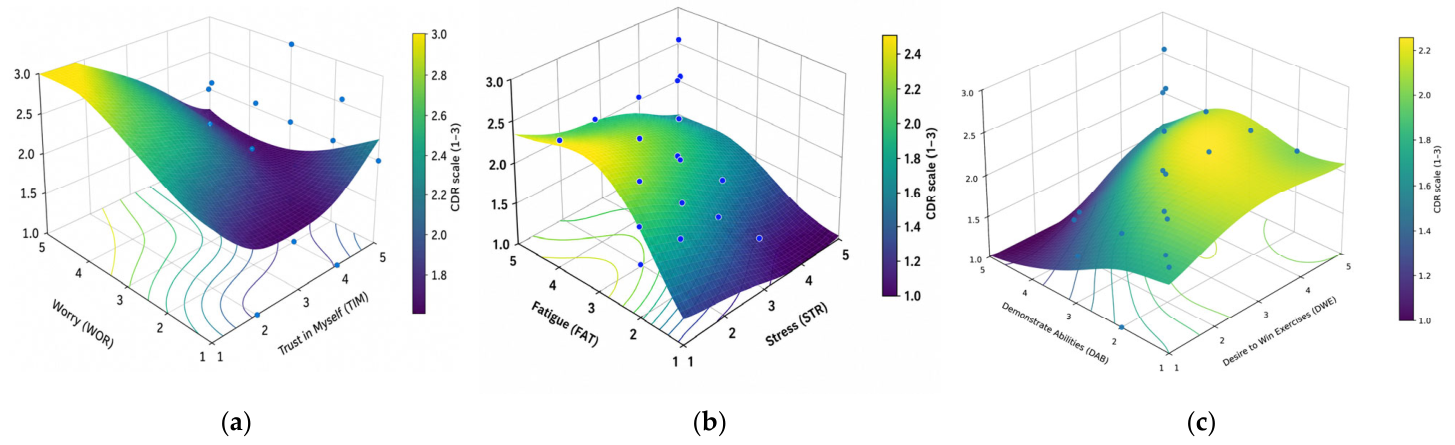
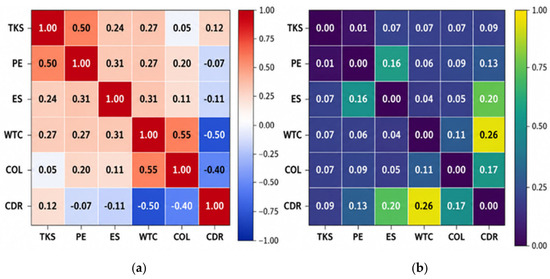
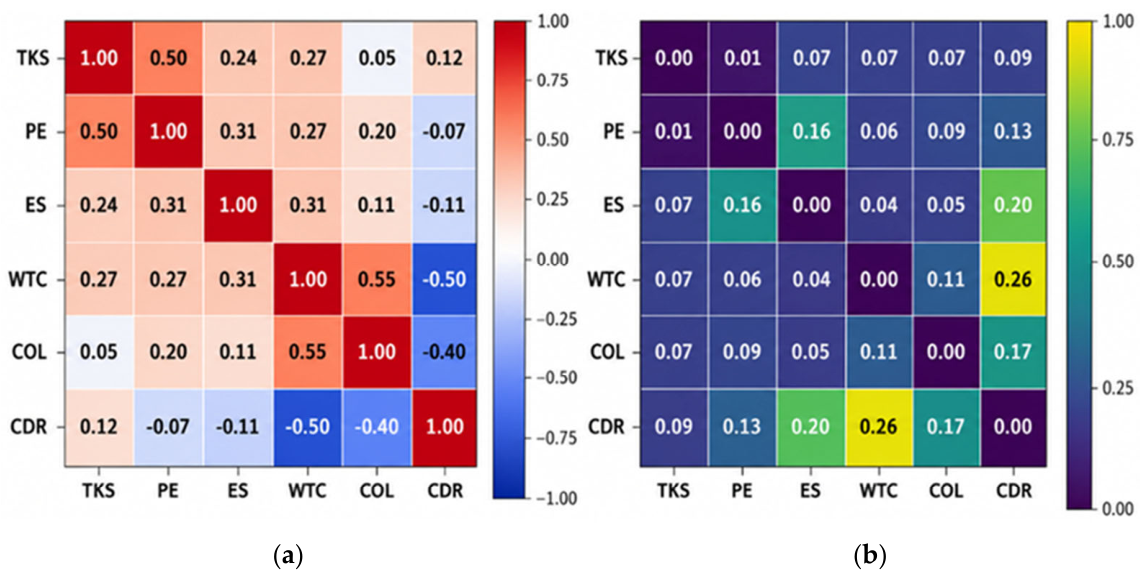
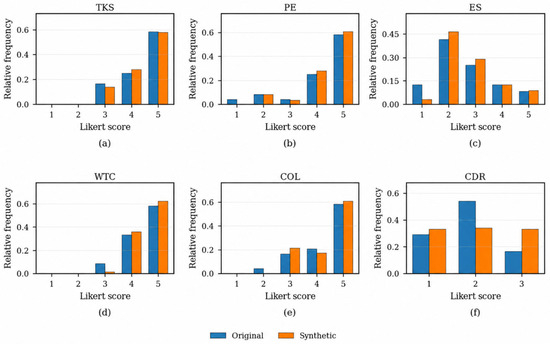
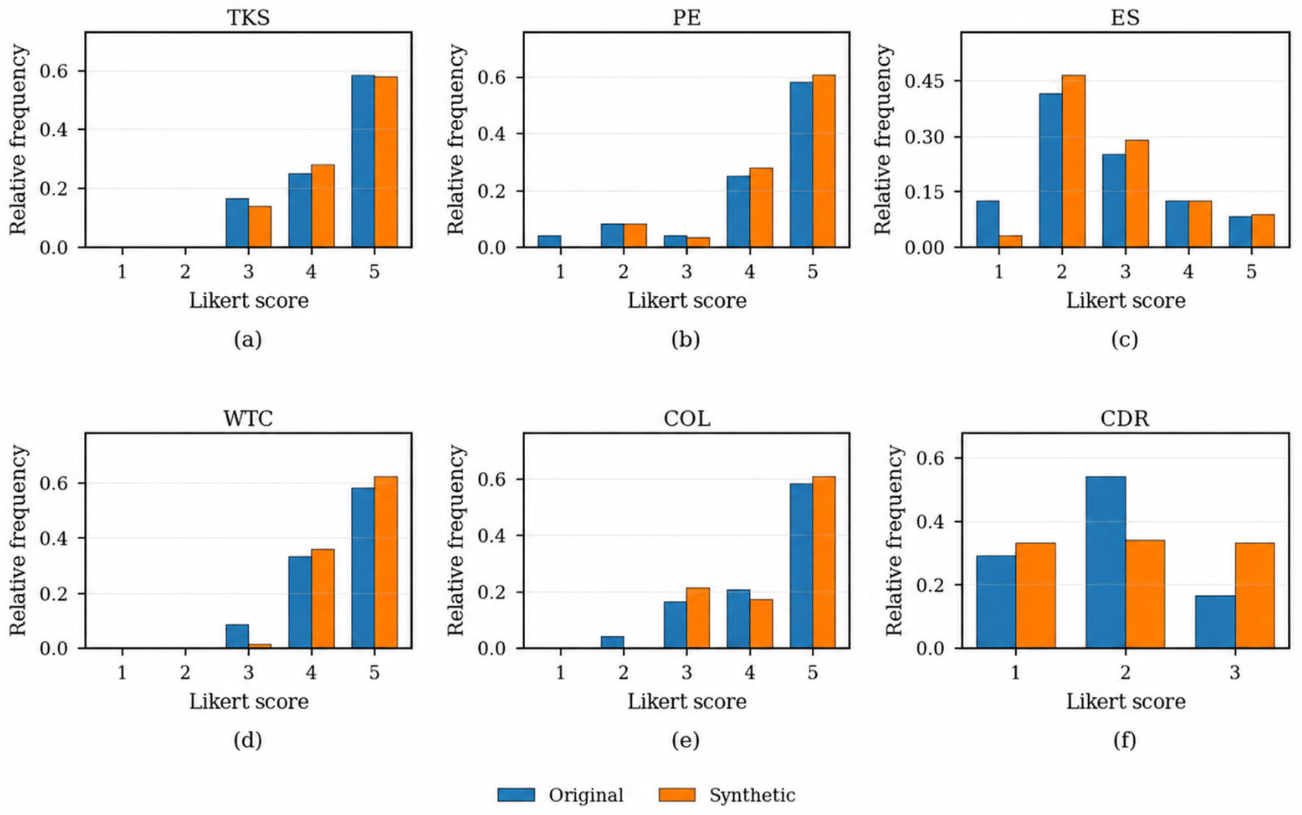
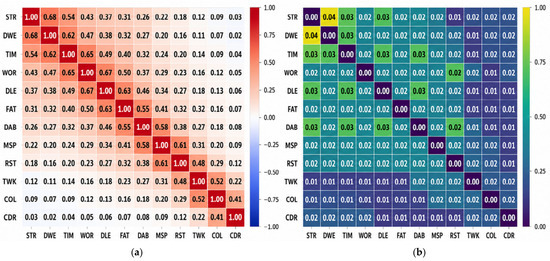
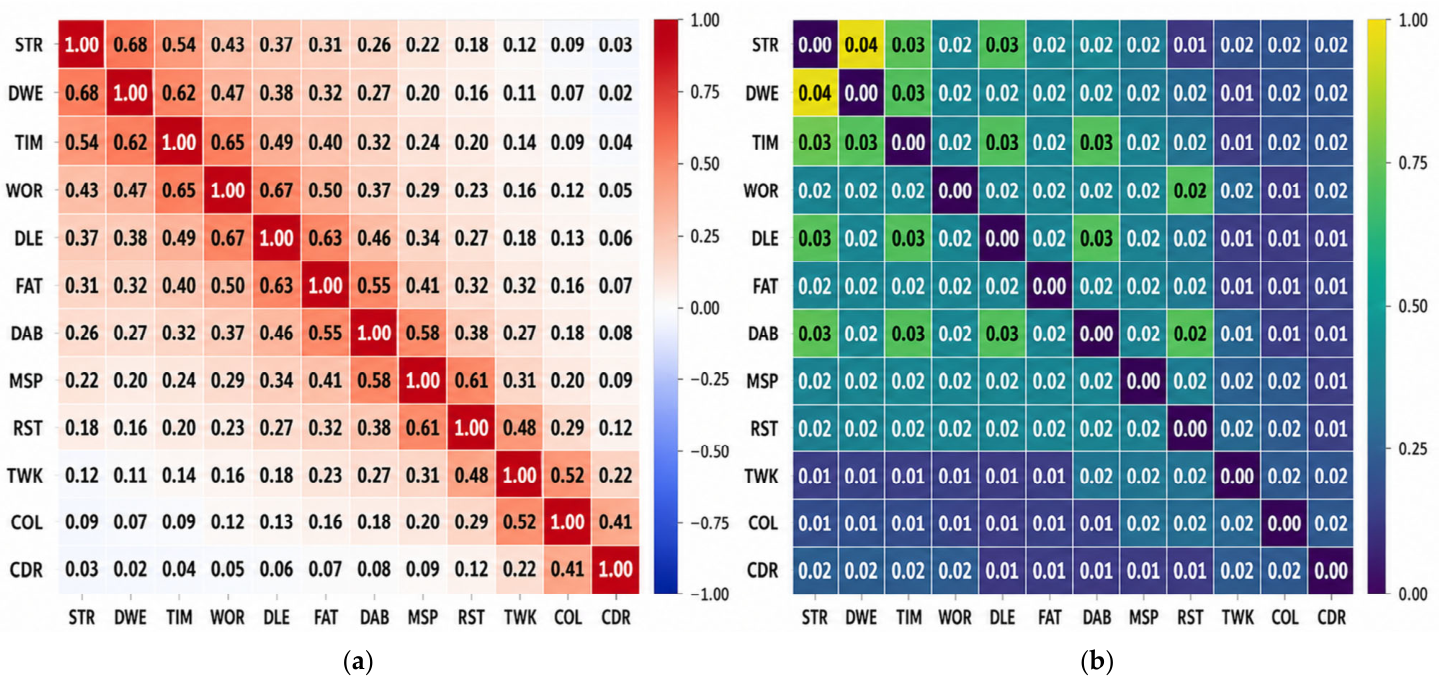
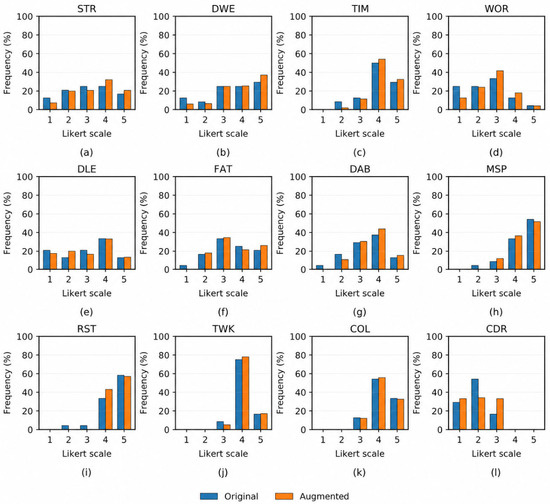
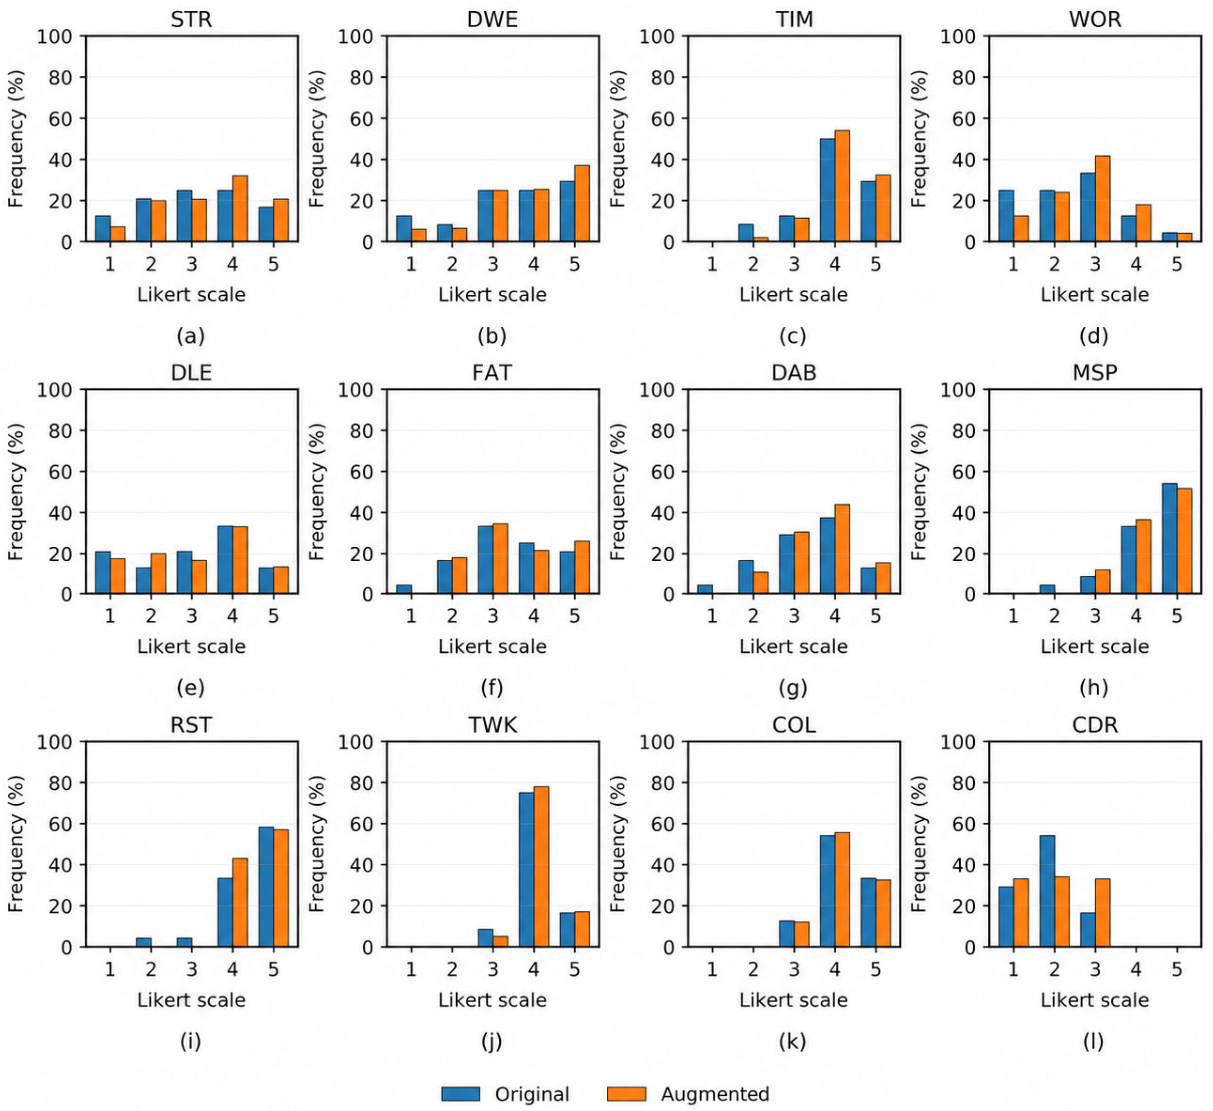
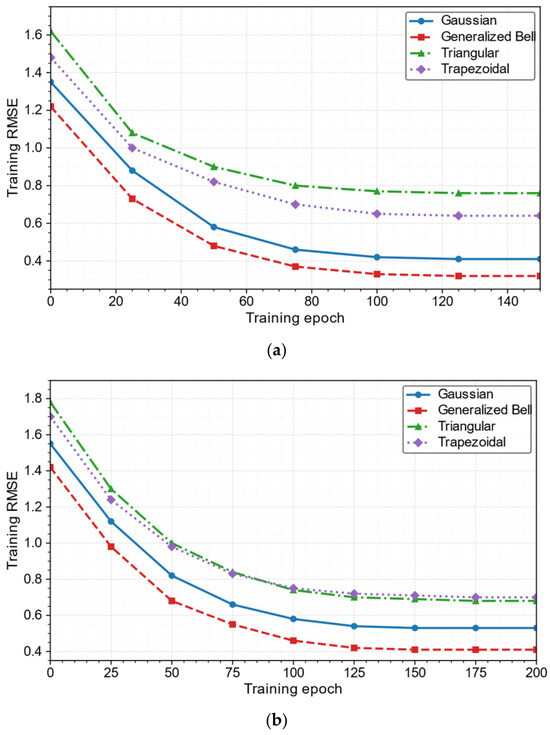
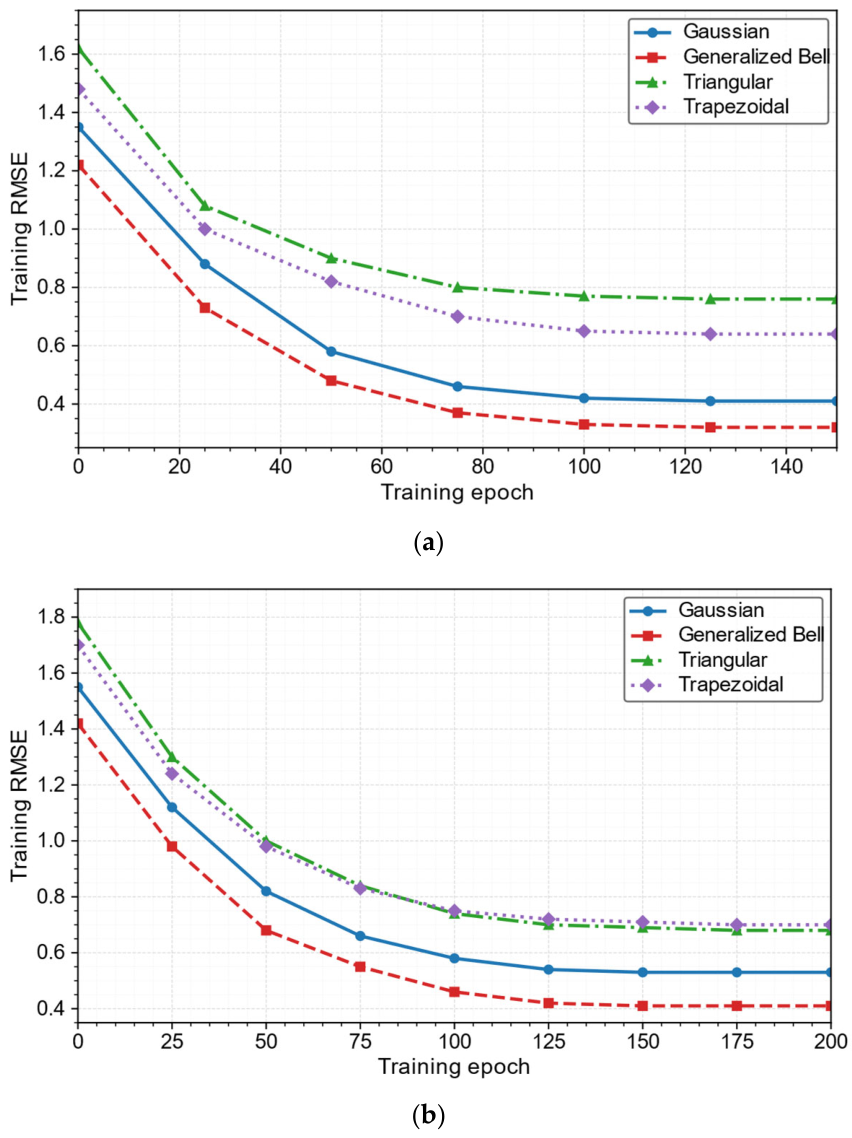
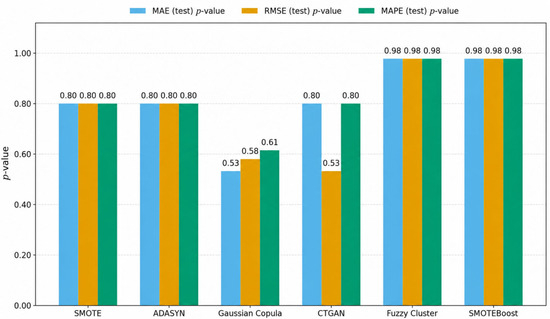
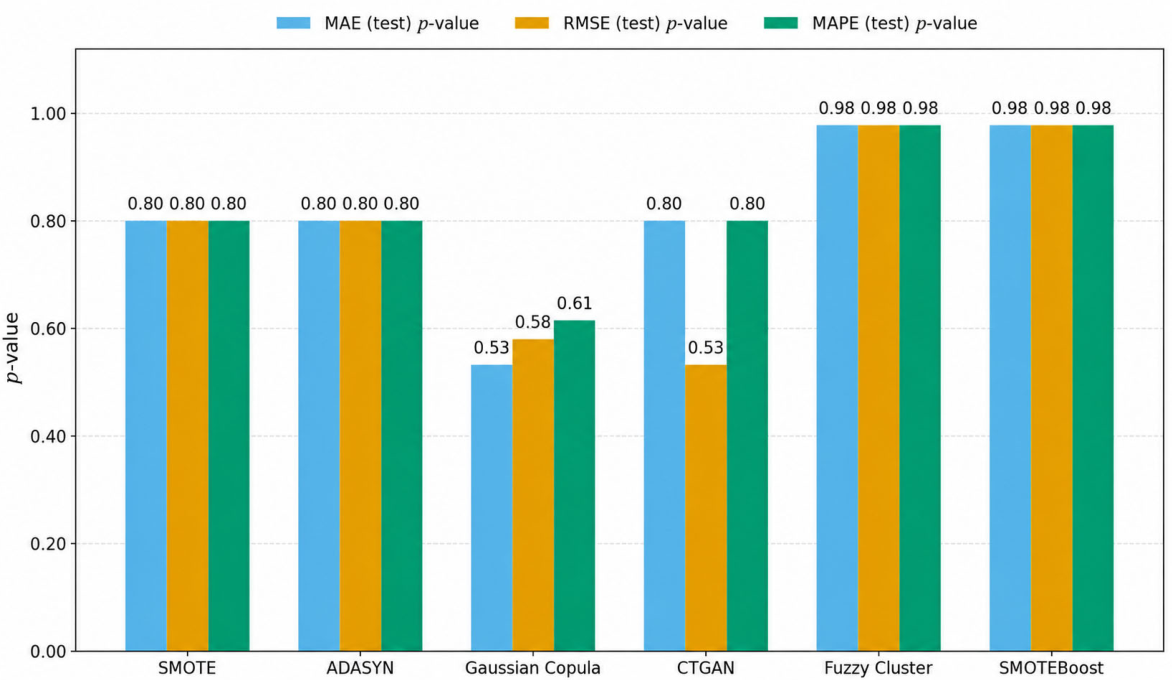
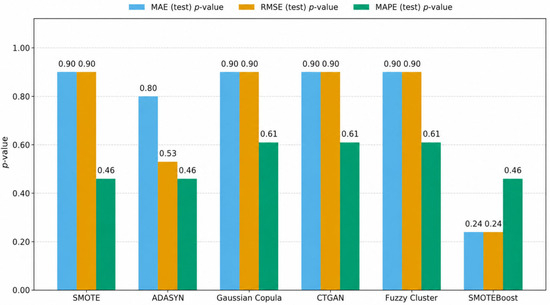
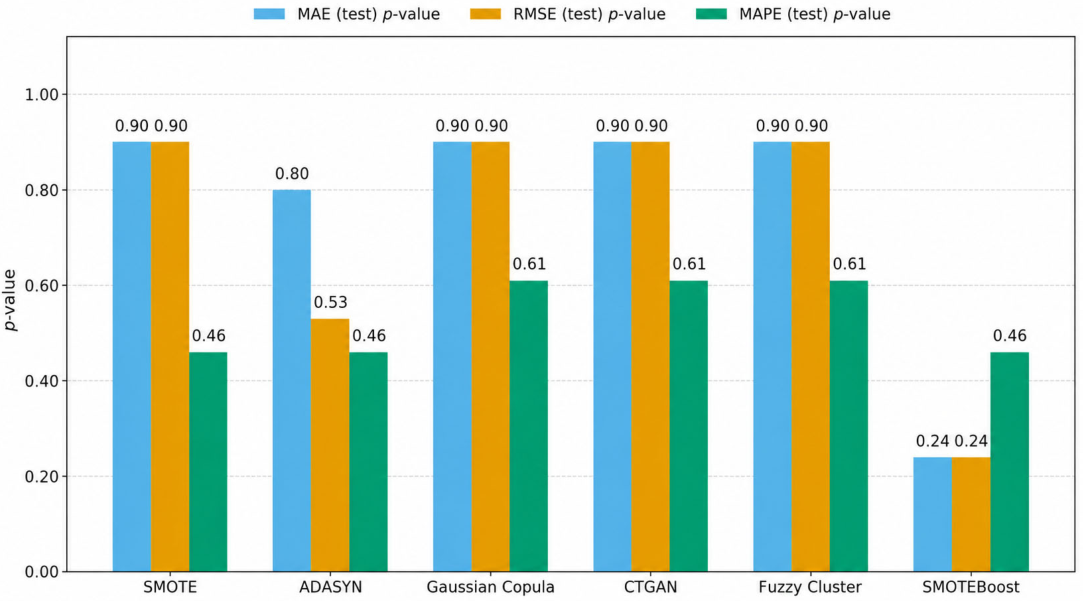

Disclaimer/Publisher’s Note: The statements, opinions and data contained in all publications are solely those of the individual author(s) and contributor(s) and not of MDPI and/or the editor(s). MDPI and/or the editor(s) disclaim responsibility for any injury to people or property resulting from any ideas, methods, instructions or products referred to in the content. |
© 2026 by the authors. Licensee MDPI, Basel, Switzerland. This article is an open access article distributed under the terms and conditions of the Creative Commons Attribution (CC BY) license.