


Featured Application
Mean apparent separation force, read together with a slip-stick peak count, gives a complementary screen for choosing butyl sealant/release-liner pairs in a specific application. The peak count is a relative warning indicator for unstable separation. It is not proposed as a validated process acceptance threshold.
Abstract
This study evaluated how silicone release liners come away from butyl hot-melt pressure-sensitive adhesive (HMPSA) sealants. An application-specific integration peel test was conducted based on FINAT FTM 10 geometry. It kept the 180° geometry, the 300 mm/min crosshead speed, and the cN/25 mm reporting convention, but used 90 mm butyl-sealant strips in place of a standard reference adhesive tape. The reported values are therefore apparent/effective separation forces for the tested liner–butyl constructions, not standard FINAT datasheet release-force values. Three double-sided silicone-coated PET liners (Rossella, Dolpap, Crosil 42) and seven commercial butyl sealants (C1E, U2E, C1EN, T1E, T2E, T1EN, T2EN) were tested on both liner sides. Two descriptors summarized each force–displacement trace: the mean apparent separation force and an operational slip-stick peak count based on positive residual-force excursions. Most combinations stayed below about 18 cN/25 mm. An increase was observed for T1EN, and a much larger one for Rossella/U2E. In both cases, high, diffuse stress was accompanied by volumetric deformations, fibrillation, and unstable detachment, rather than clean detachment at the phase boundary. Dolpap was the most stable and the most symmetric. Crosil 42 stayed in the low-force range but showed a few material-specific side differences. Taken together, the mean force and the peak count form a reproducible relative screen for selecting actual liner–butyl pairs, one that complements rather than replaces standard release-liner datasheet testing.
1. Introduction
Self-adhesive butyl sealants are supplied and processed laminated to a silicone release liner, which has to peel away cleanly from the sealant on both of its coated faces during converting and in use. How easily a given liner lets go is usually judged from a single number, namely a mean release force measured by a standardized method and most often against a reference adhesive rather than the sealant it will actually run against. That single value is useful for quality control, but it need not predict how a soft butyl hot-melt sealant behaves against a particular liner. This study therefore screens the actual butyl–liner pair with two complementary descriptors, the mean apparent separation force and an operational slip-stick peak count.
Butyl sealants are multi-component formulations. Their polymer matrix, typically butyl rubber and/or polyisobutylene, provides elasticity, barrier properties, and baseline cohesion. Tack and adhesion are tuned with tackifying resins, most often hydrocarbon-based chemistries, while hydrocarbon plasticizers such as low-molecular-weight polybutenes or polyisobutylenes lower viscosity, ease processing, and improve substrate wetting. Mineral fillers, in particular calcium carbonate, influence the rheological and physico-mechanical behavior of butyl-rubber/thermoplastic sealants, including cohesion strength, viscosity, rigidity, and processability [1]. Pigments, stabilizers, and antioxidants tune the formulation and improve aging resistance and in-service durability [2,3].
The companion materials are hot-melt pressure-sensitive adhesive (HMPSA) butyl sealants. Their matrix consists of isobutylene-based polymers, primarily butyl rubber (IIR) and polyisobutylene (PIB). After being applied in the molten state and cooled, they form a soft, viscoelastic layer that retains permanent tack while also acting as a barrier to water and gases [2,3,4]. For this reason, they are widely used as sealing layers in construction sealing tapes, corrosion-protection systems, automotive and caravanning components, insulating-glass applications, and selected barrier seals [2,4].
Their use as a self-adhesive sealant relies on combining several functions: effective substrate wetting under low pressure, long-term retention of adhesion, conformability over surface roughness, restricted migration of water or gases across the joint, and resistance to atmospheric aging. At the same time, the material must retain sufficient cohesion, creep resistance, and dimensional stability, particularly when the joint is loaded thermally or mechanically. Balancing these parameters matters when selecting a release liner, because the release force depends both on the release coating and on the viscoelastic behavior and substrate-wetting capacity of the butyl mass itself [4,5].
Polymer films and specialty papers are widely used as substrates in pressure-sensitive products and release-liner constructions. Poly(ethylene terephthalate) (PET) films and glassine-type or super-calendered kraft papers are common liner substrates, whereas polyethylene (PE), polypropylene (PP), and PET-PP films are also used in tape and protective-film constructions [5,6,7,8]. The substrate must provide coating anchorage, tear resistance, dimensional stability and resistance to deformation during converting operations; PET films are often selected where dimensional stability is critical [5,7,8].
Release coatings form a low-adhesion barrier between the substrate and the pressure-sensitive adhesive (PSA) layer and prevent permanent bonding during winding, storage, and converting [7,9]. Polysiloxane coatings are widely used because a crosslinked poly(dimethylsiloxane) (PDMS) layer provides low surface affinity for many PSAs; crosslink density, adhesive chemistry, peel rate, and storage can all affect the measured release force [7,8,9,10,11]. Release can be tuned with controlled-release or high-release additives, including MQ-type siloxane resins, but the measured release level remains a property of the complete liner-adhesive construction rather than of the coating formulation alone [10,11,12]. In related release-coating systems, waxes and fatty-acid derivatives can also modify surface energy and adhesion [8,13,14].
A measured release or peel force is not simply a property of the silicone coating. Earlier work on release liners and pressure-sensitive adhesive (PSA) peeling shows that it can also carry contributions from adhesive viscoelasticity [5,11], from sliding or friction near the peel front [15], and from cavitation, fibrillation, and the local dynamics of the front itself [16,17]. Standard release-force tests and supplier datasheets remain essential for quality control and for comparison under defined conditions, but they collapse performance into a single mean value, usually obtained with a reference adhesive or a specified laminate. That number need not predict whether a particular soft butyl HMPSA will leave both sides of a commercial liner cleanly during converting or application. It is also blind to a specific failure mode, wrong-side adhesive transfer, in which a transient local force peak during unstable slip-stick separation draws the soft adhesive onto the unintended liner face during converting; a real-world example of this problem is shown in the Supplementary Materials, Figure S22. Two strands of prior work bear on this but have largely stayed separate: studies of adhesive-tape peeling have characterized the slip-stick instability itself, including its onset and the period and amplitude of the force oscillations and their dependence on peel rate, angle and roller geometry [18,19,20], whereas release-liner and release-force studies have concentrated on the mean release force and its viscoelastic and surface-chemical contributors [5,7,9,11]. The gap addressed here is therefore not the expected fact that adhesive and liner both affect release; it is the absence of a reproducible, pair-specific screen that reads the mean force together with a force-trace instability descriptor on the actual butyl–liner construction, so that configurations with elevated force-trace instability can be flagged for further inspection and future process validation before converting.
FINAT FTM 10 is the standard method for the force needed to separate a silicone-coated release liner from the adhesive layer in self-adhesive laminates [21]. We used its peel geometry and reporting convention as a controlled framework but deliberately adapted it into an application-specific integration test, replacing the reference adhesive tape with the butyl sealants themselves (full procedure in Section 2.5). The reported values are therefore application-specific and serve to rank the tested liner–butyl pairs, not to provide standard FINAT compliance figures.
This study evaluates a pair-specific liner-screening workflow for butyl HMPSA systems. The objectives were (i) to compare three commercial double-sided silicone-coated PET liners (Dolpap, Rossella and Crosil 42) with seven commercial butyl sealants under the same application-specific 180° peel condition; (ii) to ask whether the inner and outer sides of each liner behave symmetrically for a given butyl material; and (iii) to test whether an operational slip-stick peak count, used alongside the mean apparent separation force, gives a reproducible relative indicator of unstable separation. The aim is a transparent screening method and dataset for selecting material pairs, not a full mechanistic account of liner coating chemistry. A final diagnostic objective is to assess whether positive residual peak counting, combined with the inner/outer side comparison, could help flag configurations associated with unintended side-to-side asymmetry and elevated wrong-side-transfer risk, while process-level validation against real converting defects remains future work.
2. Materials and Methods
2.1. Materials
The commercial HMPSA sealant formulations, designated C1E, U2E, C1EN, T1E, T2E, T1EN, and T2EN, were supplied by Almara sp. z o.o. sp.k. and used without further modification. The samples designated C1EN, T1EN, and T2EN were prepared using dynamic vulcanization technology [22]. According to information provided by the manufacturer, all materials were solvent-free formulations based on butyl rubber, polyisobutylene, a tackifying resin, and calcium carbonate as filler. Samples whose code contains the digit “1” were black, while products whose code contains the digit “2” were gray.
We tested each material as received, with only the conditioning step described below. Accelerated aging, end-of-shelf-life, and lot-to-lot effects were outside the scope of this work. The results thus reflect how these specific product codes behaved as prepared and conditioned here and do not represent the manufacturers’ full release specification.
The basic characterization of the commercial materials studied is summarized in Table 1. The methodology for the corresponding measurements is described in Section 2.5.
Table 1.
Characterization of the commercial sealant samples examined in this work. Peel adhesion is normalized to a 24 mm specimen width (EN 1939); release forces reported elsewhere in the paper are normalized to 25 mm.
Three types of release liner were used, all 23 µm PET films coated on both sides with a polysiloxane release layer:
- A double-sided siliconized 23 µm PET film (Dolpap, Chojnów, Poland), with a declared release force determined in accordance with FTM 10 in the range 7 ± 5 cN/25 mm, denoted Dolpap;
- Crosil 42 film (Creo, Bąkowo, Poland), denoted Crosil 42, with a declared release force determined in accordance with FTM 10 in the range 4–15 (typically 6) cN/25 mm;
- A double-sides siliconized polyester film, 23 µm thick, with a declared release force determined in accordance with FTM 10 in the range 4–15 cN/25 mm (Rossella, Caronno Pertusella, Italy), denoted Rossella.
All three liners are supplied as double-sided siliconized, non-differential films, each with a single declared release-force specification covering both faces rather than a designed per-side differential, so the two coated sides are nominally identical and are expected to release the adhesive in the same way. Both sides of every film were tested. The inner side is the face toward the roll core during winding; the outer side is the face exposed on the outside of the roll (see Supplementary Materials, Figure S23). This convention is used throughout, and in the supplementary release curves.
2.2. Sample Preparation
The sealants were pressed at 40 °C on an XEB400 × 400 × 2 hydraulic press to 1 mm ± 0.1 mm. Strips of 90 mm × 140 mm were then cut from the sheets and applied centrally to stainless-steel test plates (100 mm × 150 mm). Liner strips about 100 mm wide and >280 mm long were laminated onto the sealant with a pressure roller. The liner covered the whole sealant surface, and its free end was left outside the sample so it could be clamped in the jaws of the tensile machine. Every sample was laminated the same way to limit preparation variability. The roller was passed once along each sample, at as steady a speed and pressure as could be maintained by hand. Because roller pressure and rolling speed were not instrumented, this step is controlled manual lamination rather than calibrated pressure application, and the replicate scatter reported below includes that uncertainty. Samples were then conditioned for at least 24 h in a BJPX-HTBII incubator (Biobase) at 20 ± 2 °C and 50 ± 5% relative humidity.
2.3. Photographic Documentation of Liner Surfaces
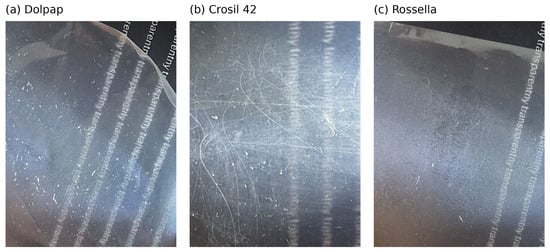
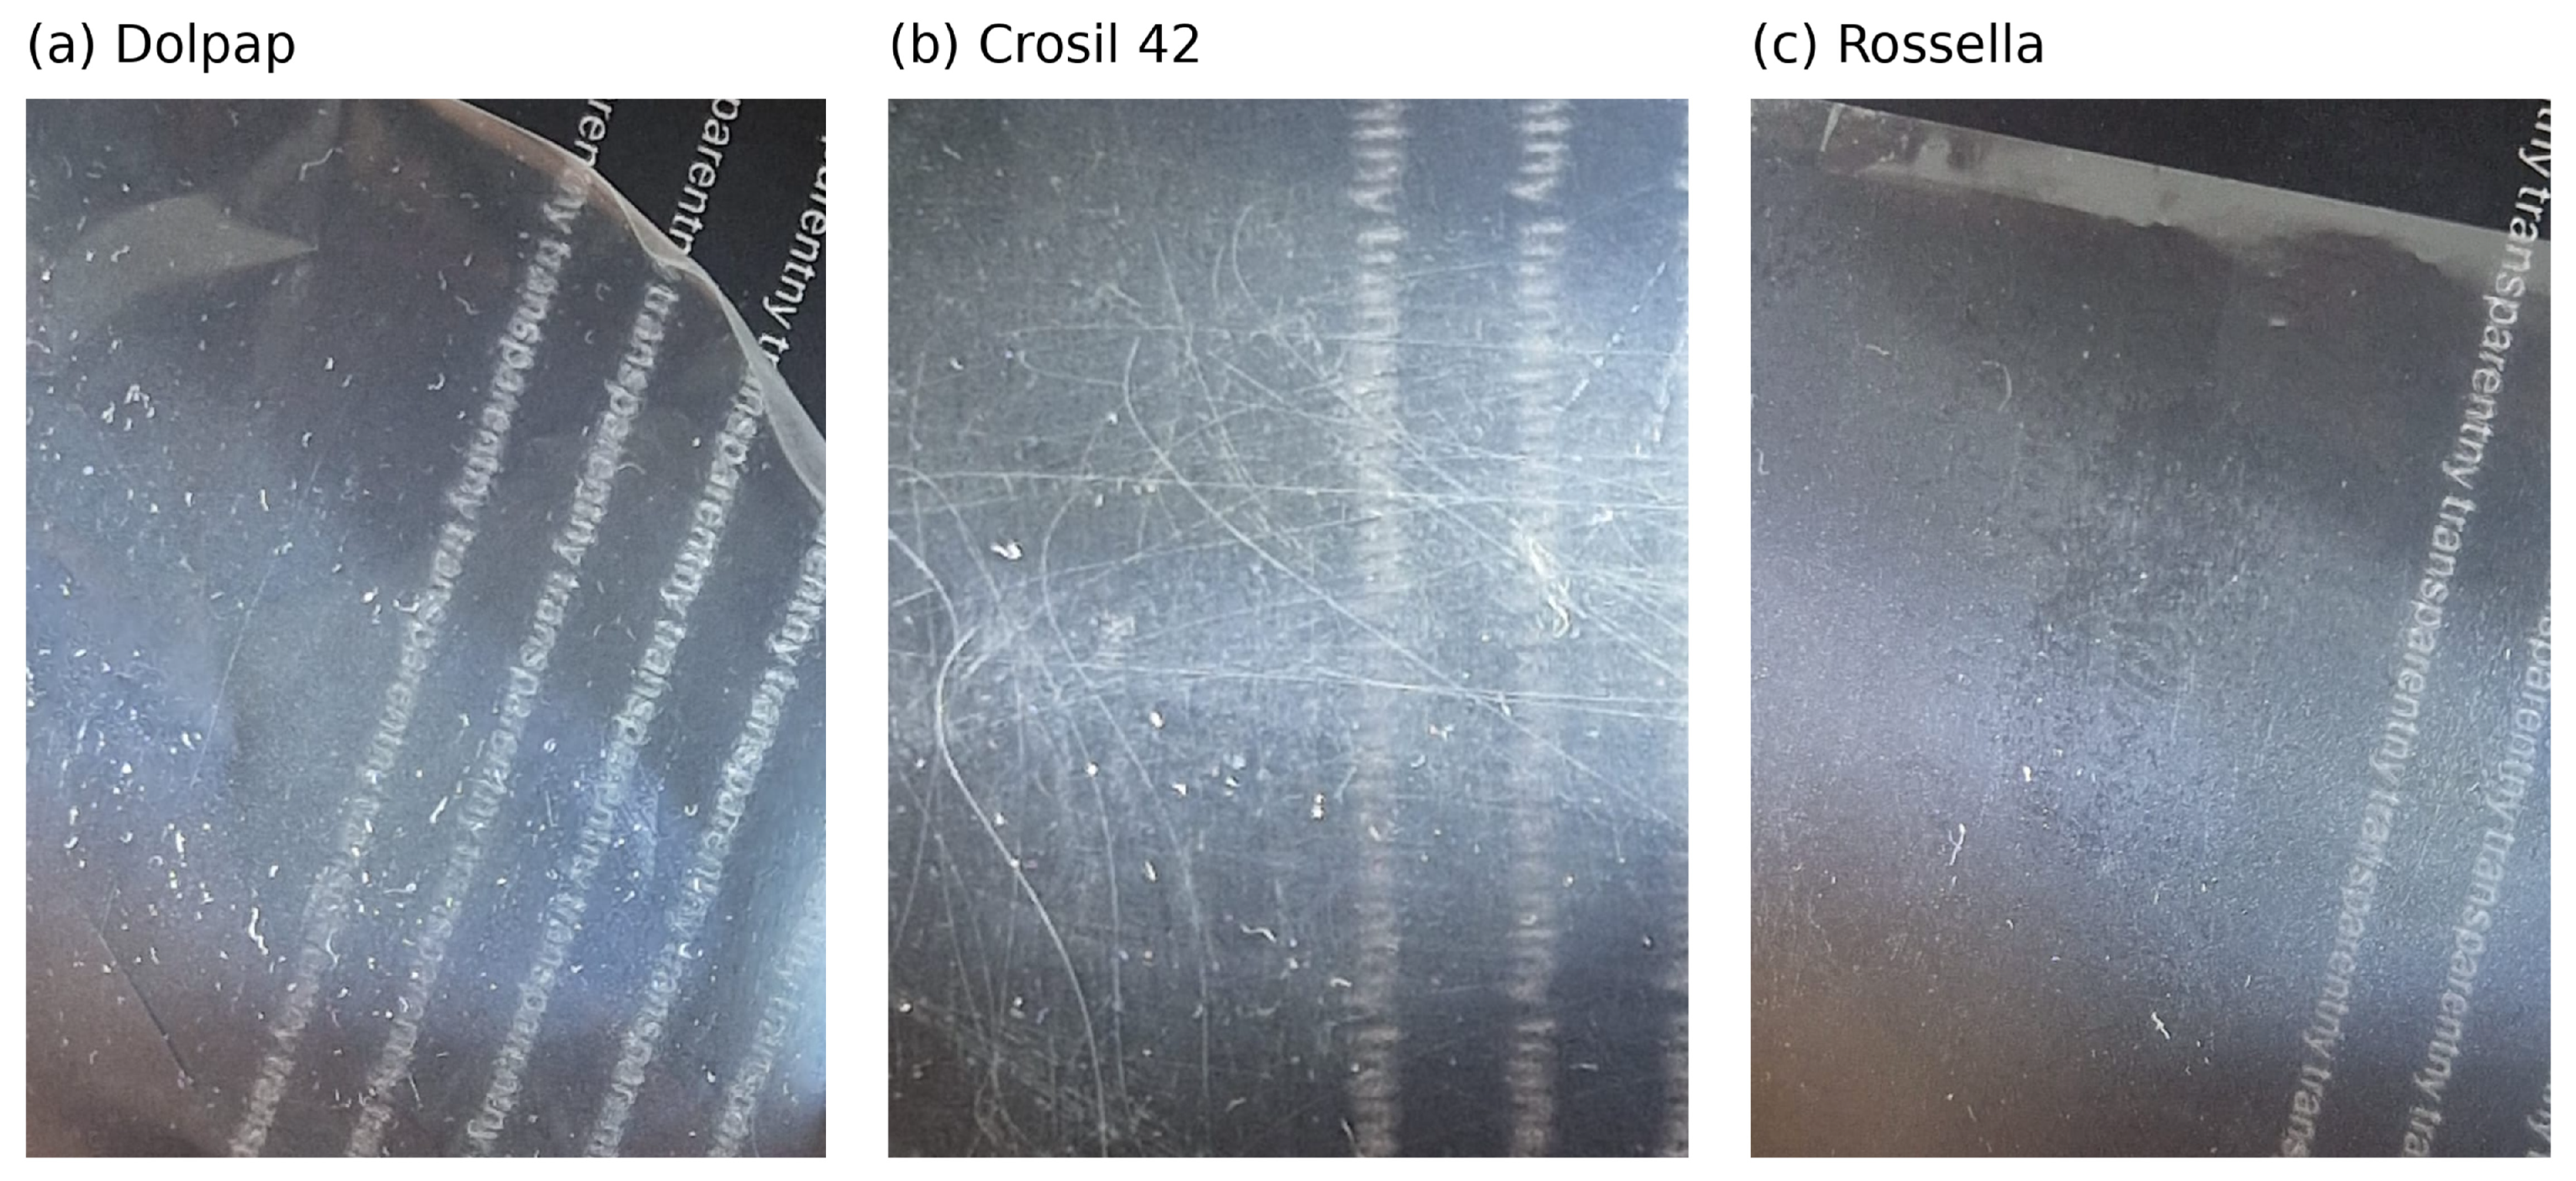
The liner surfaces were photographed with a mobile phone as a qualitative record of the surface state of the transparent release films. The films were placed on a dark printed background; the visible printed text was used as a qualitative visual reference and to document film transparency, not as a calibrated length scale. The same photographic approach was used for all liners under comparable oblique-light conditions; direct specular reflections were minimized so that visible defects and heterogeneities appeared as light-scattering features. The images were used for documentation purposes only and were not used for quantitative surface-roughness, defect-density, or optical-haze analysis.
2.4. Water Contact Angle Measurement of Sealants
Water contact angle (WCA) analyses were performed by the sessile drop technique at room temperature and atmospheric pressure with a Krüss DSA100 goniometer. Specimens were flat-pressed plates, like those used in the peel-force tests. For each sample, five independent measurements were taken, each with a 5 µL distilled-water drop; the two extreme values were discarded by a predefined rule, and the mean ± standard deviation of the remaining three is reported. Because only distilled water was used, the angles serve as a comparative measure of surface hydrophobicity rather than a full surface-free-energy determination with polar and dispersive components [23].
2.5. Measurement Procedure
Density was measured by the immersion method (ISO 1183-1 [24]); the reported tolerance of ±0.01 g/cm3 reflects the method and instrument resolution used here. The melt volume-flow rate (MVR) was determined according to ISO 1133-1 [25] (5 kg load, 140 °C). The Mooney viscosity ML and the maximum Mooney value were determined using ISO 289-1 geometry and timing [26], with modified temperature conditions selected for these sealants; ML values are reported as rounded typical values, and the maximum values for samples T1EN and T2EN were determined from the measured Mooney ML values and the MAX/ML ratio. The uncertainty of the MAX/ML parameter was calculated by standard uncertainty propagation for a quotient, except for samples T1EN and T2EN, for which experimentally determined MAX/ML values were used. The 180° peel adhesion was determined according to EN 1939 [27] on 24 mm-wide specimens and is reported in N/24 mm; after the test, the failure mode was assessed visually and classified as adhesive, cohesive, or mixed, with the designation “PET” indicating that failure or detachment occurred on the side of the PET film substrate/carrier. MVR and peel adhesion values are reported as the mean ± standard deviation, rounded to integers.
Mooney viscosity was measured with an HD-R812 Mooney viscometer (Haida International Equipment Co., Ltd., Dongguan, China). Measurements were based on ISO 289-1 [26], using a large rotor under ML(1 + 4) timing conditions at 25 °C. The test temperature was selected to suit the nature of the tested sealant compounds and differed from the conditions typically used for rubbers. Results are expressed in Mooney units (MU).
Penetration was measured with an HD-R811 penetrometer (Haida International Equipment Co., Ltd.). Measurements were performed in accordance with PN-ISO 2137:2011 [28] at 20 °C, using the cone/indenter configuration and loading-time procedure specified by the method. The procedure consisted of measuring the depth to which a standardized indenter penetrated the sample after the defined loading time. Results are expressed in penetration units, corresponding to 0.1 mm.
Apparent separation force was measured with a modified FINAT FTM 10-type peel procedure [21]. The procedure kept the 180° geometry, the fixed 300 mm/min crosshead speed, and the width-normalized reporting of FINAT FTM 10, but it was not a standard compliance test against a FINAT reference adhesive. It was designed instead as a comparative integration test for the actual butyl sealant–liner pairs studied here. Two changes were deliberate: the specimen width was raised to 90 mm, and the reference tape was replaced by the butyl sealants themselves. The reported values are therefore application-specific and not directly comparable with standard FINAT datasheet release forces obtained against reference adhesives. The point was to compare process-relevant liner removal and force-trace instabilities across genuine material pairs. Where debonding was clean and the force was low, the measured value was close to a practical release force. Where fibrillation or cohesive deformation sets in, as on the Rossella/U2E outer side, the value is better called an apparent/effective separation force, because it also includes bulk viscoelastic deformation and partial cohesive failure. Measurements were taken using a Shimadzu EZ Test EZ-LX 1 kN universal testing machine with a 1 kN load cell, at 180° and 300 mm/min. The exported force–displacement series were sampled at 100 Hz, as shown by the 0.010 s interval in the archived raw files.
Drafts, mechanical vibrations, and air-conditioning airflow, all of which can affect the stability and repeatability of the force trace, were minimized during the measurements; samples were also prepared free of contamination, creases, and deformation of the release layer, with particular attention paid to edge preparation and to the absence of air bubbles between liner and sealant.
The plan called for 10 replicate traces per liner–sealant–side configuration. In all, 424 traces were exported for the 42 configurations, of which 416 met the predefined 50–200 mm release-force window and were used for the reported means and standard deviations. Valid n values appear with the release-force results and in the supplementary curve captions. No replicate-level outlier removal followed the window criterion, so the reported SDs carry both test-to-test and manual-preparation variability. Each per-trace force is the mean over the available part of the window. Of the 416 valid traces, 17 ended before 200 mm because the peel failed early; these were kept, since early failure is itself part of the separation behavior. A window-coverage check (Supplementary Materials, Table S4) shows that restricting the analysis to full-window traces leaves the configuration ranking unchanged and shifts only the Rossella/U2E outer, which remains the clear extreme of the matrix.
Initial inspection and export were performed with Shimadzu Trapezium X software; the software version was not available in the archived metadata. Reproducible post-processing was performed with the manifest-driven slipstick Python package from the accompanying code archive (version 1.0.0; Python 3.14.4, NumPy 2.4.6, SciPy 1.17.1, Matplotlib 3.10.9). The workflow normalizes forces from the 90 mm collection width to cN/25 mm and calculates the per-replicate mean apparent separation force over 50–200 mm displacement. It then estimates baseline noise from the initial 1–5 mm near-zero-force segment, applies a common filtering and baseline procedure, counts slip-stick events, and writes the publication outputs. The analysis and figure-generation code was written with assistance from generative-AI tools, and all outputs were verified against the raw data by the authors (see Acknowledgments). Exact regeneration of the peak counts requires the locked environment recorded with the archive (the pinned package versions or the provided container); in other environments, the configuration ranking is reproduced, but individual peak counts can differ by a few events.
Instrumental noise was taken from the initial 1–5 mm of displacement, before the main release-force signal developed; if the force crossed the predefined onset criterion within this window, only its pre-onset part was used. A second-order Savitzky–Golay fit with a long window removed the baseline trend, and the residual standard deviation and maximum absolute residual were recorded.
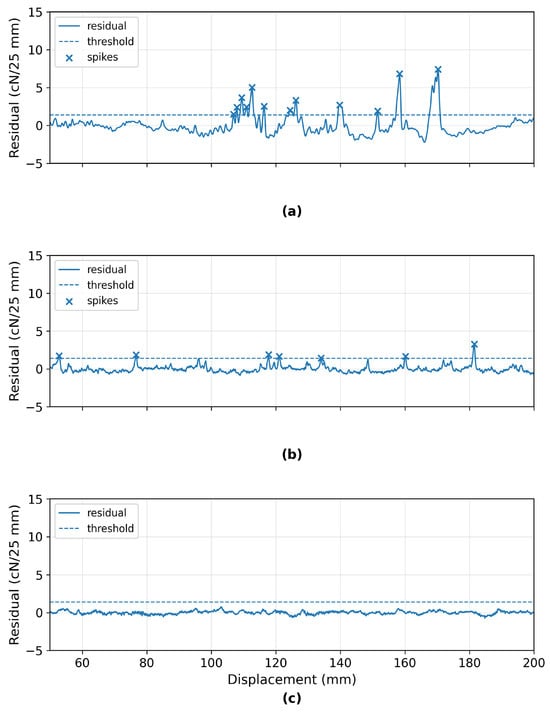
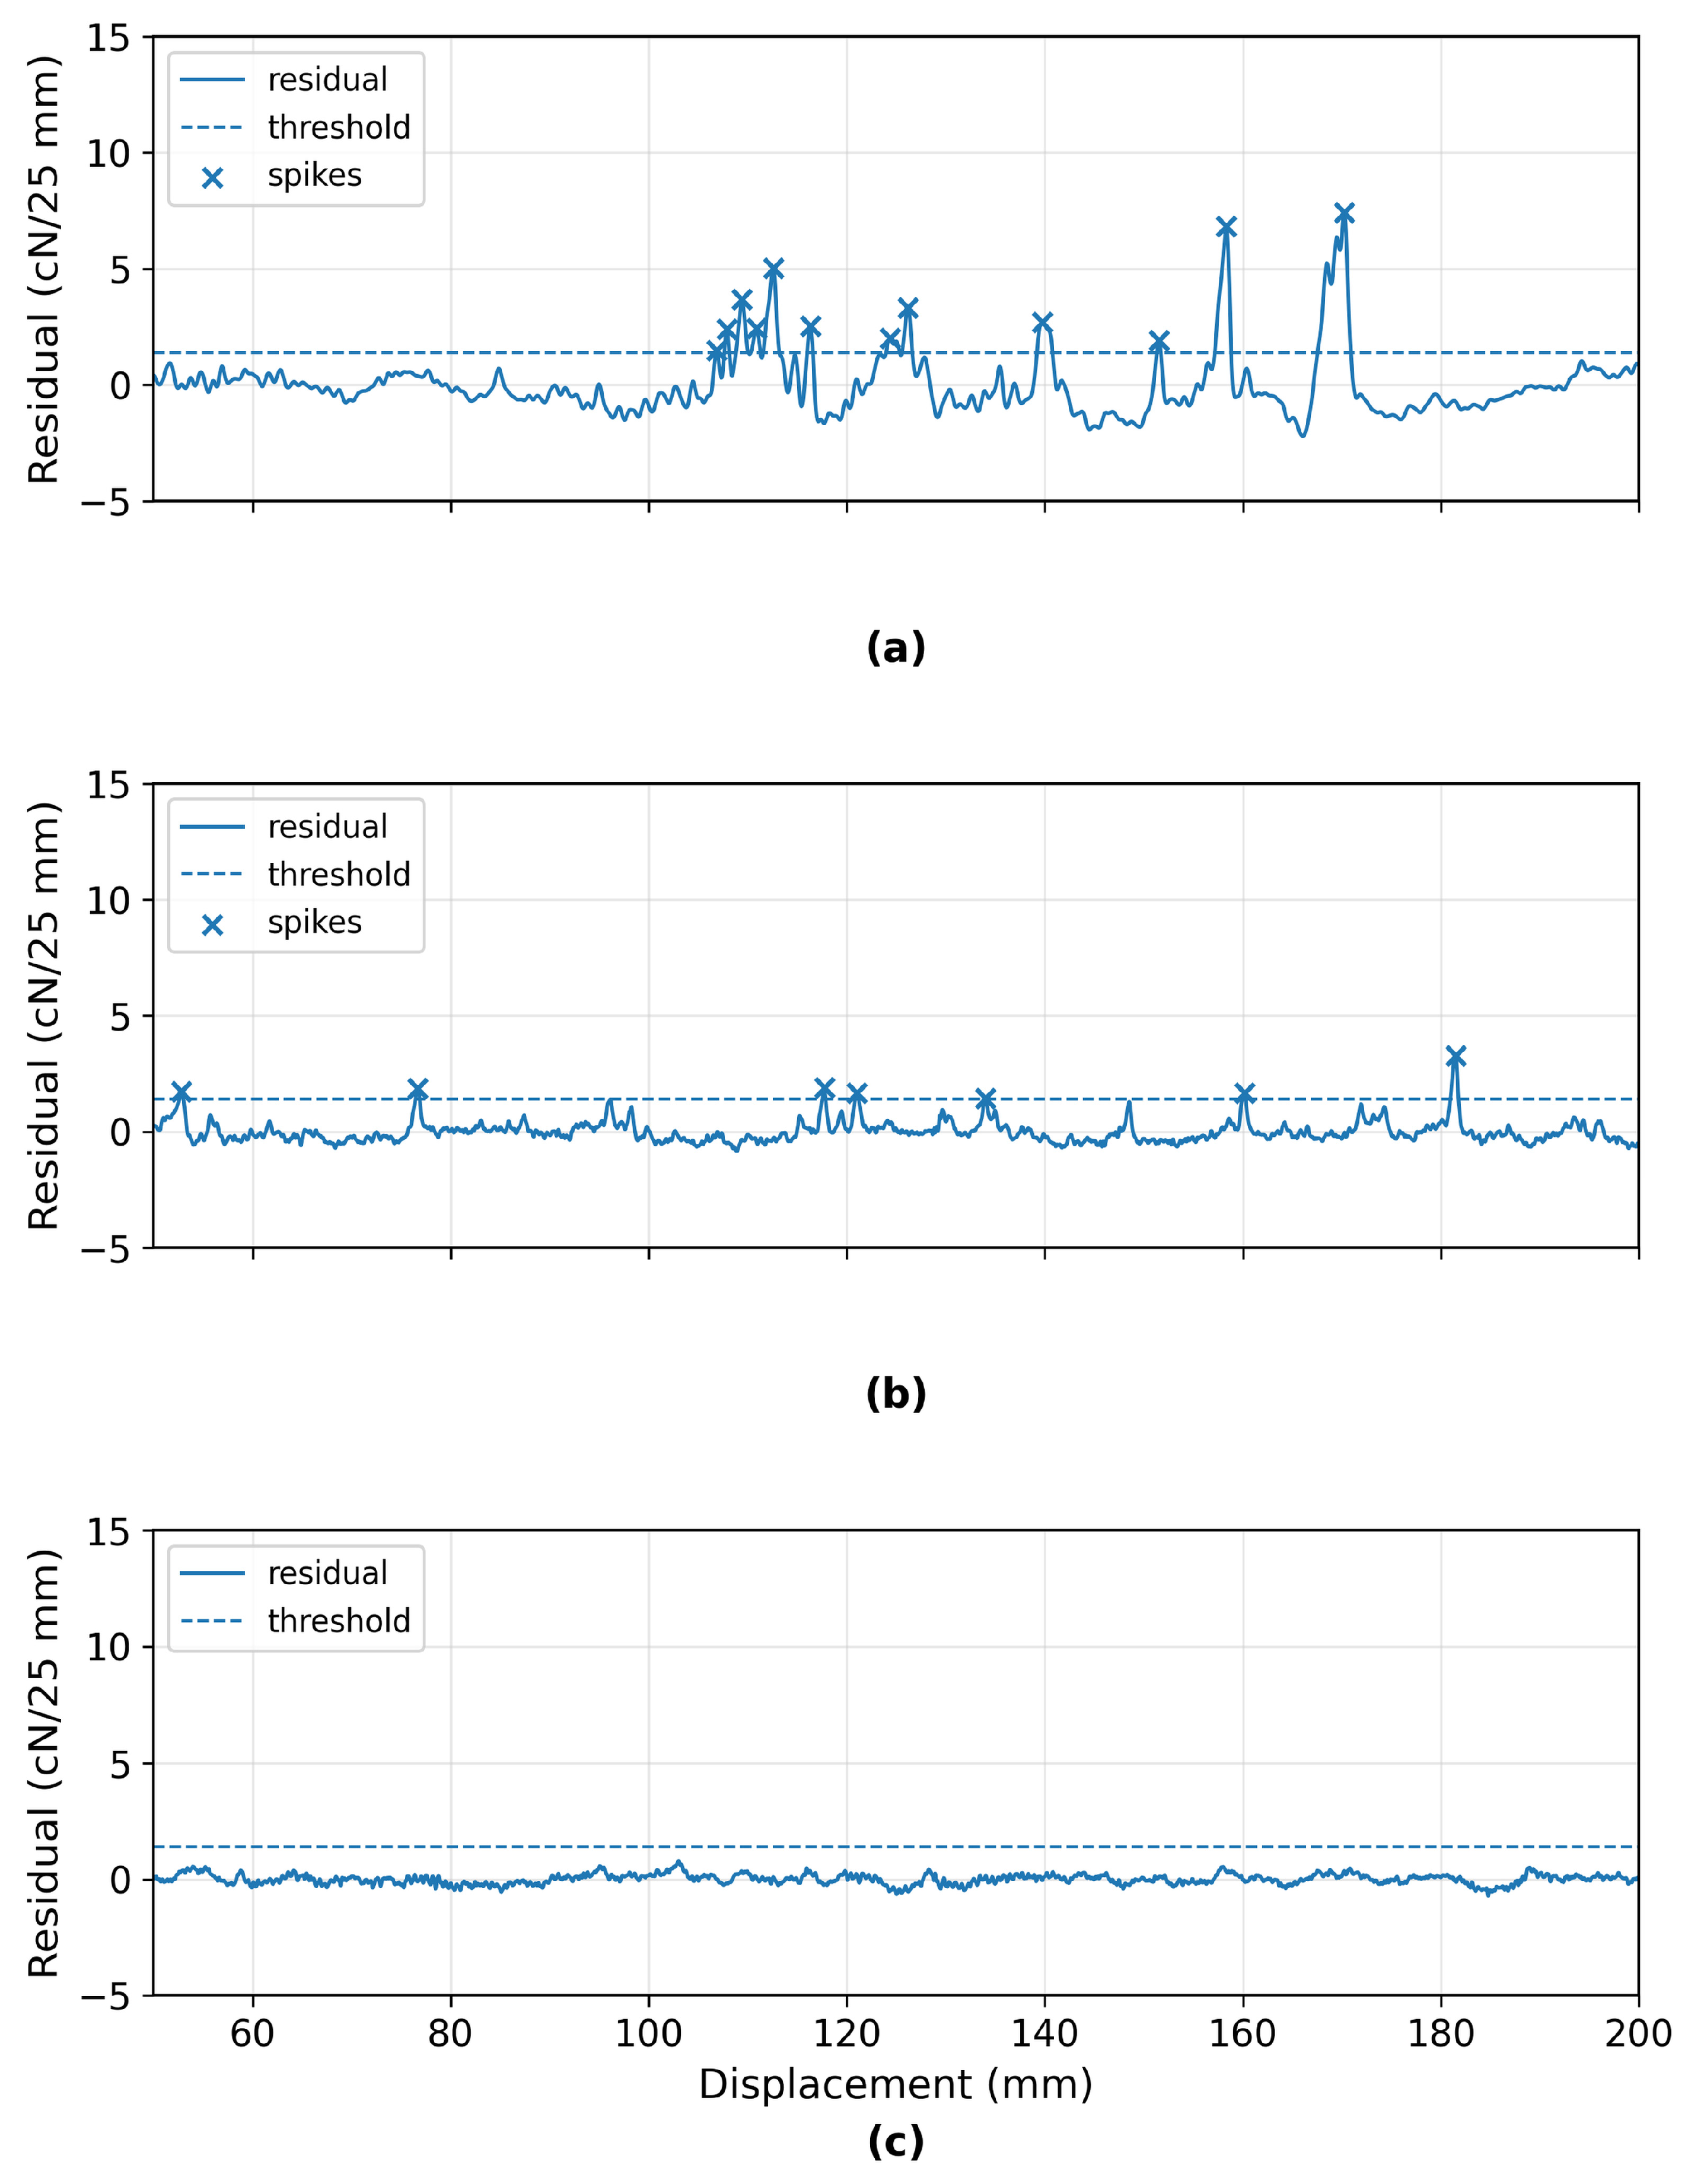
For peak counting, the force was first normalized to cN/25 mm and evaluated over the 50–200 mm window. A fourth-order low-pass Butterworth filter was applied with zero-phase filtering, at a cutoff taken from the median instrumental-noise peak frequency. A third-order Savitzky–Golay baseline followed, with a window of 50% of the truncated signal duration unless the trace length forced a shorter one. Subtracting that baseline from the filtered trace gave the residual force. One slip-stick peak event is a single contiguous positive residual excursion above 1.4 cN/25 mm; where several points in one excursion crossed the threshold, they counted as one event, and the event position and height were taken from the largest residual in that excursion. Negative excursions appear in the representative plots but were not counted.
The 1.4 cN/25 mm threshold is a fixed operational criterion for this dataset, not a universal material constant or an acceptance limit. In the regenerated outputs the median baseline-noise SD was 0.066 cN/25 mm and the 95th percentile 0.116 cN/25 mm (Supplementary Materials, Table S1), which puts the threshold at roughly 21.3 times the median noise SD and 12.0 times the 95th percentile. A threshold-sensitivity analysis (Supplementary Materials, Table S2, and the archived dataset) compared configuration-level mean peak counts across detection thresholds of 0.5–3.0 cN/25 mm against those at 1.4 cN/25 mm, by Spearman rank correlation. The ranking held up well (Spearman rho = 0.97 at 1.0 cN/25 mm and 0.95 at 2.0 cN/25 mm). The peak count is used here, then, as a relative screening and ranking indicator of force-trace instability, not as a universally calibrated slip-stick criterion.
3. Results and Discussion
3.1. Apparent Separation Force of Liners from Butyl Sealants
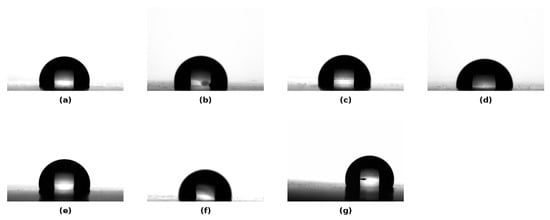
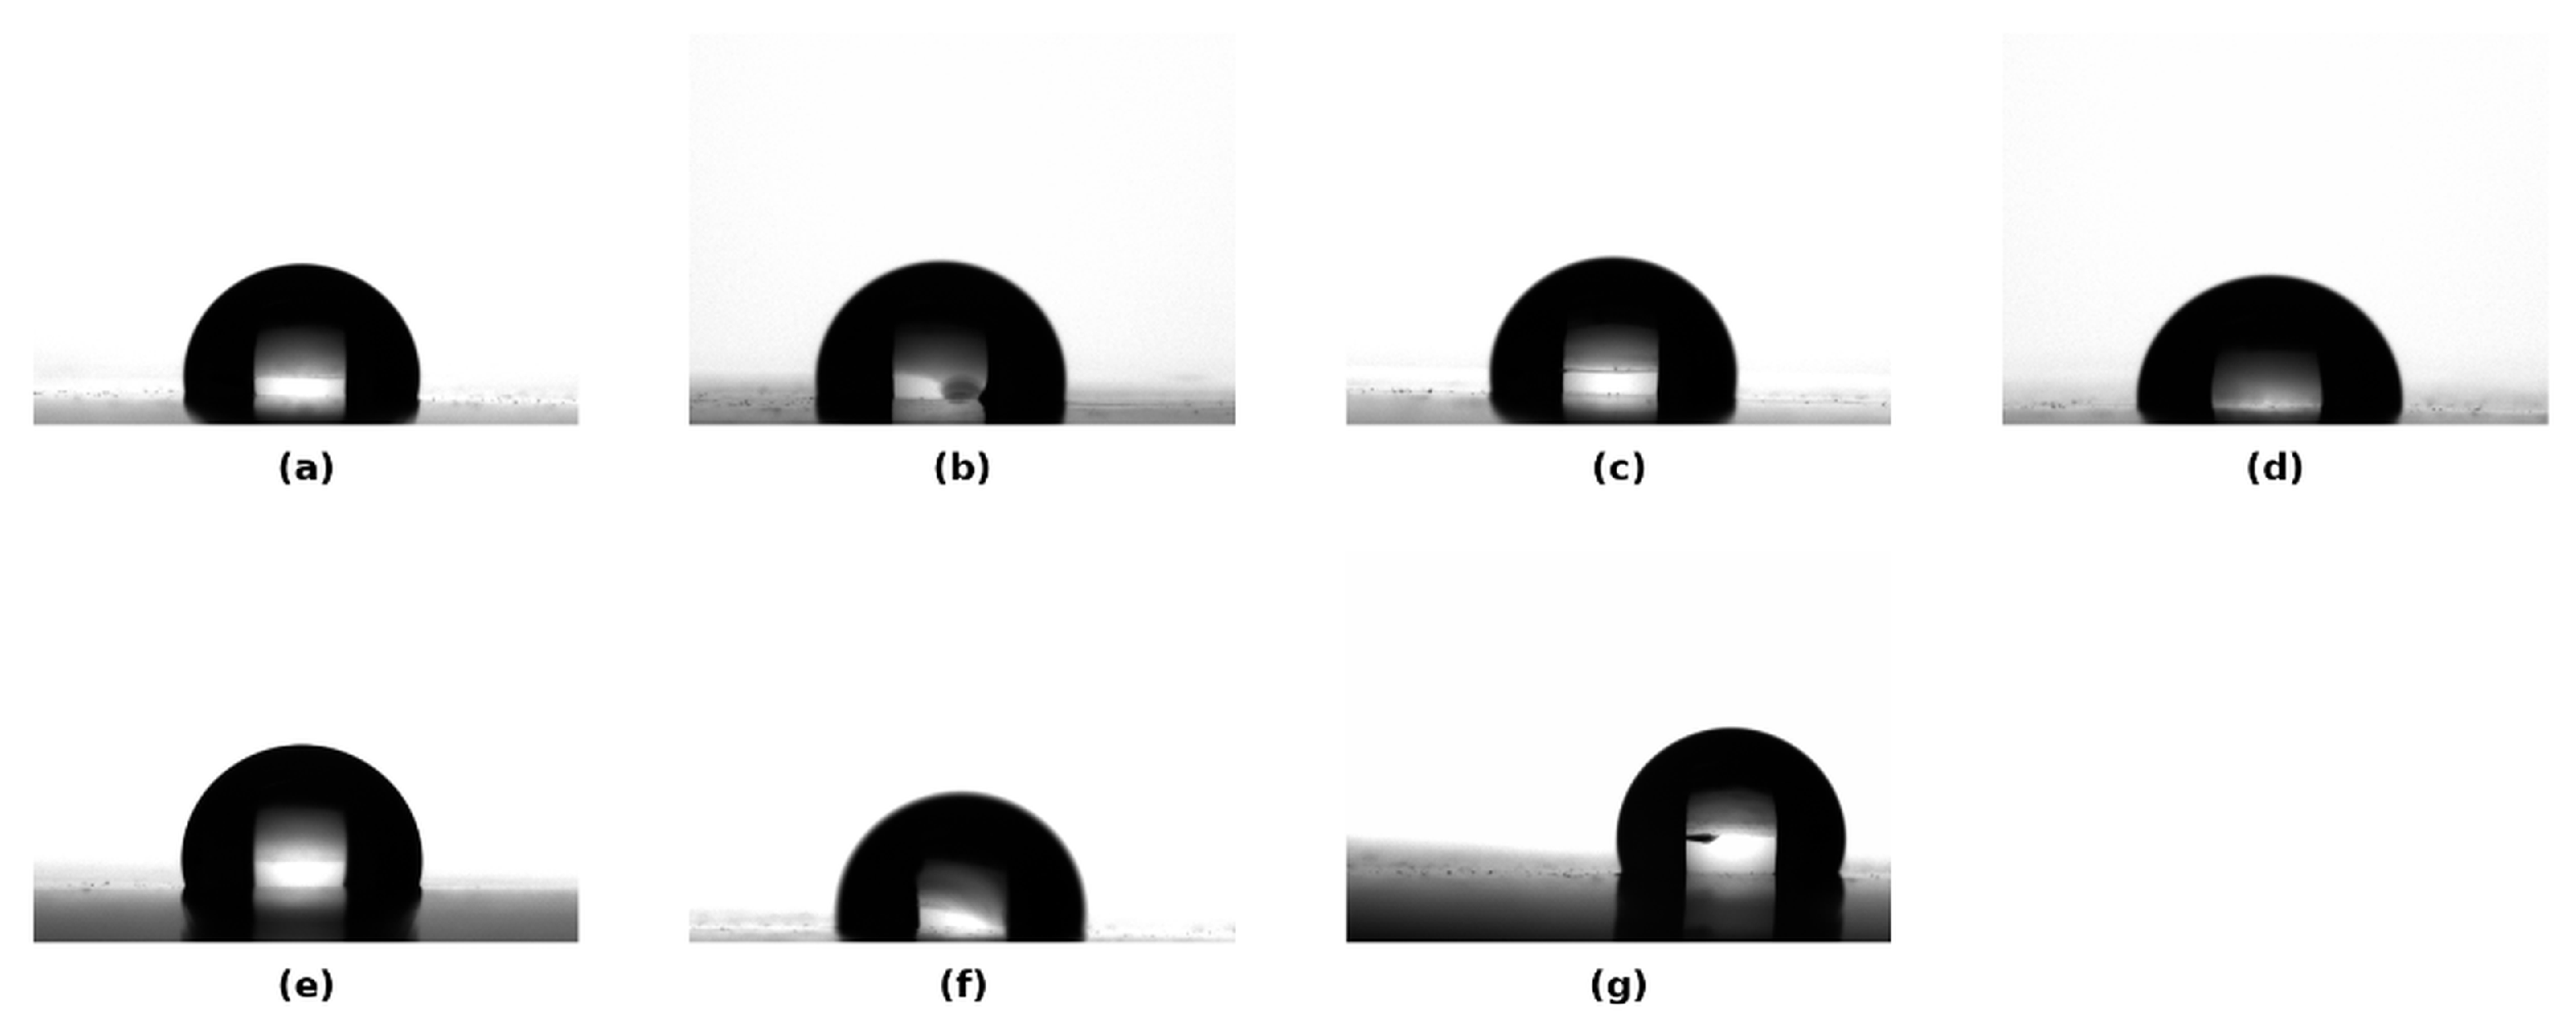
Table 1 summarizes the basic characteristics of the sealants studied: Mooney viscosity, penetration, density, MVR, 180° peel adhesion, and failure mode. Water contact angles, measured to compare the hydrophobicity of the sealant surfaces, are reported in Table 2 and illustrated with representative droplet images in Figure 1.
Table 2.
Static water contact angle of the examined butyl sealants (mean ± SD). Processing details are described in Section 2.4.
Figure 1.
Representative static water contact angle droplet images for butyl sealants: (a) C1E, (b) U2E, (c) C1EN, (d) T1E, (e) T2E, (f) T1EN, and (g) T2EN. Numerical values are given in Table 2.
All samples were hydrophobic, with contact angles between 94.0° and 100.0°: the lowest for T1E (94.0 ± 1.2°) and U2E (95.1 ± 0.3°), and the highest, close to 100°, for C1E, T2E, and T1EN. These values are consistent with the non-polar character of the butyl-sealant surfaces and their IIR/PIB matrix.
Table 3.
Mean apparent separation-force values [cN/25 mm] for liner/butyl-sealant combinations. Values are mean ± sample SD; n is the number of valid replicate traces.
Table 4.
Inner-to-outer apparent separation-force ratios for each liner–sealant pair, calculated from unrounded Table 3 means. Near-unity ratios are rounded to 1:1.
Because the liners are nominally symmetric, with both faces meant to carry the same coating, the expected inner-to-outer ratio is close to 1:1; a reproducible departure points to an unintended asymmetry, not a designed release differential. The ratios in Table 4 are rounded to the nearest simple integer ratio. For the low-force configurations, they are best read together with the Welch confidence intervals in Supplementary Table S5 rather than on their own, since a ratio of small absolute forces swings on minor differences.
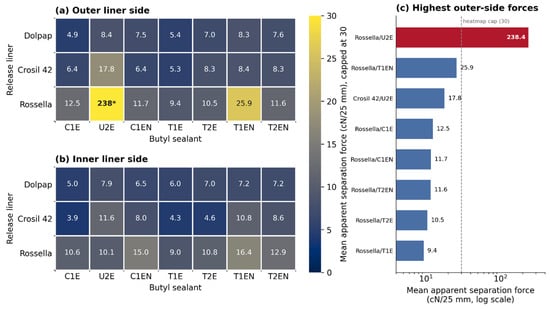
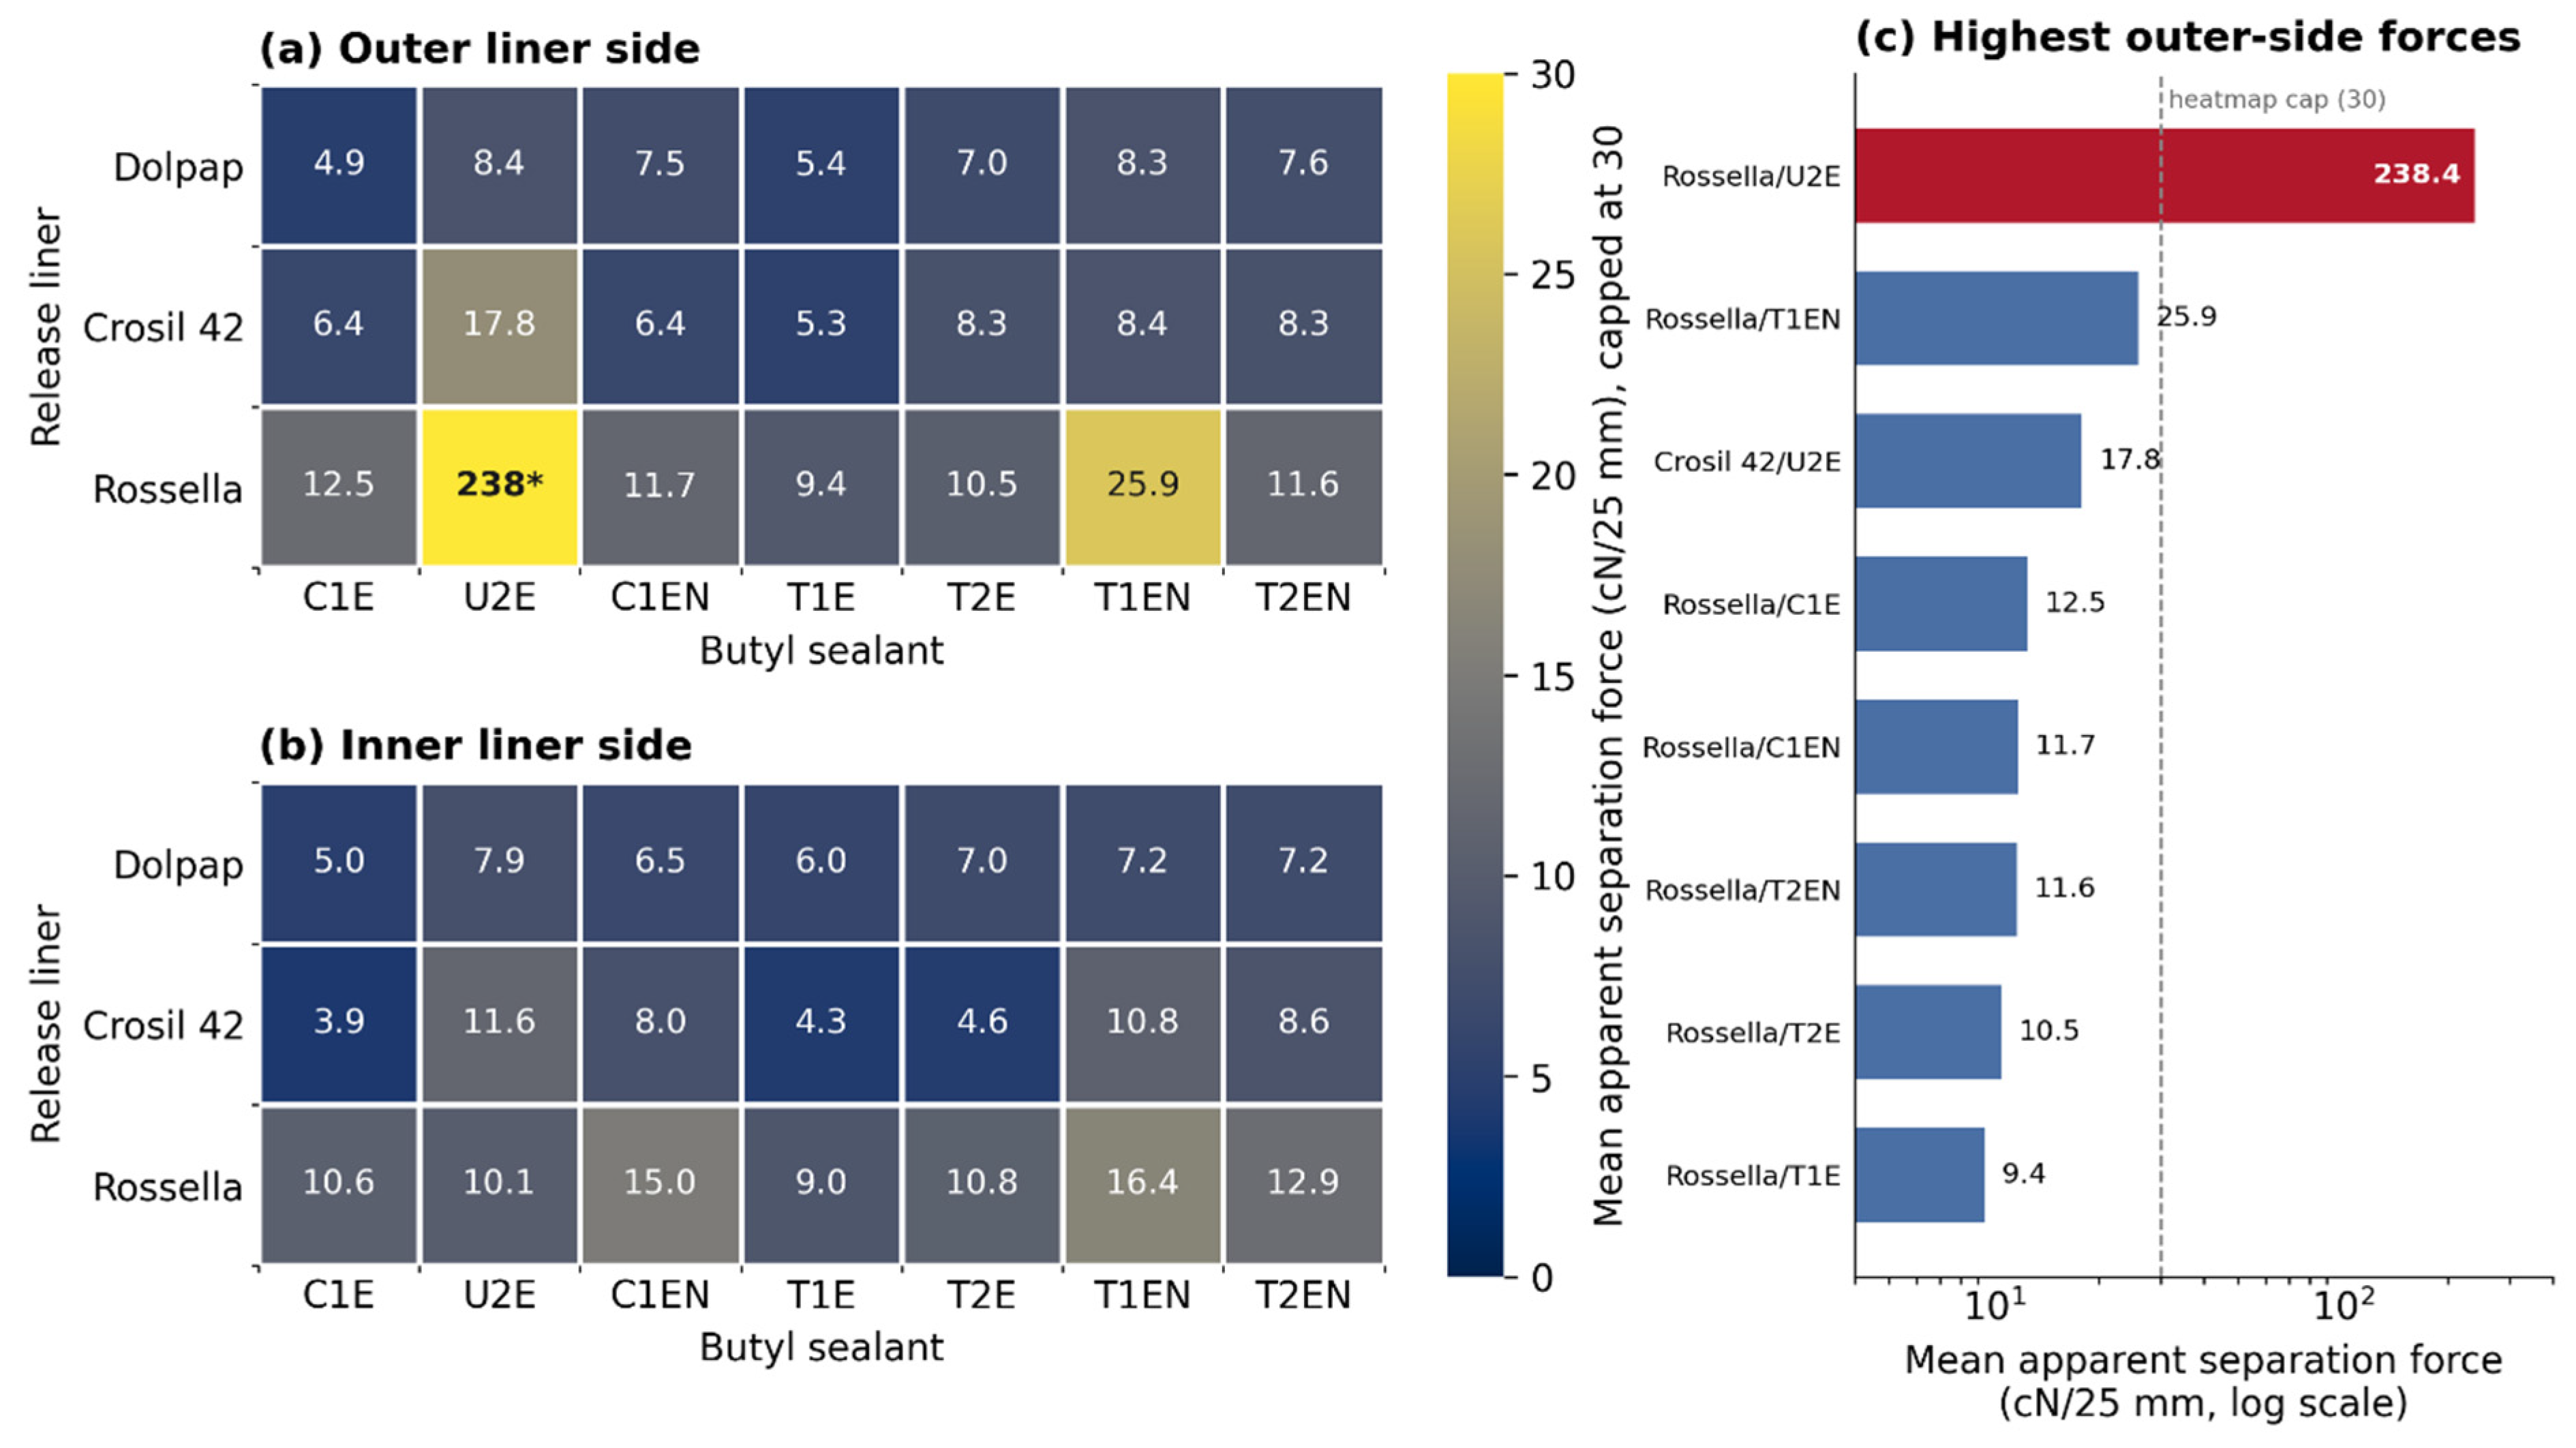
The release-force distribution across the complete liner–sealant matrix is visualized in Figure 2. Representative oblique-light photographs of the release liners are shown in Figure 3.
Figure 2.
Mean apparent separation-force heatmap for all liner–sealant combinations: (a) outer liner side; (b) inner liner side; (c) full-scale view of the high-force outer-side cases. Values are in cN/25 mm. To keep contrast where forces are low, the color scale stops at 30 cN/25 mm; anything above that is [*] and redrawn in panel (c).
Figure 3.
Oblique-light photographs of transparent silicone-coated PET release liners on a dark printed background: (a) Dolpap, (b) Crosil 42, and (c) Rossella. The printed background was intentionally retained as a qualitative contrast/scale reference and to show film transparency; images were not used for roughness or defect-density quantification.
Figure 3 shows visible heterogeneities on all liners. Because Dolpap and Crosil 42 still produced low or symmetric release forces, visible defects alone do not determine release performance; instability depends on the liner–sealant–side configuration.
For most liner–sealant combinations the mean apparent separation force stayed below 18 cN/25 mm (about 0.18 N/25 mm), so liner removal was easy under the present integration-test conditions. Two higher-force cases stood out, both on the Rossella outer side: T1EN (25.9 ± 9.3 cN/25 mm) and, far above the rest, U2E (238.4 ± 73.9 cN/25 mm, about 2.4 N/25 mm). The Rossella/U2E value was about nine times the next-highest mean (Rossella/T1EN) and more than an order of magnitude above most low-force configurations; it is treated below as an apparent/effective separation force, since both the visual evidence and the force trace point to substantial bulk deformation and partial cohesive failure.
Dolpap behaved most uniformly of the liners tested. Its release forces fell in a narrow 5–8 cN/25 mm band, in line with the low-force range expected for the declared release class, though a direct comparison with the manufacturer’s FINAT value is limited by the modified adhesive system and specimen width. Exploratory inner–outer comparisons on the existing replicates found no strong Dolpap side effect after Benjamini–Hochberg correction across the 21 side comparisons (Supplementary Materials, Table S5). Dolpap is therefore practically symmetric under these conditions, which is not the same as proving the two coated faces chemically identical.
Crosil 42 sat in a similar low-force range to Dolpap, but several low-force configurations showed statistically supported side differences. After Benjamini–Hochberg correction, these were C1E (+2.50 cN/25 mm; 95% CI 1.59 to 3.40), T1E (+1.01 cN/25 mm; 95% CI 0.44 to 1.59), T2E (+3.75 cN/25 mm; 95% CI 2.93 to 4.58) and T1EN (−2.39 cN/25 mm; 95% CI −3.51 to −1.27) (Supplementary Materials, Table S5). In absolute industrial terms these differences are small compared with the Rossella/U2E outlier, but they are reproducible within this dataset and should be read with the confidence intervals rather than from ratios alone. What causes the side dependence is not resolved here; it may involve unmeasured side-to-side differences in coating or surface state, but coating chemistry, crosslink density and microtopography were not measured directly. U2E also gave a nominal 1:2 ratio on Crosil 42, yet its outer-side value carried very large scatter (17.8 ± 15.6 cN/25 mm) and a high slip-stick peak count, so for U2E the apparent asymmetry reflects unstable, partly cohesive separation rather than a stable side difference.
For samples U2E and T1EN, the Crosil 42 liner gave higher release forces than Dolpap. For U2E, this likely follows from its penetration and MVR, the highest among the tested materials, which point to greater compliance, closer conformation to the liner surface, and a larger real contact area [5,8,29]; for T1EN it more likely reflects a more elastomeric response and greater energy dissipation during peeling than surface wetting alone [5,11,29].
Rossella gave higher apparent separation forces than Dolpap or Crosil 42 on most configurations. Of the three, it behaved as the tighter release system for several of the butyl compounds. Like Crosil 42, Rossella also showed statistically supported inner–outer differences for several sealants after Benjamini–Hochberg correction, though with no consistent direction: the outer-minus-inner difference was +1.93 cN/25 mm (95% CI 0.74–3.12) for C1E and +9.48 cN/25 mm (95% CI 2.38–16.57) for T1EN, but −3.32 cN/25 mm (95% CI −5.76 to −0.88) for C1EN (Supplementary Materials, Table S5). The much larger U2E value is addressed below, where it reflects unstable separation rather than a stable side difference. The reason is not settled. Coating architecture, crosslink density, high-release additives, and surface microtopography were not characterized directly, so these remain plausible explanations to pursue rather than proven causes of the forces seen here.
The Rossella/U2E outer-side case is better read as an apparent/effective separation force than as a purely interfacial release force. The crosshead speed was fixed at 300 mm/min, but during slip-stick peeling, the local peel-front velocity and the stress distribution fluctuate: stress builds up through the sticking part of a cycle and is released in a rapid local debond or slip. In viscoelastic tapes, interfacial friction or sliding and viscoelastic dissipation raise the peeling resistance and make the measured force depend on peel velocity, interface friction, and material parameters, all of which bear directly on the 180° parallel-peeling geometry used here [15]. U2E had the highest penetration and MVR of the materials tested, consistent with high compliance and close conformation to the liner surface against the Rossella outer side, which likely drove large local deformation and a shift from clean interfacial debonding toward fibrillation and partial cohesive failure. The fibrils and sealant residues seen afterwards support this reading, but the photographs do not pin down a chemical or topographic cause on the liner side.
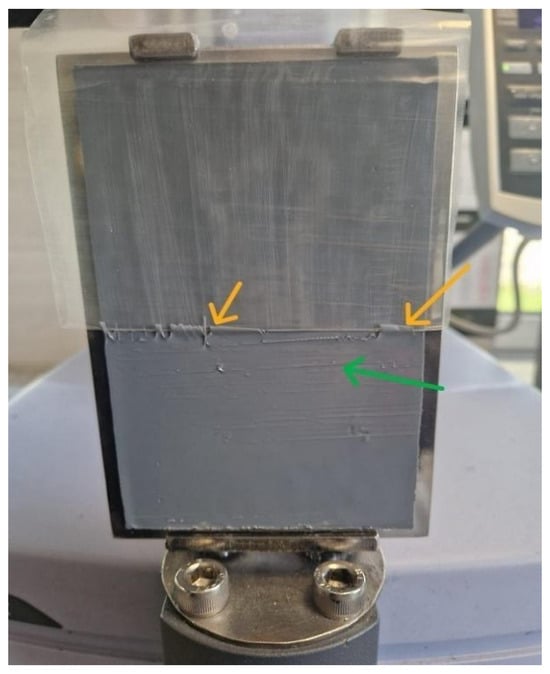
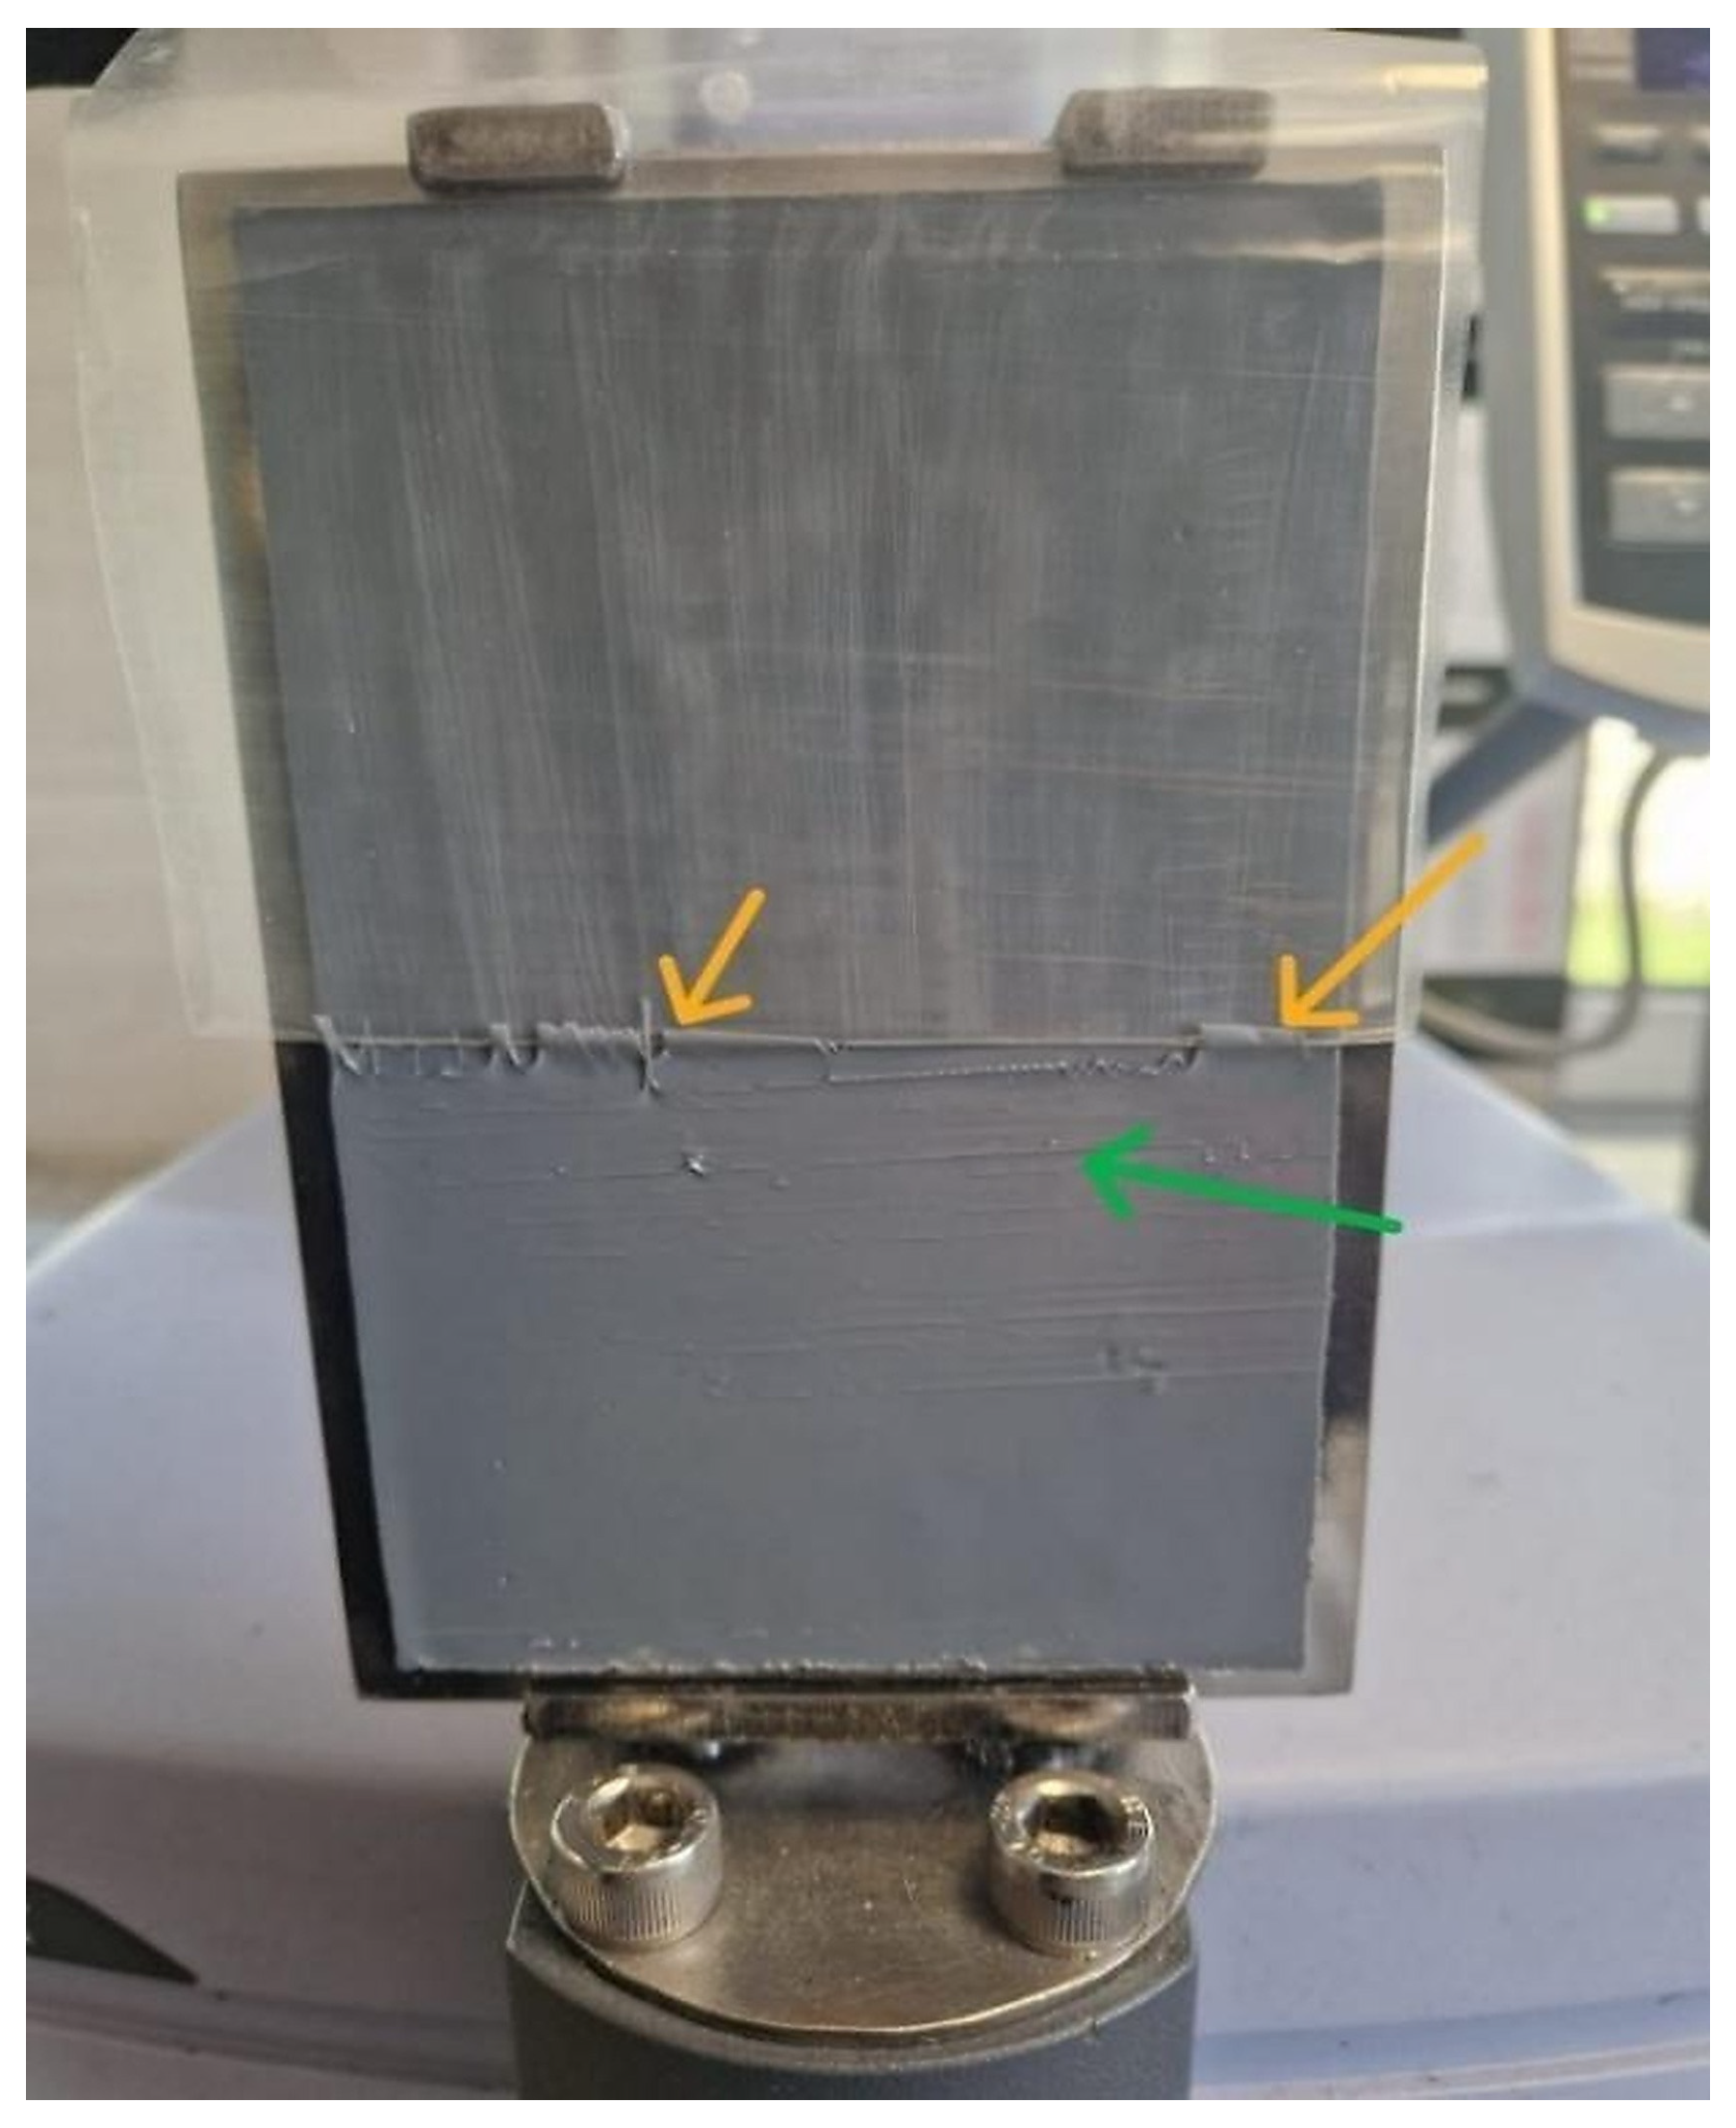
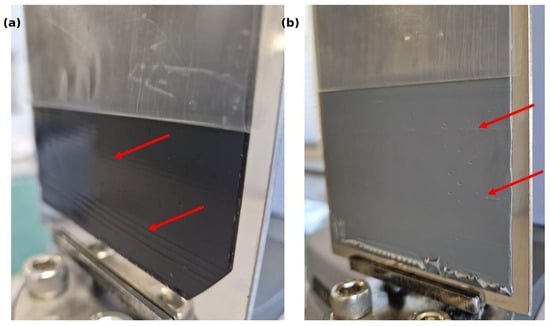
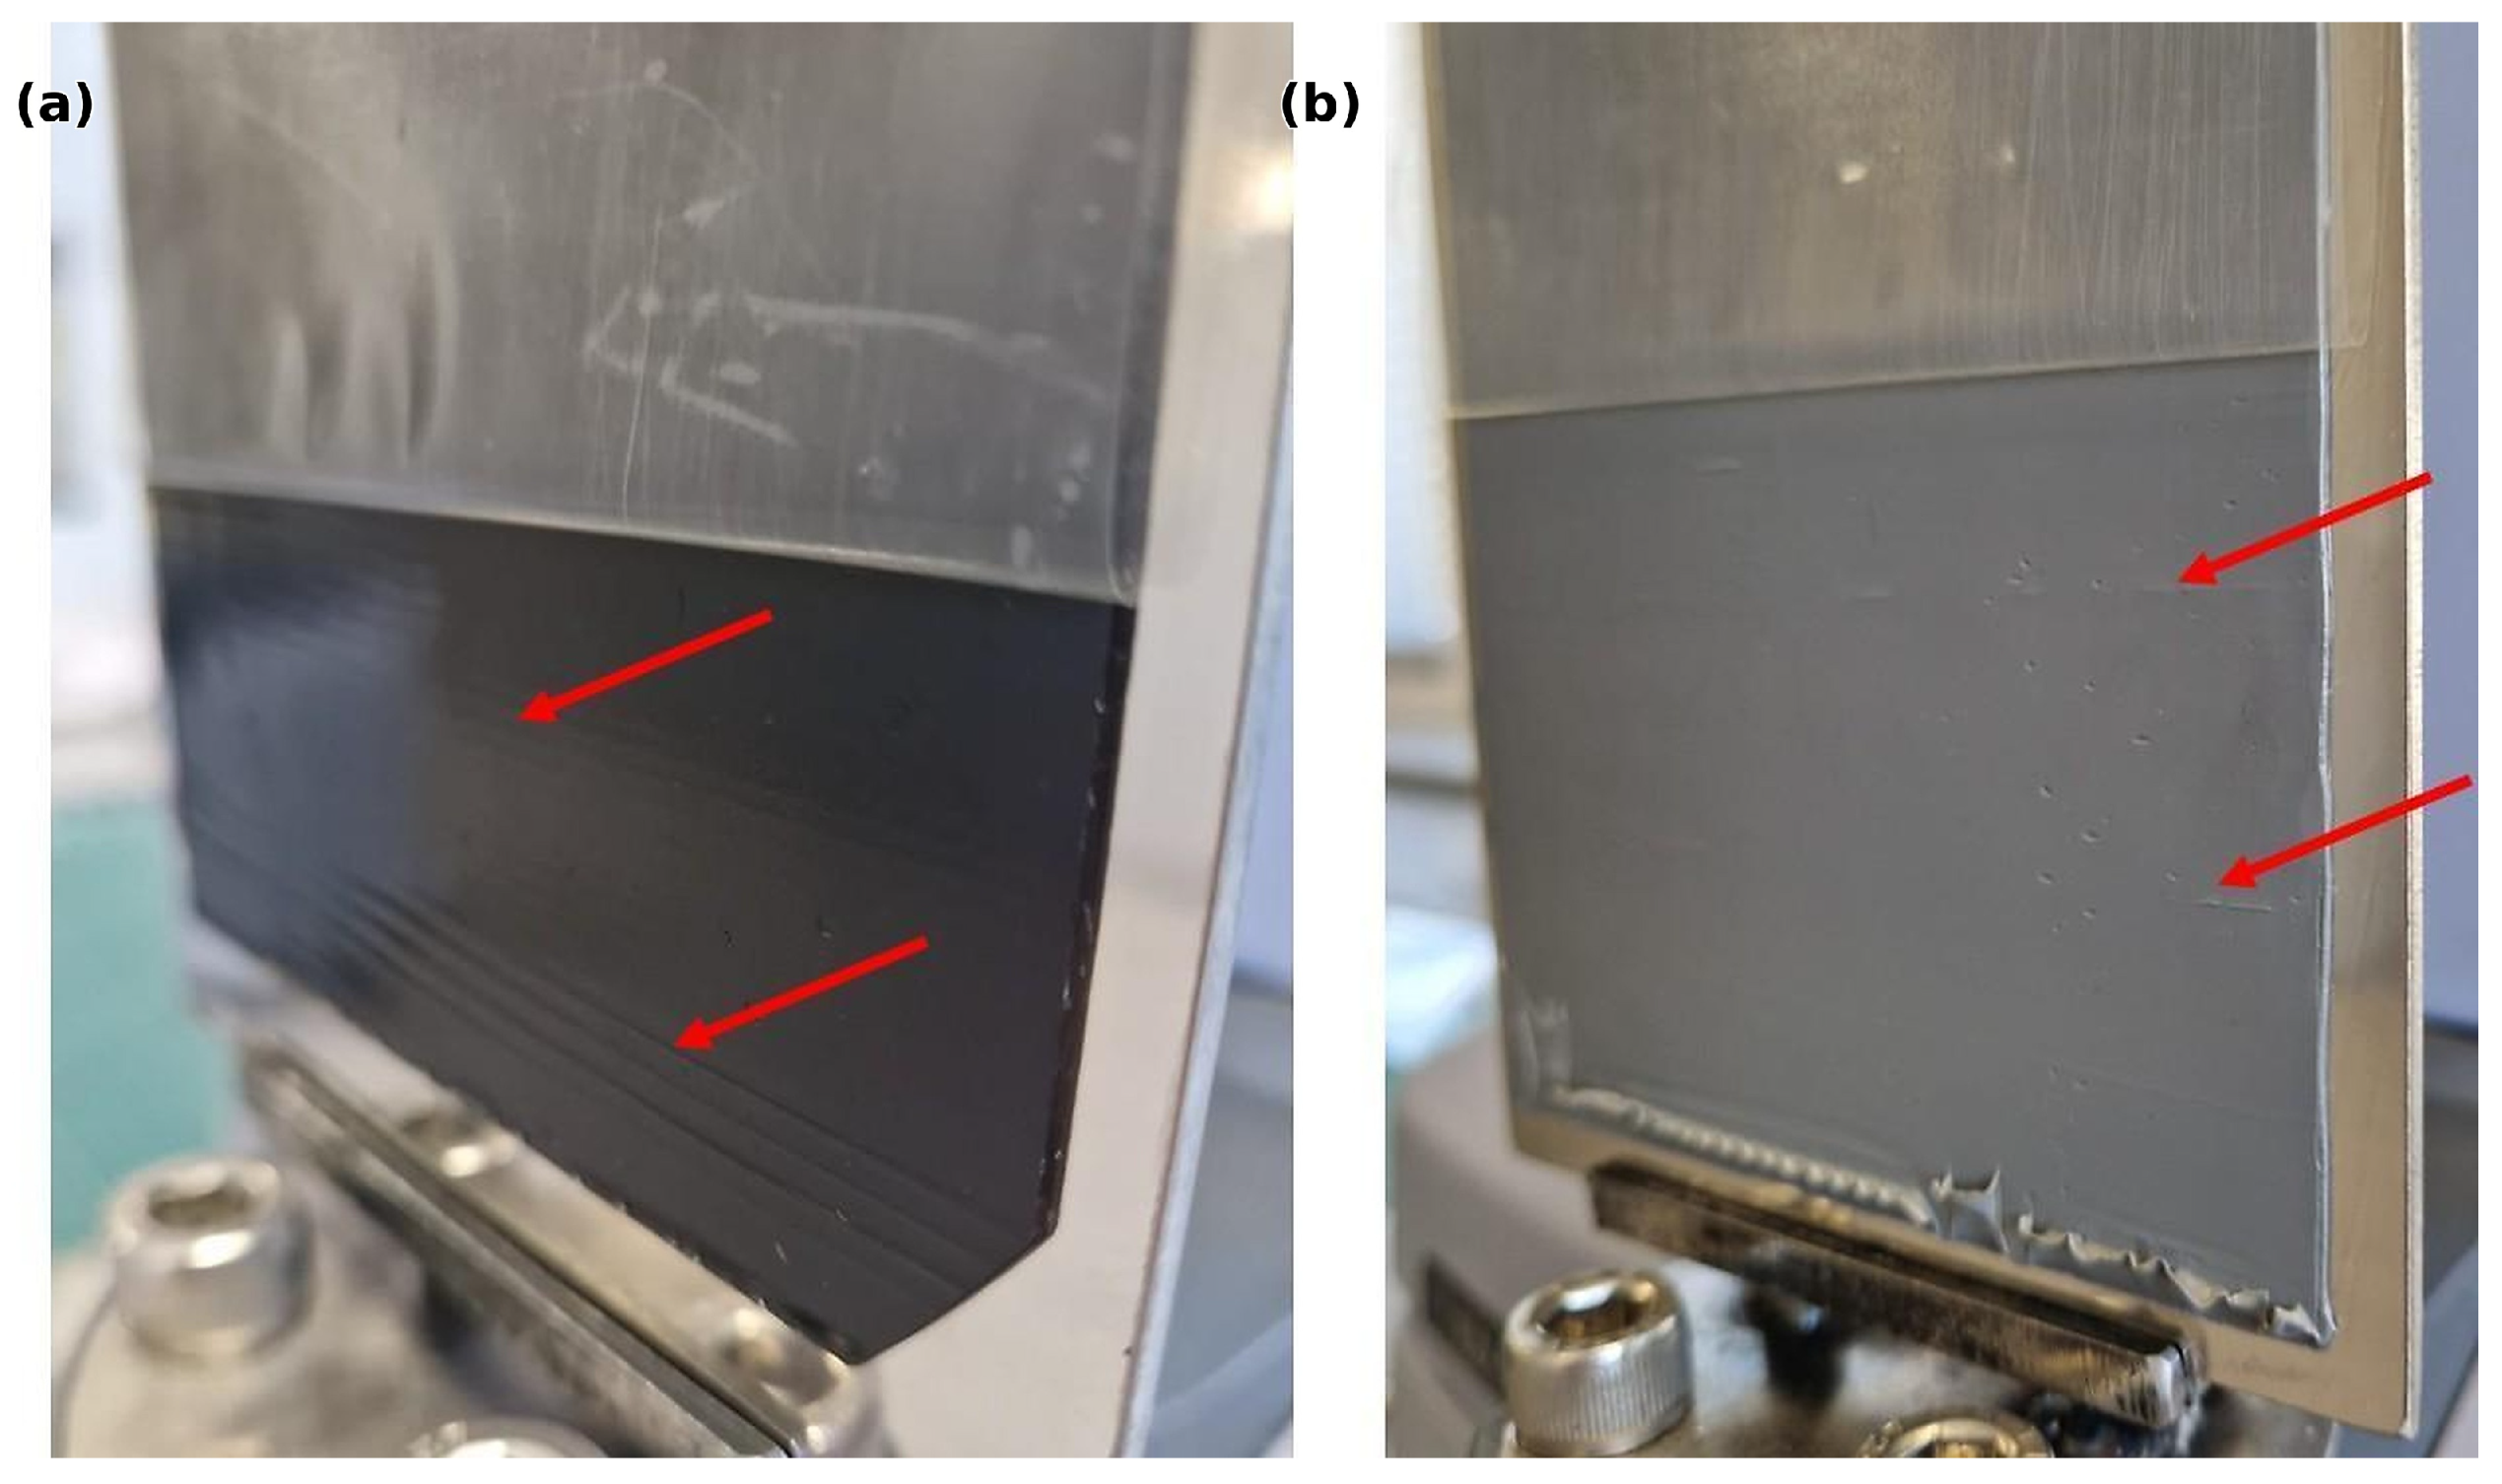
On the Rossella liner, and above all with U2E, the adhesive kept pulling out into fine threads as the liner came away (Figure 4). Soft pressure-sensitive adhesives do this routinely; the threading dissipates energy, usually alongside cavitation, and it moves the failure from a clean interface to partial cohesive tearing [16,17]. Thus, the Rossella/U2E force was not a clean interfacial number. It also reflected stretching and tearing of the butyl, and that is why we treat it as an apparent/effective separation force. Fibrillation and partly cohesive separation also showed up in the force–displacement data as sharp positive residual peaks above the detection threshold (Figure 5), in line with the unstable slip-stick peeling reported for adhesive-tape systems [18,19,20,29]. We refer to the physical phenomenon as slip-stick and keep slip-stick peak count for the counted positive residual events, matching the analysis code. The strongest excursion in the dataset was U2E on the Rossella outer side, because the compliant butyl compound could stretch a long way before it let go locally. When that happens, instability in how the peel front advances leaves visible marks on the specimen and sharp peaks in the force curve. In less severe cases, slip-stick manifested as faint lines or surface markings on the adhesive layer (Figure 6).
Figure 4.
Peel separation of Rossella liner (outer side) from U2E butyl sealant, showing cohesive stretching and sealant residues after testing. Yellow arrows indicate cohesive material deformation; green arrows mark parallel traces of cyclic slip-stick separation.
Figure 5.
Representative residual-force profiles for selected sealant/liner configurations: (a) Rossella/T1EN outer side, repeated slip-stick; (b) Crosil 42/T1EN inner side, intermediate behavior; (c) Crosil 42/T1EN outer side, stable separation. Dashed line indicates the 1.4 cN/25 mm detection threshold; crosses mark detected positive residual events. Panels share the same y-axis range.
Figure 6.
Post-test peel specimens: (a) dark PSA tape with horizontal bands/striations on the adhesive surface; (b) light-gray PSA tape with finer surface defects. Red arrows indicate the marked regions.
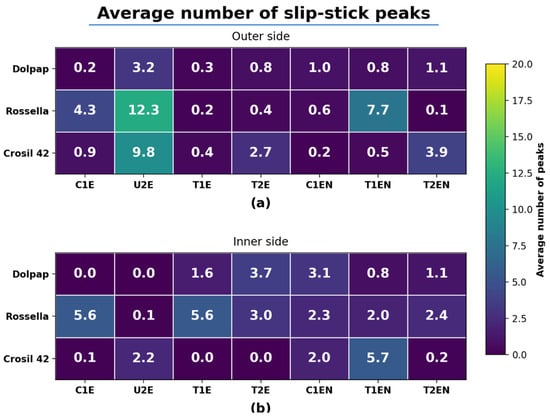
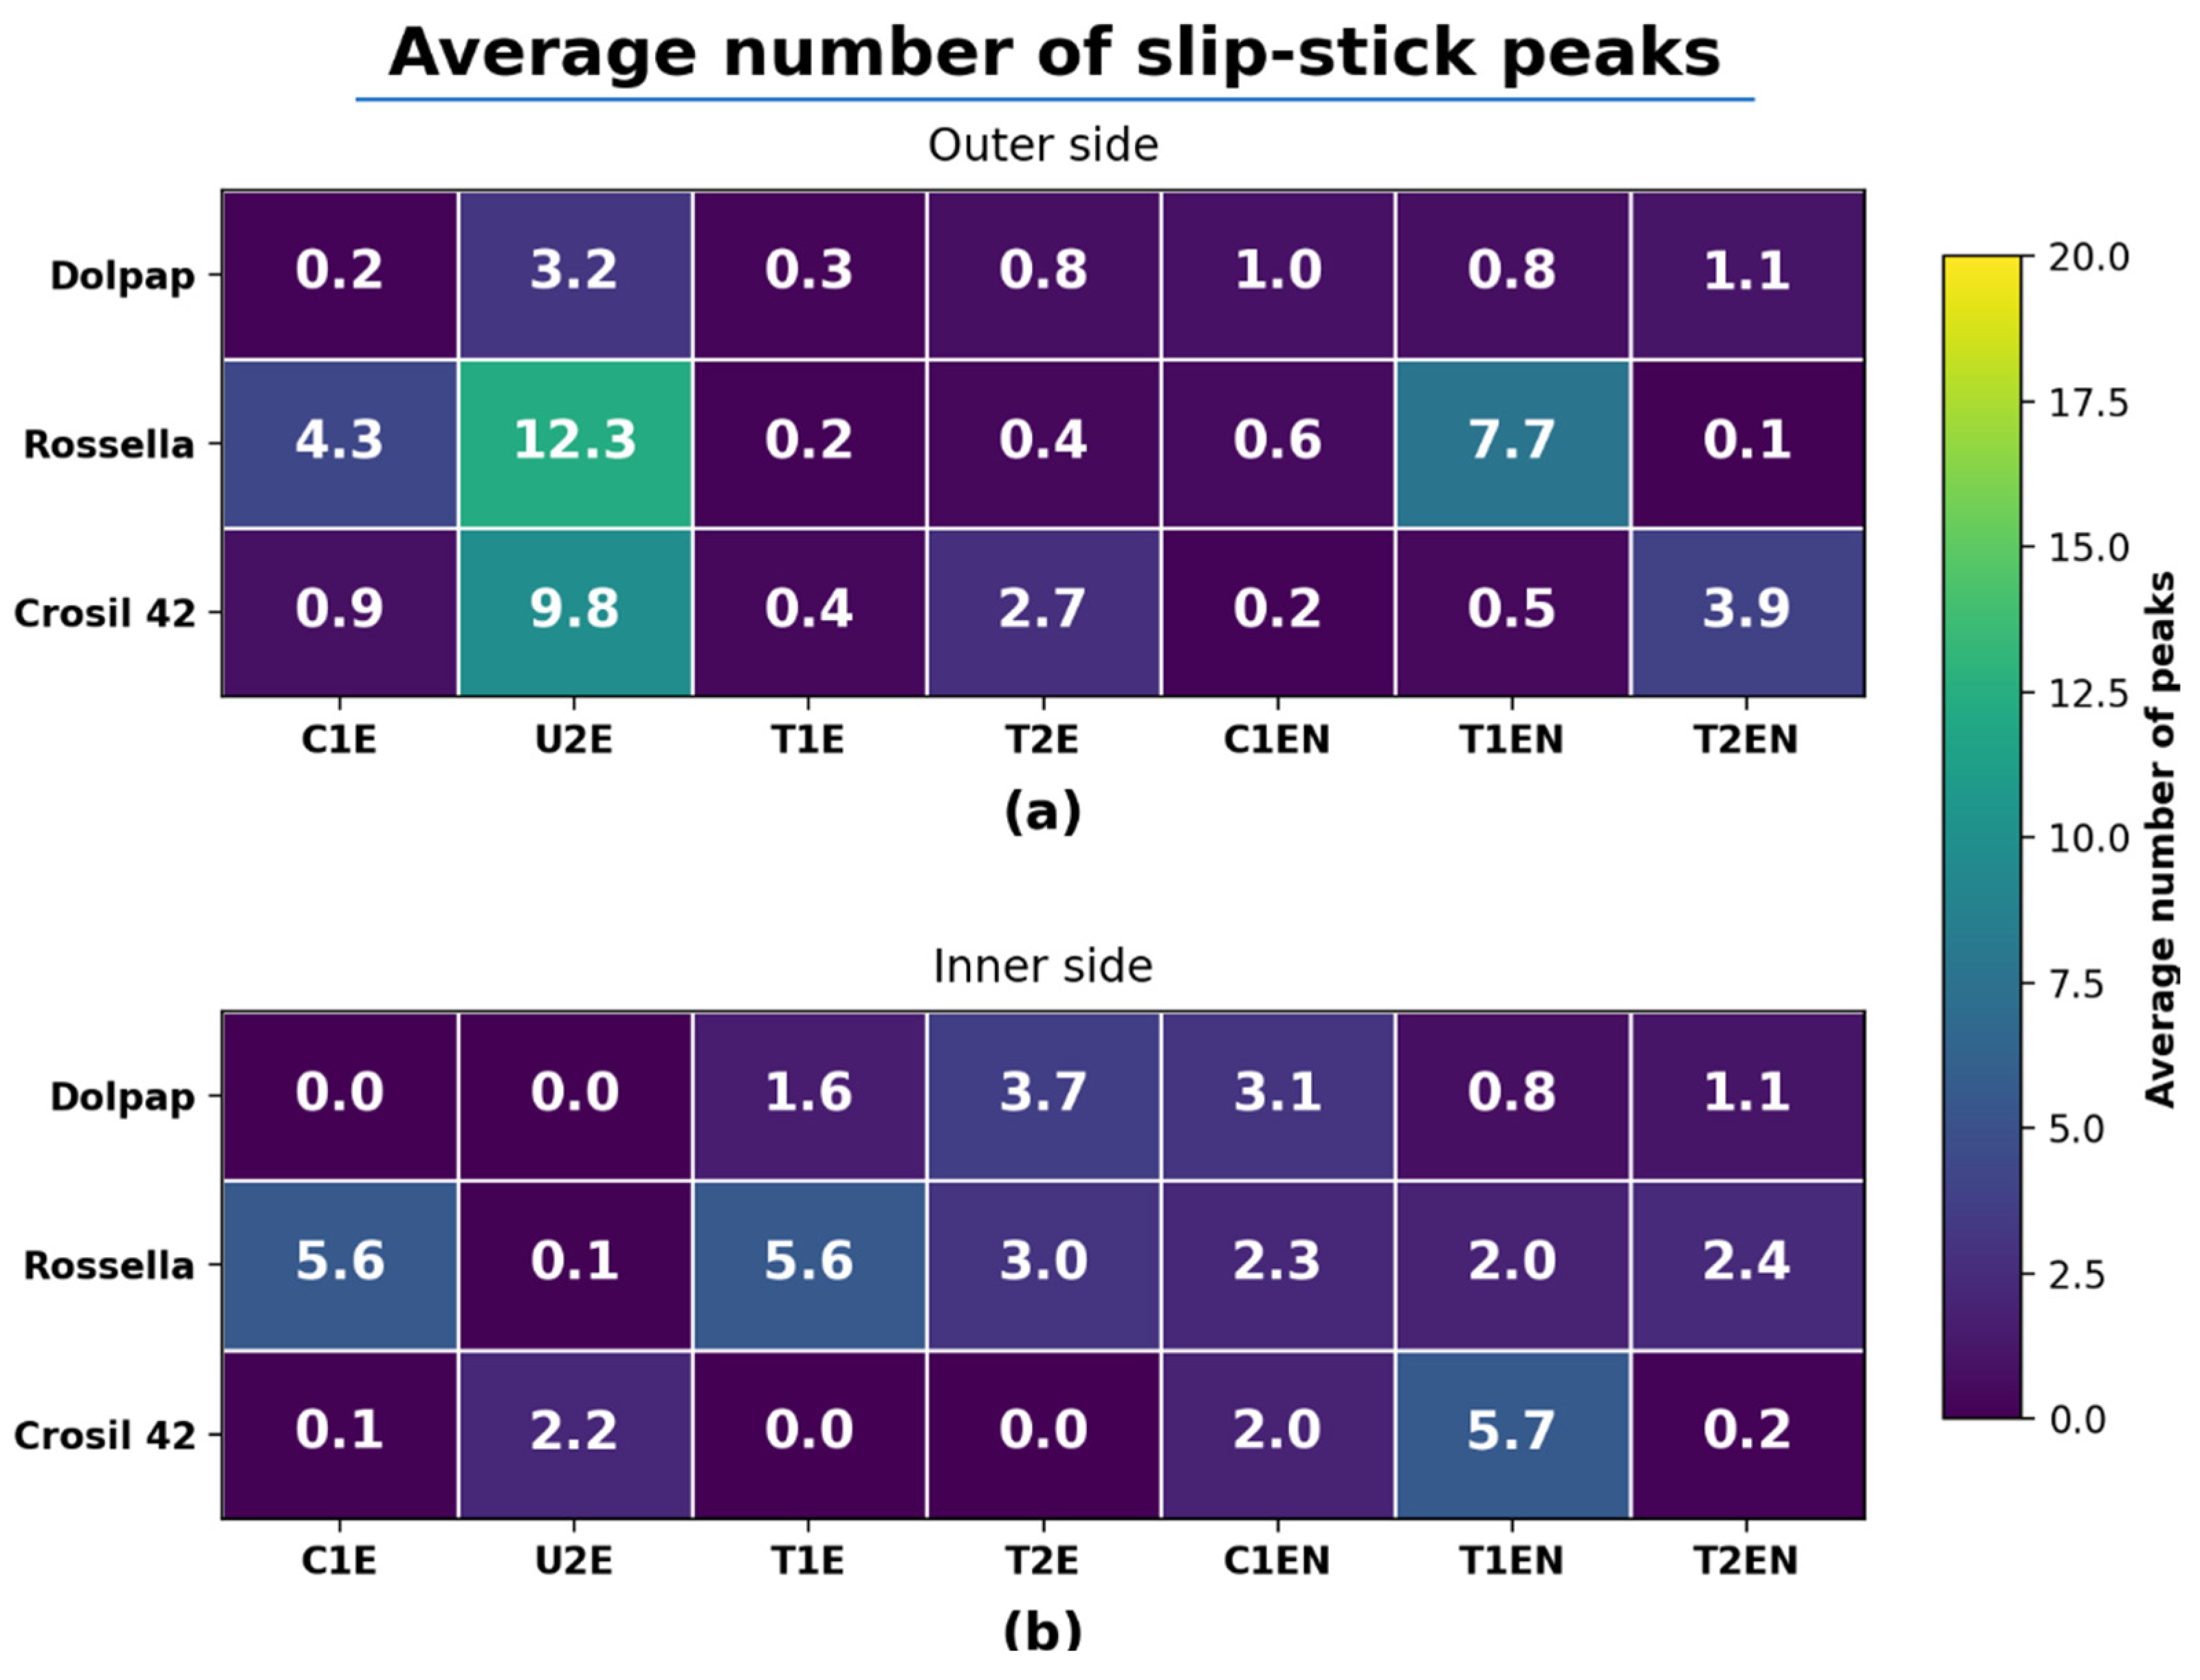
Figure 5 presents representative residual-force curves, and the supplementary material provides the full release-curve set for all Dolpap, Rossella, and Crosil 42 liner–sealant configurations (Figures S1–S21). Macroscopic post-test markings and adhesion defects are shown in Figure 6. The peak counts make clear that unstable separation tracked neither the liner alone nor the sealant alone, but the specific sealant–liner–side configuration. In some systems, such as T1EN/Crosil 42, the inner side gave the more unstable trace; in others the outer side showed more peaks, particularly with the soft U2E sample; the configurations with the highest mean peak counts are listed in Supplementary Materials, Table S3. A high peak count need not go with a high mean apparent separation force. Here it is a relative warning indicator of unstable peeling and a ranking tool for material-pair screening. It should not be read as a validated process acceptance threshold until it is tied to converting defects or application failures in a dedicated study.
PSA rheology has a strong effect on peeling [5,11,29]. Even so, no simple, consistent correlation emerged between Mooney viscosity, penetration, water contact angle and apparent separation force. That is unsurprising. Mooney viscosity, MVR, penetration and water contact angle are indirect, low-dimensional descriptors; they miss the full frequency-, rate- and strain-dependent response of a soft adhesive during peeling. The dynamic moduli G’ and G’’ and extensional rheology were not measured here, so the role of viscoelasticity stays qualitative. Future work should pair this force-trace screening with oscillatory and large-strain rheology to link peak counts and apparent separation force to how the material relaxes.
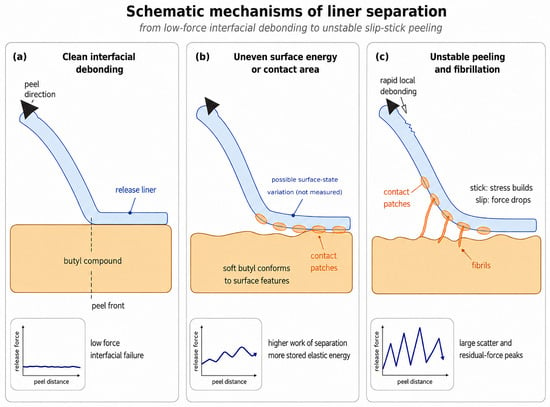
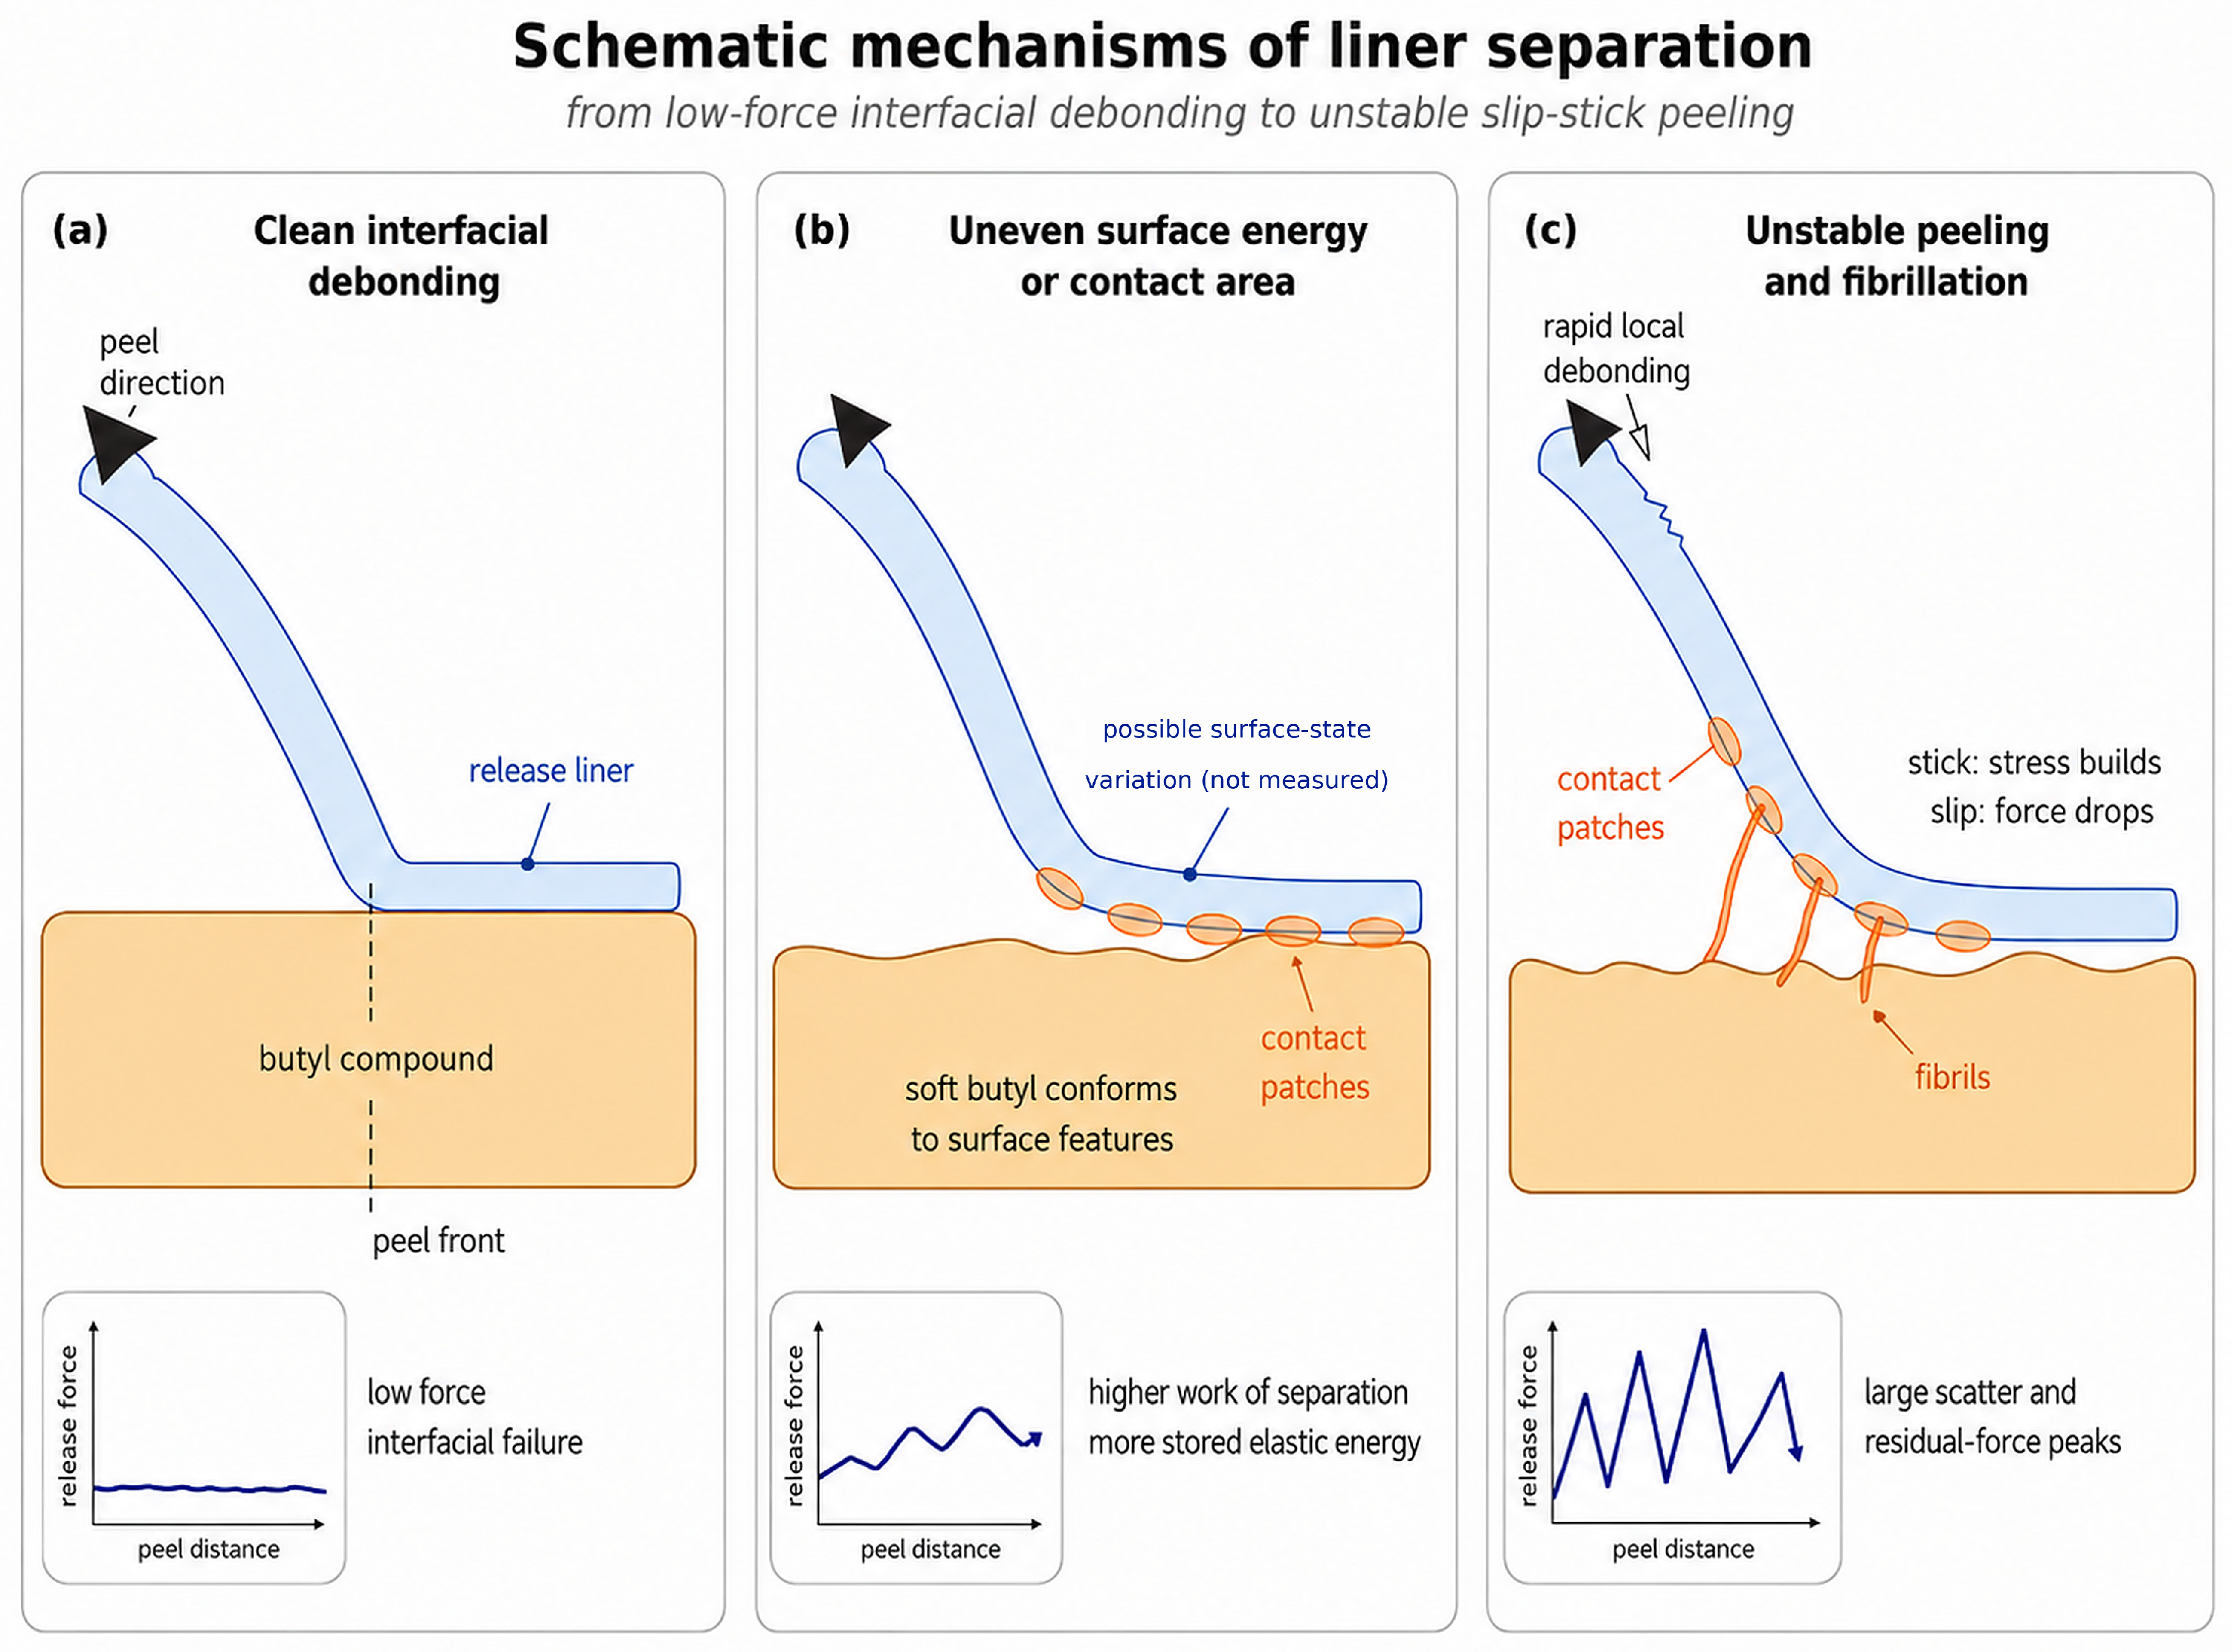
The water contact angle results did not correlate simply with liner removal, which is expected: the water measurement probes interaction with a strongly polar liquid, whereas the practical system pairs a hydrophobic butyl compound with a hydrophobic silicone release coating. Behavior is set instead by the specific liner–sealant pair and by peel-front dynamics. Release-coating architecture, surface microtopography, real contact area and dynamic viscoelastic response are all plausible contributors, but only the sealant descriptors, the force traces and the qualitative photographs were measured directly. The separation modes sketched in Figure 7 are therefore conceptual interpretations, not direct proof of any liner-surface mechanism. The corresponding slip-stick peak-count distribution is shown in Figure 8.
Figure 7.
Conceptual schematic of possible separation modes. The modes are read from the force traces and what we saw by eye: (a) clean interfacial debonding; (b) a larger real contact area as the compound wets and conforms; (c) unstable peeling with fibrillation and slip-stick behavior. The drawing interprets the data and is not direct evidence of differences in coating chemistry, crosslink density, roughness, or surface topography.
Figure 8.
Mean detected slip-stick peak count by sealant type and liner type: (a) outer liner side; (b) inner liner side. Values are mean positive residual excursions above 1.4 cN/25 mm per replicate.
3.2. Limitations
This study has several limitations. The chemical composition, coating architecture, crosslink density, surface chemistry, and surface roughness of the commercial liners were not measured directly. The photographs document surface state qualitatively. They do not stand in for profilometry, microscopy-based defect-density analysis, optical-haze measurement, or chemical characterization. The proposed mechanisms are read from release-force profiles, visual observations, and the measured sealant properties, not from direct liner-surface characterization. Roller pressure and rolling speed were not instrumented, so replicate variability includes a controlled manual-lamination component. G’ and G’’ and extensional rheology were not determined either, which keeps the discussion of viscoelasticity qualitative. The commercial sealant formulations were proprietary, and no lot-to-lot or shelf-life study was run; reproducibility rests instead on the measured material descriptors, the full force–displacement datasets, the replicate-level statistics and the analysis code, not on disclosure of complete recipes. Finally, the peak-count metric is a relative warning indicator for unstable traces and has not yet been validated as a process acceptance threshold against converting or application defects.
4. Conclusions
The modified FINAT-type test applied in this study should be regarded as a screening method rather than a compliance measurement. The standard FINAT FTM 10 method remains relevant for certifying release liners using a reference adhesive and for enabling comparison among suppliers under standardized conditions. In contrast, the protocol used in this work has a more specific purpose: to rank the tested butyl–liner combinations under a single defined condition that reflects the intended application context.
Most of the 42 liner–sealant–side configurations released easily, at mean apparent separation forces below about 18 cN/25 mm. Dolpap behaved the most uniformly and showed no strong side difference in the exploratory comparison. Crosil 42 stayed in the same low range but differed from side to side for a few sealants.
The clear outlier was Rossella/U2E on the outer side. Its high, scattered force is best read as an apparent/effective separation force, since fibrillation and partial cohesive deformation contributed strongly to it. The case shows why the mean force should be weighed together with the visual evidence and the stability of the force trace.
The operational slip-stick peak count highlighted configurations whose force traces were unstable in ways the mean force alone did not reveal. It is useful as a relative warning and ranking indicator for liner selection, but it is not yet a universally calibrated slip-stick threshold or a validated process acceptance criterion. Because the tested liners are nominally symmetric, the unintended side-to-side differences and local residual-force peaks resolved here are relevant to the kind of local deviation that could leave the adhesive on the wrong face or transfer it there during converting. These observations motivate pairing the inner–outer comparison with peak counting, but validating the screen as a diagnostic for this failure mode against actual converting or application defects remains a priority for future work.
Supplementary Materials
The following supporting information can be downloaded at: https://www.mdpi.com/article/10.3390/app16136548/s1.
Author Contributions
Conceptualization, J.C. and R.E.P.; methodology, J.C. and D.P.; software, J.C.; validation, J.C. and E.K.; formal analysis, J.C.; investigation, J.C., D.P., B.S., J.G. and M.F.; resources, J.C. and R.E.P.; data curation, J.C.; writing—original draft preparation, J.C.; writing—review and editing, E.K., B.S., J.G., M.F. and R.E.P.; visualization, J.C.; supervision, R.E.P.; project administration, J.C.; funding acquisition, J.C. All authors have read and agreed to the published version of the manuscript.
Funding
This research was funded by the Minister of Education and Science (Poland) under the programme “Doktorat wdrożeniowy”, VI edition (Implementation Doctorate Programme, 6th edition), grant number DWD/6/0325/2022, implemented in cooperation with Almara sp. z o.o. sp.k. as the industrial partner. Almara supplied the tested commercial sealant materials. No external funding was received for the article processing charge (APC).
Institutional Review Board Statement
Not applicable.
Informed Consent Statement
Not applicable.
Data Availability Statement
The original force–displacement datasets, processed source-data table for the material-property values reported in Table 1, processed and per-replicate contact angle source data for Table 2, the slipstick Python analysis code, generation scripts, exact environment requirements, metadata files, generated tables and figures, and verification scripts supporting the results of this study are openly available in Zenodo at https://doi.org/10.5281/zenodo.20448892, version 1.0.0. The supplementary release-curve figures are available as Supplementary Materials accompanying this article.
Acknowledgments
In preparing this manuscript, the authors used generative-AI tools for the following tasks: OpenAI GPT-5.5 Pro to screen the manuscript for substantive gaps; OpenAI GPT-5.5 (xhigh reasoning) to assist with organizing and documenting the Zenodo reproducibility package and the accompanying analysis scripts and figures; and Anthropic Claude Opus 4.8 for an editorial pass that included Polish-to-English translation, formatting, and a check against the journal’s author guidelines. All computations and figures were produced by the scripted analysis pipeline; the authors reviewed and edited all output, verified it against the raw data, and take full responsibility for the content of this publication.
Conflicts of Interest
J.C. and E.K. are affiliated with Almara sp. z o.o. sp.k. Almara supplied the tested commercial sealant materials, acted as the industrial partner in the Implementation Doctorate Programme, and provided access to company equipment for most experimental work, including peel testing and basic material characterization; the water contact angle measurements were performed outside the company. J.C. is also named in the patent application cited in this manuscript. Almara’s role in the work consisted of providing materials and facilities and the participation of company-affiliated authors as stated in the Author Contributions section. The interpretation of the results and the decision to submit the manuscript were made by the authors. The remaining authors declare no conflicts of interest.
Abbreviations
The following abbreviations are used in this manuscript:
| PSA | Pressure-Sensitive Adhesive |
| HMPSA | Hot-Melt Pressure-Sensitive Adhesive |
| PDMS | Poly(dimethylsiloxane) |
| PIB | Polyisobutylene |
| IIR | Isobutylene-Isoprene Rubber (butyl rubber) |
| PET | Poly(ethylene terephthalate) |
| PP | Polypropylene |
| PE | Polyethylene |
| HRA | High-Release Additive |
| FTM | FINAT Test Method |
References
- Galimzyanova, R.Y.; Lisanevich, M.S.; Khakimullin, Y.N. Effect of Calcium Carbonate on the Properties of Noncuring Sealants Based on Butyl Rubber and Thermoplastics. Russ. J. Appl. Chem. 2013, 86, 1287–1291. [Google Scholar] [CrossRef] [Scilit]
- Higgins, J.J.; Jagisch, F.C.; Stucker, N.E. Butyl Rubber and Polyisobutylene. In Handbook of Adhesives; Springer: Berlin/Heidelberg, Germany, 1990. [Google Scholar] [CrossRef] [Scilit]
- Li, L.; Bouzidi, L.; Narine, S.S. Current Research and Development Status and Prospect of Hot-Melt Adhesives: A Review. Ind. Eng. Chem. Res. 2008, 47, 7524–7532. [Google Scholar] [CrossRef] [Scilit]
- Hung, J.-M. Hot Melt Sealants. In Handbook of Sealant Technology; CRC Press: Boca Raton, FL, USA, 2009. [Google Scholar] [CrossRef] [Scilit]
- Ruuska, H. Practical Adhesion of Siliconized Release Liners. Master’s Thesis, Tampere University of Technology, Tampere, Finland, 2016. [Google Scholar]
- Yan, X.; Yang, L.; An, Y.; Jin, W.; Li, Y.; Li, B. Surface roughness and hydrophilicity enhancement of polyolefin-based membranes by three kinds of plasma methods. Surf. Interface Anal. 2015, 47, 545–553. [Google Scholar] [CrossRef] [Scilit]
- Kinning, D.J.; Schneider, H.M. Release coatings for pressure sensitive adhesives. In Adhesion Science and Engineering; Elsevier: Amsterdam, The Netherlands, 2002; pp. 535–571. [Google Scholar] [CrossRef] [Scilit]
- Germek, E.; Schmid, M.; Lindner, M. Grafting of Fatty Acids on Polyvinyl Alcohol: Effects on Surface Energy and Adhesion Strength of Acrylic Pressure Sensitive Adhesives. Front. Mater. 2020, 6, 335. [Google Scholar] [CrossRef] [Scilit]
- Eckberg, R.P. Silicone Release Coatings. In Handbook of Pressure Sensitive Adhesive Technology, 3rd ed.; Satas & Associates: Warwick, RI, USA, 1999; pp. 865–892. [Google Scholar]
- Hori, S.; Yamada, T.; Kuo, C.-M. Release Modifier and Release Coating Organopolysiloxane Composition. U.S. Patent 8,933,177 B2, 13 January 2015. [Google Scholar]
- Gordon, G.V.; Schmidt, R.G. PSA Release Force Profiles from Silicone Liners: Probing Viscoelastic Contributions from Release System Components. J. Adhes. 2000, 72, 133–156. [Google Scholar] [CrossRef] [Scilit]
- Yamamoto, K.; Kanai, T.; Sakuta, K.; Nakajima, T. Heavy Release Additive for Release Sheet, Organopolysiloxane Composition for Release Sheet, and Release Sheet. U.S. Patent 10,570,234 B2, 25 February 2020. [Google Scholar]
- Liang, B.; Yang, Y.; Li, J. Research progress of water-based release agents. MATEC Web Conf. 2022, 358, 01033. [Google Scholar] [CrossRef] [Scilit]
- Critchlow, G.W.; Litchfield, R.E.; Sutherland, I.; Grandy, D.B.; Wilson, S. A review and comparative study of release coatings for optimised abhesion in resin transfer moulding applications. Int. J. Adhes. Adhes. 2006, 26, 577–599. [Google Scholar] [CrossRef] [Scilit]
- Ceglie, M.; Menga, N.; Carbone, G. The role of interfacial friction on the peeling of thin viscoelastic tapes. J. Mech. Phys. Solids 2022, 159, 104706. [Google Scholar] [CrossRef] [Scilit]
- Varchanis, S.; Kordalis, A.; Dimakopoulos, Y.; Tsamopoulos, J. Adhesion, cavitation, and fibrillation during the debonding process of pressure sensitive adhesives. Phys. Rev. Fluids 2021, 6, 013301. [Google Scholar] [CrossRef] [Scilit]
- Villey, R.; Cortet, P.-P.; Creton, C.; Ciccotti, M. In-situ measurement of the large strain response of the fibrillar debonding region during the steady peeling of pressure sensitive adhesives. Int. J. Fract. 2017, 204, 175–190. [Google Scholar] [CrossRef] [Scilit]
- Cortet, P.-P.; Dalbe, M.-J.; Guerra, C.; Cohen, C.; Ciccotti, M.; Santucci, S.; Vanel, L. Intermittent stick-slip dynamics during the peeling of an adhesive tape from a roller. Phys. Rev. E 2013, 87, 022601. [Google Scholar] [CrossRef] [Scilit] [PubMed]
- Dalbe, M.-J.; Villey, R.; Ciccotti, M.; Santucci, S.; Cortet, P.-P.; Vanel, L. Inertial and stick-slip regimes of unstable adhesive tape peeling. Soft Matter 2016, 12, 4537–4548. [Google Scholar] [CrossRef] [Scilit] [PubMed]
- Dalbe, M.-J.; Cortet, P.-P.; Ciccotti, M.; Vanel, L.; Santucci, S. Multiscale Stick-Slip Dynamics of Adhesive Tape Peeling. Phys. Rev. Lett. 2015, 115, 128301. [Google Scholar] [CrossRef] [Scilit] [PubMed]
- FINAT. FINAT Test Method FTM 10—Quality of Silicone Coated Substrates for Self-Adhesive Laminates: Release Force; FINAT: The Hague, The Netherlands, 2019. [Google Scholar]
- Czakaj, J. (Almara sp. z o.o. sp.k.). Method for Producing an Adhesive Composition, Adhesive Composition, and Product Containing and/or Based on the Adhesive Composition. Patent PL448261A1, 13 October 2025. Also available as WO2025216641A1. [Google Scholar]
- Owens, D.K.; Wendt, R.C. Estimation of the Surface Free Energy of Polymers. J. Appl. Polym. Sci. 1969, 13, 1741–1747. [Google Scholar] [CrossRef] [Scilit]
- ISO 1183-1:2019; Plastics—Methods for Determining the Density of Non-Cellular Plastics—Part 1: Immersion Method, Liquid Pycnometer Method and Titration Method. International Organization for Standardization: Geneva, Switzerland, 2019.
- ISO 1133-1:2022; Plastics—Determination of the Melt Mass-Flow Rate (MFR) and Melt Volume-Flow Rate (MVR) of Thermoplastics—Part 1: Standard Method. International Organization for Standardization: Geneva, Switzerland, 2022.
- ISO 289-1:2015; Rubber, Unvulcanized—Determinations Using a Shearing-Disc Viscometer—Part 1: Determination of Mooney Viscosity. International Organization for Standardization: Geneva, Switzerland, 2015.
- EN 1939:2003; Self Adhesive Tapes—Determination of Peel Adhesion Properties. European Committee for Standardization: Brussels, Belgium, 2003.
- PN-ISO 2137:2011; Petroleum Products and Lubricants—Determination of Cone Penetration of Lubricating Greases and Petrolatum. Polish Committee for Standardization: Warsaw, Poland, 2011.
- Sun, S.; Li, M.; Liu, A. A review on mechanical properties of pressure sensitive adhesives. Int. J. Adhes. Adhes. 2013, 41, 98–106. [Google Scholar] [CrossRef] [Scilit]

Disclaimer/Publisher’s Note: The statements, opinions and data contained in all publications are solely those of the individual author(s) and contributor(s) and not of MDPI and/or the editor(s). MDPI and/or the editor(s) disclaim responsibility for any injury to people or property resulting from any ideas, methods, instructions or products referred to in the content. |
© 2026 by the authors. Licensee MDPI, Basel, Switzerland. This article is an open access article distributed under the terms and conditions of the Creative Commons Attribution (CC BY) license.