


Abstract
Real-time traffic safety analysis is necessary to determine proactive risks associated with traffic conflicts. This study presents a driving-risk detection framework based on high-precision naturalistic vehicle trajectory data to support host vehicle driver-warning systems. A rear-end conflict identification approach based on time-to-collision (TTC) is employed to detect vehicle interactions as safe or unsafe. To capture temporal driving patterns, frame-level observations are transformed into sequential samples using a sliding-window strategy while preserving the natural class imbalance of real-world traffic data. Several conventional machine learning models, including CatBoost, LightGBM, XGBoost, Random Forest, Extra Trees, Decision Tree, and SVM, as well as recurrent deep learning models such as Simple RNN, LSTM, and GRU, are evaluated using leave-one-subject-out cross-validation across seven expressways. Among the evaluated models, the Simple RNN achieves a recall of 99.12% and an F1-score of 98.48%, outperforming the conventional machine learning models. Its predictive performance is comparable to that of LSTM and GRU while offering lower inference latency, making it suitable for real-time deployment. A SHAP-based Explainable AI analysis is conducted to identify the most influential factors in conflict detection and to provide insight into model predictions. The analysis supports that host vehicle speed, preceding vehicle speed, and inter-vehicle gap are the primary determinants of rear-end conflict risk. This proactive and interpretable framework, evaluated offline on naturalistic trajectory data, demonstrates strong potential for integration into real-time driver-warning systems.
1. Introduction
Road traffic injuries are the leading cause of mortality among individuals aged 5–29 years. A significant number, approximately 1.19 million people, die every year due to road crashes. Around 20 to 50 million more people are injured, leading to long-term disabilities for most of them. Financial losses are among the consequences of traffic-related injuries. These losses affect individuals, families, and entire countries. In most countries, road crashes cost about 3% of the gross domestic product (World Health Organization, 2023) [1]. Rear-end collisions are the most frequent type of road accident. Data from the National Highway Traffic Safety Administration (NHTSA) show that there were 1,457,155 such crashes in 2020. This was the highest among all accident types. It accounted for approximately 27.8% of all crashes [2]. Driver distraction and inattention are major contributors to road crashes as they impair driver perception, reaction capability, and vehicle control [3]. In addition, sudden braking, rapid acceleration, and deceleration are also important indicators of elevated traffic risk and potential rear-end conflicts [4]. These rear-end crashes remain one of the most common traffic safety concerns in both developed and developing countries, with irregular changes in vehicle speed playing a significant role in their occurrence. Real-time traffic safety-monitoring and risk assessment systems have received increasing attention because they enable the early identification of hazardous traffic conditions, support timely preventive interventions, and facilitate proactive collision avoidance [5,6,7,8]. With advances in traffic sensing technologies, collecting high-resolution, real-time traffic data has become increasingly accessible, further promoting research on real-time traffic risk analysis and prediction [9]. Real-time risk assessment frameworks are also relevant to autonomous and connected vehicle environments, where they require higher data resolution and greater accuracy in collision risk estimation [10].
Time-to-collision (TTC) is a widely used surrogate safety measure that estimates the time until two vehicles collide if they continue at the same speed in the same direction. A smaller TTC value indicates a higher risk of collision. Previous studies have commonly adopted TTC thresholds ranging from 1.5 to 4 s [11]. However, drivers typically require approximately 1.5 s to react and press the brake [12], indicating that warning systems should provide sufficient lead time to prevent potential conflicts. In this study, traffic states and conflicts are integrated using a 4 s TTC threshold. Binary safety labels are derived from TTC values in high-resolution trajectory data, with values below the threshold indicating potential unsafe conditions. While advanced driver assistance systems (ADASs) and emergency braking applications often employ smaller TTC thresholds because their primary objective is to detect imminent collision risks and trigger immediate interventions, the proposed framework focuses on proactive rear-end conflict detection using vehicle trajectory data. Consequently, the objective is to identify developing unsafe interactions before they become critical. The selection of the 4 s threshold is supported by the trajectory-based traffic safety study of Hu et al. [13], who systematically evaluated TTC thresholds of 1.5 s, 2 s, 3 s, and 4 s on highways using the Akaike Information Criterion (AIC). Their findings showed that the 4 s threshold yielded the highest statistical significance for traffic safety variables and captured a substantially larger number of meaningful conflict cases, 1238 unsafe instances compared to the 1.5 s threshold, making it the most suitable boundary for proactive conflict analysis. Given the relatively high vehicle speeds and rapidly changing car-following dynamics on expressways, an earlier conflict identification threshold is advantageous for detecting safety-critical situations before they become irreversible. Therefore, a TTC threshold of 4 s is considered appropriate for the proposed trajectory-based rear-end conflict detection framework.
To mitigate adverse impacts on individuals and society, this study proposes an effective system for detecting potential rear-end vehicle conflicts. The system uses a trajectory-based sequential learning framework that preserves frame-level vehicle interactions and transforms them into temporal sequences via sliding windows, leveraging the high-quality WUT-NGSIM trajectory dataset. In addition, SHAP-based explainability is incorporated to improve model interpretability, and inference-time analysis is conducted to evaluate the model’s computational suitability for low-latency traffic safety monitoring.
Related Works and Problem Statement
Existing traffic safety studies can generally be divided into two groups based on the type of data used. The first group studies the relationship between crashes and overall traffic conditions, including traffic volume, speed, and occupancy. The second group focuses on traffic conflicts using detailed vehicle trajectory data. However, both approaches have limitations. Crash-based studies depend on accident data. In reality, real accident data are scarce and difficult to obtain. In many cases, several years of data are required to discover the accident patterns. Furthermore, data are frequently affected by quality issues, underreporting, and inconsistencies. These limitations reduce its effectiveness for real-time safety monitoring [14,15]. Conversely, trajectory-based studies require video data, necessitating complex methods to extract information about vehicle movements. This process is time-consuming and usually done offline. As a result, real-time safety evaluation is difficult [13].
To overcome these limitations, recent studies follow a different approach. They establish the connection between traffic conditions and traffic conflicts using surrounding safety measures [13,16]. The growing availability of high-resolution traffic data has accelerated the adoption of machine learning and deep learning in safety analysis. Traffic conflicts occur far more frequently than crashes, require evasive action, and can be extracted from trajectory data [15]. Among various indicators, time-to-collision (TTC), first introduced by Hayward (1972) [17], remains one of the most widely used measures, particularly for detecting rear-end conflicts. Hu et al. [13] applied TTC to define the conflict, non-conflict class labels. They evaluated multiple classifiers using the HighD dataset and found that a random forest model trained on SMOTE-balanced data achieved the highest accuracy. They presented a comparative analysis to evaluate the model’s performance on the original imbalanced dataset, its undersampled and oversampled versions, using the same machine learning methods for consistency. Huang et al. [5] extracted traffic-flow and inter-vehicle kinematic features from risk events and applied several models, including Logistic Regression, K-Nearest Neighbors, eXtreme Gradient Boosting, Random Forest, and Multilayer Perceptron, with oversampling and undersampling strategies. Parsa et al. [18] developed a real-time crash prediction framework for urban roads using eXtreme Gradient Boosting combined with SHAP. Beyond good predictive performance, their analysis also identified the factors that played a major role in traffic conditions. Vijayan et al. [19] proposed an ensemble of multi-layer perceptrons for rear-end collision detection, using a one-dimensional CNN for feature extraction and Bayesian optimization for hyperparameter tuning. Dong et al. [20] used time-to-collision (TTC), deceleration rate to avoid crash (DRAC), and acceleration variance as inputs for a Hybrid Extreme Learning Machine (HELM). This semi-supervised model achieved 99.6% detection accuracy for abnormal events in naturalistic driving scenarios. Roy and Hasan [21] implemented several machine learning algorithms, including Logistic Regression, Random Forest, eXtreme Gradient Boosting, and Artificial Neural Networks, on vehicle trajectory data for highway traffic incident detection. The main limitation of traditional machine learning methods is that they treat each sample independently and do not explicitly model temporal dependencies in continuously evolving traffic conditions. Cai et al. [22] implemented a deep convolutional generative adversarial network (DCGAN) model for crash prediction on expressways, demonstrating improved sensitivity to rare but critical safety events. Li and Chen [23] applied deep learning models to spatiotemporal vehicle trajectory features, demonstrating that convolutional architectures can effectively capture risk-related patterns from acceleration, velocity, and inter-vehicle distance data. Zhao et al. [24] proposed a CNN-LSTM-Attention model for near-crash event identification on mountainous roads using naturalistic driving data from Yunnan, China. In their framework, a CNN extracted local spatial features from the driving data, an LSTM tracked temporal dependencies among feature variables, and an attention mechanism dynamically adjusted the weights of the feature parameters. The model was benchmarked against six comparative architectures, achieving an overall accuracy of 98.8% and a near-crash detection precision of 90.1%. Hema and Kumar [25] developed an LM-LSTM model by combining the Levenberg–Marquardt optimization algorithm with LSTM to address the problem of unoptimized weights in standard recurrent networks. They evaluated the approach on the NGSIM trajectory dataset and achieved 95.6% accuracy for rear-end collision risk prediction. Wang et al. [26] introduced a Spatiotemporal Transformer Network for simulating conflict risk propagation on freeways using high-resolution vehicle trajectory data. Ahsan et al. [27] investigated rear-end conflicts at Rectangular Rapid Flashing Beacon (RRFB) pedestrian crossings using 52 h of CCTV video processed through computer vision techniques. Modified time-to-collision (MTTC) and deceleration rate to avoid collision (DRAC) were used as surrogate conflict indicators, and separate time-embedded transformer models were trained for each metric. The ensemble voting framework achieved 86% recall with a 23% false alarm rate, outperforming individual models. Ashraf and Dey [28] analyzed rear-end collision risk in mixed autonomous and human-driven traffic using Lyft and Waymo datasets. They employed a hybrid deep learning framework that combined a Bidirectional Long Short-Term Memory Autoencoder with Extreme Value Theory (EVT). Deep learning approaches, including CNN-LSTM-Attention-based architectures for near-crash detection [24], spatiotemporal transformer networks for conflict risk propagation simulation using trajectory data [26], an ensemble time-embedded transformer model for vehicle conflict prediction [27], and a GNN-LSTM framework for spatiotemporal accident severity modeling [29], have exhibited strong capability in capturing sequential vehicle interaction patterns from trajectory data. Recent studies have also highlighted Explainable AI (XAI) techniques, including SHAP- and LIME-based interpretation frameworks, to improve the transparency and trustworthiness of safety-critical ITS applications. For example, recent research has investigated SHAP-integrated GNN-LSTM frameworks for traffic accident severity prediction [29], explainable spatiotemporal incident detection systems [30], and lightweight real-time XAI architectures for autonomous vehicle applications [31].
Despite substantial advances in trajectory-based traffic safety analysis, several limitations remain in existing studies. Some studies rely on aggregated traffic variables over fixed temporal intervals, which may obscure short-term vehicle interaction dynamics critical for early conflict detection. In addition, conventional machine learning methods treat observations independently and therefore cannot effectively capture temporal dependencies in continuously evolving driving behavior. Several previous studies also rely on oversampling or undersampling strategies to address class imbalance, potentially distorting the natural distribution of rare unsafe events. Furthermore, many existing studies focus primarily on prediction accuracy without considering computational efficiency, generalization to unseen traffic environments, and the interpretability required for practical deployment in real-time warning systems. To address these limitations, sequential deep learning models are used to capture vehicle motion over time rather than relying solely on conventional machine learning methods. This enables the model to learn how traffic conditions evolve and how unsafe situations develop from normal driving behavior. Unlike Hu et al. [13] and Li et al. [32], who relied on aggregated data over intervals, our approach preserves frame-level observations to retain detailed temporal information. Sequences are then created using sliding windows to capture temporal dependencies. This allows the model to learn fine-grained patterns in vehicle behavior and provides a richer, more flexible temporal representation. Moreover, neither oversampling nor undersampling is used to address class imbalance. The proposed framework intentionally avoids such preprocessing. Because non-conflict traffic data far outnumber conflict data in real-world traffic scenarios. The temporal modeling strengths of recurrent neural networks are used here to implicitly handle imbalance. The proposed model is evaluated using a leave-one-subject-out (LOSO) validation scheme across seven folds to provide generalization.
This study proposes a trajectory-based framework for detecting and warning of driving risks using temporal sequences generated by a sliding-window approach. The framework provides practical insights into how fine-grained trajectory dynamics can enhance early warning performance in traffic safety systems. This study makes the following contributions:
- This research formulates driving risk detection as a real-time prediction problem using time-to-collision (TTC) derived directly from vehicle trajectories without relying on historical crash data. This enables continuous, proactive risk detection, overcoming the sparsity and reactivity of crash-based approaches.
- Frame-level trajectory observations are retained and transformed into temporal sequences using a sliding window approach, instead of relying on aggregated traffic variables. Short-term interactions between vehicles that regulate driving risk are lost in aggregated representations. In addition, multiple temporal window sizes (15, 30, 45, and 60 frames) are evaluated using trajectory data sampled at 30 fps, corresponding to durations of 0.5 s, 1 s, 1.5 s, and 2 s. It is found that a short temporal window of approximately 1 s is sufficient to capture the dynamics leading to unsafe conditions, enabling low-latency real-time warning.
- An imbalanced dataset, a large number of safe instances compared to unsafe instances, is used in the proposed framework without oversampling or undersampling. Temporal modeling captures the evolution of driving patterns, allowing for the identification of rare unsafe events while reflecting realistic traffic behavior. Moreover, leave-one-subject-out (LOSO), a robust validation technique, is used to test the model generalization across different expressways. It helps the model capture general driving behavior rather than relying on location-specific patterns, improving its applicability to unseen environments.
- A SHapley Additive exPlanations (SHAP)-based explainable AI technique is applied to identify which features most influence the predictions. Vehicle speed and inter-vehicle distance emerge as the most important factors, consistent with core traffic safety principles, thereby improving trust in the model.
To the best of our knowledge, the integration of fine-grained frame-level temporal sequence modeling without resampling, rigorous cross-environment generalization assessment through LOSO evaluation, and integrated model interpretability using SHAP analysis within a deliberately lightweight architecture has not been jointly explored in rear-end conflict detection research. A Simple RNN with 64 hidden units, trained directly on raw imbalanced sequences, achieves a recall of 99.12% and an F1-score of 98.48%, demonstrating superior performance to conventional machine learning models. Its predictive performance is comparable to that of the more structurally complex LSTM and GRU architectures. Most recent deep learning studies primarily emphasize accuracy, but they either ignore computational efficiency or acknowledge high inference costs. In contrast, our proposed model achieves a mean per-sequence inference latency of only 0.20–0.40 ms, demonstrating its suitability for real-time deployment. These findings suggest that high architectural complexity is not necessarily required for short-horizon traffic conflict detection, as our lightweight Simple RNN achieves sub-millisecond inference latency (0.20–0.40 ms) alongside high accuracy. A LOSO cross-validation framework across seven geographically distinct expressway segments of the WUT-NGSIM dataset ensures that model performance is evaluated on entirely unseen traffic environments, thereby providing stronger evidence of cross-environment generalization rather than dataset-specific overfitting.
The rest of this paper is organized into several sections. Section 2 presents the proposed methodology, followed by the experimental setup in Section 3. Section 4 reports the performance evaluation and comparative analysis with several machine learning and sequential deep learning models, along with the interpretability of the model. Finally, the discussion and conclusions are presented in Section 5 and Section 6.
2. Methods
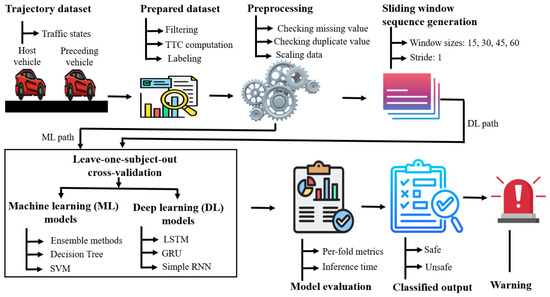
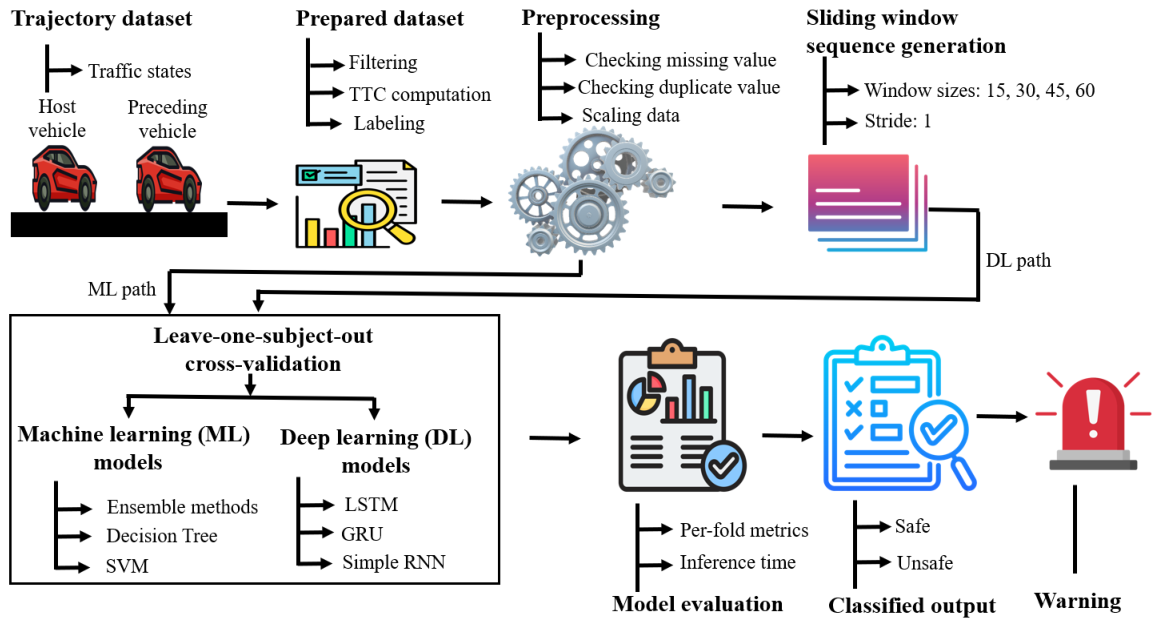
The steps for the rear-end conflict detection system include dataset preparation, preprocessing, multi-scale sliding-window sequence generation, LOSO validation, and classification models. Figure 1 presents the sequential steps of the proposed system architecture, each of which is briefly described below.
Figure 1.
Overall architecture of the proposed rear-end conflict detection framework, including dataset preparation, preprocessing, temporal sequence generation, LOSO validation, and classification stages.
2.1. Dataset Description
This study employs the WUT-NGSIM vehicle trajectory dataset [33], collected on the ring road between Heping Overpass and Hongmiao Overpass in Wuhan City using a DJI Mavic Air2 drone. The dataset comprises seven expressway segments designated as Expressways B, C, D, E, F, H, and I, at 30 FPS. The dataset provides frame-level observations of individual vehicles. Spatial coordinates, as well as kinematic properties related to the vehicle’s motion state information, are included in every record. The dataset identifies the preceding vehicle for each observed vehicle through a preceding vehicle identifier. However, the characteristics of that preceding vehicle, such as its velocity, acceleration, and position, are not embedded within the same record. Hence, a data reconstruction step is necessary before any interaction-based analysis.
2.2. Dataset Preparation
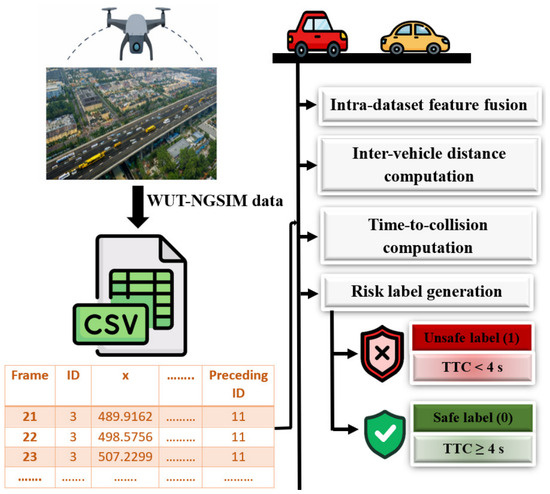
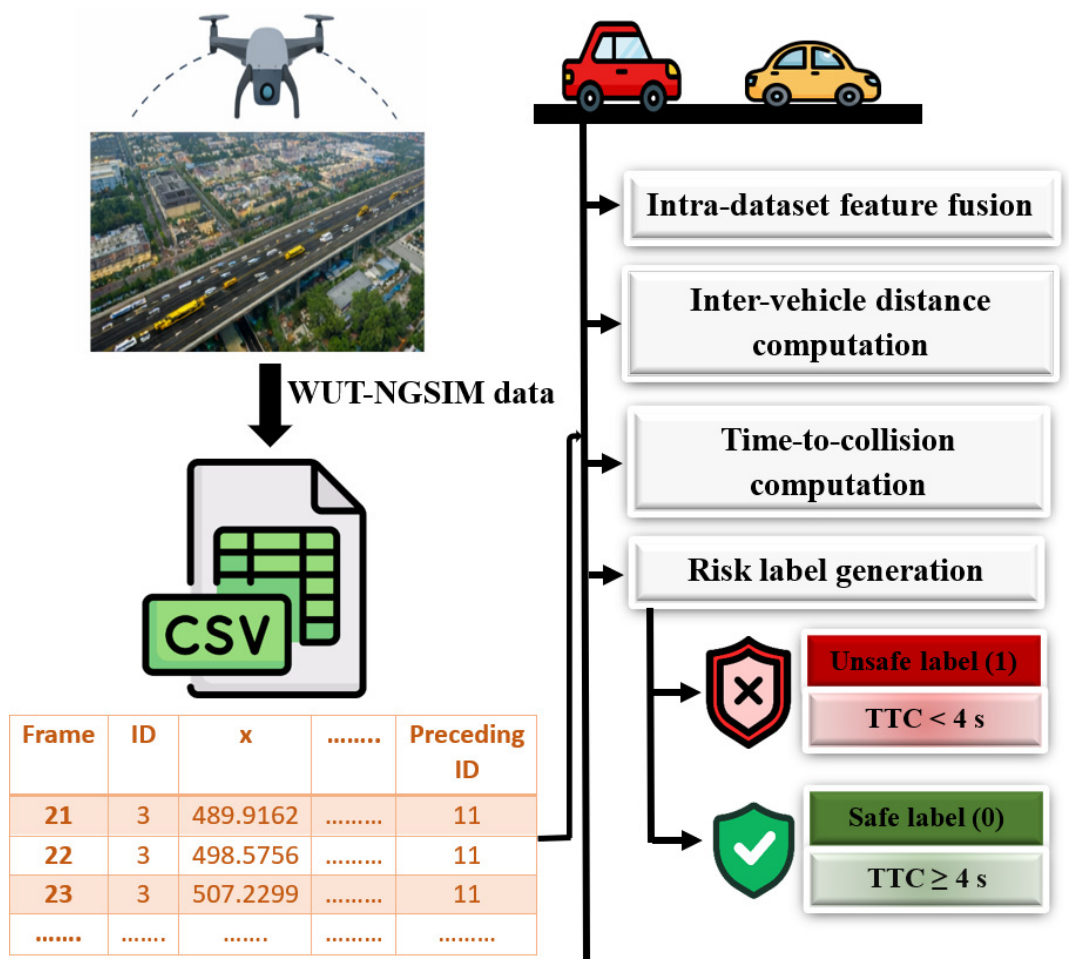
Raw trajectory data are organized to incorporate information from both the host and preceding vehicles for traffic safety analysis. At first, records corresponding to vehicles without a valid preceding vehicle, where the preceding vehicle ID equals zero, are excluded to ensure that all observations represent meaningful car-following scenarios. To capture interaction dynamics between vehicles, each vehicle is associated with its corresponding preceding vehicle within the same frame. The spatial coordinates and kinematic features of the host vehicle and its preceding vehicle are extracted from the dataset using a self-join by frame number and vehicle IDs. The inter-vehicle distance, D, is then calculated using the Euclidean distance and adjusted by subtracting the length of the leading vehicle.
where and represent the position of the immediate preceding vehicle, while x and y denote the position of the host vehicle, and is the length of the preceding vehicle. The time-to-collision (TTC) is then derived for each observation using the calculated distance and relative velocity.
where and represent the velocities of the following (host) vehicle and the preceding vehicle, respectively. A negative relative speed implies that the host vehicle is not closing in on the lead vehicle. In these cases, TTC is set to a large constant to reflect a non-critical condition. Observations with TTC equal to 0 are removed, as the focus of this study is on risk detection rather than post-collision analysis. Samples with TTC values in the range () are retained to concentrate on meaningful pre-collision scenarios. This filtering removes distant interactions that are unlikely to pose immediate safety risks. Each observation is assigned to a binary risk level following the TTC computation. Instances with TTC values of less than 4 s are labeled as unsafe, while remaining instances with TTC values greater than or equal to 4 s are labeled as safe. In this study, the term “unsafe” refers to potential rear-end conflict conditions rather than actual collision events.
The risk level is converted to a numerical value, with “safe” mapped to 0 and “unsafe” to 1. The steps of dataset preparation are illustrated in Figure 2.
Figure 2.
Overview of the dataset preparation pipeline, showing the transformation of raw WUT-NGSIM trajectory data into the final risk-labeled dataset used for model training and testing.
The extracted trajectory-based features used for model training are summarized in Table 1. The feature set captures the spatial positions and kinematic properties of both the host and preceding vehicles, including vehicle coordinates, velocities, accelerations, and inter-vehicle distances.
Table 1.
Trajectory-based input features extracted from the WUT-NGSIM dataset, comprising vehicle position, velocity, acceleration, and inter-vehicle distance information used for model development.
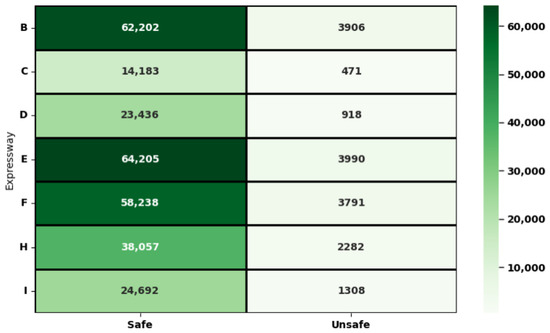
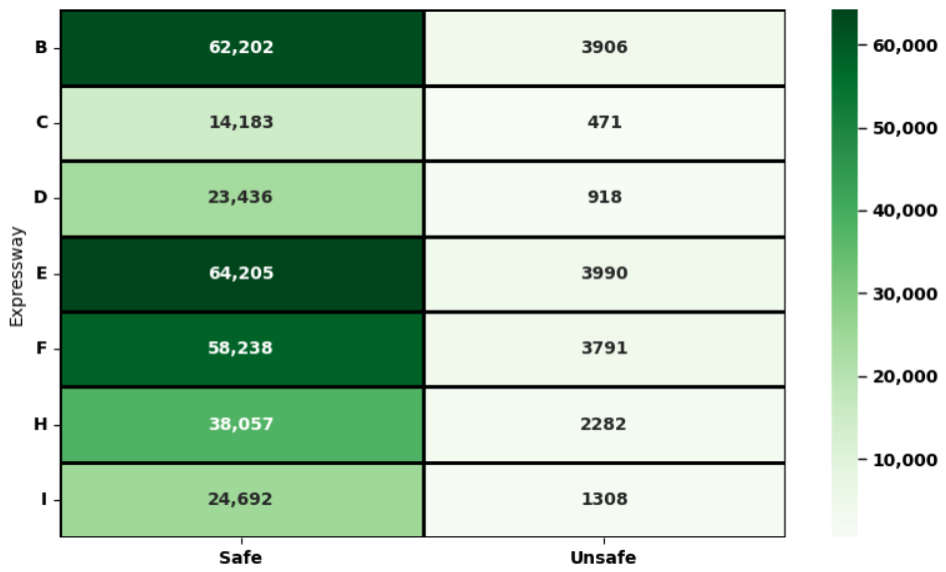
As presented in Figure 3, traffic observations are divided into safe and unsafe conditions across different expressways, and safe cases are far more frequent than unsafe ones. A total of 285,013 safe instances are in the prepared dataset, while only 16,666 unsafe instances are present. The imbalance ratios range from approximately 15:1 to 30:1, indicating that for every unsafe instance, there are at least 15 safe observations. Expressway C shows the highest class imbalance ratio. This reflects real-world traffic conditions, where hazardous events occur far less frequently than in normal driving situations.
Figure 3.
Distribution of safe and unsafe traffic instances across different expressways, indicating safe observations substantially outnumber unsafe cases.
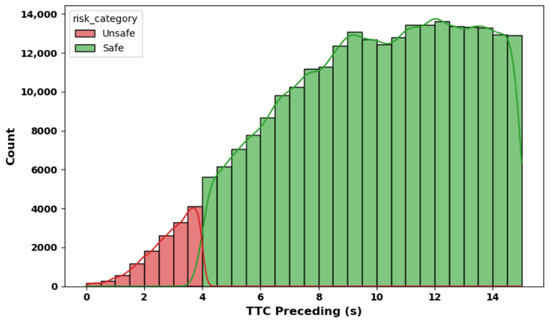
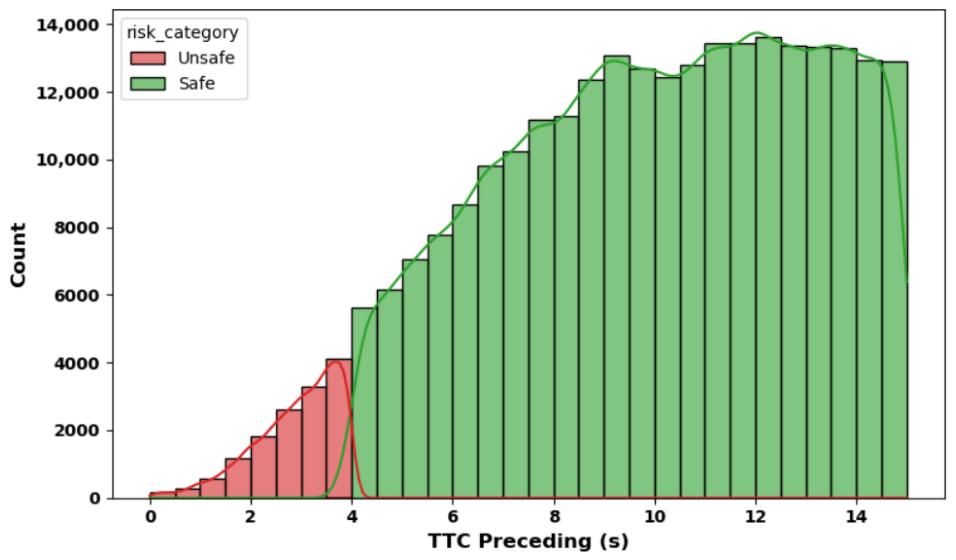
As shown in Figure 4, safe and unsafe conditions are separated by TTC, with higher values typically associated with safe scenarios. In contrast, unsafe conditions are associated with lower TTC values, less than 4 s, indicating an inverse relationship between TTC and collision risk.
Figure 4.
Distribution of time-to-collision (TTC) values for safe and unsafe conditions, showing that lower TTC values are linked to higher collision risk.
2.3. Preprocessing
The dataset is preprocessed before being fed into the model. It is first checked for missing values, as their presence can introduce bias and distort the learned patterns. Various strategies, such as deletion, imputation, or predictive techniques, are commonly applied to address missing data. However, in this study, the dataset is already well-prepared and contains no missing values. Hence, no additional handling is required. It is also verified that the prepared dataset contains no duplicate values. Next, feature standardization is performed. Standardization rescales each feature to have a mean of zero and a standard deviation of one. As a result, all features contribute equally during model training, preventing bias toward features with larger numerical ranges.
The standardization process is defined as follows:
where represents the standardized value, x is the original feature value, denotes the mean, and is the standard deviation.
2.4. Temporal Sequence Representation
Driving behavior evolves over time and cannot be accurately represented using isolated observations. To capture temporal dependencies in vehicle trajectories, the data are converted into sequential samples using a sliding-window mechanism. Consecutive observations are grouped together to form temporal sequences that represent the evolution of vehicle motion over a short period.
2.5. Applied Classifiers
Various traditional machine learning (ML) classifiers and deep learning (DL) models are employed to classify traffic safety data and evaluate their performance in traffic safety assessment. ML classifiers include boosting-based ensemble methods (CatBoost, LightGBM, and XGBoost), bagging-based ensemble methods (Random Forest and Extra Trees), a single-tree model (Decision Tree), and a Support Vector Machine (SVM). These classifiers are trained using the features to distinguish between safe and unsafe traffic conditions. In addition, sequential deep learning models, namely Simple Recurrent Neural Network (Simple RNN), Long Short-Term Memory (LSTM), and Gated Recurrent Unit (GRU), are applied to capture temporal dependencies in the sequential traffic data.
2.6. Leave-One-Subject-Out Cross-Validation
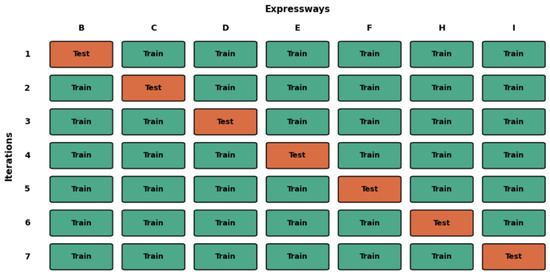
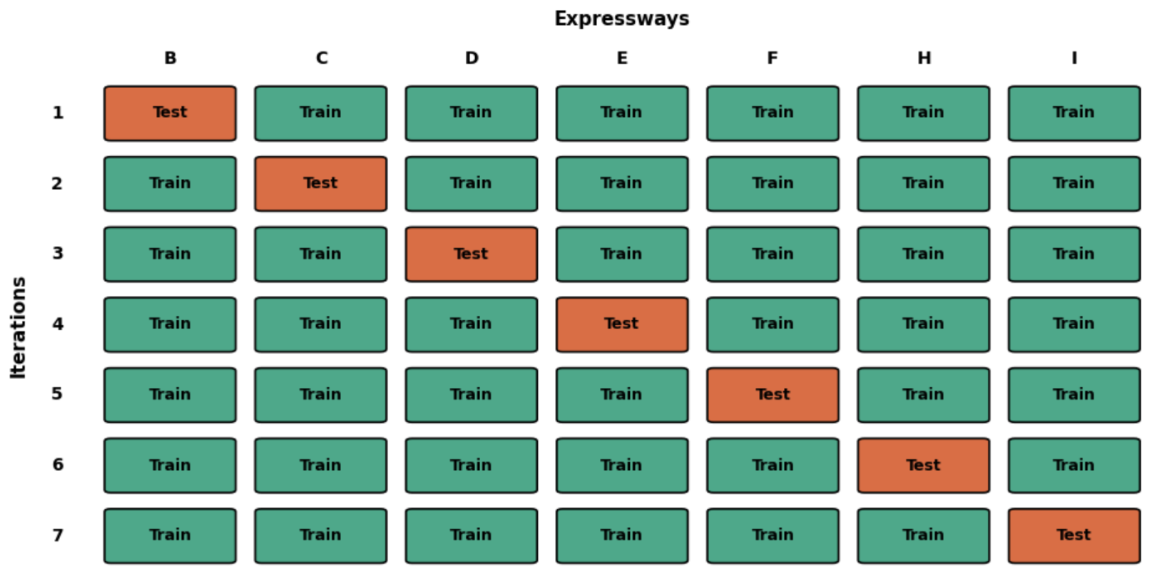
A leave-one-subject-out (LOSO) cross-validation technique is used to assess generalizability across different expressways. Each expressway is used once as the test set, while the remaining expressways are used for training, illustrated in Figure 5. Since there are seven expressways, the process is repeated seven times. Expressway B is used for testing, while the rest are used for training in the first iteration. Expressway C is used next for testing in the second iteration. The process repeats similarly until all expressways have been used once as the test set. The LOSO model is tested on unseen expressway data in each iteration, providing a robust assessment of its generalization capability.
Figure 5.
Illustration of leave-one-subject-out (LOSO) cross-validation strategy across seven expressways.
3. Experimental Settings
The dataset contains no missing values or duplicate records. The input features are normalized with scikit-learn’s StandardScaler, fitted on the training set, and then applied to the test data to prevent leakage. A sliding-window approach is used to construct fine-grained temporal sequences. Window sizes of 15, 30, 45, and 60 timesteps are used to capture temporal dependencies during model training, with a stride of 1, so that consecutive sequences overlap across all timesteps except the last. This overlap is intentionally used to preserve detailed temporal information from continuous vehicle movements and interactions. Although neighboring sequences within the same dataset partition are temporally related, this does not cause temporal leakage between training and testing data. Sequence generation is performed separately for the training and testing sets, and no sequence contains samples from both partitions. The LOSO evaluation strategy reduces the possibility of information leakage by keeping the test expressway completely separate from the training expressways. Therefore, the model is always evaluated on unseen expressway data that are not used during training. For sequence-level classification, each sequence is assigned a target label corresponding to the safety condition based on the TTC value at the final timestep. The Simple RNN model is constructed using a sequential architecture. It consists of a Simple RNN layer with 64 units, followed by a Dropout layer with a rate of 0.3, a Dense layer with 32 units and ReLU activation, a second Dropout layer with a rate of 0.2, and a final output Dense layer with Sigmoid activation. The model is compiled using the Adam optimizer with binary cross-entropy as the loss function. Training is performed for up to 100 epochs with a batch size of 64. A 0.2 validation split is used during training to assess overfitting. Early stopping is applied with a patience of 15 epochs, monitoring the validation loss and automatically restoring the best model weights. A leave-one-subject-out (LOSO) cross-validation scheme is used to evaluate the model. Hyperparameters for both machine learning and deep learning models have been selected empirically based on preliminary experiments. Exhaustive optimization methods such as grid search, random search, or Bayesian optimization have not been employed. For fair comparison, the Simple RNN, LSTM, and GRU models are all evaluated under similar training settings. All experiments are conducted using Python 3.11.5, TensorFlow 2.18.0, and Keras 3.7.0 on Windows 11 Pro. TensorFlow and Keras are used to implement deep learning models. Scikit-learn is used for classical machine learning models. The hardware configuration includes a 13th-generation Intel Core i7-13700H CPU at 2.40 GHz, 32 GB RAM, and an NVIDIA GeForce RTXTM 4060 GPU (CUDA 11.8, cuDNN 8.6). Inference time is recorded for each fold to compare computational efficiency across models. Inference is performed with a batch size of 64 sequences. The Simple RNN achieves a mean per-sequence latency of 0.20–0.40 ms across LOSO folds, and LSTM records 0.32–0.60 ms. GRU records the highest per-sequence latency (0.46–1.59 ms), attributed to its longer sequence length of 60.
4. Results
This study evaluates several machine learning and sequential deep learning models using multiple performance metrics, including precision, recall, F1-score, accuracy, inference time, confusion matrix analysis, and Precision–Recall (PR) curve analysis. Table 2 summarizes the performance of different applied classifiers under the LOSO validation setting on the imbalanced dataset. As the dataset is highly imbalanced, accuracy alone is not a reliable indicator of model performance. A model can achieve high accuracy simply by correctly detecting the majority (safe) class while failing to capture the minority (unsafe) instances. Hence, greater priority is assigned to recall and F1-score, as these metrics better reflect the model’s ability to detect unsafe conditions. CatBoost and LightGBM achieve high accuracy among conventional machine learning models, but their recall remains relatively low at around 71.00%, indicating that a significant proportion of unsafe instances are not detected. Other tree-based models, such as XGBoost, Random Forest, Extra Trees, and Decision Tree, perform even worse on recall, limiting their ability to capture the minority (unsafe) class. SVM behaves differently; it achieves high recall, but at the cost of lower precision, leading to more false alarms. Sequential deep learning models demonstrate superior predictive performance compared with conventional machine learning approaches. LSTM and GRU achieve a good balance between precision and recall, with F1-scores above 98.00%. However, compared to LSTM and GRU, the Simple RNN achieves the highest numerical recall (99.12%) and F1-score (98.48%). Wilcoxon signed-rank test confirms that this difference is not statistically significant relative to LSTM or GRU in terms of precision and F1-score, indicating broadly comparable predictive performance among the three sequential models. Based on these observations, together with its lower inference latency, the Simple RNN is selected as the preferred model, as it maintains a strong balance between detecting unsafe conditions (high recall) and overall prediction reliability (high F1-score) while offering the best computational efficiency for real-time traffic safety applications.
Table 2.
Performance metrics of different classifiers using the LOSO method on imbalanced data.
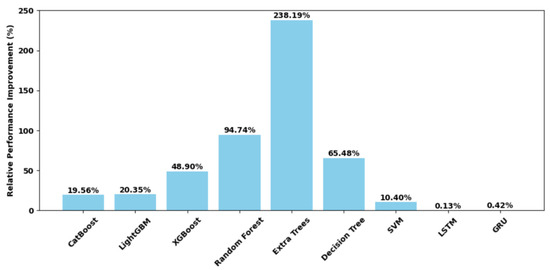
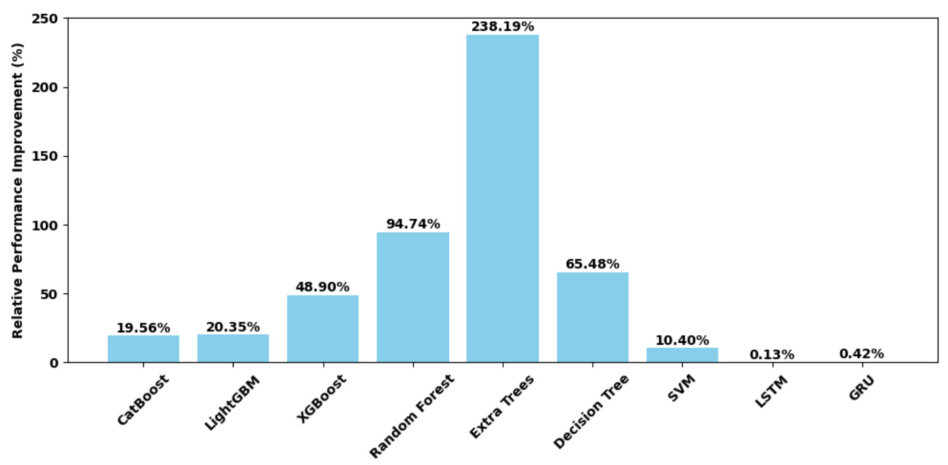
Figure 6 illustrates the relative performance improvement in the Simple RNN model compared to other classifiers in terms of F1-score. For each classifier, the percentage improvement is calculated as follows:
Simple RNN demonstrates substantial performance improvements over traditional machine learning classifiers, with the most significant gains observed against Extra Trees (238.19%), Random Forest (94.74%), and Decision Tree (65.48%). In contrast, the improvement over LSTM and GRU is marginal, with gains of only 0.13% and 0.42% respectively, indicating comparable performance among sequential deep learning models. These results highlight the advantage of capturing temporal dependencies. However, even a marginal improvement can be meaningful in traffic safety applications, where missed detection of unsafe events directly contributes to collision risk.
Figure 6.
Relative performance improvement in Simple RNN compared to other classifiers in terms of F1-score.
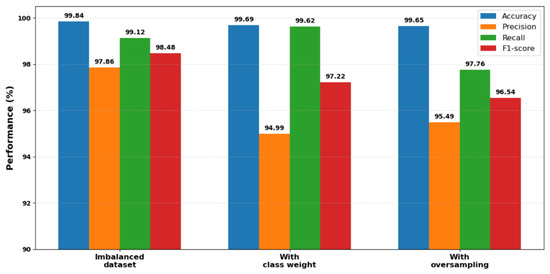
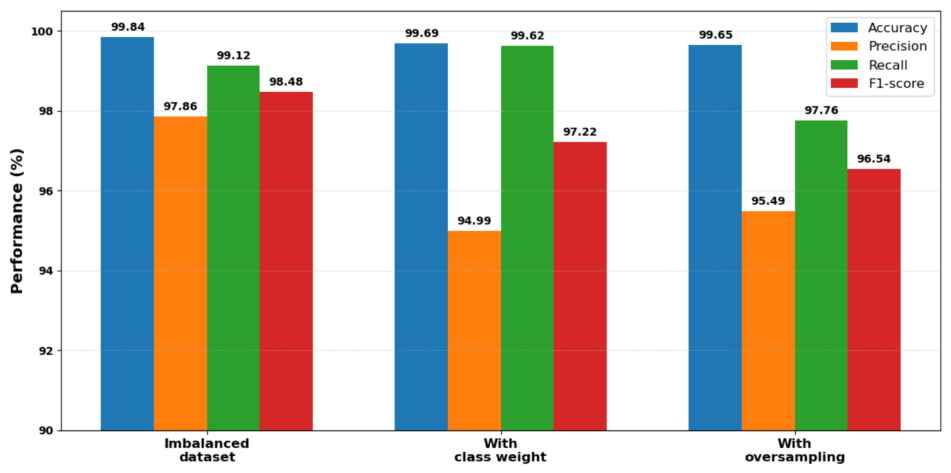
Temporal modeling using the Simple RNN effectively captures the evolution of driving patterns well under class-imbalanced conditions. To demonstrate this capability, the performance of the proposed imbalanced dataset is compared with oversampling and class-weighting strategies using the same Simple RNN architecture. As illustrated in Figure 7, the Simple RNN model trained on the original imbalanced dataset achieves the highest F1-score (98.48%) and precision (97.86%) while maintaining very high recall (99.12%). Applying class weighting slightly increases recall to 99.62%. However, this improvement comes at the expense of lower precision and F1-score. Similarly, oversampling yields a lower F1-score than the original imbalanced training strategy. Unlike oversampling approaches that may distort the original traffic distribution or class weighting methods that may bias optimization toward the minority class, the proposed framework preserves realistic traffic behavior while still achieving excellent unsafe-event detection performance. These findings suggest that the temporal sequence modeling capability of the Simple RNN is sufficient to effectively learn driving patterns directly from naturally imbalanced trajectory data.
Figure 7.
Comparison of Simple RNN performance on the original imbalanced dataset, class-weighting, and oversampling strategies in terms of accuracy, precision, recall, and F1-score.
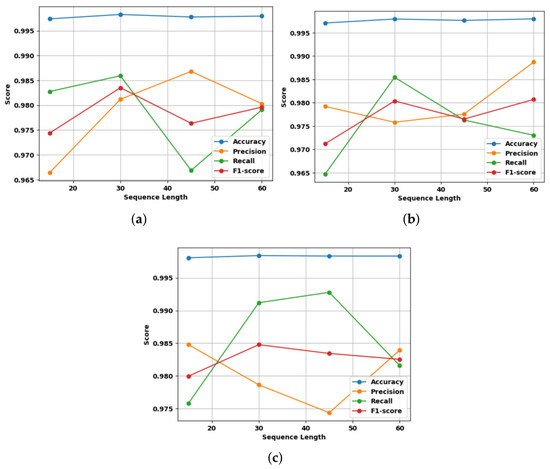
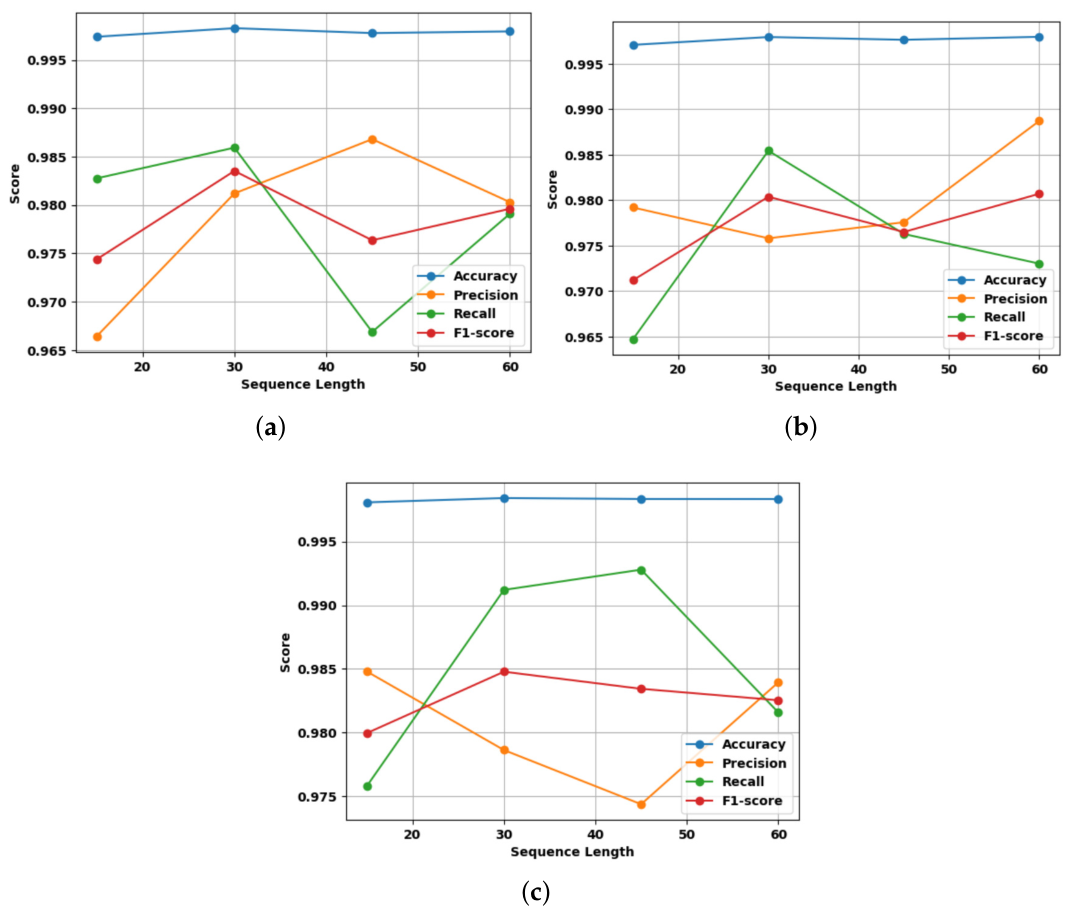
Figure 8 illustrates the average performance of LSTM, GRU, and Simple RNN models for varying sequence lengths across seven expressways under the LOSO validation framework. All models achieve very high performance, with accuracy values consistently above 99.70%. For the LSTM, the best performance is observed at a sequence length of 30, achieving the highest recall and F1-score. GRU shows consistent performance across all sequence lengths, with slight improvements at the longer length of 60, achieving the highest F1-score (98.07%). The Simple RNN performs well, achieving the highest F1-score (98.48%) at a sequence length of 30, indicating that shorter temporal windows are sufficient to capture relevant patterns in this dataset.
Figure 8.
Performance comparison of sequential deep learning models using different sequence lengths (15, 30, 45, and 60). (a) LSTM model performance, (b) GRU model performance, and (c) Simple RNN model performance in terms of precision, recall, F1-score, and accuracy.
Sequential deep learning models, including Simple RNN, LSTM, and GRU, are evaluated under identical settings using different sliding-window sequence lengths of 15, 30, 45, and 60 timesteps. Across all sequence lengths, the Simple RNN consistently achieves higher accuracy and F1-score than both LSTM and GRU, as demonstrated in Table 3. These consistent results indicate that the evaluation results of the Simple RNN are stable and not due to random experimental variation.
Table 3.
Performance comparison of sequential deep learning models across different sequence lengths.
To assess whether the observed differences among the recurrent neural network architectures are statistically significant, a Wilcoxon signed-rank test is performed using the fold-wise LOSO evaluation results. The test compares the performance of paired models across folds without assuming normality. The p-value is the probability of observing the measured difference under the null hypothesis that there is no systematic performance difference between the models being compared. A significance level of is adopted, meaning that differences are considered statistically significant when . The results presented in Table 4 show that no statistically significant differences exist between Simple RNN and LSTM in terms of precision, recall, or F1-score. Similarly, no significant differences are observed between the Simple RNN and the GRU in precision and F1-score. A statistically significant difference is observed only in recall when comparing the Simple RNN and the GRU (). These findings indicate that the recurrent architectures achieve broadly comparable predictive performance. Therefore, the selection of Simple RNN is primarily motivated by its faster inference latency while maintaining competitive predictive performance.
Table 4.
Wilcoxon signed-rank test results for fold-wise LOSO performance comparisons between Simple RNN and other recurrent architectures. Statistical significance is assessed using .
The fold-wise performance of the Simple RNN model is summarized in Table 5. The model maintains consistently high performance across all LOSO folds, achieving recall and F1-score values generally above 97.00%. Accuracy also remains close to 100% for all iterations, demonstrating strong generalization capability under the LOSO setting. Unlike classical models, the simple RNN effectively captures temporal dependencies, leading to improved performance, particularly in recall and overall balance.
Table 5.
Fold-wise LOSO performance of the Simple RNN model.
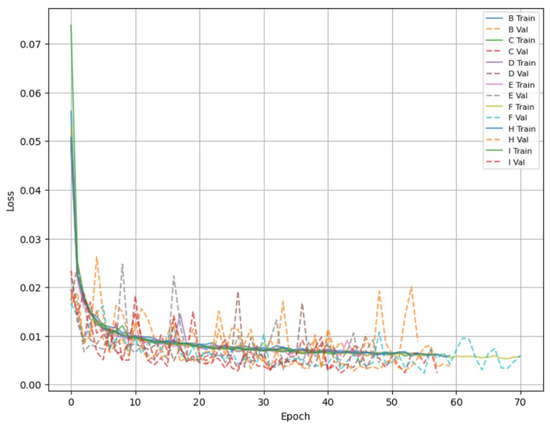
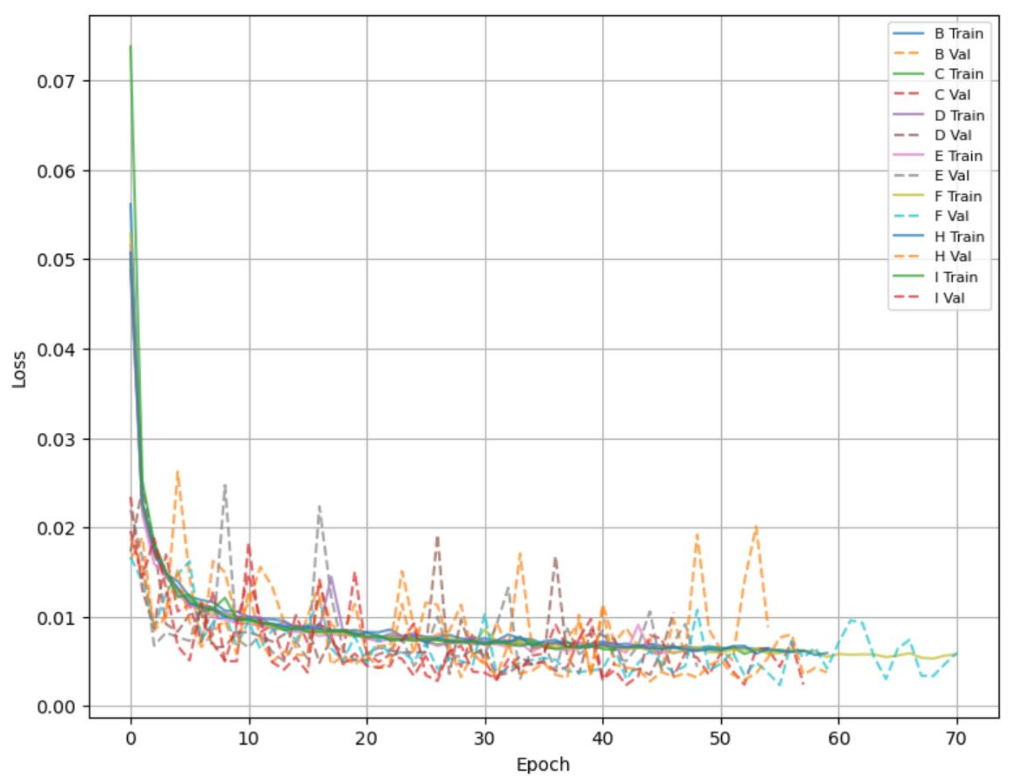
Figure 9 shows the training and validation loss curves of the Simple RNN model for all seven LOSO folds. For each fold, the training data are further divided into training and validation subsets using a 0.2 split to assess generalization. It can be observed that, across all folds, both training and validation losses decrease rapidly in the initial epochs, indicating effective learning of the underlying patterns. As training progresses, the loss curves stabilize and converge to low values, indicating that the model reaches an optimal state without excessive fluctuations. The validation loss closely follows the training loss across all epochs, with only minor variations. There is no significant divergence between the two curves, which suggests that the model does not suffer from overfitting.
Figure 9.
Training and validation loss curves of the Simple RNN model across epochs, indicating stable convergence and minimal overfitting.
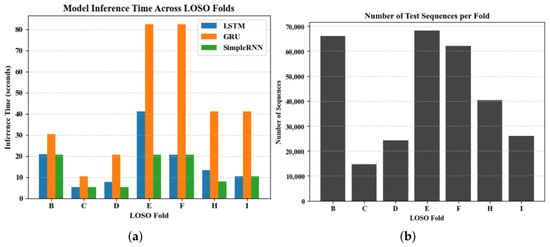
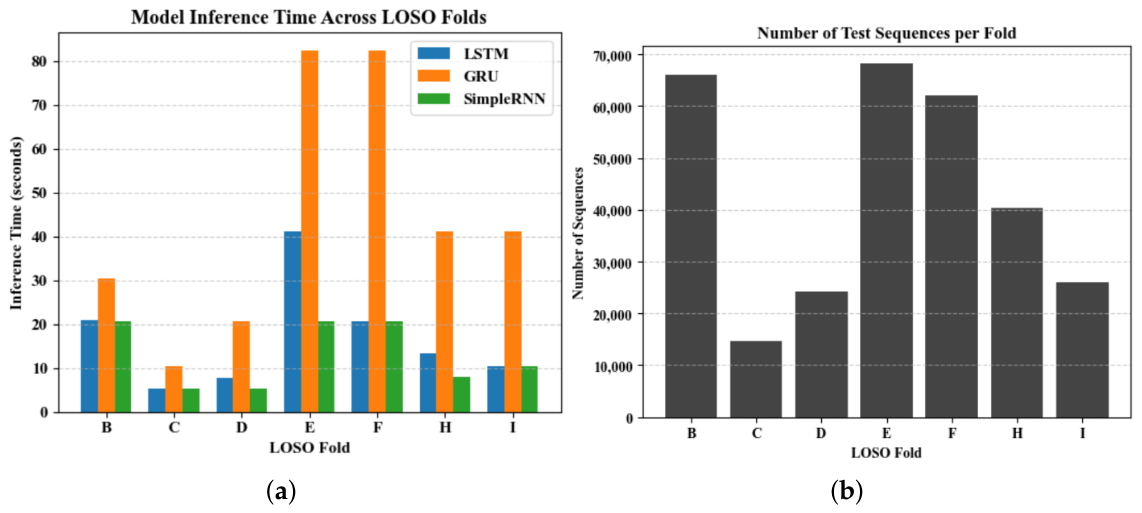
Figure 10 compares the computational efficiency of the sequential deep learning models, namely LSTM, GRU, and Simple RNN, across different sequence lengths under the LOSO evaluation framework. To illustrate the inference time, optimal sequence lengths are considered for each model based on performance. LSTM and Simple RNN use a sequence length of 30, while GRU uses a sequence length of 60, as these window sizes yield the best recall and F1-score shown in Figure 8. As shown in Figure 10a, the inference time varies notably across different models and folds. GRU consistently exhibits the highest inference time, while LSTM and Simple RNN exhibit lower inference times. Among them, the Simple RNN generally achieves the fastest inference time. Figure 10b presents the number of test sequences across different LOSO folds, where a clear imbalance is observed between folds. This variation influences inference time since folds with more sequences require longer processing. Figure 10a reflects the same trend, with higher sequence counts corresponding to increased inference duration.
Figure 10.
(a) Inference time comparison for LSTM, GRU, and Simple RNN models, illustrating their computational efficiency. (b) Distribution of the number of sequences across different LOSO folds, highlighting variations in data availability among expressways.
Table 6 presents the fold-wise inference time, number of test sequences, and mean per-sequence latency of the Simple RNN, LSTM, and GRU models under the LOSO cross-validation framework. The per-sequence latency is computed by dividing the total inference time of each fold by the corresponding number of test sequences.
The results show that the Simple RNN consistently achieves the lowest inference latency (0.20–0.40 ms per sequence), whereas GRU exhibits the highest (0.46–1.59 ms per sequence), demonstrating the computational efficiency of the proposed lightweight Simple RNN framework for real-time traffic safety applications.
Table 6.
Fold-wise inference time, number of test sequences, and mean per-sequence latency for Simple RNN (sequence length 30), LSTM (sequence length 30), and GRU (sequence length 60) under the LOSO cross-validation framework.
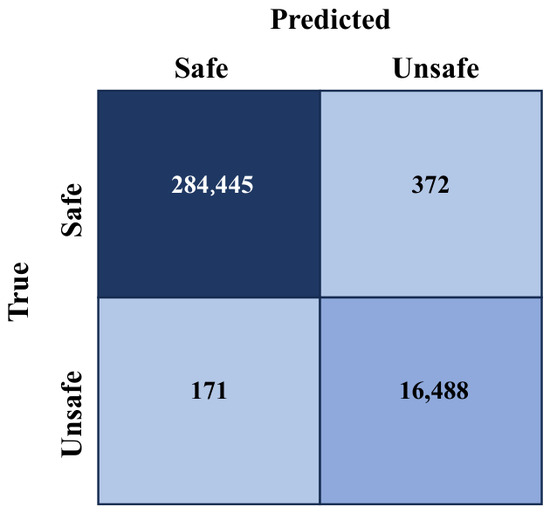
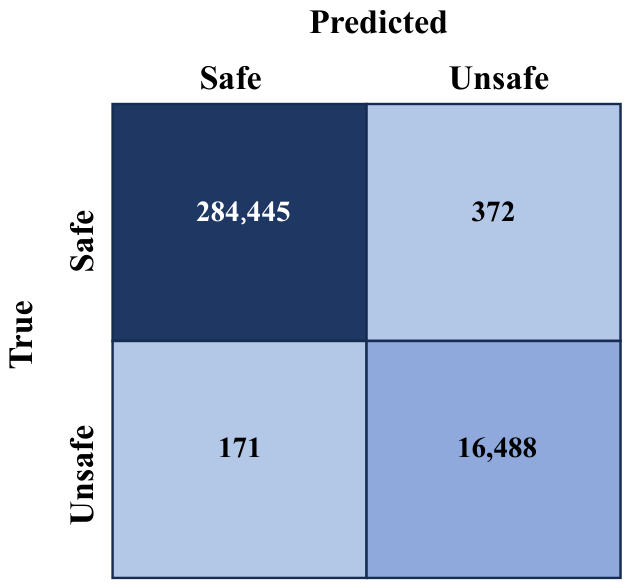
Figure 11 presents a cumulative confusion matrix, which consolidates the results of seven LOSO iterations. This provides an overall evaluation of the performance across all expressways using the Simple RNN model. The model detects the safe class, with 284,445 true negatives and only 372 false positives, achieving a detection rate of 99.87%. For the unsafe class, the model correctly identifies 16,488 true positives, while 171 sequences are misclassified as false negatives, resulting in a detection rate of 98.97%.
Figure 11.
Cumulative confusion matrix of the proposed model showing aggregated classification performance across all folds.
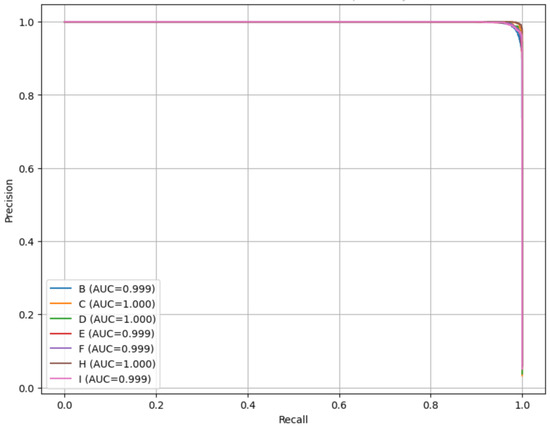
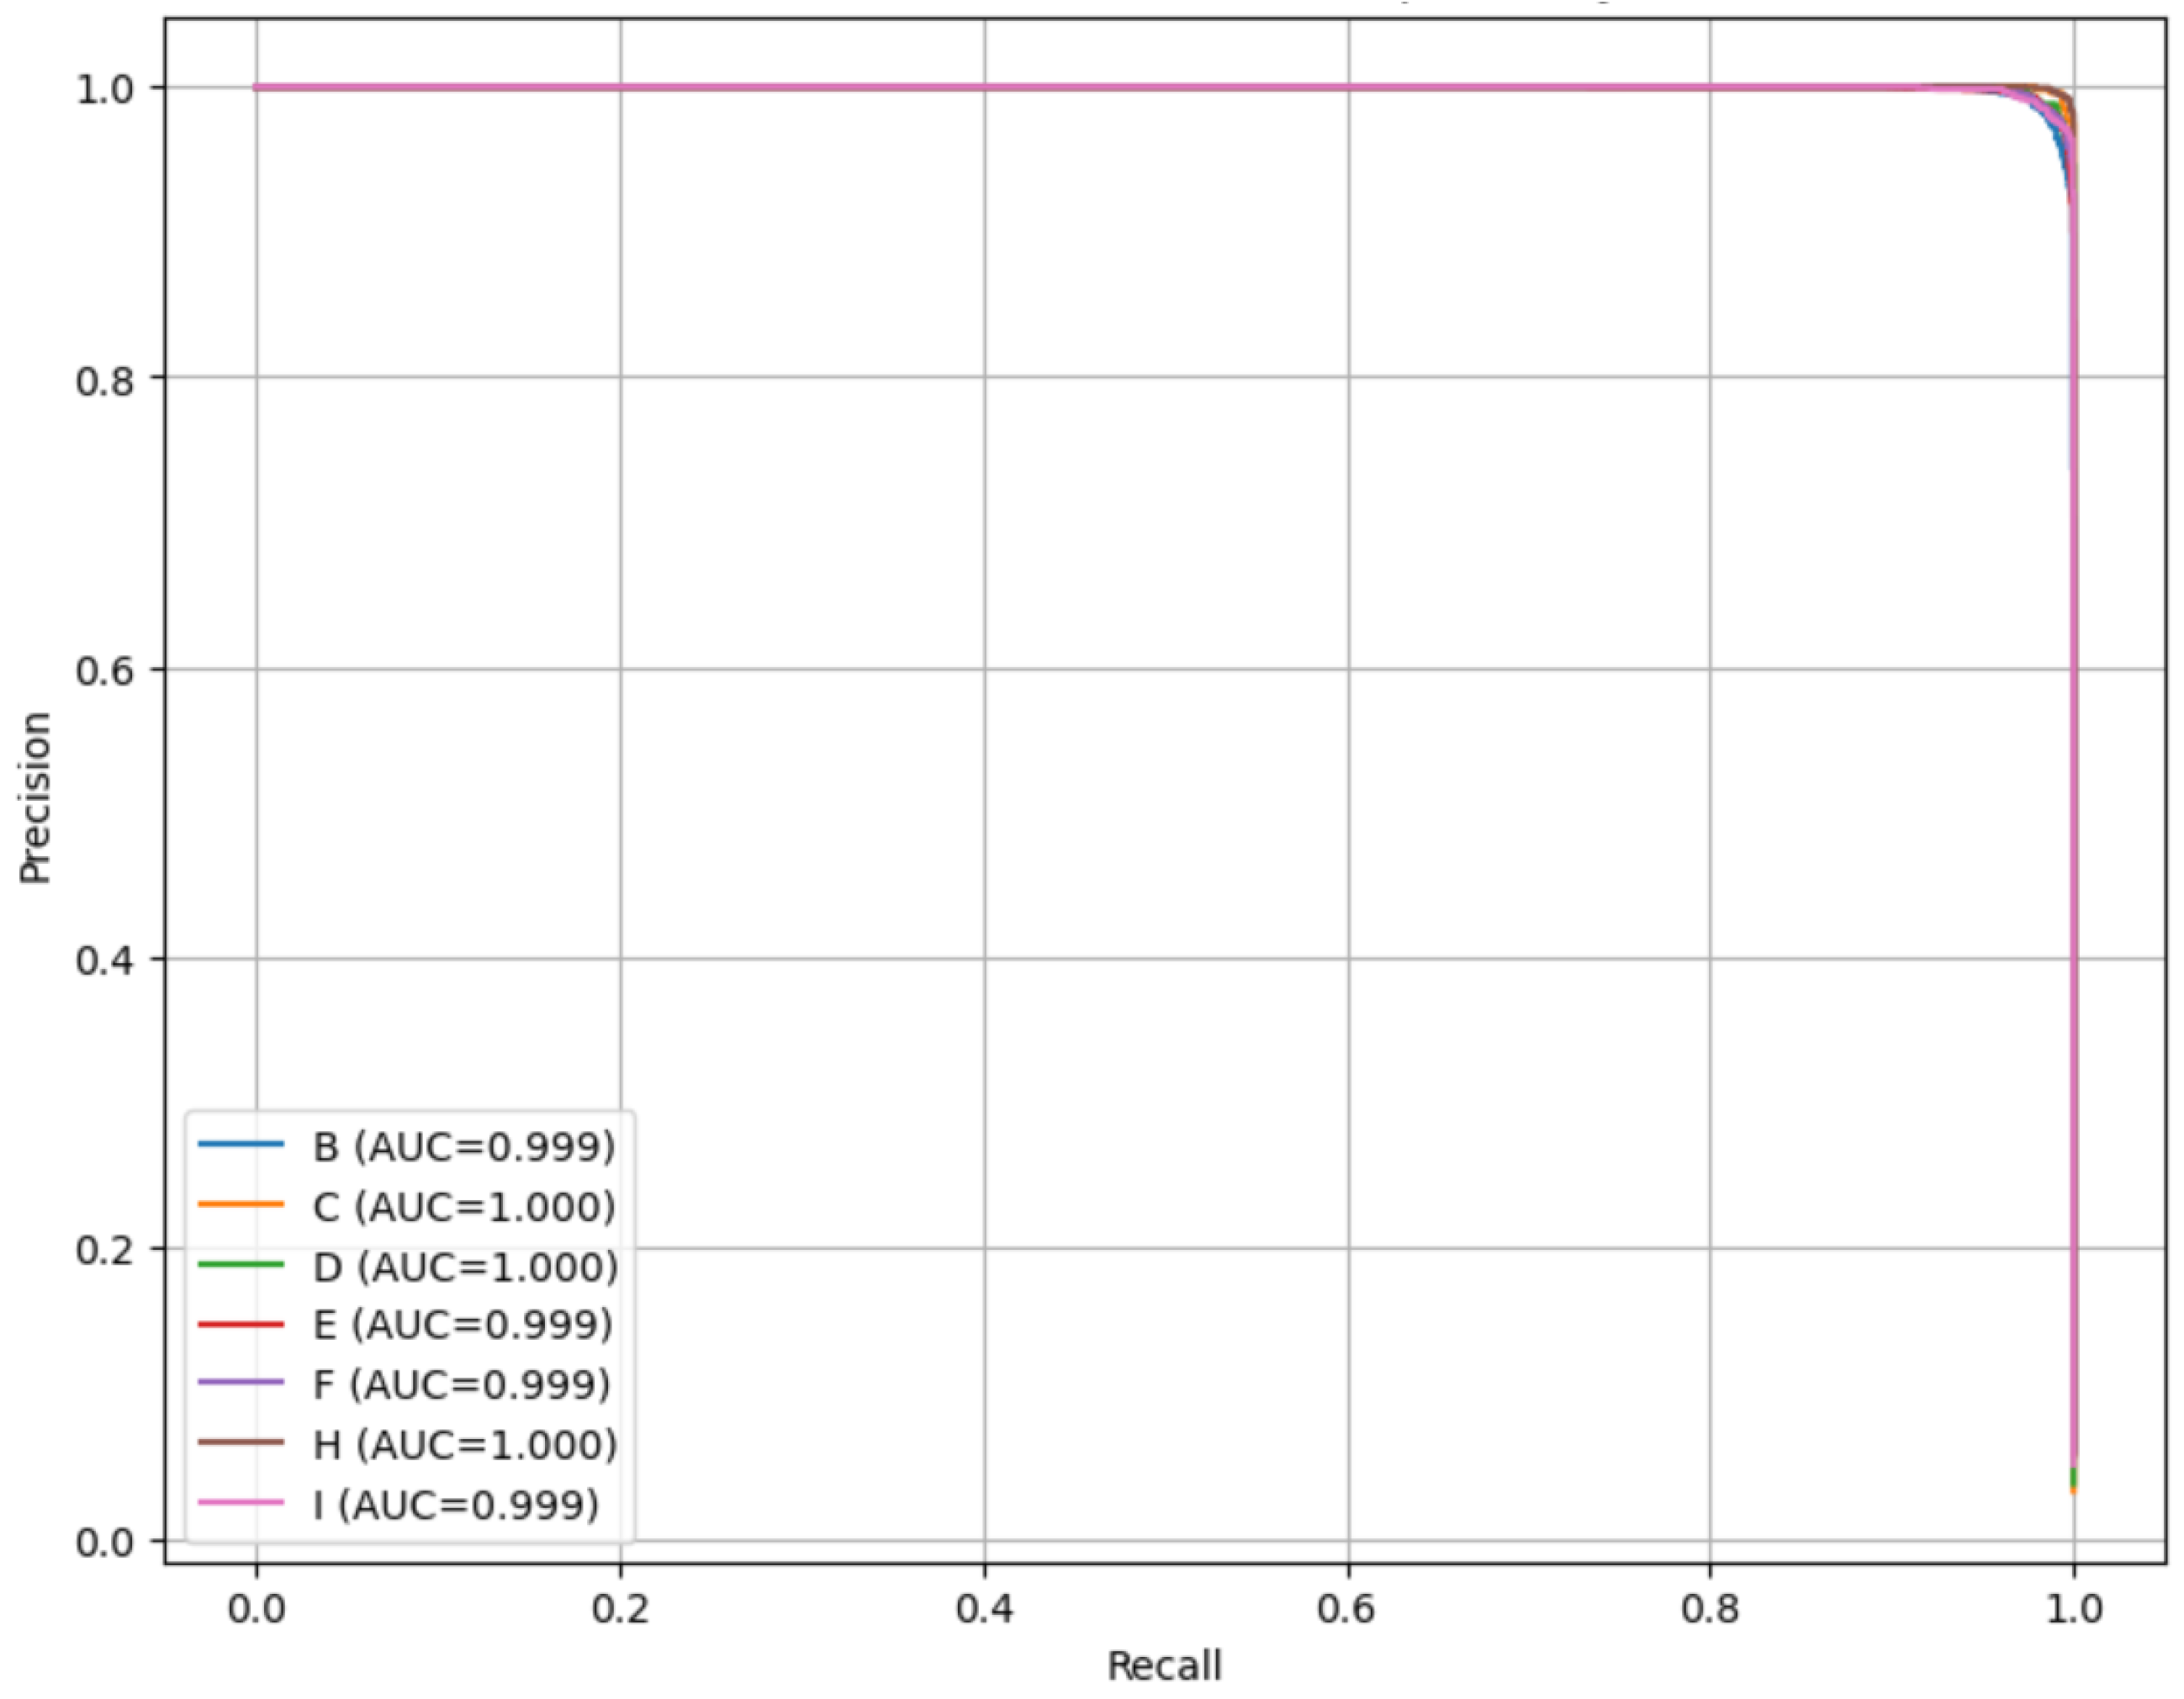
The Precision–Recall (PR) curves for all seven LOSO folds are shown in Figure 12 using the proposed framework on the imbalanced dataset. The curves remain concentrated near the upper-right corner of the plot, with PR-AUC values ranging from 0.999 to 1.000 across all expressways. This indicates that the proposed Simple RNN maintains both extremely high precision and high recall despite the severe class imbalance present in the trajectory dataset. The near-perfect PR-AUC values demonstrate that the proposed temporal sequence modeling framework effectively captures unsafe traffic patterns without requiring oversampling or weighted loss functions. The consistency of the curves across all LOSO folds further confirms that the model generalizes well to unseen expressway environments while preserving strong minority-class detection capability.
Figure 12.
Precision–Recall curves of the proposed Simple RNN framework across all LOSO expressway folds, demonstrating robust minority-class detection performance on the imbalanced dataset.
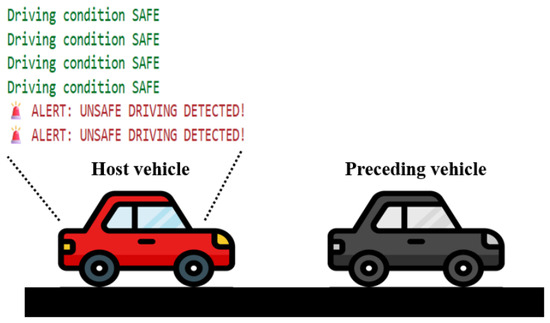
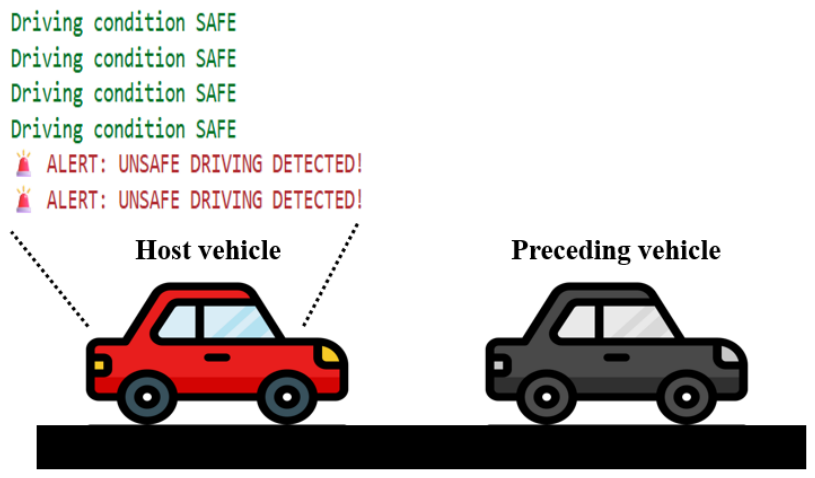
The system warns the driver of the host vehicle, as shown in Figure 13. The system continuously monitors driving conditions and detects them as safe or unsafe. If the system detects an unsafe driving condition, it automatically triggers an alert message. This illustrates the model’s effective applicability for real-time traffic safety monitoring.
Figure 13.
Output of the host vehicle driver alert system showing dynamic driving-condition monitoring with alternating safe- and unsafe-driving status notifications.
Interpretability of the Simple RNN Model
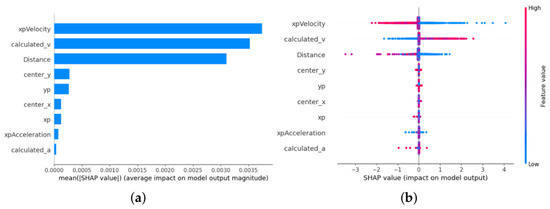
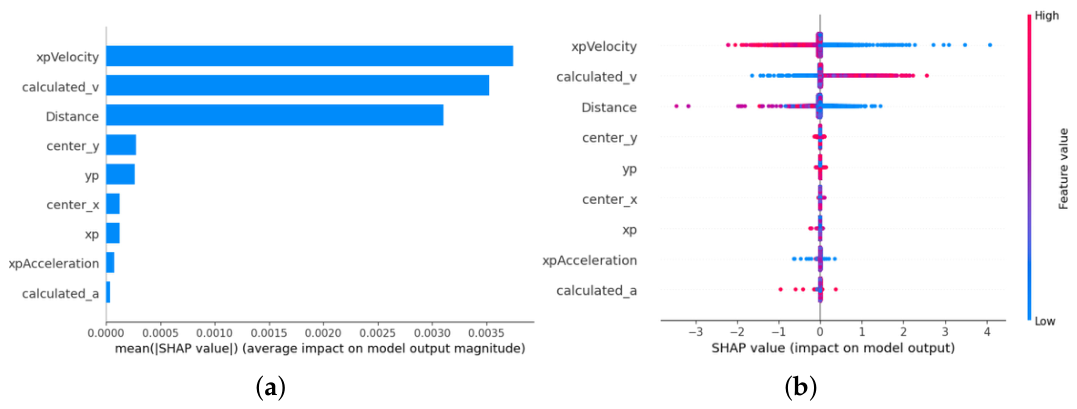
Explainable AI (XAI)-based SHAP (SHapley Additive exPlanations) is employed to interpret the Simple RNN model by quantifying the contribution of each feature to the model’s predictions. It provides insight into how each feature influences the prediction of safe and unsafe driving conditions. Figure 14a highlights the overall importance of each feature, ranking them by their average impact. The results indicate that the velocities of the preceding and host vehicles, as well as the distance between them, are the most influential features in determining the model output. Figure 14b shows that both high and low values of these features affect the prediction differently. Positive SHAP values indicate that the feature pushes the prediction toward unsafe or risky driving, whereas negative SHAP values indicate the opposite.
Figure 14.
(a) Mean absolute SHAP values ranking the relative importance of input features. (b) SHAP summary plot showing how high (red) and low (blue) feature values influence predictions.
5. Discussion
5.1. Analysis of Evaluation Results
This research provides a traffic safety assessment framework that uses a Simple RNN model and compares the performance of various machine learning and deep learning models for rear-end potential conflict detection. Among all machine learning models, SVM achieves the best trade-off, with a recall of 97.24% and an F1-score of 89.20%. Deep learning models outperform machine learning models. LSTM, GRU, and Simple RNN all achieve an F1-score above 98.00%. The Simple RNN model performs slightly better with an F1-score of 98.48% at sequence length 30, as shown in Table 2, with the fastest inference time, presented in Table 6. The results show that a lightweight Simple RNN model consistently achieves a good performance comparable to that of the gated recurrent networks while requiring lower inference time. This indicates that the discriminative patterns in the data are primarily short-horizon and can be effectively captured within sliding temporal windows, without the need for complex memory-gating mechanisms, particularly when spatiotemporal features are explicitly engineered. The detection accuracy of the proposed framework is validated through five mechanisms: (1) LOSO cross-validation across seven expressways, ensuring no data leakage between training and testing sets; (2) fold-wise metrics of Simple RNN reported in Table 5, showing consistent recall above 97.00% across all folds; (3) a cumulative confusion matrix (Figure 11) aggregating all 301,476 sequences, yielding an overall unsafe-class detection rate of 98.97% (16,488 true positives, 171 false negatives); (4) Precision–Recall curve analysis (Figure 12), which produces PR-AUC values ranging from 0.999 to 1.000 across all seven LOSO folds, indicating consistently high precision and recall; and (5) a multi-sequence-length evaluation across four temporal window sizes (15, 30, 45, and 60 timesteps), reported in Table 3, which demonstrates that the Simple RNN yields consistently good performance comparable to that of LSTM and GRU, as further supported by the statistical analysis in Table 4.
5.2. Limitations
Even after demonstrating promising performance, our proposed framework faces several limitations. The current study uses trajectory data from seven expressway scenarios in the WUT-NGSIM dataset. A leave-one-subject-out (LOSO) validation strategy is employed to improve robustness across the seven expressway scenarios, enabling evaluation on unseen driving subjects and reducing subject-specific bias. However, the framework has not yet been validated using completely independent external datasets collected under different traffic and sensing conditions. In addition, the experiments focus on expressway traffic scenarios. Therefore, the proposed framework has not been evaluated in urban intersections, mixed-traffic environments, or heterogeneous roadway networks. Furthermore, the conflict identification process relies on TTC-based surrogate safety measures, which assume constant velocity and a single preceding vehicle interaction. TTC may not fully capture complex driving maneuvers, driver intention, or rapidly changing traffic dynamics. The use of fixed TTC thresholds may also limit adaptability across varying traffic densities and environmental conditions. Although the 4 s TTC threshold is selected based on prior literature and its suitability for proactive conflict detection, no sensitivity analysis is conducted across alternative TTC thresholds in the present study. Moreover, this study focuses on recurrent neural network architectures and does not evaluate transformer-based temporal models, which may capture temporal dependencies more effectively. Future work will focus on evaluating the framework across multiple external datasets and roadway environments, incorporating adaptive or context-aware conflict thresholds, and investigating transferability across diverse traffic scenarios. Future studies will also examine transformer-based architectures and multimodal traffic sensing to improve robustness for real-world ITS deployments.
5.3. Real-World ITS Integration
The real-time deployment of the proposed method involves several considerations, including standalone implementation and potential integration with the ITS infrastructure to further enhance its scope. The proposed framework requires basic sensing hardware, such as a lidar or depth camera, to measure the relative state of the preceding vehicle, a capability currently used in widely adopted adaptive cruise control (ACC) or emerging automated driving systems, and usually with very low latency in the order of a few milliseconds. However, although the model inference latency is sub-millisecond (0.20–0.40 ms per sequence), the total end-to-end system latency, including sensor sensing, data preprocessing, model inference, and vehicle control actuation delays or warnings, requires further investigation through hardware-in-the-loop and real-world deployment studies, which are kept out of the scope of this study. For a human driver, the proposed system can serve as a driving assistant for collision avoidance, with an acceptable human interface that can promptly deliver warnings. To ensure the acceptability of such a warning system, it needs to be adaptive to users’ skills, fitness, or driving behavior by tuning parameters or safety thresholds, a possibility that warrants further investigation. The proposed conflict detection framework can also serve as a proactive input to Adaptive Cruise Control (ACC) systems, in addition to passive driver warnings. When the model predicts an unsafe condition, it may support adaptive speed regulation or following-distance adjustment before the situation becomes critical. With emerging vehicular communication and roadside units within the Intelligent Transportation System (ITS) infrastructure, the proposed model can predict conflicts more precisely and communicate to help avoid multiple-vehicle collisions and to support network-level traffic safety monitoring.
6. Conclusions
This study develops a rear-end conflict detection framework using high-resolution vehicle trajectory data collected on expressways. The Simple RNN achieves an F1-score of 98.48%, outperforming the evaluated machine learning models while maintaining predictive performance comparable to that of LSTM and GRU. In addition, it achieves the lowest inference latency (0.20–0.40 ms) among the evaluated recurrent architectures, making it well-suited for real-time rear-end conflict detection. The proposed framework effectively handles class imbalance by leveraging temporal learning. SHAP analysis confirms that the model primarily relies on physically meaningful traffic interaction features, particularly vehicle speed and inter-vehicle distance, which are directly related to collision risk estimation. This consistency with established traffic safety theory enhances confidence in the model’s decision-making. Overall, the findings indicate that a lightweight temporal deep learning model, Simple RNN, provides precise, interpretable, and computationally efficient solutions for proactive rear-end conflict detection, with potential applications in intelligent transportation systems.
Author Contributions
Conceptualization, N.T. and M.A.S.K.; methodology, N.T.; software, N.T.; validation, N.T.; formal analysis, N.T. and M.A.S.K.; investigation, N.T.; resources, N.T.; data curation, N.T.; writing—original draft preparation, N.T.; writing—review and editing, M.A.S.K., A.S.M.B. and K.Y.; visualization, N.T.; supervision, M.A.S.K., A.S.M.B. and K.Y.; project administration, N.T. and M.A.S.K. All authors have read and agreed to the published version of the manuscript.
Funding
This research is partly supported by the Japan Society for the Promotion of Science (JSPS) Grants-in-Aid for Scientific Research (C) 26K07547.
Institutional Review Board Statement
Not applicable.
Informed Consent Statement
Not applicable.
Data Availability Statement
The dataset used during the current study is publicly available on IEEE DataPort: https://ieee-dataport.org/documents/wut-ngsim-high-precision-and-trustworthy-vehicle-trajectory-dataset (accessed on 26 August 2024).
Conflicts of Interest
The authors declare no conflicts of interest.
References
- World Health Organization. Road Traffic Injuries. 2023. Available online: https://www.who.int/news-room/fact-sheets/detail/road-traffic-injuries (accessed on 27 March 2026).
- National Highway Traffic Safety Administration. Traffic Safety Facts 2020: A Compilation of Motor Vehicle Crash Data; National Highway Traffic Safety Administration: Washington, DC, USA, 2022.
- Michelaraki, E.; Katrakazas, C.; Kaiser, S.; Brijs, T.; Yannis, G. Real-time monitoring of driver distraction: State-of-the-art and future insights. Accid. Anal. Prev. 2023, 192, 107241. [Google Scholar] [CrossRef] [Scilit] [PubMed]
- Anis, M.; Li, S.; Geedipally, S.R.; Zhou, Y.; Lord, D. Real-time risk estimation for active road safety: Leveraging Waymo AV sensor data with hierarchical Bayesian extreme value models. Accid. Anal. Prev. 2025, 211, 107880. [Google Scholar] [CrossRef] [Scilit] [PubMed]
- Huang, S.; Chen, H.; Wen, X.; Zhang, H. Predicting highway risk event with trajectory data: A joint approach of traffic flow and vehicle kinematics. Electronics 2024, 13, 625. [Google Scholar] [CrossRef] [Scilit]
- Kamel, A.; Sayed, T.; Kamel, M. Real-time combined safety-mobility assessment using self-driving vehicles collected data. Accid. Anal. Prev. 2024, 199, 107513. [Google Scholar] [CrossRef] [Scilit] [PubMed]
- Bai, Y.; Meng, W.; Gong, Y.; Li, Y.; Gong, L. Advanced Real-time Highway Risk Early Warning System Integrating Comprehensive Weighting Techniques. Int. J. Intell. Transp. Syst. Res. 2025, 23, 1145–1162. [Google Scholar] [CrossRef] [Scilit]
- Flannagan, C.; LeBlanc, D.; Bogard, S.; Nobukawa, K.; Narayanaswamy, P.; Leslie, A.; Kiefer, R.; Marchione, M.; Beck, C.; Lobes, K. Large-Scale Field Test of Forward Collision Alert and Lane Departure Warning Systems; National Highway Traffic Safety Administration: Washington, DC, USA, 2016.
- Yasmin, S.; Eluru, N.; Wang, L.; Abdel-Aty, M.A. A joint framework for static and real-time crash risk analysis. Anal. Methods Accid. Res. 2018, 18, 45–56. [Google Scholar] [CrossRef] [Scilit]
- Chia, W.M.D.; Keoh, S.L.; Michala, A.L.; Goh, C. Real-time recursive risk assessment framework for autonomous vehicle operations. In Proceedings of the 2021 IEEE 93rd Vehicular Technology Conference (VTC2021-Spring), Helsinki, Finland, 25–28 April 2021; pp. 1–7. [Google Scholar]
- Mahmud, S.S.; Ferreira, L.; Hoque, M.S.; Tavassoli, A. Micro-simulation modelling for traffic safety: A review and potential application to heterogeneous traffic environment. IATSS Res. 2019, 43, 27–36. [Google Scholar] [CrossRef] [Scilit]
- Sultan, B.; McDonald, M. Assessing the safety benefit of automatic collision avoidance systems (during emergency braking situations). In Proceedings of the 18th International Technical Conference on the Enhanced Safety of Vehicle, (DOT HS 809 543), Nagoya, Japan, 19–22 May 2003. [Google Scholar]
- Hu, Y.; Li, Y.; Huang, H.; Lee, J.; Yuan, C.; Zou, G. A high-resolution trajectory data driven method for real-time evaluation of traffic safety. Accid. Anal. Prev. 2022, 165, 106503. [Google Scholar] [CrossRef] [Scilit] [PubMed]
- Tarko, A.P.; Lizarazo, C.G. Validity of failure-caused traffic conflicts as surrogates of rear-end collisions in naturalistic driving studies. Accid. Anal. Prev. 2021, 149, 105863. [Google Scholar] [PubMed]
- Arun, A.; Haque, M.M.; Bhaskar, A.; Washington, S.; Sayed, T. A systematic mapping review of surrogate safety assessment using traffic conflict techniques. Accid. Anal. Prev. 2021, 153, 106016. [Google Scholar] [CrossRef] [Scilit] [PubMed]
- Yu, R.; Han, L.; Zhang, H. Trajectory data based freeway high-risk events prediction and its influencing factors analyses. Accid. Anal. Prev. 2021, 154, 106085. [Google Scholar] [CrossRef] [Scilit] [PubMed]
- Hayward, J.C. Near Miss Determination Through Use of a Scale of Danger; Pennsylvania State University: University Park, PA, USA, 1972. [Google Scholar]
- Parsa, A.B.; Movahedi, A.; Taghipour, H.; Derrible, S.; Mohammadian, A.K. Toward safer highways, application of XGBoost and SHAP for real-time accident detection and feature analysis. Accid. Anal. Prev. 2020, 136, 105405. [Google Scholar] [CrossRef] [Scilit] [PubMed]
- Vijayan, D.; Saad, M.; Khedr, A.M. Bayesian Optimized Enhanced Ensemble Multi-Layer Perceptron for Rear-End Collision Prediction in IoV. IEEE Access 2024, 12, 193693–193706. [Google Scholar] [CrossRef] [Scilit]
- Dong, Y.; Zhang, L.; Farah, H.; Zgonnikov, A.; van Arem, B. Data-driven semi-supervised machine learning with safety indicators for abnormal driving behavior detection. Transp. Res. Rec. 2025, 2679, 319–334. [Google Scholar]
- Roy, S.; Hasan, S. Advance real-time detection of traffic incidents in highways using vehicle trajectory data. Data Sci. Transp. 2026, 8, 6. [Google Scholar] [CrossRef] [Scilit]
- Cai, Q.; Abdel-Aty, M.; Yuan, J.; Lee, J.; Wu, Y. Real-time crash prediction on expressways using deep generative models. Transp. Res. Part C Emerg. Technol. 2020, 117, 102697. [Google Scholar] [CrossRef] [Scilit]
- Li, H.; Chen, L. Traffic accident risk prediction based on deep learning and spatiotemporal features of vehicle trajectories. PLoS ONE 2025, 20, e0320656. [Google Scholar] [CrossRef] [Scilit] [PubMed]
- Zhao, J.; Yang, W.; Zhu, F. A CNN-LSTM-attention model for near-crash event identification on mountainous roads. Appl. Sci. 2024, 14, 4934. [Google Scholar] [CrossRef] [Scilit]
- Hema, D.D.; Kumar, K.A. Levenberg–marquardt–lstm based efficient rear-end crash risk prediction system optimization. Int. J. Intell. Transp. Syst. Res. 2022, 20, 132–141. [Google Scholar]
- Wang, T.; Ge, Y.E.; Wang, Y.; Chen, W. A spatio-temporal deep learning approach to simulating conflict risk propagation on freeways with trajectory data. Accid. Anal. Prev. 2024, 195, 107377. [Google Scholar] [CrossRef] [Scilit] [PubMed]
- Ahsan, M.J.; Abdel-Aty, M.; Anik, B.T.H.; Islam, Z. An ensemble time-embedded transformer model for traffic conflict prediction at RRFB pedestrian crossings. Transp. Eng. 2025, 20, 100318. [Google Scholar] [CrossRef] [Scilit]
- Ashraf, M.T.; Dey, K. Rear-end collision risk estimation for autonomous vehicles under mixed traffic scenarios using real-world perception data. Transp. A Transp. Sci. 2025; in press. [CrossRef] [Scilit]
- Alnowaiser, K. A Computational Intelligence GNN–LSTM Framework for Spatiotemporal Prediction of Traffic Accident Severity in Smart Cities Using SHAP XAI. Int. J. Comput. Intell. Syst. 2025, 18, 271. [Google Scholar] [CrossRef] [Scilit]
- Zhai, X.; Guo, F.; Sivakumar, A. Toward explainable automatic incident detection: A spatiotemporal self-supervised framework with multi-probing classifiers. J. Intell. Transp. Syst. 2025, 1–20. [Google Scholar] [CrossRef] [Scilit]
- Tahir, H.A.; Alayed, W.; Hassan, W.U.; Haider, A. A novel hybrid XAI solution for autonomous vehicles: Real-time interpretability through LIME–SHAP integration. Sensors 2024, 24, 6776. [Google Scholar] [PubMed]
- Li, Y.; Li, H.; Fujiwara, A.; Zhang, J. Real-Time Prediction of Longitudinal Traffic Conflict Risk using Connected Vehicle and Deep Learning Approach. Int. J. Intell. Transp. Syst. Res. 2025, 24, 11–22. [Google Scholar] [CrossRef] [Scilit]
- He, Y.; Cao, B.; Chan, C.Y. WUT-NGSIM: A High-Precision and Trustworthy Vehicle Trajectory Dataset; IEEE DataPort: Piscataway, NJ, USA, 2022. [Google Scholar] [CrossRef]

Disclaimer/Publisher’s Note: The statements, opinions and data contained in all publications are solely those of the individual author(s) and contributor(s) and not of MDPI and/or the editor(s). MDPI and/or the editor(s) disclaim responsibility for any injury to people or property resulting from any ideas, methods, instructions or products referred to in the content. |
© 2026 by the authors. Licensee MDPI, Basel, Switzerland. This article is an open access article distributed under the terms and conditions of the Creative Commons Attribution (CC BY) license.