


Abstract
Climate warming is accelerating permafrost degradation in alpine regions, promoting the development of thaw-related slope deformation through active-layer thickening, ground-ice thaw, and hydro-mechanical weakening. Permafrost degradation margins are particularly sensitive to climatic warming, where enhanced heat transfer and active-layer water migration can accelerate shallow slope instability; however, the underlying mechanisms require further investigation. This study investigates two representative freeze–thaw-related landslides in the western Qilian Mountains: an active-layer detachment developed in degraded discontinuous permafrost and a freeze–thaw-induced shallow creep landslide located near the lower limit of permafrost occurrence. UAV photogrammetry, electrical resistivity tomography, and SBAS InSAR were integrated to characterize geomorphic features, internal frozen ground conditions, and deformation patterns. The active-layer detachment shows strong subsurface heterogeneity, with residual high-resistivity frozen bodies separated by localized thawed zones. Its deformation is mainly concentrated in the upslope detachment zone and central depletion–transport zone, where meadow-mat cracking, turf stripping, and exposed mineral soil coincide with thawed corridors between discontinuous permafrost bodies. In contrast, the freeze–thaw-induced shallow creep landslide exhibits the largest deformation in the upper permafrost-margin sector, where weakly discontinuous permafrost persists, whereas deformation decreases downslope in the seasonally frozen ground sector. This study highlights the critical role of discontinuous permafrost, localized thawing, and active-layer water migration in promoting shallow slope deformation and suggests that permafrost degradation margins may become increasingly susceptible to freeze–thaw-induced landslide activity under continued climate warming.
1. Introduction
Permafrost is extensively distributed across Arctic, alpine, and high-latitude regions, and constitutes a fundamental component of cold-region ecological, hydrological, and geomorphological systems. As a thermally sensitive subsurface layer, permafrost exerts strong control on ground thermal regimes, surface–subsurface hydrological connectivity, and slope stability in cold environments [1,2]. Over recent decades, widespread permafrost degradation, characterized by rising ground temperatures, active-layer thickening, and ground-ice thaw, has been documented across the Northern Hemisphere under a warming climate [3,4]. These changes are particularly pronounced on the Qinghai–Tibet Plateau (QTP), where warming rates exceed the global average [5]. As permafrost thermal stability declines, hillslope systems increasingly respond through thaw-related geomorphic processes, including retrogressive thaw slumps (RTSs), active-layer detachments (ALDs), thermokarst subsidence, and shallow freeze–thaw-induced landslides [6,7,8]. These processes provide key indicators of the coupled thermal, hydrological, and mechanical response of mountain permafrost terrain to climate change [9,10,11].
Permafrost-related slope failures are commonly represented by RTSs and ALDs, which differ markedly in morphology, triggering conditions, and deformation style. RTSs typically develop in ice-rich permafrost terrain and are characterized by a steep headwall, progressive retrogression, exposure and thawing of ground ice, and downslope transport of thawed sediment [12,13]. Accelerated RTS activity has been reported in Arctic and QTP regions, where ground-ice thaw, surface thermal disturbance, and increasing liquid-water input can intensify headwall retreat and sediment evacuation [14,15]. In contrast, ALDs are shallow translational failures involving detachment of the active layer along or near the active-layer–permafrost interface. Their initiation is commonly associated with active-layer deepening, elevated pore-water pressure above the permafrost table, and thaw-induced reduction in soil shear strength [16,17]. ALDs can rapidly alter slope morphology and sediment transport processes while simultaneously disturbing vegetation and organic layers, thereby enhancing thermal degradation of underlying permafrost [9].
However, the bulk of existing studies have focused on typical RTSs and ALDs within continuous permafrost environments, whereas relatively limited attention has been paid to freeze–thaw-induced landslides occurring near the permafrost margin. In alpine discontinuous permafrost regions, progressive permafrost degradation commonly leads to complex subsurface conditions characterized by alternating vestigial frozen bodies and localized taliks. Such degradation not only modifies subsurface thermal and hydrological regimes but also alters groundwater pathways, pore-water pressure distribution, and the mechanical properties of shallow soils [18]. Previous studies have suggested that permafrost margins are particularly sensitive to climatic and surface disturbances because of their relatively low thermal stability, making them hotspots for freeze–thaw-related deformation and slope instability [2,19]. In these environments, in addition to typical RTSs and ALDs, shallow freeze–thaw-induced creep landslides controlled by seasonal freeze–thaw cycles, hydro-mechanical weakening, and residual permafrost may also develop. Nevertheless, their subsurface structures and governing deformation mechanisms remain poorly understood.
Recent advances in remote sensing and geophysical techniques have provided new opportunities for investigating freeze–thaw-related landslides. Electrical resistivity tomography (ERT) has been widely deployed for permafrost investigations because of its sensitivity to temperature, ice content, liquid-water content, pore-water conductivity, and sediment texture [20,21]. Frozen ground generally exhibits higher resistivity than thawed or water-rich materials, making ERT useful for identifying active-layer thickness, residual permafrost bodies, thawed zones, and water-rich layers [22,23]. InSAR, by contrast, provides spatially continuous measurements of surface displacement and has been applied to active-layer freeze–thaw dynamics, thaw subsidence, and slow-moving permafrost-related landslides [24,25,26]. Integrating ERT and InSAR is therefore particularly suitable for permafrost-margin landslides: ERT constrains the internal hydrothermal structure, whereas InSAR identifies the spatial distribution and magnitude of surface deformation. Their combined use allows deformation-prone zones to be interpreted in relation to residual permafrost, localized thawing, and shallow hydrological weakening.
The Qilian Mountains, located on the northeastern margin of the QTP, represent a typical alpine permafrost region highly sensitive to climate change. In recent decades, elevated air temperatures, active-layer deepening, and widespread permafrost degradation have contributed to intensified freeze–thaw-related geomorphic activity in this region [11,19]. Previous studies have mainly focused on the spatial distribution of RTSs and thermokarst landforms and their responses to climate warming, whereas systematic investigations of subsurface structure and deformation characteristics among different types of freeze–thaw-induced landslides have remained limited. In particular, in discontinuous permafrost regions where residual permafrost, taliks, and seasonally frozen ground coexist, complex subsurface structures may strongly influence slope stability and deformation behavior.
In this study, two representative freeze–thaw-related landslides in the Qilian Mountains were investigated:
- (1)
- An active-layer detachment (ALD) developed in degraded discontinuous permafrost;
- (2)
- A freeze–thaw-induced shallow creep landslide located near the permafrost margin.
By integrating UAV surveys, electrical resistivity tomography (ERT), and Sentinel-1 InSAR observations, we systematically analyze the subsurface resistivity structures and surface LOS deformation characteristics of both features. The objectives of this study are to:
- (1)
- Investigate the subsurface structure of the ALD and its control on surface deformation in degraded discontinuous permafrost;
- (2)
- Examine the deformation characteristics of freeze–thaw-induced shallow creep landslides and their relationship with residual permafrost distribution near the permafrost margin;
- (3)
- Explore the coupling relationships among permafrost continuity, localized taliks, and surface kinematics across divergent freeze–thaw-related landslides.
This study provides new insights into the mechanisms of freeze–thaw-induced slope deformation in alpine permafrost-margin environments and contributes to hazard assessment and slope stability evaluation under ongoing permafrost degradation.
2. Study Area and Methods
2.1. Study Area
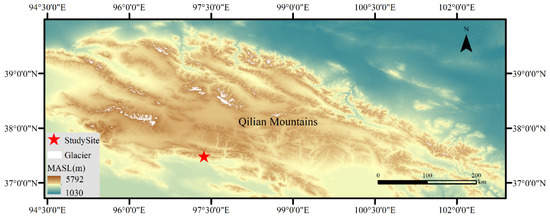
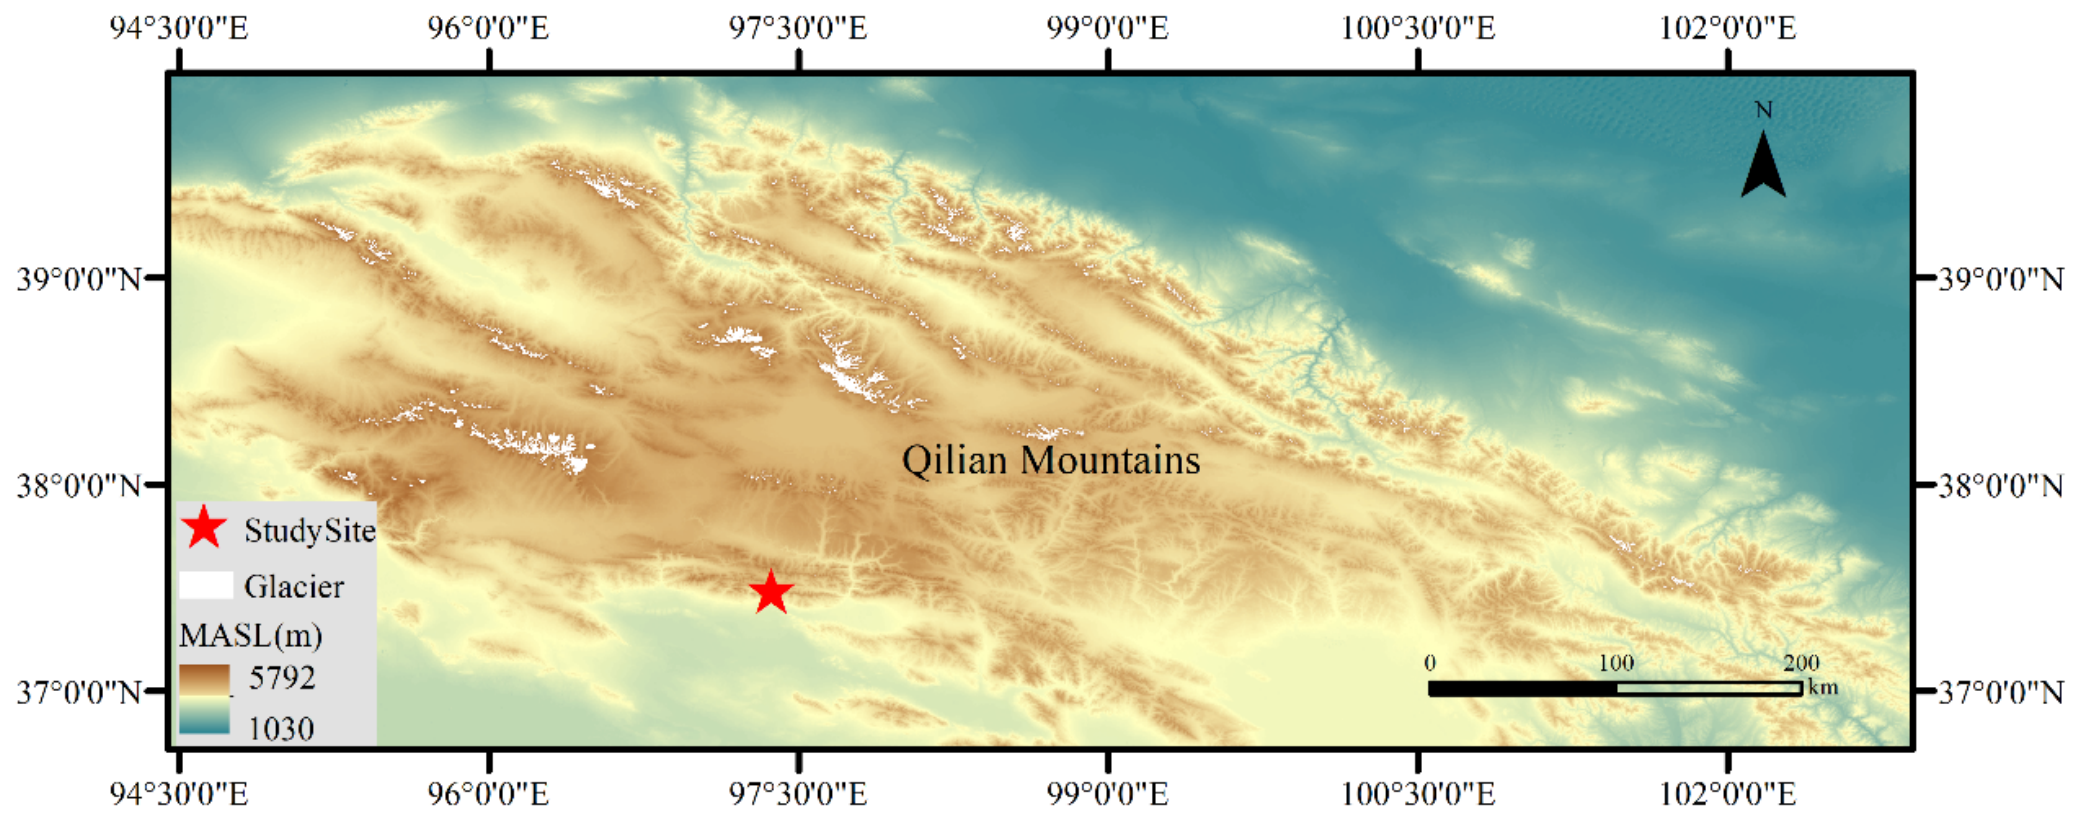
The study area is situated within the southwestern quadrant of Delingha City, Qinghai Province, occupying the transitional ecotone between the northern margin of the western Qilian Mountains and the northern edge of the Qaidam Basin (approximately 37°15′ N, 97°20′ E; Figure 1). This region is positioned along the northeastern margin of the QTP and represents a climatically sensitive permafrost environment highly vulnerable to contemporary climatic warming. The topographic elevation in the study area mainly ranges from 4200 to 4700 m a.s.l. The regional topoclimate is characterized by a hyper-arid alpine continental regime defined by intense solar radiation, pronounced diurnal thermal cycles, sparse vegetation cover, and pervasive freeze–thaw activity. Winters are protracted, frigid, and dry, whereas summers are brief and relatively humid. Annual precipitation is generally less than 200 mm, while potential evaporation is much higher than precipitation. The mean annual air temperature (MAAT) is approximately −3 °C [27]. Permafrost distribution is stringently modulated by altitudinal and topographic gradients, with continuous permafrost restricted to alpine domains, discontinuous and sporadic permafrost developing at intermediate elevations, and seasonally frozen ground dominating lower elevations.
Figure 1.
Study site in the western subrange of the Qilian Mountains, Qinghai Province, China. Notes: Elevation data were downloaded from STER V4 DEM accessed on 23 September 2014 (http://gdex.cr.usgs.gov/gdex).
Two representative freeze–thaw-induced landslides situated along distinct altitudinal zones were selected for detailed investigation. The first site features an ALD slope failure triggered within degraded discontinuous permafrost. This ALD spans an altitudinal range between 3517 and 3750 m a.s.l., with an approximate length of 293 m and an average width of 46.19 m. The slope failure is morphologically characterized by tensile cracking and detachment of the alpine meadow mat in the upslope sector, widespread exposure of grayish mineral soil in the central depletion–transport zone, and downslope displacement of shallow materials. The other site is a freeze–thaw-induced shallow creep landslide located near the lower limit of permafrost occurrence, with an altitudinal range between 3510 and 3640 m a.s.l. Compared with the ALD, this landslide shows weaker surface disturbance and is mainly characterized by shallow creep and downslope accumulation of alpine meadow blocks.
2.2. InSAR Processing
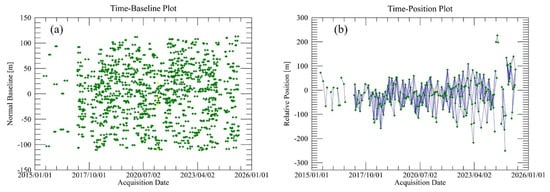
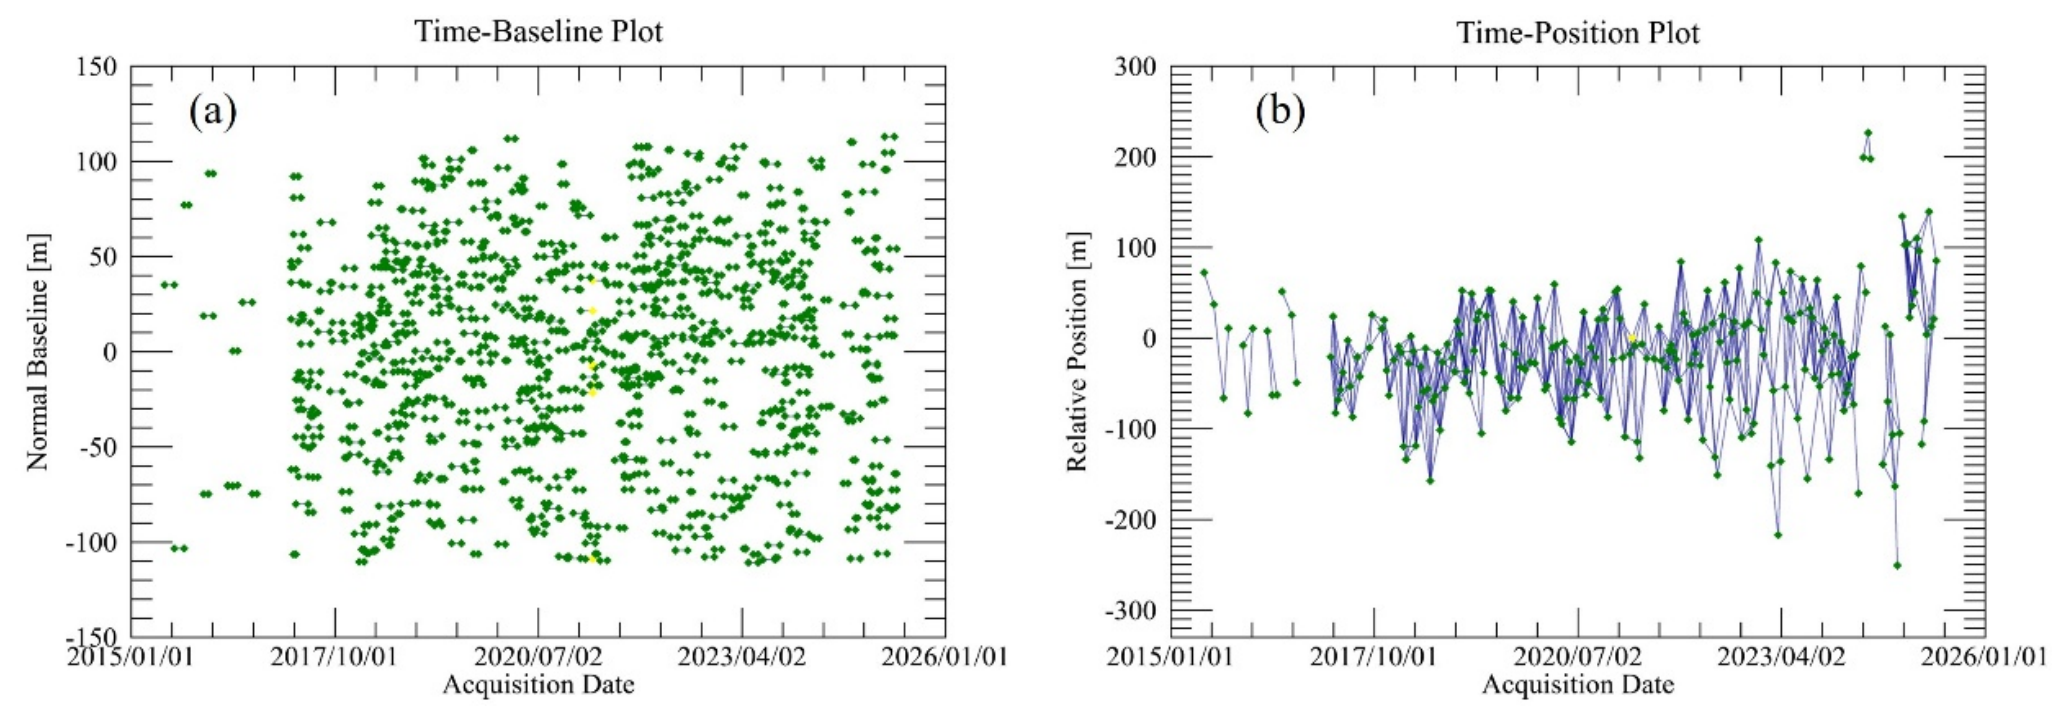
Multi-temporal InSAR provides an effective approach for detecting slow and spatially distributed slope deformation in mountain and permafrost terrain because it offers wide-area coverage, repeated observations, and high sensitivity to subtle surface motion, including in areas that are difficult to access by field surveys [24,25,26]. To characterize the surface kinematic progression of both landforms, Sentinel-1A ascending-track SAR images acquired between June 2015 and May 2025 were processed using a multi-temporal InSAR approach. Considering the strong seasonal freeze–thaw dynamics and vegetation-induced phase decorrelation in the study area, the interferometric pair selection was carefully optimized based on spatial and temporal baseline distributions, as well as interferometric coherence conditions. Following the co-registration of all SAR acquisitions, interferometric pairs with constrained temporal and perpendicular baselines were preferentially selected to minimize spatiotemporal decorrelation. A total of 749 interferometric pairs were generated. The average temporal baseline was 35.74 days, while the average spatial baseline was approximately 47.56 m, with a maximum spatial baseline of 109.80 m (as shown in Figure 2). The Sentinel-1 Interferometric Wide Swath (IW) Single Look Complex (SLC) data exhibit an inherent azimuth-to-range resolution ratio of approximately 4:1. Therefore, multi-looking with a factor of 4 in the range direction was applied to establish uniform spatial resolution and reduce phase noise. Following interferogram generation, flat-earth and topographic phase components were removed using the Shuttle Radar Topography Mission (SRTM) DEM. Goldstein filtering was subsequently applied to enhance the interferometric phase quality, and 2D phase unwrapping was performed using the Minimum Cost Flow algorithm. The generated interferograms, coherence maps, and unwrapped phase images were manually inspected to exclude image pairs affected by low coherence or phase-unwrapping errors. Interferometric pairs with satisfactory coherence and reliable unwrapping results were retained for further processing. Ground control points (GCPs) located in relatively stable areas were manually selected for orbital refinement and phase re-leveling. Finally, a time-series inversion was performed on the corrected unwrapped phases to retrieve the line-of-sight (LOS) velocities of the landslides.
Figure 2.
Connections between the Sentinel-1 SAR acquisitions with the spatial (a) and temporal baselines (b).
2.3. Electrical Resistivity Tomography (ERT) Surveys
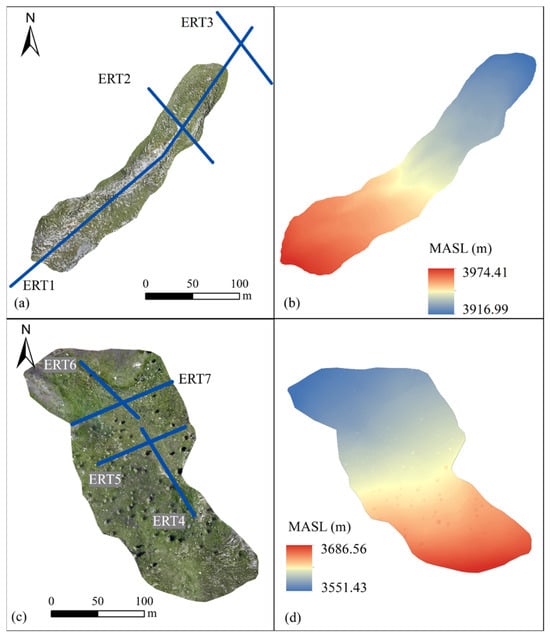
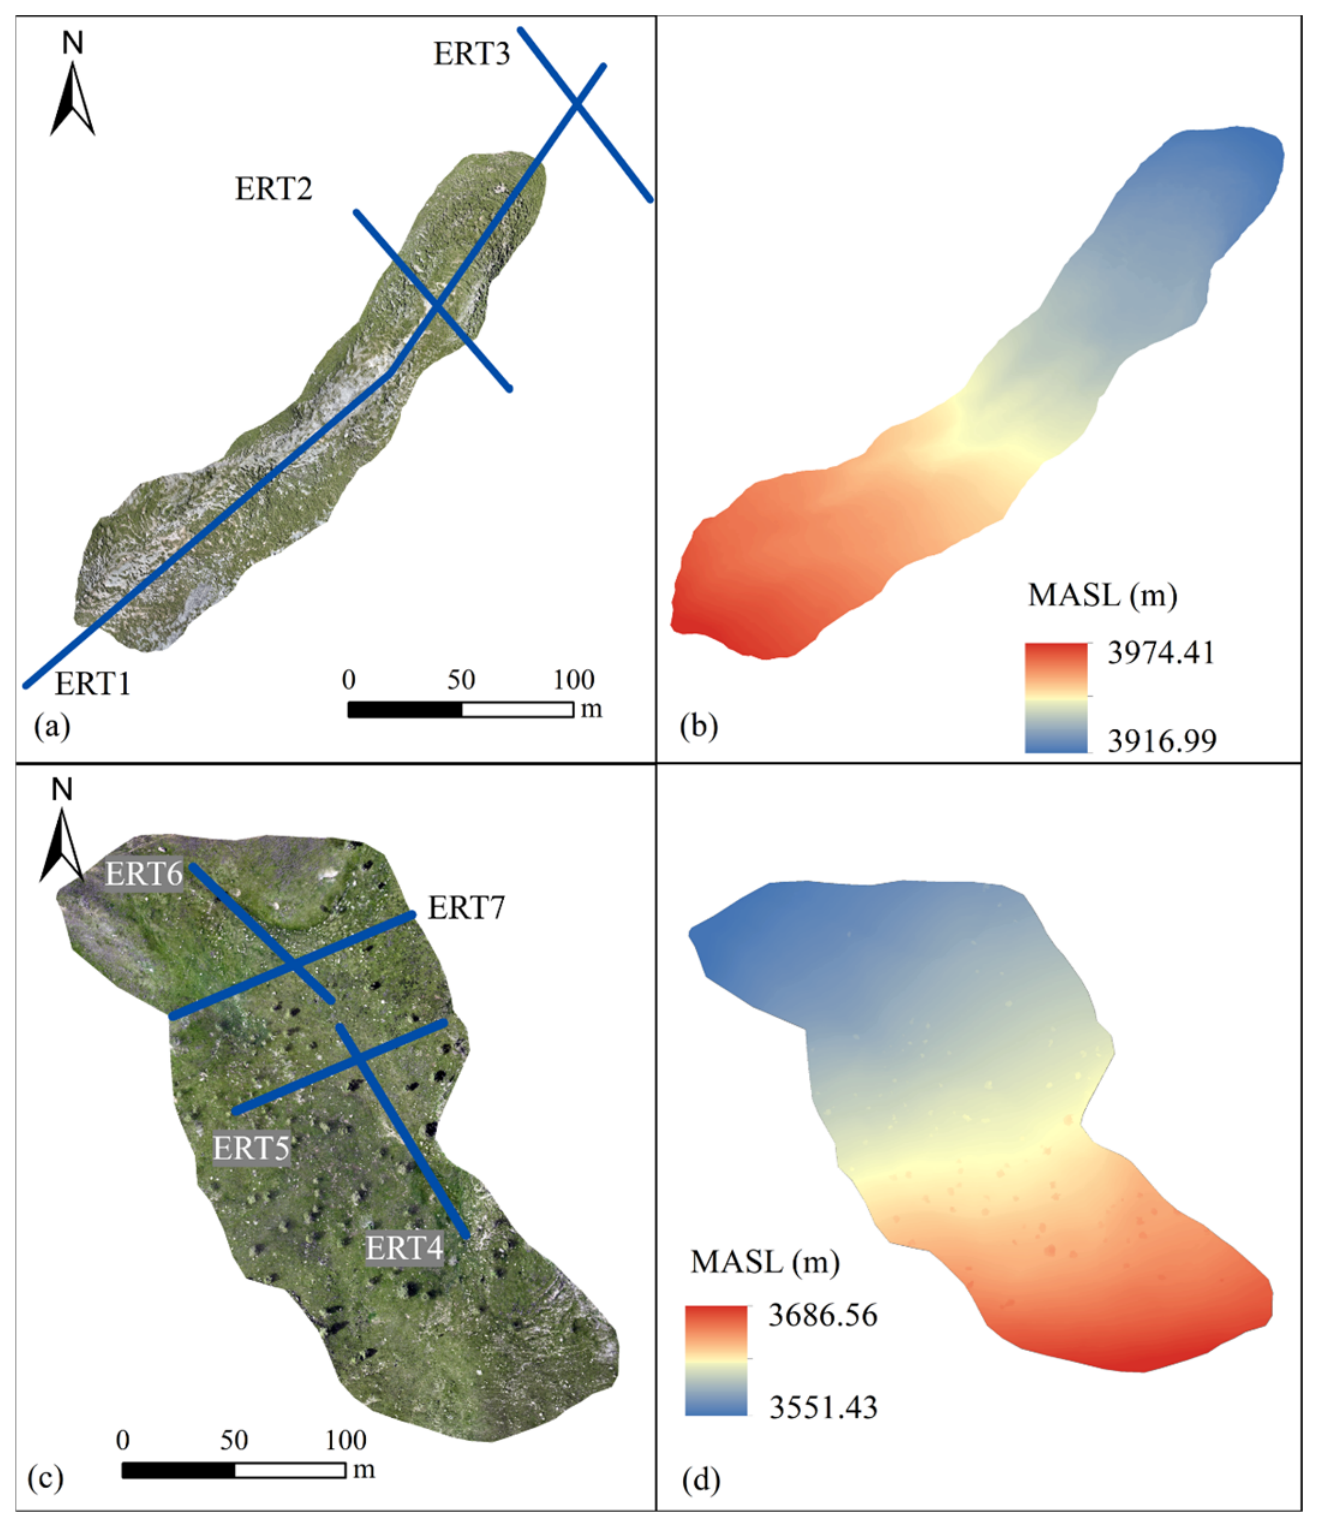
A total of seven ERT profiles were surveyed across both landslides to investigate the subsurface structure and permafrost distribution (as shown in Figure 3). Profiles ERT 1–ERT 3 were arranged across the ALD, comprising one longitudinal profile (ERT 1) extending from the upslope detachment zone to the frontal accumulation zone, and two transverse profiles: one crossing the frontal accumulation lobe (ERT 2) and one outside the frontal margin (ERT 3) of the ALD. Profiles ERT4–ERT7 were conducted across the freeze–thaw-induced shallow creep landslide, including longitudinal and transverse sections spanning the marginal permafrost zone (ERT 4 and ERT 5) and lower-elevation seasonal frost zone (ERT 6 and ERT 7), as shown in Figure 3. All ERT data acquisition campaigns were performed using a SUPERSTING R8 resistivity imaging system (Advanced Geosciences Inc., Austin, TX, USA). A Wenner–Schlumberger electrode array was adopted due to its balanced sensitivity to both vertical stratification and horizontal resistivity gradients. Electrode spacing was set to 2 m, and profile lengths ranged from approximately 100 to 400 m depending on terrain conditions and landslide geometry. Because the alpine meadow surface and coarse surficial debris often compromised electrical coupling, saltwater-soaked sponges were utilized at the electrode contacts to enhance conductivity during field measurements. The surveys were conducted during thaw season (10–15 August 2025) when the active layer was sufficiently developed and the ground surface was free of snow cover. The apparent resistivity data were processed and inverted using the smoothness-constrained optimization algorithm within RES2DINV software (ver.4.8.9). Topographic correction based on differential GPS elevation measurements was incorporated into the inversion process to improve model accuracy. After inversion, the resistivity models were interpreted using both relative spatial contrasts and a locally constrained reference threshold. Preliminary borehole temperature observations (assembled by and calibrated in the State Key Laboratory of Frozen Soils Engineering, Lanzhou, China) and co-located ERT measurements from nearby monitoring sites adjacent to the freeze–thaw-induced shallow creep landslide were used to constrain the resistivity range of frozen or ice-bearing ground under comparable permafrost-margin conditions. This joint borehole ERT calibration indicated that thaw-season resistivity values of approximately 700 Ω m or higher generally correspond to probable frozen or ice-bearing materials, whereas markedly lower values are more consistent with unfrozen, water-rich, or fine-grained materials. Because no borehole was drilled directly along the ERT profiles analyzed in this study, the 700 Ω m value was used only as a local reference threshold. Frozen ground occurrence was therefore inferred from the threshold, together with the lateral continuity and geometry of resistive anomalies, geomorphic setting, elevation, and correspondence with InSAR-derived deformation patterns.
Figure 3.
Surficial geomorphology and geophysical survey layouts: (a) UAV orthomosaic and (b) digital elevation model (DEM) of the active-layer detachment complex; (c) UAV orthomosaic and (d) DEM of the freeze–thaw-induced shallow creep landslide, showing the spatial distribution of the electrical resistivity tomography (ERT) profiles.
Prior applications of two-dimensional ERT and GPR in mountainous and permafrost terrains have demonstrated their efficacy in constraining subsurface lithology, frozen ground distribution, and degraded or sporadic permafrost conditions [28,29,30]. However, bulk subsurface resistivity is governed not solely by thermal state, but by a complex interplay of liquid-water content, ground-ice volume, lithology, porosity, pore-water conductivity, and inversion regularization parameters. To evaluate the fidelity of the inverted resistivity structures, the depth-of-investigation (DOI) index was computed as a model-appraisal metric following established ERT reliability assessment frameworks [31]. The DOI index quantifies the degree to which a reconstructed resistivity model is constrained by measured apparent resistivity data versus initial reference-model assumptions. Lower DOI values signify model cells that are robustly constrained by field data, whereas elevated DOI values identify regions where the inversion scheme is increasingly dominated by regularization constraints, reference models, or diminished data sensitivity. In this study, a DOI threshold of <0.2 was adopted to demarcate reliable model cells; conversely, zones with DOI values exceeding 0.2—particularly within deeper sections and peripheral profile margins—were interpreted with caution. Consequently, the DOI maps were utilized to delimit the reliable interpretation domain and to critically evaluate whether deep-seated conductive anomalies represented poorly constrained inversion artifacts rather than geologically meaningful cryotic features.
2.4. Unmanned Aerial Vehicle (UAV) Geomorphic Photogrammetry
UAV-based aerial surveys were executed during the thaw season (14–15 August 2025) to obtain ultra-high-resolution geomorphological and topographic frameworks for both features. The UAV platform used in this study was a Matrice 210 rotary-wing UAV (SZ DJI Technology Co., Ltd., Shenzhen, China), equipped with an onboard GPS receiver and altimeter sensor. The operating temperature range of the UAV spanned −20 to 50 °C, ensuring stable operation in high-altitude cold environments. A DJI ZENMUSE X5S digital camera with a 20-megapixel CMOS sensor (5280 × 3956 pixels resolution, 4:3 aspect ratio) (SZ DJI Technology Co., Ltd., Shenzhen, China) was deployed for image acquisition. UAV flights were conducted under optimal nadir and off-nadir parameters with sufficient image overlap (>80% forward and >70% side lap) to ensure the quality of photogrammetric reconstruction. The acquired images were processed using structure-from-motion (SfM) photogrammetry to generate digital orthomosaics and digital surface models (DSMs). The UAV-derived datasets were used to identify geomorphic features such as meadow-mat cracking, exposed mineral soil, frontal turf-block accumulation, and local compressional deformation, and to support the interpretation of InSAR and ERT results.
To quantify the relative vegetation signal from the UAV-derived RGB orthomosaics, the green leaf index (GLI) was computed on a pixel-by-pixel basis [32]. Elevated positive GLI values signify that green reflectance dominates the red and blue spectral bands, which typically corresponds to a denser or more continuous alpine meadow canopy under comparable illumination conditions. GLI values approaching zero indicate attenuated or mixed spectral signatures, which are characteristic of sparse vegetation, exposed substrate intermingled with turf, or mechanically disrupted meadow surfaces. Conversely, negative or near-zero values delineate features lacking active chlorophyll signals, including exposed mineral soil, senescent or damaged vegetation, water-saturated dark surfaces, or terrain shadows. Consequently, spatial declines in the GLI along the longitudinal transects were interpreted as diagnostic evidence of vegetation degradation or meadow-mat disruption, and were systematically co-analyzed with subsurface ERT resistivity structures and surficial InSAR deformation patterns.
3. Results
3.1. Electrical Resistivity Structure of the ALD
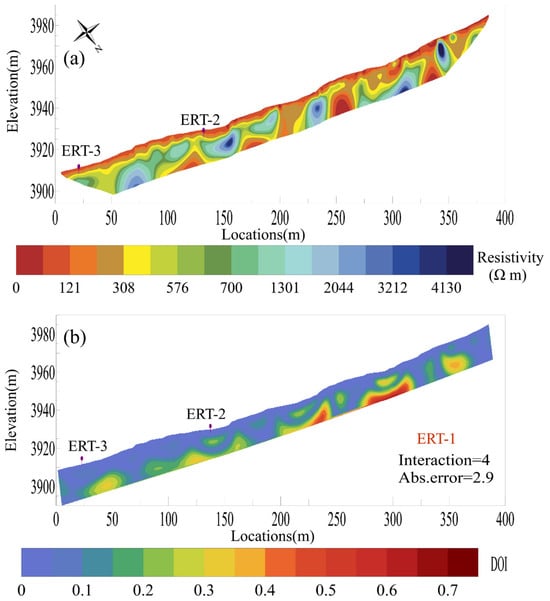
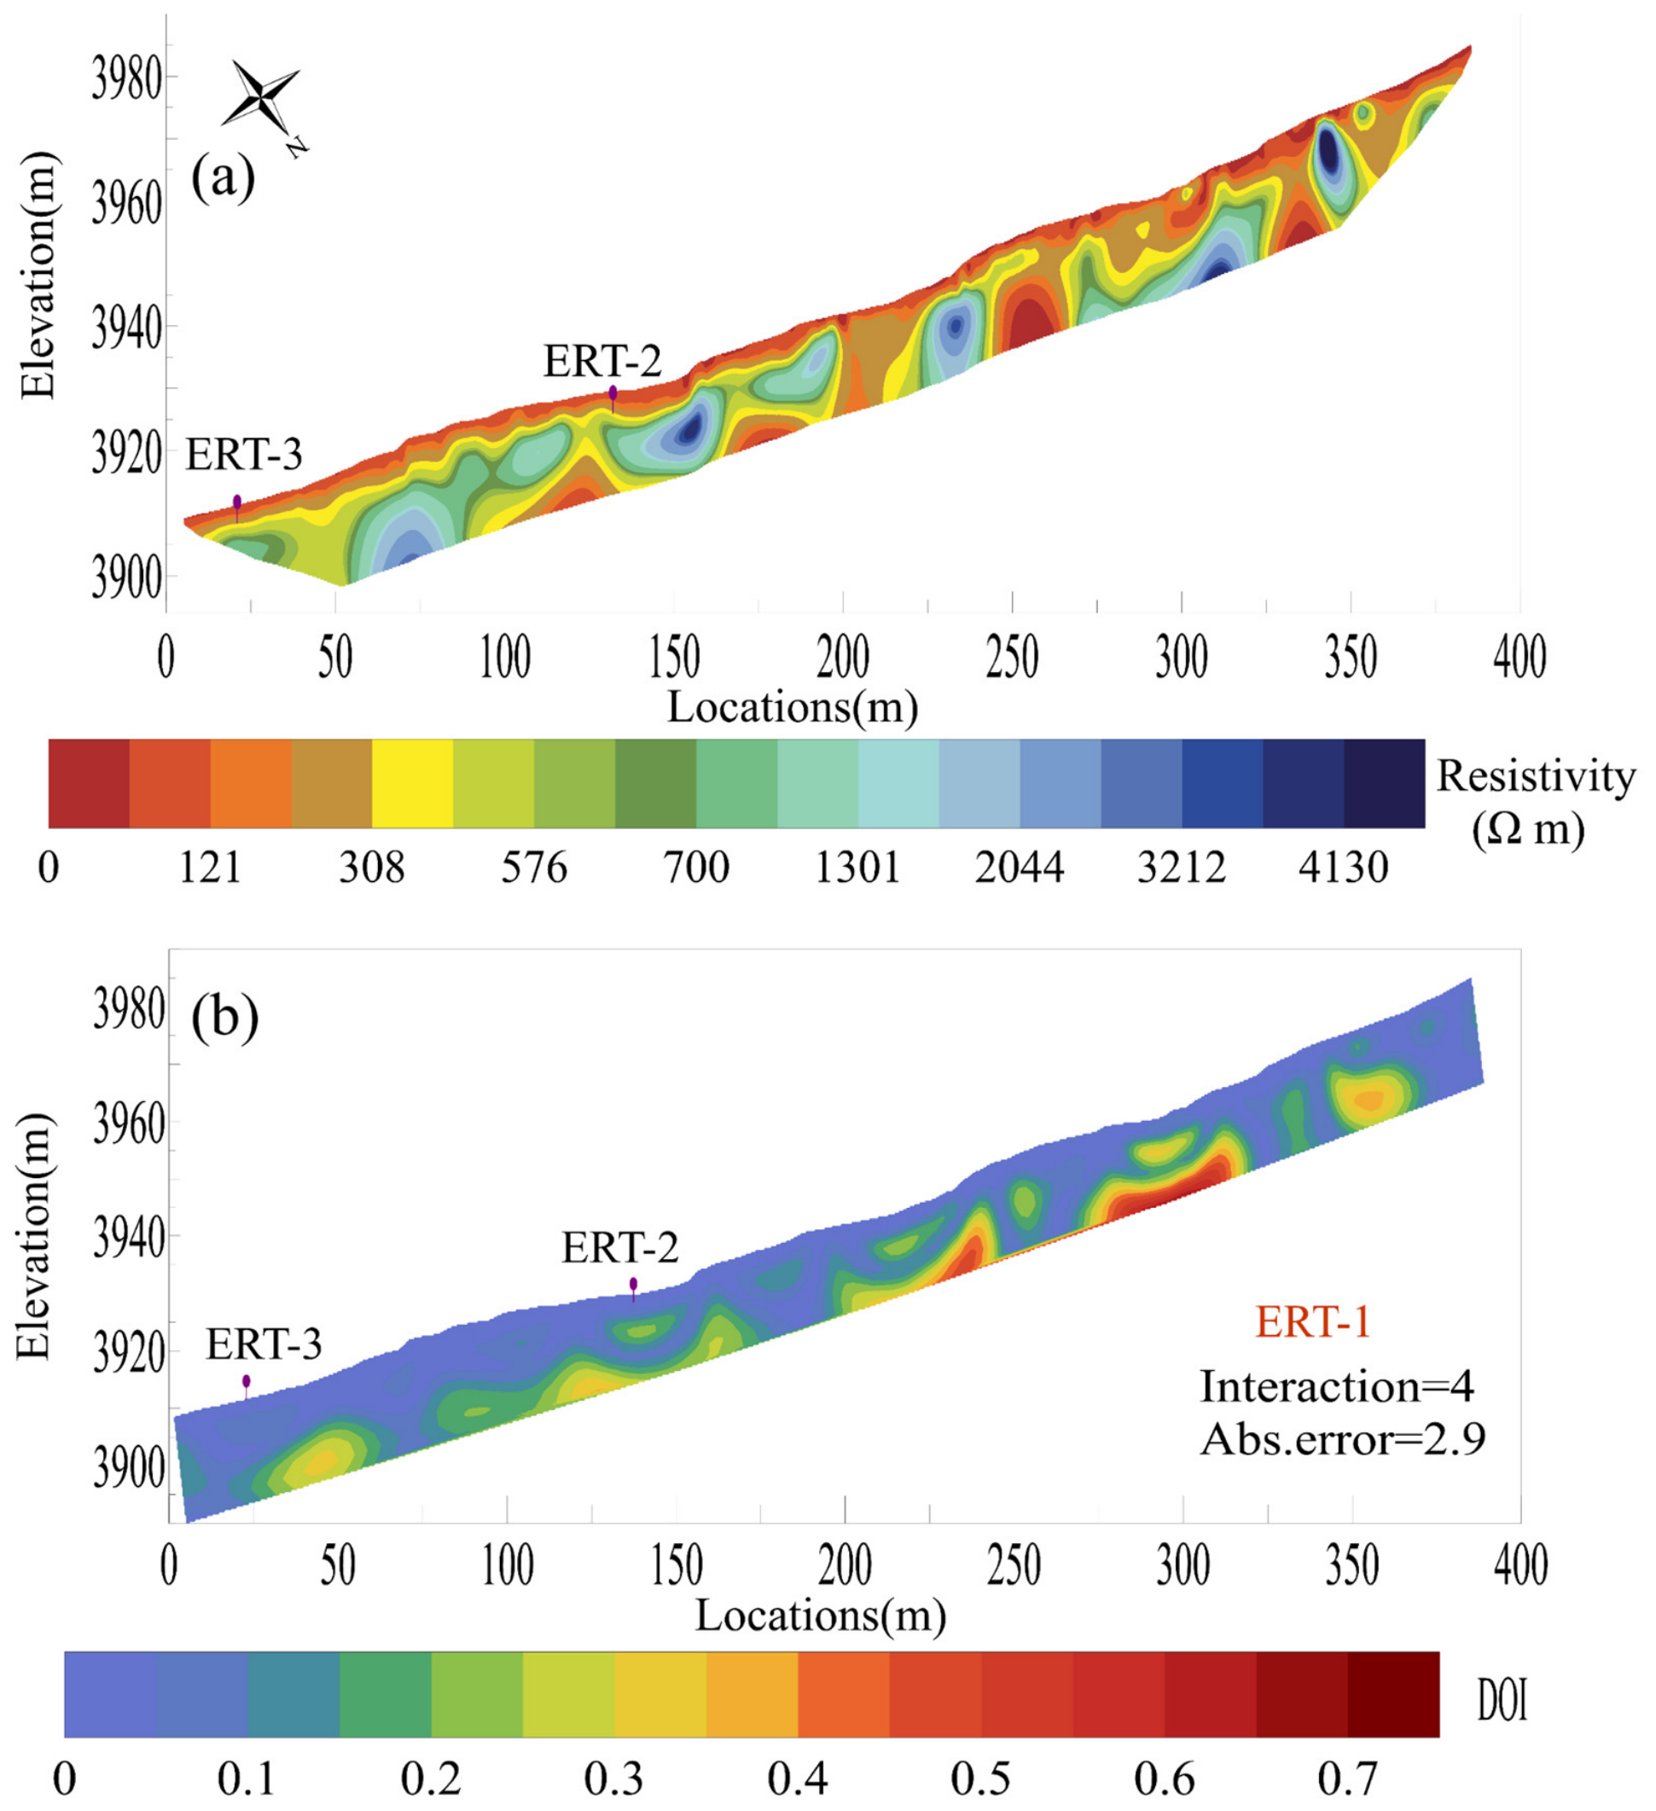
The ERT profiles reveal pronounced spatial heterogeneity in the subsurface resistivity structure of the ALD. Permafrost exhibits a discontinuous distribution, manifested as isolated high-resistivity bodies separated by localized thawed zones. Overall, the longitudinal profile ERT1 demonstrates a clear downslope decrease in resistivity, suggesting degraded permafrost integrity at lower elevations and localized thawing within the lower slope segments (Figure 4). The most complex resistivity structure occurs between approximately 200 and 350 m along ERT1, corresponding to the central and most strongly deformed part of the ALD. In this sector, the alpine meadow turf has undergone fragmentation and displacement, subsequently exposing the underlying grayish-brown mineral substrate. Distinct low-resistivity anomalies are evident at approximately 230–260 m and 330–350 m, likely representing taliks or saturated unfrozen layers. In contrast, a relatively high-resistivity permafrost body is preserved between 260 and 330 m, exhibiting a peak resistivity value of 1430 Ω m. Resistivity remains consistently higher than 1300 Ω m down to a depth of approximately 20 m, implying that the cryotic layer extends beyond the detection limits of the array. The maximum depth of the shallow unfrozen or thawed layer occurs near 280 m, reaching approximately 15 m. This zone coincides with the most severely disturbed and exposed part of the ALD, indicating pronounced active-layer deepening and permafrost degradation. Toward lower elevations along ERT1, the thickness of the shallow unfrozen layer remains relatively stable, typically ranging from 5 to 10 m. However, both the resistivity magnitude and thickness of the underlying permafrost decrease in the downslope direction. In the 0–50 m section, located outside the frontal slope of the ALD, no continuous high-resistivity frozen layer is detected, suggesting that permafrost has primarily undergone complete thawing or persists solely as isolated remnants. Although the depth-of-investigation (DOI) index reaches relatively high values (exceeding 0.5) at greater depths, the vast majority of the ERT profile area down to a depth of 15 m exhibits low DOI values, thereby demonstrating the high reliability and robust data constraints of the ERT inversion results.
Figure 4.
Longitudinal geoelectrical characterization of the active-layer detachment: (a) 2D inverted resistivity tomogram and (b) spatial distribution of the depth-of-investigation (DOI) index, demonstrating the data reliability and depth constraints of the geophysical inversion.
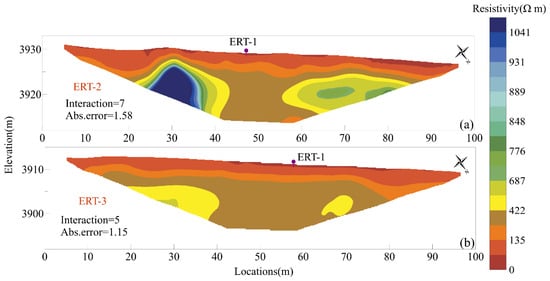
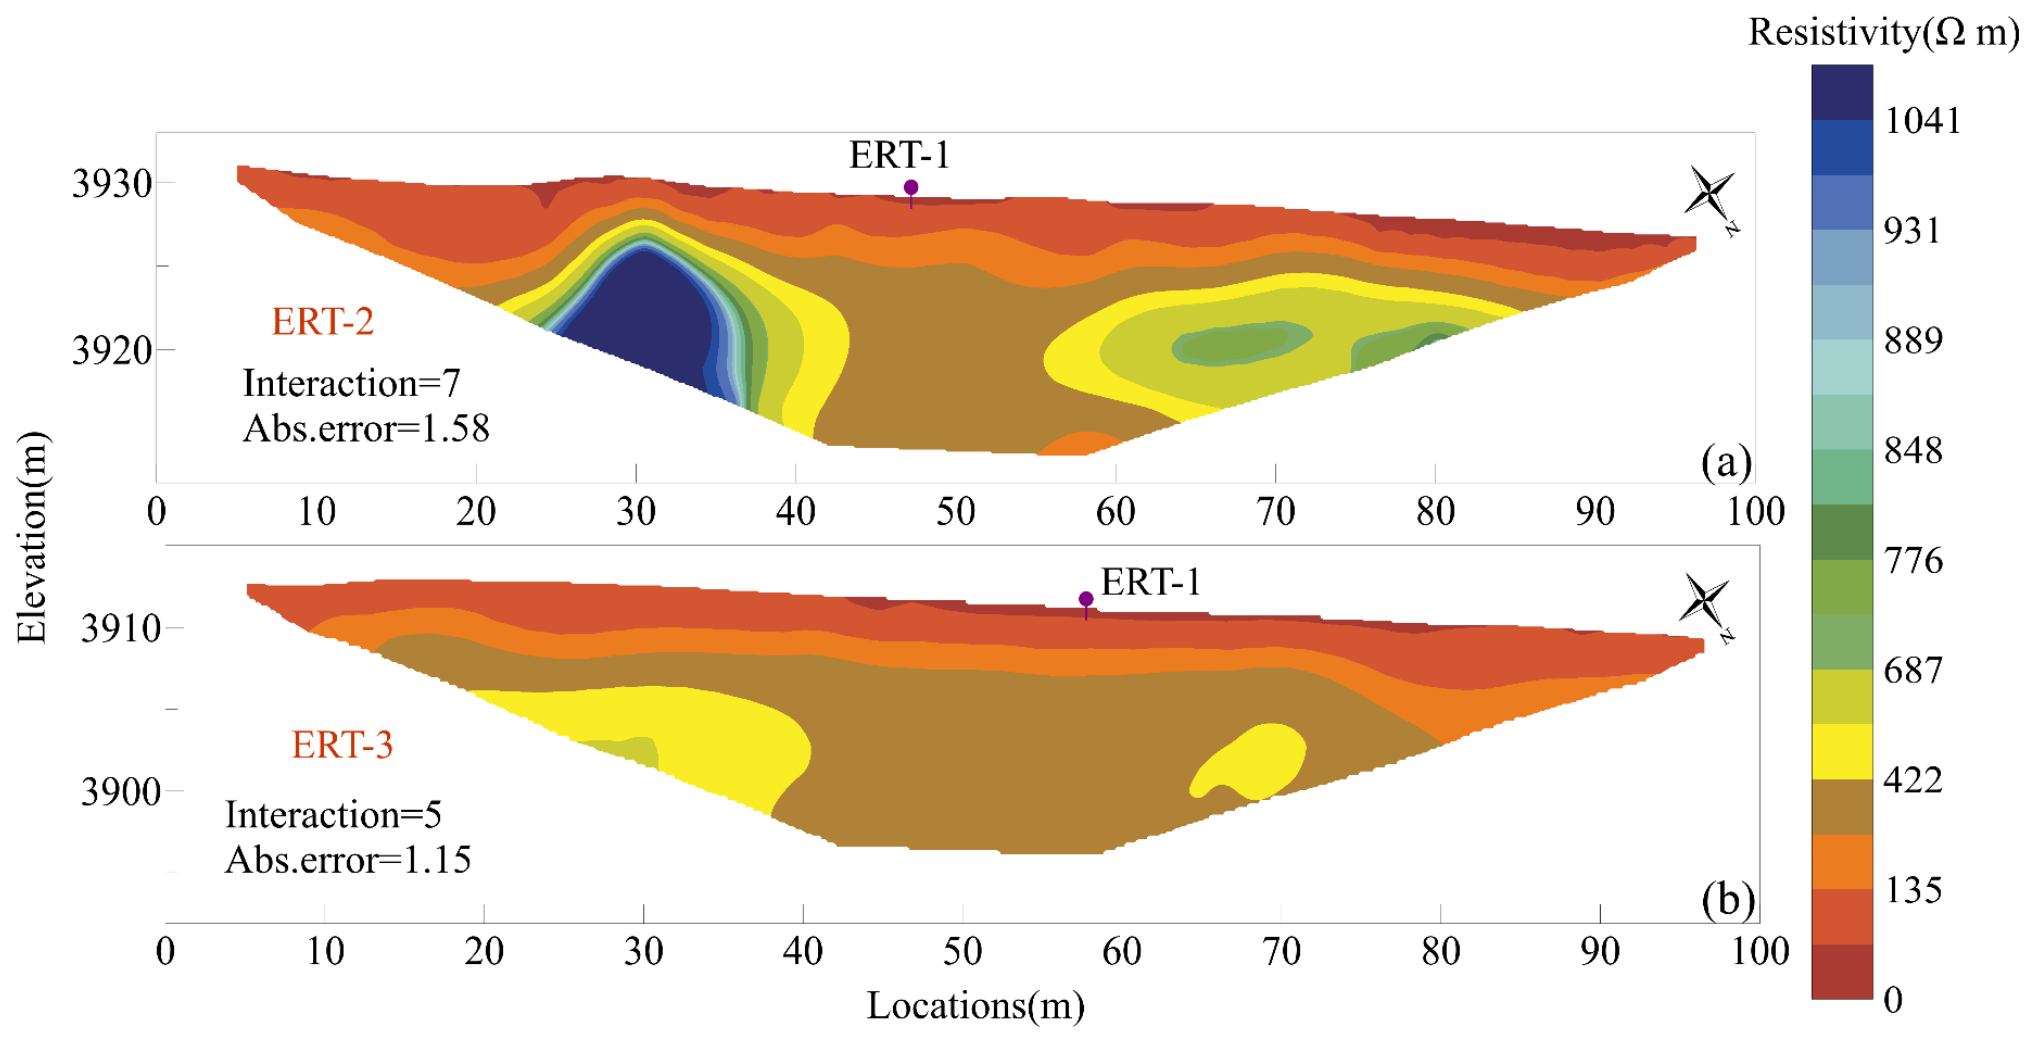
The transverse profile ERT2, situated within the frontal accumulation lobe of the ALD, is characterized by predominantly low and laterally variable resistivity, indicative of a discontinuous permafrost regime (as shown in Figure 5). On the western flank of the profile (0–40 m), relatively high resistivity values are observed. The shallow unfrozen layer is approximately 5–10 m thick, below which resistivity increases with depth, attaining a maximum value of 1041 Ω m. This pattern suggests the presence of a permafrost body whose lower boundary is not resolved within the inversion depth. In contrast, the 40–60 m section exhibits low resistivity, with peak values reaching only ~400 Ω m, signifying a localized talik. On the eastern flank of the profile (65–84 m), which aligns with the lateral margin of the ALD, permafrost signatures are also detected. The shallow unfrozen layer is approximately 5–8 m thick, underlain by a resistive layer roughly 4–6 m thick, with a maximum resistivity of 848 Ω m. The base of permafrost is identified at a depth of approximately 8 m.
Figure 5.
Transverse ERT inverted profiles in the frontal accumulation lobe (a) and outside the frontal margin (b) of the active-layer detachment.
Compared with ERT2, ERT3, which is located outside the frontal margin of the ALD, shows substantially lower resistivity. Resistivity displays only a gradual vertical gradient, peaking at approximately 422 Ω m. The absence of any continuous high-resistivity anomalies suggests that permafrost in this sector has largely degraded. Collectively, the three ERT profiles demonstrate that the ALD occurred within a degraded discontinuous permafrost environment. Permafrost degradation is most pronounced within the central deformation zone, while patchy permafrost persists in the frontal accumulation lobe; notably, no clear geophysical evidence for permafrost is discernible beyond the frontal margin.
3.2. Electrical Resistivity Structure of the Freeze–Thaw-Induced Shallow Creep Landslide
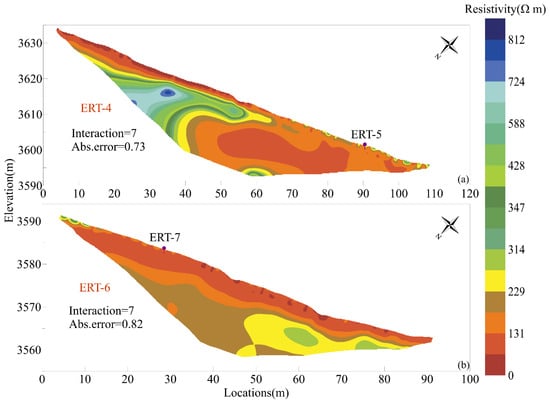
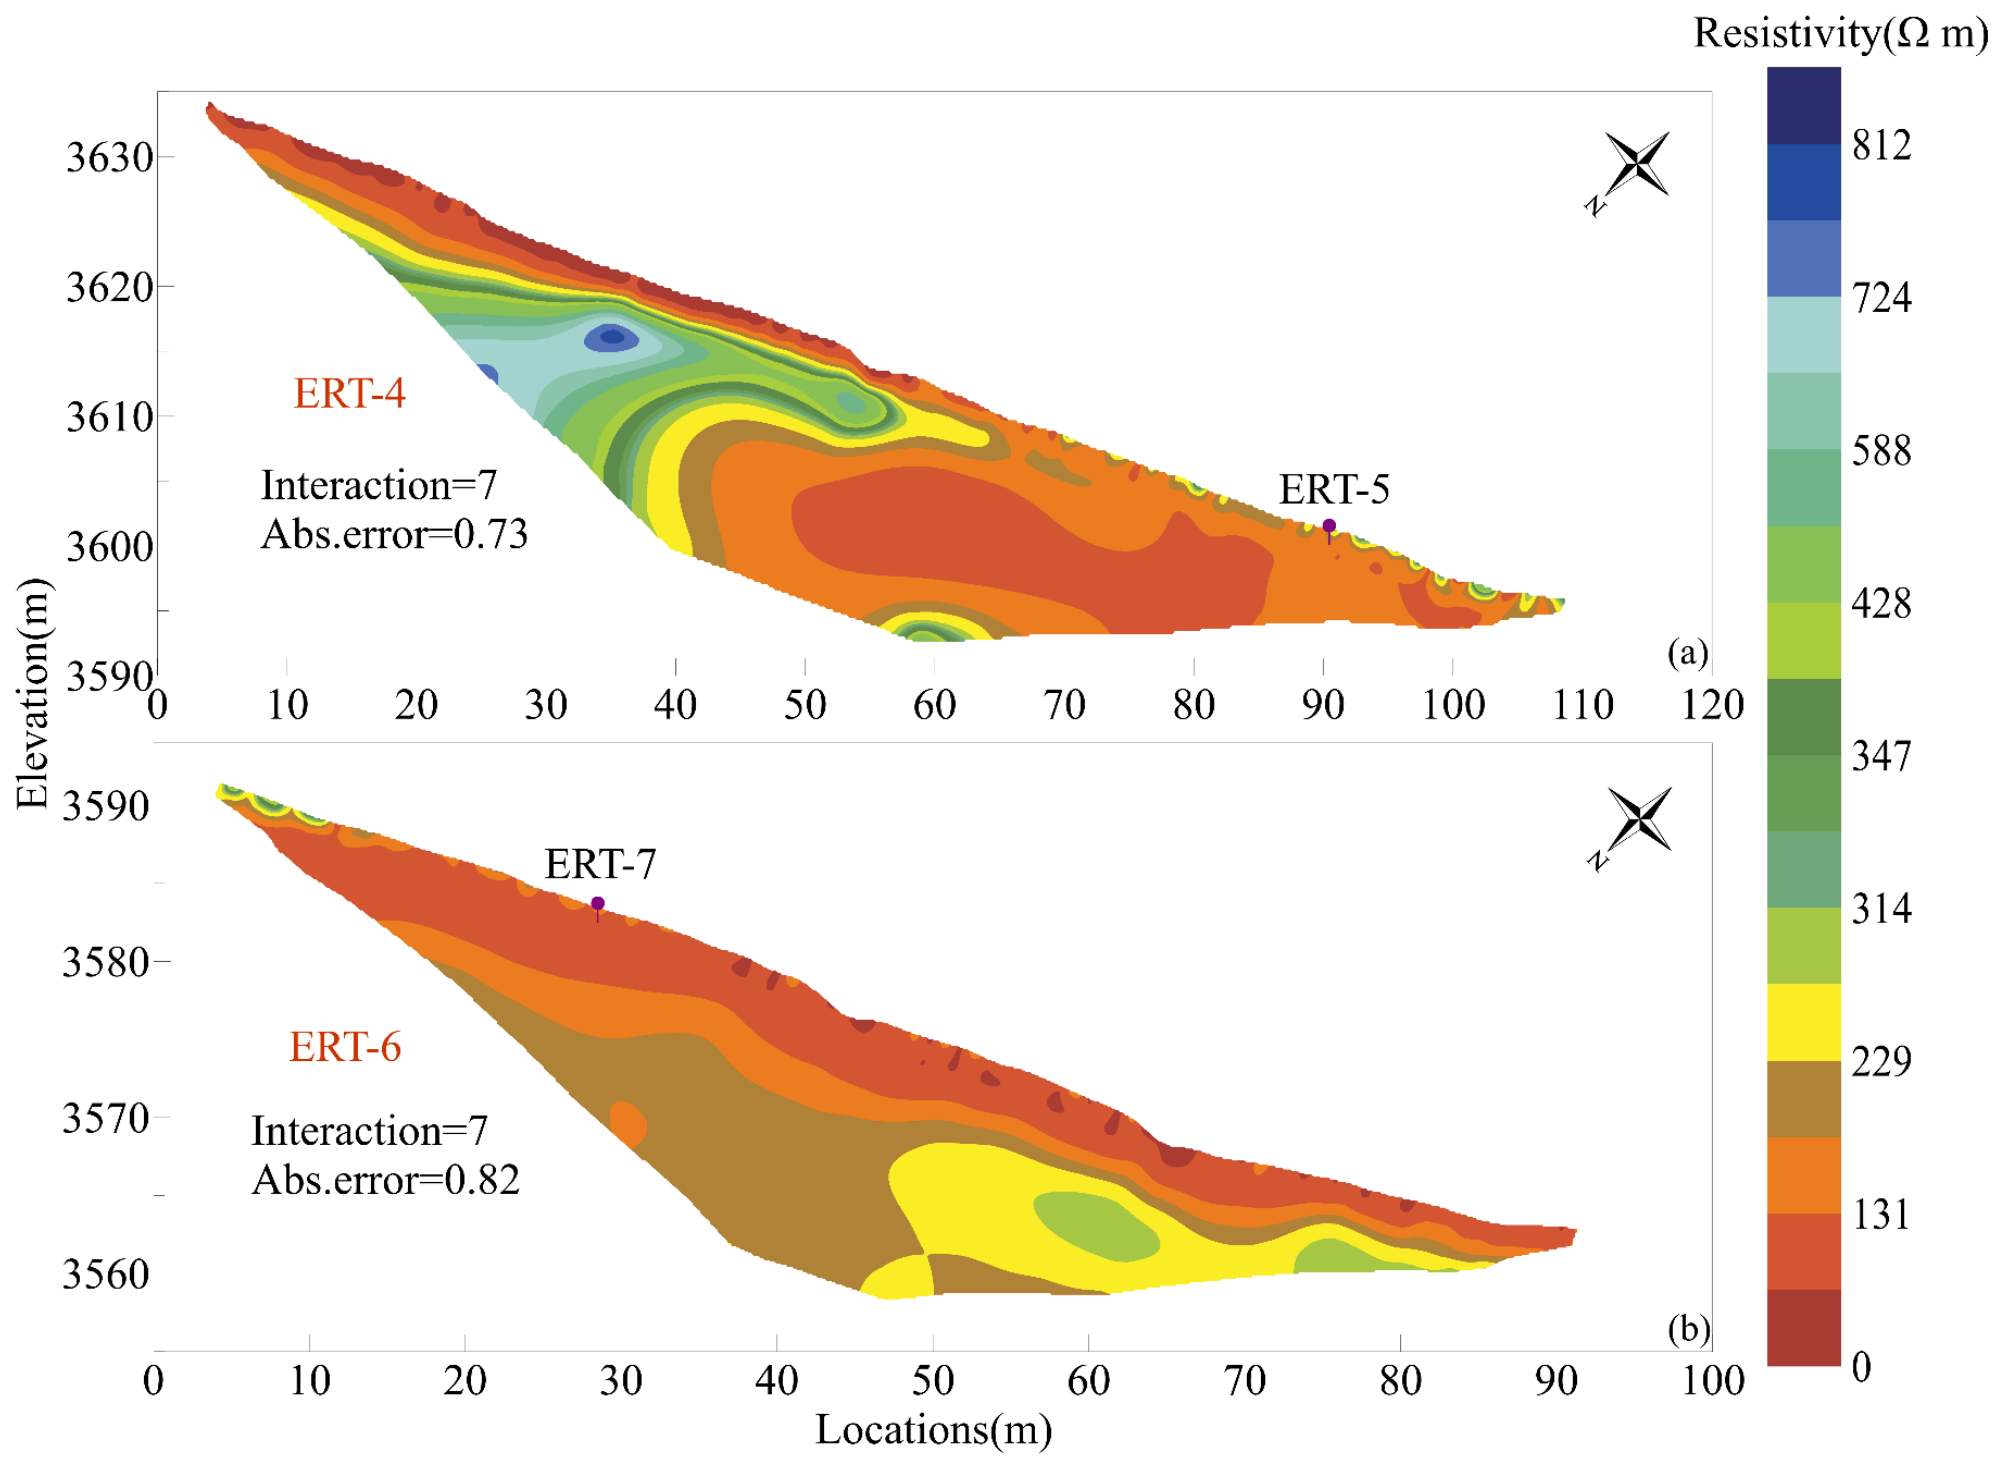
The longitudinal profile ERT4 exhibits a pronounced transition in permafrost occurrences along the altitudinal gradient. In the upper part of the landslide (0–65 m), resistivity is relatively high and displays a non-monotonic vertical trend, characterized by an initial increase followed by a subsequent decrease with depth (Figure 6). The shallow unfrozen layer measures approximately 2–4 m in thickness, with peak resistivity attaining a value of 812 Ω m. The underlying permafrost layer is approximately 5–10 m thick. Although the continuous resistive anomaly indicates the presence of permafrost in the upper part of the slope, its magnitude is substantially lower than that observed in the high-elevation ALD profile, and the resistive zone exhibits significant spatial heterogeneity. This suggests that permafrost in this sector is poorly preserved—likely characterized by high ground temperature and low ice content—positioning it near a critically degraded marginal state. In the medial and distal parts of ERT4 (65–110 m), resistivity decreases precipitously, with peak values remaining below 347 Ω m. This section is characterized by laterally continuous low-resistivity anomalies, indicative of unfrozen, saturated, or fine-grained subsurface materials. The absence of a continuous highly resistive layer suggests that the medial and lower segments of the landslide are devoid of continuous permafrost. The progressive decrease in resistivity toward lower elevations indicates that the landslide is located near the lower limit of permafrost preservation, representing a degraded permafrost margin. The longitudinal profile ERT6 similarly demonstrates predominantly low resistivity values. The majority of the profile yields resistivity values below 229 Ω m, rarely exceeding 300 Ω m. No continuous high-resistivity frozen layer is detected, indicating that permafrost is largely absent in this area. A prominent conductive horizon occurs within the upper 3–5 m, with values commonly below 100 Ω m. This layer likely represents water-rich shallow materials or a fine-grained layer. Resistivity increases slightly with depth, possibly reflecting attenuated moisture content, enhanced compaction, or a higher proportion of coarse-grained materials. However, the bulk resistivity remains insufficient to suggest the presence of permafrost.
Figure 6.
Longitudinal ERT inverted profiles across the upper part (a) and lower part (b) of the freeze–thaw-induced shallow creep landslide.
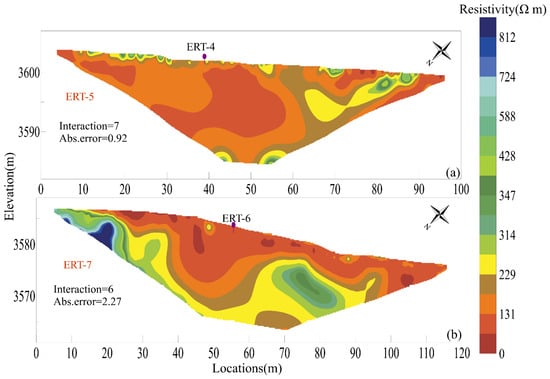
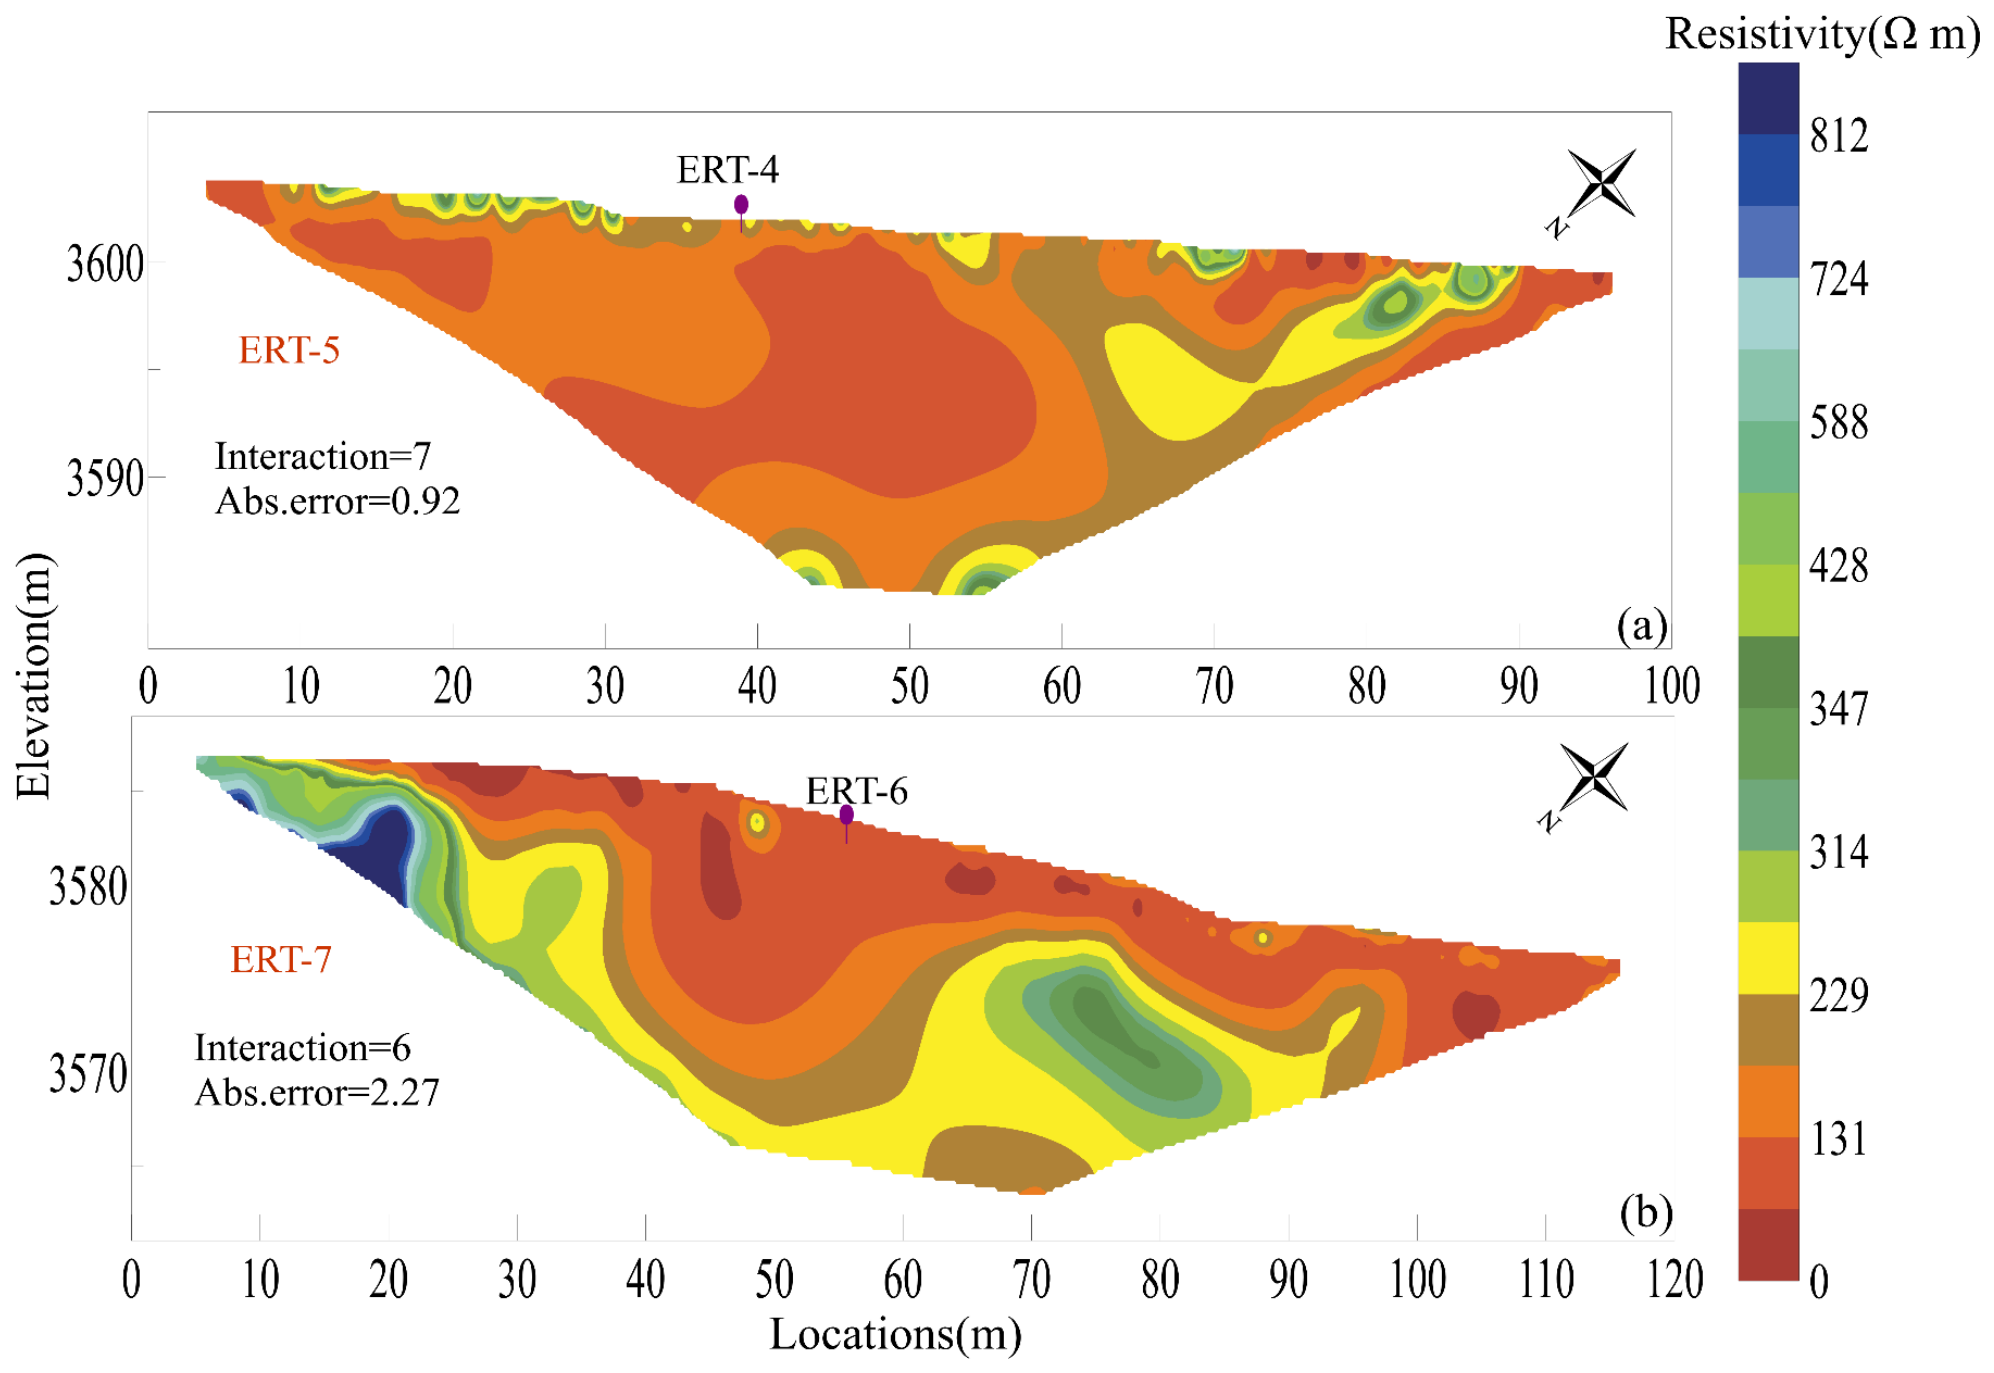
The transverse profile ERT5, situated at approximately 3600 m a.s.l. near the lower elevational limit of discontinuous permafrost inferred from ERT4, is characterized by generally low resistivity values (Figure 7a). Unlike the upper part of ERT4, no continuous high-resistivity frozen layer was detected along this profile. Except for a limited area on the right side of the profile where resistivity locally exceeds 400 Ω m, most of the section exhibits resistivity values below 200 Ω m. This pattern suggests that permafrost is largely absent beneath ERT5 and that the subsurface is mainly composed of unfrozen, water-rich, or fine-grained materials. The absence of a laterally continuous resistive layer further indicates that the main body of the landslide near this elevation lacks a stable active-layer–permafrost interface.
Figure 7.
Transversal ERT inverted profiles across the (a) upper part and (b) lower part of the freeze–thaw-induced shallow creep landslide.
The transverse profile ERT7, positioned at an elevation of approximately 3570 m a.s.l., also shows generally low resistivity over most of the profile (Figure 7b). However, a localized high-resistivity anomaly occurs on the left side of the profile, with maximum values approaching 900 Ω m. Field observations indicate that this part of the profile is characterized by accumulated meadow blocks, abundant cracks, and locally coarse blocky debris, which may have reduced electrode–ground contact quality and increased apparent resistivity. Outside this localized anomaly, the profile is dominated by low-to-moderate resistivity values and does not show a continuous frozen layer. Synthesizing the results from ERT4–ERT7, permafrost is preserved only in the upper or locally higher-elevation parts of the landslide, whereas the main landslide body is dominated by shallow conductive materials and lacks a continuous active-layer–permafrost interface. Consequently, this feature is not classified as a typical ALD, but rather as a freeze–thaw-induced shallow creep landslide governed by seasonal freeze–thaw cycles and hydro-mechanical destabilization.
3.3. InSAR-Derived Kinematic Characteristics and Spatial Deformation Patterns
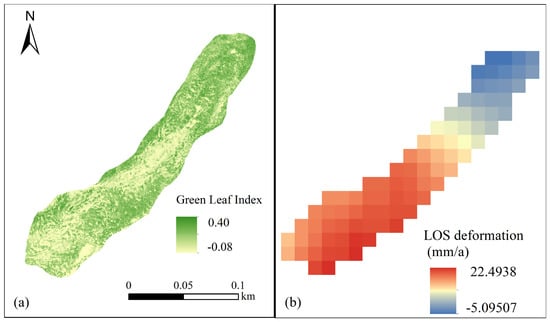
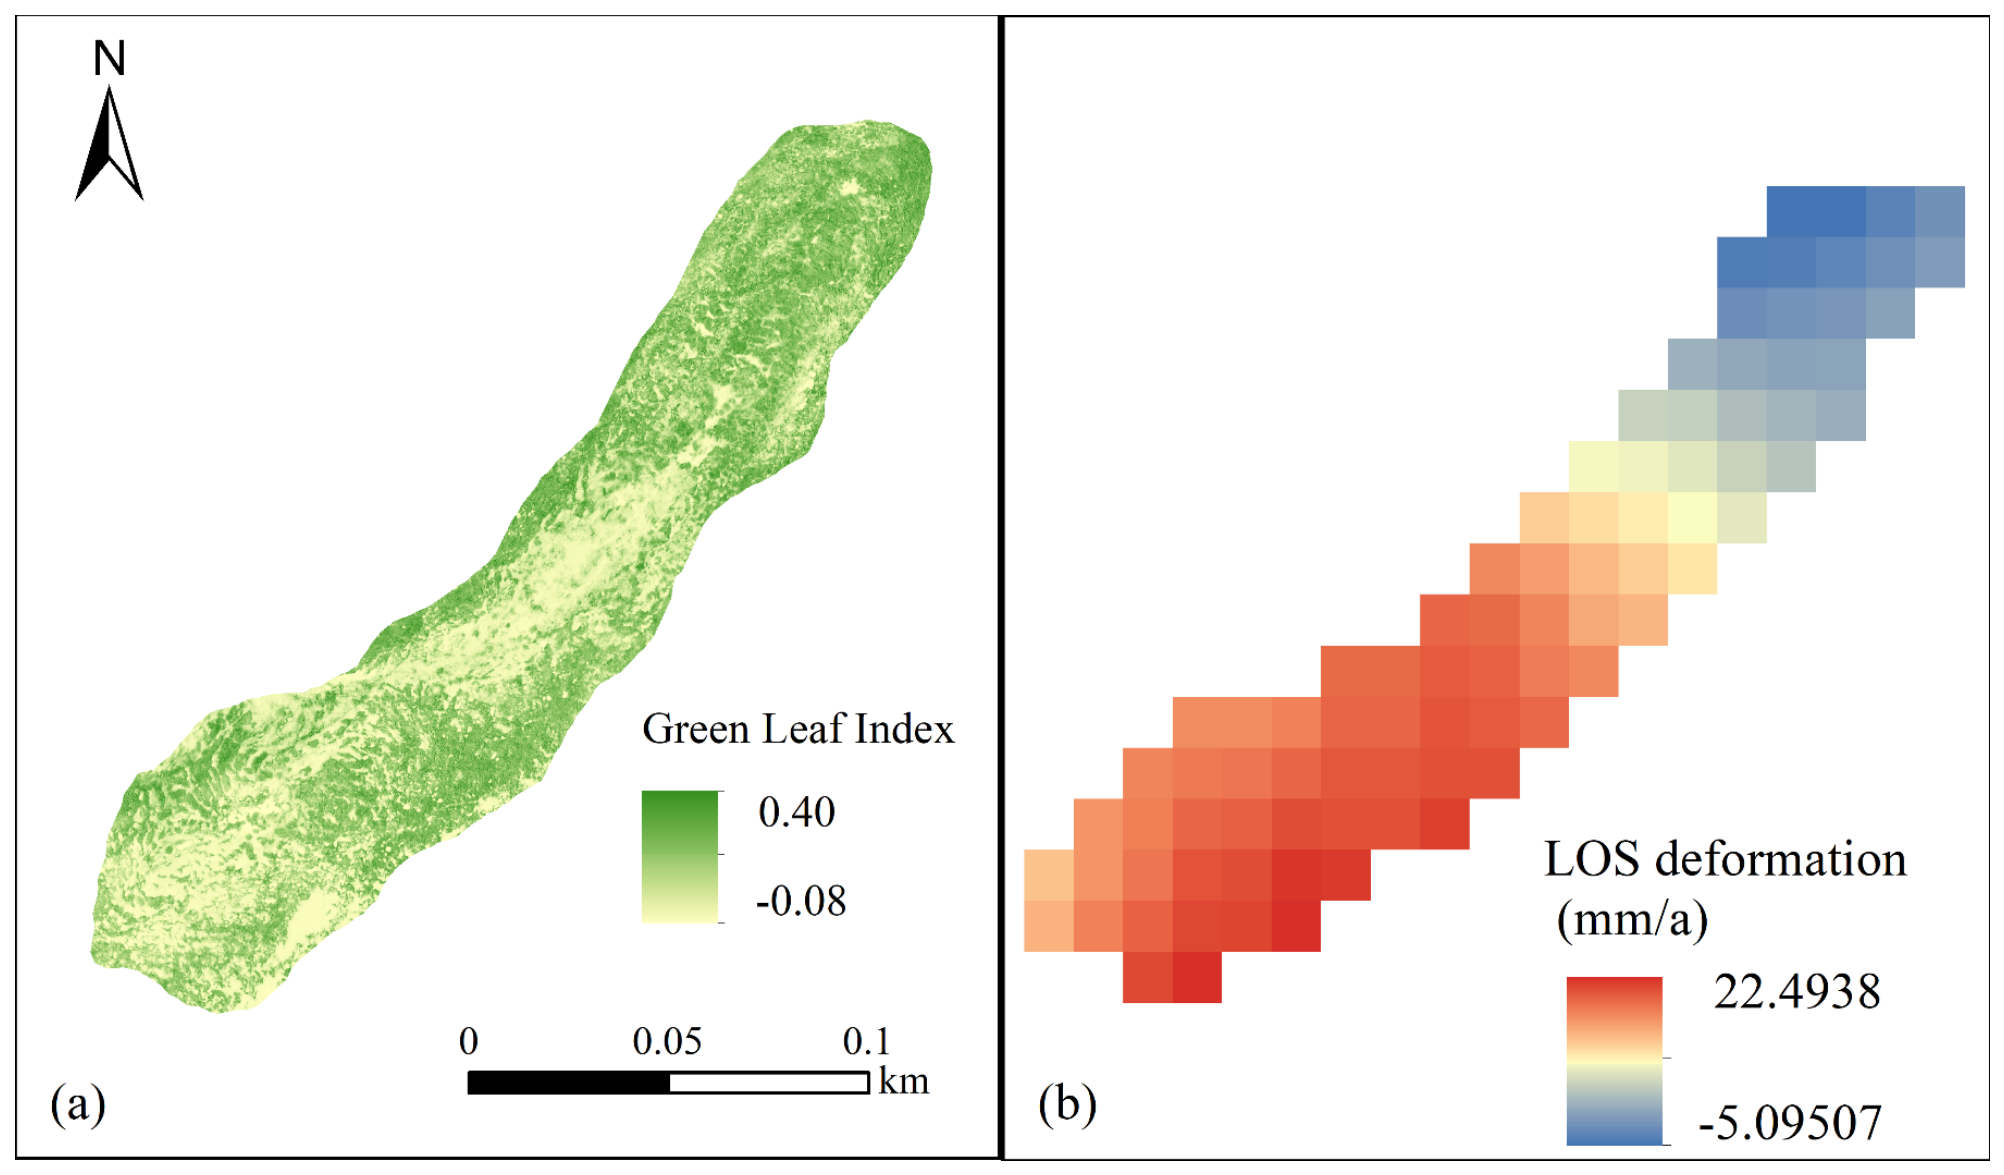
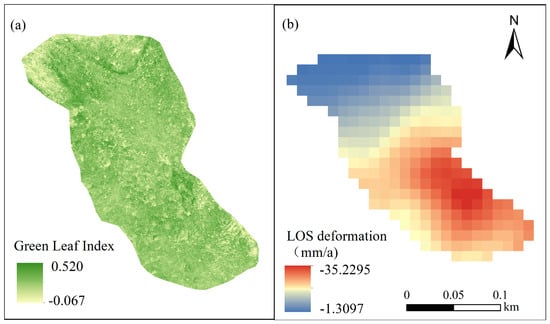
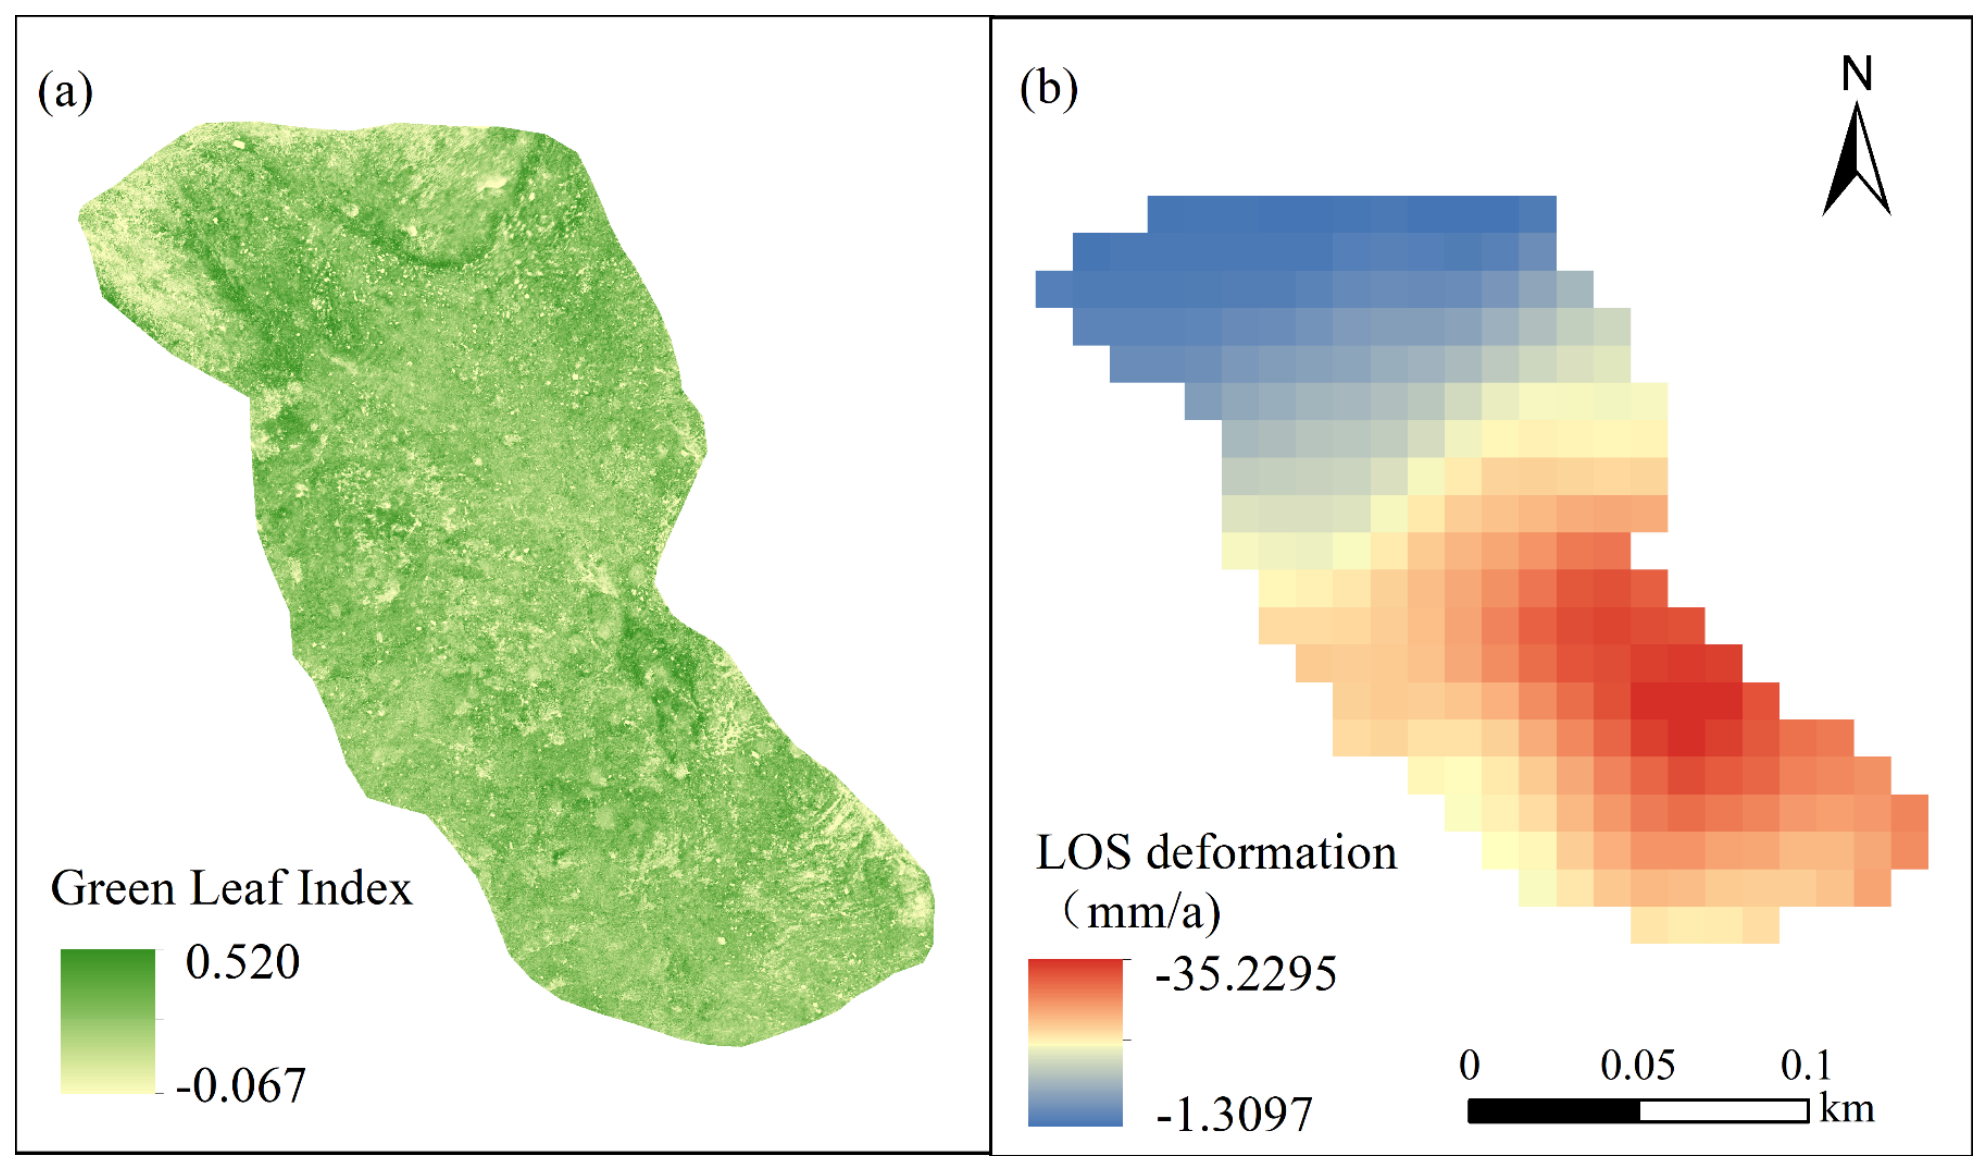
The Sentinel-1 InSAR interferometry results reveal pronounced spatially heterogeneous deformation patterns across both the ALD and the freeze–thaw-induced shallow creep landslide. Integrating field observations with UAV orthomosaics, the ALD can be segmented into three distinct morpho-structural units: an upslope detachment zone, a central depletion transport zone, and a frontal accumulation zone. The detachment zone exhibits the highest line-of-sight (LOS) velocity, with a maximum of 21.86 mm/year, a minimum of 12.53 mm/year, and a mean of 17.32 mm/year (as shown in Figure 8). The peak displacement is localized in the southwestern corner of the ALD root area, where numerous tensile cracks are manifested, the alpine meadow turf has undergone displacement, and grayish mineral soil is locally exposed. This sector is dominated by shallow detachment and creep processes. No steep scarp is observed, and the geomorphology lacks evidence of the retrogressive headwall retreat typical of RTSs. The depletion transport zone also displays relatively elevated LOS deformation rates, yielding a maximum of 21.40 mm/year, a minimum of 1.61 mm/year, and a mean of 14.15 mm/year. This zone is distinctively characterized by the stripping of the alpine meadow turf, exposure of the grayish mineral soil, and subsequent downslope transport of displaced materials. Peak deformation occurs in the medial to distal portion of the landslide, corresponding to the area undergoing intensive turf stripping and widespread exposure of grayish mineral soil (totaling approximately 972.36 m2). Conversely, the minimum displacement within this zone occurs mainly near the transition to the upslope detachment zone, where locally accumulated turf blocks derived from the upper slope are present. Overall, the mean LOS deformation rate in the depletion transport zone is slightly lower than that in the upslope detachment zone, yet it remains a strongly deforming sector within the ALD. Concurrently, the accumulation zone exhibits substantially attenuated LOS deformation rates compared to the upslope detachment and central depletion–transport zones, ranging from −3.88 to 2.20 mm/year, with a mean of −0.65 mm/year. This sector is mainly characterized by imbricated turf blocks and local compressional deformation. Relatively high local deformation occurs in the northeastern part of the frontal zone, corresponding to a steeper frontal slope and localized compression. Overall, the LOS deformation within the ALD decreases markedly from the upslope detachment and central depletion–transport zones toward the frontal accumulation zone. This spatial trend demonstrates that present kinematic activity is mainly concentrated in the upper and central reaches of the ALD, whereas the frontal zone is dominated by accumulation and local morphological readjustment.
Figure 8.
Eco-geomorphic characteristics and kinematic activity of the active-layer detachment complex: (a) UAV-derived green leaf index map and (b) annual line-of-sight (LOS) ground deformation rate map computed from SBAS-InSAR processing.
The freeze–thaw-induced shallow creep landslide displays LOS deformation rates ranging from −35.23 to −1.31 mm/year and exhibits a pronounced elevation-dependent pattern. Based on the high-density ERT results detailed previously, the inferior elevational limit of discontinuous permafrost within this landslide complex was identified at approximately 3600 m a.s.l. Accordingly, the landslide is bifurcated into an upper permafrost-margin sector and a lower seasonally frozen ground sector using the 3600 m a.s.l. contour as the boundary. The upper permafrost-margin sector exhibits LOS deformation rates ranging from −35.23 to −17.33 mm/year, with a mean of −25.25 mm/year, constituting the most strongly deforming domain of the freeze–thaw-induced shallow creep landslide (as shown in Figure 9). In terms of absolute LOS velocity, this sector also exhibits greater deformation magnitudes than any of the ALD sectors. The maximum displacement occurs on the northeastern flank of the landslide, where creep-related accumulation of the alpine meadow turf is observed. However, tensile cracks are poorly developed, the vegetation cover remains largely intact, and no distinct landslide headwall or extensive exposure of underlying substrate is observed. Crucially, the LOS deformation rates decrease progressively with decreasing elevation. In the lower seasonally frozen ground sector, LOS deformation rates range from −19.23 to −1.31 mm/year, with a mean of −8.48 mm/year, which is substantially lower than that of the upper permafrost-margin sector. Although localized creep-related accumulation of the alpine meadow turf is still observed in this lower sector, field observations and UAV imagery indicate that the intensity of local compression and the extent of accumulation are much less pronounced than those in the upper sector. This is consistent with the attenuating displacement trend indicated by the InSAR results. In summary, the ALD is characterized by intense deformation in the upslope detachment and central depletion–transport zones and attenuated deformation in the frontal accumulation zone. In contrast, the freeze–thaw-induced shallow creep landslide exhibits strong deformation in the upper permafrost-margin sector and subdued deformation in the lower seasonally frozen ground sector. Based solely on the absolute magnitude of LOS deformation rates, the upper permafrost-margin sector of the freeze–thaw-induced shallow creep landslide exhibits the largest InSAR-detectable deformation within the study area.
Figure 9.
Eco-geomorphic characteristics and kinematic activity of the freeze–thaw-induced shallow creep landslide: (a) UAV-derived green leaf index map and (b) annual line-of-sight (LOS) ground deformation rate map computed from SBAS-InSAR processing.
4. Discussion
4.1. Deformation Mechanism of the ALD in Degraded Discontinuous Permafrost
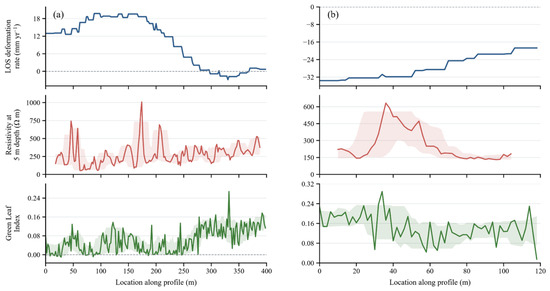
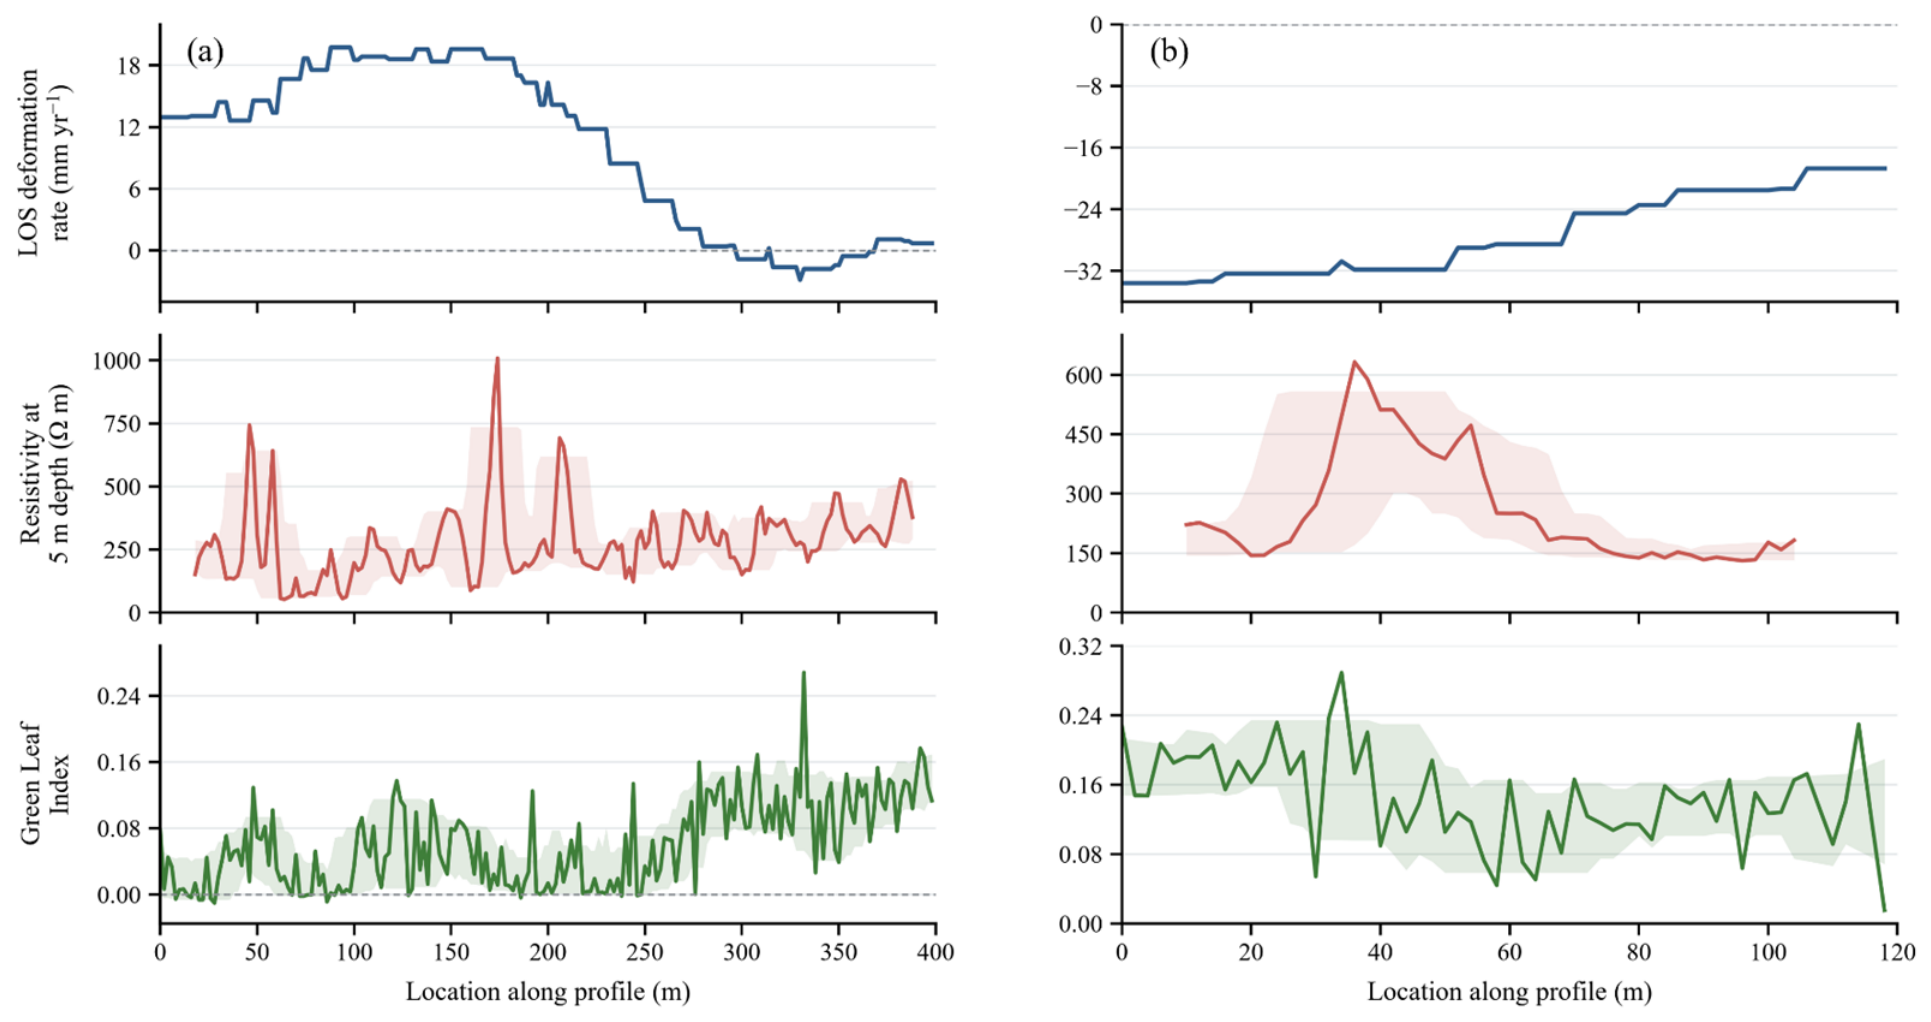
The ERT profiles reveal that the investigated ALD developed within a degraded discontinuous permafrost environment. Along the downslope altitudinal gradient, the subsurface structure is characterized by alternating vestigial high-resistivity cryotic masses and localized low-resistivity taliks. Unlike typical retrogressive thaw slumps (RTSs), this landslide lacks a steep scarp, persistent headwall retreat, and discernible retrogressive erosion. Instead, it manifests primarily as tensile cracking of the alpine meadow turf in the upslope root zone, stripping and displacement of the vegetation cover in the central reach, exposure of the underlying grayish mineral substrate, and subsequent downslope transport of shallow colluvial materials. These morpho-structural features suggest that landslide initiation and development are closely related to elevated pore-water pressure near the active-layer base, thaw-induced weakening, and consequent reductions in frictional shear strength. The InSAR results demonstrate that LOS deformation is mainly concentrated within the upslope detachment zone and the central depletion–transport zone. These two sectors are characterized by cracking, detachment, and downslope displacement of the alpine meadow turf, together with extensive exposure of the grayish mineral soil. To further examine the kinematic relationship between surface deformation and permafrost structure, resistivity values at a 5 m depth along ERT1 were extracted and compared with the corresponding InSAR-derived LOS deformation rates. The spatial overlay profile demonstrates that LOS deformation and resistivity at a 5 m depth exhibit a pronounced non-linear spatial decoupling rather than a simplistic linear correlation (as shown in Figure 10). The highest deformation rates do not correspond to the most resistive permafrost bodies stabilized by ground ice; instead, peak displacement velocities occur predominantly within conductive taliks, particularly within the low-resistivity transition corridors between two relatively resistive frozen bodies. For example, the section at approximately 30–80 m along the profile shows relatively high LOS deformation rates, while corresponding to a low-resistivity thawed zone between two high-resistivity permafrost bodies. Similar correspondence between low-resistivity thawed zones and enhanced LOS deformation is also observed in other parts of the profile. This pattern indicates that greater surface deformation does not necessarily imply higher ground-ice content or better-preserved permafrost. Rather, it is more likely associated with thawed zones formed during permafrost degradation. High-resistivity frozen bodies likely possess a higher volumetric ice content and robust cryogenic cohesion, resulting in greater matrix stiffness and shear strength. Under downslope shear stress, these frozen bodies are thus more resistant to deformation than adjacent thawed or water-rich layers. In contrast, low-resistivity thawed zones generally indicate unfrozen, highly saturated, or fine-grained materials, which are highly susceptible to geomechanical shear failure and strain localization [20]. Furthermore, vestigial permafrost bodies act as low-permeability hydrological barriers, limiting the downward drainage of snowmelt, rainfall infiltration, and shallow groundwater [33]. This mechanism forces preferential moisture accumulation within adjacent taliks or immediately above the permafrost table. Previous investigations across Canada, the Qinghai–Tibet Plateau (QTP), and Arctic regions have demonstrated that such ALD failures are commonly associated with the accumulation of excess pore-water pressure and a concomitant reduction in shear strength near the active-layer base or the permafrost table [17,34,35]. When thawing, rainfall, or soil saturation weakens this interface, shallow materials are more likely to detach, creep, or slide downslope via effective stress collapse [9]. Our empirical observations align closely with this mechanistic framework. However, the ALD identified in this study differs from conventional, rapid failure events because the stabilizing permafrost boundary lacks continuity. Instead, ERT imaging delineates residual frozen bodies separated by conductive taliks, suggesting that the spatial locus of shearing is modulated by the fragmented structural geometry of the degraded permafrost matrix, rather than being confined to a single, well-defined basal detachment plane.
Figure 10.
Spatial alignment of surface kinematics, subsurface geoelectrical structures, and eco-geomorphic indices along the primary landslide axes. (a) Longitudinal profile ERT1 of the active-layer detachment and (b) longitudinal profile ERT4 of the freeze–thaw-induced shallow creep landslide, illustrating the coupled relationships among multi-temporal InSAR-derived line-of-sight deformation rates (blue line), electrical resistivity values at a 5 m depth (red line), and the UAV-derived green leaf index (green line). The shaded envelopes indicate the local 10th–90th percentile range calculated within a 30 m moving window along each profile.
Surface disturbance may further amplify these spatial differences in deformation dynamics. Within the upslope and central sectors of the ALD complex, widespread tensile cracking, denudation of the organic turf mat, and the exposure of the underlying grayish-brown mineral substrate—substantiated by both in situ field observations and corresponding negative or near-zero GLI values—severely impair the thermal buffering capacity inherently provided by pristine vegetation and organic overburdens [36]. This denudation enhances ground heat absorption and water infiltration, thereby promoting active-layer deepening and localized thawing. Previous studies have emphasized that vegetation and organic layers play a critical role in thermal insulation. Disturbance to surface vegetation fundamentally alters the surface energy balance, leading to active-layer thickening and permafrost degradation [37]. Therefore, turf-mat disturbance in the upslope and central sectors is not only a surface expression of ALD deformation, but actively intensifies the thermal disturbance to the underlying permafrost. This initiates a positive thermal feedback loop wherein surface denudation, enhanced downward heat flux, and hydro-mechanical thaw weakening mutually accelerate slope failure [38]. In contrast, the lower-elevation frontal accumulation zone is mainly characterized by imbricated, displaced turf blocks and local compressional deformation. Although discrete cracks characterized by near-zero GLI values occur between individual turf blocks, this zone is characterized by an absence of extensive turf denudation or widespread exposure of the mineral substrate, with GLI values across the majority of the area hovering around 0.4. This relatively continuous vegetation canopy and thickened turf blocks continue to offer substantial thermal insulation, thereby attenuating direct thermal disturbance to the underlying permafrost [39]. The correlation analysis provides quantitative support for this interpretation. Along the longitudinal transect of the ALD, the surface deformation rate exhibits a strong, statistically significant inverse correlation with the green leaf index (Pearson r = −0.71, p < 0.001). This coupled relationship demonstrates that the most kinetically active sectors of the landslide slope systematically coincide with zones of severe vegetation degradation or disrupted turf cover. The ERT results indicate that permafrost remains in the frontal accumulation zone. Although its resistivity is lower than that in the upslope and central sectors, the frozen layer can still be locally continuous or semi-continuous even under lower-elevation conditions. Consistently, the InSAR results show that LOS deformation rates in the frontal accumulation zone are much lower than those in the upslope detachment and central depletion–transport zones. These observations suggest that, near the permafrost margin, the degree of permafrost continuity and the integrity of the surface insulation layer exert an overriding control on the spatial distribution of ALD surface deformation.
4.2. Enhanced Deformation at the Permafrost Margin in the Freeze–Thaw-Induced Shallow Creep Landslide
Compared with the ALD, the freeze–thaw-induced shallow creep landslide exhibits distinct surface kinematic profiles and subsurface hydro-geophysical configurations. The upper part of the landslide is mainly characterized by chronic downslope viscoelastic creep of the alpine meadow turf, local accumulation, and compressional deformation. This sector also corresponds to the highest LOS deformation rates derived from InSAR. To further examine the spatial coupling between surface deformation and the near-surface cryotic architecture, resistivity values at a 5 m depth along ERT4 were extracted and compared with the corresponding InSAR-derived LOS deformation rates (as shown in Figure 10). The joint profile demonstrates that the maximum strain acceleration occurs in the upper part of the landslide, between the 0 and 48 m electrodes, where LOS deformation rates range from −30.76 to −33.58 mm/year. This sector also exhibits the highest resistivity values along the profile, with a maximum resistivity of 632.20 Ω m at 5 m depth and a peak resistivity of 812 Ω m at greater depth. However, compared with the ALD, these peak resistivity values remain relatively low and close to the lower threshold for frozen ground interpretation, indicating that the permafrost layer in this area is likely weakly preserved, near-isothermal, and thermally marginal. The enhanced deformation in this upper sector may be attributed to the hydro-mechanical destabilization under a degrading permafrost near the permafrost margin [20]. Where an underlying frozen layer acts as an impermeable aquiclude, snowmelt, rainfall infiltration, and shallow groundwater converge preferentially at the supra-permafrost boundary or within the near-surface thawed matrix. This can increase pore-water pressure, reduce effective stress, and lower soil shear strength, thereby promoting instability of the overlying sediments [10,40]. Although the permafrost body itself may retain a certain degree of stiffness and resistance to deformation, its margins are more likely to develop thaw-transition zones and water-rich weak layers. In Arctic Alaska and the Seward Peninsula, InSAR and field observations further indicate that active-layer displacement and shallow soil movement are strongly influenced by freeze–thaw state, transient water storage, vegetation and soil cohesion, drainage convergence, and ground-ice distribution [41,42]. Seasonal InSAR studies in Svalbard and on the QTP similarly demonstrate that thaw subsidence and creep-like deformation vary with the timing of active-layer thaw and local ground thermal conditions [43]. Pervasive seasonal freeze–thaw cycles can further induce expansion, contraction, and structural fabric disruption of shallow soils, while nival meltwater or meteoric inputs amplify the soil moisture content [44]. Together, these processes favor slow, shallow creep of the meadow mat and near-surface materials. The disruption of permafrost continuity, expansion of thawed zones, and development of shallow low-resistivity layers collectively influence near-surface moisture conditions, freeze–thaw frequency, and the physical–mechanical properties of the soil. These changes attenuate global slope stability and elucidate why the peak kinematic activity is concentrated in the upper permafrost-margin sector rather than being uniformly distributed across the landslide [2,18].
Along the downslope altitudinal gradient, the study area gradually transitions from a discontinuous or sporadic permafrost regime to seasonally frozen ground. Along ERT4, two pronounced decreases in resistivity occur at approximately 50–58 m and 64–70 m, where resistivity at 5 m depth drops to around 180 Ω m. These decreases correspond to a marked reduction in surface deformation. Further downslope, resistivity at 5 m depth gradually decreases to approximately 140 Ω m and becomes relatively stable, while LOS deformation rates also decline to their lowest values. Although the lower seasonally frozen ground sector contains shallow low-resistivity materials and localized creep-related meadow-mat accumulation, its LOS deformation rates are much lower than those in the upper permafrost-margin sector. This contrast suggests that the disappearance of permafrost changes the hydrological and mechanical behavior of the shallow slope materials. Once permafrost is largely absent, the slope no longer receives sustained water input associated with thawing permafrost, and it also lacks the persistent frozen boundary that can act as a low-permeability barrier. After short-lived seasonal snow and ice melt in early spring, shallow soil water may drain rapidly downward or laterally through preferential drainage pathways, followed by dewatering and consolidation. This process can restore effective shear resistance in the shallow soil layer [45]. In addition, without a residual frozen layer, the prolonged maintenance of excess pore-water pressure is precluded because water can more readily drain downward or laterally. As a result, freeze–thaw-induced shallow creep can still occur in the lower seasonally frozen ground sector, but its deformation intensity is significantly weaker than within the upper permafrost-margin sector. In summary, the peak kinematic displacement of the freeze–thaw-induced shallow creep landslide is concentrated in the upper permafrost-margin sector rather than in the lower seasonally frozen ground sector. This indicates that the permafrost degradation margin may represent a deformation-sensitive zone for thaw-related shallow slope movement. In this zone, permafrost has not completely disappeared, but its continuity and thermal stability have already been substantially reduced. Residual frozen bodies, low-resistivity thawed zones, and water-rich shallow materials jointly create hydro-thermo-mechanically unstable conditions, promoting slow creep of the alpine meadow mat and local accumulation.
4.3. Uncertainties and Limitations
Although the integrated ERT–InSAR framework provides useful constraints on the spatial association between subsurface hydrothermal heterogeneity and surface deformation, several methodological limitations should be explicitly acknowledged. First, ERT delineates the distribution of bulk electrical resistivity rather than directly measuring in situ ground temperature or ice content. In permafrost landscapes, resistivity is strongly governed by temperature and the phase state of pore water, but it is also affected by grain-size distribution, porosity, degree of saturation, mineral composition, pore-water conductivity, and the presence of coarse blocky materials [21,46,47]. Therefore, high-resistivity anomalies should be interpreted as probable frozen or ice-rich bodies only when supported by geomorphic setting, elevation, and spatial continuity, whereas low-resistivity anomalies may indicate unfrozen, water-rich, fine-grained, or more conductive materials. The resistivity interpretation in this study was guided by preliminary borehole temperature and ERT observations from nearby monitoring sites located adjacent to the freeze–thaw-induced shallow creep landslide within identical permafrost-margin conditions. This local calibration enhances the robustness of the ERT interpretation. However, because the calibration site is not strictly co-located with all ERT profiles, the ERT-derived frozen ground structure in this study should be regarded as a semi-quantitative hydrothermal interpretation rather than a direct measurement of permafrost temperature or volumetric ice content. In addition, uncertainties are also associated with the ERT inversion procedure. The apparent resistivity data were inverted using a smoothness-constrained least-squares algorithm in RES2DINV, and robust inversion was additionally performed as a sensitivity test. Although both inversion schemes produced broadly similar resistivity patterns, ERT inversion remains a non-unique and regularization-dependent problem [48]. Moreover, model sensitivity generally decreases with depth and toward profile margins; therefore, the lower boundaries of resistive bodies and deeper conductive zones should be interpreted more cautiously than the shallow and middle portions of the sections [31]. In this study, the main interpretation therefore emphasizes first-order spatial patterns and relative contrasts among frozen, thawed, and water-rich zones, rather than exact permafrost boundaries or absolute ice content estimates.
The InSAR results also contain several sources of uncertainty. Sentinel-1 InSAR measures displacement only along the satellite’s line of sight and, therefore, cannot independently resolve vertical subsidence, horizontal downslope motion, and local rotational deformation [49]. In alpine permafrost terrain, atmospheric delay, seasonal snow cover, vegetation dynamics, freeze–thaw-related decorrelation, phase-unwrapping uncertainty, reference-area selection, and spatial averaging at the radar-pixel scale may further affect the retrieved velocity field [50]. For this reason, the LOS deformation rates in this study are interpreted as relative indicators of spatial deformation intensity rather than complete three-dimensional displacement vectors. A further limitation arises from the different temporal scales of the datasets. The InSAR velocities represent multi-year average deformation over 2015–2025, whereas the ERT and UAV surveys were conducted during a single thaw season in 2025. Future work should combine repeated ERT surveys, borehole temperature monitoring, active-layer probing, soil-moisture and pore-pressure measurements, multi-geometry InSAR, and repeated UAV topographic surveys to better constrain the seasonal and interannual hydro-thermal-mechanical evolution of permafrost-margin slope deformation.
5. Conclusions
This study systematically investigated the structural and kinematic behaviors of two representative freeze–thaw-related landslides in the alpine permafrost region of the western Qilian Mountains using an integrated framework combining UAV photogrammetry, ERT, and Sentinel-1 multi-temporal InSAR interferometry. The investigated landslides represent contrasting geomorphic responses to permafrost degradation along an elevation-dependent permafrost transition zone. The ALD developed within degraded permafrost characterized by alternating discontinuous permafrost bodies and localized taliks, while the freeze–thaw-induced shallow creep landslide occurred near the lower limit of permafrost. ERT results revealed pronounced spatial heterogeneity in the subsurface permafrost architecture, while InSAR datasets demonstrated that peak surface deformation preferentially concentrated within localized taliks. In the ALD, deformation was concentrated in the upslope detachment zone and the central depletion–transport zone, where conductive talik pathways and exposed mineral soil were widespread. In contrast, the freeze–thaw-induced shallow creep landslide exhibited accelerated kinematic displacement within the upper permafrost-margin sector, where the permafrost body likely impeded drainage and promoted shallow water accumulation, whereas deformation weakened significantly downslope in the seasonally frozen ground sector. These results indicate that permafrost continuity, localized taliks, and shallow hydrological conditions jointly control the spatial variability of freeze–thaw-related slope deformation, underscoring that the permafrost degradation margin acts as a highly sensitive kinematic hotspot for thaw-induced slope instability under ongoing climate warming.
Nevertheless, several limitations remain in this study. The investigation was based on two representative landslides and relied primarily on ERT and InSAR observations, without long-term in situ hydrothermal monitoring. Consequently, the seasonal evolution of pore-water pressure, active-layer thickness, and subsurface thermal conditions could not be directly quantified. In addition, although ERT effectively revealed the spatial distribution of frozen and thawed materials, uncertainties remain regarding the precise ice content and thermal state of the subsurface layers. Future research should therefore combine long-term ground temperature monitoring, hydrological observations, borehole investigations, and repeated geophysical surveys to better constrain the coupled hydro-thermal–mechanical processes governing thaw-related slope deformation. Expanded UAV and InSAR monitoring across broader elevation gradients in the Qilian Mountains would further improve our understanding of how permafrost degradation controls the spatial evolution of alpine freeze–thaw-induced landslides under continued climate warming.
Author Contributions
Conceptualization, Y.Z.; methodology, Y.Z., J.M., W.S. and X.Z.; investigation, Y.Z., J.M., W.S. and X.Z.; writing—original draft, Y.Z. and J.M.; writing—review and editing, J.C. and X.Z.; data curation, J.M. and W.S.; funding acquisition, Y.Z.; project administration, J.C.; supervision, J.C. All authors have read and agreed to the published version of the manuscript.
Funding
This work was financially supported by the National Natural Science Foundation of China (Grant No. U23A2013), the Fujian Provincial Natural Science Foundation of China (Grant No. 2025J08223), the Educational Research Program for Young and Middle-aged Teachers in Fujian Province (JZ230034), and the Research and Development Fund Program of Fujian University of Technology (GY-Z23026).
Institutional Review Board Statement
Not applicable.
Informed Consent Statement
Not applicable.
Data Availability Statement
The original contributions presented in the study are included in the article.
Acknowledgments
The authors would like to sincerely thank the editors and three anonymous reviewers for their rigorous, constructive, and inspiring suggestions.
Conflicts of Interest
The authors declare no conflicts of interest.
References
- Walvoord, M.A.; Kurylyk, B.L. Hydrologic Impacts of Thawing Permafrost—A Review. Vadose Zone J. 2016, 15, 1–20. [Google Scholar] [CrossRef] [Scilit]
- Gruber, S.; Haeberli, W. Permafrost in Steep Bedrock Slopes and Its Temperature-Related Destabilization Following Climate Change. J. Geophys. Res. Earth Surf. 2007, 112, F02S18. [Google Scholar] [CrossRef] [Scilit]
- Jin, H.; Vandenberghe, J.; Luo, D.; Harris, S.A.; He, R.; Chen, X.; Jin, X.; Wang, Q.; Zhang, Z.; Spektor, V.; et al. Quaternary Permafrost in China: Framework and Discussions. Quaternary 2020, 3, 32. [Google Scholar] [CrossRef] [Scilit]
- Jin, H.; Li, S.; Cheng, G.; Wang, S.; Li, X. Permafrost and Climatic Change in China. Glob. Planet. Chang. 2000, 26, 387–404. [Google Scholar] [CrossRef] [Scilit]
- Zhang, G.; Nan, Z.; Hu, N.; Yin, Z.; Zhao, L.; Cheng, G.; Mu, C. Qinghai-Tibet Plateau Permafrost at Risk in the Late 21st Century. Earth’s Future 2022, 10, e2022EF002652. [Google Scholar] [CrossRef] [Scilit]
- Kokelj, S.V.; Jorgenson, M.T. Advances in Thermokarst Research. Permafr. Periglac. Process. 2013, 24, 108–119. [Google Scholar] [CrossRef] [Scilit]
- Lantuit, H.; Pollard, W.H. Fifty Years of Coastal Erosion and Retrogressive Thaw Slump Activity on Herschel Island, Southern Beaufort Sea, Yukon Territory, Canada. Geomorphology 2008, 95, 84–102. [Google Scholar] [CrossRef] [Scilit]
- Luo, J.; Niu, F.; Lin, Z.; Liu, M.; Yin, G. Recent Acceleration of Thaw Slumping in Permafrost Terrain of Qinghai-Tibet Plateau: An Example from the Beiluhe Region. Geomorphology 2019, 341, 79–85. [Google Scholar] [CrossRef] [Scilit]
- Lewkowicz, A.G.; Harris, C. Frequency and Magnitude of Active-layer Detachment Failures in Discontinuous and Continuous Permafrost, Northern Canada. Permafr. Periglac. Process. 2005, 16, 115–130. [Google Scholar] [CrossRef] [Scilit]
- Lewkowicz, A.G.; Harris, C. Morphology and Geotechnique of Active-Layer Detachment Failures in Discontinuous and Continuous Permafrost, Northern Canada. Geomorphology 2005, 69, 275–297. [Google Scholar] [CrossRef] [Scilit]
- Mu, C.; Shang, J.; Zhang, T.; Fan, C.; Wang, S.; Peng, X.; Zhong, W.; Zhang, F.; Mu, M.; Jia, L. Acceleration of Thaw Slump during 1997–2017 in the Qilian Mountains of the Northern Qinghai-Tibetan Plateau. Landslides 2020, 17, 1051–1062. [Google Scholar] [CrossRef] [Scilit]
- Luo, J.; Niu, F.; Lin, Z.; Liu, M.; Yin, G.; Gao, Z. Inventory and Frequency of Retrogressive Thaw Slumps in Permafrost Region of the Qinghai–Tibet Plateau. Geophys. Res. Lett. 2022, 49, e2022GL099829. [Google Scholar] [CrossRef] [Scilit]
- Nesterova, N.; Leibman, M.; Kizyakov, A.; Lantuit, H.; Tarasevich, I.; Nitze, I.; Veremeeva, A.; Grosse, G. Review Article: Retrogressive Thaw Slump Characteristics and Terminology. Cryosphere 2024, 18, 4787–4810. [Google Scholar] [CrossRef] [Scilit]
- Segal, R.A.; Lantz, T.C.; Kokelj, S.V. Acceleration of Thaw Slump Activity in Glaciated Landscapes of the Western Canadian Arctic. Environ. Res. Lett. 2016, 11, 034025. [Google Scholar] [CrossRef] [Scilit]
- Ward Jones, M.K.; Pollard, W.H.; Jones, B.M. Rapid Initialization of Retrogressive Thaw Slumps in the Canadian High Arctic and Their Response to Climate and Terrain Factors. Environ. Res. Lett. 2019, 14, 055006. [Google Scholar] [CrossRef] [Scilit]
- Jiang, G.; Gao, S.; Lewkowicz, A.G.; Zhao, H.; Pang, S.; Wu, Q. Development of a Rapid Active Layer Detachment Slide in the Fenghuoshan Mountains, Qinghai–Tibet Plateau. Permafr. Periglac. Process. 2022, 33, 298–309. [Google Scholar] [CrossRef] [Scilit]
- Lewkowicz, A.G. Dynamics of Active-Layer Detachment Failures, Fosheim Peninsula, Ellesmere Island, Nunavut, Canada. Permafr. Periglac. Process. 2007, 18, 89–103. [Google Scholar] [CrossRef] [Scilit]
- Hjort, J.; Streletskiy, D.; Doré, G.; Wu, Q.; Bjella, K.; Luoto, M. Impacts of Permafrost Degradation on Infrastructure. Nat. Rev. Earth Environ. 2022, 3, 24–38. [Google Scholar] [CrossRef] [Scilit]
- Chen, J.; Zhang, J.; Wu, T.-H.; Liu, L.; Zhang, F.-Y.; Hao, J.-M.; Huang, L.-C.; Wu, X.-D.; Wang, P.-L.; Xia, Z.-X.; et al. Elevation-Dependent Shift of Landslide Activity in Mountain Permafrost Regions of the Qilian Mountains. Adv. Clim. Change Res. 2024, 15, 1067–1077. [Google Scholar] [CrossRef] [Scilit]
- Hauck, C.; Kneisel, C. Applied Geophysics in Periglacial Environments; Cambridge University Press: Cambridge, UK, 2008. [Google Scholar]
- Mollaret, C.; Hilbich, C.; Pellet, C.; Flores-Orozco, A.; Delaloye, R.; Hauck, C. Mountain Permafrost Degradation Documented through a Network of Permanent Electrical Resistivity Tomography Sites. Cryosphere 2019, 13, 2557–2578. [Google Scholar] [CrossRef] [Scilit]
- Rosset, E.; Hilbich, C.; Schneider, S.; Hauck, C. Automatic Filtering of ERT Monitoring Data in Mountain Permafrost. Near Surf. Geophys. 2013, 11, 423–434. [Google Scholar] [CrossRef] [Scilit]
- Siewert, M.B.; Krautblatter, M.; Christiansen, H.H.; Eckerstorfer, M. Arctic Rockwall Retreat Rates Estimated Using Laboratory-Calibrated ERT Measurements of Talus Cones in Longyeardalen, Svalbard. Earth Surf. Process. Landf. 2012, 37, 1542–1555. [Google Scholar] [CrossRef] [Scilit]
- Barboux, C.; Delaloye, R.; Lambiel, C. Inventorying Slope Movements in an Alpine Environment Using DInSAR. Earth Surf. Process. Landf. 2014, 39, 2087–2099. [Google Scholar] [CrossRef] [Scilit]
- Du, Q.; Chen, D.; Li, G.; Cao, Y.; Zhou, Y.; Chai, M.; Wang, F.; Qi, S.; Wu, G.; Gao, K.; et al. Preliminary Study on InSAR-Based Uplift or Subsidence Monitoring and Stability Evaluation of Ground Surface in the Permafrost Zone of the Qinghai–Tibet Engineering Corridor, China. Remote Sens. 2023, 15, 3728. [Google Scholar] [CrossRef] [Scilit]
- Hu, B.; Wu, Y.; Zhang, X.; Yang, B.; Chen, J.; Li, H.; Chen, X.; Chen, Z. Monitoring the Thaw Slump-Derived Tthermokarst in the Qinghai-Tibet Plateau Using Satellite SAR Interferometry. J. Sens. 2019, 2019, 1698432. [Google Scholar] [CrossRef] [Scilit]
- Tian, H.; Yang, T.; Liu, Q. Climate Change and Glacier Area Shrinkage in the Qilian Mountains, China, from 1956 to 2010. Ann. Glaciol. 2014, 55, 187–197. [Google Scholar] [CrossRef] [Scilit]
- Kneisel, C. Assessment of Subsurface Lithology in Mountain Environments Using 2D Resistivity Imaging. Geomorphology 2006, 80, 32–44. [Google Scholar] [CrossRef] [Scilit]
- Stiegler, C.; Rode, M.; Sass, O.; Otto, J.-C. An Undercooled Scree Slope Detected by Geophysical Investigations in Sporadic Permafrost below 1000 M ASL, Central Austria. Permafr. Periglac. Process. 2014, 25, 194–207. [Google Scholar] [CrossRef] [Scilit]
- Krutskikh, N.; Ryazantsev, P.; Ignashov, P.; Kabonen, A. The Spatial Analysis of Vegetation Cover and Permafrost Degradation for a Subarctic Palsa Mire Based on UAS Photogrammetry and GPR Data in the Kola Peninsula. Remote Sens. 2023, 15, 1896. [Google Scholar] [CrossRef] [Scilit]
- Caterina, D.; Beaujean, J.; Robert, T.; Nguyen, F. A Comparison Study of Different Image Appraisal Tools for Electrical Resistivity Tomography. Near Surf. Geophys. 2013, 11, 639–658. [Google Scholar] [CrossRef] [Scilit]
- Bassine, F.Z.; Errami, A.; Khaldoun, M. Vegetation Recognition Based on UAV Image Color Index. In Proceedings of the 2019 IEEE International Conference on Environment and Electrical Engineering and 2019 IEEE Industrial and Commercial Power Systems Europe (EEEIC/I&CPS Europe); IEEE: New York, NY, USA, 2019; pp. 1–4. [Google Scholar]
- Woo, M. Permafrost Hydrology; Springer: Berlin/Heidelberg, Germany, 2012. [Google Scholar]
- Harris, C.; Lewkowicz, A.G. An Analysis of the Stability of Thawing Slopes, Ellesmere Island, Nunavut, Canada. Can. Geotech. J. 2000, 37, 449–462. [Google Scholar] [CrossRef] [Scilit]
- Swanson, D.K. Permafrost Thaw-related Slope Failures in Alaska’s Arctic National Parks, c. 1980–2019. Permafr. Periglac. Process. 2021, 32, 392–406. [Google Scholar] [CrossRef] [Scilit]
- Shur, Y.L.; Jorgenson, M.T. Patterns of Permafrost Formation and Degradation in Relation to Climate and Ecosystems. Permafr. Periglac. Process. 2007, 18, 7–19. [Google Scholar] [CrossRef] [Scilit]
- Burn, C.R. The Response (1958–1997) of Permafrost and near-Surface Ground Temperatures to Forest Fire, Takhini River Valley, Southern Yukon Territory. Can. J. Earth Sci. 1998, 35, 184–199. [Google Scholar] [CrossRef]
- Li, Y.; Liu, Y.; Chen, J.; Dang, H.; Zhang, S.; Mei, Q.; Zhao, J.; Wang, J.; Dong, T.; Zhao, Y. Advances in Retrogressive Thaw Slump Research in Permafrost Regions. Permafr. Periglac. Process. 2024, 35, 125–142. [Google Scholar] [CrossRef] [Scilit]
- Jorgenson, M.T.; Romanovsky, V.; Harden, J.; Shur, Y.; O’Donnell, J.; Schuur, E.A.G.; Kanevskiy, M.; Marchenko, S. Resilience and Vulnerability of Permafrost to Climate changeThis Article Is One of a Selection of Papers from The Dynamics of Change in Alaska’s Boreal Forests: Resilience and Vulnerability in Response to Climate Warming. Can. J. For. Res. 2010, 40, 1219–1236. [Google Scholar] [CrossRef] [Scilit]
- Vandenberghe, J.; Czudek, T. Pleistocene Cryopediments on Variable Terrain. Permafr. Periglac. Process. 2008, 19, 71–83. [Google Scholar] [CrossRef] [Scilit]
- Chen, J.; Wu, Y.; O’Connor, M.; Cardenas, M.B.; Schaefer, K.; Michaelides, R.; Kling, G. Active Layer Freeze-Thaw and Water Storage Dynamics in Permafrost Environments Inferred from InSAR. Remote Sens. Environ. 2020, 248, 112007. [Google Scholar] [CrossRef] [Scilit]
- Del Vecchio, J.; Lathrop, E.R.; Dann, J.B.; Andresen, C.G.; Collins, A.D.; Fratkin, M.M.; Zwieback, S.; Glade, R.C.; Rowland, J.C. Patterns and Rates of Soil Movement and Shallow Failures across Several Small Watersheds on the Seward Peninsula, Alaska. Earth Surf. Dyn. 2023, 11, 227–245. [Google Scholar] [CrossRef] [Scilit]
- Rouyet, L.; Liu, L.; Strand, S.M.; Christiansen, H.H.; Lauknes, T.R.; Larsen, Y. Seasonal InSAR Displacements Documenting the Active Layer Freeze and Thaw Progression in Central-Western Spitsbergen, Svalbard. Remote Sens. 2021, 13, 2977. [Google Scholar] [CrossRef] [Scilit]
- Li, T.; Zhang, L.; Gong, W.; Tang, H.; Jiang, R. Initiation Mechanism of Landslides in Cold Regions: Role of Freeze-Thaw Cycles. Int. J. Rock Mech. Min. Sci. 2024, 183, 105906. [Google Scholar] [CrossRef] [Scilit]
- Harris, C.; Kern-Luetschg, M.; Smith, F.; Isaksen, K. Solifluction Processes in an Area of Seasonal Ground Freezing, Dovrefjell, Norway. Permafr. Periglac. Process. 2008, 19, 31–47. [Google Scholar] [CrossRef] [Scilit]
- Herring, T.; Lewkowicz, A.G.; Hauck, C.; Hilbich, C.; Mollaret, C.; Oldenborger, G.A.; Uhlemann, S.; Farzamian, M.; Calmels, F.; Scandroglio, R. Best Practices for Using Electrical Resistivity Tomography to Investigate Permafrost. Permafr. Periglac. Process. 2023, 34, 494–512. [Google Scholar] [CrossRef] [Scilit]
- Wagner, F.M.; Mollaret, C.; Günther, T.; Kemna, A.; Hauck, C. Quantitative Imaging of Water, Ice and Air in Permafrost Systems through Petrophysical Joint Inversion of Seismic Refraction and Electrical Resistivity Data. Geophys. J. Int. 2019, 219, 1866–1875. [Google Scholar] [CrossRef] [Scilit]
- Loke, M.H.; Acworth, I.; Dahlin, T. A Comparison of Smooth and Blocky Inversion Methods in 2D Electrical Imaging Surveys. Explor. Geophys. 2003, 34, 182–187. [Google Scholar] [CrossRef] [Scilit]
- Hu, J.-J.; Li, Z.; Ding, X.; Zhu, J.J.; Zhang, L.; Sun, Q. Resolving Three-Dimensional Surface Displacements from InSAR Measurements: A Review. Earth-Sci. Rev. 2014, 133, 1–17. [Google Scholar] [CrossRef] [Scilit]
- Jolivet, R.; Agram, P.S.; Lin, N.Y.; Simons, M.; Doin, M.-P.; Peltzer, G.; Li, Z. Improving InSAR Geodesy Using Global Atmospheric Models. J. Geophys. Res. Solid Earth 2014, 119, 2324–2341. [Google Scholar] [CrossRef] [Scilit]
Disclaimer/Publisher’s Note: The statements, opinions and data contained in all publications are solely those of the individual author(s) and contributor(s) and not of MDPI and/or the editor(s). MDPI and/or the editor(s) disclaim responsibility for any injury to people or property resulting from any ideas, methods, instructions or products referred to in the content. |
© 2026 by the authors. Licensee MDPI, Basel, Switzerland. This article is an open access article distributed under the terms and conditions of the Creative Commons Attribution (CC BY) license.