


Abstract
The transition to Cyber–Physical Production Systems (CPPS) requires reliable real-time identification of material flows, yet RFID performance in metal-rich industrial environments remains sensitive to hardware configuration and tag orientation. This study aims to support RFID-based material-flow management in automotive inbound logistics by identifying a suitable UHF RFID configuration for cable harness containers. A structured experimental configuration-screening procedure based on Design of Experiments (DoE) principles was applied to evaluate three controllable factors: antenna type, RFID transponder type, and transponder orientation. The number of cable harnesses in the container was treated as an uncontrollable factor reflecting operational variability. The experiment included 1500 screening measurements, followed by 4000 validation measurements for the two best-performing transponder configurations. The results indicated that a linearly polarized antenna, outward transponder orientation, and the AD 232 UHF transponder provided the most reliable configuration among the tested alternatives. In the validation sample, this configuration produced no missed reads across 40,000 reading opportunities, corresponding to an observed sample DPMO of zero and a 6+ σ indication. The findings show that systematic RFID configuration can improve material-flow data reliability and support leaner, more transparent CPPS operations, while long-term reliability should be confirmed through extended industrial monitoring.
1. Introduction
The fourth industrial revolution—commonly referred to as Industry 4.0—has initiated a profound transformation of global manufacturing systems, reshaping how industrial operations integrate digital technologies with physical processes. Within this context, the intersection of Industry 4.0 and sustainability has emerged as a critical domain for achieving the next generation of efficient, transparent, and environmentally responsible production systems [1,2]. As manufacturing industries face increasing pressure to reduce waste, enhance resource efficiency, and minimize carbon footprints, the integration of advanced cyber–physical technologies has become a cornerstone of sustainable supply chain management [3].
Industry 4.0 technologies—particularly the Internet of Things (IoT), artificial intelligence (AI), big data analytics, and Radio Frequency Identification (RFID)—enable continuous, real-time data acquisition and control across complex production networks. These technologies facilitate synergy between operational efficiency and sustainability objectives by providing end-to-end visibility and supporting evidence-based decision-making throughout the value chain [1]. The application of such technologies fosters a circular economy paradigm through enhanced traceability, predictive maintenance, and the reduction in non-value-added activities [2]. In various industrial sectors, from textiles to food manufacturing, studies demonstrate how the integration of IoT, blockchain, and RFID significantly improves supply chain transparency and resource management—key enablers of sustainable industrial practices [4].
However, despite the theoretical advantages of digitalization, the realization of sustainable Industry 4.0 ecosystems remains constrained by multiple barriers. According to [3], challenges such as economic uncertainty, resistance to technological change, and insufficient digital infrastructure hinder the full-scale implementation of Industry 4.0 principles. To overcome these barriers, researchers increasingly emphasize the need for collaborative innovation and strategic partnerships across supply chain actors, as effective cooperation enhances the diffusion of sustainable technologies and facilitates the co-creation of digital value [5]. Furthermore, the literature underscores the necessity of robust frameworks for evaluating the sustainability performance of digitally enhanced supply chains. Ref. [6] proposes a systematic measurement framework for assessing information flows in Industry 4.0 environments, helping companies align technological investments with sustainability metrics and long-term goals.
Within the broader landscape of Industry 4.0 technologies, RFID systems have gained particular prominence due to their potential to automate material identification, streamline logistics operations, and enhance data accuracy in supply chain processes [7,8]. By enabling wireless, non-contact identification of objects, RFID represents a foundational building block for smart manufacturing and Cyber–Physical Production Systems (CPPS)—integrated systems that connect physical material flow with digital information networks in real time [9]. In the automotive industry, where material-flow efficiency and traceability are paramount, RFID technology has been widely recognized as a catalyst for digital transformation. Ref. [9] demonstrated the use of RFID-enabled digital twins for real-time monitoring of intralogistics processes, where automated data collection minimizes manual labor and ensures the seamless flow of materials from suppliers to production lines. Refs. [10,11] show that integrating RFID with manufacturing information systems can substantially improve transport efficiency, inventory accuracy, and overall production reliability.
The sustainability implications of RFID adoption are equally significant. As RFID enhances data accuracy and process transparency, it enables Lean and Just-in-Time (JIT) production strategies that reduce inventory waste, minimize rework, and decrease energy consumption associated with overproduction and excess storage [12,13]. Moreover, when integrated with IoT infrastructures, RFID contributes to closed-loop production systems, supporting lifecycle traceability and reverse logistics as part of circular economy practices [14]. Through real-time monitoring and data synchronization, RFID systems facilitate the measurement of material and energy flows, thus becoming an indispensable tool for sustainable manufacturing operations aligned with Industry 4.0 principles.
Nevertheless, the implementation of RFID systems in industrial environments is not without challenges. Numerous studies have identified reliability issues stemming from environmental interference, electromagnetic reflections, and signal attenuation, especially in metal-rich or high-humidity environments [15,16]. These factors can cause inconsistent transponder readability and data gaps, undermining the reliability of automated identification systems. Additional challenges include the need for robust infrastructure, cross-system interoperability, and skilled personnel capable of managing RFID-based data networks [17,18]. In many cases, organizations also face uncertainty regarding the return on investment (ROI) of RFID deployments, as the benefits in terms of error reduction and sustainability are difficult to quantify without rigorous experimental validation [13]. Consequently, while RFID is widely recognized as an enabler of smart manufacturing, its real-world reliability and sustainability performance remain underexplored in empirical industrial research.
Given these challenges, systematic and data-driven methodologies are required to evaluate and optimize RFID performance within complex production environments. As the authors of [19] note, successful implementation depends on addressing both technical and organizational barriers through structured experimentation and continuous improvement frameworks. To this end, the Design of Experiments (DoE) approach provides a scientifically grounded method for identifying key factors that influence RFID system reliability, allowing researchers to optimize system configuration for specific operational conditions. While previous studies have proposed conceptual models and case studies of RFID integration in Industry 4.0 contexts, fewer studies have applied structured experimental procedures to compare hardware and configuration parameters affecting RFID reading reliability under application-specific industrial conditions.
In this context, the present study contributes to the literature on sustainable manufacturing and CPPS by applying a structured experimental configuration-screening procedure based on Design of Experiments (DoE) principles to a UHF RFID system for inbound material-flow management in the automotive industry. The study focuses on experimentally identifying the configuration factors that affect RFID reading reliability, namely antenna type, transponder type, and transponder orientation, under laboratory conditions designed to reflect the selected industrial application.
The purpose of the study is not to provide a universal RFID solution for all production environments, but to demonstrate how systematic configuration testing can reduce technological uncertainty before RFID deployment in a specific material-flow setting. In this respect, the research links an engineering implementation problem with the broader CPPS requirement for reliable, real-time material-flow data. Improved RFID data reliability can support leaner and more transparent production logistics, particularly by reducing the need for manual barcode scanning and by improving the availability of material-flow information for enterprise systems.
The primary objective of this study was to experimentally investigate and select a reliable RFID configuration for inbound cable harness logistics in a CPPS-oriented automotive environment. Specifically, the study examined the effects of antenna type, RFID transponder type, and transponder orientation on reading reliability, while treating the number of cable harnesses in the container as an operationally variable factor. The selected configuration was subsequently validated on an additional sample to assess its observed reliability under the defined test conditions.
The research area specification arose from a direct industrial requirement focused on replacing conventional barcode-based identification with an RFID-based solution for material-flow monitoring. To address this issue, the experimental procedure was used to identify the most suitable combination of the tested hardware and orientation parameters, while the interpretation of the reliability results was limited to the tested configuration and validation sample.
2. Materials and Methods
The methodology employed in this study is centered on a structured experimental configuration-screening procedure based on Design of Experiments (DoE) principles. The aim was to compare selected combinations of RFID hardware and transponder orientation in order to identify a configuration suitable for reliable inbound material-flow identification in the tested application. This section describes the experimental architecture, component selection, measurement procedure, and reliability assessment used to evaluate the impact of the selected factors on RFID reading performance. The practical aim was to support the transition from manual barcode-based identification to an automated RFID-based solution with improved observed reliability.
2.1. Experimental Design for RFID System Implementation in Production Material Flow
The reliability and speed of component identification within the material flow are considered significant attributes of a modern, flexible manufacturing structure. This section describes the testing, selection, and configuration of a suitable RFID system for the receiving area of cable harnesses in the automotive sector. For this purpose, experiments were designed to identify both positive and negative factors affecting the correct identification of monitored incoming components based on specific system configurations, and to determine the optimal combination of factors to achieve maximum reading system reliability. The selection of experiment parameters was chosen based on the Design of Experiments (DoE) method. The results clearly demonstrated the justification for using this method, which successfully configured the system for material-flow element identification.
The experimental measurements were conducted in the laboratory environment of the Identification Technologies Laboratory at the Faculty of Manufacturing Technologies at the Technical University of Košice, located in Prešov, Slovakia. The experiment design concept involved thorough preparation, creating an appropriate experiment architecture that realistically reflected practical conditions, including the influence of the environment on the RFID system, and generating the necessary data for execution and evaluation. The measurement procedure followed these steps:
- Determination of experimental outputs.
- System adaptation of conditions and establishment of the experimental procedure.
- Execution of the experiment.
- Analysis of experimental output data.
2.2. Determination of Experimental Inputs
As mentioned above, the experimental part took place in the Laboratory of Identification Technologies. The experiment’s objective was to find a suitable RFID system configuration for the inbound identification of cable harnesses, with a focus on achieving the highest possible reading success rate. A total of 5500 measurements were performed: 1500 measurements were conducted within the DoE framework, and 4000 measurements were performed to verify the reliability of the configurations identified as optimal by the DoE.
The most critical element in RFID systems is the correct spatial transport of data information. Electromagnetic energy emitted by the antenna can be absorbed, reflected, or subjected to interference within the space. The propagation of electromagnetic energy is influenced by the materials present in the environment, the material on which the RFID transponder is applied, the chosen RFID system frequency, the system power, and, naturally, the distance, placement, and type of RFID transponder and antenna. All these factors simultaneously affect the cooperation between the transponder and the reader during a given reading period.
For correct testing and verification of the RFID system’s functionality, it was necessary to find the most suitable configuration among the available components. The primary criterion was cost, and thus the selection of components was budget-conscious, given the nature of mass production (although it is assumed that the costs of tagging individual items in the material flow would be shared across the entire supply chain).
The fundamental elements subjected to testing were:
- Alien ALR-8697 Circularly Polarized Antenna, Alien Technology LLC (Morgan Hill, CA, USA);
- Gaben UHF LP RFID Antenna, GABEN, spol. s r.o. (Ostrava, Czech Republic);
- RFID INLAY AD 814 UHF 22 × 22 mm, EPC, MONZA 3, WET, Avery Dennison RFID (Flowery Branch, GA, USA);
- RFID INLAY UHF Wet Mini Web NXP G2iL 43 × 21 mm, SMARTRAC N.V. (Amsterdam, The Netherlands);
- RFID INLAY AD 227M5 UHF 95 × 8 mm, EPC, MONZA 5, WET, Avery Dennison RFID (Flowery Branch, GA, USA);
- RFID INLAY AD 232 UHF 18 × 75 mm, EPC, NXP G2iL, WET, Avery Dennison RFID (Flowery Branch, GA, USA);
- ALIEN SQUIGGLE RFID WHITE WET INLAY (ALN-9740, HIGGS-4), Alien Technology LLC (Morgan Hill, CA, USA).
2.3. System Adaptation of Conditions and Experiment Procedure
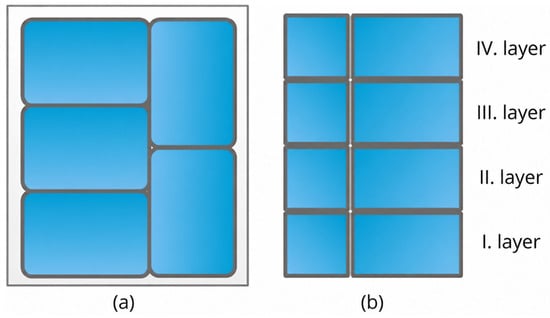
To simulate the selected industrial conditions in a controlled and repeatable laboratory setting, the experiment architecture was constructed based on practical requirements from inbound cable harness logistics. Cable harnesses intended for vehicle assembly were used for the experiment. These cable harnesses were placed in KLT transport containers, arranged according to the operational layout: five containers per layer, with each container holding 2 to 10 cable harnesses, depending on the specifications of the assembly operation.
In the real production scenario, cable harnesses are typically stocked on pallets with eight layers of containers. In the laboratory setup, the stack height was reduced to four layers due to spatial and equipment constraints, resulting in one tested transport batch of 20 containers. This simplification was introduced to create a stable and repeatable experimental arrangement for comparing RFID configurations. The aim of this laboratory arrangement was therefore not to reproduce the full pallet geometry in all respects, but to provide a controlled screening environment in which the effects of antenna type, transponder type, transponder orientation, and container filling could be compared under consistent conditions.
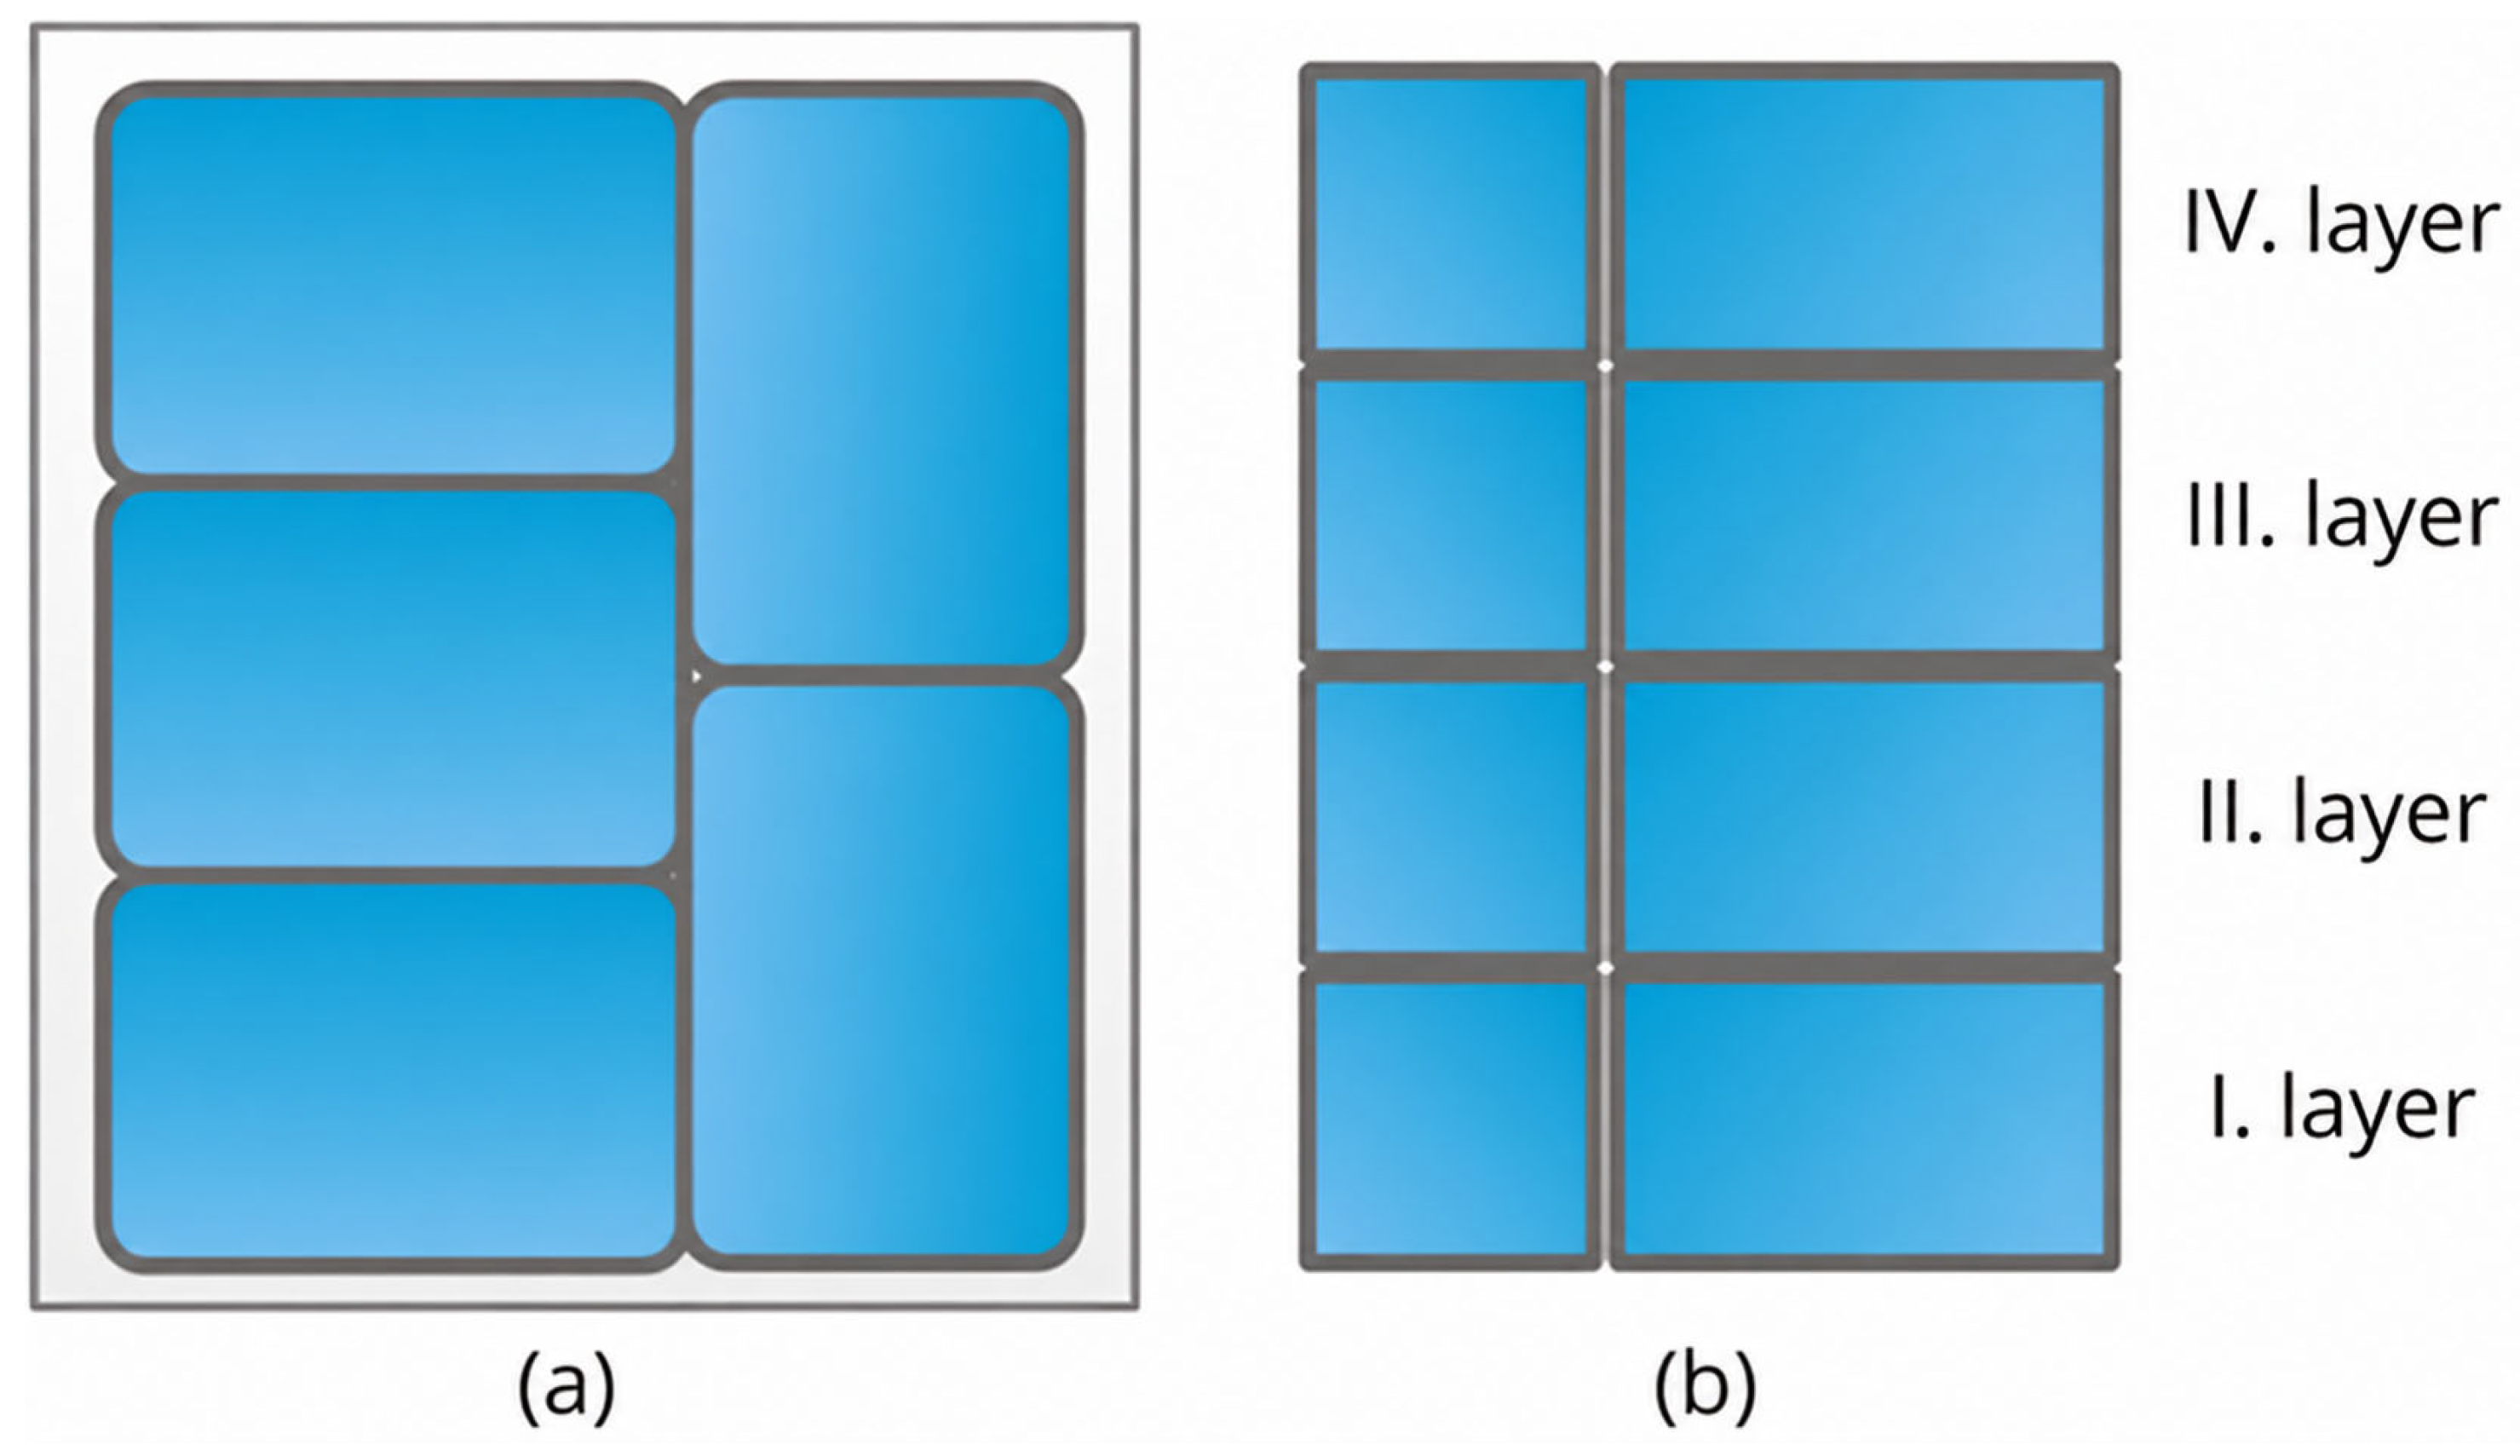
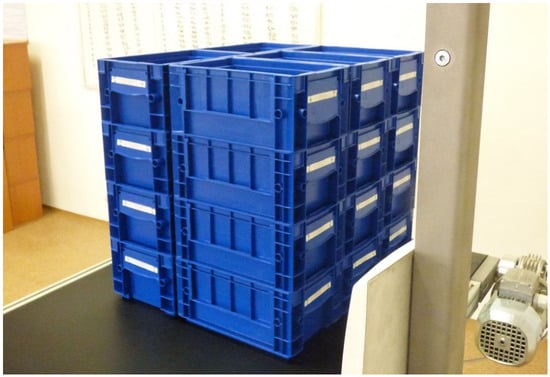
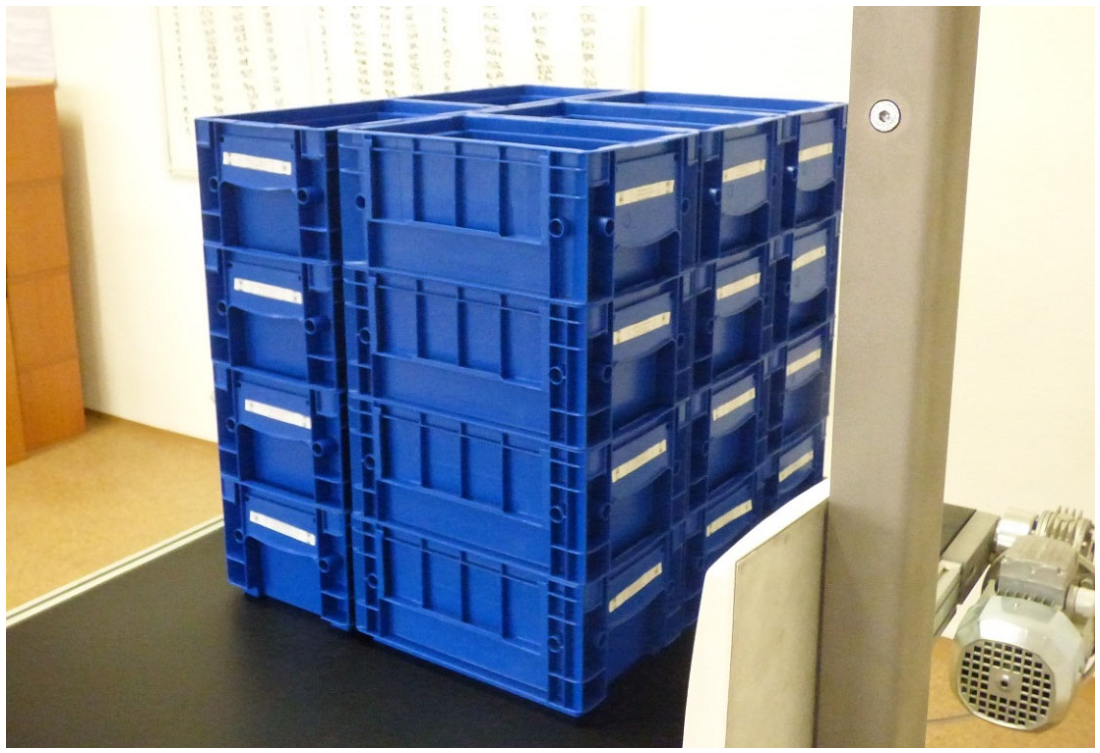
The reduction from eight to four layers may influence RFID reading performance, particularly because a higher stack can change signal propagation, shielding, reflection, and tag visibility. For this reason, the conclusions drawn from the laboratory experiment are interpreted primarily for the tested four-layer configuration and for similar material-flow conditions. The selected configuration should therefore be understood as the best-performing alternative within the tested setup, while full-scale operational validation remains necessary when the system is applied to eight-layer pallets or other pallet geometries. The illustration of the container arrangement is presented in Figure 1. A representative photograph of the four-layer KLT container arrangement used in the laboratory setup is shown in Figure 2.
Figure 1.
Illustration of container arrangement: (a) top view; (b) side view.
Figure 2.
Four-layer KLT container arrangement used in the experiment.
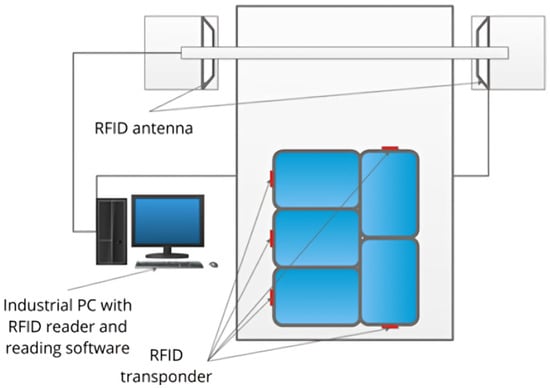
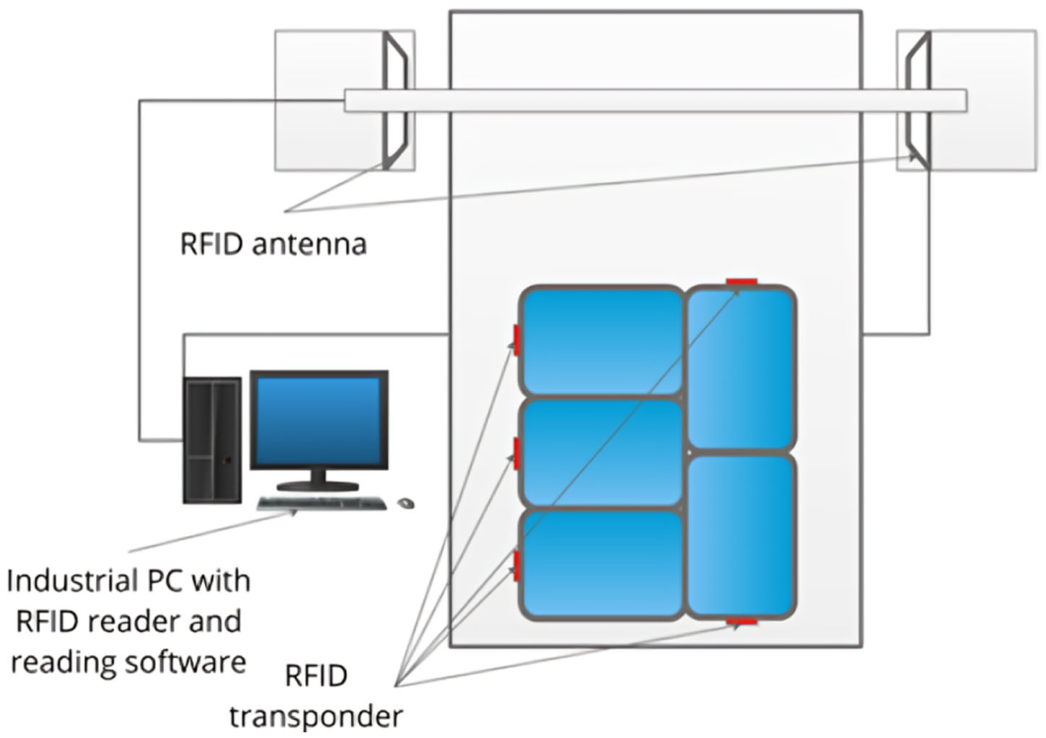
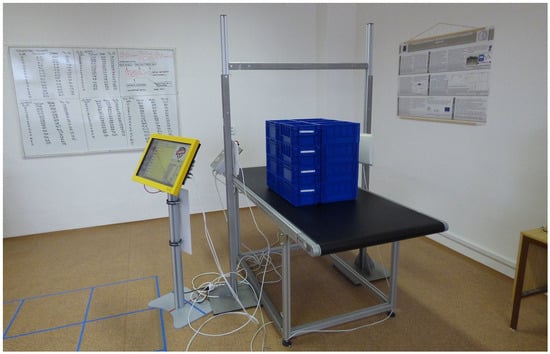
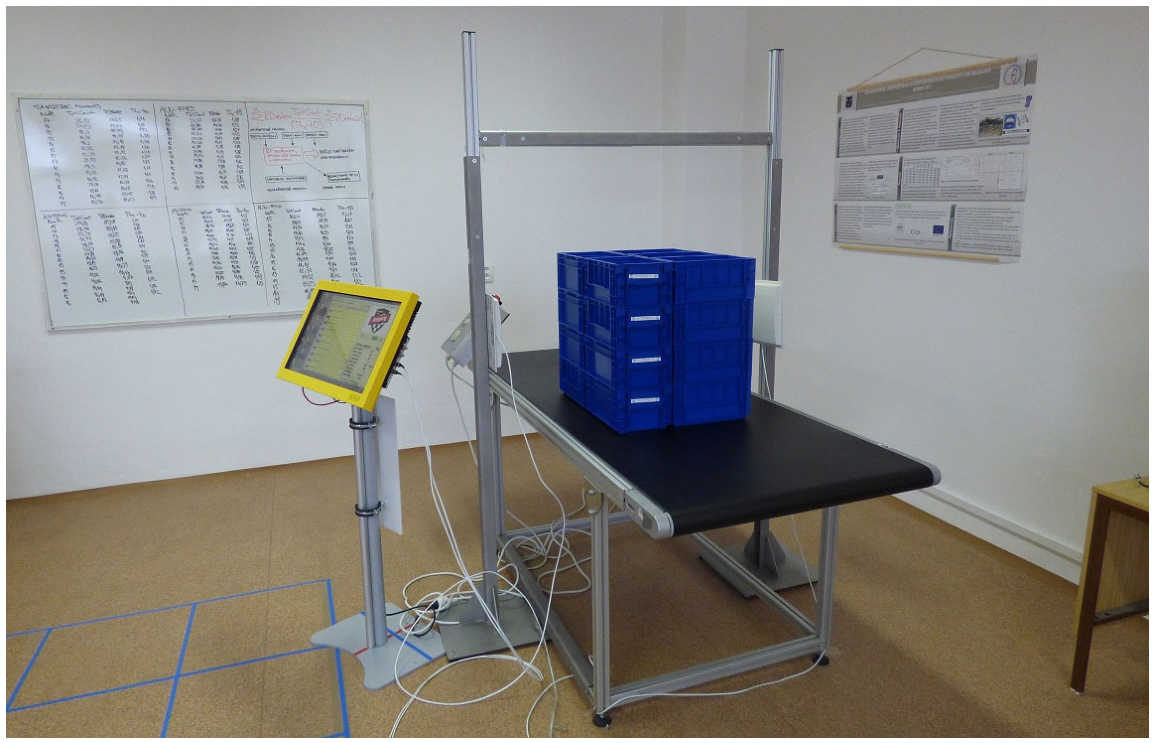
These containers were moved through an RFID gate equipped with two antennas (on the exterior sides), connected to a reader and an industrial PC, where software recorded the number of successful reads. An RFID transponder with a unique EPC code was placed on the front face of each container. The experiment utilized two types of antennas (circularly and linearly polarized), five types of RFID transponders, and two types of transponder orientation (all transponders facing the exterior, or a random orientation where two transponders per layer faced the interior). The layout of the entire experiment is visualized in Figure 3. A representative photograph of the laboratory RFID test setup is shown in Figure 4.
Figure 3.
Layout of the experiment.
Figure 4.
Photograph of the laboratory RFID test setup.
2.4. Experiment Execution
The experiment focused on testing the functionality of the RFID system for inbound cable harness logistics in the automotive sector, with the goal of determining the significant factors that substantially impact the reading functionality of the RFID system. System functionality is primarily affected by the presence of metals, which reflect the propagating electromagnetic waves emitted by the antenna, leading to poor signal reflection. The main objective was to specify the optimal hardware configuration infrastructure of the RFID system from the examined selectable options. To achieve the goal, the Design of Experiments (DoE) method, conceived by Taguchi, was utilized. Due to the uneven number of factors, a complete orthogonal design in line with that conceived by Taguchi could not be implemented.
2.4.1. Static P-Diagram Design
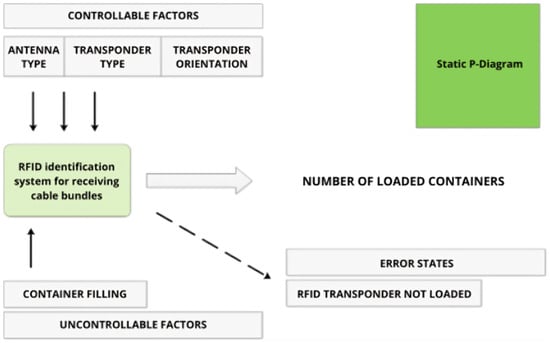
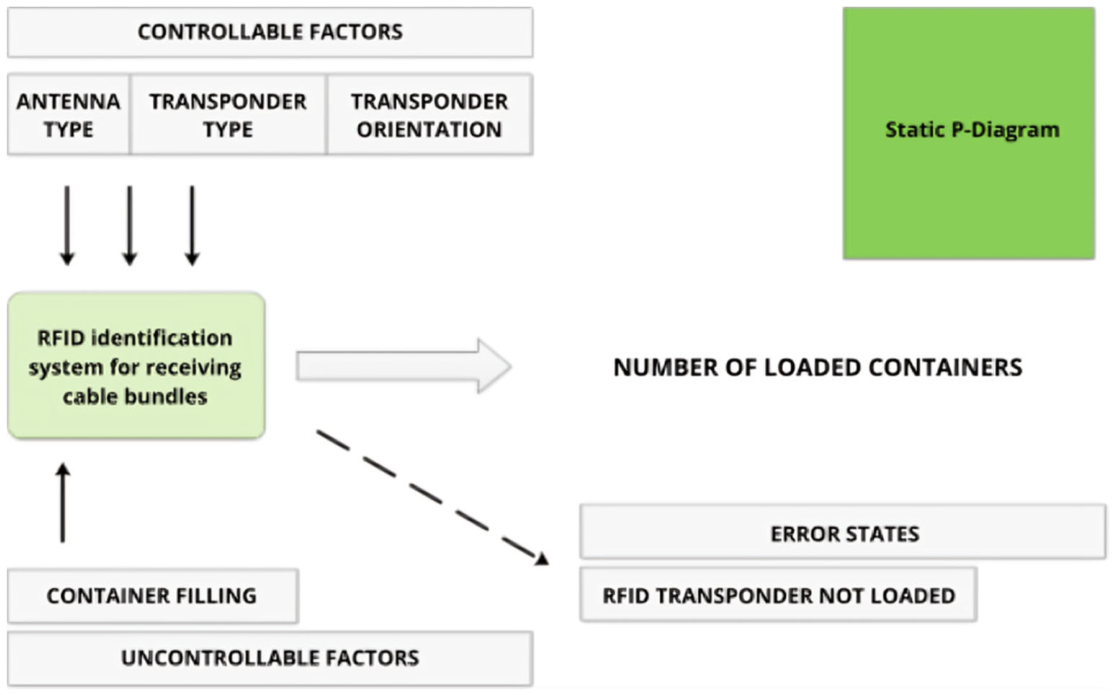
During the design and creation of the static P-Diagram, possible controllable factors were identified: the type of RFID transponder (A), the transponder orientation within the stack of containers (B), and the type of RFID antenna (C). Considering these factors and other relevant circumstances, one uncontrollable factor was ultimately chosen: the number of cable harnesses in the container. This uncontrollable factor was selected because, in real operation, these containers arrive with varied contents, yet with a maximum capacity of 10 pieces, according to vehicle specifications. Three controllable factors that can be adjusted by users were considered in the experiment.
The experimental design was developed based on the static P-Diagram (Figure 5), which graphically and explicitly describes the inputs, controllable factors, and uncontrollable factors that affect the identification process of cable harnesses in the material flow.
Figure 5.
Static P-Diagram of the experiment.
2.4.2. Description of Experimental Equipment
The experimental setup consisted of a belt conveyor moving at a constant speed of v = 0.195 m·s−1, and an RFID gate composed of two RFID antennas (either the circularly polarized Alien ALR-8697 or the linearly polarized Gaben UHF LP). The antennas were positioned on the gate columns at a height of h = 300 mm from the conveyor belt edge. This height setting was chosen to direct the emitted electromagnetic wave toward the center of the stack of KLT containers. A four-port Impinj Speedway Revolution R420 RFID reader, Impinj, Inc. (Seattle, WA, USA) was used. The Impinj Speedway Connect Software, Impinj, Inc., version 2.8.0 (Seattle, WA, USA) and a GBTouch industrial touchscreen computer, GABEN, spol. s r.o. (Ostrava, Czech Republic) were used as the software solution for recording successfully read transponders.
The comparison between the circularly and linearly polarized antennas was conducted under the same installed gate geometry and software configuration. The antennas were mounted on the exterior sides of the RFID gate at the same height relative to the conveyor, and the same RFID reader and recording software were used throughout the experiment. The study therefore compares the tested antenna configurations as installed experimental alternatives rather than as EIRP-normalized antenna designs.
Cable harnesses were placed in stackable KLT containers with dimensions of 300 (w) × 200 (l) × 147 (h) mm, arranged according to the diagram. Five types of RFID transponders were used: RFID INLAY AD 814, RFID INLAY UHF Wet Mini Web NXP G2iL, RFID INLAY AD 227M5 MONZA 5, RFID INLAY AD 232 NXP G2iL, and ALIEN SQUIGGLE RFID WHITE WET INLAY (ALN-9740, HIGGS-4).
This RFID system configuration operates in the Ultra-High-Frequency (UHF) spectrum within the 860–960 MHz band. The UHF band was selected based on the VDA 5500 standard [20], which recommends using UHF, especially with regard to CPSs, to unify technological aspects across the entire supply chain in the automotive sector, specifically for 2nd Tier suppliers, 1st Tier suppliers, and OEMs (Original Equipment Manufacturers).
The experiment’s outcome was intended to be an arrangement of controllable factors that would maximize the value of the monitored parameter—the reliable reading of 20 containers with cable harnesses. Since the environment involved metals that reflect the RFID signal, it was necessary to select the correct antenna type with the appropriate wave propagation characteristics. It was also necessary to select a suitable type of RFID transponder, considering its cost, which could guarantee the correct signal reflection back to the antenna. Finally, the transponder orientation had to be defined—whether they needed to be turned to the outward side for better visibility or if a random orientation of the RFID transponder placed on the front face of the containers in individual layers would suffice. In the proposed configuration, the RFID transponder is placed on the outer wall of the containers as they move past a stationary antenna and reader. The selected controllable and uncontrollable factors affecting reading quality were considered in the experiment.
The controllable and uncontrollable factors of the experiment are described in Table 1.
Table 1.
Controllable and uncontrollable factors.
The experimental design was subsequently proposed, consisting of 1500 measurements (Table 2). Each level of the uncontrollable factor comprised 300 measurements (container filling from two to ten cable harnesses). For each combination of controllable factors (transponder orientation, antenna type, and transponder type) within one uncontrollable factor, 15 measurements were performed. A separate randomized run-order protocol was not applied as an inferential component of the experimental design. Instead, the experiment was conducted as a controlled configuration-screening procedure under stable laboratory conditions, using the same conveyor speed, antenna positioning, RFID reader, and software settings across the tested configurations.
Table 2.
Design of Experiments framework.
Since the experiment’s goal was to identify the configuration of controllable factors associated with the most reliable RFID reading performance, the experiment focused on maximizing the value of the parameter as a screening indicator. The parameter was used to evaluate the deviation of the output parameter from its target value and to compare the tested RFID configurations. For this specific experiment, the target reading success was 20 out of 20 possible transponders in one pass through the RFID gate. Thus, the target number of unread transponders was 0 out of 20 possible. In this case, the maximum value indicated the best-performing configuration within the screening experiment. The monitored parameter, the , is expressed by Equation (1):
where
= Arithmetic mean of the observed RFID reading performance values.
= Sample deviation of the observed RFID reading performance values.
Although the practical target was zero unread transponders, the value zero was not used as a nominal target parameter in the denominator of a standard nominal-the-best Taguchi formulation. In this study, the recorded response was treated as the observed deviation from the target reading state, and the value was used as a comparative screening indicator for ranking the tested RFID configurations. Higher values were interpreted as more favorable only in combination with lower mean deviation values , because the practical objective was to minimize the number of unread transponders.
3. Results
This section presents the analysis of the experimental data gathered using the structured experimental procedure based on DoE principles. The primary goal was to identify the combination of controllable factors that maximized the ratio, which was used as a comparative indicator for minimizing deviation from the target reading performance. The subsequent subsections present the screening results, identify the best-performing configurations, and assess their observed reliability through additional validation testing using DPMO and Sigma-level indicators.
3.1. Analysis of Experimental Output Data
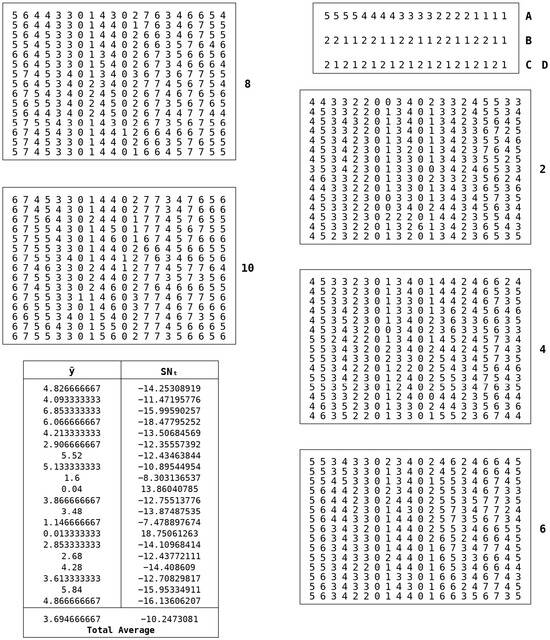
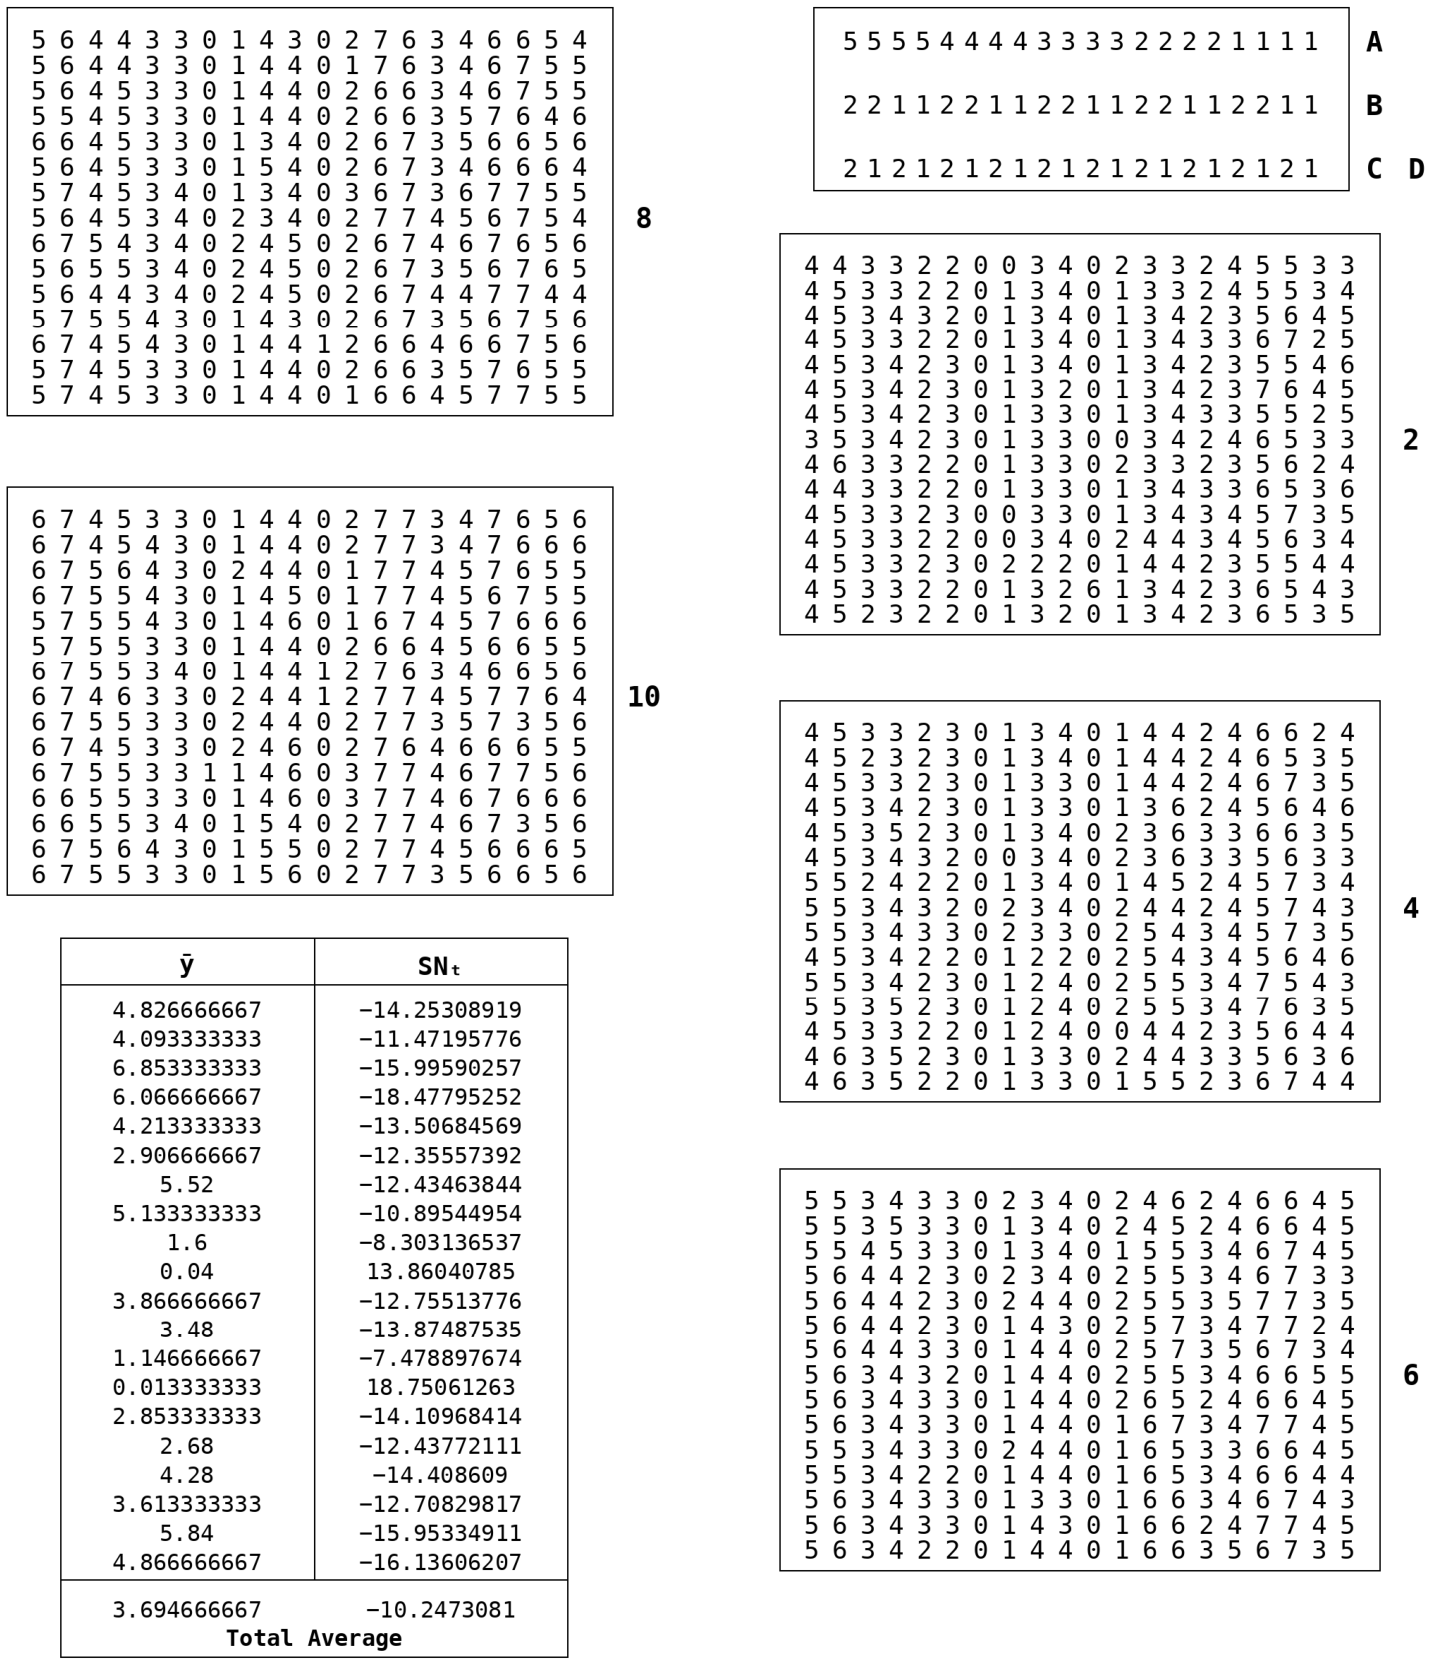
Every controllable factor in the experiment is adjustable and has two or five levels. During the experiment, the parameter was monitored as a comparative indicator of deviation from the target reading performance. The goal of this experimental screening was to calculate and compare the ratio values for the tested RFID configurations and to identify the combinations associated with the lowest number of unread transponders. The ratio values were calculated for each experimental series.
From the total differences in the number of successfully read transponders, as listed in Figure 6, the ratios were calculated for each experimental series. The optimal setting of controllable factors is statistically determined by the highest ratio value. All obtained summary data of unread transponders from individual measurements were transformed into the parameter, also described in Figure 6. The average value for individual combinations of controllable factors is also described in the figure.
Figure 6.
Deviations from the target value resulting from experiments.
The total average deviation of the output parameter from its target value was 3.694666667. From a practical perspective, this is an insufficient reading rate, as it corresponds to an 18.473% reading failure rate, which is unacceptable in practice since the system reliability is approximately 2.4 σ, and the DPMO (Defects Per Million Opportunities) is at 184,500. The overall average factor was −10.2473081. For this reason, it was necessary to identify the combination of controllable factor settings associated with improved reading performance and a lower number of unread transponders in the screening experiment.
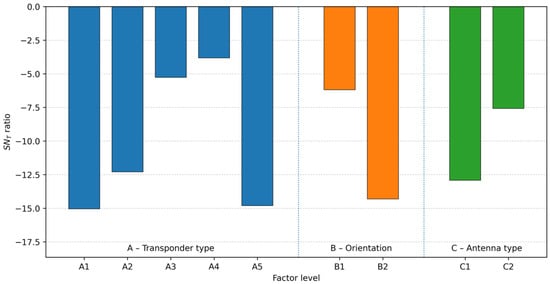
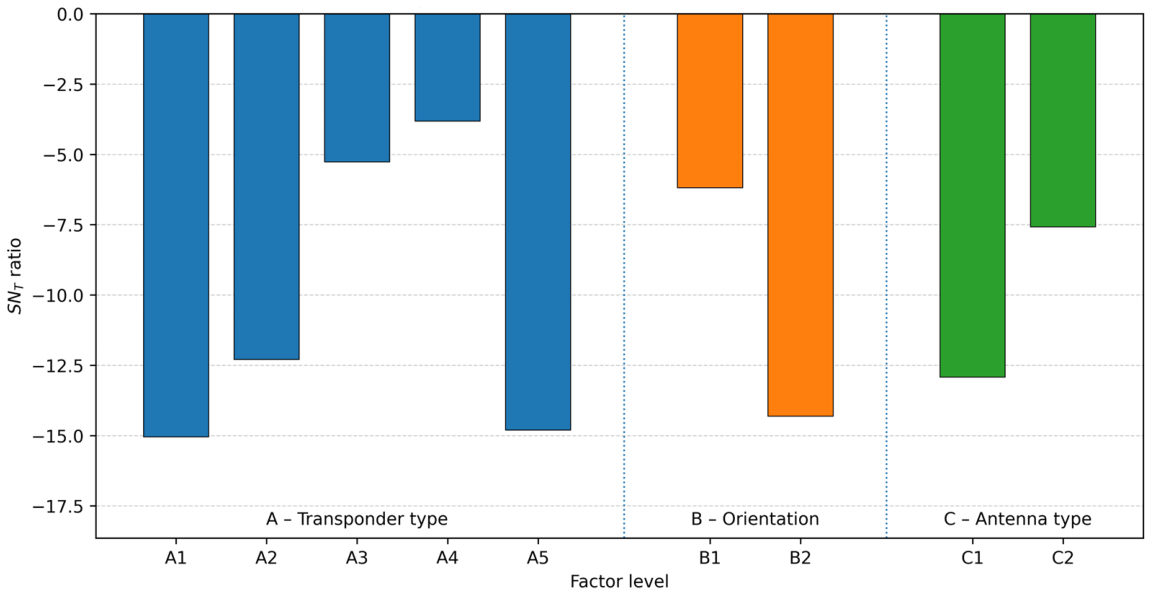
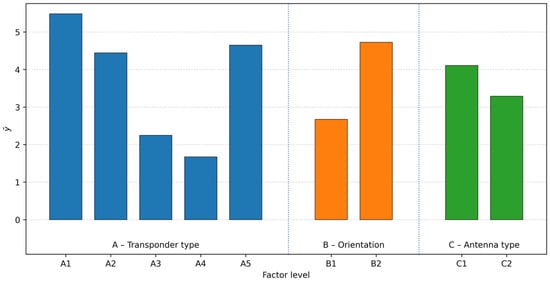
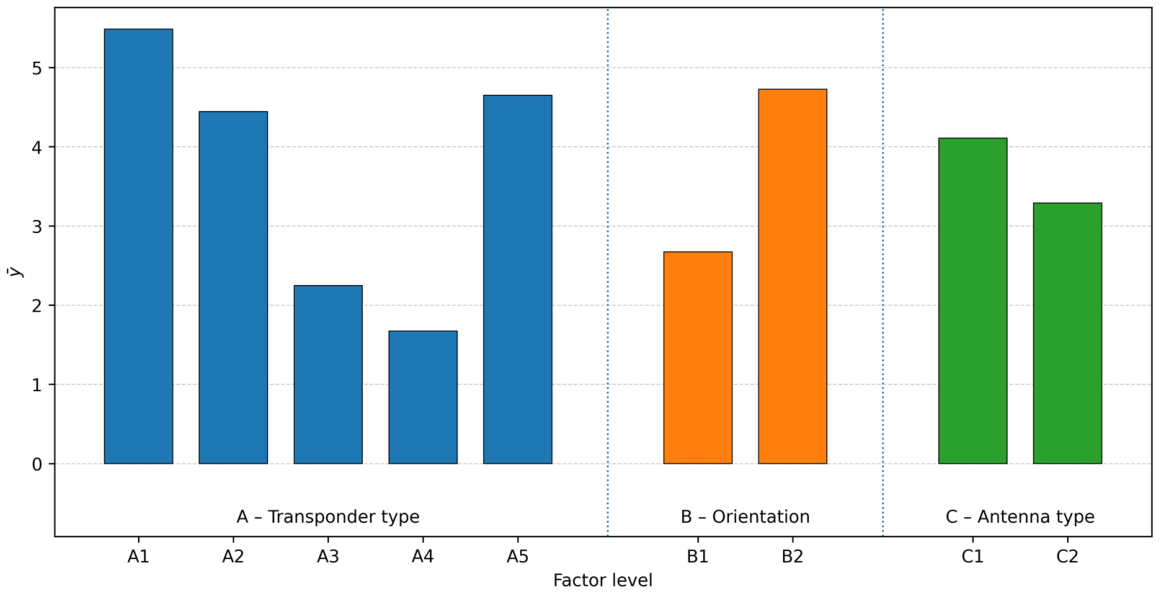
Experimental series 10 and 14 were identified as the best combination of controllable factors, meeting the requirement to improve quality and minimize the variability of the reading success output parameter. It can therefore be concluded that the optimal combination of factor levels is A3, B1, C2 and A4, B1, C2. Because container filling was treated as an uncontrollable noise factor, the robustness of the selected configurations was also interpreted descriptively across the tested fill levels of 2, 4, 6, 8, and 10 cable harnesses per container. Figure 6 indicates that the two best-performing configurations maintained very low deviations across the tested fill range. For configuration A3, B1, C2, no deviations were observed at fill levels 2, 4, and 6, while one deviation was observed at fill level 8 and two deviations at fill level 10 across 15 repeated measurements per fill level. For configuration A4, B1, C2, no deviations were observed at fill levels 2, 4, 6, and 8, while one deviation was observed at fill level 10. This descriptive pattern suggests that higher container filling may increase the risk of missed reads in some cases; however, the selected configurations demonstrated high robustness within the tested range of the noise factor, with A4, B1, C2 showing the strongest robustness result. For the visualization of the experimental method results, a graphical approach is also used to obtain the average values for each level of every factor. Such visualization helps to compare how the levels of the controllable factors differ in the observed number of successfully read transponders. The average values and the ratio values for each level of the controllable factors are shown in Figure 7, and the corresponding values are shown in Figure 8.
Figure 7.
Bar chart of the parameter for individual controllable factors.
Figure 8.
Bar chart of the parameter for individual controllable factors.
Figure 7 and Figure 8 illustrate clear differences in observed RFID transponder readability across transponder orientation and antenna type levels. The experimental results indicate that the most suitable orientation is to have all transponders facing the peripheral (outer) side. Of the tested antennas, the linearly polarized antenna is clearly the best choice for this case, resulting in better reading of stacked transponders. Based on the experiments, two types of transponders were selected according to the parameter result, namely: RFID INLAY AD 227M5 UHF 95 × 8 mm, EPC, MONZA 5, WET and RFID INLAY AD 232 UHF 18 × 75 mm, EPC, NXP G2iL, WET. Consequently, it was necessary to test the reliability of the selected components of the proposed RFID system for material-flow monitoring.
3.2. Reliability Testing of Selected RFID System Components
With regard to the application of the proposed system in real-world operation, it was necessary to test the reliability of the designed system and its components. The testing took place under laboratory conditions. A statistical sample size of 2000 measurements was chosen for each of the two selected transponders. The purpose of this testing was to determine the observed reliability of the selected configurations using the Defects Per Million Opportunities (DPMO) indicator and the corresponding Sigma Level. Each of the 2000 measurements consisted of 20 reading opportunities, as 20 transponders were placed on the containers in each measurement. All transponders were placed on the outer peripheral wall of the containers, and only the linearly polarized antenna was used, in accordance with the results of the previous experimental screening. Randomly placed cable harnesses, 120 pieces in total and ranging from 2 to 10 bundles per container, were included in the containers.
For the DPMO calculation, one unit was defined as one measurement pass through the RFID gate; therefore, DPU was set to 20, corresponding to the 20 transponder reading opportunities included in each pass. The DPMO level was calculated according to Equation (2):
where
= Quantity of defects found in the sample.
= Sample size.
= Quantity of possible defects per unit in the studied sample.
The Sigma Level was determined using the iSixSigma Process Sigma Calculator (online version), with the standard deviation shift of 1.5 applied.
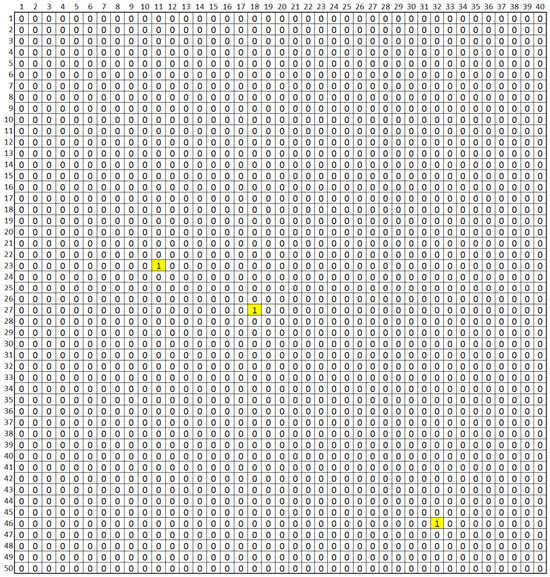
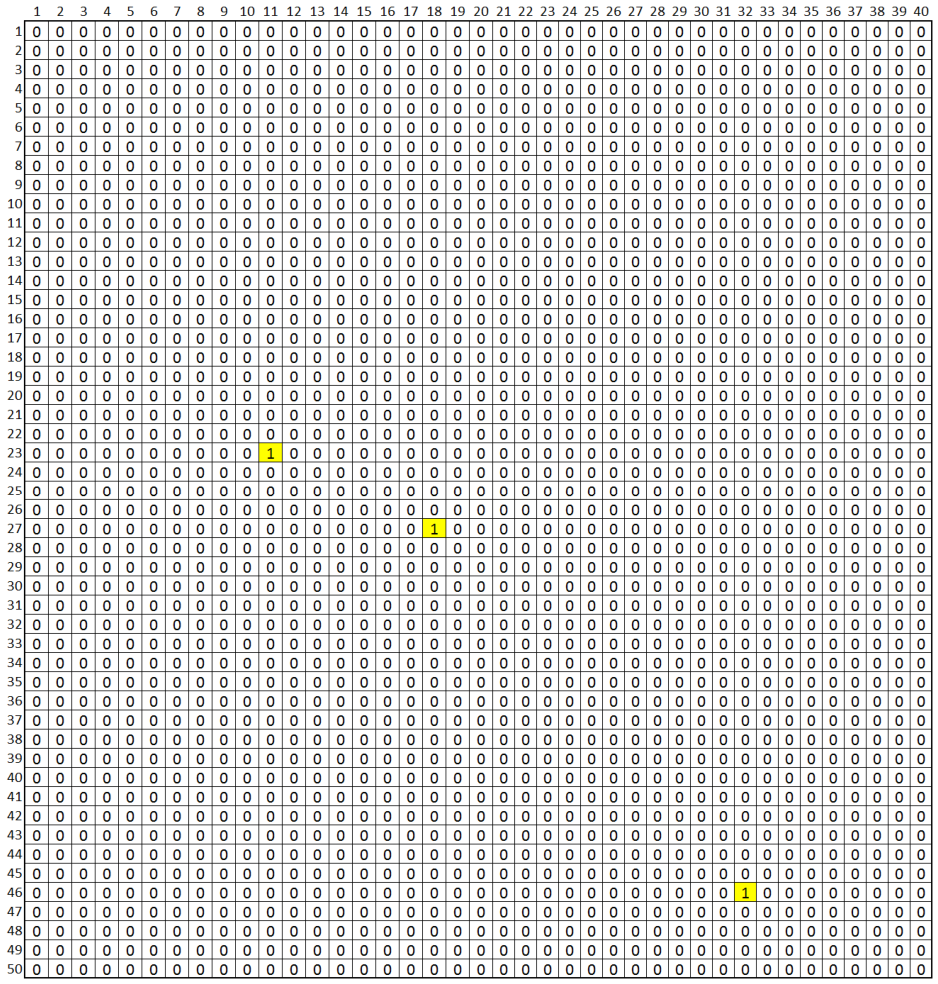
Based on the results of reliability testing for the RFID INLAY AD 227M5 UHF 95 × 8 mm transponder (Figure 9), three missed reads were observed in 2000 measurements, with the yellow-highlighted cells indicating the positions of these failed readings in the matrix. Since each measurement included 20 reading opportunities, the validation sample consisted of 40,000 reading opportunities in total. The observed DPMO for this transponder was calculated as shown in Equation (3):
Figure 9.
Reliability testing results for RFID INLAY AD 227M5.
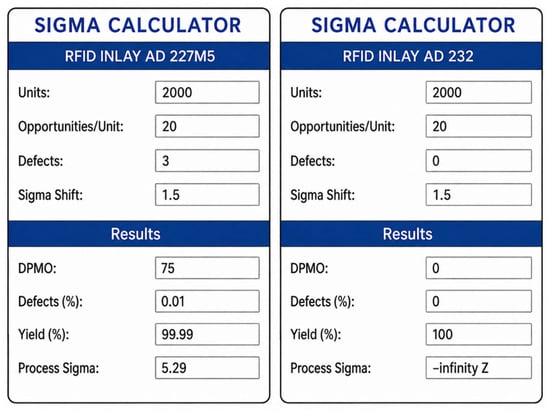
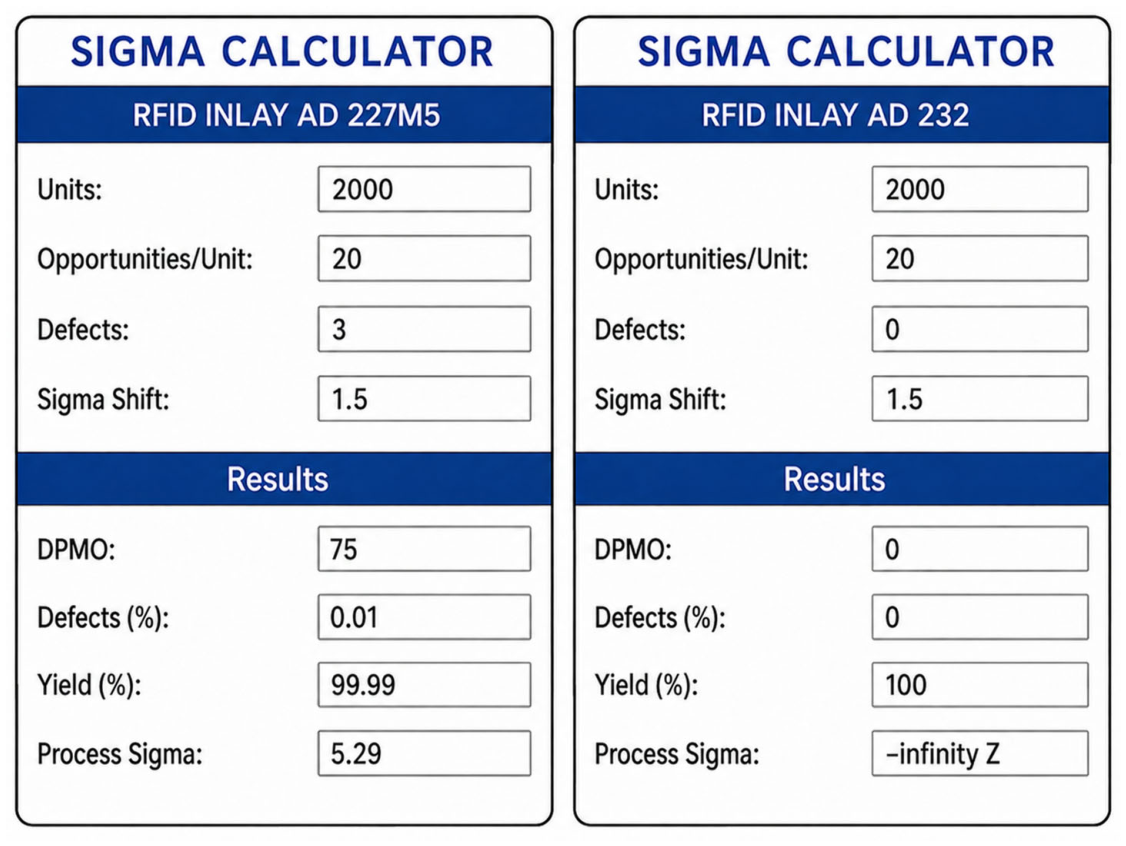
Thus, the observed DPMO for the AD 227M5 transponder was 75 unread transponders per 1,000,000 reading opportunities. According to the Process Sigma Calculator output shown in Figure 10, this corresponded to a Sigma Level of 5.29 σ. This result indicates high observed reliability for the tested configuration.
Figure 10.
Output from the Process Sigma Calculator software for transponders RFID INLAY AD 227M5 (left) and RFID INLAY AD 232 (right).
For the RFID INLAY AD 232 UHF 18 × 75 mm G2iL transponder (Figure 11), no missed reads were observed in 2000 measurements. As in the previous case, this corresponds to 40,000 reading opportunities. The observed DPMO for this transponder was calculated as shown in Equation (4):
Figure 11.
Reliability testing results for RFID INLAY AD 232.
Thus, the observed sample DPMO for the AD 232 transponder was 0 unread transponders per 1,000,000 reading opportunities. Based on the Process Sigma Calculator output shown in Figure 10, the validation sample indicated a 6+ σ result for this configuration.
However, the zero observed DPMO for the AD 232 transponder should be interpreted as a sample-based result rather than as proof that the true long-term DPMO of the system is zero. With zero observed failures in 40,000 reading opportunities, the result provides strong evidence of high reliability under the tested laboratory conditions, but extended in situ monitoring would be required to confirm long-term process capability in routine operation. Using the common rule-of-three approximation for zero observed failures, the upper 95% confidence bound for the defect rate is approximately 75 DPMO. This confidence-bound value is not an observed DPMO for AD 232; it is a statistical upper bound derived from the validation sample size.
Within these limits, the AD 232 transponder represents the best-performing alternative among the tested configurations.
3.3. Preliminary Conclusions and Practical Application
The following conclusions were drawn from the presented study. Analysis of the experimental results showed that RFID transponder type, antenna signal propagation characteristics, and transponder orientation influenced the observed RFID reading performance in the tested material-flow setting. Specifically, the factor levels A4, B1, and C2 emerged as the best-performing combination in the screening experiment. This configuration was subsequently assessed in a validation sample using DPMO and Sigma-level indicators, which supported its high observed reliability under the tested laboratory conditions. The results are valid within the tested range of controllable parameters and for the specified RFID system configuration. The findings can be used to support the selection and configuration of RFID-based identification systems in conditions similar to the designed RFID system.
3.3.1. Application of Experiment Results
The experimental results were transferred to the receiving point for cable harnesses in the manufacturing plant of the final automobile producer. The application of RFID technology is currently in the pilot testing phase. The pilot implementation demonstrates the technical feasibility of automated information reading upon receipt of cable harnesses and integration with the company’s IT infrastructure, allowing the RFID system to communicate directly with the SAP ERP system.
The RFID gate at the inbound materials area consists of four linearly polarized antennas, two placed on each side. The antennas are connected to a four-port RFID reader with a direct connection to the software. The old method of marking containers with barcodes, used to determine unique identities required for production, has been replaced by the RFID transponder, which reduces dependence on manual scanning and related non-value-added work. The working environment of the tested reading system includes direct connectivity and information uploading to the SAP environment. This information is instantly available to users after the transported pallet passes through the RFID gate. Within the scope of the present study, the pilot phase was documented as an implementation step rather than as a longitudinal reliability trial. Therefore, time-based miss rate, duplicate-read rate, and false-positive rate were not quantified for the four-antenna production gate. The pilot and laboratory configurations are consequently not directly comparable as reliability datasets: the two-antenna laboratory configuration was used for controlled configuration screening and validation, whereas the four-antenna pilot gate demonstrates the transfer of the selected linearly polarized configuration to an operational SAP-connected material-flow environment.
3.3.2. Anticipated Contributions to Science and Practice
Scientific Contribution: The contribution to science and research stemming from the context of this work is the proposal and determination of factors affecting the correct functionality of RFID systems used for material-flow monitoring in production, which were identified based on DoE (Design of Experiments) and verified in practice.
Practical Contributions: The results of the research on the application possibilities of RFID technology for material-flow monitoring in production, from the perspective of their practical use, are:
- A concept for an RFID-based system for a specific application in the automotive industry was designed.
- It contributed to the gradual implementation of Cyber–Physical Systems (CPS).
From a management perspective, the optimized RFID configuration developed in this study can support data-driven decision-making and process transparency across manufacturing operations. By integrating RFID data with enterprise resource planning (ERP) systems such as SAP, managers can obtain real-time information on material-flow movements and potential process deviations. This can support proactive management control, faster response to production bottlenecks, and better coordination between logistics, procurement, and production planning departments. The implementation of such an RFID-driven information system is therefore relevant to Lean Management principles by reducing dependence on manual identification tasks and by supporting evidence-based managerial decision-making. However, the direct effects on productivity, cost efficiency, and sustainability performance were not quantified within the scope of the present study.
4. Discussion
The findings of this study provide new insights into the optimization of Radio Frequency Identification (RFID) technology performance within the context of Cyber–Physical Production Systems (CPPS), contributing to the broader discourse on Industry 4.0 sustainability. By employing a Design of Experiments (DoE) methodology to examine key parameters—namely antenna type, transponder type, and transponder orientation—the research demonstrates how data-driven optimization can substantially enhance the reliability and efficiency of RFID-based material-flow systems. These results not only align with previous research on RFID optimization [21,22,23], but also expand the existing literature by providing empirical evidence from a real industrial environment in the automotive sector. The absence of missed reads in the validation sample and the corresponding 6+ σ indication represent a significant step toward highly reliable RFID-based identification in the tested application. Nevertheless, this result should be interpreted as sample-based reliability evidence rather than as definitive proof of long-term Six Sigma performance. The findings therefore support the use of systematic RFID configuration testing as a practical means of improving material-flow data reliability before broader CPPS integration.
The application of DoE methodologies in RFID research has long been recognized as a powerful approach to identifying optimal configurations and mitigating performance inconsistencies [21,24]. Previous studies have used simulation-based experiments, antenna-geometry optimization, reader-collision reduction, network planning, or machine-learning-supported RFID logistics to improve system performance [22,24,25]. Compared with these studies, the present research focuses less on algorithmic or simulation-based optimization and more on the physical comparison of commercially available antennas, transponders, and transponder orientations in a specific automotive material-flow setting. This provides an application-oriented contribution by showing how RFID configuration screening can be linked with observed DPMO and Sigma-level indicators before practical CPPS/ERP integration. The convergence of DoE and RFID, as highlighted across these studies, thus represents a robust methodological framework for realizing the potential of Industry 4.0 technologies in sustainable manufacturing.
The implications of this study extend beyond technical optimization and into the domain of operational excellence, where RFID and statistical design methodologies intersect with Six Sigma principles. Prior research emphasizes that the integration of RFID with Six Sigma methodologies enables organizations to achieve lower Defects Per Million Opportunities (DPMO) and improved process control through real-time data visibility [26]. The present findings support this synthesis by indicating that improved RFID reading reliability can contribute to process stability and defect reduction, which are core objectives of Six Sigma-oriented process improvement. By facilitating continuous and accurate material tracking, optimized RFID systems provide the data foundation necessary for implementing the DMAIC (Define, Measure, Analyze, Improve, Control) framework [27]. This relationship underscores how RFID technology acts as a digital enabler of quality improvement methodologies, enabling data-driven decision-making and timely corrective action.
Moreover, RFID-enabled Six Sigma integration has proven effective across diverse industrial sectors, including automotive [27], furniture manufacturing [28], and bakery production [29]. The ability of RFID to provide accurate, real-time visibility of materials and processes supports Lean and Just-in-Time (JIT) principles, ultimately reducing waste and variance across production lines [30]. However, while previous studies often emphasize conceptual frameworks, simulation results, or general process-improvement applications, this research contributes by validating RFID configuration choices through a controlled laboratory experiment linked to a practical automotive material-flow scenario. The contribution is therefore not a universal RFID deployment model, but a case-based demonstration of how configuration-level testing can support more reliable CPPS integration.
The outcomes also highlight the significance of green logistics and sustainable material-flow management as integral components of Industry 4.0-based manufacturing. As demonstrated by [31], optimizing material flow and minimizing waste through targeted cost accounting practices significantly enhances both environmental and financial performance. The present study extends this perspective by showing that RFID system optimization can support green logistics objectives by improving the reliability of material-flow data. Reliable, real-time identification of materials enables efficient handling, minimizes misrouting, and supports closed-loop logistics by providing accurate reverse flow data. These findings resonate with the broader literature emphasizing that improved material-flow efficiency, when paired with environmentally conscious logistics strategies, leads to measurable reductions in waste generation and energy consumption [32,33,34].
In particular, the study’s implications align with the principles of Material-Flow Cost Accounting (MFCA) and green target costing, as explored by [31]. By ensuring precise data capture on material movement and resource utilization, RFID systems provide a digital foundation for such sustainability-oriented accounting systems. This integration of digital and environmental accounting methods may support the analysis of production costs and emissions, reinforcing the connection between technological innovation and corporate sustainability strategies. As [35,36] argue, the success of green logistics depends on effectively managing both forward and reverse flows within the supply chain, a goal that optimized RFID technology directly supports by enhancing data transparency and traceability throughout the product lifecycle.
Nevertheless, several challenges and limitations remain to be addressed in the broader adoption of optimized RFID systems in industrial environments. Prior research identifies barriers such as high implementation costs, technological complexity, and workforce resistance to change [37]. These issues can limit the scalability and sustainability of RFID deployments, especially in small and medium-sized enterprises (SMEs). The present study partially mitigates these concerns by demonstrating that reliability optimization through DoE can maximize system performance without necessitating costly overengineering or redundant infrastructure. However, further research is needed to explore cost–benefit trade-offs, particularly when scaling optimized RFID configurations across multiple production lines or facilities. Moreover, the research was conducted under specific environmental and operational conditions characteristic of the automotive sector. Thus, the generalizability of the results to other industrial contexts warrants additional investigation.
From a methodological standpoint, the findings also suggest several directions for future research. First, extending the Design of Experiments framework to include additional factors—such as transponder material, the material on which the RFID transponder is applied, reader positioning, and ambient environmental conditions—could yield deeper insights into the complex interactions that govern RFID system performance. Second, combining DoE with machine learning and predictive analytics, as suggested by [25]. could enhance the adaptability of RFID systems to dynamic production environments. Third, incorporating sustainability performance metrics into RFID optimization experiments would enable a more holistic evaluation of their impact on resource efficiency, energy consumption, and waste reduction, key metrics for Industry 4.0 sustainability [32,34]. Finally, cross-sector comparative studies would be valuable to establish benchmark configurations and best practices for achieving Six Sigma-level performance across different manufacturing domains.
Overall, the study confirms that the integration of RFID optimization through Design of Experiments represents a scientifically rigorous and practically relevant approach to achieving both technological reliability and sustainability in manufacturing. The managerial implications of the findings are significant. The ability to obtain sample-based evidence of high RFID reading reliability can support managers in implementing continuous improvement frameworks such as Total Quality Management (TQM) and Lean Six Sigma at the organizational level. The enhanced visibility of process data supports not only operational control but also strategic management initiatives related to sustainability reporting, digital transformation, and performance benchmarking. This alignment of technological optimization with managerial decision-making reinforces the role of management as the central driver of Industry 4.0 adoption and sustainable innovation. By bridging the gap between experimental design, Six Sigma quality frameworks, and green logistics principles, the research contributes to a unified model of sustainable digital manufacturing. The demonstrated improvements in RFID system performance underscore how targeted, data-driven interventions can help reduce inefficiencies, limit avoidable errors, and enable real-time traceability—all of which are essential for the transition toward resilient and resource-efficient Industry 4.0 ecosystems. As global manufacturing continues to evolve, the convergence of RFID, experimental optimization, and sustainability frameworks will be instrumental in shaping the next generation of intelligent, environmentally conscious production systems.
A methodological limitation of the study is that the experimental evaluation was primarily designed as a configuration-screening procedure. Therefore, the SNt-based results should be interpreted as comparative screening evidence, while a full smaller-the-better S/N analysis with confidence intervals may be addressed in future research. Another methodological limitation is that the study did not include a full ANOVA-based decomposition of main effects, interaction effects, and effect sizes. The results should therefore be interpreted as comparative configuration-screening evidence for the tested factor levels rather than as inferential estimates of factor effects. Future research should include a randomized or blocked experimental design and ANOVA or mixed-effects modelling to quantify main effects, interactions, and effect sizes more rigorously. The RF parameters of the gate, including EIRP and read-zone uniformity, were not independently equalized or mapped; therefore, the antenna comparison should be interpreted as a comparison of the tested installed configurations rather than as an isolated comparison of antenna polarization under fully normalized RF conditions. A further limitation concerns the laboratory simplification of the pallet structure. While the real production scenario uses eight layers of KLT containers, the laboratory experiment was conducted with four layers due to spatial and equipment constraints. This arrangement enabled controlled and repeatable comparison of RFID configurations, but it does not fully reproduce all signal propagation and shielding effects that may occur in a complete eight-layer pallet. Therefore, the results should be interpreted as configuration-screening evidence under the tested laboratory geometry. Future research and industrial validation should include full-scale testing with eight-layer pallets and longer-term monitoring under routine operating conditions.
5. Conclusions
This study demonstrated a systematic, data-driven procedure for improving RFID reading reliability in a complex, metal-rich manufacturing environment. Addressing the prevalent challenge of unreliable data acquisition—a critical bottleneck in the transition to Cyber–Physical Production Systems (CPPS)—we utilized a Design of Experiments (DoE) approach to optimize key architectural factors. Key findings include:
- Identification of configuration-sensitive factors: The experimental results showed that antenna type, transponder type, and transponder orientation substantially influenced RFID reading reliability in the tested material-flow setting. This confirms the need for system-level configuration testing rather than relying on component selection alone.
- Selection of the best-performing configuration: Among the tested alternatives, the best-performing configuration consisted of a linearly polarized antenna, the RFID INLAY AD 232 transponder, and outward orientation of all transponders on the peripheral side of the containers.
- Sample-based reliability verification: Subsequent validation testing of this configuration produced no missed reads in 40,000 reading opportunities. This corresponds to an observed sample DPMO of zero and a 6+ σ indication in the Process Sigma Calculator. However, this finding should be interpreted as very high observed reliability under the tested conditions, while the true long-term defect rate should be verified through extended industrial monitoring.
The primary scientific contribution of this study lies in demonstrating how a structured experimental configuration-screening procedure based on DoE principles can be used to reduce technological uncertainty in RFID deployment for CPPS-oriented material-flow management. Rather than proposing a universal RFID configuration, the study provides an empirically grounded example of how selected hardware and orientation factors can be evaluated and validated for a specific industrial application.
The practical implications are relevant to Green Economy and Sustainable Manufacturing principles, particularly through improved material-flow visibility and reduced dependence on manual identification:
- Support for Lean and JIT: The improved RFID reading reliability observed in this study can support Lean and Just-in-Time logistics by increasing the accuracy and timeliness of material-flow information. This may reduce the need for repeated manual checks and can improve the transparency of inbound logistics processes.
- Potential sustainability relevance: By improving the reliability of material-flow identification, the proposed RFID configuration can contribute to more accurate inventory records, fewer handling errors, and better coordination between logistics and production planning. These effects are relevant for sustainable manufacturing; however, direct reductions in warehouse space, energy use, waste, or CO2 emissions were not quantified in this study and should therefore be examined in future research.
- CPPS Foundation: The successfully implemented system provides the required, reliable data layer that is foundational for higher-level CPPS functions, such as automated decision-making and real-time process control within the manufacturing environment, specifically interfacing with the SAP ERP system.
Although the proposed configuration was transferred to a pilot application, the main reliability assessment was conducted under laboratory conditions designed to reflect the selected industrial scenario. Future research should therefore focus on long-term in situ monitoring within operational plants to verify whether the observed zero-defect result and the corresponding 6+ σ indication remain stable over extended use. This protocol should include time-stamped records of missed reads, duplicate reads, and false-positive identifications, enabling a quantitative comparison between the four-antenna pilot gate and the two-antenna laboratory configuration. Such monitoring should account for possible environmental and operational changes, including dust, temperature variation, pallet composition, tag wear, signal degradation, and changes in material handling routines. The present study did not independently vary additional stressors such as reader frequency behaviour, conveyor speed changes, broader standoff-distance variation, or different harness SKUs; therefore, the reliability results should be interpreted for the tested laboratory and pilot-transfer conditions rather than for all possible production stress conditions. Future studies should also quantify the economic and environmental effects of improved RFID data reliability, including potential impacts on handling errors, inventory levels, energy use, material waste, and CO2 emissions.
Beyond technical optimization, the study highlights the managerial significance of integrating data reliability into strategic decision-making. Reliable, real-time data derived from RFID systems can serve as a foundation for advanced management control systems, enabling predictive planning, performance monitoring, and strategic alignment of sustainability objectives within the framework of digital manufacturing.
Author Contributions
Conceptualization, R.N., M.R., P.A. and M.M.; methodology, M.M.; software, R.N. and M.M.; validation, R.N. and M.M.; formal analysis, R.N. and S.M.; investigation, M.M.; resources, M.M.; data curation, R.N. and S.M.; writing—original draft preparation, R.N. and M.M.; writing—review and editing, R.N., M.R., P.A. and S.M.; visualization, R.N. and S.M.; supervision, R.N., M.R., P.A. and M.M.; project administration, R.N.; funding acquisition, M.R. and P.A. All authors have read and agreed to the published version of the manuscript.
Funding
This research was funded by the Cultural and Educational Grant Agency of the Ministry of Education, Research, Development and Youth of the Slovak Republic (KEGA), grant numbers KEGA 052PU-4/2026 and KEGA 032PU-4/2026, and by the Scientific Grant Agency of the Ministry of Education, Research, Development and Youth of the Slovak Republic and the Slovak Academy of Sciences (VEGA), grant number VEGA 1/0636/25.
Data Availability Statement
The original contributions presented in this study are included in the article. Further inquiries can be directed to the corresponding author.
Conflicts of Interest
Author Miroslav Minďaš is affiliated to Bamida s.r.o., Prešov, Slovakia. The remaining authors declare that the research was conducted in the absence of any commercial or financial relationships that could be construed as a potential conflict of interest.
Abbreviations
The following abbreviations are used in this manuscript:
| CPPS | Cyber–Physical Production Systems |
| RFID | Radio Frequency Identification |
| DoE | Design of Experiments |
| UHF | Ultra High Frequency |
| 6σ | Six Sigma |
| DPMO | Defects Per Million Opportunities |
| IoT | Internet of Things |
| AI | Artificial Intelligence |
| JIT | Just-in-Time |
| ROI | Return on Investment |
| P-Diagram | static P-diagram |
| KLT | small load carriers (KLT boxes) |
| EPC | Electronic Product Code |
| PC | Personal Computer (industrial PC) |
| VDA | Verband der Automobilindustrie (norm VDA 5500) |
| CPS | Cyber–Physical Systems |
| TQM | Total Quality Management |
| OEM | Original Equipment Manufacturer |
| ERP | Enterprise Resource Planning |
| SAP | ERP Systems, Applications, and Products in Data Processing |
| DMAIC | Define–Measure–Analyze–Improve–Control |
| SMEs | Small and Medium-sized Enterprises |
References
- Naseem, M.; Yang, J. Role of Industry 4.0 in Supply Chains Sustainability: A Systematic Literature Review. Sustainability 2021, 13, 9544. [Google Scholar] [CrossRef] [Scilit]
- Dastres, R.; Soori, M.; Asamel, M. Radio Frequency Identification (RFID) Based Wireless Manufacturing Systems, a Review. Indep. J. Manag. Prod. 2022, 13, 258–290. [Google Scholar] [CrossRef] [Scilit]
- Durmaz, N.; Budak, A. Analysing Key Barriers to Industry 4.0 for Sustainable Supply Chain Management. J. Intell. Fuzzy Syst. 2022, 43, 6663–6682. [Google Scholar] [CrossRef] [Scilit]
- Sadiq, M.; Mehmood, K.; Leong, M.K.; Ghani, U.; Usman, M. Industry 4.0 and Circular Economy: Examining the Role of Supply Chain Integration and Corporate Social Responsibility. Corp. Soc. Responsib. Environ. Manag. 2025. Early View. [Google Scholar] [CrossRef] [Scilit]
- Yang, Q.; Samson, A.B.; Gummi, U.M.; Chen, D. Study on the Use of Industry 4.0 Technology for the Textile Industry Sustainable Supply Chain Process. Adv. Eng. Technol. Res. 2023, 4, 140–147. [Google Scholar] [CrossRef] [Scilit]
- Yogindra, P.G.; Vijaya, G.S. A Systematic Literature Review of Strategic Partnership in Sustainable Supply Chain—Indian Aerospace Industries. ECS Trans. 2022, 107, 2315. [Google Scholar] [CrossRef] [Scilit]
- Todorova, A.; Zyatchin, A. A Sustainability Measurement Framework of Supply Chain Information Flow: The Case of Industry 4.0 Technology Implementation. Contrib. Game Theory Manag. 2023, 16, 237–270. [Google Scholar] [CrossRef] [Scilit]
- Agarwal, V.; Ankolikar, S. Deployment of RFID Sensors in Supply Chain Management—A Review. J. Mechatron. Artif. Intell. Eng. 2022, 3, 47–64. [Google Scholar] [CrossRef] [Scilit]
- Knapp, H.; Romagnoli, G.; Uckelmann, D. Architecture, Application and Implementation of a Digital Twin of the RFID-Enabled Material Flow in Real-Time for Automotive Intralogistics. Int. J. RF Technol. 2023, 13, 53–90. [Google Scholar] [CrossRef] [Scilit]
- Paszkiewicz, A.; Siwiec, K.; Pawłowicz, B.; Budzik, G.; Ganzha, M.; Paprzycki, M. RFID-Enabled Smart Manufacturing: Real-Time Asset Tracking and Operational Workflow Optimization. Teh. Glas. 2025, 19, 25–30. [Google Scholar] [CrossRef] [Scilit]
- Pitaloka, B.A.; Patra, O.; Yusriski, R.; Suryana, H. Designing an RFID System to Improve Stock Accuracy and Supply Chain Efficiency of PT Bap in the Context of Industry Digitalization 4.0. Indones. Impr. J. 2025, 4, 3443–3459. [Google Scholar] [CrossRef] [Scilit]
- Spekman, R.; Sweeney, P. RFID: From Concept to Implementation. Int. J. Phys. Distrib. Logist. Manag. 2006, 36, 736–754. [Google Scholar] [CrossRef] [Scilit]
- Li, S.; Visich, J.K. Radio Frequency Identification: Supply Chain Impact and Implementation Challenges. Int. J. Integr. Supply Manag. 2006, 2, 407–424. [Google Scholar] [CrossRef] [Scilit]
- Mamun, M.; Miyaji, A.; Luv, R.; Su, C. A Lightweight Multi-Party Authentication in Insecure Reader-Server Channel in RFID-Based IoT. Peer-to-Peer Netw. Appl. 2020, 14, 708–721. [Google Scholar] [CrossRef] [Scilit]
- Cheng, C.; Chai, J. Deployment of RFID in Healthcare Facilities—Experimental Design in MRI Department. J. Med. Syst. 2011, 36, 3423–3433. [Google Scholar] [CrossRef] [Scilit] [PubMed]
- Knapp, H.; Uckelmann, D. Literature Review on Sources of Interference and Proposed Solutions for RFID Installations in Complex Production and Logistics Processes in the Automotive Industry. Int. J. RF Technol. 2022, 12, 87–126. [Google Scholar] [CrossRef] [Scilit]
- Bendoly, E.; Citurs, A.; Konsynski, B. Internal Infrastructural Impacts on RFID Perceptions and Commitment: Knowledge, Operational Procedures, and Information-Processing Standards. Decis. Sci. 2007, 38, 423–449. [Google Scholar] [CrossRef] [Scilit]
- Rafique, M.; Rahman, M.; Saibani, N.; Arsad, N.; Saadat, W. RFID Impacts on Barriers Affecting Lean Manufacturing. Ind. Manag. Data Syst. 2016, 116, 1585–1616. [Google Scholar] [CrossRef] [Scilit]
- Oke, A.; Kineber, A.; Akindele, O.; Ekundayo, D. Determining the Stationary Barriers to the Implementation of Radio Frequency Identification (RFID) Technology in an Emerging Construction Industry. J. Eng. Des. Technol. 2023, 22, 1894–1912. [Google Scholar] [CrossRef] [Scilit]
- VDA 5500. Basic Principles for RFID Application in the Automotive Industry; Version 1.1; Verband der Automobilindustrie e.V. (VDA): Berlin, Germany, 2015. [Google Scholar]
- Zhang, Y.; Hu, J.; Yan, X.; Yang, X. Structure Optimization of an Ultrahigh Frequency Radio Frequency Identification Tag Thread Based on the Normal Mode Helix Dipole Antenna. Text. Res. J. 2020, 91, 523–532. [Google Scholar] [CrossRef] [Scilit]
- Lyu, S.; Wei, Z.; Li, Z. RFID Network Scheduling Using an Improved Bat Algorithm. J. Phys. Conf. Ser. 2020, 1486, 032008. [Google Scholar] [CrossRef] [Scilit]
- Guo, D.; Xiang, Q.; Li, Z. Hybrid Intelligent Optimization Approach for RFID Network Planning. Appl. Mech. Mater. 2014, 596, 230–233. [Google Scholar] [CrossRef] [Scilit]
- Zane, C.; Reyes, P. Airlines’ Plight: Where Has All the Luggage Gone? Manag. Res. Rev. 2010, 33, 767–782. [Google Scholar] [CrossRef] [Scilit]
- Rymarczyk, P.; Małek, A.; Nowak, R.; Dziwulski, J. Optimization of Logistics Processes of the Supply Chain Using RFID Technology. Eur. Res. Stud. J. 2021, 24, 637–647. [Google Scholar] [CrossRef] [Scilit]
- Mehrjerdi, Y. A Framework for Six Sigma-Driven RFID-Enabled Supply Chain Systems. Int. J. Qual. Reliab. Manag. 2013, 30, 142–160. [Google Scholar] [CrossRef] [Scilit]
- Mariana, Y.; Andrean, W.; Lestari, N. Minimizing Defects in Radiator Grille Upper Garnish Parts Using Six Sigma (DMAIC) at PT. AAS. Eng. Math. Comput. Sci. J. 2023, 5, 111–115. [Google Scholar] [CrossRef] [Scilit]
- Simanová, Ľ.; Gejdoš, P. Implementation of the Six Sigma Methodology in Increasing the Capability of Processes in the Company of the Furniture Industry of the Slovak Republic. Manag. Syst. Prod. Eng. 2020, 29, 54–58. [Google Scholar] [CrossRef] [Scilit]
- Primahesa, I.G.; Ngatilah, Y. Quality Analysis of Bakery Products Using the Six Sigma Method and Failure Mode and Effect Analysis (FMEA): Case Study on CV. XYZ. Int. J. Adv. Technol. Eng. Inf. Syst. 2022, 1, 43–56. [Google Scholar] [CrossRef] [Scilit]
- Cannon, A.; Reyes, P.; Frazier, G.; Prater, E. RFID in the Contemporary Supply Chain: Multiple Perspectives on Its Benefits and Risks. Int. J. Oper. Prod. Manag. 2008, 28, 433–454. [Google Scholar] [CrossRef] [Scilit]
- Mahmud, A.; Yenti, R.R. The Effect of Green Accounting Implementation on Environmental Performance Moderated by Material Flow Cost Accounting. El-Mal J. Kaji. Ekon. Bisnis Islam 2025, 6, 1584–1592. [Google Scholar] [CrossRef] [Scilit]
- Gikonyo, P.K.; Ngugi, P.K.; Paul, S.N. Green Distribution Systems and Performance of Building and Construction Manufacturing Firms in Kenya. Int. J. Supply Chain Logist. 2022, 6, 16–30. [Google Scholar] [CrossRef] [Scilit]
- Fauzi, M.; Hartati, V.; Nugraha, S.R.; Nursalim, S.; Puspani, N.S. Green Logistics and Extended Producer Responsibility Approach for Food and Beverage Packaging Waste Management at Widyatama University: A Model for Green Campus. J. Teknol. Lingkung. 2024, 25, 38–47. [Google Scholar] [CrossRef] [Scilit]
- Dzwigol, H.; Trushkina, N.; Kwilinski, A. The Organizational and Economic Mechanism of Implementing the Concept of Green Logistics. Virtual Econ. 2021, 4, 41–75. [Google Scholar] [CrossRef] [Scilit] [PubMed]
- Melnikova, N.; Yanchenko, N. The Analysis of the Interpretation and the Essence of Green Logistics. Soc. Econ. 2018, 56, 183–189. [Google Scholar] [CrossRef] [Scilit]
- Rao, P. Measuring Environmental Performance Across a Green Supply Chain: A Managerial Overview of Environmental Indicators. Vikalpa J. Decis. Mak. 2014, 39, 57–74. [Google Scholar] [CrossRef] [Scilit]
- Soleha, I.S.; Rohendi, D.; Okitasari, H. Metode Lean Six Sigma Sebagai Strategi untuk Meningkatkan Kualitas Pelayanan dengan Meminimalkan Pemborosan dalam Pengadaan Bumbu Dapur pada Distributor X. J. Ris. Rumpun Ilmu Tek. 2025, 4, 33–48. [Google Scholar] [CrossRef] [Scilit]



Disclaimer/Publisher’s Note: The statements, opinions and data contained in all publications are solely those of the individual author(s) and contributor(s) and not of MDPI and/or the editor(s). MDPI and/or the editor(s) disclaim responsibility for any injury to people or property resulting from any ideas, methods, instructions or products referred to in the content. |
© 2026 by the authors. Licensee MDPI, Basel, Switzerland. This article is an open access article distributed under the terms and conditions of the Creative Commons Attribution (CC BY) license.