


Abstract
This study focuses on a novel three-span hybrid continuous beam bridge, analyzing the force performance and key design parameters of the non-cellular post-support plate joint. A finite element model and parametric analysis were used to reveal the stress distribution patterns, the load-bearing characteristics of the connectors, and the load transfer path under negative bending moments. The study shows that the axial force within the joint is equitably shared among three load paths: the top slab concrete (20.7%), the bearing plate (40.1%), and the shear connectors (39.2%). Although interfacial friction contributes approximately 27.1% to the total shear resistance, it is conservatively recommended to neglect this effect in design due to inherent uncertainties. Parametric analysis reveals distinct marginal effects and efficiency thresholds: increasing the bearing plate thickness from 20 mm to 100 mm results in a mere 1.0 MPa reduction in the peak concrete stress, while extending the joint length beyond 1.0 times the beam height renders the central connectors ineffective. Furthermore, reducing the connector stiffness effectively lowers the non-uniformity coefficient from 2.3 to below 2.0. Notably, the first row of web PBLs carries 34.8% to 47.2% of the total shear force, with a stable non-uniformity coefficient of 1.05–1.06, establishing it as the critical control section for simplified design. These findings provide a theoretical basis and practical guidance for the design of similar joints in hybrid girder bridges.
1. Introduction
With the continuous development of bridge engineering technology, the design and innovation of large-span bridge structures have become an important research direction in the field of civil engineering [1,2]. Concrete beam bridges, steel beam bridges, and steel-concrete composite beam bridges have been widely applied across different span ranges. However, each structural form has certain limitations [3]. To overcome the limitations of existing structures, bridge engineers in the 1970s proposed a structural form that combines steel beams and concrete in the longitudinal direction of the main beam. This hybrid form offers better mechanical properties, span capability, and economic performance [4]. Currently, this hybrid beam structure has been applied in various types of bridges, such as the Kurt-Schumacher Bridge for cable-stayed bridges [5], the Shibanpo Bridge Double-Line Bridge for girder bridges [6], the Lecheng Bridge for suspension bridges [7], and the Caiyuanba Yangtze River Bridge for arch bridges [8]. In this hybrid beam structure, the steel beams reduce the structural load, and the concrete beams provide good compressive resistance. As a result, steel beams are typically placed in the main span while concrete beams are placed in the side spans, which allows for a more rational distribution of the bending moment diagram, increasing the span capability of the structure and improving the force performance of the structural system [9,10].
Existing long-span hybrid girder bridges predominantly adopt a combination of prestressed concrete box beams and steel box beams. In this hybrid form, the concrete deck and steel deck require two different paving systems, which makes construction complicated and reduces efficiency. Engineering practices have demonstrated that steel box girders incur high pavement costs and poor economic viability; notably, the susceptibility to damage of the pavement and the inferior fatigue durability of the steel deck have become persistent challenges plaguing the engineering community [11,12,13]. To address these issues, several scholars have proposed a novel hybrid girder system [14,15,16,17], which strategically integrates composite girders within a specific span segment of the main span, while utilizing traditional prestressed concrete girders for the remaining main span and side spans. This configuration represents a rational longitudinal integration of composite and concrete girders. While this joining method has been successfully implemented in cable-stayed bridges—such as the Shanghai Xupu Bridge [18], the Tsing Ma Bridge in Hong Kong [19], and Yinzhouhu Bridge [15]—research on its mechanical performance and load-transfer mechanisms in girder bridge systems remains scant.
Furthermore, compared to conventional steel-concrete joints, this novel joint features a significantly more complex configuration. Beyond the traditional components—shear connectors, steel bearing plates, reinforced concrete, and prestressing tendons [20,21]—it introduces the additional challenge of integrating the concrete bridge deck with the steel girder flange. This results in intricate interfacial stress states and ambiguous load-transfer paths. Current scholarly efforts, both domestically and internationally, have predominantly focused on conventional joints, with research primarily addressing mechanical performance, load-transfer mechanisms, fatigue damage evolution, and connector behavior [22,23,24,25,26,27,28,29,30]. For instance, Lin et al. [31] experimentally and numerically investigated the mechanical performance of conventional joints, confirming their high flexural capacity and validating their damage evolution laws. Similarly, Cheng et al. [32], through push-out tests, established the failure modes, load-slip curves, and strain distribution patterns of shear connectors and bearing plates under varying thickness conditions.
However, research specifically targeting the composite-to-concrete girder joint remains insufficient. The following critical scientific questions have yet to be definitively answered: (1) What is the load-transfer mechanism at the steel-concrete interface of this novel joint under complex stress states dominated by negative bending moments? (2) How do key design parameters (e.g., bearing plate thickness, connector stiffness, transition length) influence the distribution of load paths and the uniformity of stress distribution? (3) How can simplified design recommendations for this novel joint be formulated while ensuring adequate safety margins?
To address these research gaps, this study investigates a three-span novel hybrid continuous girder bridge. The structure of this paper is organized as follows: Section 2 details the engineering background and the specific configuration of the non-cellular post-support plate joint. Section 3 develops a finite element model to analyze the concrete stress distribution, steel plate behavior, and connector shear characteristics under dominant negative bending moments, thereby elucidating the internal load-transfer mechanisms. Subsequently, Section 4 conducts a systematic parametric analysis to quantify the influence of key variables—specifically bearing plate thickness, connector stiffness, and transition length—on the mechanical performance. Finally, Section 5 summarizes the major conclusions and proposes targeted design optimization recommendations. This research aims to provide a robust theoretical foundation and practical references for the engineering application of this innovative bridge structural system.
2. Project Overview
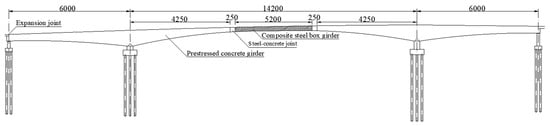
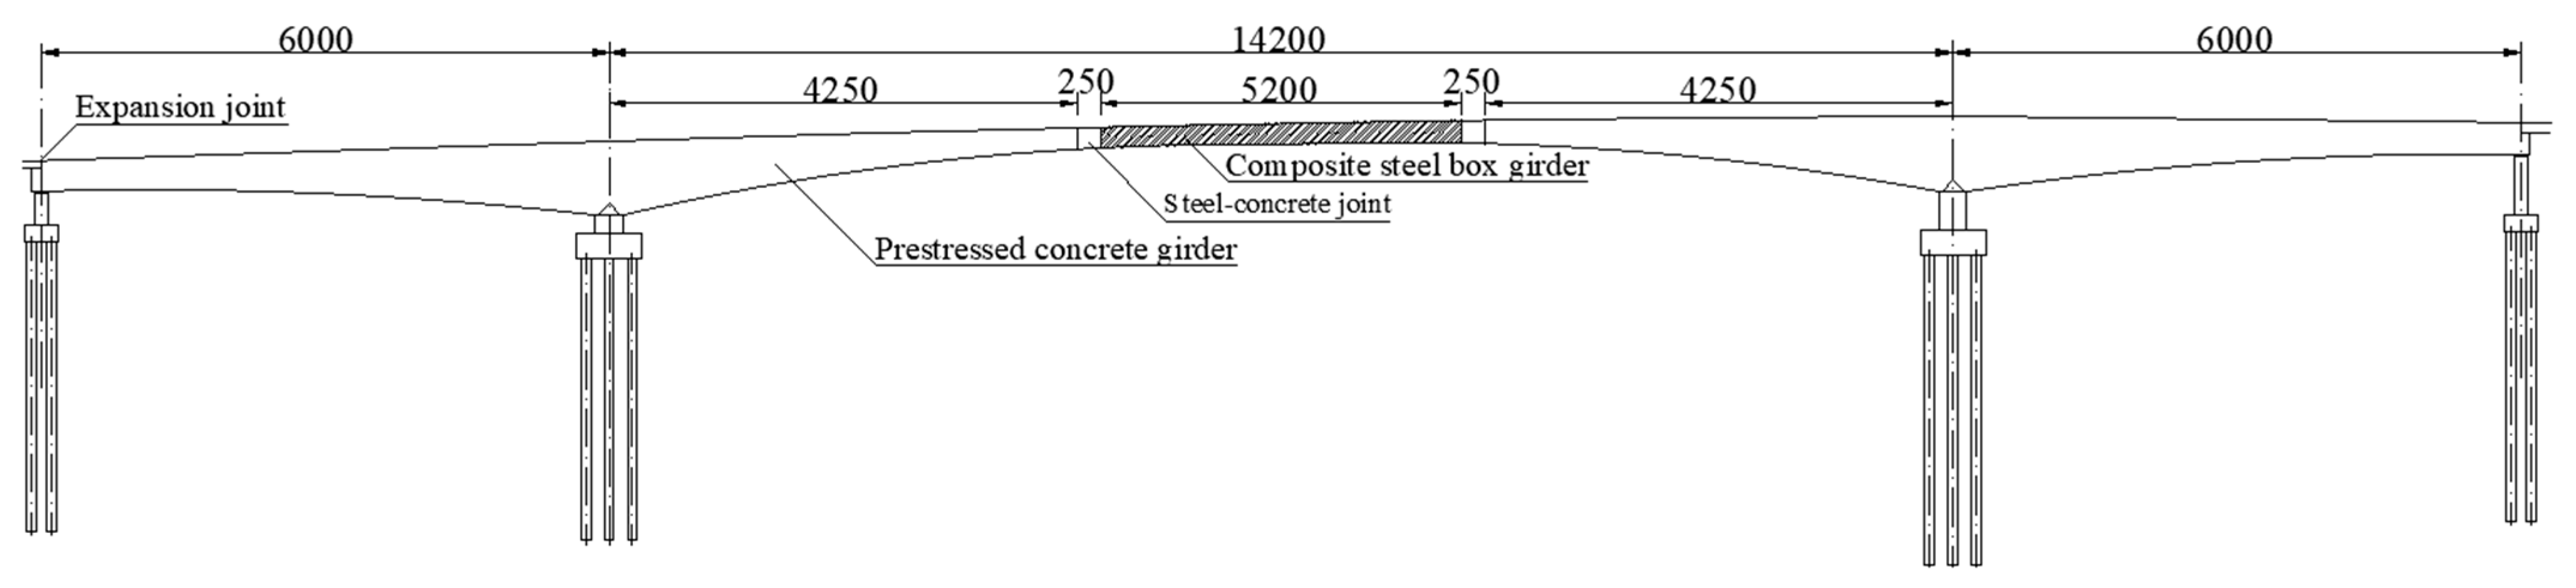
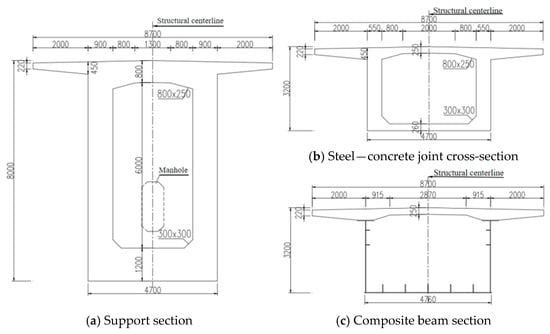
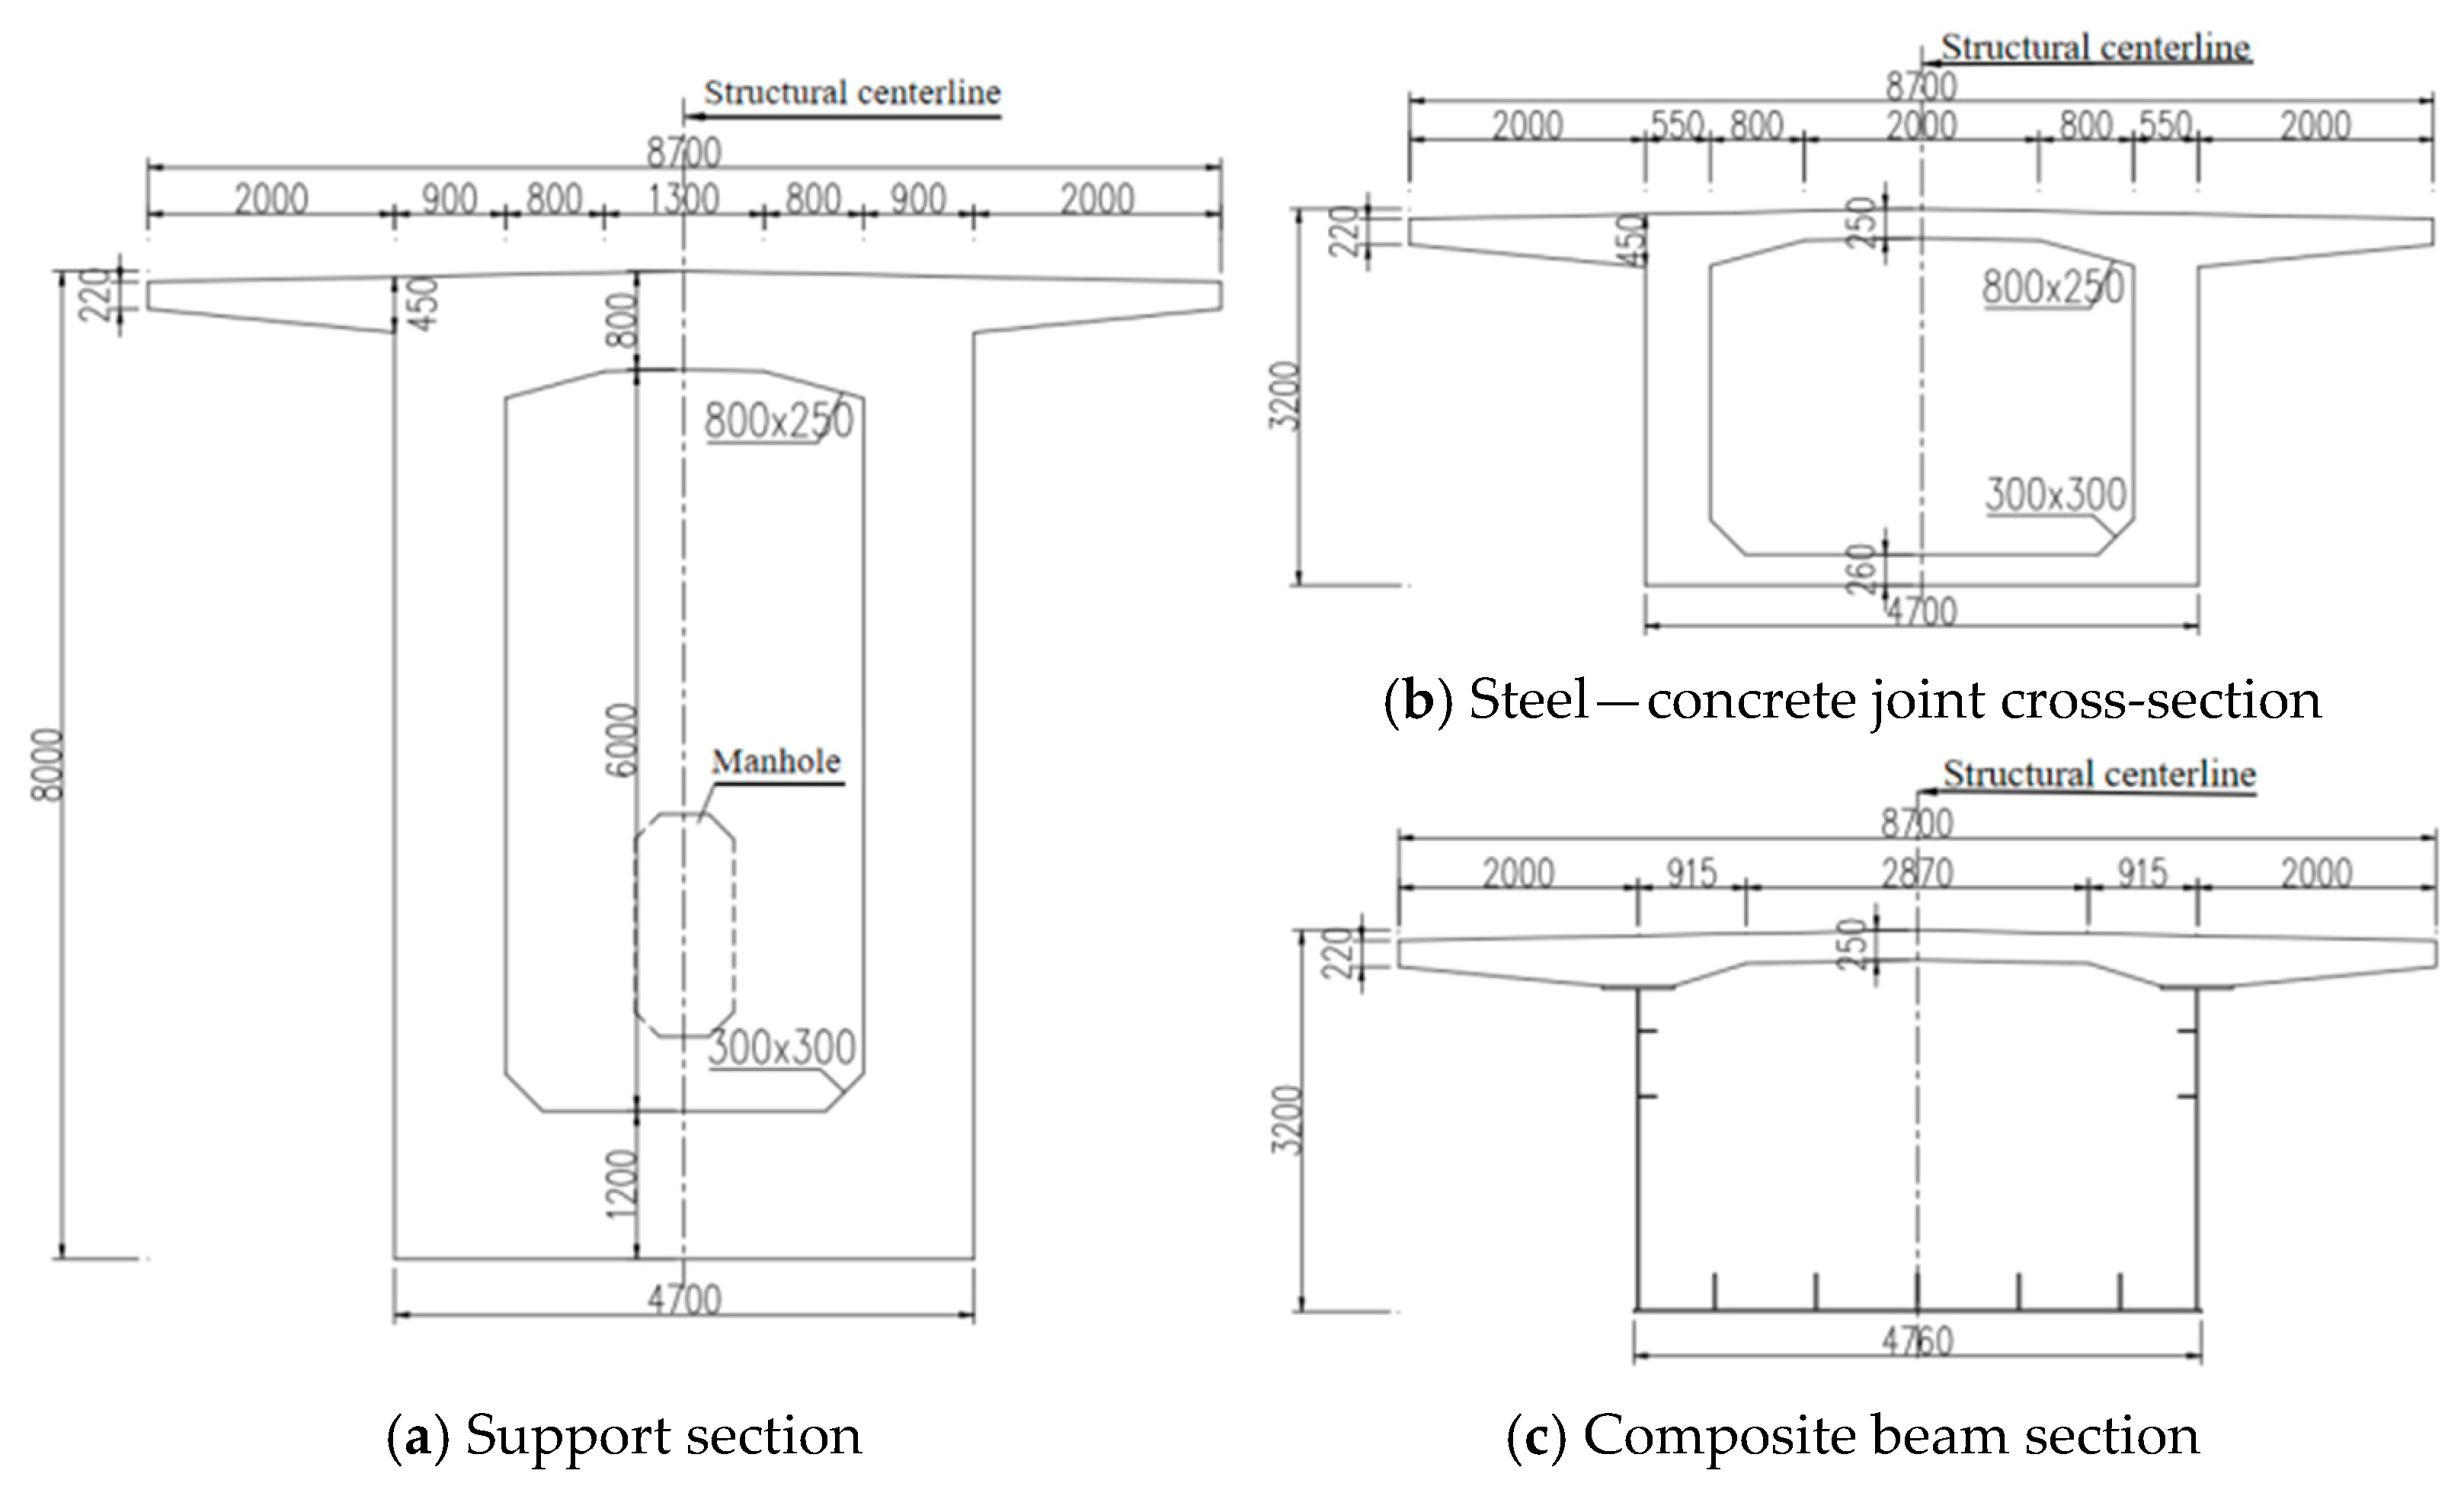
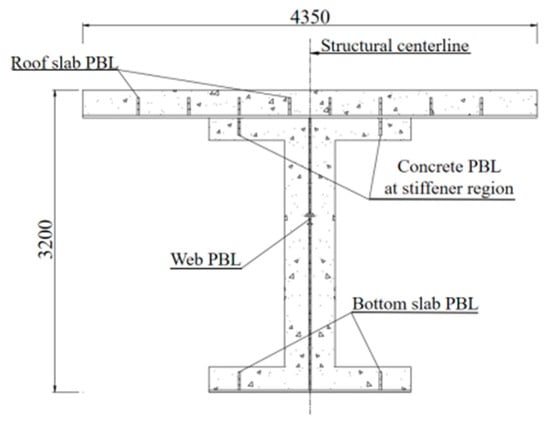
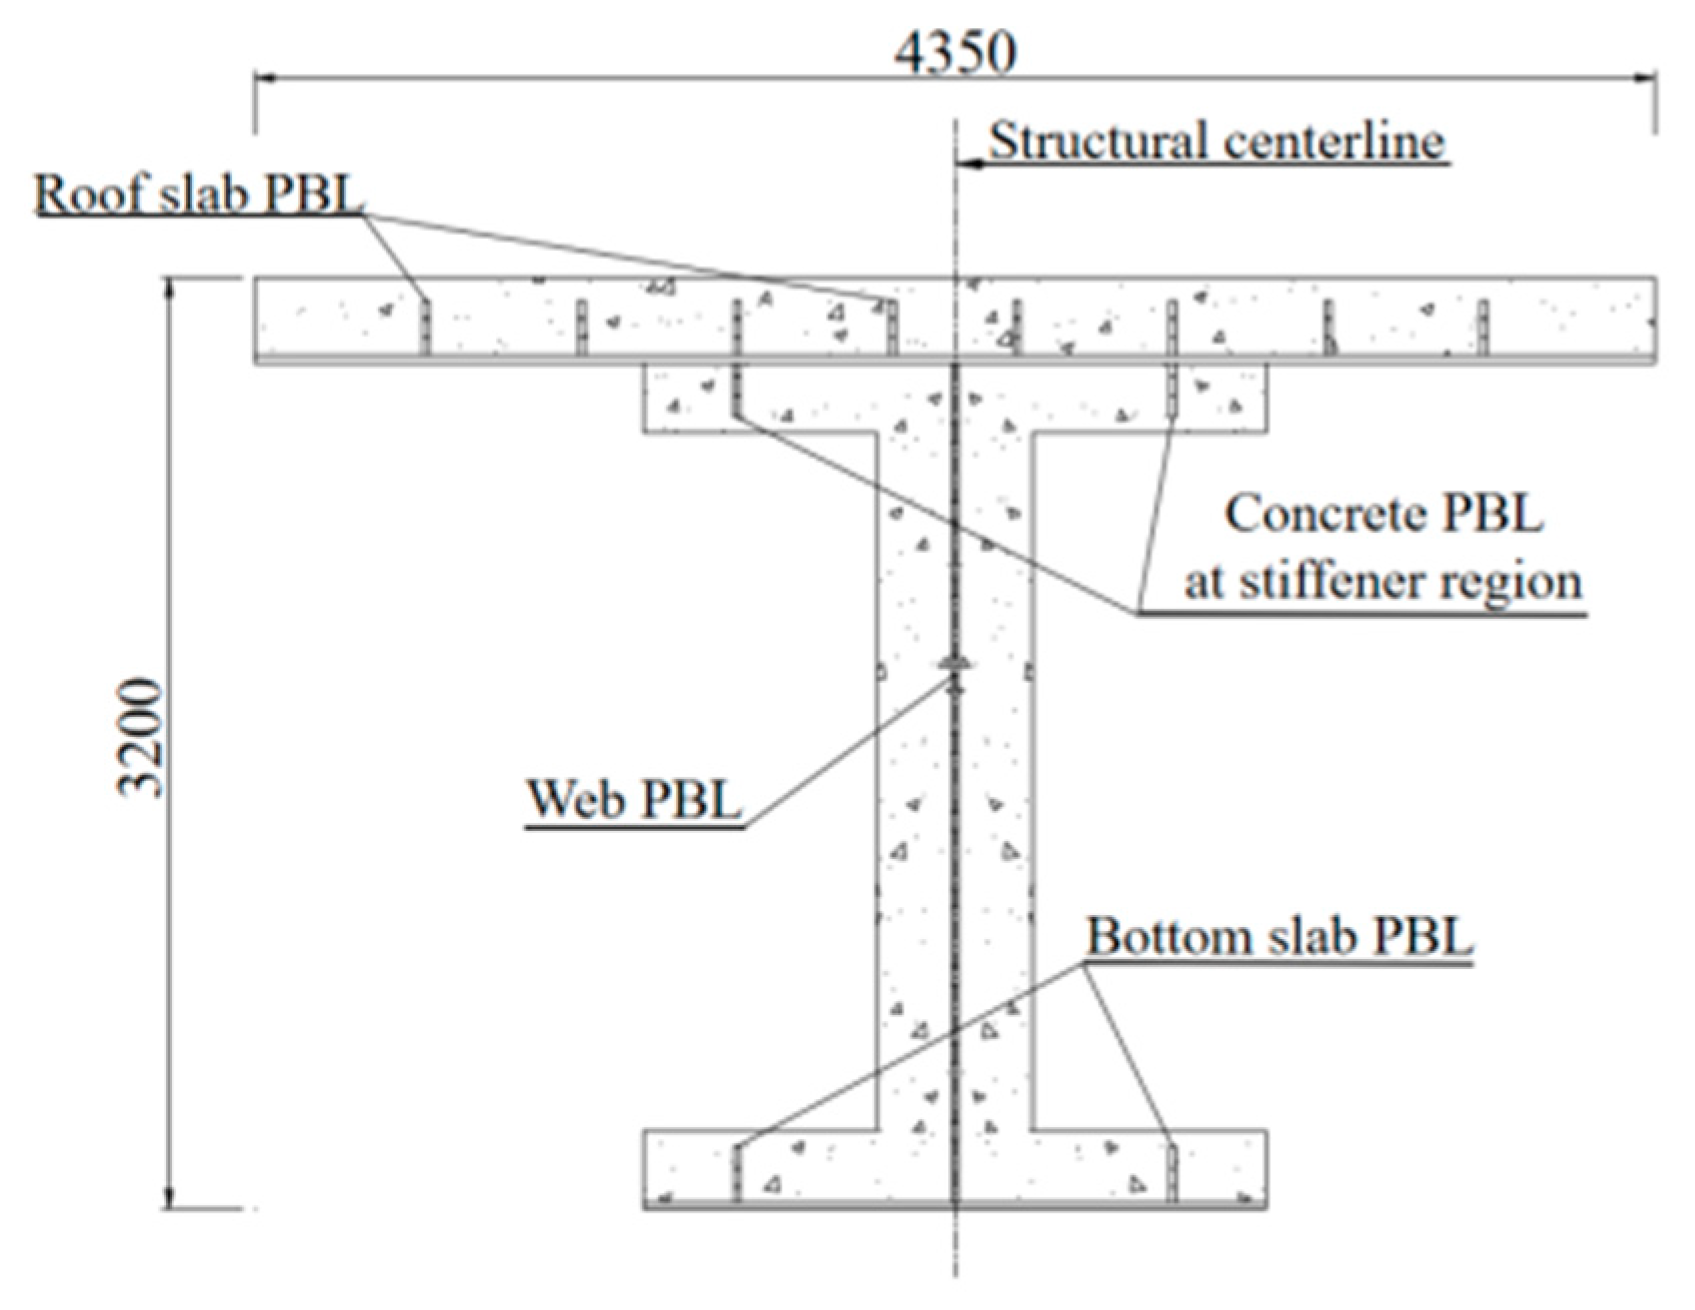
This study is based on a three-span hybrid continuous beam bridge (60 m + 142 m + 60 m), with the overall layout shown in Figure 1. The main beam structure adopts a novel hybrid beam scheme, in which a composite box beam is used for the 52 m section of the main span, while prestressed concrete box beams are used for the side spans and the remaining sections of the main span. The composite beam and prestressed concrete beam are connected through a joint section located 45 m from the central support, as shown in the structural cross-section in Figure 2. The specific location of this joint was determined through multi-round structural optimization based on extensive parametric analyses using the Midas Civil finite element model.
Figure 1.
General Layout Diagram (Unit: cm).
Figure 2.
Structural cross-section diagram (Unit: mm).
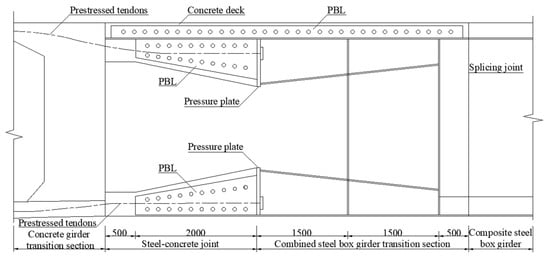
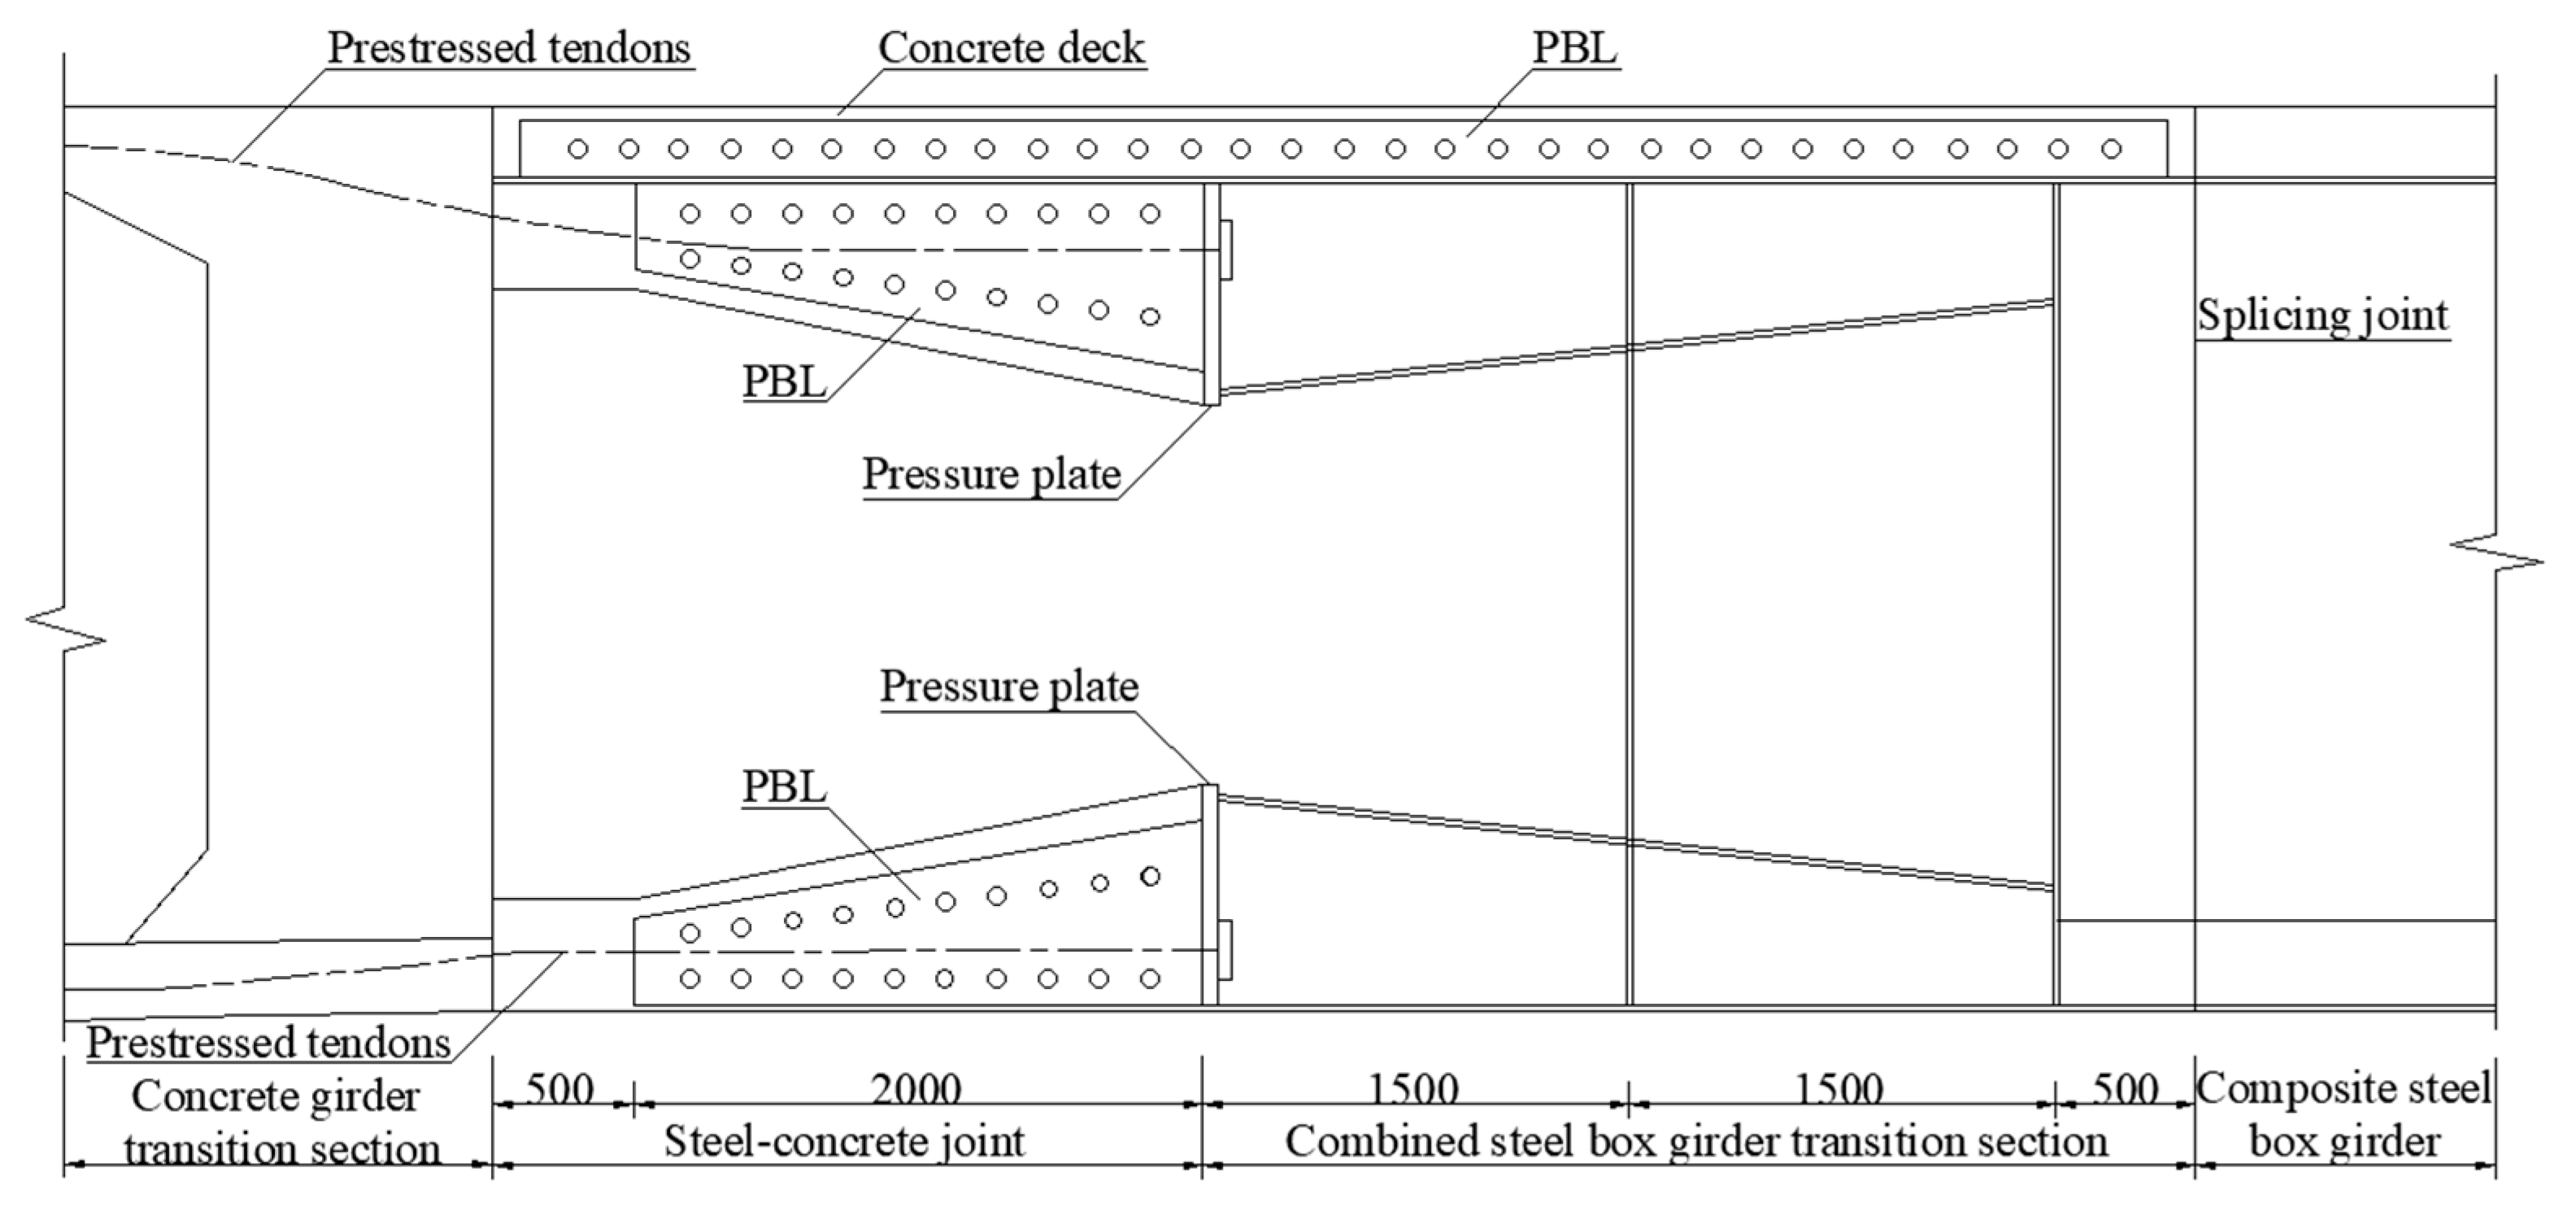
The novel steel-concrete joint employs a non-cellular post-support plate configuration, as illustrated in Figure 3. The joint has a length of 2.5 m, utilizing a hybrid system of a bearing plate and shear connectors. The top flange of the transition segment adopts a steel-concrete composite slab, longitudinally integrated with 17 PBL connectors (200 mm high × 20 mm thick) to ensure robust composite action. Internally, reinforced transition concrete is placed, with its depth linearly varying from 400 mm at the concrete girder end to 720 mm at the composite girder end. Both PBL and welded studs are embedded within this concrete to facilitate load transfer. The bearing plate, fabricated from 50 mm thick steel, is welded integrally to the internal PBL and the top/bottom flanges of the steel girder. Additional studs are welded to the interface between the bearing plate and the concrete. The PBL features a diameter of 60 mm, penetrated by 20 mm diameter transverse rebar where applicable, and are spaced at 180 mm longitudinally. The stud connectors are 20 mm × 170 mm in dimensions, with a spacing ranging from 150 mm to 250 mm.
Figure 3.
New steel-concrete joint structure (Unit: mm).
3. Finite Element Model Calculation and Analysis
3.1. Finite Element Model
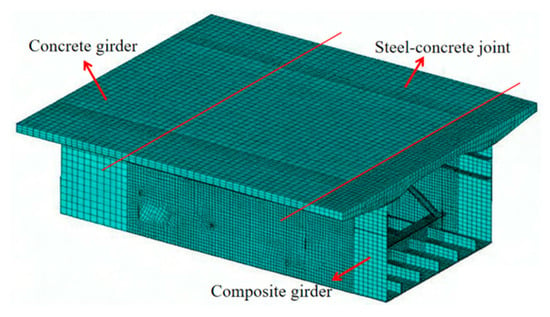
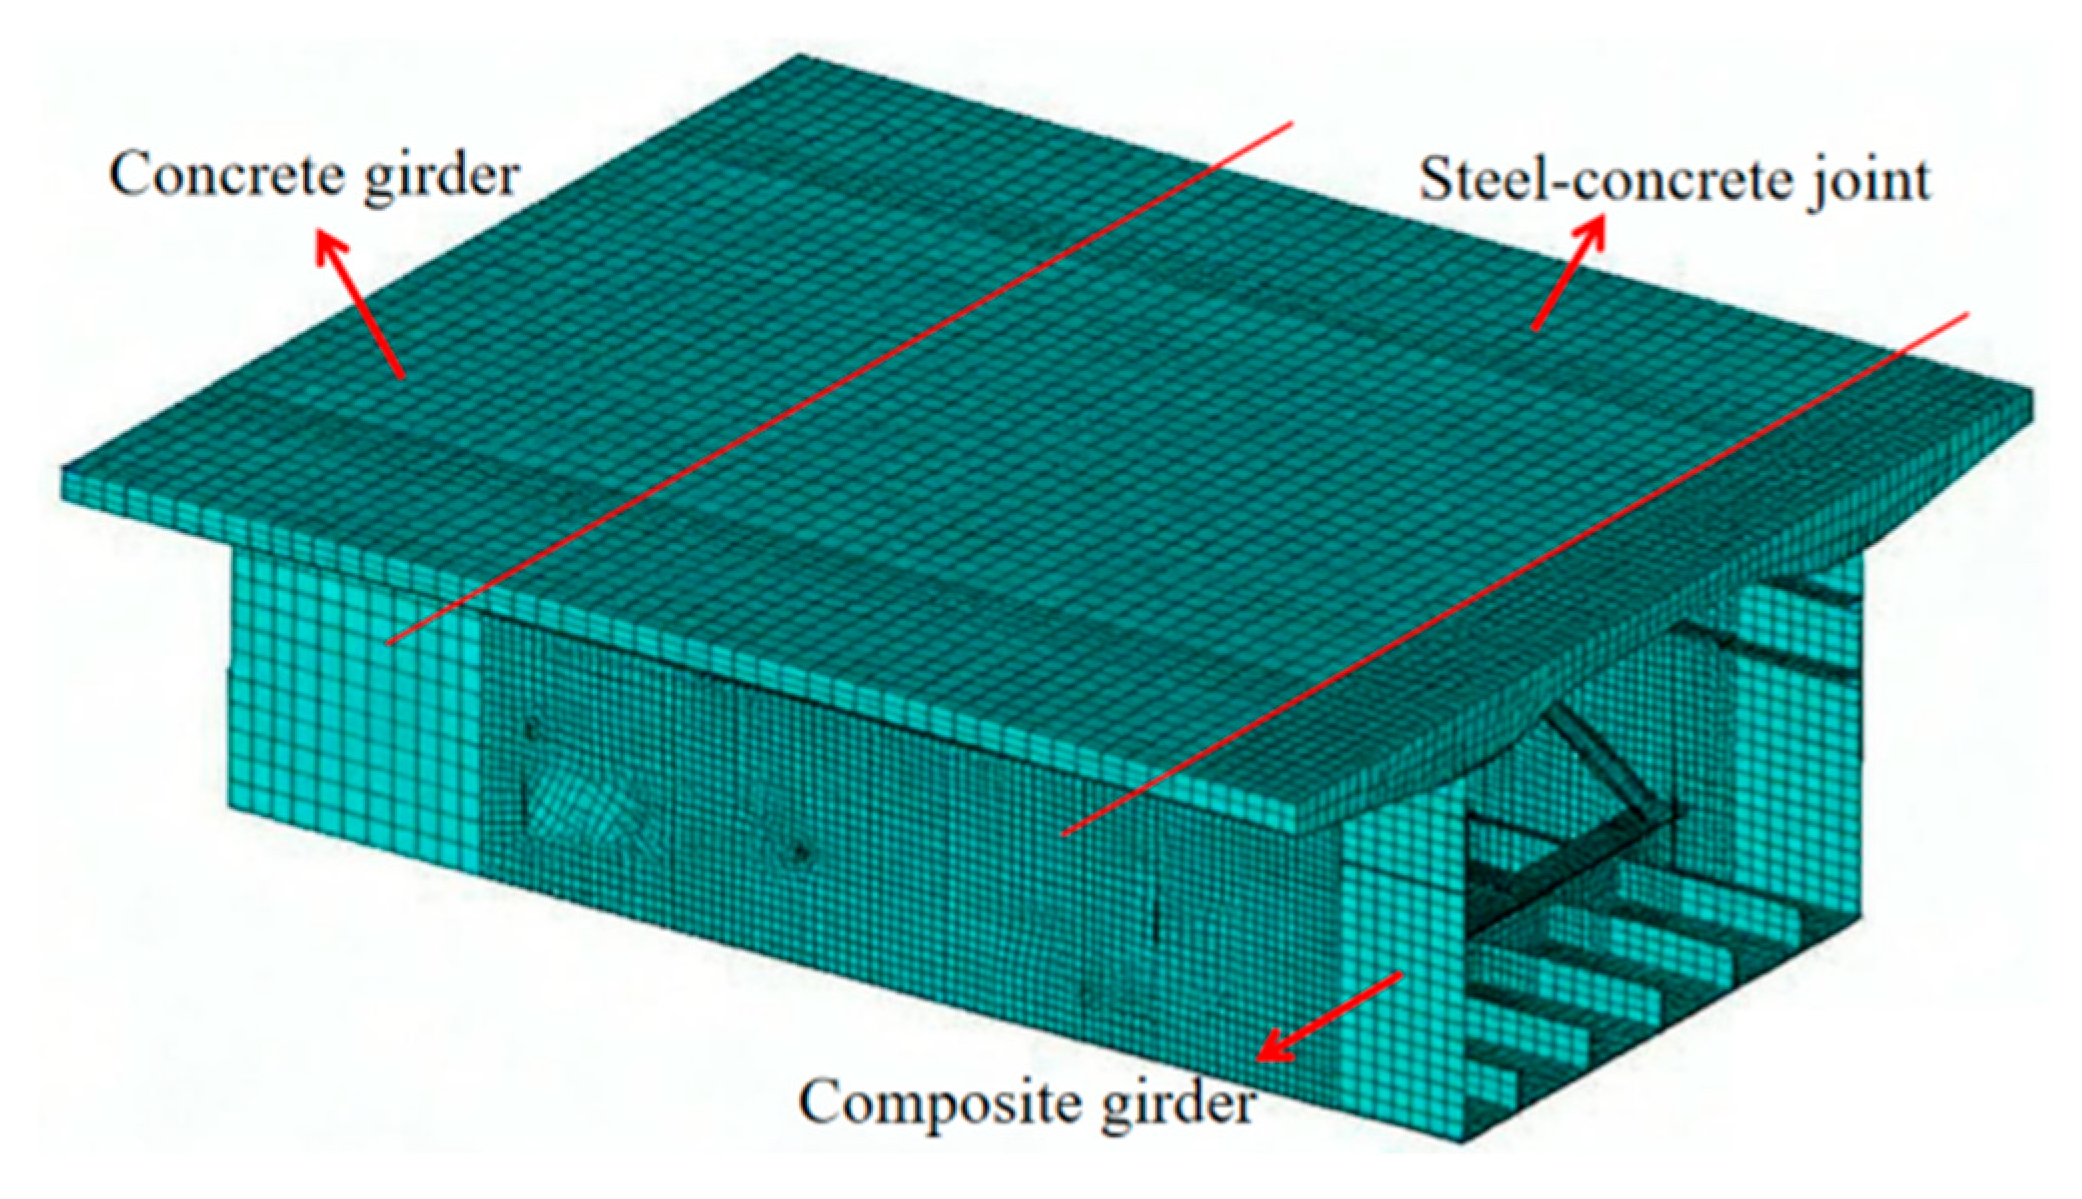
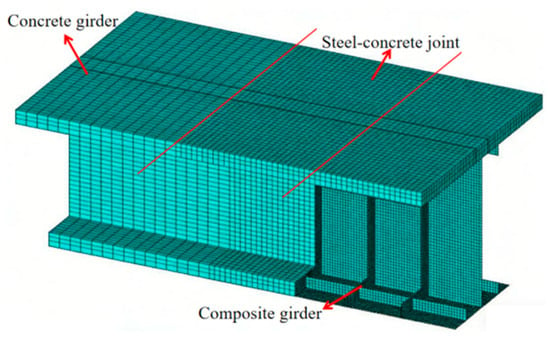
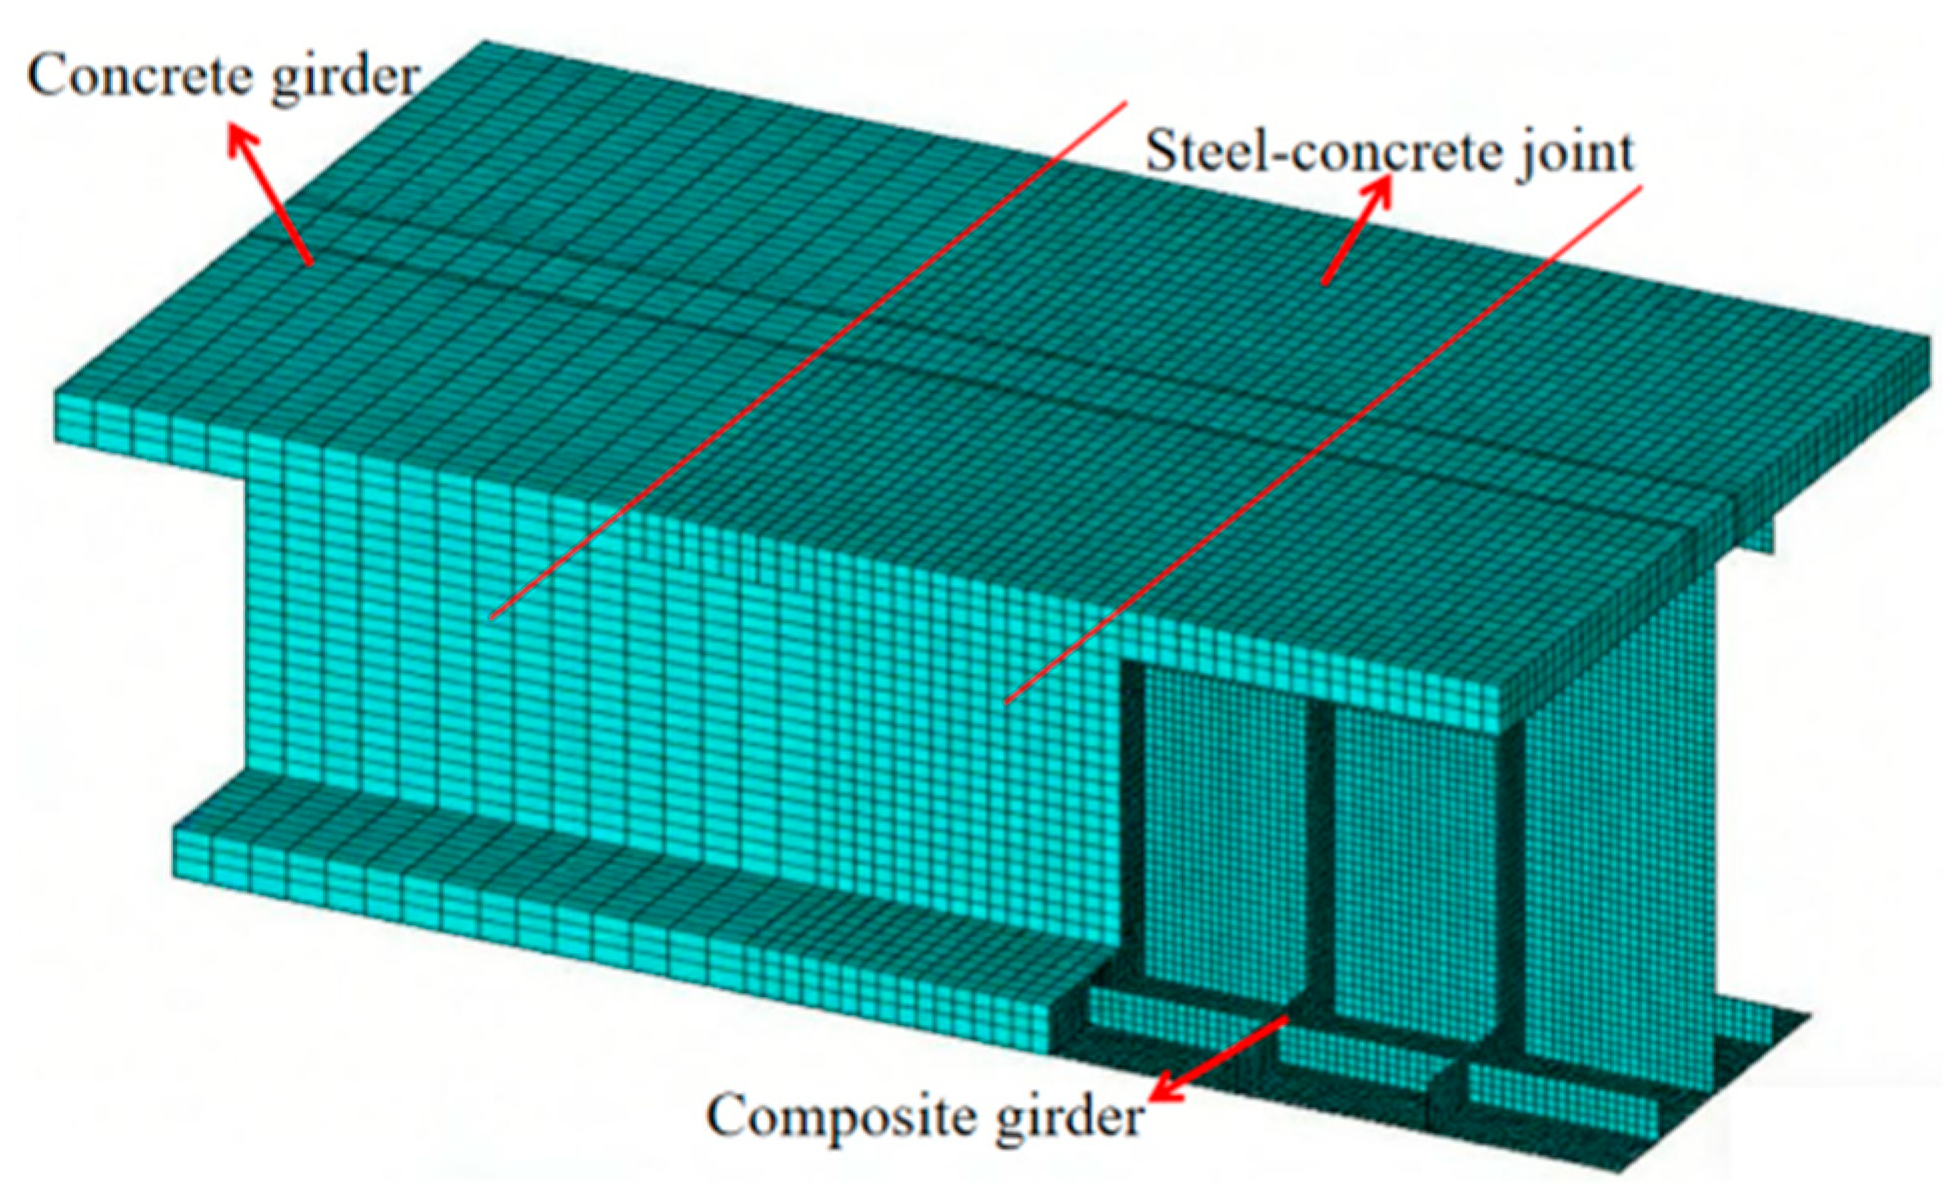
The finite element model of the novel steel-concrete joint, developed in ANSYS 19.0, is shown in Figure 4. The steel plates were modeled using Shell181 elements; the concrete was modeled using Solid65 elements; and the prestressed tendons and rebar were modeled using Link8 elements. Based on a mesh sensitivity study, a global mesh size of 20 mm was adopted, with local refinement down to 5 mm or 10 mm in critical regions of the joint. The steel-concrete joint includes a large number of welded studs and PBL, but this study primarily focuses on the overall force distribution and the forces on the connectors, not the force distribution within the connectors. Therefore, the connectors were modeled using linear spring elements (Combin14), with the shear stiffness of the spring elements corresponding exactly to that of the actual PBL and stud connectors. Since steel-concrete joints are generally chosen in areas with low structural forces, and designs often use thicker plates and stronger concrete, the forces within the components of the joint are relatively small. Excluding the effects of local stress concentrations, the entire joint’s forces are within the linear elastic range. The materials within the joint were modeled using linear elastic constitutive laws [33], as shown in Table 1.
Figure 4.
Finite element model.
Table 1.
Material Parameters in the joint.
In the finite element model, the ends of the concrete beams were fixed, while the ends of the composite beams were subjected to bending moments (7446 kN·m) and shear forces (4204 kN) via rigid domain constraint equations in ANSYS. The prestress was introduced using the equivalent temperature load method. The bond behavior between the prestressed tendons, rebar, and concrete was simulated through displacement constraint equations. To minimize the influence of the fixed constraints at the beam ends and the loading constraints on the force distribution in the joint, boundary conditions are applied in areas 1 times the beam height away from the joint at both ends of the model, based on Saint-Venant’s principle.
3.2. Stress Analysis of the New Steel-Concrete Joint
The novel hybrid continuous beam is an organic combination of composite beams and prestressed concrete beams. Composite beams are typically more susceptible to stress under negative bending moments, which can cause cracking of the concrete deck or instability of the steel beam’s bottom plate. Consequently, this section employs a FE model to conduct an in-depth investigation into the mechanical response of the novel joint under negative bending moments, thereby elucidating the load-transfer mechanisms across three core components: concrete, steel plates, and shear connectors.
3.2.1. Concrete Stress Analysis
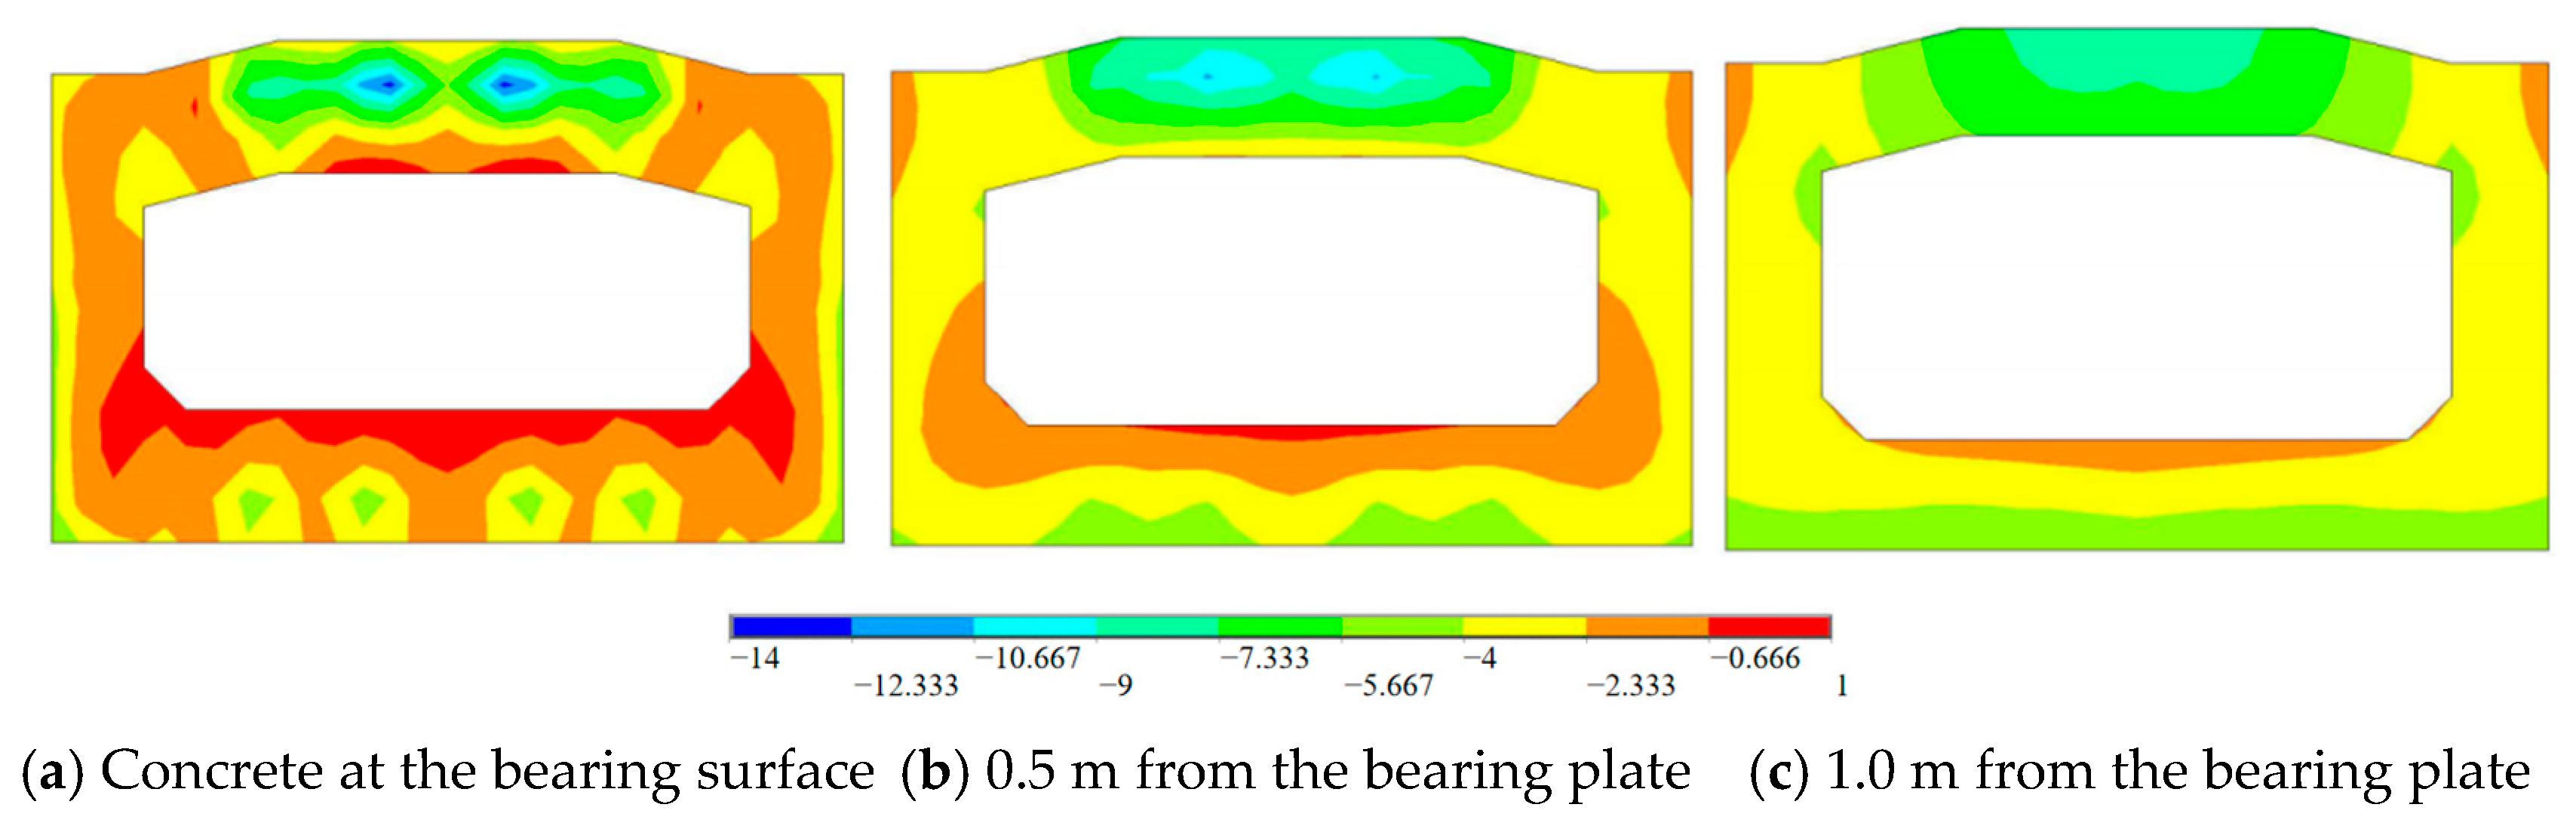
The distribution of the compressive normal stress in the concrete at different distances from the bearing surface is shown in Figure 5. Due to the local prestress anchorage effect, the compressive stress in the concrete at the bearing surface exhibits noticeable stress concentrations. However, the constraint effect within the concrete causes tensile stress to appear in the local edge regions, as shown in Figure 5a. On the bearing surface, the maximum compressive stress in the concrete reached 14.0 MPa. However, as the distance from the bearing surface increases, the local effect of the prestress effectively diffuses, and the compressive stress concentration in the concrete gradually flattens. At a distance of 1 m from the bearing surface, the stress distribution becomes nearly uniform, indicating that the prestress has effectively diffused at this distance, and the concrete is overall in a uniformly compressed state.
Figure 5.
Concrete stress distribution at different positions (Unit: MPa).
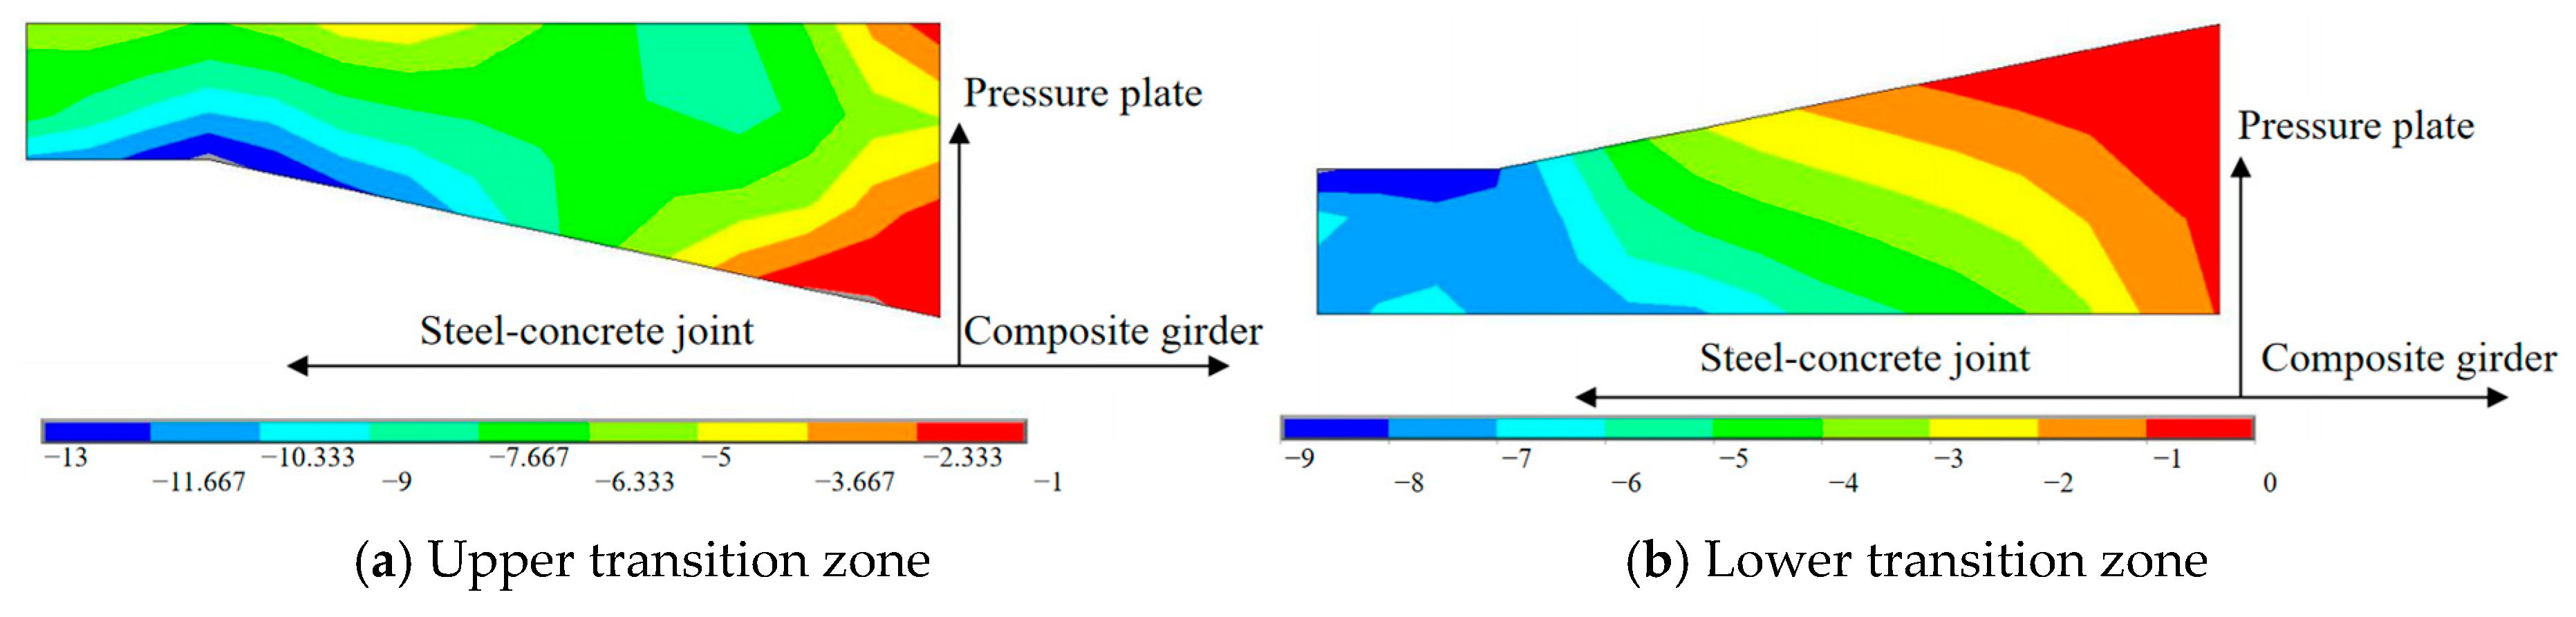
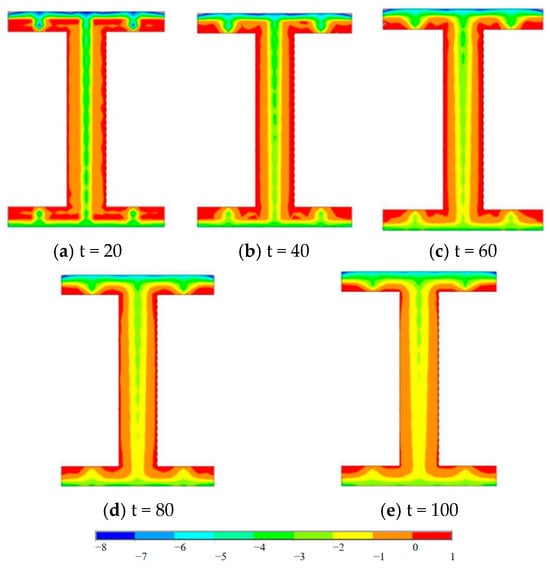
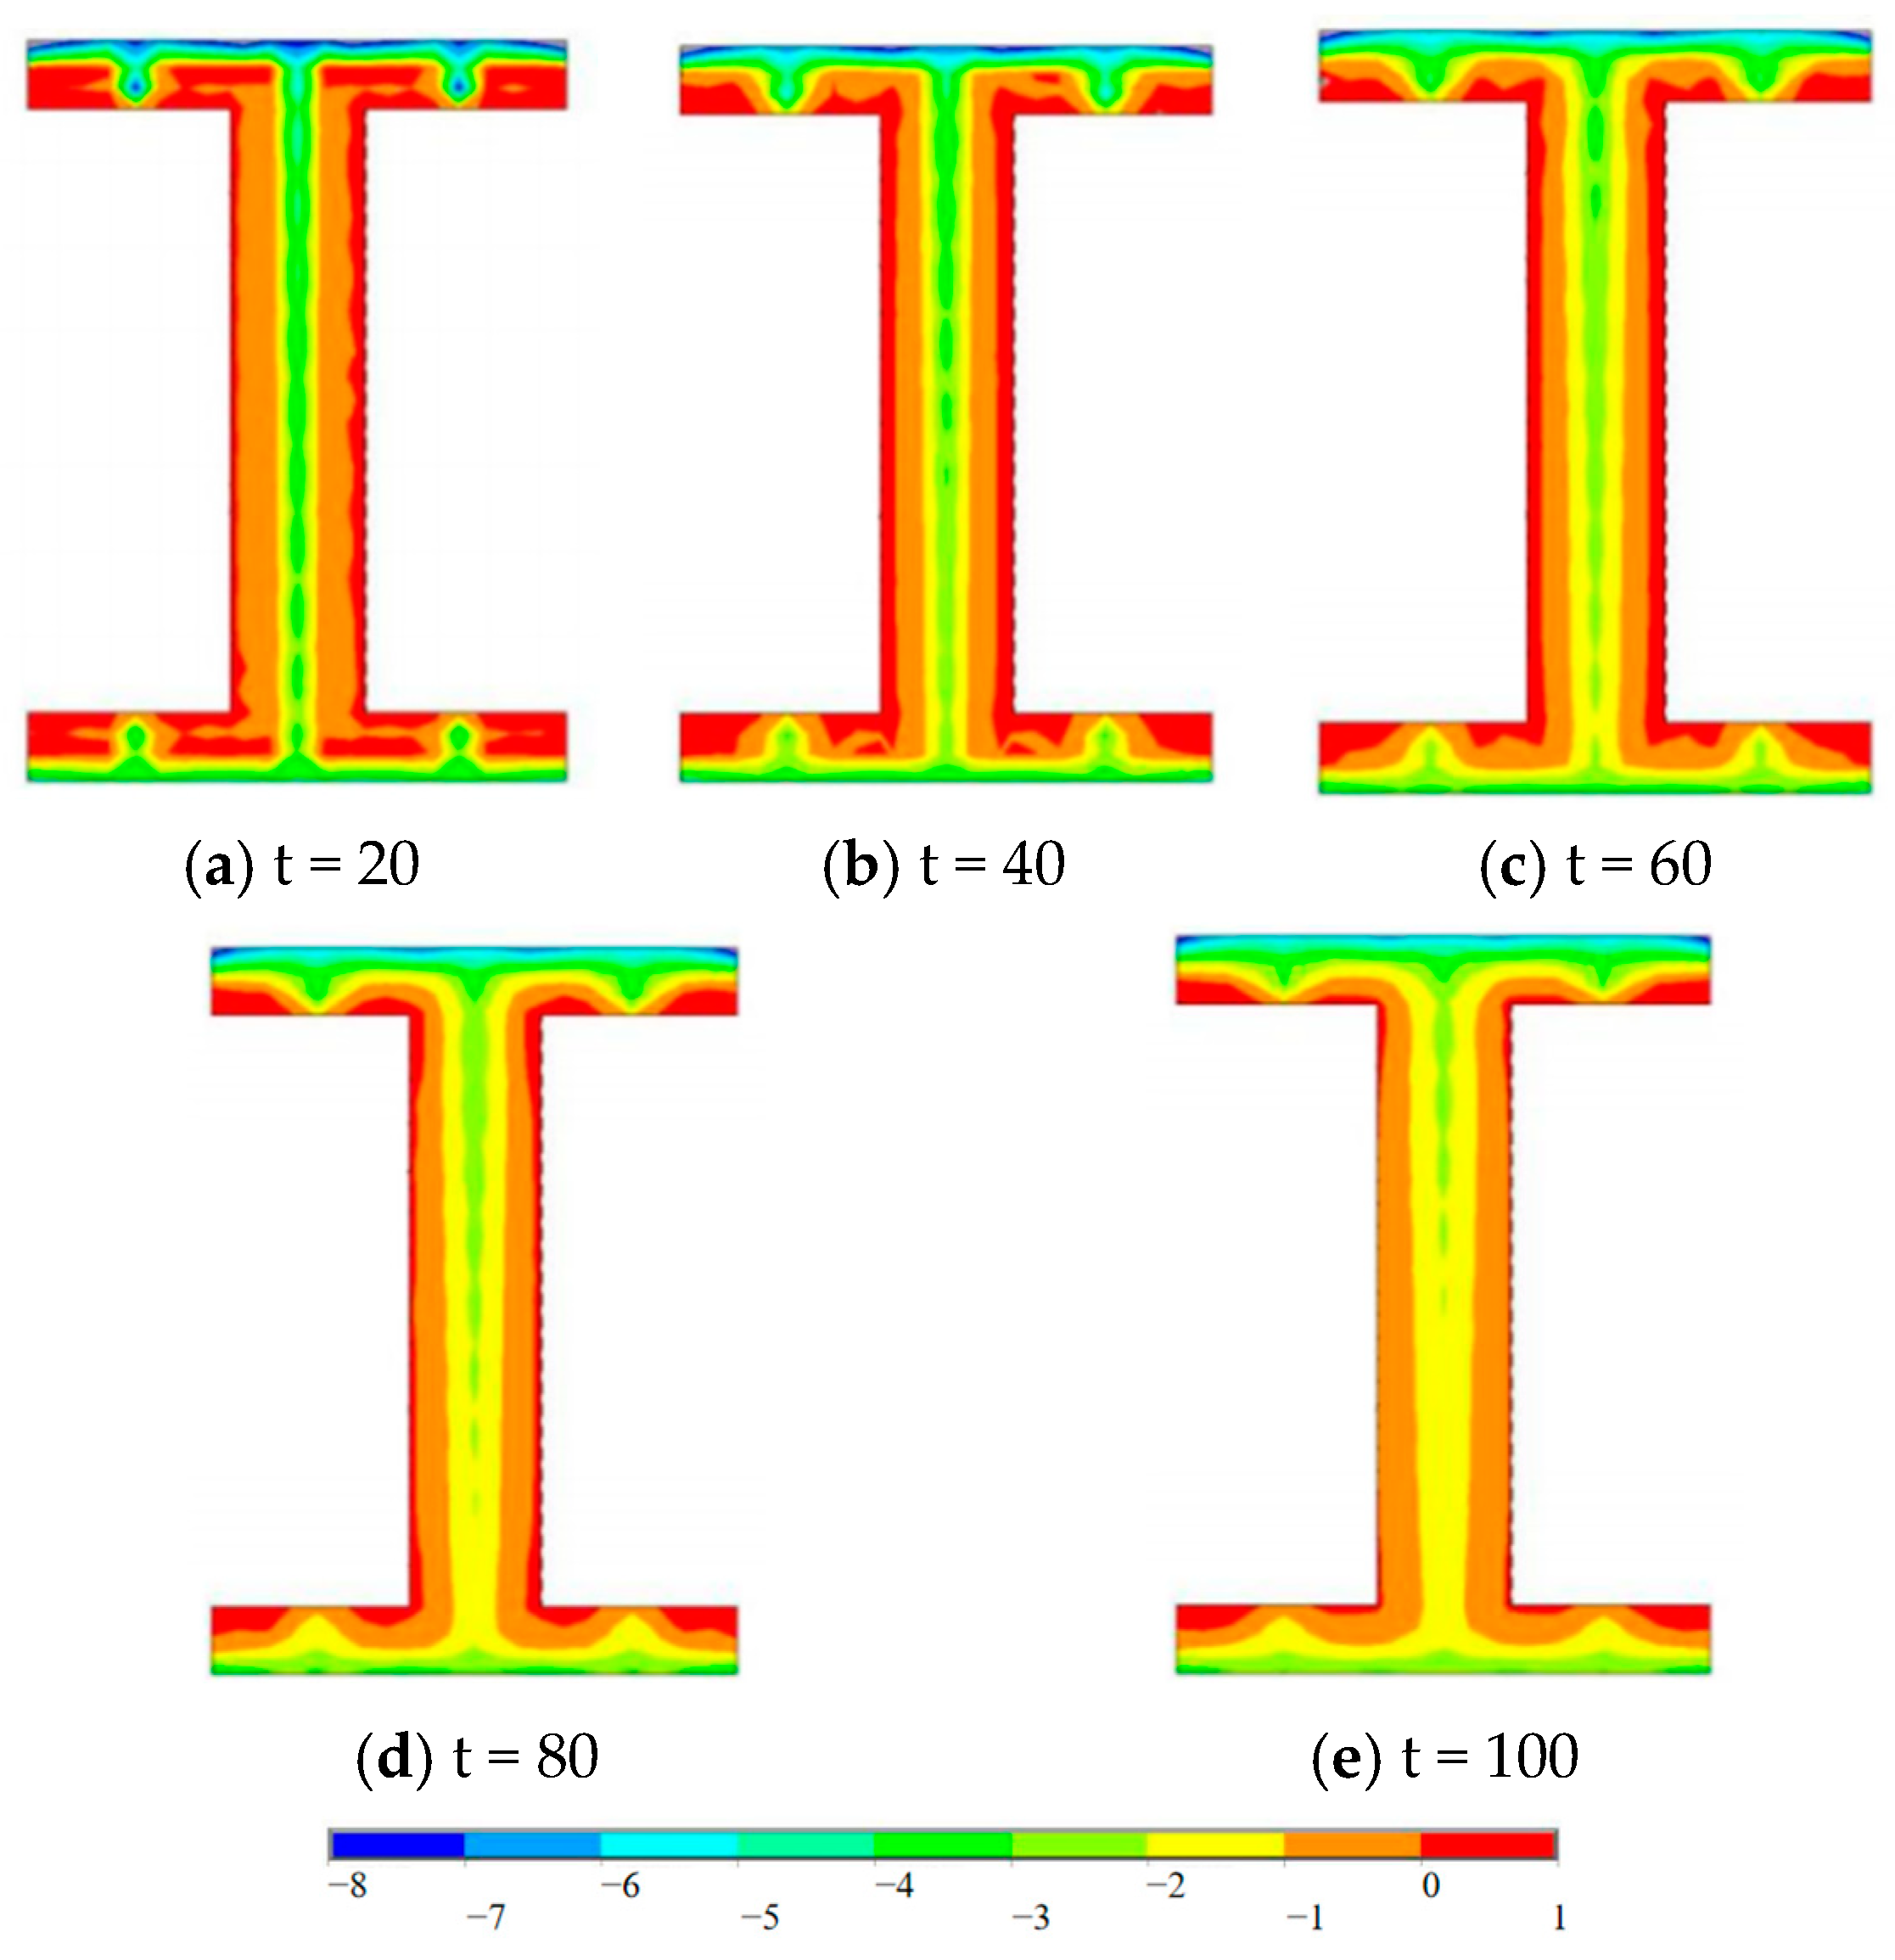
The longitudinal stress distribution of the concrete in the upper and lower transition sections of the joint is shown in Figure 6. Overall, the stress is transmitted smoothly along the longitudinal direction of the bridge. Concrete farther from the bearing plate experiences greater stress, while the regions closer to the bearing plate are subjected to lower stress. This distribution pattern is consistent with the load transfer mechanism in the joint, where the connectors gradually transfer the load to the concrete. Notably, the concrete in the lower transition section exhibits a more pronounced stress gradient than the upper transition section. This is mainly due to the local anchorage effect of the prestressed tendons in the upper transition section, where the prestress causes a significant stress diffusion near the bearing plate, thereby improving the uniformity of the stress distribution in that region.
Figure 6.
Longitudinal concrete stress distribution of the bridge (Unit: MPa).
3.2.2. Steel Plate Stress Analysis
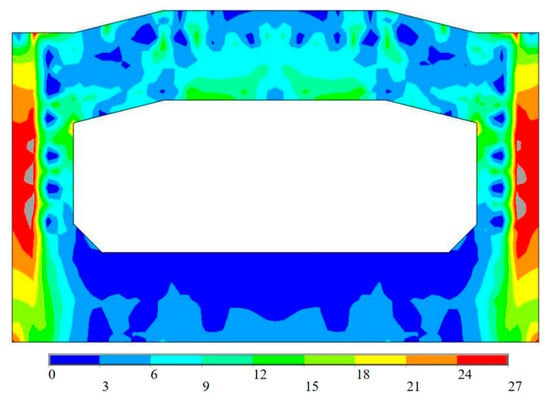
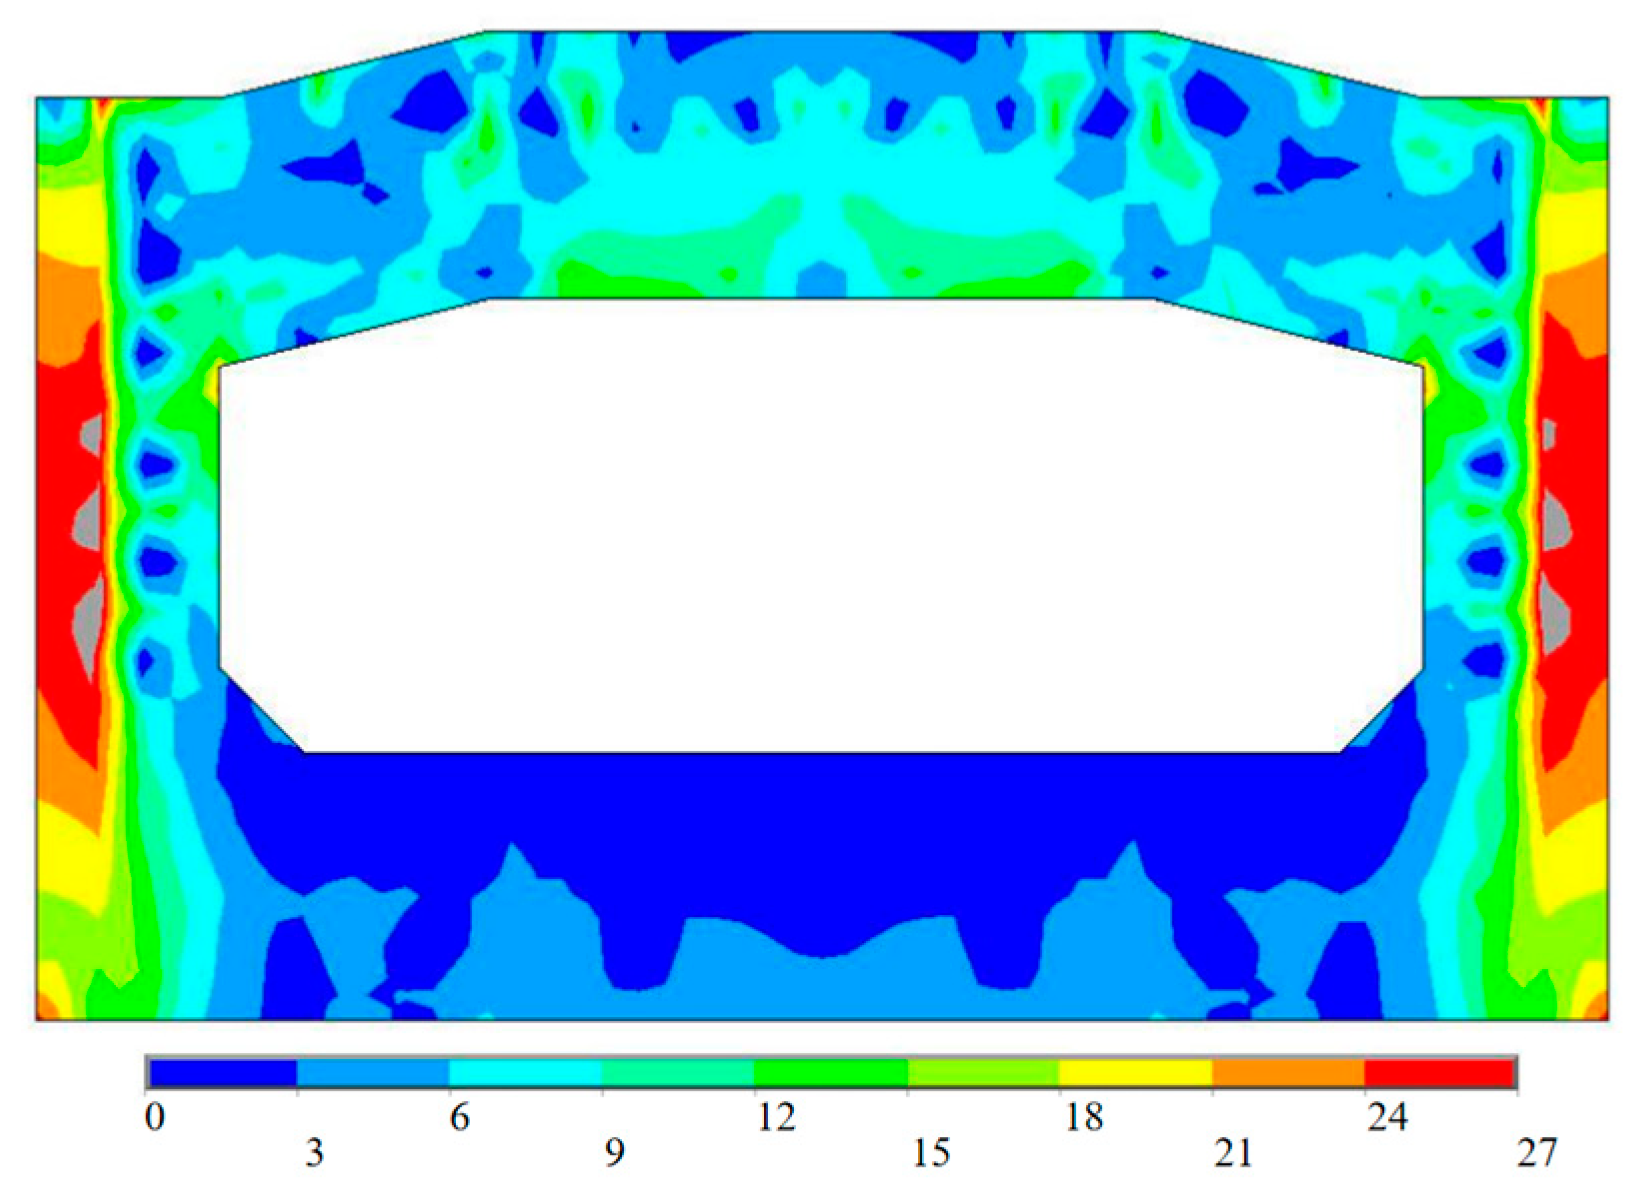
As shown in Figure 7, the von-Mises stress distribution in the bearing plate of the joint exhibits spatial non-uniformity. Along the axial force transfer path, the edge regions of the bearing plate, which have higher in-plane stiffness, mainly transfer the axial force, leading to higher edge stresses. In contrast, the central part of the plate has perforated structures and lower out-of-plane stiffness, resulting in weaker axial force transfer capacity and lower stress levels in that region. Additionally, the geometric eccentricity between the steel web of the composite beam section and the PBL in the joint introduces an eccentric load on the bearing plate, causing out-of-plane bending deformation and resulting in localized stress concentrations in that area. However, the out-of-plane concrete provides an elastic constraint on the bearing plate, suppressing its overall out-of-plane deformation. As a result, except for the aforementioned areas of higher localized stress, most of the bearing plate’s stress remains low.
Figure 7.
Von-Mises stress distribution in the bearing plate of the joint (Unit: MPa).
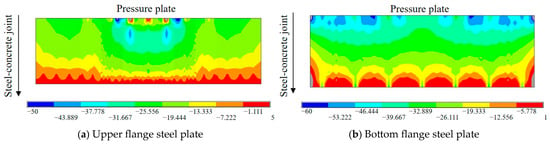
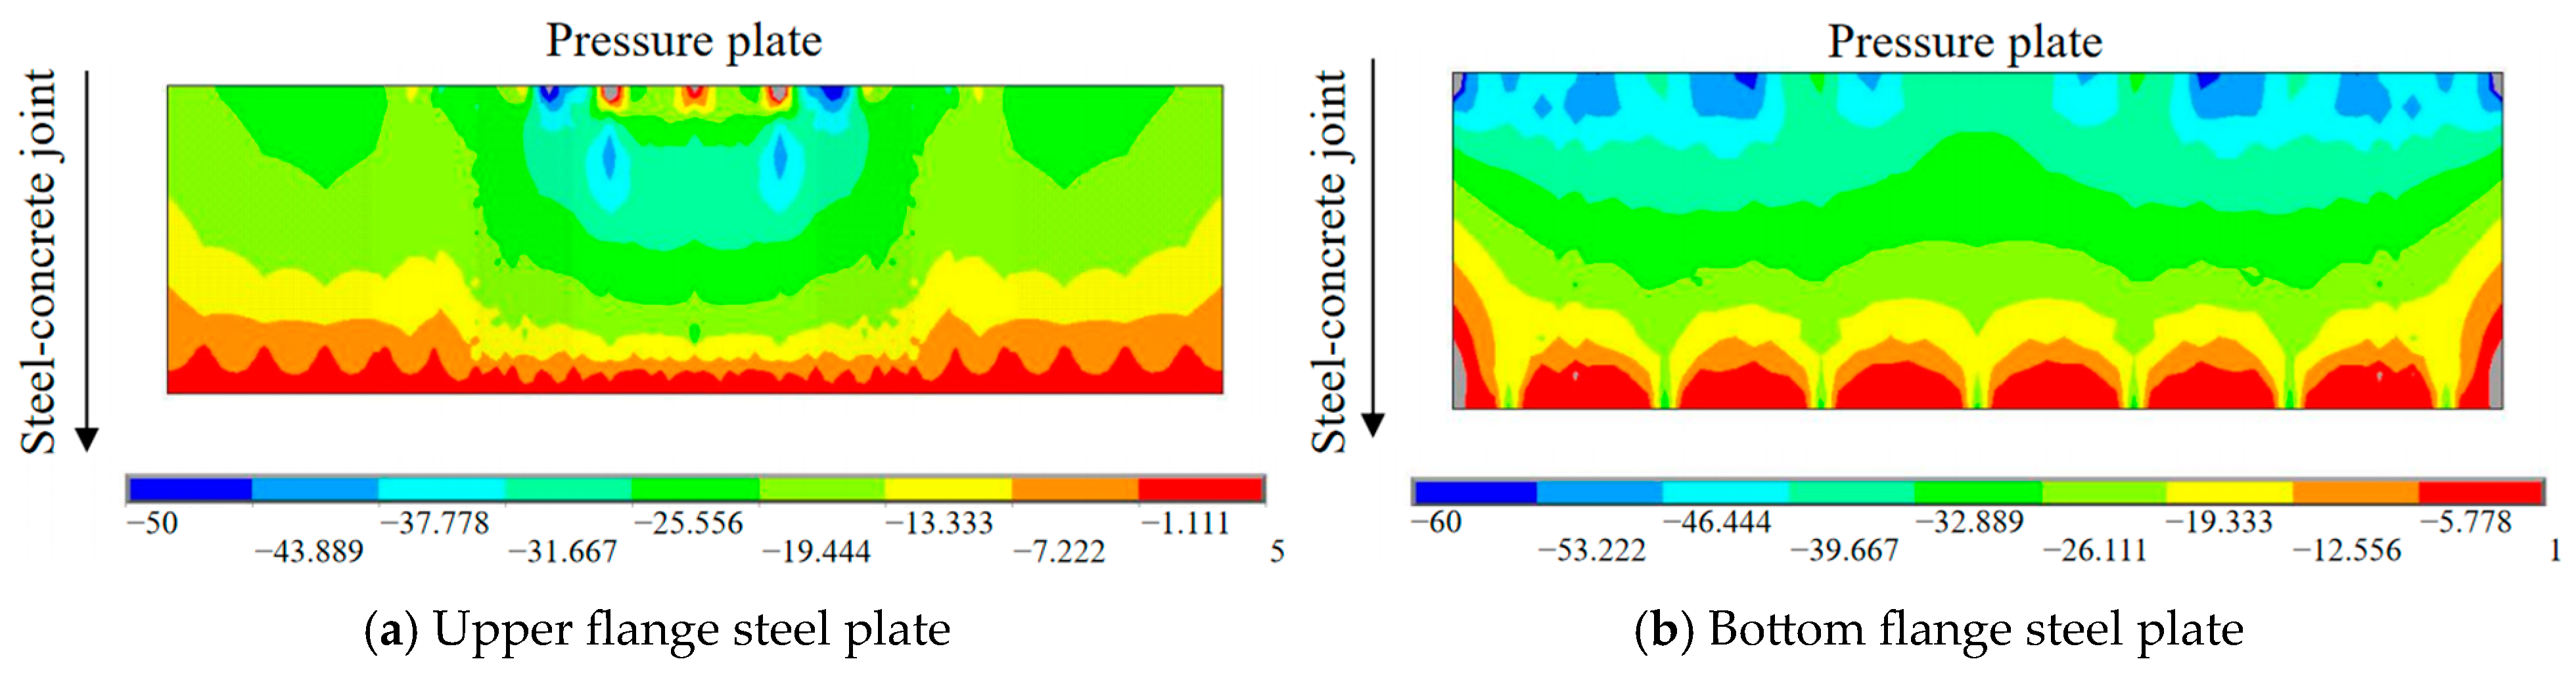
At this point, the stress in the upper and lower flange steel plates exhibits noticeable fluctuations at the locations of the PBL connectors, as shown in Figure 8. This is due to the localized constraint on the steel plate deformation by the connectors and the redistribution of shear forces. However, from an overall distribution perspective, the stress changes relatively smoothly along the bridge direction, indicating that the PBL connectors effectively coordinate the deformation at the steel-concrete interface. This allows the steel plate stress to be gradually transferred to the concrete components via the shear flow generated by the connectors, ensuring reliable diffusion and transfer of internal forces within the joint.
Figure 8.
Longitudinal steel plate stress distribution (Unit: MPa).
3.2.3. Connector Stress Analysis
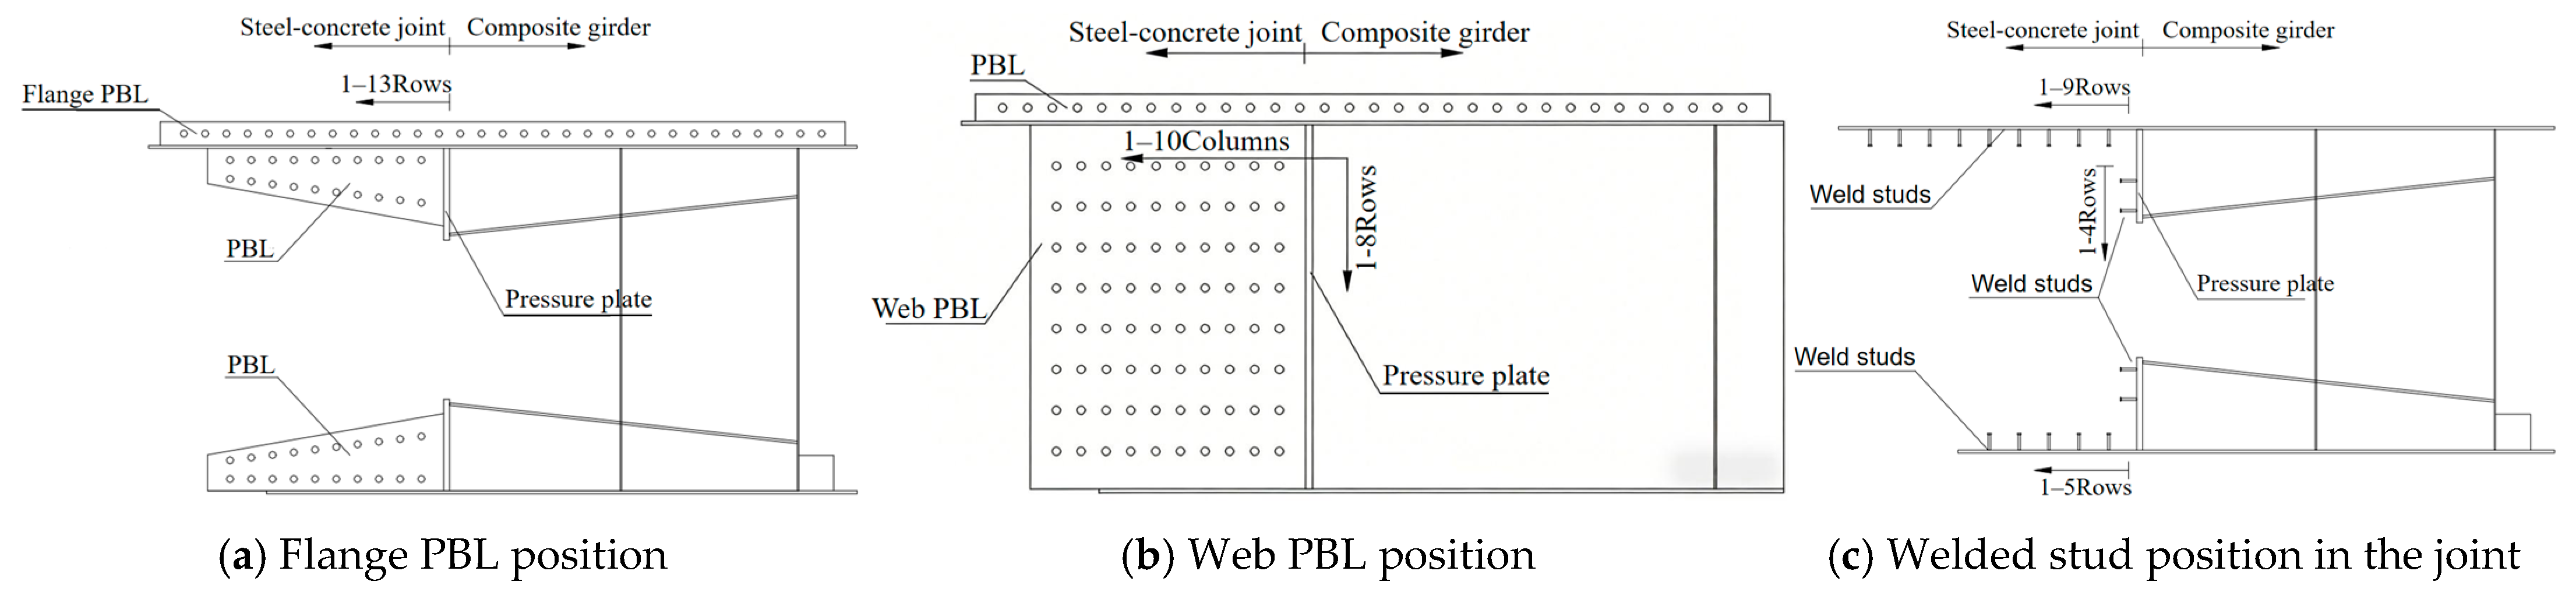
To ensure the safety and reliability of the joint, a large number of shear-resistant connectors are often arranged within the joint. The stress and distribution of the connectors directly reflect the force performance of the joint. To better analyze the force mechanism of the connectors, the positions of the shear-resistant connectors in the new type of joint are divided, as shown in Figure 9.
Figure 9.
Connector locations in the joint.
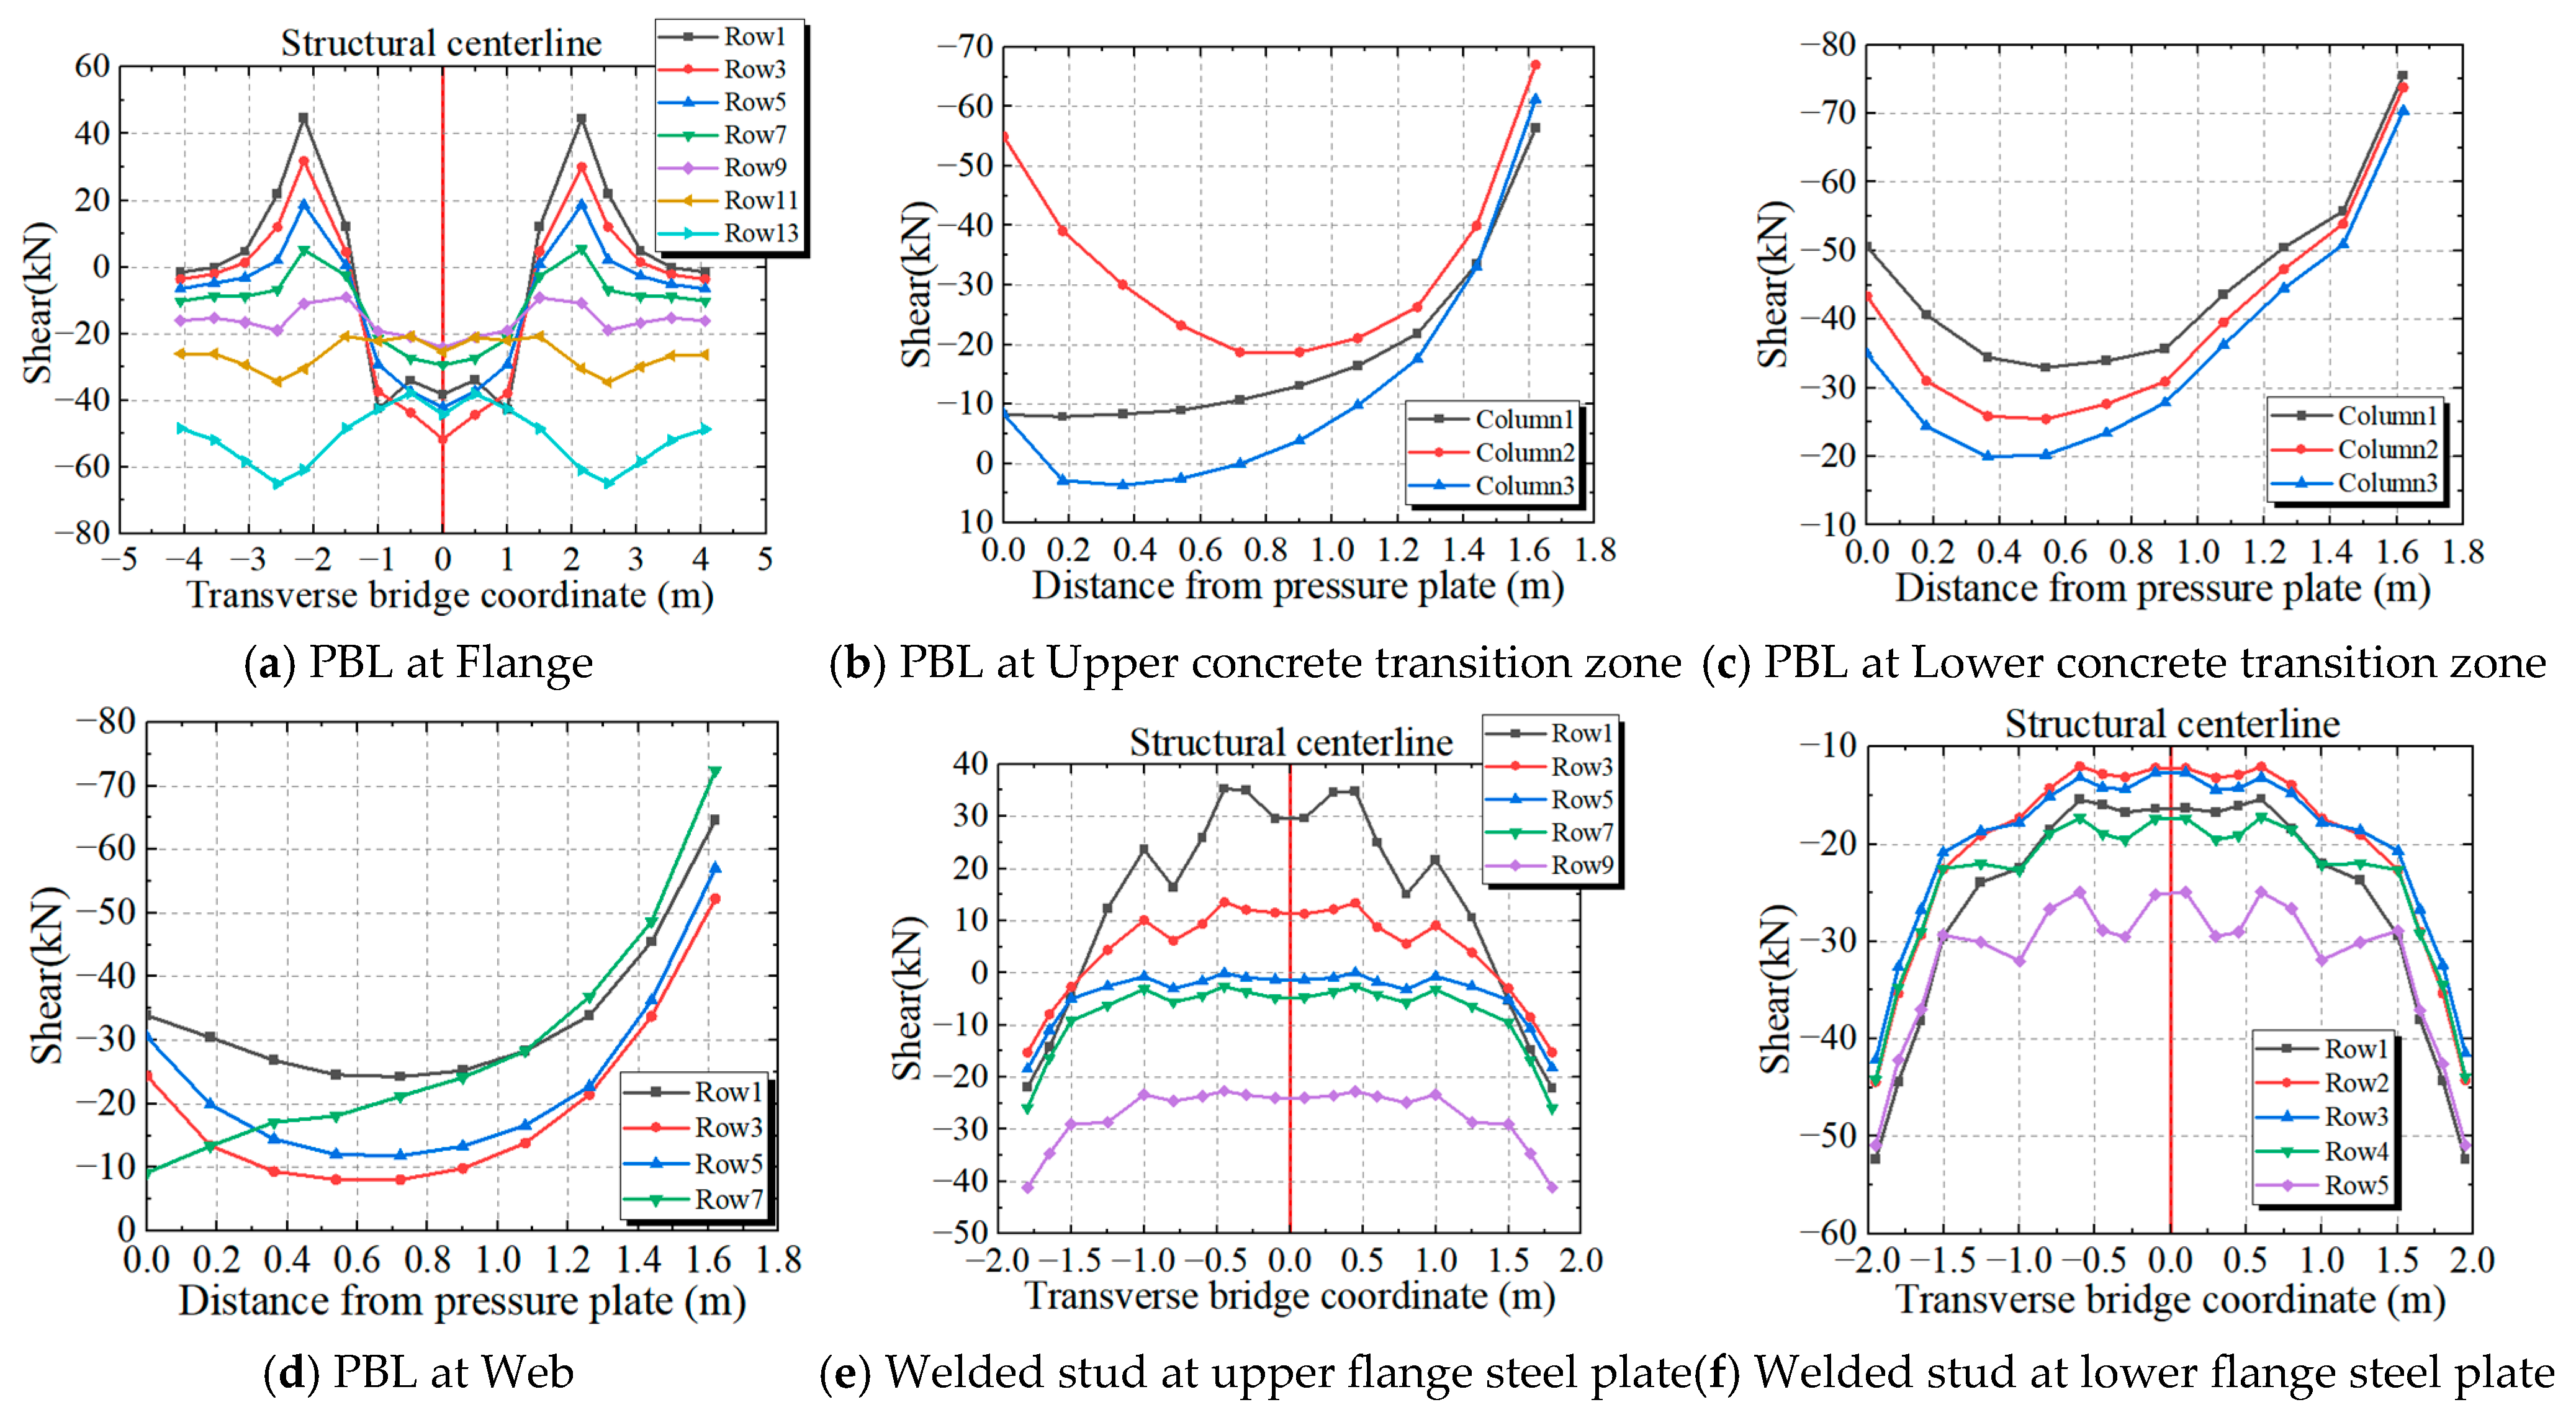
Figure 10 shows the longitudinal shear force distribution of the connectors in the joint. Figure 10a illustrates the shear force distribution at the PBL openings along the upper flange. It can be seen that the PBL in the region above the web are significantly stressed, with the maximum shear force reaching −65 kN. The shear force direction reverses along the longitudinal direction of the bridge, which is primarily due to the “weak–strong–weak” variation in the stiffness of the upper edge of the joint. Therefore, under axial pressure, the concrete top plate stress in the three beam segments of the joint first increases and then decreases. The unbalanced internal force generated during this process must be transferred through the connectors in the top plate, causing the shear force direction to change.
Figure 10.
Longitudinal shear force distribution of each connector in the joint.
The shear force distribution of the remaining PBL connectors follows a “saddle shape,” with higher shear forces at both ends and lower shear forces in the middle, as shown in Figure 10b–d. The peak shear force occurs near the end of the joint, close to the concrete beam segment, with the maximum longitudinal shear force approaching −80 kN, indicating that this area is a key location for internal force transfer.
As shown in Figure 10e,f, the longitudinal shear force distribution of the welded stud connectors in the upper and lower flange steel plates exhibits similar spatial characteristics to the PBL connectors. From a transverse bridge direction view, the welded studs near the web, due to their higher stiffness and concentrated stress transfer, experience significantly higher longitudinal shear forces than the middle region, displaying a “saddle shape” distribution with higher values at the ends and lower values in the center. Under the bending moment, the direction of the longitudinal shear force on the welded studs at the upper flange changes. However, since the shear stiffness of the welded stud connectors is relatively small, compared to the PBL connectors, the peak longitudinal shear force they experience is smaller, around −50 kN. This suggests that the PBL bears a larger proportion of the longitudinal shear force in the joint, while the welded studs primarily assist in force transfer and distribute the local shear forces.
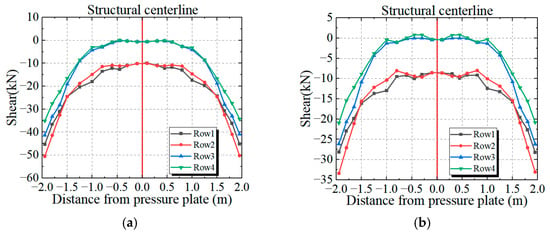
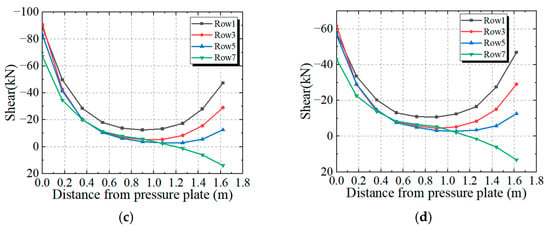
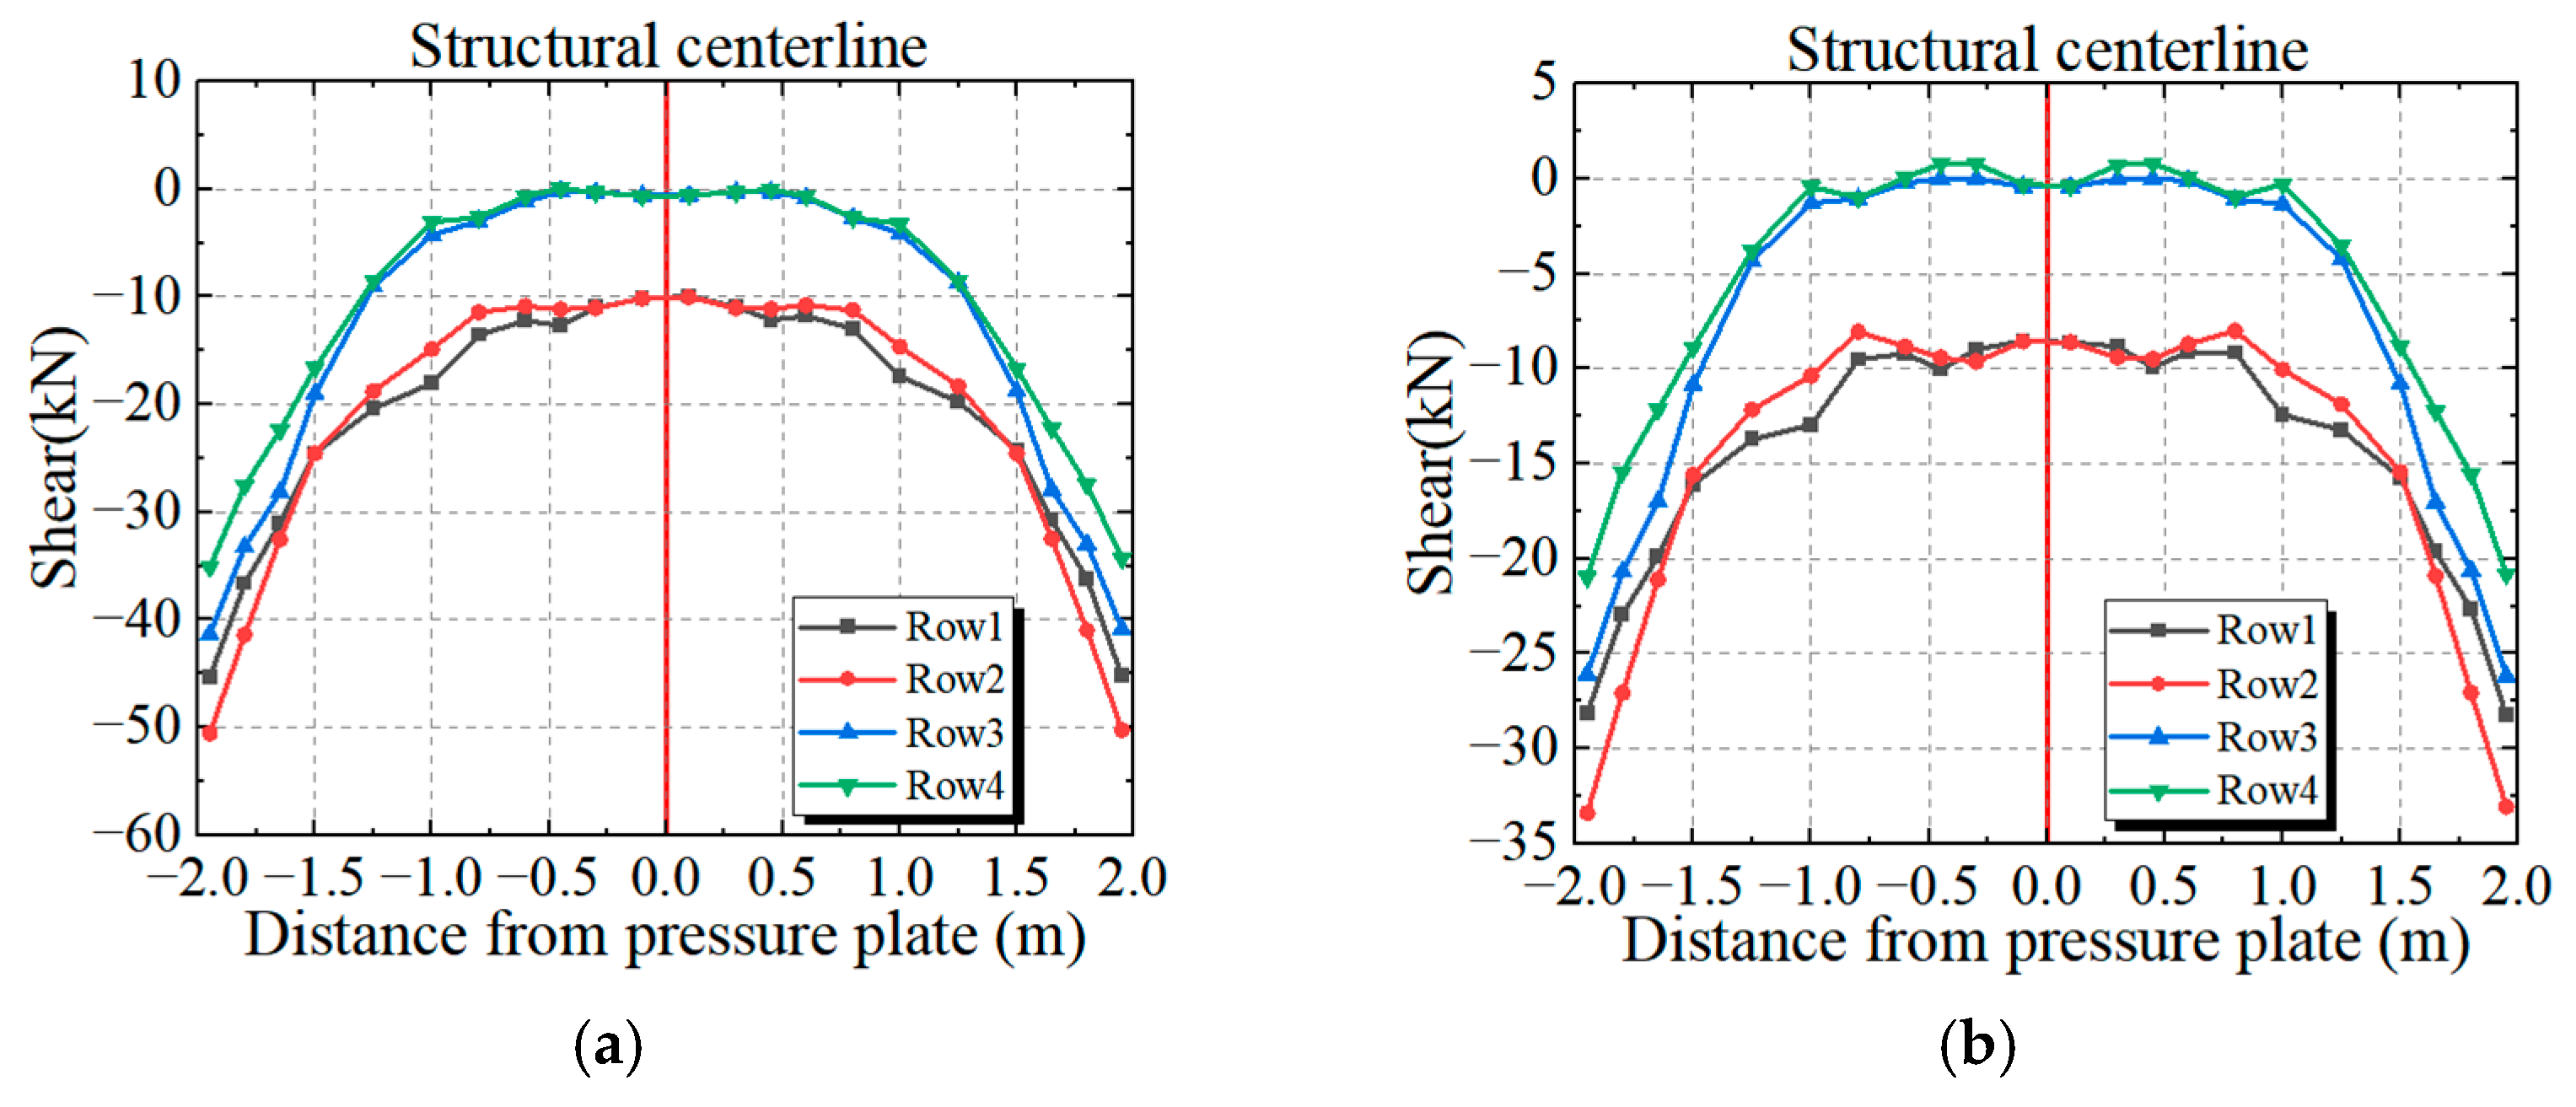
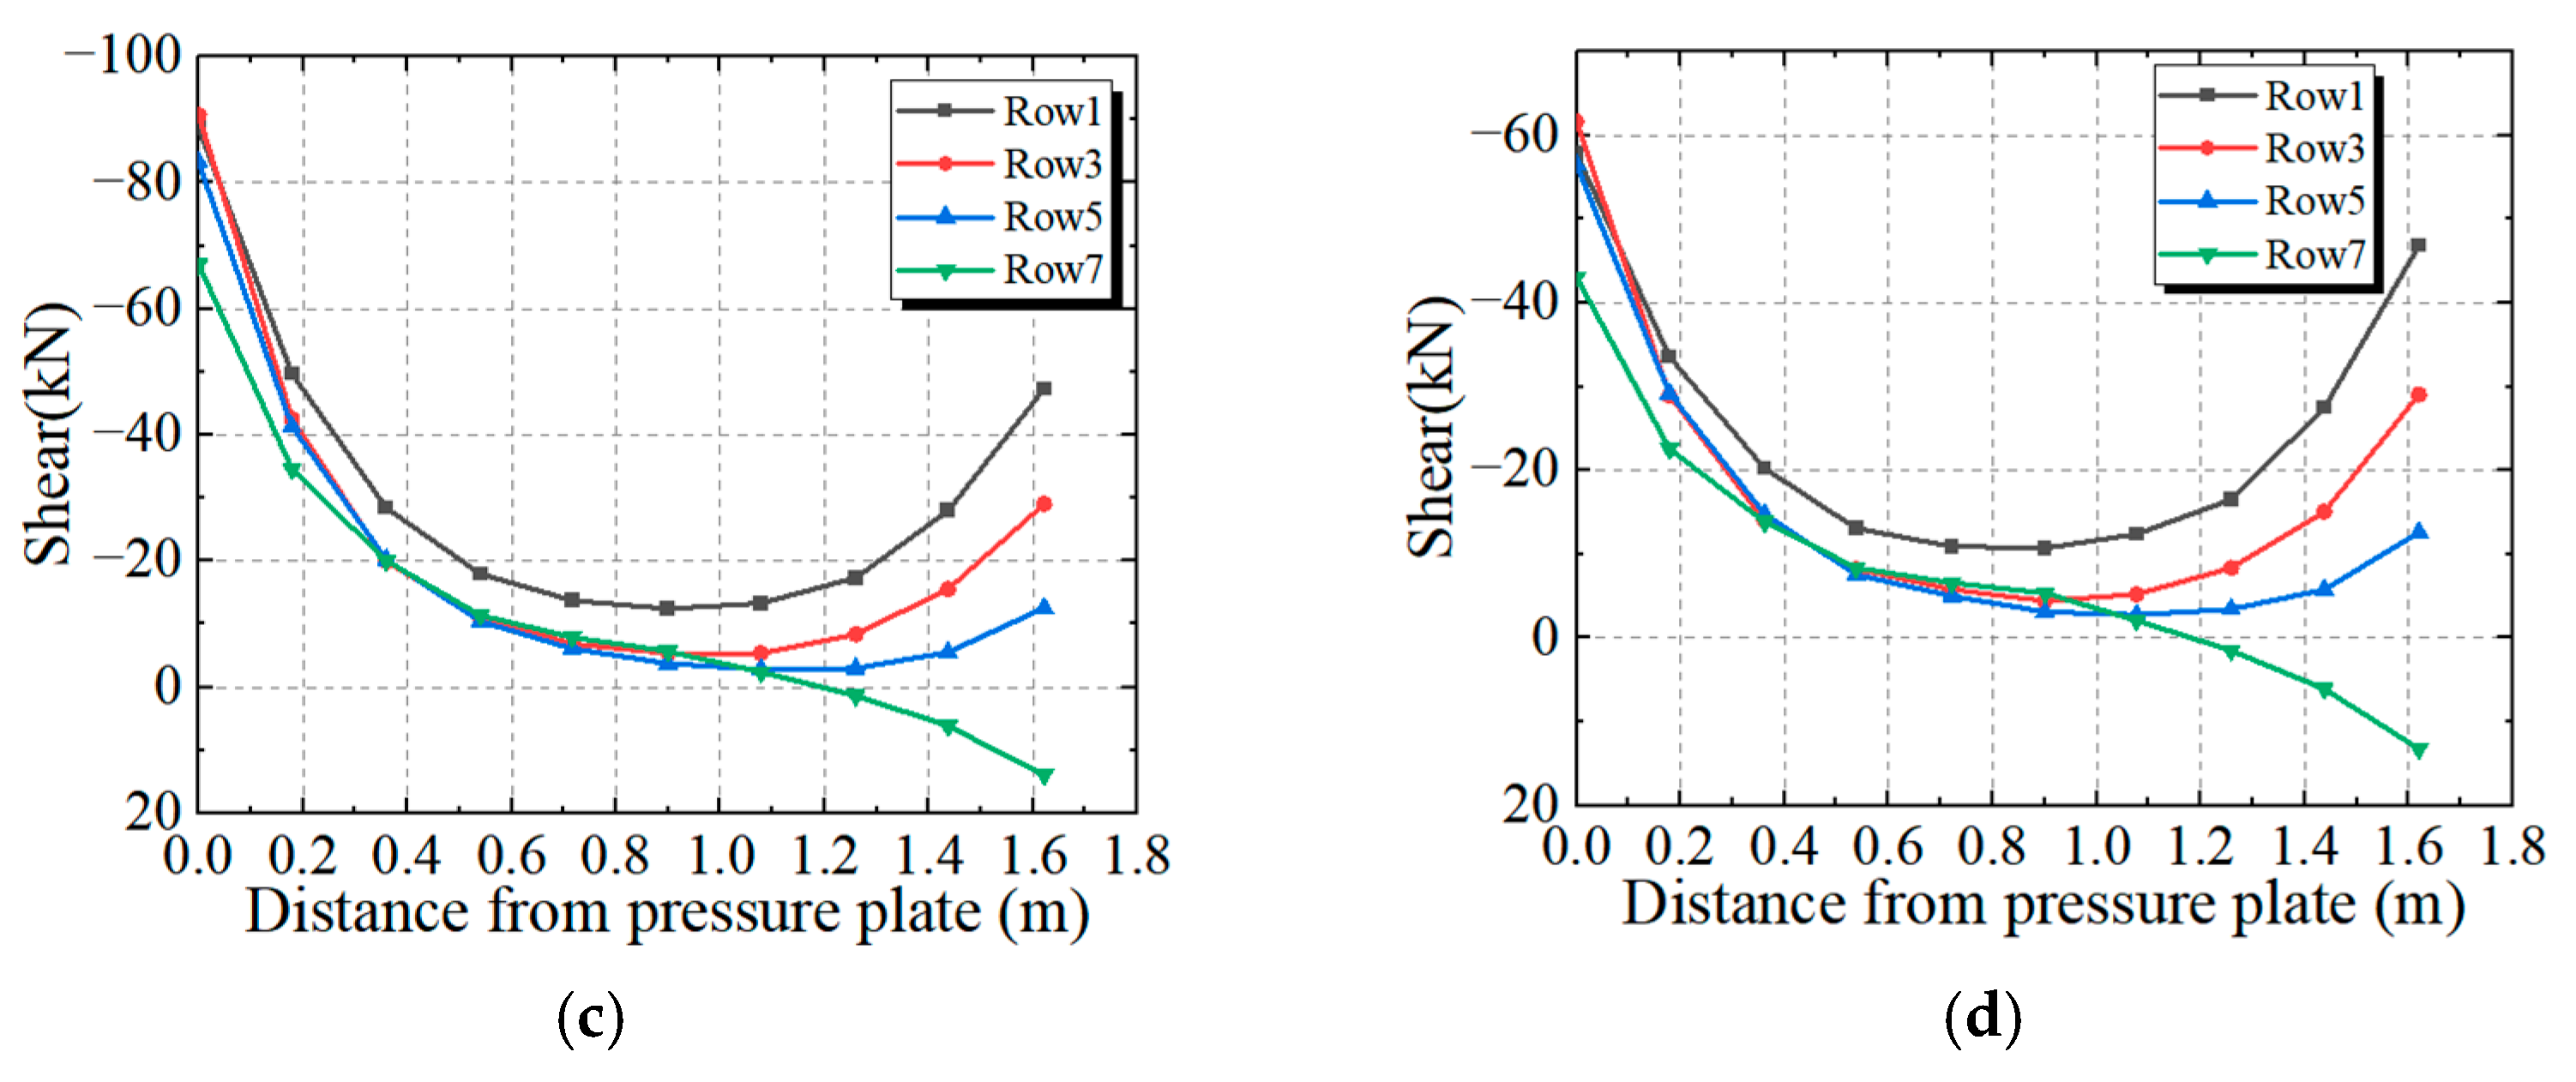
The connectors in the joint not only have to bear longitudinal shear forces but also experience vertical shear forces. To ensure the overall stiffness and durability of the new steel-concrete joint, sufficient prestressed tendons were arranged. Under prestress, significant frictional forces develop at the steel-concrete bearing interface, which can have a notable impact on the shear resistance of the connectors, though the extent of this effect is still unclear. To quantitatively assess the influence of the friction effect on the stress distribution of the connectors, this study compares the vertical shear forces on the connectors in the joint under two conditions: considering friction and not considering friction. In the finite element simulation, to reasonably reflect the friction behavior at the bearing surface, the friction coefficient is set to 0.3, the bonding frictional stress is conservatively taken as 0, and the maximum frictional stress is considered as ( standard tensile strength of concrete) [34].
The vertical shear forces borne by the welded studs and the PBL on the bearing plate, under the two scenarios with and without friction, are shown in Figure 11. From Figure 11a,b, it can be seen that the vertical shear forces on the two rows of welded studs on the upper bearing plate are larger, while the shear forces on the lower two rows are smaller. The peak vertical shear forces on each row of studs differ by nearly 15 kN between the two scenarios. This indicates that the friction effect significantly influences the peak shear force on the welded studs at the bearing surface, but it has a limited effect on the stress distribution pattern of the studs. According to the closed thin-walled beam theory, when the box girder cross-section bears shear forces, the shear flow is transferred from the center of the cross-section to the webs of the box girder, gradually increasing. Therefore, in the transverse direction of the bridge, the shear forces on the studs near the web are larger, while the shear forces on the studs near the center line of the cross-section are relatively smaller.
Figure 11.
Vertical shear force distribution of each connector in the joint. (a) Welded stud at the bearing plate (Ignoring bearing surface friction effect); (b) Welded stud at the bearing plate (Considering bearing surface friction effect); (c) Web PBL (Ignoring bearing surface friction effect); (d) Web PBL (Considering bearing surface friction effect).
From Figure 11c,d, it can be seen that the vertical shear force distribution on the PBL of the web is uneven, with the peak vertical shear force occurring at the first perforation nearest to the bearing plate. When friction is not considered, the maximum vertical shear force is 90 kN, but after considering the friction effect, it decreases to 60 kN. This is because, when friction is taken into account, the relative slip between the bearing surfaces decreases, leading to a reduction in the additional bending moment. The perforated shear force still reverses but with a smaller amplitude, resulting in a lower overall force level.
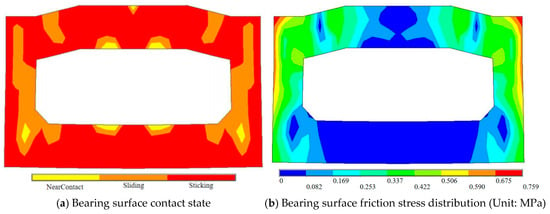
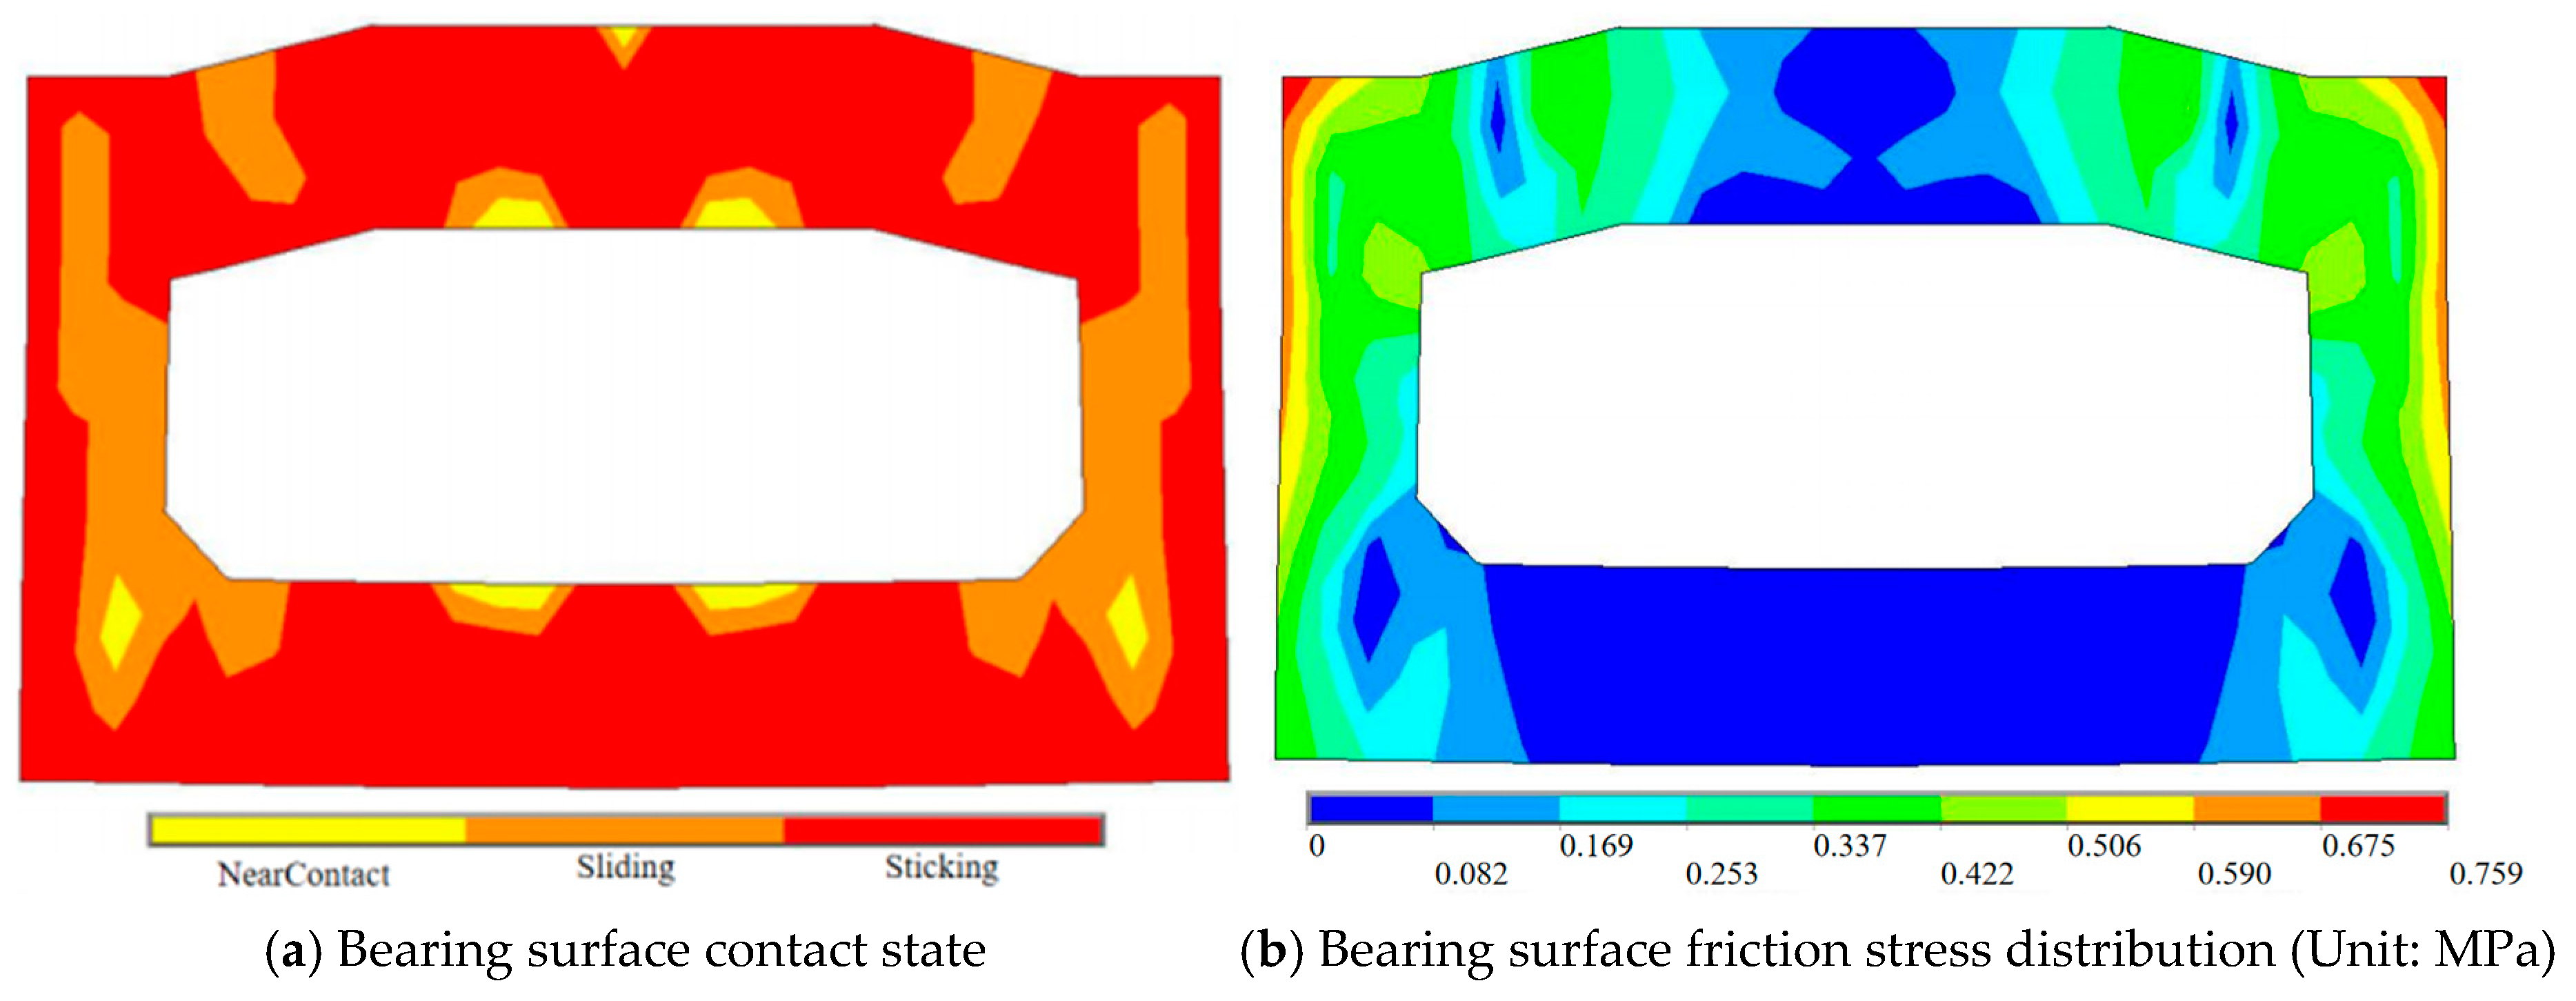
After considering the friction effect, the frictional force distribution at the bearing surface still exhibits significant non-uniformity, as shown in Figure 12. This non-uniformity is mainly due to the vertical shear forces in the joint, which are primarily transmitted through the steel web of the composite beam and then diffuse through the bearing steel plate to the contact surface. Meanwhile, the axial pressure effect induced by the prestressing within the joint is not transmitted uniformly across the contact surface, leading to higher compressive stress in the prestressed anchorage area, while other regions experience relatively lower stress. As a result, at the contact surface corresponding to the steel web position, the frictional shear force is larger, and interface slip will initially occur in this region. As the slip develops, the connectors gradually participate in the load transfer, eventually balancing with the shear force in the section.
Figure 12.
Bearing surface contact stress state.
Compared to traditional steel-concrete joints, the new joint structure has fundamental differences. In traditional joints, the contact bearing surface is entirely composed of a steel-concrete interface. In the new structure, in addition to the contact bearing surface, there is also a concrete top plate. When the joint experiences positive bending moments, the axial pressure effect generated by the prestress is partially transferred to the concrete top plate, leading to a reduction in the pressure on the contact bearing surface, which weakens the friction effect in that region. Based on the above analysis, from a conservative design perspective, it is not advisable to account for the shear resistance contribution from the friction force at the contact bearing surface in the new joint structure.
3.3. Load Transfer Path Analysis of the New Hybrid Beam Joint
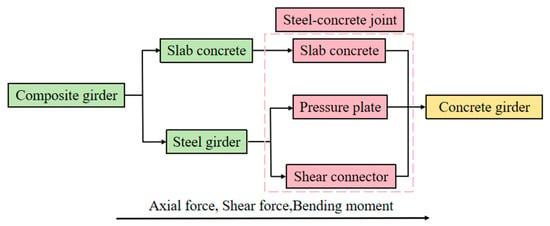
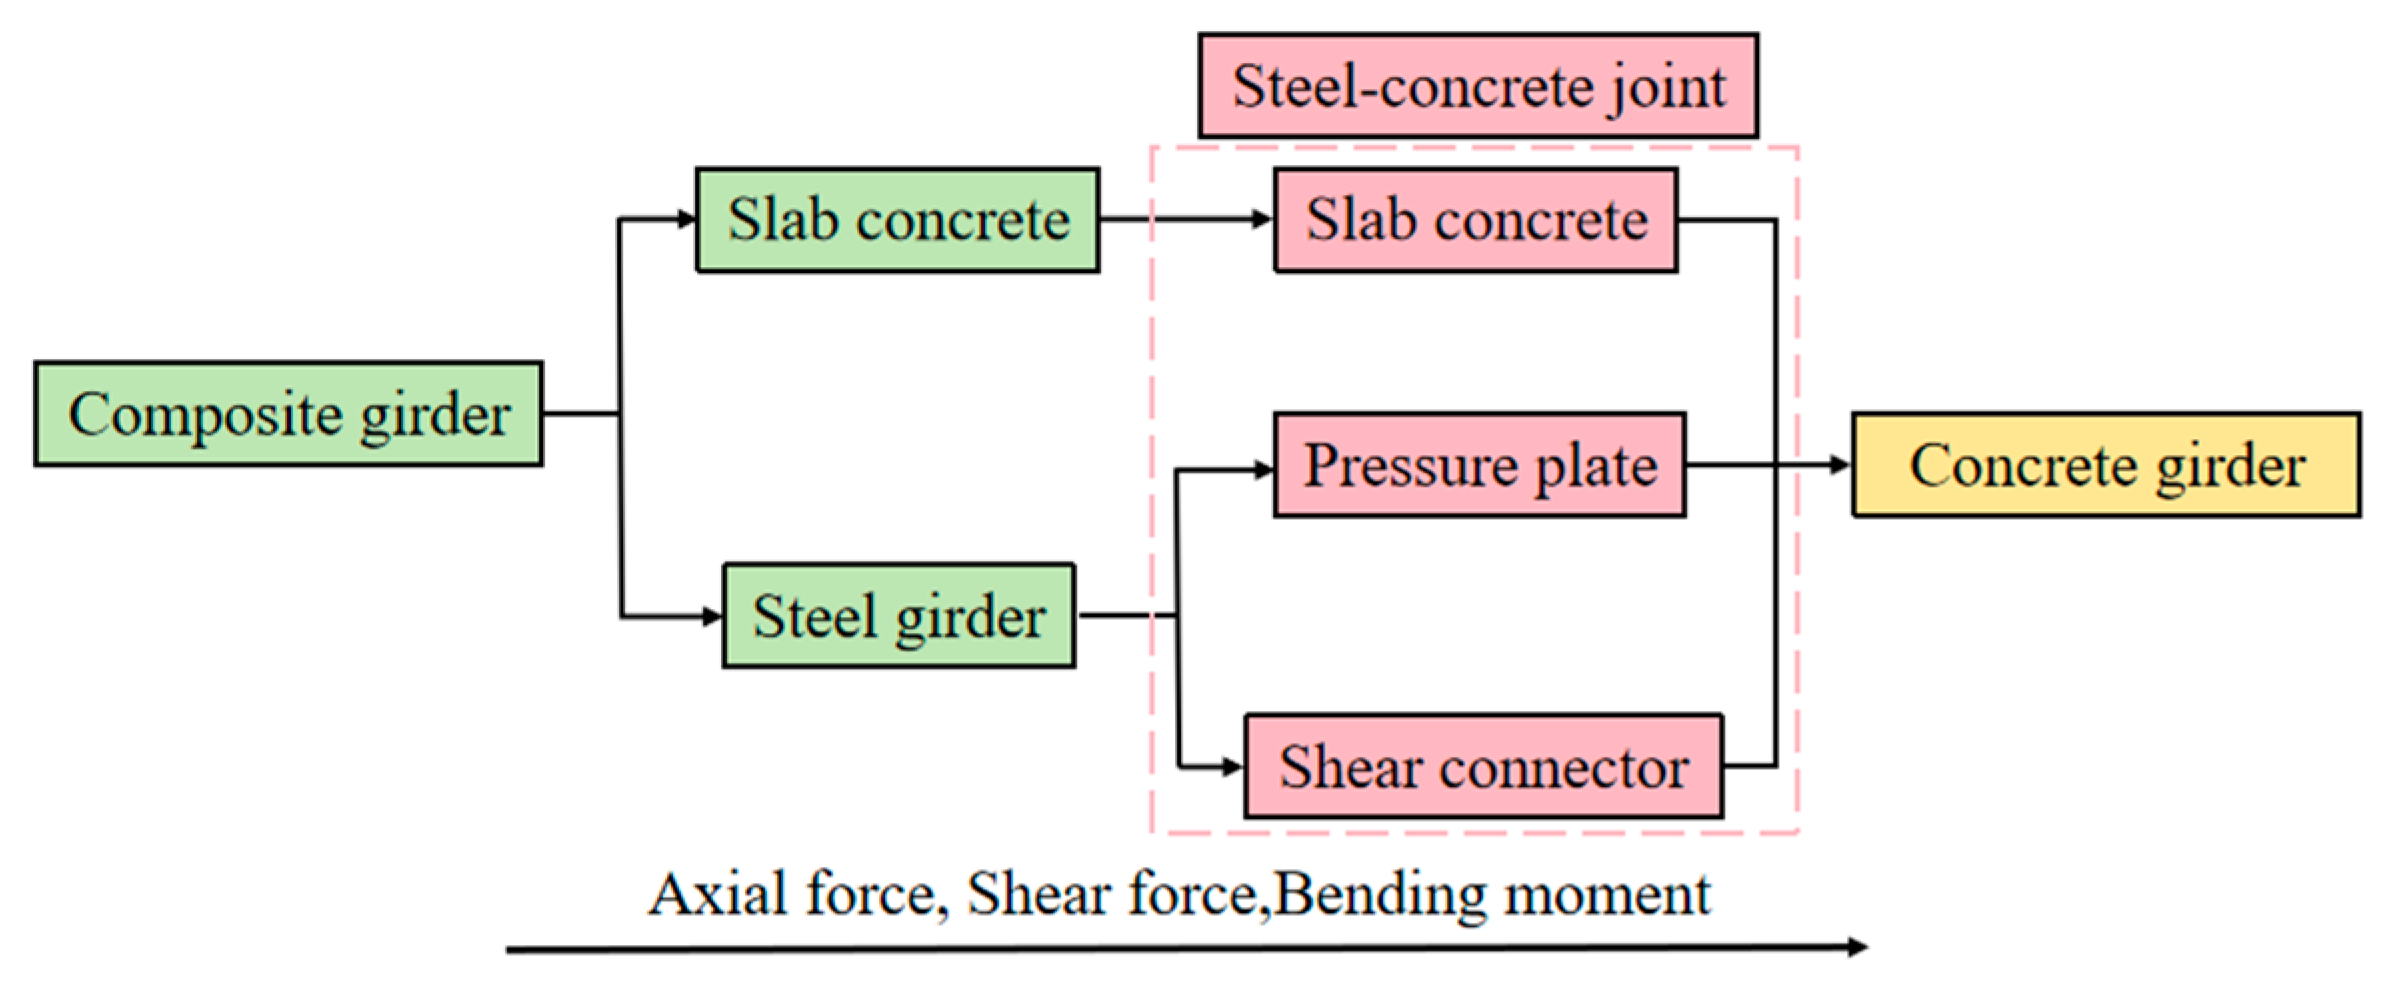
From the above analysis, it is clear that the axial force, shear force, and bending moment in the new steel-concrete joint are transmitted from the concrete top plate of the composite beam and the lower steel beam to the joint. These forces are then jointly carried by the concrete in the joint’s top plate, the bearing plate, and the shear connectors, and finally transferred to the concrete beam, as shown in Figure 13. The axial force distribution ratios for each load transfer path are shown in Table 2. Under the maximum negative bending moment condition used in the calculation, the concrete in the top plate of the joint is in tension, so its proportion of the axial force is relatively low, only 20.7%. The axial force is primarily transmitted by the bearing action of the bearing plate and the shear action of the shear connectors, with the two proportions being nearly equal. This indicates that the axial force transfer path in the design of this joint is clear and the load is shared relatively evenly.
Figure 13.
Load transfer path in the joint.
Table 2.
Load transfer ratio of each axial load transfer path.
The vertical shear force distribution ratios for each path are shown in Table 3. Whether or not the contact surface friction effect is considered, the proportion of shear force transferred by the top plate concrete is very small and can be neglected in the design. However, the friction effect significantly influences the shear distribution. Quantitative integration of frictional stresses reveals that, when friction is considered, the bearing plate and shear connectors transfer 27.1% and 66.4% of the shear force, respectively. Conversely, in the absence of interfacial friction, the shear force is borne almost exclusively by the shear connectors. Given the complex and uncertain nature of the contact surface friction mechanism, it is recommended, from a design safety perspective, to exclude its shear resistance contribution, thereby transferring all the shear force to the shear connectors. This assumption will increase the design shear force on the connectors, making the design safer in engineering practice.
Table 3.
Shear transfer ratio of each vertical load transfer path.
4. Parametric Analysis of the New Hybrid Beam Joint
4.1. Parametric Finite Element Model
This study is based on the structure of the non-cellular bearing plate joint in the new hybrid continuous beam bridge. It focuses on investigating the influence of key design parameters (bearing plate thickness, shear connector stiffness, and joint length) on the force characteristics and load transfer performance of the joint. It is important to clarify that the impact of studs is marginal compared to that of PBLs. Therefore, the parametric study focused solely on varying the PBL parameters. Through parametric analysis, the study primarily examines the stress state of the concrete at the bearing surface, the stress distribution of the shear connectors, and the load transfer ratios carried by each transfer path. The goal is to quantitatively evaluate the impact of these parameters on the mechanical behavior of the new joint.
To improve computational efficiency and clarify the load transfer paths, a half-structure of the original joint was used for finite element analysis. Based on the equivalent principle of the moment of inertia and cross-sectional area, the model was simplified into an I-shaped cross-section, as shown in Figure 14. The finite element modeling techniques and material parameters used in the analysis are consistent with those in the previous model. The simplified finite element model after equivalence is shown in Figure 15.
Figure 14.
Cross-sectional diagram of the joint.
Figure 15.
Parametric finite element calculation model.
4.2. Axial Force Analysis of the Connection
4.2.1. Concrete Stress Analysis
The compressive stress distribution of the concrete at the bearing surface under different bearing plate thicknesses is shown in Figure 16. When the bearing plate thickness is small, its out-of-plane stiffness is low, and it behaves as an out-of-plane flexible plate. Under the internal forces transmitted from the steel flange plates, stiffeners, and web of the composite beam segment, the bearing plate undergoes noticeable out-of-plane bending deformation, resulting in significant stress concentration in the concrete at the bearing surface. It should be noted that the peak compressive stress in the concrete consistently occurs near the edge of the steel beam profile. When the steel plates in the composite beam are subjected to high forces, localized high compressive stresses may cause concrete crushing, thereby affecting the load-carrying capacity of the connection. Increasing the bearing plate thickness significantly enhances its out-of-plane stiffness, which enlarges the effective load diffusion area after the forces in the steel plates of the composite beam are transmitted through the bearing plate, leading to a more uniform stress distribution in the concrete at the bearing surface.
Figure 16.
Effect of different bearing plate thicknesses on concrete stress at the bearing surface (Unit: MPa).
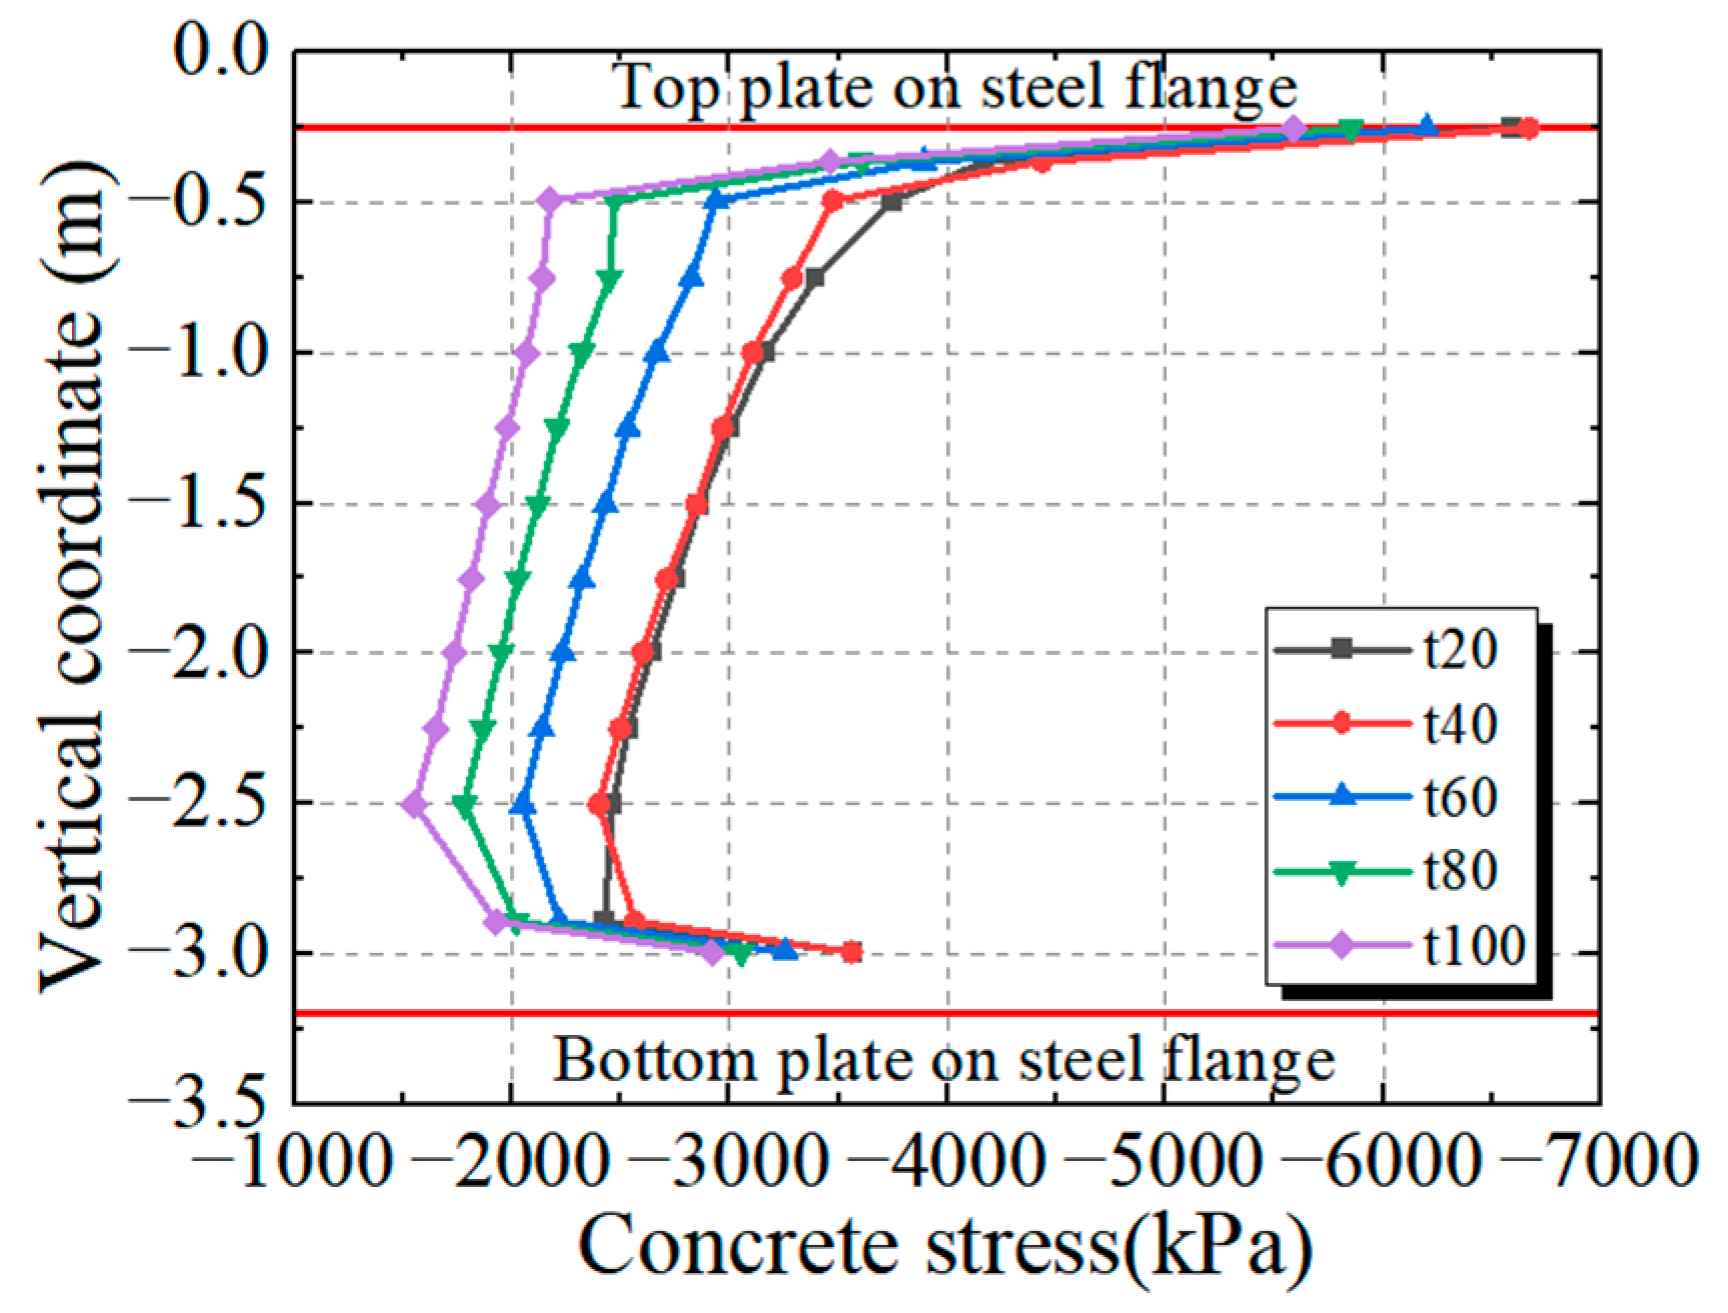
However, relying solely on increasing the bearing plate thickness has a limited effect on improving the stress state of the concrete at the bearing surface of the joint. As shown in Figure 17, although increasing the bearing plate thickness can make the compressive stress distribution in the concrete at the bearing surface more uniform, its effect on reducing the peak compressive stress is not significant. When the bearing plate thickness increases from 20 mm to 100 mm, the peak concrete compressive stress was only reduced by about 1 MPa. Moreover, if the bearing plate becomes too thick, the thick plate effect can occur, leading to issues such as delamination and tearing, and increasing the difficulty of welding construction.
Figure 17.
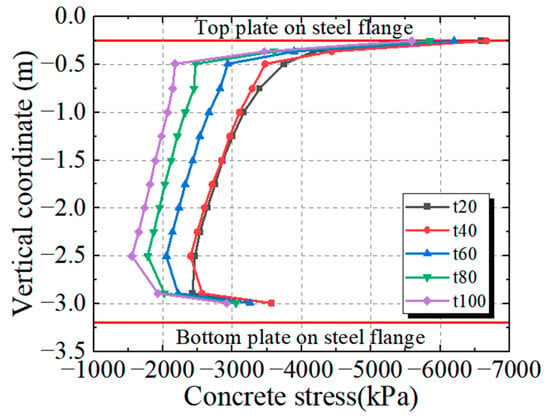
Concrete stress distribution at the steel beam web.
4.2.2. Connector Stress Analysis
- (1)
- Effect of bearing plate thickness variation
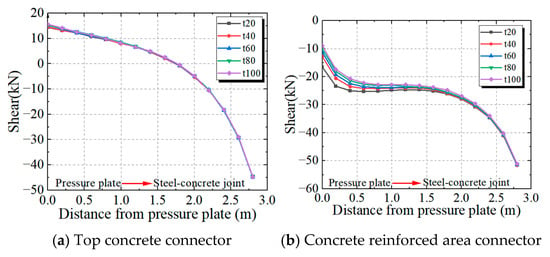
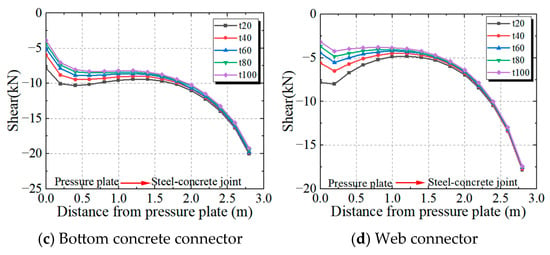
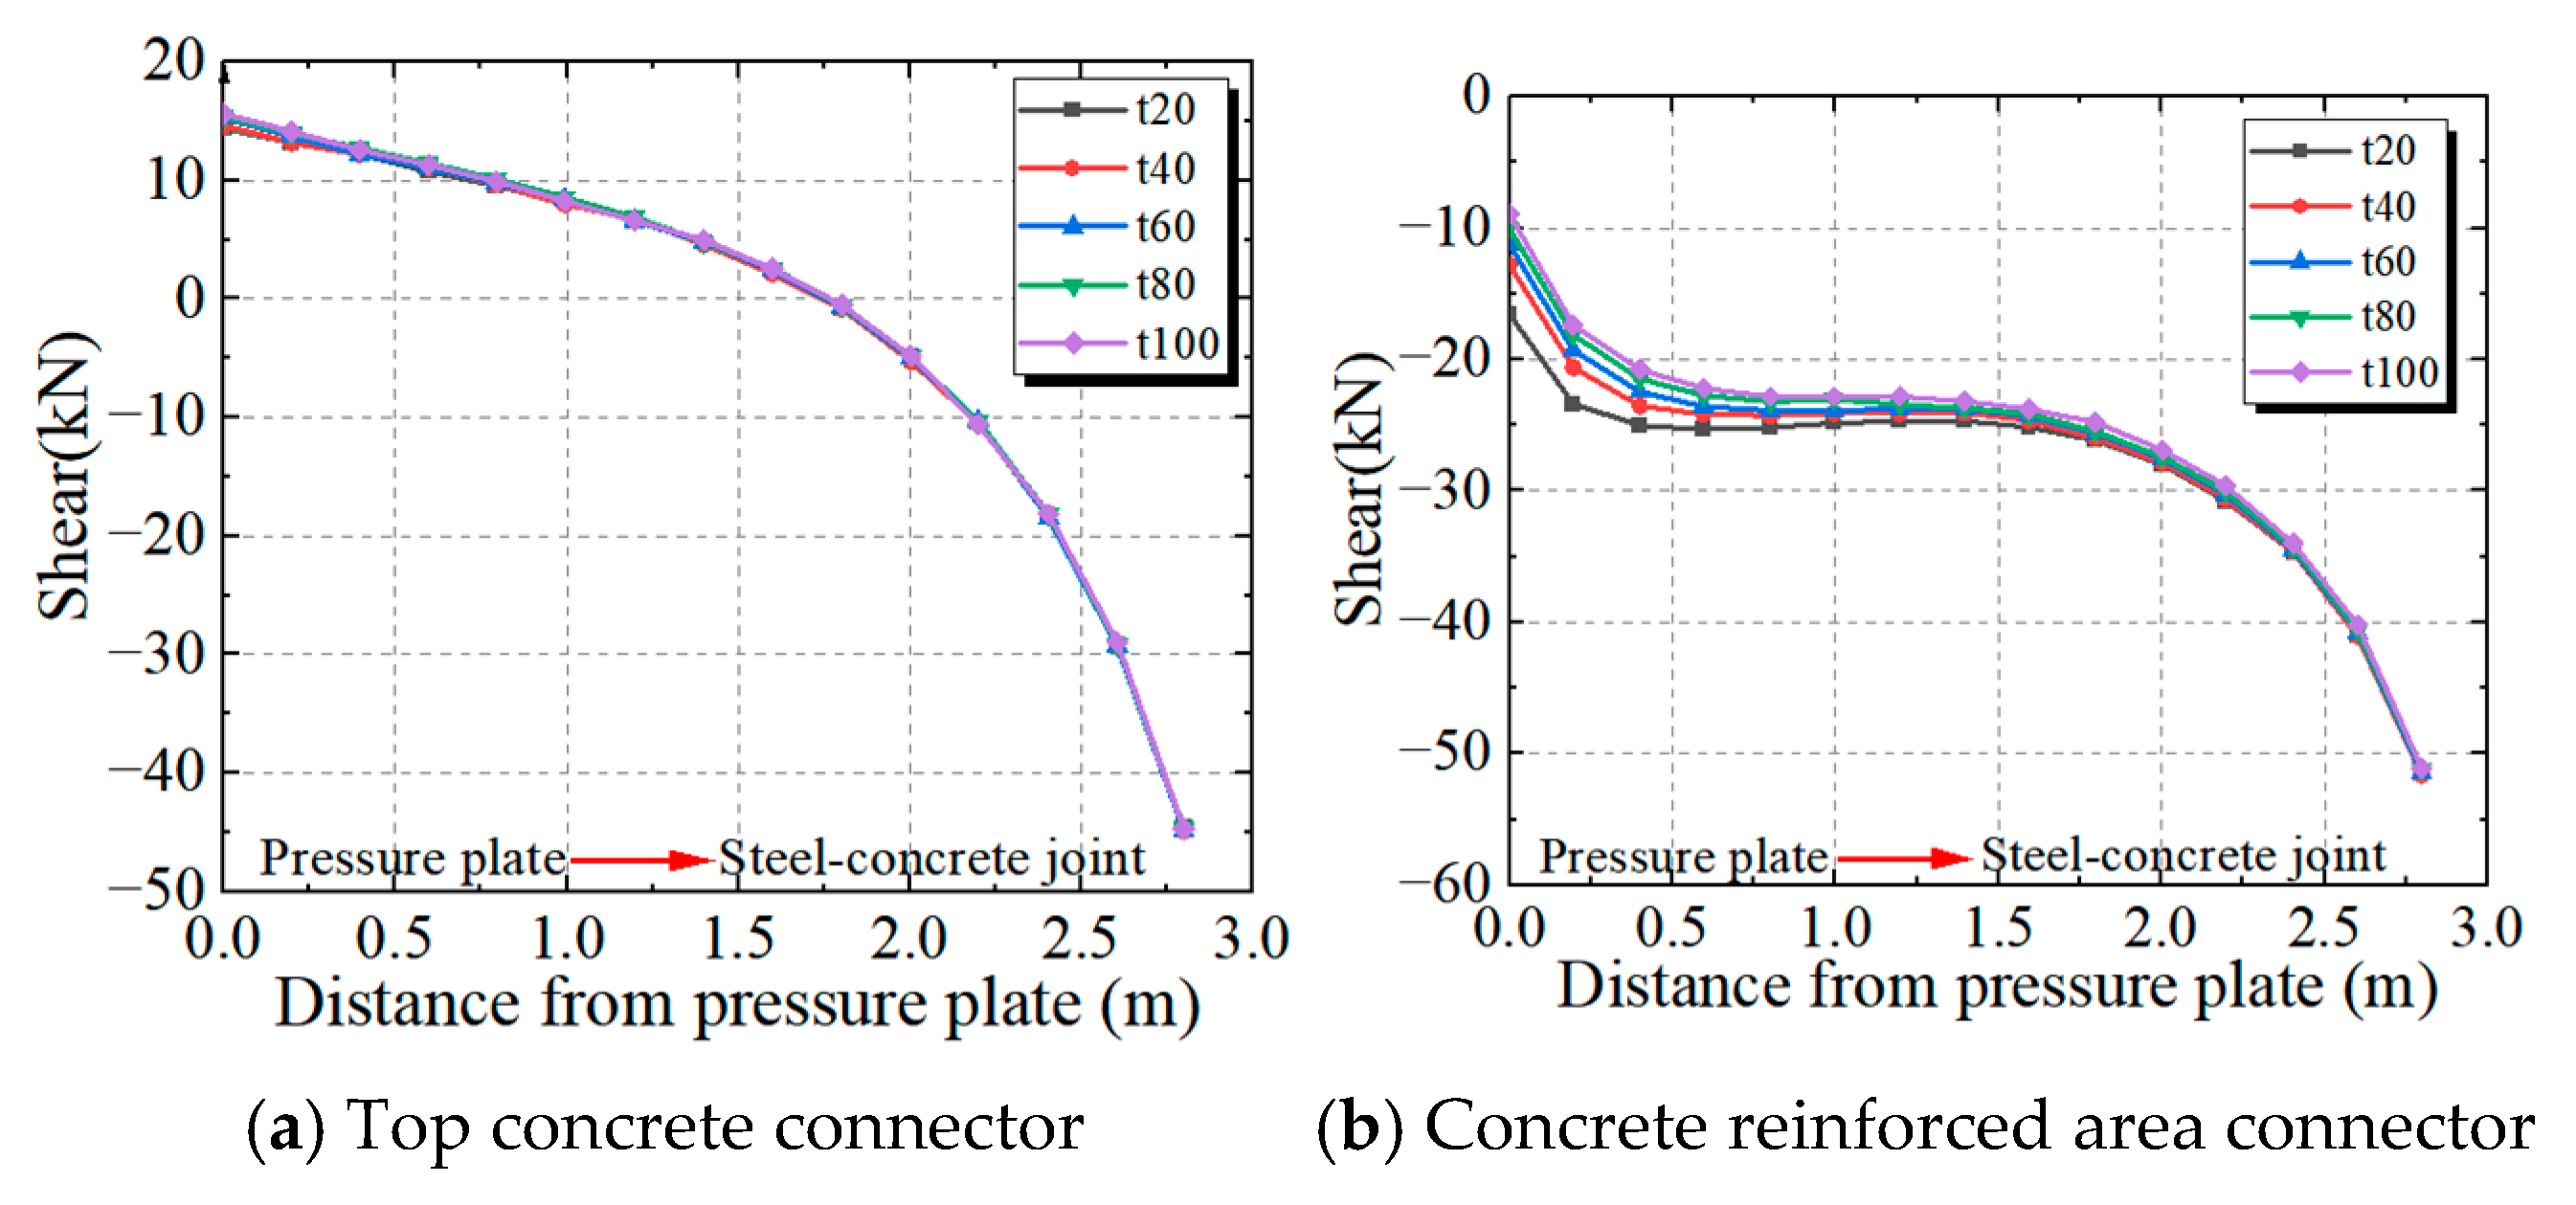
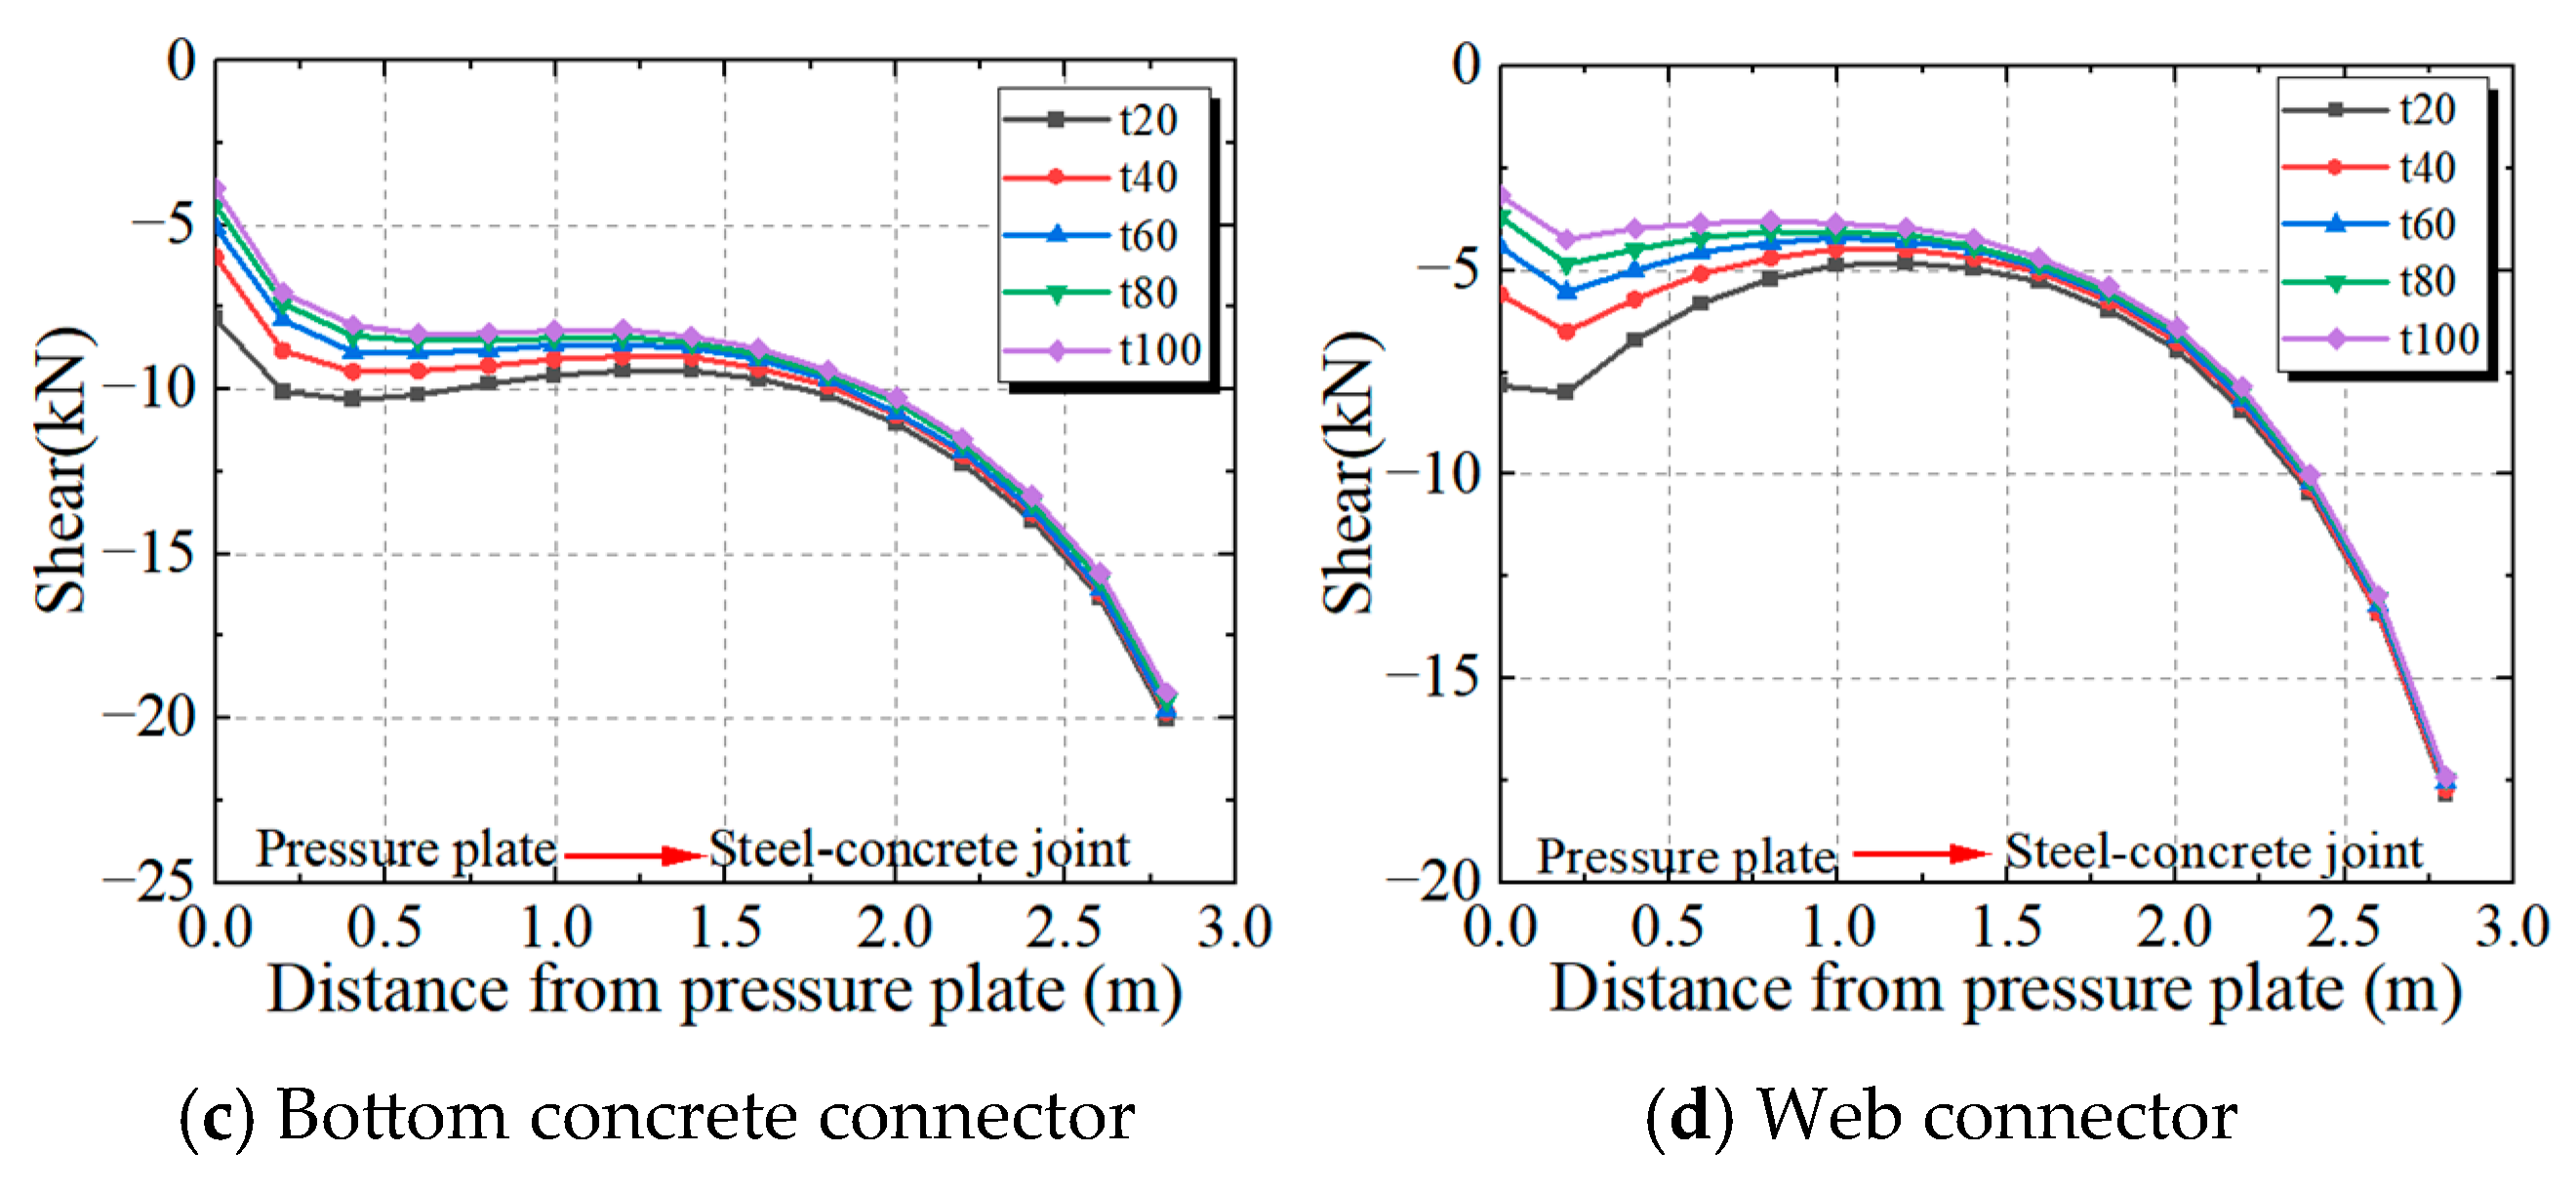
Changes in the bearing plate thickness inevitably lead to variations in the stress experienced by the connectors at different locations. The following analyzes the effect of bearing plate thickness variation on the stress and distribution of connectors at different positions, as shown in Figure 18. As shown in Figure 18a, under different bearing plate thicknesses, the stress and distribution of the connectors within the top plate concrete do not show significant changes. This is because the connectors in the top plate of the joint primarily transfer the force from the upper edge of the composite beam’s concrete to the concrete beam section, and this load transfer path does not involve the bearing plate. As shown in Figure 18b–d, when the bearing plate thickness changes, the shear force experienced by the connectors near the bearing plate decreases, while the effect on the connectors farther from the bearing plate is minimal. This is because increasing the bearing plate thickness causes the stressed area to diffuse, making the stress distribution near the bearing plate more uniform, reducing local deformations in the bearing plate and concrete, and thus decreasing the relative slip of the connectors near the bearing plate, which in turn reduces the shear force they experience. However, when the bearing plate thickness increases from 20 mm to 100 mm, the peak stress experienced by the connectors at various positions in the new joint remains almost unchanged. Since the peak stress on the connectors often controls the design of the joint, simply changing the bearing plate thickness does not significantly improve the stress performance of the connectors in the joint.
Figure 18.
Effect of bearing plate thickness on connector stress distribution.
- (2)
- Effect of connector stiffness variation
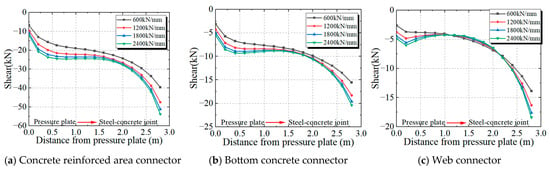
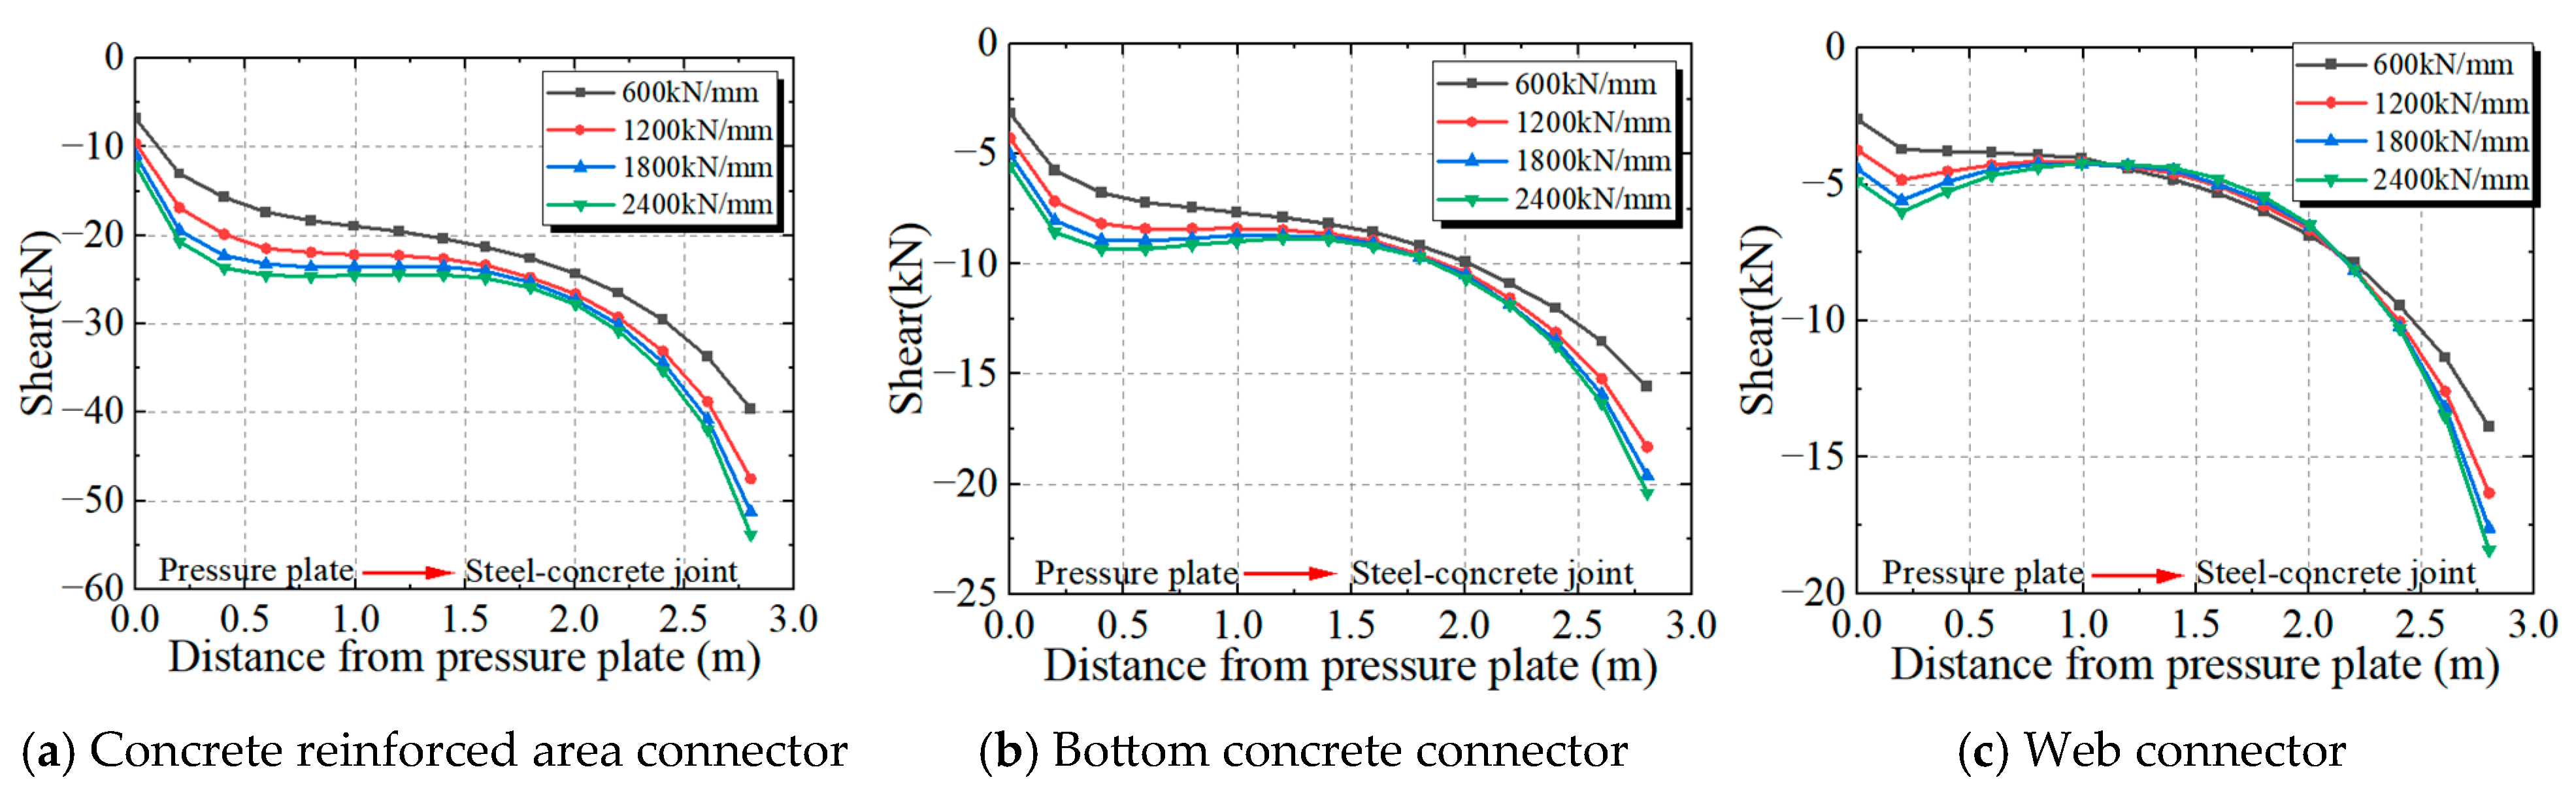
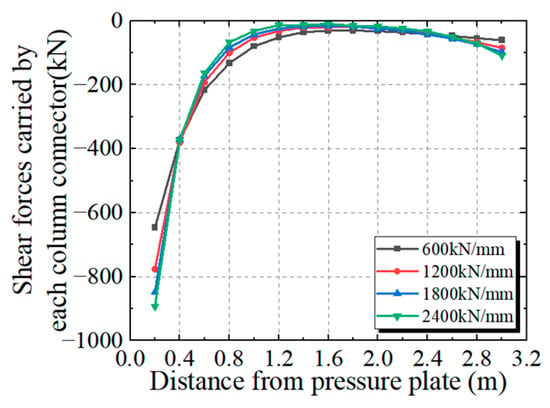
From the above analysis, it can be seen that the connectors in the top plate concrete are not sensitive to changes in the bearing plate thickness. Therefore, a stiffness variation analysis is performed on the other three types of connectors. The stress distribution of the connectors at different locations is shown in Figure 19. When the stiffness of the connectors is varied, the overall trend of the stress distribution remains unchanged. The stress distribution for all cases shows an increasing trend, but it is relatively flat in the middle region, indicating that the stress distribution is more uniform in that area. When the connector stiffness is softer, the stress distribution across each row of connectors becomes more uniform. Therefore, using connectors with lower stiffness can effectively reduce the peak stress experienced by the connectors.
Figure 19.
Effect of connector stiffness on connector stress distribution.
To quantitatively evaluate the impact of different connector stiffnesses on the uniformity of the shear force distribution, the stress non-uniformity coefficient for each row of connectors is defined by Equation (1):
where λ is the connector stress non-uniformity coefficient; Vmax is the maximum shear force experienced by a row of connectors; and is the average shear force experienced by that row of connectors.
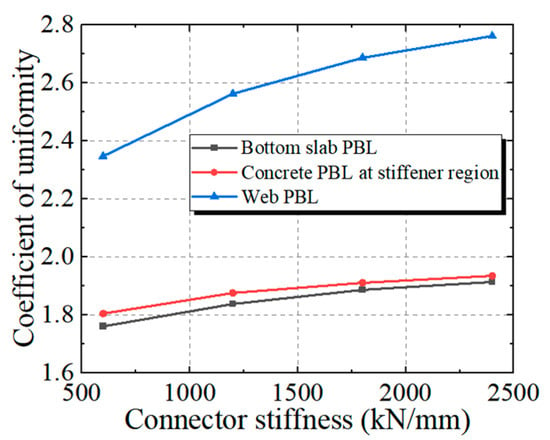
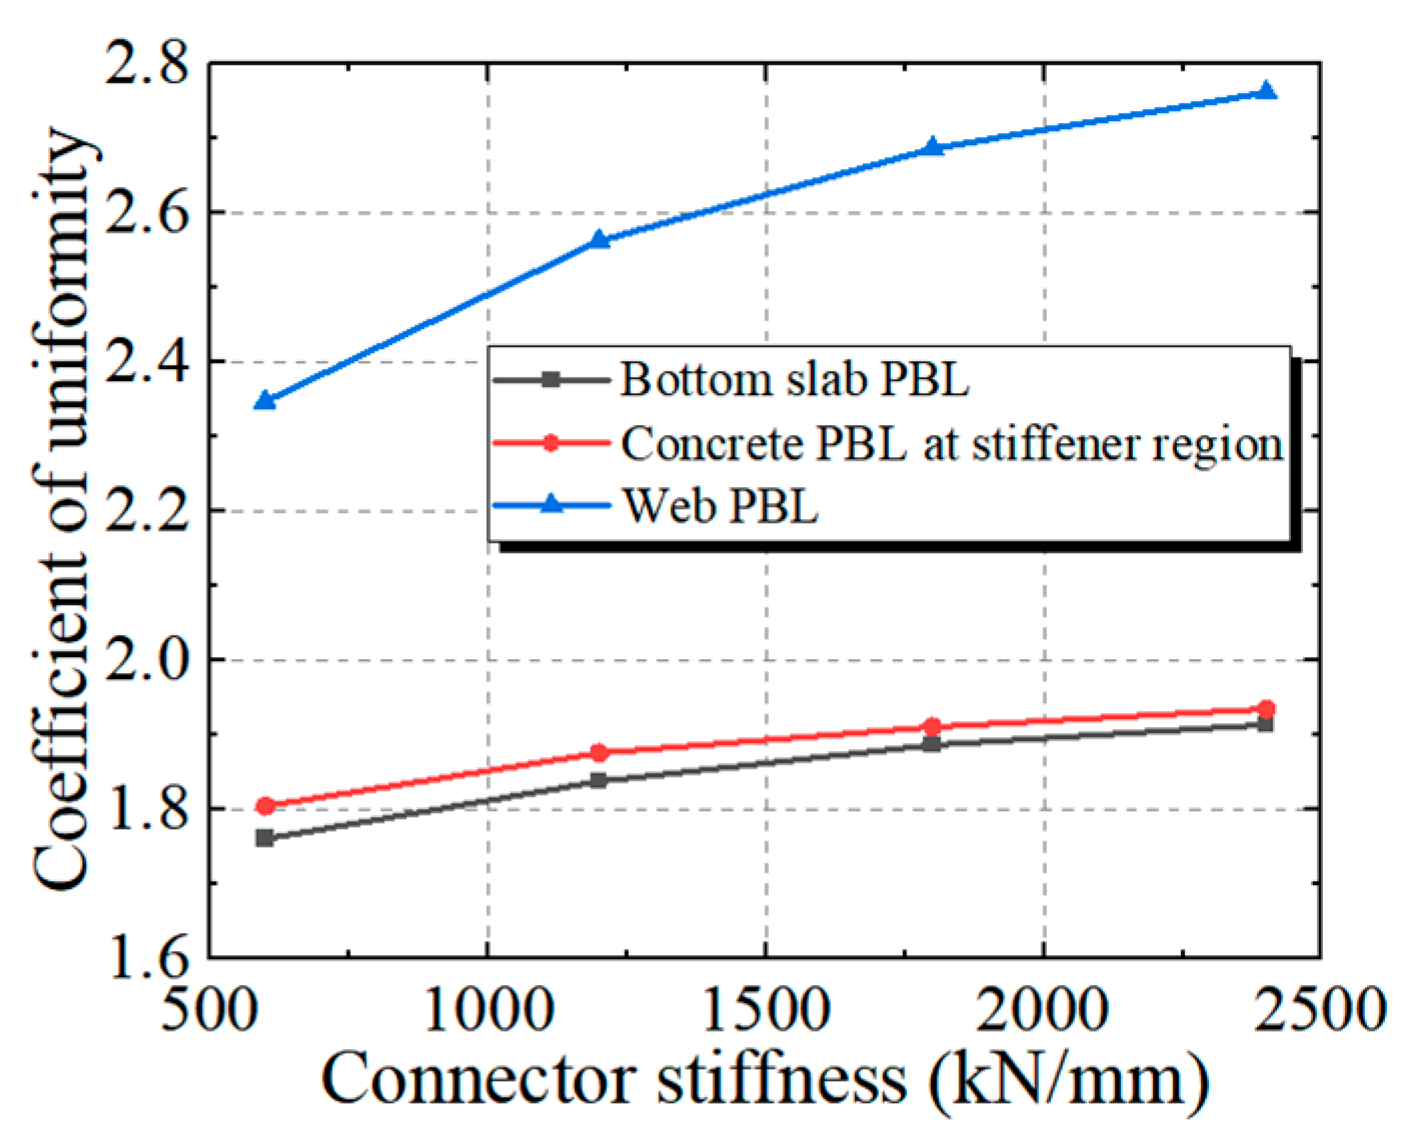
When the stiffness of the connectors varies, the connector stress non-uniformity coefficients are shown in Figure 20. The connectors at the reinforced concrete areas and those in the bottom concrete slab exhibit similar stress non-uniformity coefficients, both slightly below 2.0. However, the stress non-uniformity coefficient for the connectors in the web area is larger, above 2.3. This difference is mainly due to the higher stiffness in the web region, which causes more concentrated stress transfer, resulting in a more uneven stress distribution.
Figure 20.
Effect of connector stiffness on non-uniformity coefficient.
It can also be observed that the stiffness of the connectors has a significant impact on the uniformity of their stress distribution. As the stiffness of the connectors increases, the non-uniformity coefficient of their stress distribution shows an upward trend, indicating that connectors with higher stiffness will exacerbate the unevenness of the shear force distribution. Therefore, to improve the uniformity of the stress distribution in the connectors, connectors with lower stiffness should be used, which will result in a more balanced shear force distribution and alleviate localized stress concentration.
- (3)
- Effect of joint Length Variation
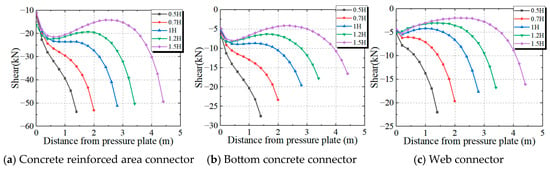
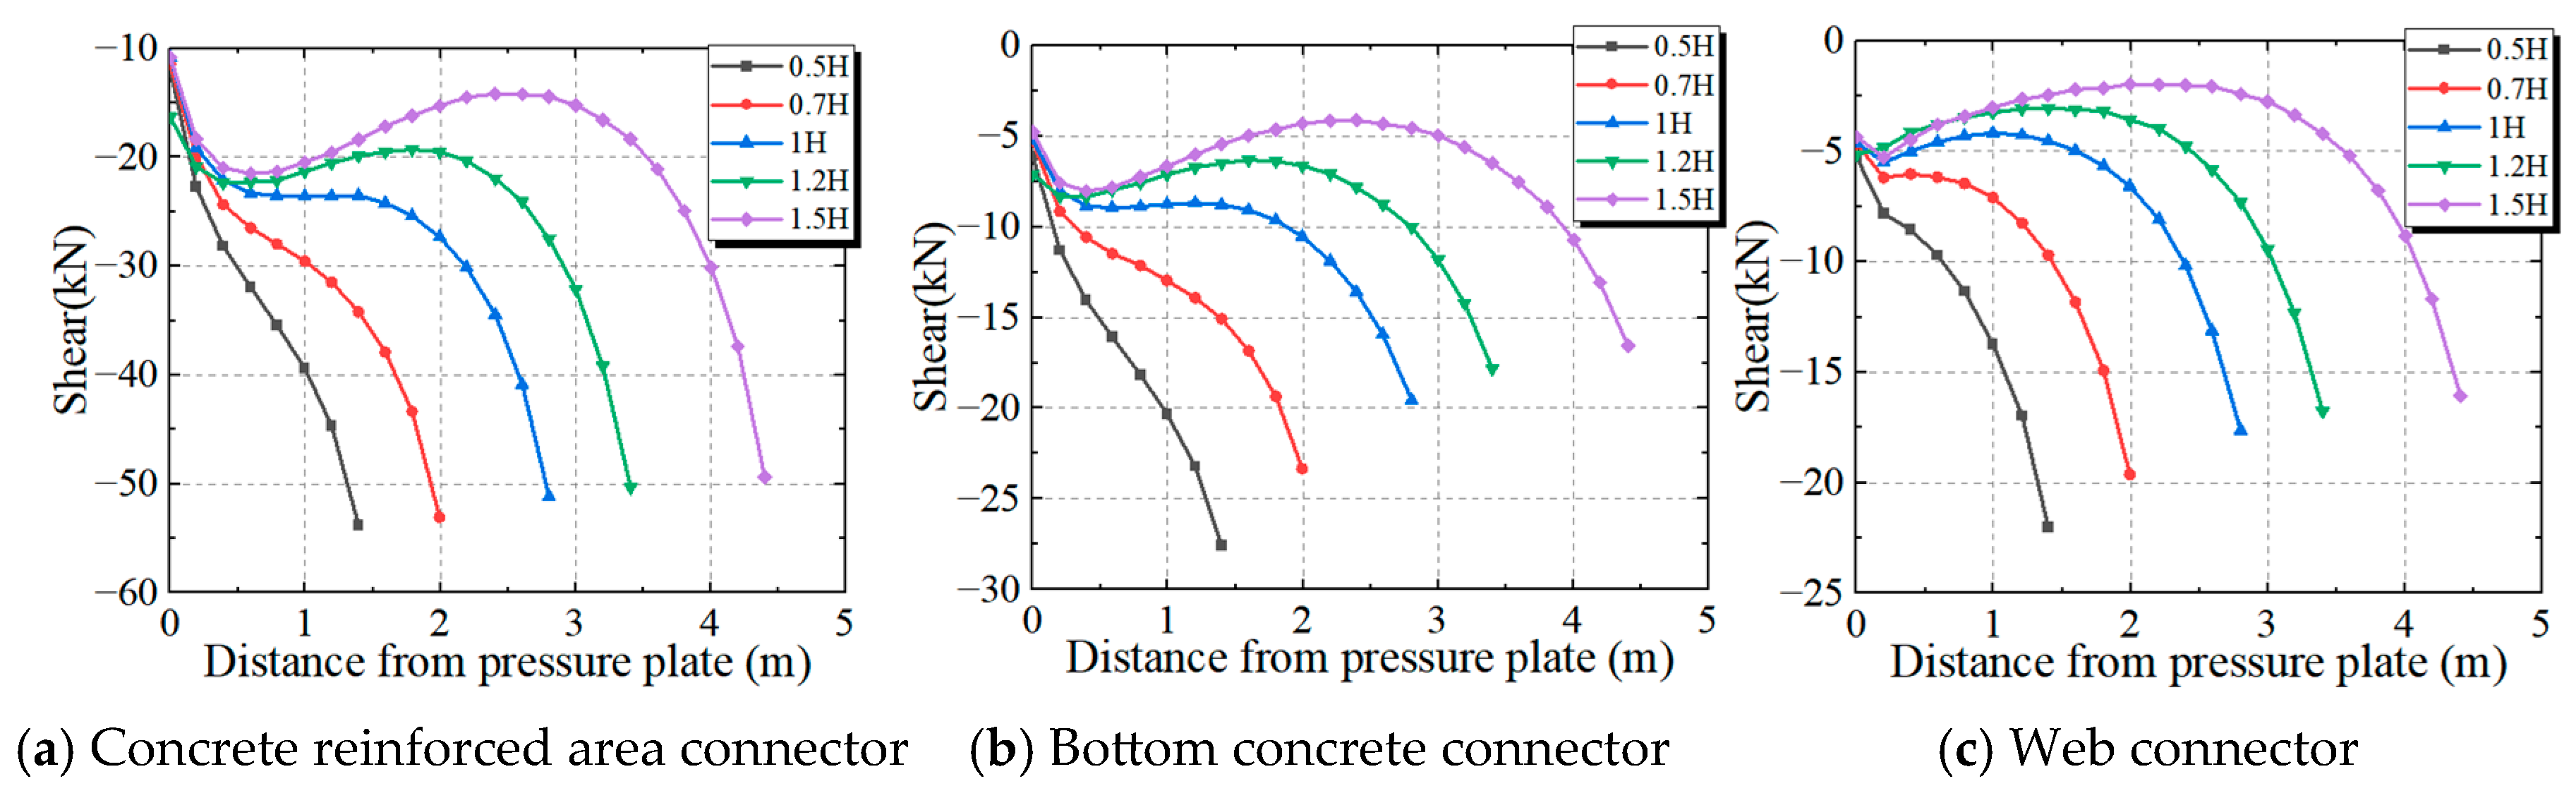
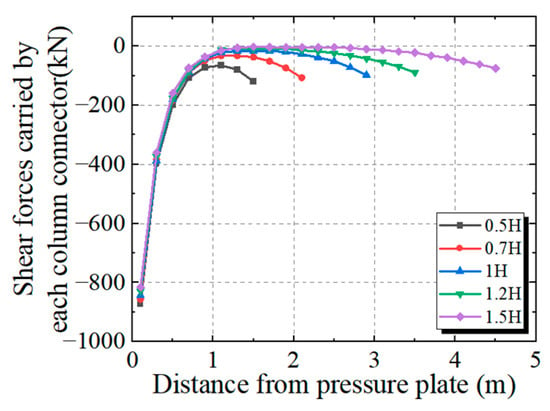
The reasonable selection of the joint length for the new joint is a key parameter for controlling the safe, reliable, and smooth transfer of internal forces. To this end, this study analyzes the evolution of the shear force distribution of connectors at various locations as the joint length (L) increases from 0.5 H to 1.5 H (where H is the beam height), while keeping the PBL spacing constant, as shown in Figure 21.
Figure 21.
Effect of joint length on connector stress distribution.
As the L increases from 0.5 H to 1.5 H, the number of rows of connectors increases from 8 to 23. Consequently, the distribution of shear forces carried by the connectors also changes significantly. When L < 1 H, the shear force distribution on the connectors increases monotonically with the increasing distance of the connectors from the bearing plate. However, when L ≥ 1 H, the stress distribution shows a turning point, and the shear force carried by the connectors begins to gradually form an inverted “N” shape. Therefore, when the joint length exceeds 1.0 H, the connectors located in the middle of the joint are almost unable to fully resist shear forces. Further increasing the joint length has only a limited effect on reducing the peak shear force experienced by the connectors.
4.2.3. Bearing Load Transfer Proportion Analysis
Based on the finite element numerical results, the total axial forces carried by the top plate concrete, the bearing plate, and the connectors are obtained. Using Equations (2)–(4), the load transfer proportions of the three bearing load transfer paths in the new hybrid beam connection can be calculated.
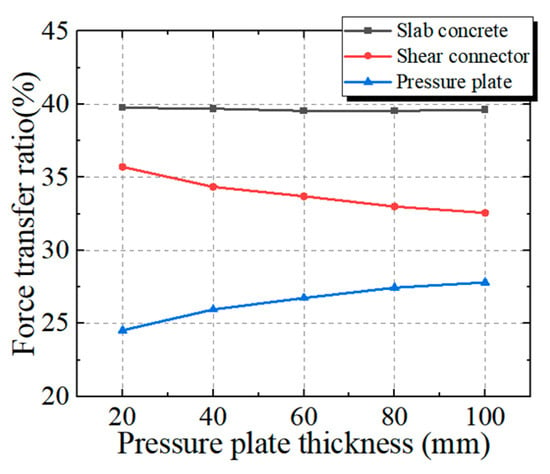
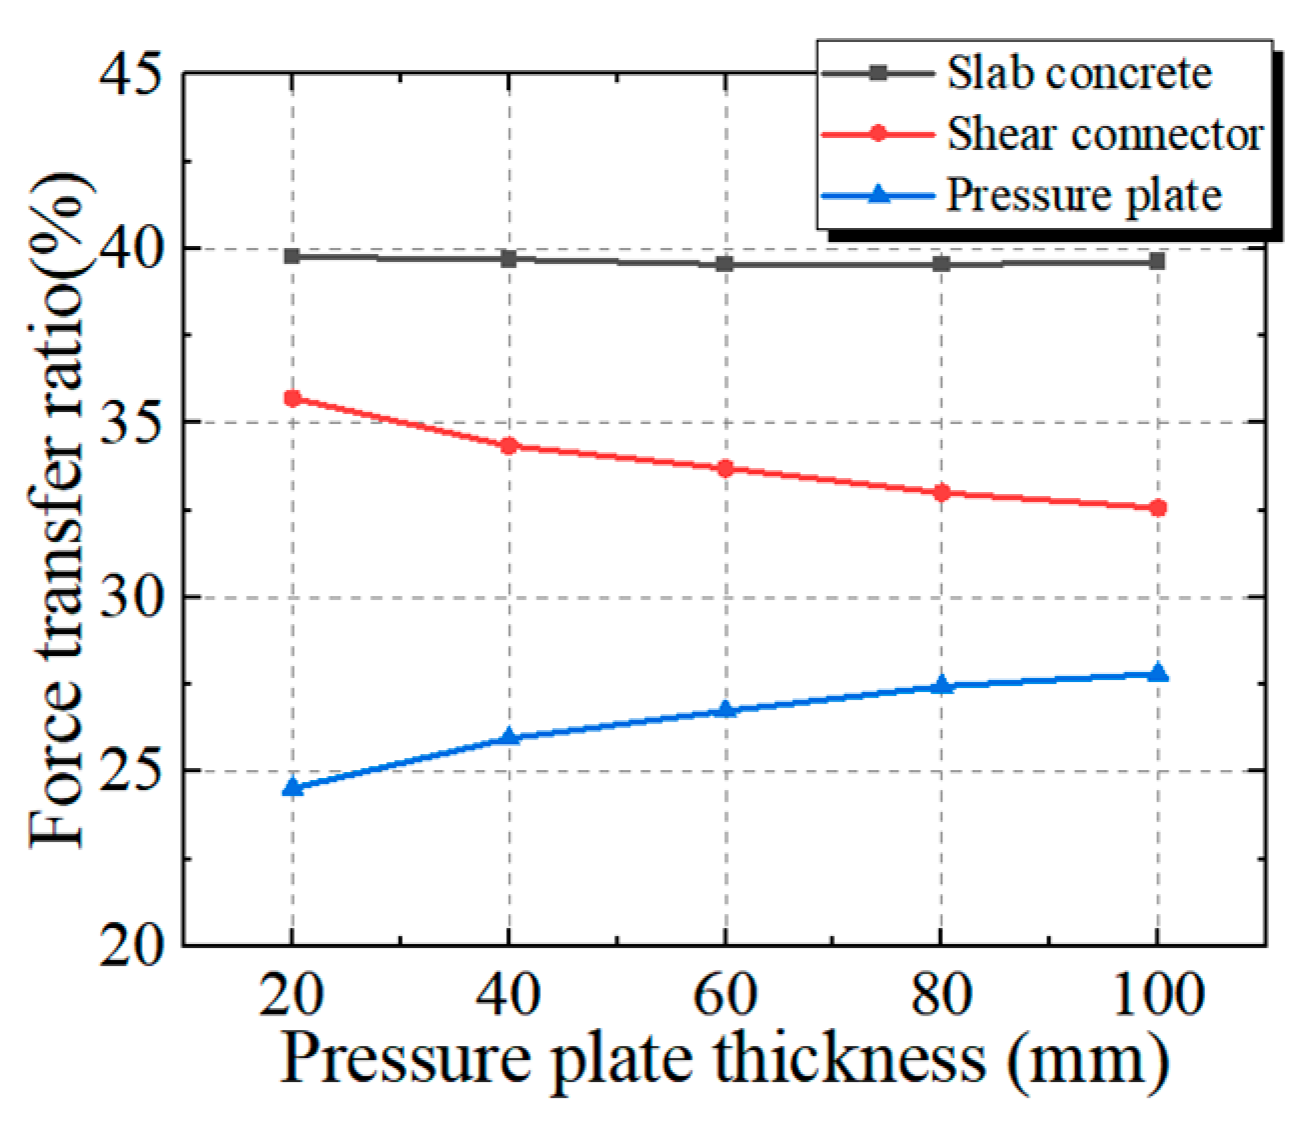
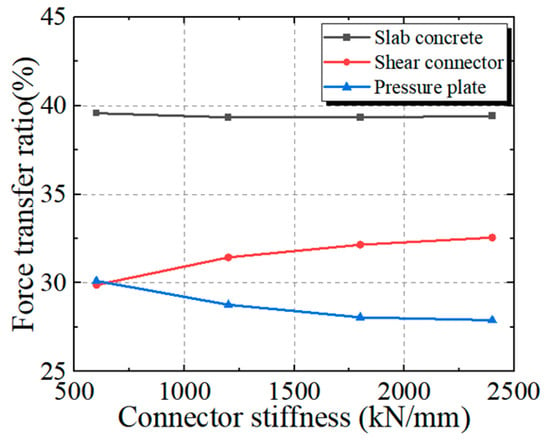
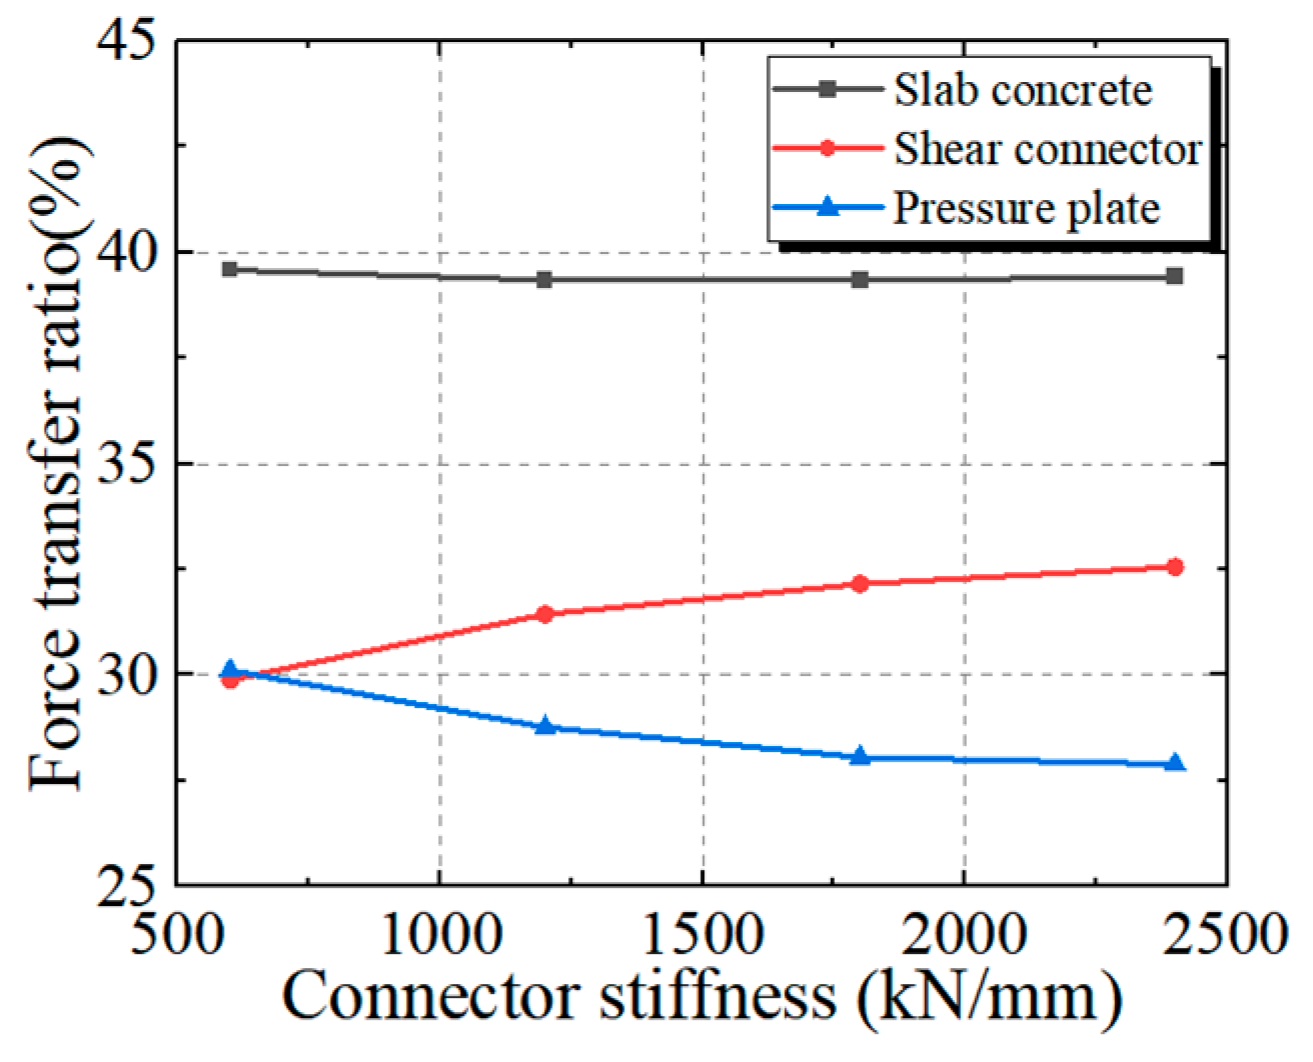
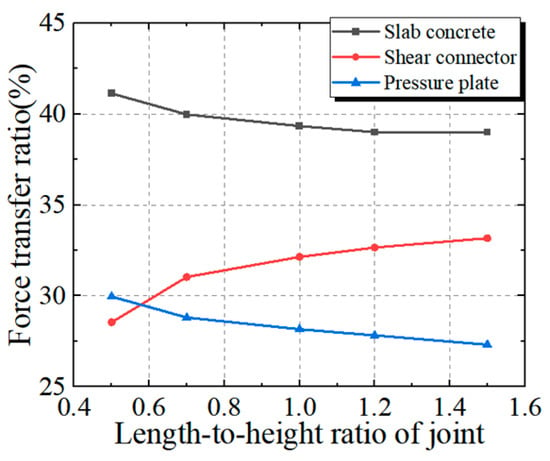
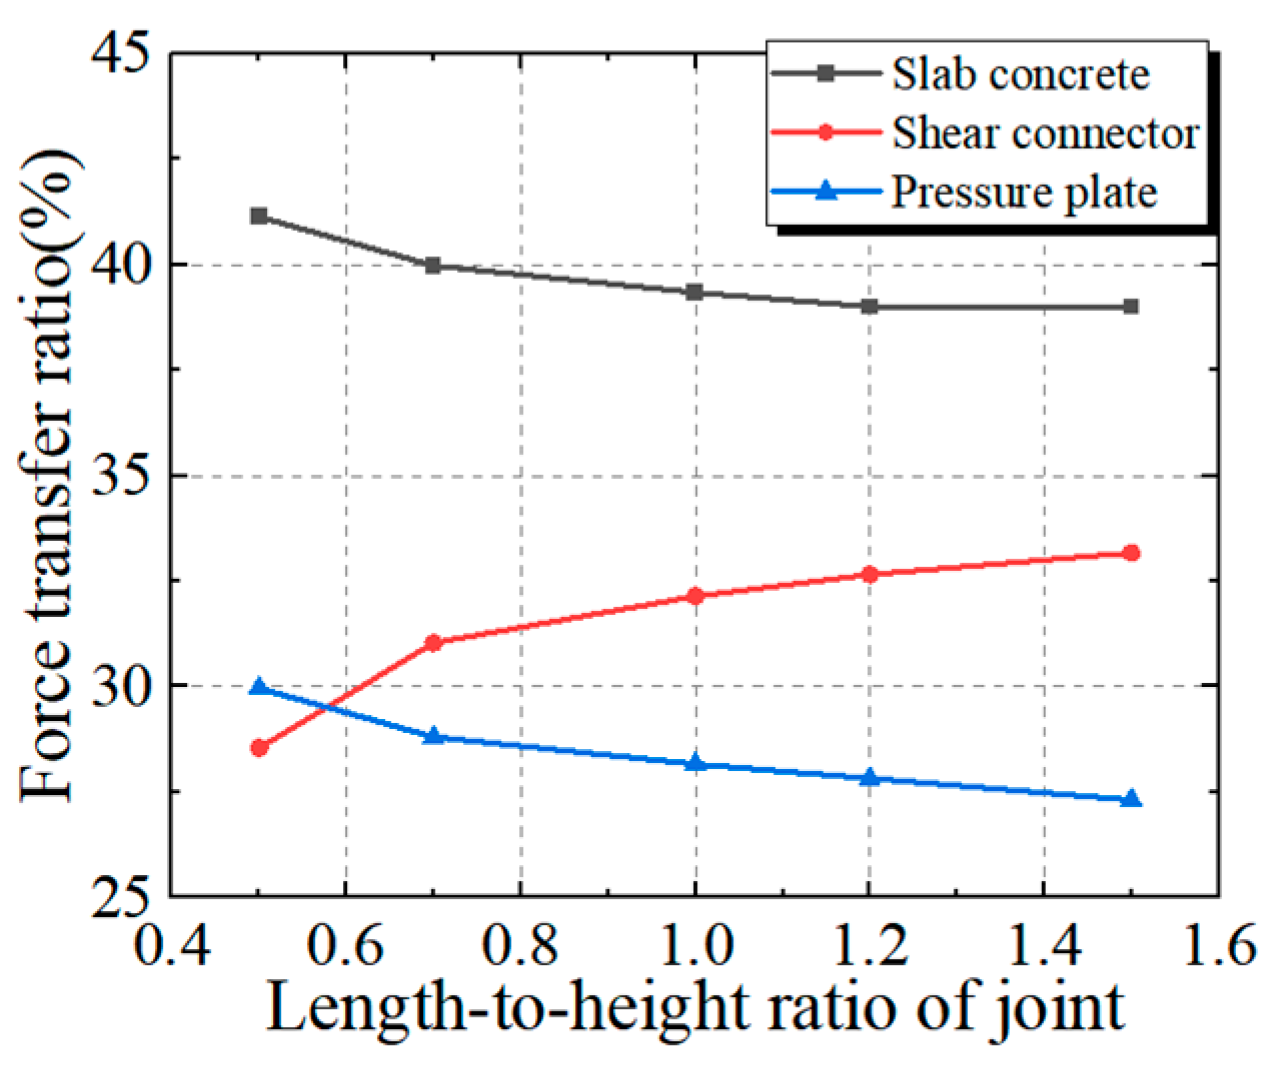
In the equations: represent the axial force proportions carried by the top plate concrete, shear connectors, and bearing plate, respectively; represent the axial forces carried by the top plate concrete, shear connectors, and bearing plate, respectively; and represents the total axial force carried by the new joint bearing. Figure 22, Figure 23 and Figure 24 show the impact of bearing plate thickness, connector stiffness, and joint length variation on the load transfer proportions of the joint.
Figure 22.
Effect of bearing plate thickness on load transfer proportion in the joint.
Figure 23.
Effect of connector stiffness on load transfer proportion in the joint.
Figure 24.
Effect of joint length on load transfer proportion in the joint.
As shown in Figure 22, the change in bearing plate thickness has a limited overall effect on the load transfer proportion of the joint. When the bearing plate thickness increases from 20 mm to 100 mm, the load transfer proportion carried by the concrete bridge deck remains around 39.5%. The load transfer proportion carried by the bearing plate gradually increases as its stiffness increases with thickness. However, the PBL connectors in the web area, which have a larger number and overall stiffness, always carry a slightly higher load transfer proportion than the bearing plate, with both being around 30%, showing a small difference.
Figure 23 reflects the impact of connector stiffness variation. Increasing the stiffness of the connectors allows them to carry a higher proportion of the load transfer while slightly reducing the proportion carried by the bearing plate. However, this effect is not significant. When the connector stiffness increases from 600 kN/mm to 2400 kN/mm, the load transfer proportion increases from 30.0% to 32.7%, indicating that, within the parameter range of this study, connector stiffness is not the primary factor influencing load transfer distribution.
The effect of joint length is shown in Figure 24. Increasing the joint length is equivalent to adding more “springs” in parallel along the load transfer path of the connectors, which theoretically increases the overall stiffness of that path, thereby enhancing its load transfer proportion. However, the actual increase is not linear. When the length increases from 0.5 H to 1.0 H, the connector load transfer proportion increases noticeably; after 1.0 H, the increment slows down. This is because the actual steel plate is not completely rigid, and as the joint length increases, the deformation of the steel plate reduces the equivalent stiffness of the connector load transfer path, thus weakening the transfer benefit from increasing the length.
4.3. Connector Shear Stress Analysis in the Joint
In the conservative design framework of the new joint (where contact surface friction is not considered), the shear transfer mechanism of the joint is primarily handled by the PBL connectors in the steel web. Therefore, the reasonable selection of connector stiffness and joint length becomes a key design parameter that controls the distribution of shear force between the transfer paths and the load-bearing performance of the connectors themselves. The following systematically analyzes the impact of these two parameters on the structural force behavior.
4.3.1. Effect of Connector Stiffness Variation
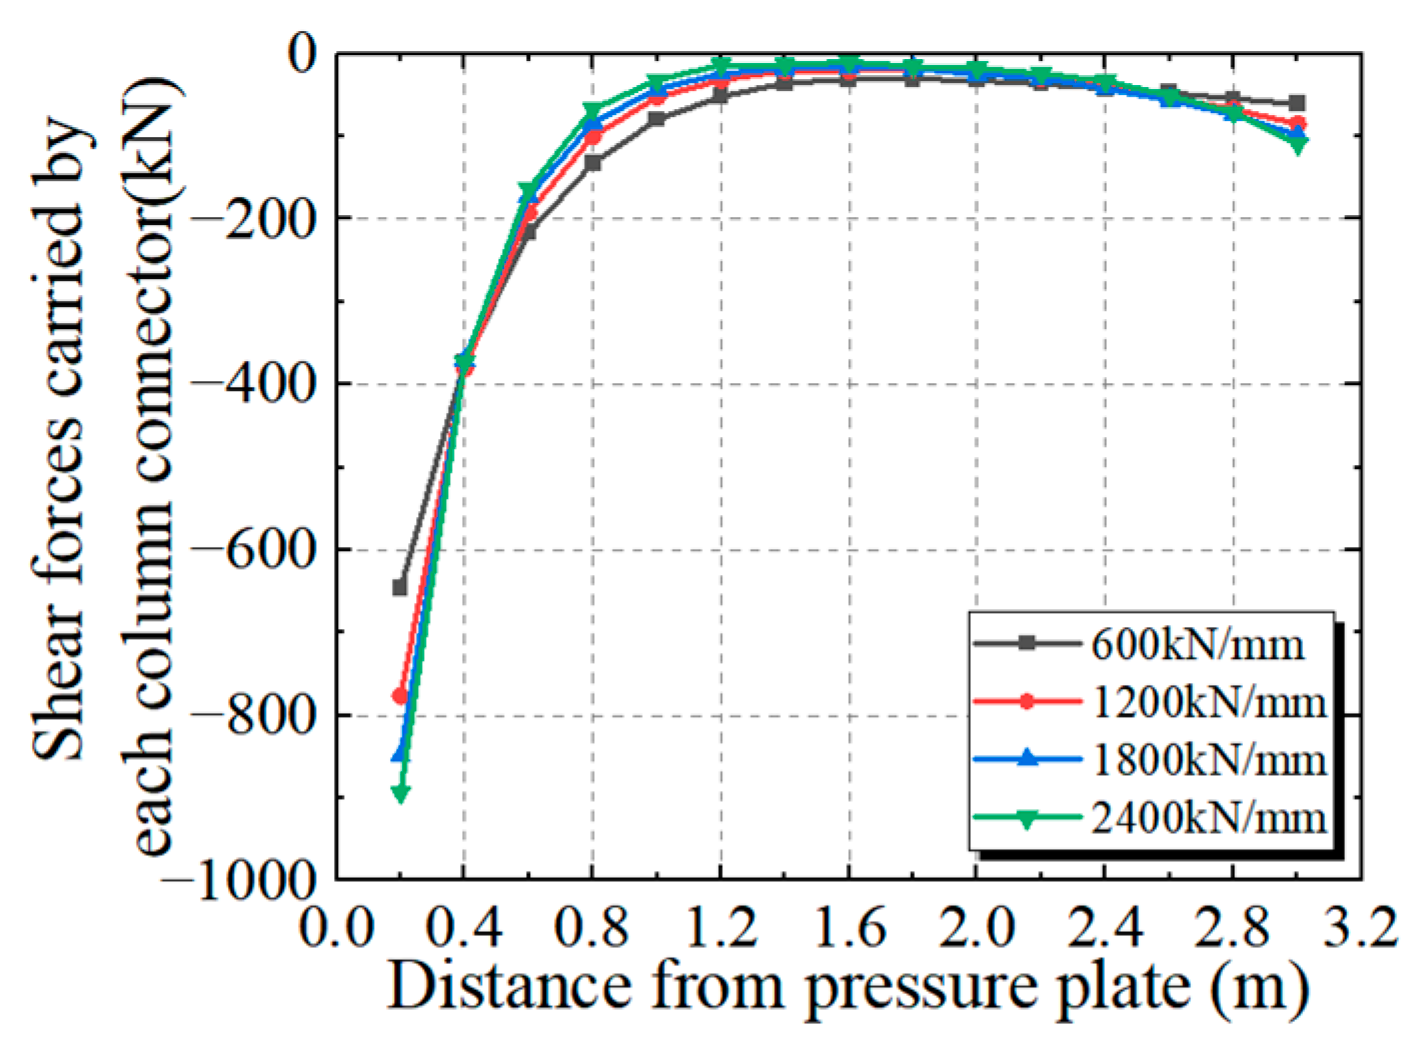
The total shear force carried by each row of PBL as the connector stiffness changes is shown in Figure 25. It can be observed that the connector stiffness has a significant effect on its shear force distribution. When the connector stiffness is higher, the first row of connectors closest to the bearing plate will carry a larger proportion of the shear force. As the connector stiffness decreases, the shear force carried by the first row of connectors decreases accordingly, and the shear force distribution among all rows of connectors in the joint tends to become more uniform.
Figure 25.
Effect of connector stiffness on total shear force carried by the connector.
Specifically, when the connector stiffness increases from 600 kN/mm to 2400 kN/mm, the proportion of vertical shear force carried by the first row of connectors increases from 34.8% to 47.2% of the total shear force in the web. This indicates that the stress state of the first row of PBL largely determines the overall shear resistance of the joint. Therefore, the maximum shear force carried by this row of connectors can be considered as the controlling factor for the shear design of the new hybrid beam joint.
The shear force non-uniformity coefficient for each row of connectors, calculated using Equation (1), shows significant variation depending on position. However, as mentioned earlier, in the joint design, the focus is usually on the first row of connectors, which carries the highest stress. The analysis shows that the shear force non-uniformity coefficient for the first row of connectors is basically unaffected by changes in connector stiffness, remaining stable around 1.05, indicating that the shear force distribution in this row is relatively uniform. Therefore, for simplification in design calculations, it can be assumed that the first row of connectors experiences uniform loading. This assumption will not cause significant errors and will not affect structural safety.
4.3.2. Effect of Joint Length Variation
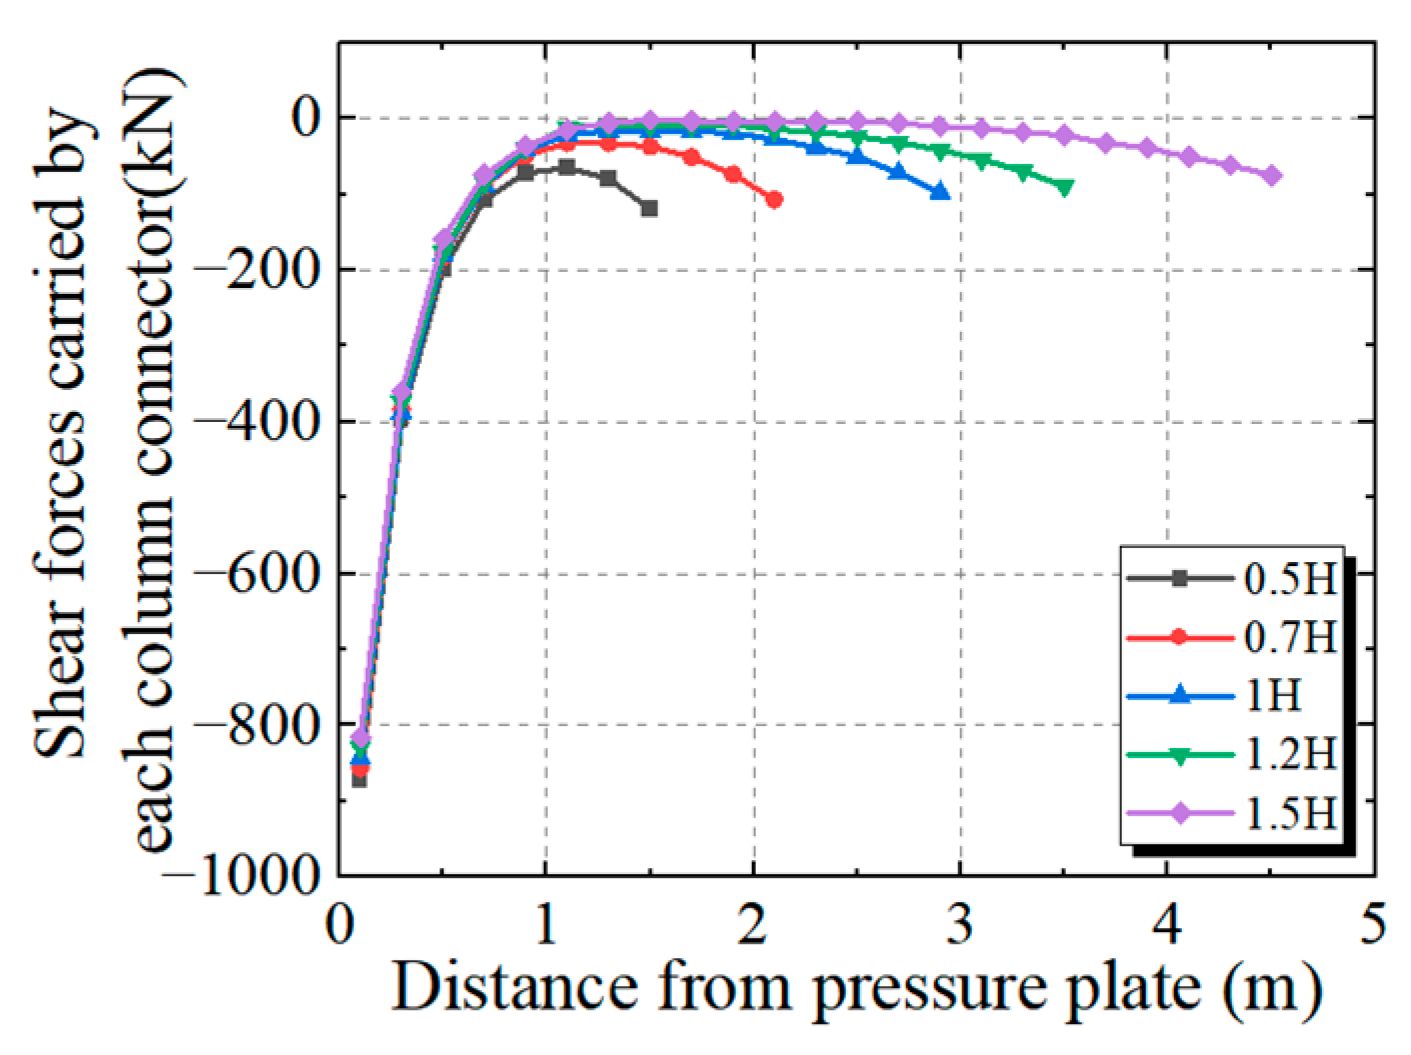
The total shear force carried by each row of PBL as the joint length changes is shown in Figure 26. It can be seen that the shear force carried by the PBL connectors in the web is extremely unevenly distributed along the length of the joint, exhibiting a typical “saddle shape” distribution with higher shear forces at the ends and lower forces in the middle. The peak shear force still occurs at the first row of PBL. As the joint length increases, the shear force on the PBL connectors at the ends of the joint decreases. However, the peak shear force at the first row of PBL does not significantly reduce. At the same time, the shear force on the PBL connectors in the middle of the joint further decreases, indicating that the shear resistance of the connectors in this region is not fully utilized and the load transfer efficiency is relatively low.
Figure 26.
Effect of joint length on total shear force carried by each row of connectors.
Parametric analysis shows that when the joint length varies within the range of 0.5 H to 1.5 H, the shear force non-uniformity coefficient for the first row of PBL connectors remains below 1.06, indicating that the length variation has little effect on the uniformity of the stress distribution in this row of connectors.
4.3.3. Shear Transfer Proportion Analysis
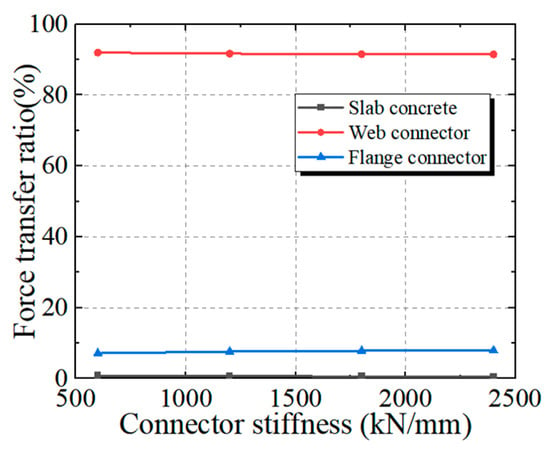
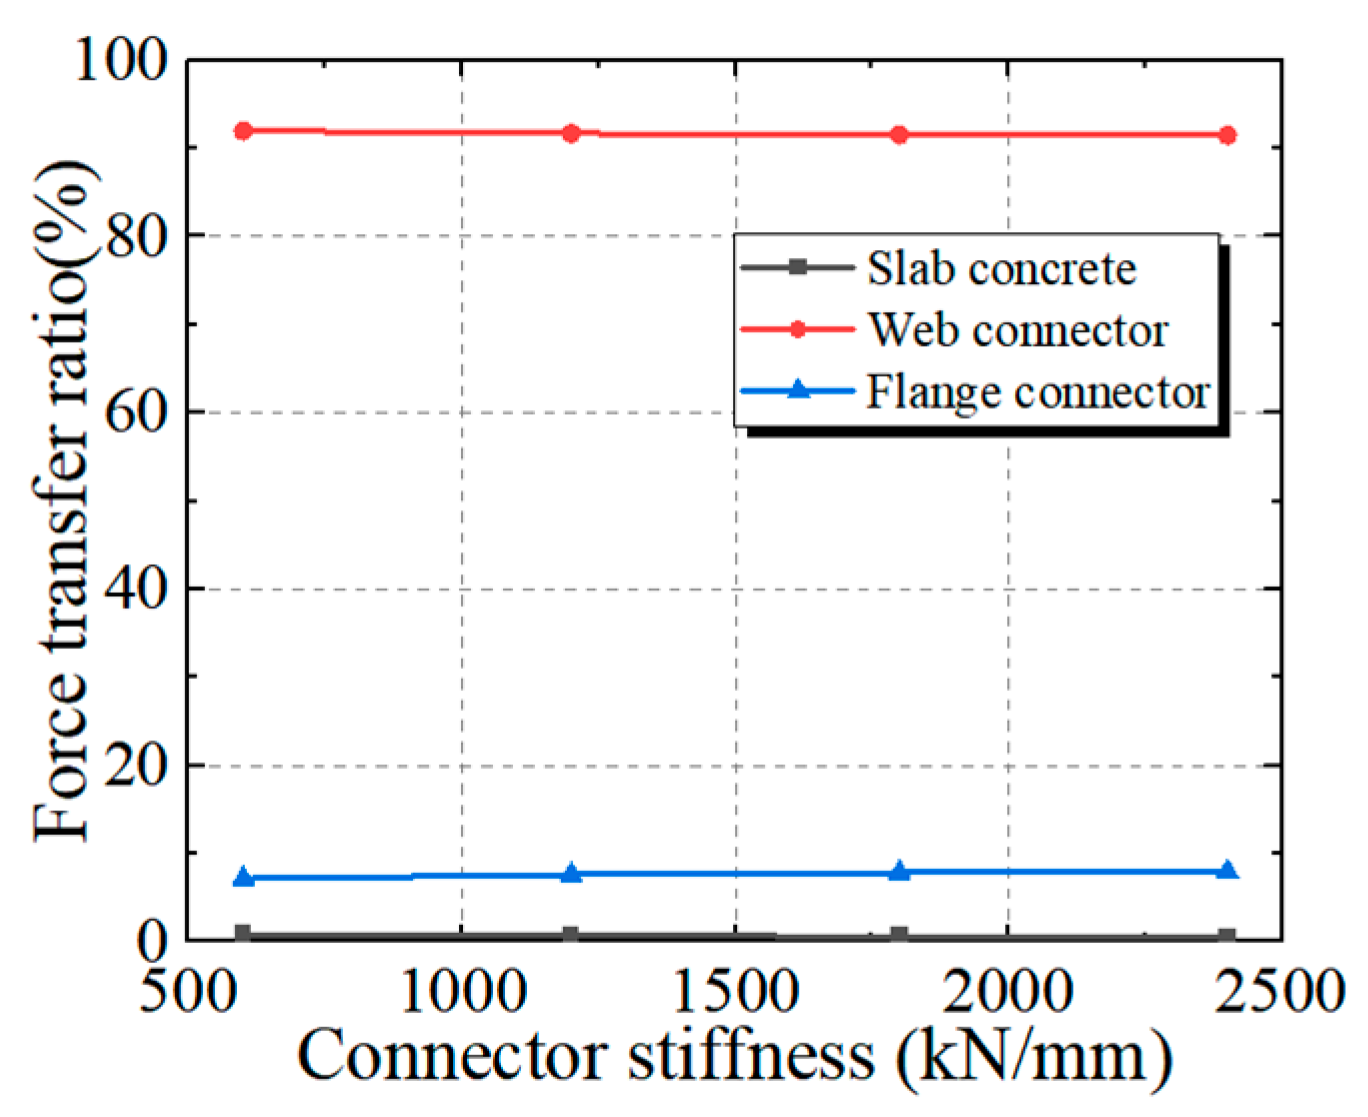
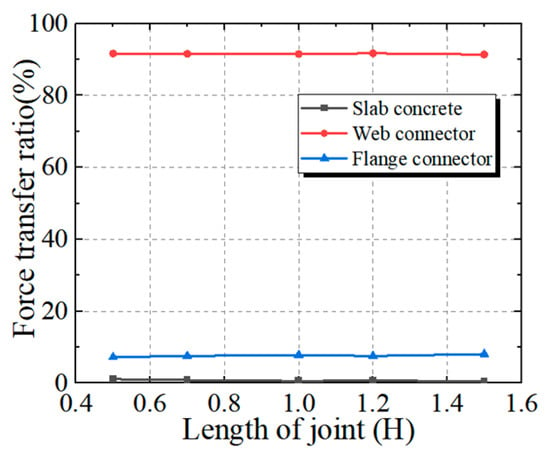
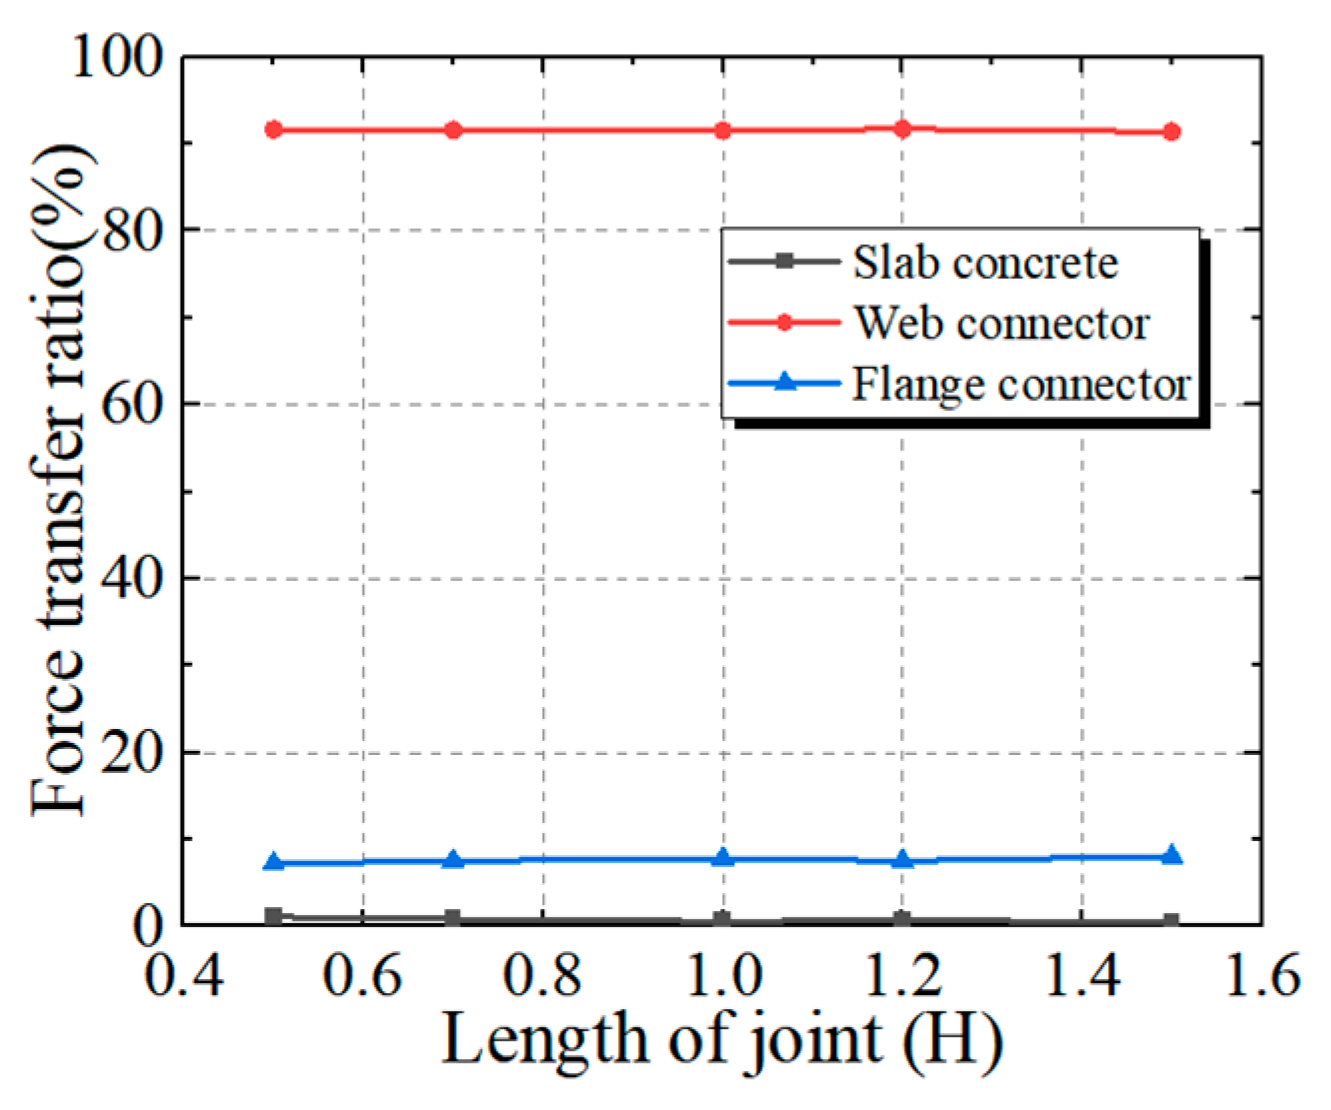
The impact of connector stiffness and joint length on the load transfer proportion of each transfer path is shown in Figure 27 and Figure 28. In the new joint, the vast majority of the shear force is carried by the PBL connectors in the web, which bear more than 90% of the total shear force. This proportion is not significantly affected by the connector stiffness or the variation in joint length. Therefore, in the shear design of the new hybrid beam bridge joint, it can be assumed that the vertical shear force experienced by the joint is entirely carried by the PBL connectors in the web.
Figure 27.
Effect of connector stiffness on shear transfer.
Figure 28.
Effect of joint length on shear transfer.
5. Conclusions
This study conducted a force performance and parametric analysis of the new steel-concrete joint. Multiple finite element models were established for simulation analysis, and the following conclusions were drawn based on the above work:
- (1)
- Under loading, the novel joint exhibits a distinct “three-path load distribution” characteristic: the axial force is equitably shared by the top slab concrete (20.7%), the bearing plate (40.1%), and the shear connectors (39.2%), demonstrating a more uniform load transfer mechanism compared to conventional joints.
- (2)
- The friction effect at the bearing surface has a significant impact on the vertical shear resistance of the joint, contributing approximately 27.1% of the vertical shear force. Given the complex and uncertain nature of the friction mechanism, it is recommended to conservatively neglect its contribution in the design to simplify calculations and ensure safety.
- (3)
- Parametric analysis reveals distinct marginal effects and critical thresholds for geometric dimensions. Increasing the bearing plate thickness from 20–100 mm results in a mere 1.0 MPa reduction in the peak concrete stress. Furthermore, excessive thickness poses risks of lamellar tearing; thus, a thickness of 50 mm is recommended to balance stiffness and constructability. A 1.0 H efficiency threshold exists for the joint length; exceeding this limit triggers an inverted N-shaped shear distribution, rendering the central connectors ineffective. Therefore, anchoring the length near 1.0 H is advised to avoid unnecessary self-weight.
- (4)
- Reducing connector stiffness effectively lowers the non-uniformity coefficient from 2.3 to below 2.0, achieving uniform load diffusion. Crucially, the first row of web PBLs carries 34.8% to 47.2% of the total shear force, with a stable non-uniformity coefficient of 1.05–1.06. Consequently, this row should serve as the primary control section for shear design, permitting simplified calculations under the assumption of uniform load distribution.
- (5)
- This study is subject to certain limitations. First, the finite element models adopted linear elastic material constitutive models, without considering nonlinear behaviors such as concrete cracking or steel yielding. Second, the findings lack experimental validation; therefore, caution should be exercised when extrapolating these conclusions to other structural contexts. Future research should integrate nonlinear finite element analysis with experimental investigations to further elucidate the mechanical performance and load-transfer mechanisms of this novel joint.
Author Contributions
Y.L.: Writing—original draft, Visualization, Software, Formal analysis, Data curation. Q.S.: Writing—review and editing, Methodology, Formal analysis, Data curation. F.O.M.: Writing—original draft, Software. X.Y.: Writing—original draft, Resources. S.G.: Writing—original draft. All authors have read and agreed to the published version of the manuscript.
Funding
This research was funded by the Shanghai Municipal Commission of Housing and Urban-Rural Development Management Research Project (Grant NO.2025-002-033) and the Shanghai Municipal Commission of Science and Technology Science and Technology Program Project (Grant NO. 23DZ1202305).
Institutional Review Board Statement
Not applicable.
Informed Consent Statement
Not applicable.
Data Availability Statement
The original contributions presented in the study are included in the article, further inquiries can be directed to the corresponding author.
Conflicts of Interest
Author Xingfei Yan was employed by the company Shanghai Urban Construction Design and Research Institute. The remaining authors declare that the research was conducted in the absence of any commercial or financial relationships that could be construed as a potential conflict of interest.
References
- Huang, W.; Pei, M.; Liu, X.; Wei, Y. Design and construction of super-long span bridges in China: Review and future perspectives. Front. Struct. Civ. Eng. 2020, 14, 803–838. [Google Scholar] [CrossRef] [Scilit]
- Zheng, J.; Wang, J. Concrete-Filled Steel Tube Arch Bridges in China. Engineering 2018, 4, 143–155. [Google Scholar] [CrossRef] [Scilit]
- Nie, J.; Wang, J.; Gou, S.; Zhu, Y.; Fan, J. Technological development and engineering applications of novel steel-concrete composite structures. Front. Struct. Civ. Eng. 2019, 13, 1–14. [Google Scholar] [CrossRef] [Scilit]
- Virlogeux, M. Recent evolution of cable-stayed bridges. Eng. Struct. 1999, 21, 737–755. [Google Scholar] [CrossRef] [Scilit]
- Dusch, K. The Kurt-Schumacher-Bridge Mannheim-Ludwigshafen (North Bridge). Bauingenieur 1998, 73, 53–64. [Google Scholar]
- Man-Chung, T.; Dai, T. Overall Design of Double-Line Bridge of Shibanpo Changjiang River Bridge in Chongqing. Bridge Constr. 2006, 6, 28–32. [Google Scholar] [CrossRef] [Scilit]
- Chen, H.; Li, D.; Sun, P.; Yu, D.; Zhang, W. Experimental investigation on the structural behavior of the steel-concrete composite segments of self-anchored suspension bridges. J. Harbin Eng. Univ. 2023, 44, 837–846,856. [Google Scholar] [CrossRef]
- Beijing Zhantianyou Foundation for Civil Engineering. Chongqing Caiyuanba Yangtse River Bridge. China Civ. Eng. J. 2010, 43, 156. [Google Scholar] [CrossRef]
- Zhang, W.; Zheng, D.; Huang, Q.; Kang, S. Experimental and simulative analysis of flexural performance in UHPC-RC hybrid beams. Constr. Build. Mater. 2024, 436, 136889. [Google Scholar] [CrossRef] [Scilit]
- Zou, Y.; Zheng, K.; Zhou, J.; Zhang, Z.; Li, X. Mechanical behavior of perfobond connector group in steel–concrete joint of hybrid bridge. Structures 2021, 30, 925–936. [Google Scholar] [CrossRef] [Scilit]
- Shi, S.; Chen, X.; Gu, L.; Ma, T. Investigated on hot mix epoxy resin used in steel bridge deck pavement affected by collaborative toughen. Case Stud. Constr. Mater. 2024, 20, e03019. [Google Scholar] [CrossRef] [Scilit]
- Duan, S.; Wu, X.; Wang, H.; Hu, J.; Luan, Y.; Ma, T. Design and evaluation of semi self-compacting cold mix polyurethane mixture for steel bridge deck pavement. Constr. Build. Mater. 2024, 419, 135490. [Google Scholar] [CrossRef] [Scilit]
- Liu, Y.; Qian, Z.; Xie, Y.; Xu, S.-Q. Investigation on materials for prefabricated bridge deck pavement and construction technology: Application to a case study of concrete box-girder bridge. Case Stud. Constr. Mater. 2024, 20, e03185. [Google Scholar] [CrossRef] [Scilit]
- Su, Q. A New Type Hybrid-beam Bridge Structural System and Its Design Parameters. J. Tongji Univ. (Nat. Sci.) 2013, 41, 799–805. [Google Scholar] [CrossRef]
- Zhang, J. Analysis of Force Transmission Characteristics and Bearing Capacity of Combined Section of Composite Hybrid Beam Cable-Stayed Bridge. Master’s Thesis, Chongqing Jiaotong University, Chongqing, China, 2023. [Google Scholar]
- Qu, J.; Wang, S. Research on Stress Performance of Steel-concrete Joint Section of Composite Hybrid Beam Cable-stayed Bridge. In Proceedings of the WTC2025, Suzhou, China, 12 June 2025. [Google Scholar] [CrossRef]
- Zhao, L.; Pu, G.; Yuan, Y.; Guo, Q.; Yu, Y. Mechanical behaviour of steel-concrete joint in hybrid girder cable-stayed bridge. Structures 2023, 57, 105239. [Google Scholar] [CrossRef] [Scilit]
- Hu, W.; Hu, K. Erection Supervision of Main Spans of Xupu Bridge. Bridge Constr. 1998, 2, 25–28. [Google Scholar]
- Liu, Z. The Development of Cable-Supported Bridges in Hong Kong. China Civ. Eng. J. 2005, 38, 59–68. [Google Scholar] [CrossRef]
- Leng, J.; Yang, J.; Zhang, Z.; Zou, Y.; Chen, J.; Zhou, J. Experimental and numerical investigations on force transfer mechanism of steel-concrete joint in hybrid girder bridges. Structures 2023, 54, 153–170. [Google Scholar] [CrossRef] [Scilit]
- Yang, S.; Zhang, Y.; Zhou, Y.; Chen, X.; Yang, H. Force-Transfer Mechanism Analysis of Steel–Concrete Joints in Railway Hybrid Girder Cable-Stayed Bridges. Int. J. Steel Struct. 2025, 25, 947–958. [Google Scholar] [CrossRef] [Scilit]
- Chen, D.; Lin, Z.; Su, Q.; Ouyang, M.; Shangguan, B. Structural Optimization and Experiment of Steel Concrete Composite Segment in Hybrid-Girder Rigid Frame Bridges. Eng. Mech. 2023, 40, 149–160. [Google Scholar] [CrossRef]
- Shangguan, B.; Su, Q.; Casas, J.R.; Su, H.; Wang, S.; Zhao, R. Modeling and Testing of a Composite Steel-Concrete Joint for Hybrid Girder Bridges. Materials 2023, 16, 3265. [Google Scholar] [CrossRef] [Scilit] [PubMed]
- Yang, S.; Shi, Z.; Pu, Q.; Jiang, X.; Zeng, M.; Liu, Z. Study on Mechanical Behaviour of Steel-Concrete Joint of High-speed Railway Hybrid Girder Cable-stayed Bridge with Twin-box Section. Tiedao Xuebao J. China Railw. Soc. 2022, 44, 150–160. [Google Scholar] [CrossRef]
- Lin, Y.T.; Li, L.H.; Su, Q.T.; Matanmi, F.O. Mechanical behavior and calculation method of the joint between the steel anchor beam and the concrete pylon wall in cable-stayed bridge pylons. Structures 2026, 88, 111879. [Google Scholar] [CrossRef] [Scilit]
- Shi, Z.; Zhang, Y.; Li, Y.; He, Z.; Shi, J. Stress Behavior and Theoretical Calculation of Steel-concrete Joint of Railway Hybrid Girder. Eng. Mech. 2024, 41, 282–291. [Google Scholar] [CrossRef]
- Wang, H.; Yang, L.; Zeng, H. Study on Static Performance of The Steel-concrete Joint in a High-speed Railway Hybrid Girder Low Tower Cable-stayed Bridge. Structures 2025, 71, 107858. [Google Scholar] [CrossRef] [Scilit]
- Shi, Z.; Li, Y.; Yang, Y.; Zhao, X.; Yu, W. Fatigue Performance of a Novel Steel-Concrete Joint of a Long-Span High-Speed Railway Hybrid Girder–Cable-Stayed Bridge. J. Bridge Eng. 2024, 29, 04023104. [Google Scholar] [CrossRef] [Scilit]
- Yao, Y.; Yan, M.; Shi, Z.; Wang, Y.; Bao, Y. Mechanical Behavior of an Innovative Steel-concrete Joint for Long-span Railway Hybrid Box Girder Cable-stayed Bridges. Eng. Struct. 2021, 239, 112358. [Google Scholar] [CrossRef] [Scilit]
- Pu, Q.; Yang, S.; Shi, Z.; Hong, Y.; Zhou, Y. Fatigue Performance of an Innovative Steel-Concrete Joint in Long-Span Railway Hybrid Box Girder Cable-Stayed Bridges. J. Bridge Eng. 2021, 26, 04020129. [Google Scholar] [CrossRef] [Scilit]
- Lin, Y.; Su, Q.; Matanmi, F.O.; Shangguan, B.; Wu, F. Flexural performance and calculation methods for steel-concrete joint in hybrid girder rigid frame bridges. Structures 2026, 88, 111885. [Google Scholar] [CrossRef] [Scilit]
- Cheng, X.; Nie, X.; Fan, J.S. Structural Performance and Strength Prediction of Steel-to-Concrete Box Girder Deck Transition Zone of Hybrid Steel-Concrete Cable-Stayed Bridges. J. Bridge Eng. 2016, 21, 1–19. [Google Scholar] [CrossRef] [Scilit]
- Carlo, P.; Virginio, Q. Comparison of Linear and Nonlinear Procedures for the Analysis of the Seismic Performance of Straight Multi-Span RC Bridges. Buildings 2024, 14, 464. [Google Scholar] [CrossRef] [Scilit]
- Lam, D.; El-Lobody, E. Behavior of Headed Stud Shear Connectors in Composite Beam. J. Struct. Eng. 2005, 131, 96–107. [Google Scholar] [CrossRef] [Scilit]

Disclaimer/Publisher’s Note: The statements, opinions and data contained in all publications are solely those of the individual author(s) and contributor(s) and not of MDPI and/or the editor(s). MDPI and/or the editor(s) disclaim responsibility for any injury to people or property resulting from any ideas, methods, instructions or products referred to in the content. |
© 2026 by the authors. Licensee MDPI, Basel, Switzerland. This article is an open access article distributed under the terms and conditions of the Creative Commons Attribution (CC BY) license.