


Featured Application
The evaluated Fusion AI workflow provides a robust framework for historical landscape reconstruction using archival aerial imagery, enabling the automated and accurate generation of 3D terrain models for heritage documentation and archaeological research in areas with limited metadata.
Abstract
This study evaluates the accuracy of various preprocessing methods applied to scanned archival aerial photographs for reconstructing historical terrain in the Czech Republic. Seven workflows were tested on identical imagery and control points, varying parameters such as resolution unification, brightness normalization, focal length calibration, and AI-based denoising. Accuracy was assessed using GNSS checkpoints and high-resolution LiDAR data. Results show that basic brightness correction reduced the vertical RMSE by 59% (to 5.69 m). In contrast, standalone AI preprocessing was associated with increased geometric instability (RMSE 16.48 m) due to over-smoothing and the loss of essential micro-texture. However, the evaluated “Fusion AI” workflow—combining AI enhancement with strict focal length constraints—successfully mitigated this degradation. By restricting the internal orientation, it stabilized the vertical accuracy at 6.48 m, closely matching the best traditional approaches. Statistical analysis revealed strong spatial autocorrelation and non-normal error distributions, highlighting the need for robust validation. Ultimately, this study confirms that AI can be effectively utilized to enhance visual clarity in data-scarce historical reconstruction without sacrificing spatial reliability, provided it is strictly geometrically constrained. This offers an optimal compromise and a tested, reproducible workflow that supports heritage preservation and long-term environmental analysis.
1. Introduction
The utilization of historical aerial and terrestrial imagery has become increasingly vital across various scientific disciplines, enabling researchers to conduct long-term spatiotemporal analyses that would otherwise be impossible. These archival datasets serve as unique time capsules, providing foundational data for tracking land-use changes, documenting the evolution of cultural heritage, and assessing environmental dynamics over decades [1]. Furthermore, the transition from traditional analytical photogrammetry to modern digital processing techniques—such as Structure-from-Motion (SfM)—has significantly broadened the accessibility and application of these historical records [2]. However, working with analog images digitized for modern workflows brings specific challenges, particularly regarding how scanning resolution and physical degradation influence the final geometric accuracy [3,4].
Despite these methodological advancements, reconstructing historical terrain from archival aerial imagery is significantly constrained by the absence of camera calibration protocols (Interior Orientation) and flight logs (Exterior Orientation)—a condition referred to here as the “metadata vacuum” [5,6]. Coupled with the physical degradation of analog film and radiometric inconsistencies, this lack of calibration data makes standard Structure-from-Motion (SfM) workflows highly unstable [4,7,8]. In regions affected by drastic anthropogenic transformations, such as open-pit mining districts, original topographic features have been extensively transformed [9,10]. Consequently, establishing dense Ground Control Point (GCP) networks is often unfeasible, further compounding the geometric instability of historical photogrammetry [11,12].
While previous studies have demonstrated the potential of historical SfM [13,14,15,16], they typically rely on datasets with sufficient control points. Furthermore, although modern AI-based denoising techniques offer visual enhancements, their geometric impact on 3D reconstruction remains poorly quantified under limited control conditions [17,18]. Therefore, a systematic evaluation of how specific preprocessing steps affect vertical accuracy in data-scarce environments is required.
This study addresses these gaps by conducting a rigorous sensitivity analysis of seven distinct photogrammetric workflows applied to scanned archival imagery from the 1930s. Rather than seeking to maximize absolute accuracy under ideal conditions, our primary objective is to identify a robust preprocessing strategy capable of minimizing vertical error in suboptimal conditions, where metadata are missing and ground control is minimal.
To achieve this, we test the following three hypotheses:
H1.
Basic radiometric corrections (brightness normalization) and geometric standardization (resolution unification) substantially reduce noise in the sparse cloud, improving the vertical accuracy (RMSE) compared to unmodified archival scans.
H2.
Standalone AI-based denoising, while visually enhancing 2D image quality, introduces geometric smoothing that degrades the vertical accuracy of 3D models unless constrained by fixed internal orientation parameters.
H3.
A composite “Fusion AI” workflow—combining AI enhancement with strict focal length fixation—can mitigate the geometric degradation associated with standalone AI preprocessing and maintain acceptable reconstruction stability under data-scarce conditions (minimal GCP availability).
To validate these workflows robustly despite the limited number of available ground control points (n = 6), we employ a dual-validation approach. This combines discrete GNSS checkpoints with a continuous surface difference analysis against high-resolution LiDAR data, allowing for a comprehensive assessment of terrain morphology reconstruction in the Bohemian Central Highlands. Ultimately, our findings reveal that while unconstrained AI denoising significantly degrades vertical accuracy (RMSE increasing to over 16 m), the evaluated geometrically constrained “Fusion AI” workflow successfully mitigates these distortions, stabilizing the error at 6.48 m and providing a reproducible path for historical landscape reconstruction under pronounced metadata limitations.
2. Materials and Methods
The primary dataset consists of aerial photographs acquired during the late 1930s by the Military Geographical Institute of Czechoslovakia, typically flown at altitudes of 4200 to 5000 m. The imagery was recorded on nitrocellulose film. While this medium offers high textural resolution suitable for photogrammetric processing, it is physically fragile and prone to degradation and radiometric aging over time [19,20]. To preserve the maximum amount of spatial information, the analog negatives were digitized at the Military Geographic and Hydrometeorological Office (VGHMÚř) using high-precision photogrammetric scanners at a 14–15 micrometer resolution with an internal geometric accuracy of 2 micrometers [21].
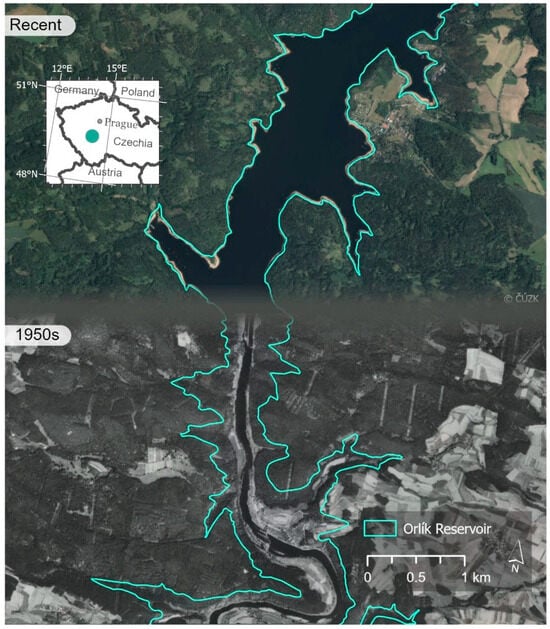
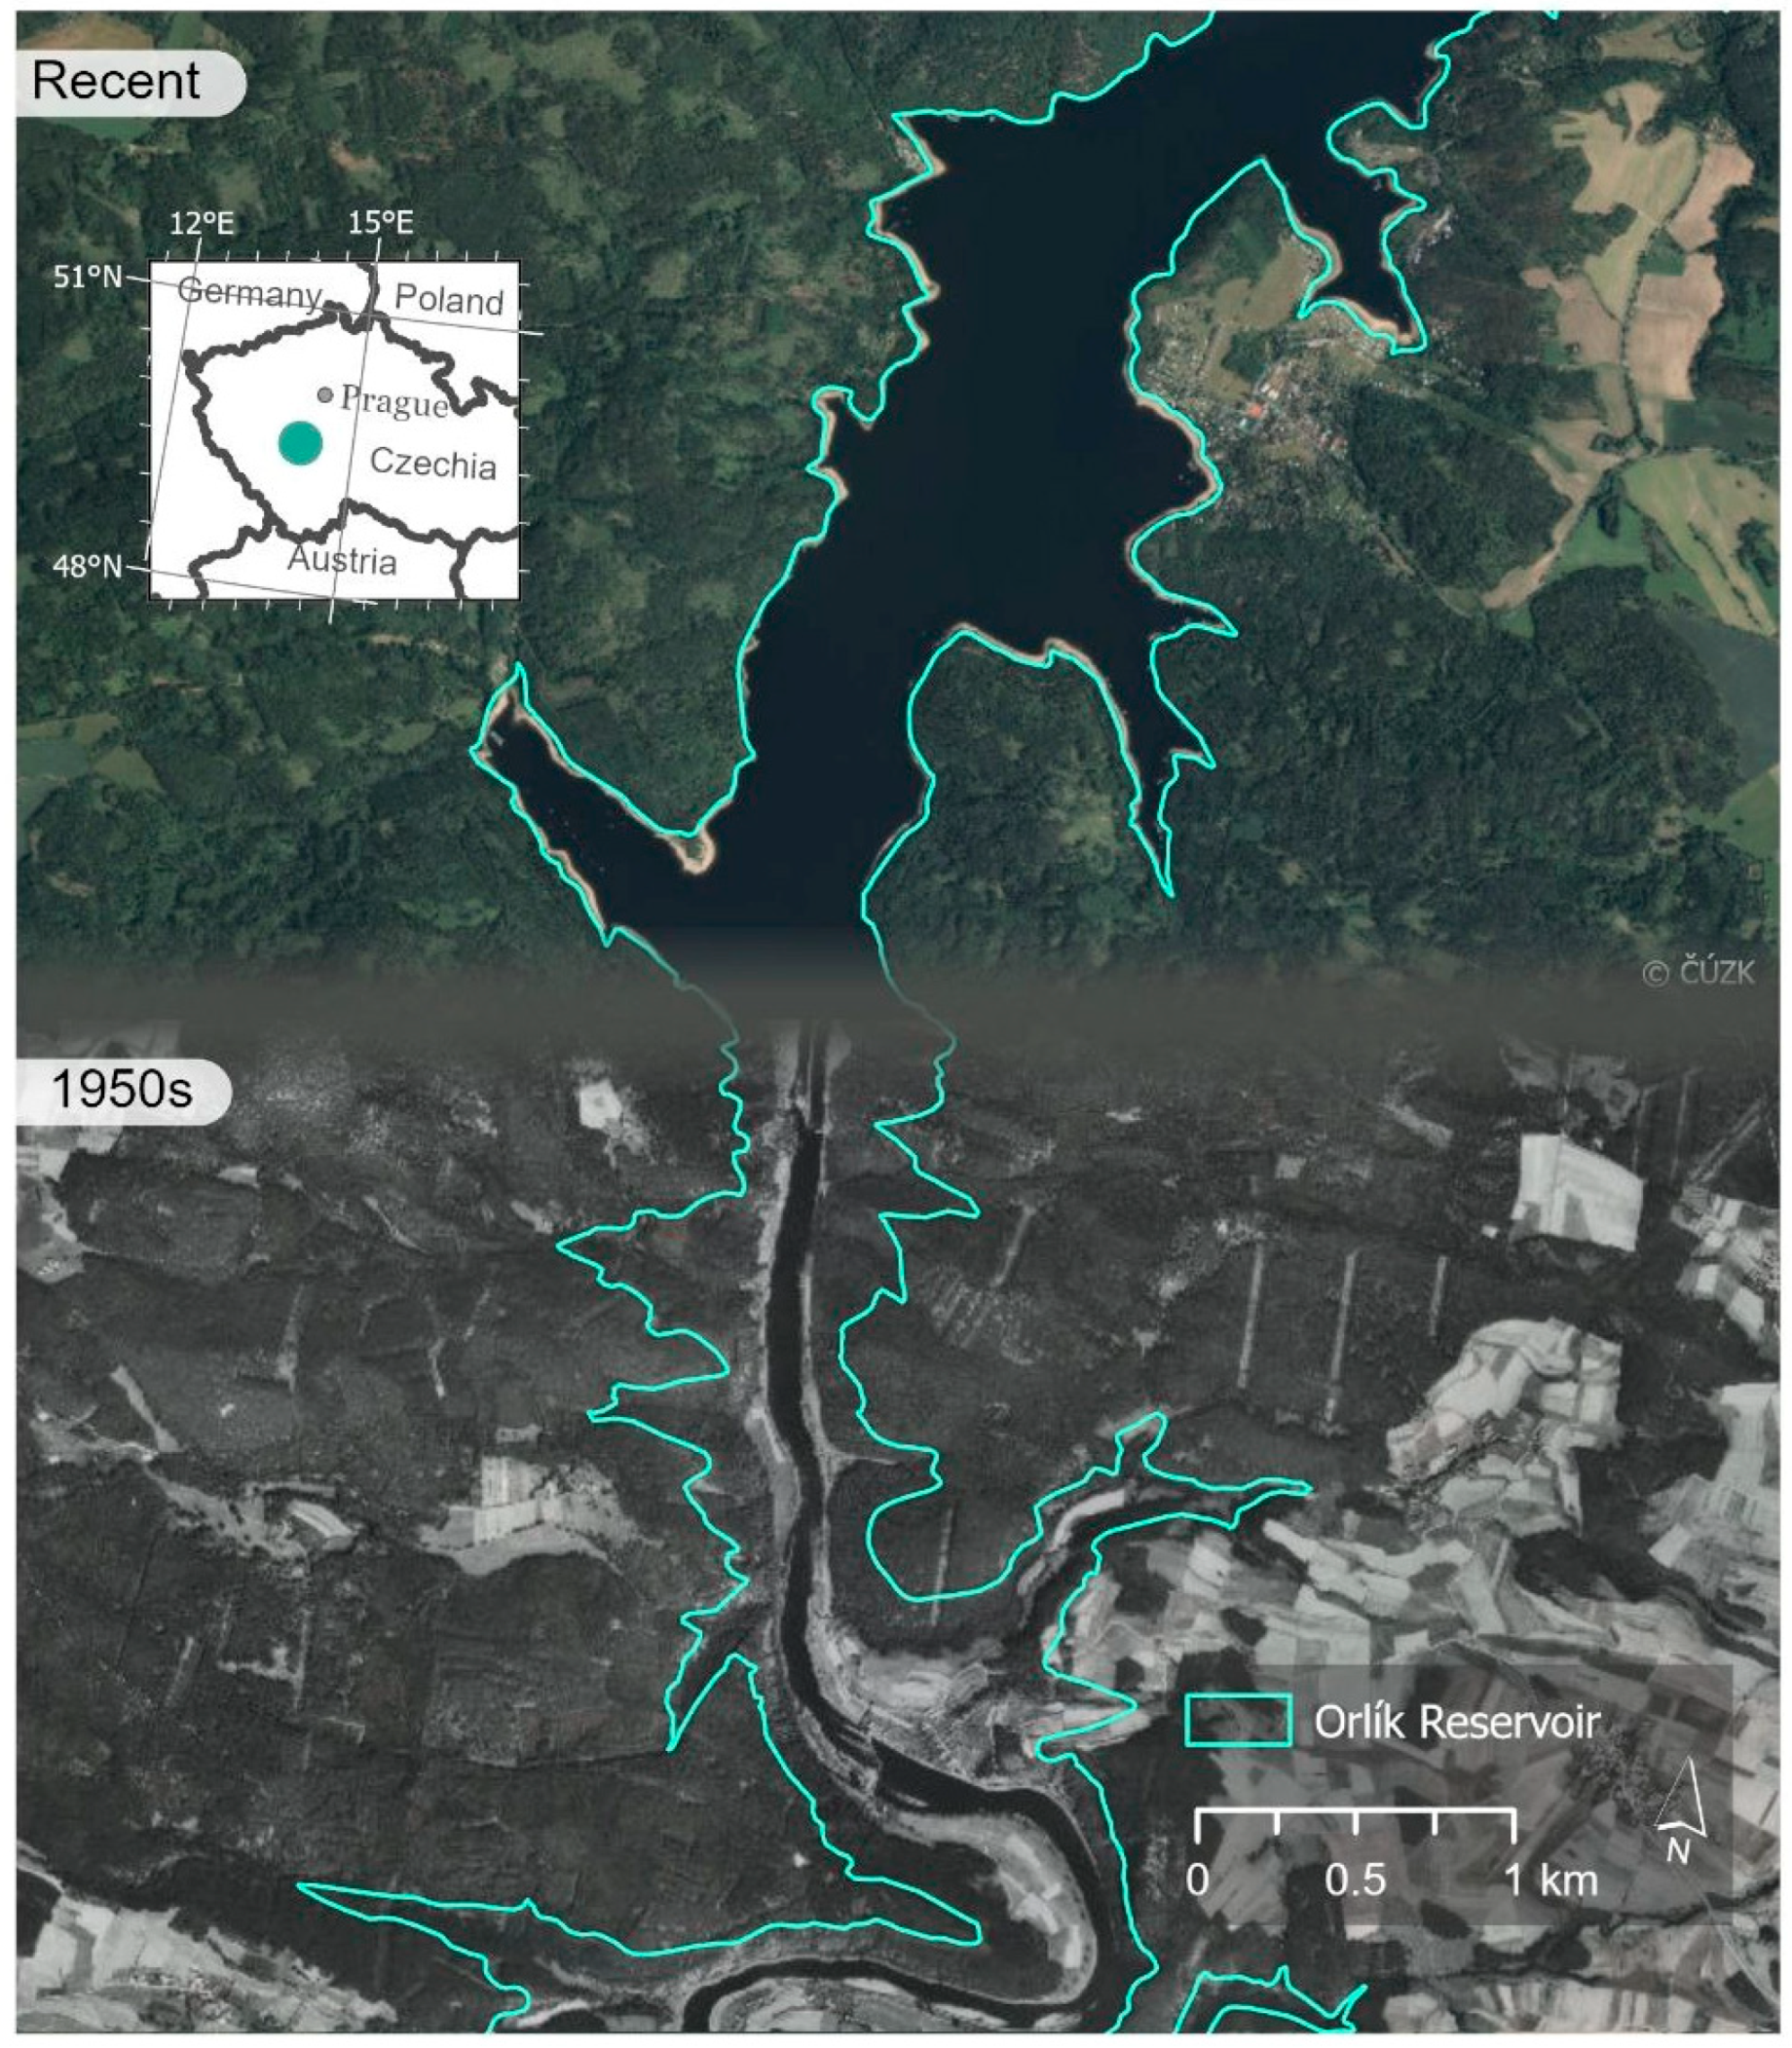
The Czech Republic was selected as the study area due to the massive anthropogenic transformations it underwent during the 20th century, particularly through extensive surface coal mining and the construction of large reservoir systems (see Figure 1) [22,23]. While numerous authors have long demonstrated the utility of archival imagery for assessing environmental and geomorphological dynamics—ranging from long-term soil erosion to landslide monitoring [7,20,24,25]—the precise 3D reconstruction of vanished terrain forms in these heavily disturbed regions presents a specific challenge. The complete obliteration of original topographic features often prevents the establishment of dense ground control point (GCP) networks, necessitating the robust processing workflows evaluated in this study.
Figure 1.
Example of vanished terrain morphology due to the construction of the Orlík Reservoir.
2.1. Methodological Test Site
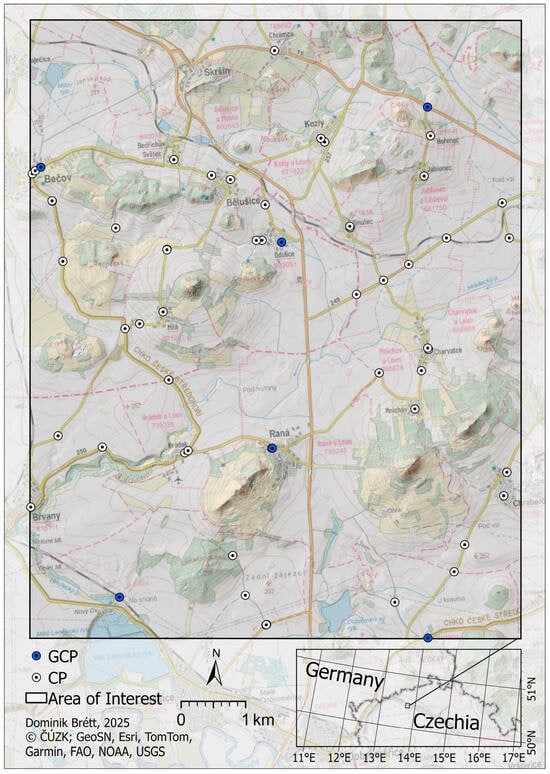
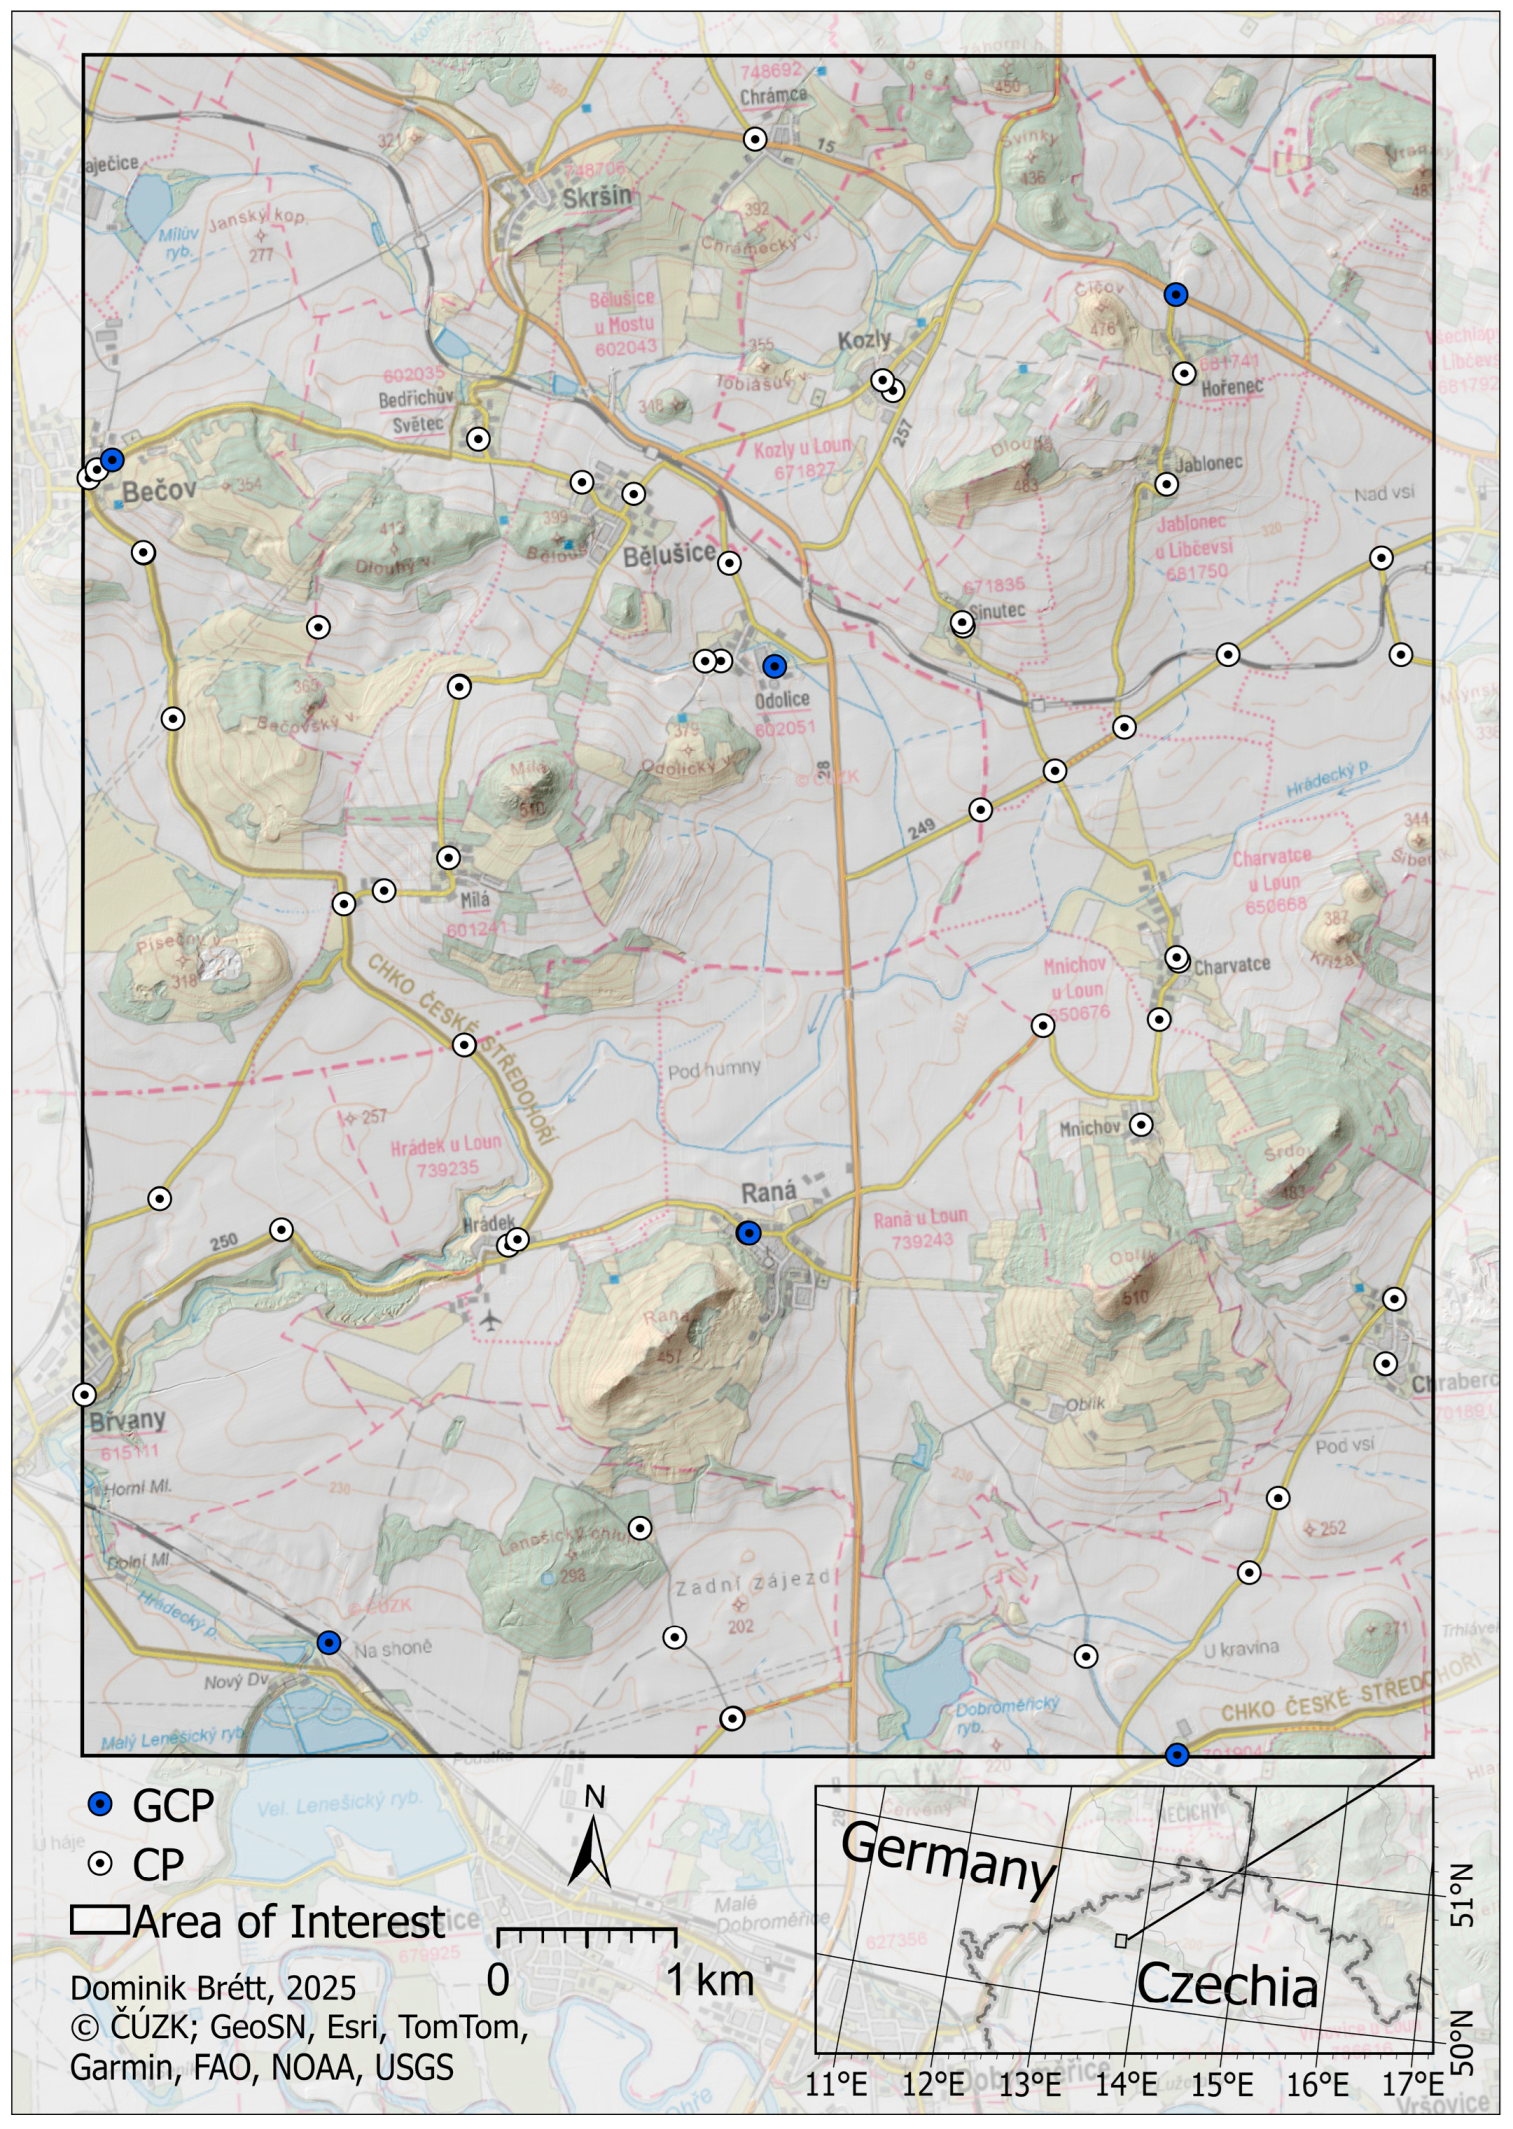
The study focuses on the Bohemian Central Highlands (České středohoří), specifically the area surrounding Raná hill (see Figure 2). This region was selected not as a representative example of a transformed landscape, but rather as a controlled methodological test site. Its geomorphological diversity—characterized by sharp transitions between flat agricultural plains and steep volcanic cones—provides a rigorous testing ground for evaluating the vertical stability of photogrammetric models.
Figure 2.
Overview map of the Bohemian Central Highlands (České středohoří) study area, illustrating the spatial distribution of the six Ground Control Points (GCPs) and 53 Checkpoints (CPs) used for model georeferencing and validation.
Importantly, unlike the target application domains of this research (e.g., open-pit mining districts where the original terrain has been extensively transformed), the Raná study area has remained geomorphologically stable over the evaluated period. This stability is necessary, as it allows for the acquisition of independent, high-precision modern reference data (LiDAR and GNSS) required to objectively quantify the errors of the reconstructed historical surface models.
2.2. Simulation of Data-Scarce Conditions
A central aspect of this study is the simulation of the “metadata vacuum” typical of historical archives. In regions affected by drastic anthropogenic changes, reliable ground control is often nonexistent due to the destruction of original landscape features. To replicate these strict operational limitations, the methodology does not aim for maximum achievable accuracy using a dense control network. Instead, the georeferencing process was deliberately restricted to a minimal set of persistent natural features (n = 6) identifiable across the temporal gap.
While this low number of Ground Control Points (GCPs) falls below standard recommendations for modern photogrammetric blocks, it directly reflects the realistic limits encountered in historical landscape reconstruction. This experimental design allows us to isolate and assess the performance of the evaluated preprocessing workflows (particularly the “Fusion AI” method) under the specific stress conditions of minimal geometric control. The resulting models are subsequently validated against a dense network of 53 independent checkpoints and continuous LiDAR coverage.
2.3. GNSS Data Collection and Ground Control Strategy
Ground control and checkpoint data were acquired using Global Navigation Satellite System (GNSS) Real-Time Kinematic (RTK) methods with real-time corrections. Each point was measured under favorable satellite geometry (typically utilizing more than 20 visible satellites), ensuring that the resulting positional errors did not exceed several centimeters in either the horizontal or vertical components. A total of 59 ground points were measured in the field. To simulate the data-scarce conditions described above, only 6 points were utilized as Ground Control Points (GCPs) to anchor the models, while the remaining 53 served as independent Checkpoints (CPs) for rigorous accuracy validation.
The identification of suitable GNSS points required careful selection to represent identical, well-preserved features that have remained unchanged from the time of the historical imagery to the present. The selection focused primarily on building corners and other static anthropogenic objects clearly visible in both the historical and modern orthophotos. To facilitate the localization of these persistent features, we utilized the official historical orthophoto map of the Czech Republic, available as a Web Map Tile Service (WMTS). This map service, created as part of the National Inventory of Contaminated Sites (NIKM) project in 2010, includes aerial images predominantly from 1952 to 1954 (supplemented with images from 1937 to 1970 and 1996). This intermediate dataset served as a crucial temporal bridge, allowing us to reliably verify the stability of identical points between the original 1930s archival imagery and the modern landscape.
2.4. Aerial Laser Scanning (LiDAR Reference Data)
Part of the territory, specifically the area around Raná hill, was also scanned using a RIEGL VUX-1LR aerial laser scanner (RIEGL Laser Measurement Systems GmbH, Horn, Austria) mounted on a TL-232 Condor aircraft. This small aircraft, initially modified for military purposes, is equipped with a specialized sensor bay. Its low cruising speed of approximately 100 km/h provides optimal parameters for high-density scanning.
The scanned area was flown at approximately 300 m above the terrain, accounting for local topographic variability. The LiDAR scanner was configured to a pulse frequency of 400 kHz with 81 lines per second (lps). Trajectory refinement via Post-Processed Kinematic (PPK) methods was performed using PosPac software (version 8.4), and the raw scanner data was processed in RiProcess (version 1.8.6.18). To generate a reference surface, the LiDAR point cloud data were interpolated into a raster Digital Elevation Model (DEM) with a spatial resolution of 0.5 m using the ‘Binning’ method in ArcGIS Pro (version 3.2.1). The average elevation of all points within each cell was calculated to minimize the influence of outliers. Gaps without data were filled using linear interpolation to ensure a continuous surface, and the output raster was stored in floating-point format to retain full elevation precision. These LiDAR-derived models exhibited a vertical accuracy of ±5 cm and a horizontal accuracy of ±10 cm, serving as a highly precise, consistent benchmark for evaluating the accuracy of the models generated from the archival aerial imagery.
2.5. Photogrammetric Processing
The test datasets contain the same 30 images captured from the identical historical flight mission. However, for each dataset, specific preprocessing parameters were systematically varied to assess their impact on the final 3D model. All datasets were processed in Agisoft Metashape software (version 2.1.0). The images were aligned using the “High” accuracy setting, with a key point limit of 80,000 and a Tie point limit of 8000.
For the dense surface reconstruction, Depth Maps were generated with the Depth Filtering parameter set to “Aggressive”. This filtering level was deliberately chosen to maximize the removal of noise inherent to the scanned nitrocellulose film, prioritizing overall surface smoothness and noise suppression over the retention of potential micro-texture details [26]. Subsequently, Digital Surface Models (DSMs) were generated directly from the calculated Depth Maps, bypassing the dense point cloud generation step to streamline the workflow and reduce data redundancy. Interpolation was “Enabled” to ensure a continuous surface representation. Finally, orthomosaics were generated based on the respective DSMs. All outputs were processed and georeferenced in the S-JTSK/Krovak East North coordinate system (EPSG:5514).
Importantly, all datasets were georeferenced and evaluated using the identical workflow. The same set of ground control points (n = 6) was used to anchor the models, and identical processing parameters were applied across all variants. This standardized approach ensures a reliable assessment of the influence of the varied preprocessing inputs.
2.6. Difference Analysis
To evaluate the performance of the generated DSMs in complex terrain, a spatial difference analysis was conducted over the hilly area of the test site. Since such undulating terrain typically lacks identical anthropogenic ground features for discrete control point measurements, the independent high-resolution LiDAR dataset (see Section 2.4) was used as a continuous reference. The LiDAR reference surface was subtracted from the DSMs derived from each historical image dataset to quantify elevation differences and evaluate terrain representation accuracy. While minor deviations may reflect actual landscape changes (e.g., vegetation growth or minor erosion) that occurred between the historical imagery acquisition and the modern LiDAR survey, these changes are temporally constant across all dataset variants. Consequently, their influence does not compromise the internal validity of the relative performance comparison among the different preprocessing workflows.
2.7. Statistical Analysis
To rigorously evaluate the accuracy and consistency of the resulting models, multiple statistical measures were computed for each dataset using the 53 GNSS checkpoints. These metrics included:
- Root Mean Square Error (RMSE) in X, Y, Z: To assess absolute positional and vertical accuracy.
- Mean and Median Errors: To identify systematic shifts (bias).
- Standard Deviation: To measure the variability and dispersion of the errors.
- Skewness and Kurtosis: To describe the shape and distribution of the error values.
- Shapiro–Wilk test: To test for normality. Values significantly below 1 (p < 0.05) indicate a non-normal error distribution.
- Paired t-tests: Applied to assess whether the mean vertical and horizontal errors significantly deviate from zero (indicating systematic bias).
- Global and Local Moran’s I: To evaluate the spatial autocorrelation of errors. High positive values indicate strong spatial clustering of similar error magnitudes.
- Spearman’s Rank Correlation: A robust non-parametric test [27] used to assess monotonic relationships between terrain elevation and vertical error, without assuming linearity or being heavily influenced by outliers.
2.8. Dataset Description and the Fusion Workflows
To systematically isolate the effects of individual preprocessing steps, a total of seven dataset variants were generated from the original archival imagery. Each dataset builds upon specific modifications—ranging from basic geometric cropping to advanced AI denoising—allowing for a controlled evaluation of their impact on the final 3D reconstruction. All datasets were processed in Agisoft Metashape under identical alignment and model generation parameters. The seven evaluated datasets are defined as follows:
- Original (Raw): The baseline dataset processed without any modifications. The raw scans contain unnecessary data (e.g., white scanning backgrounds) and slight resolution inconsistencies, causing the SfM software to incorrectly categorize the image block into distinct camera groups.
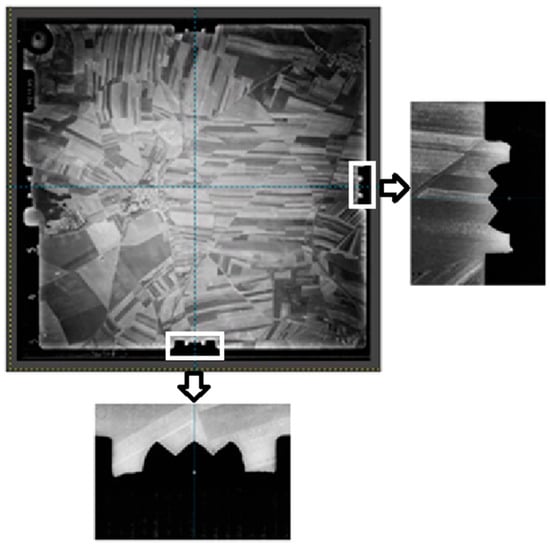
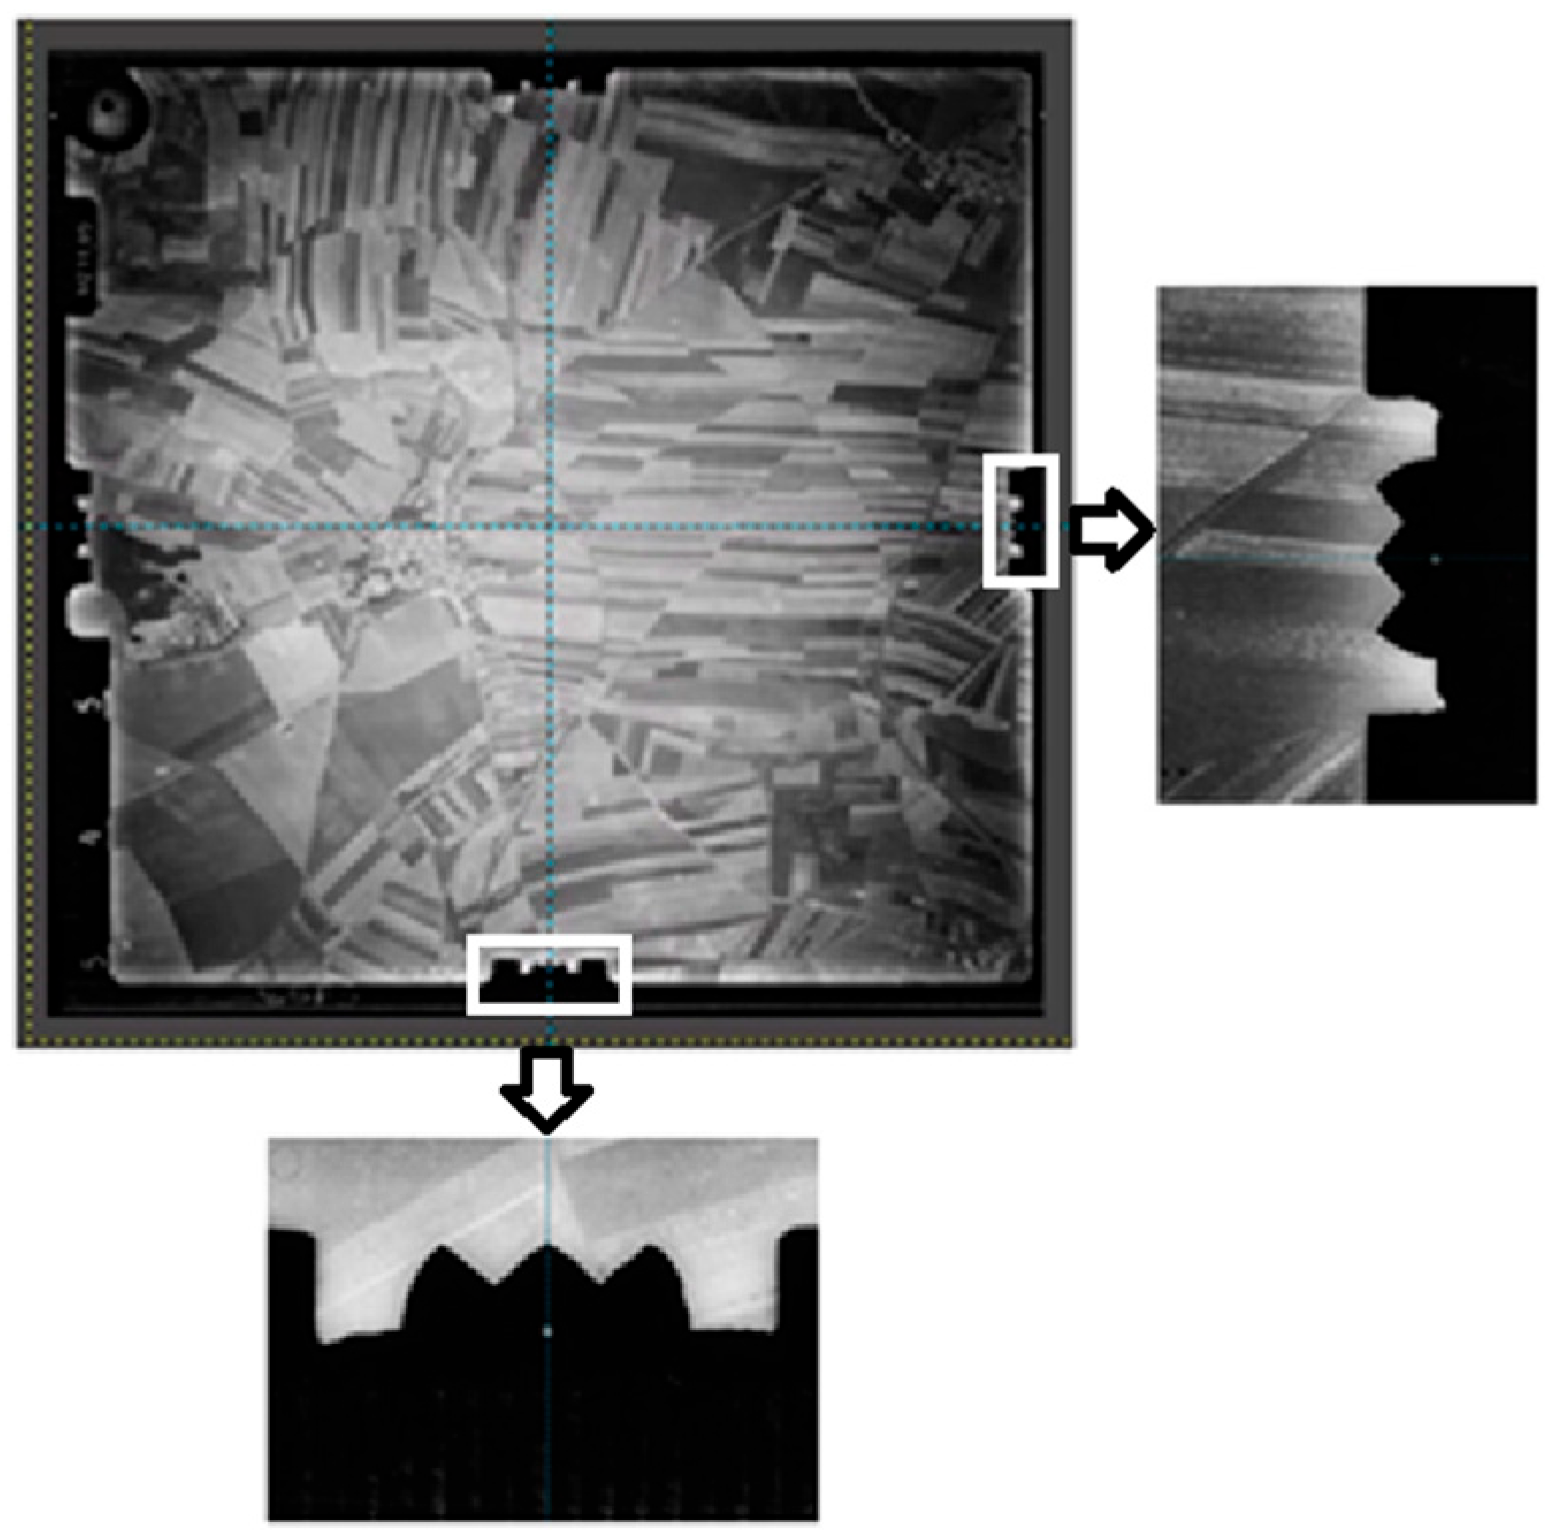
- Unified: Geometric standardization was performed using GIMP software (version 3.0.4). Frame and out-of-frame metadata were removed, and all images were resized to a common resolution (12,210 × 11,782 pixels), matching the lowest effective resolution within the block. Images were precisely aligned using fiducial marks to ensure uniform orientation (Figure 3).
- Unified + Focal Length: Identical to the Unified dataset, but with internal orientation parameters partially constrained. The historically calibrated focal length (f = 211.09 mm), extracted from the preserved frame metadata, was manually fixed in the SfM software to prevent erroneous self-calibration (Figure 4).
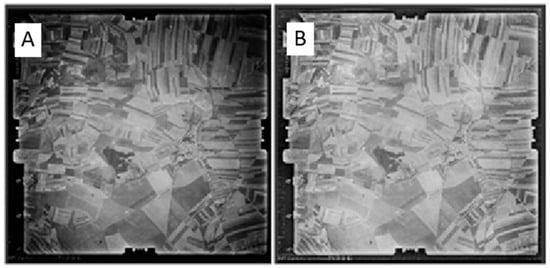
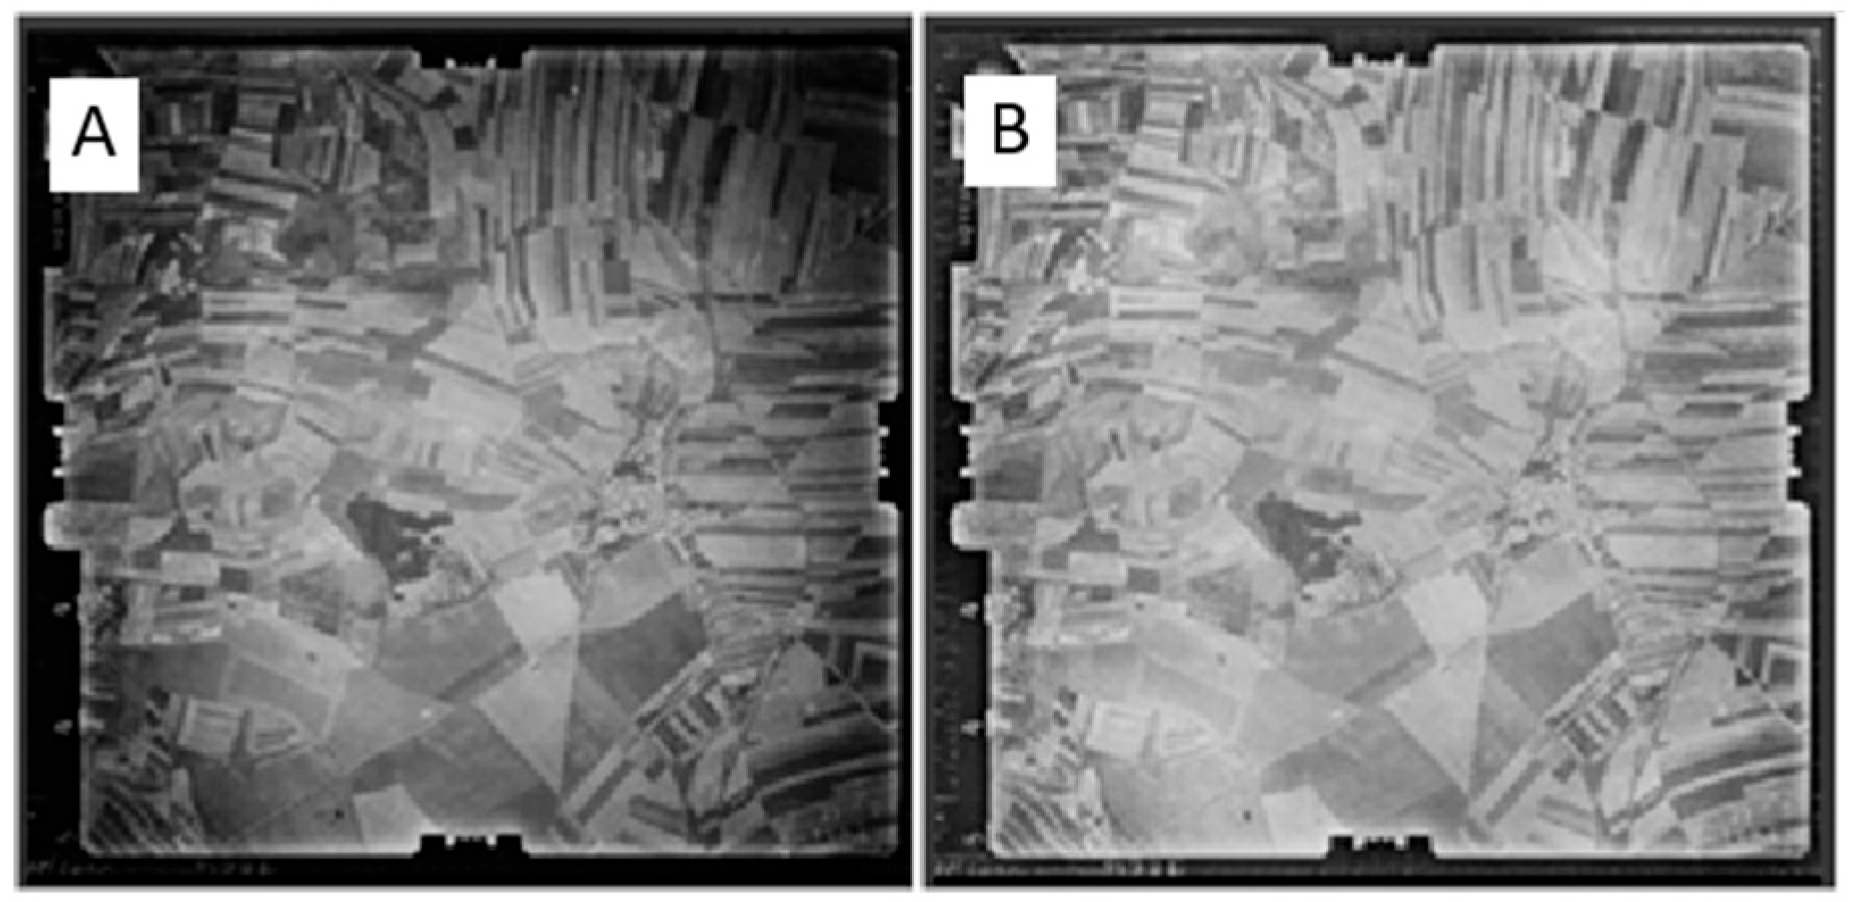
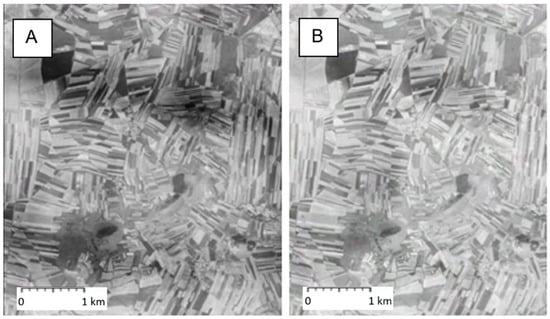
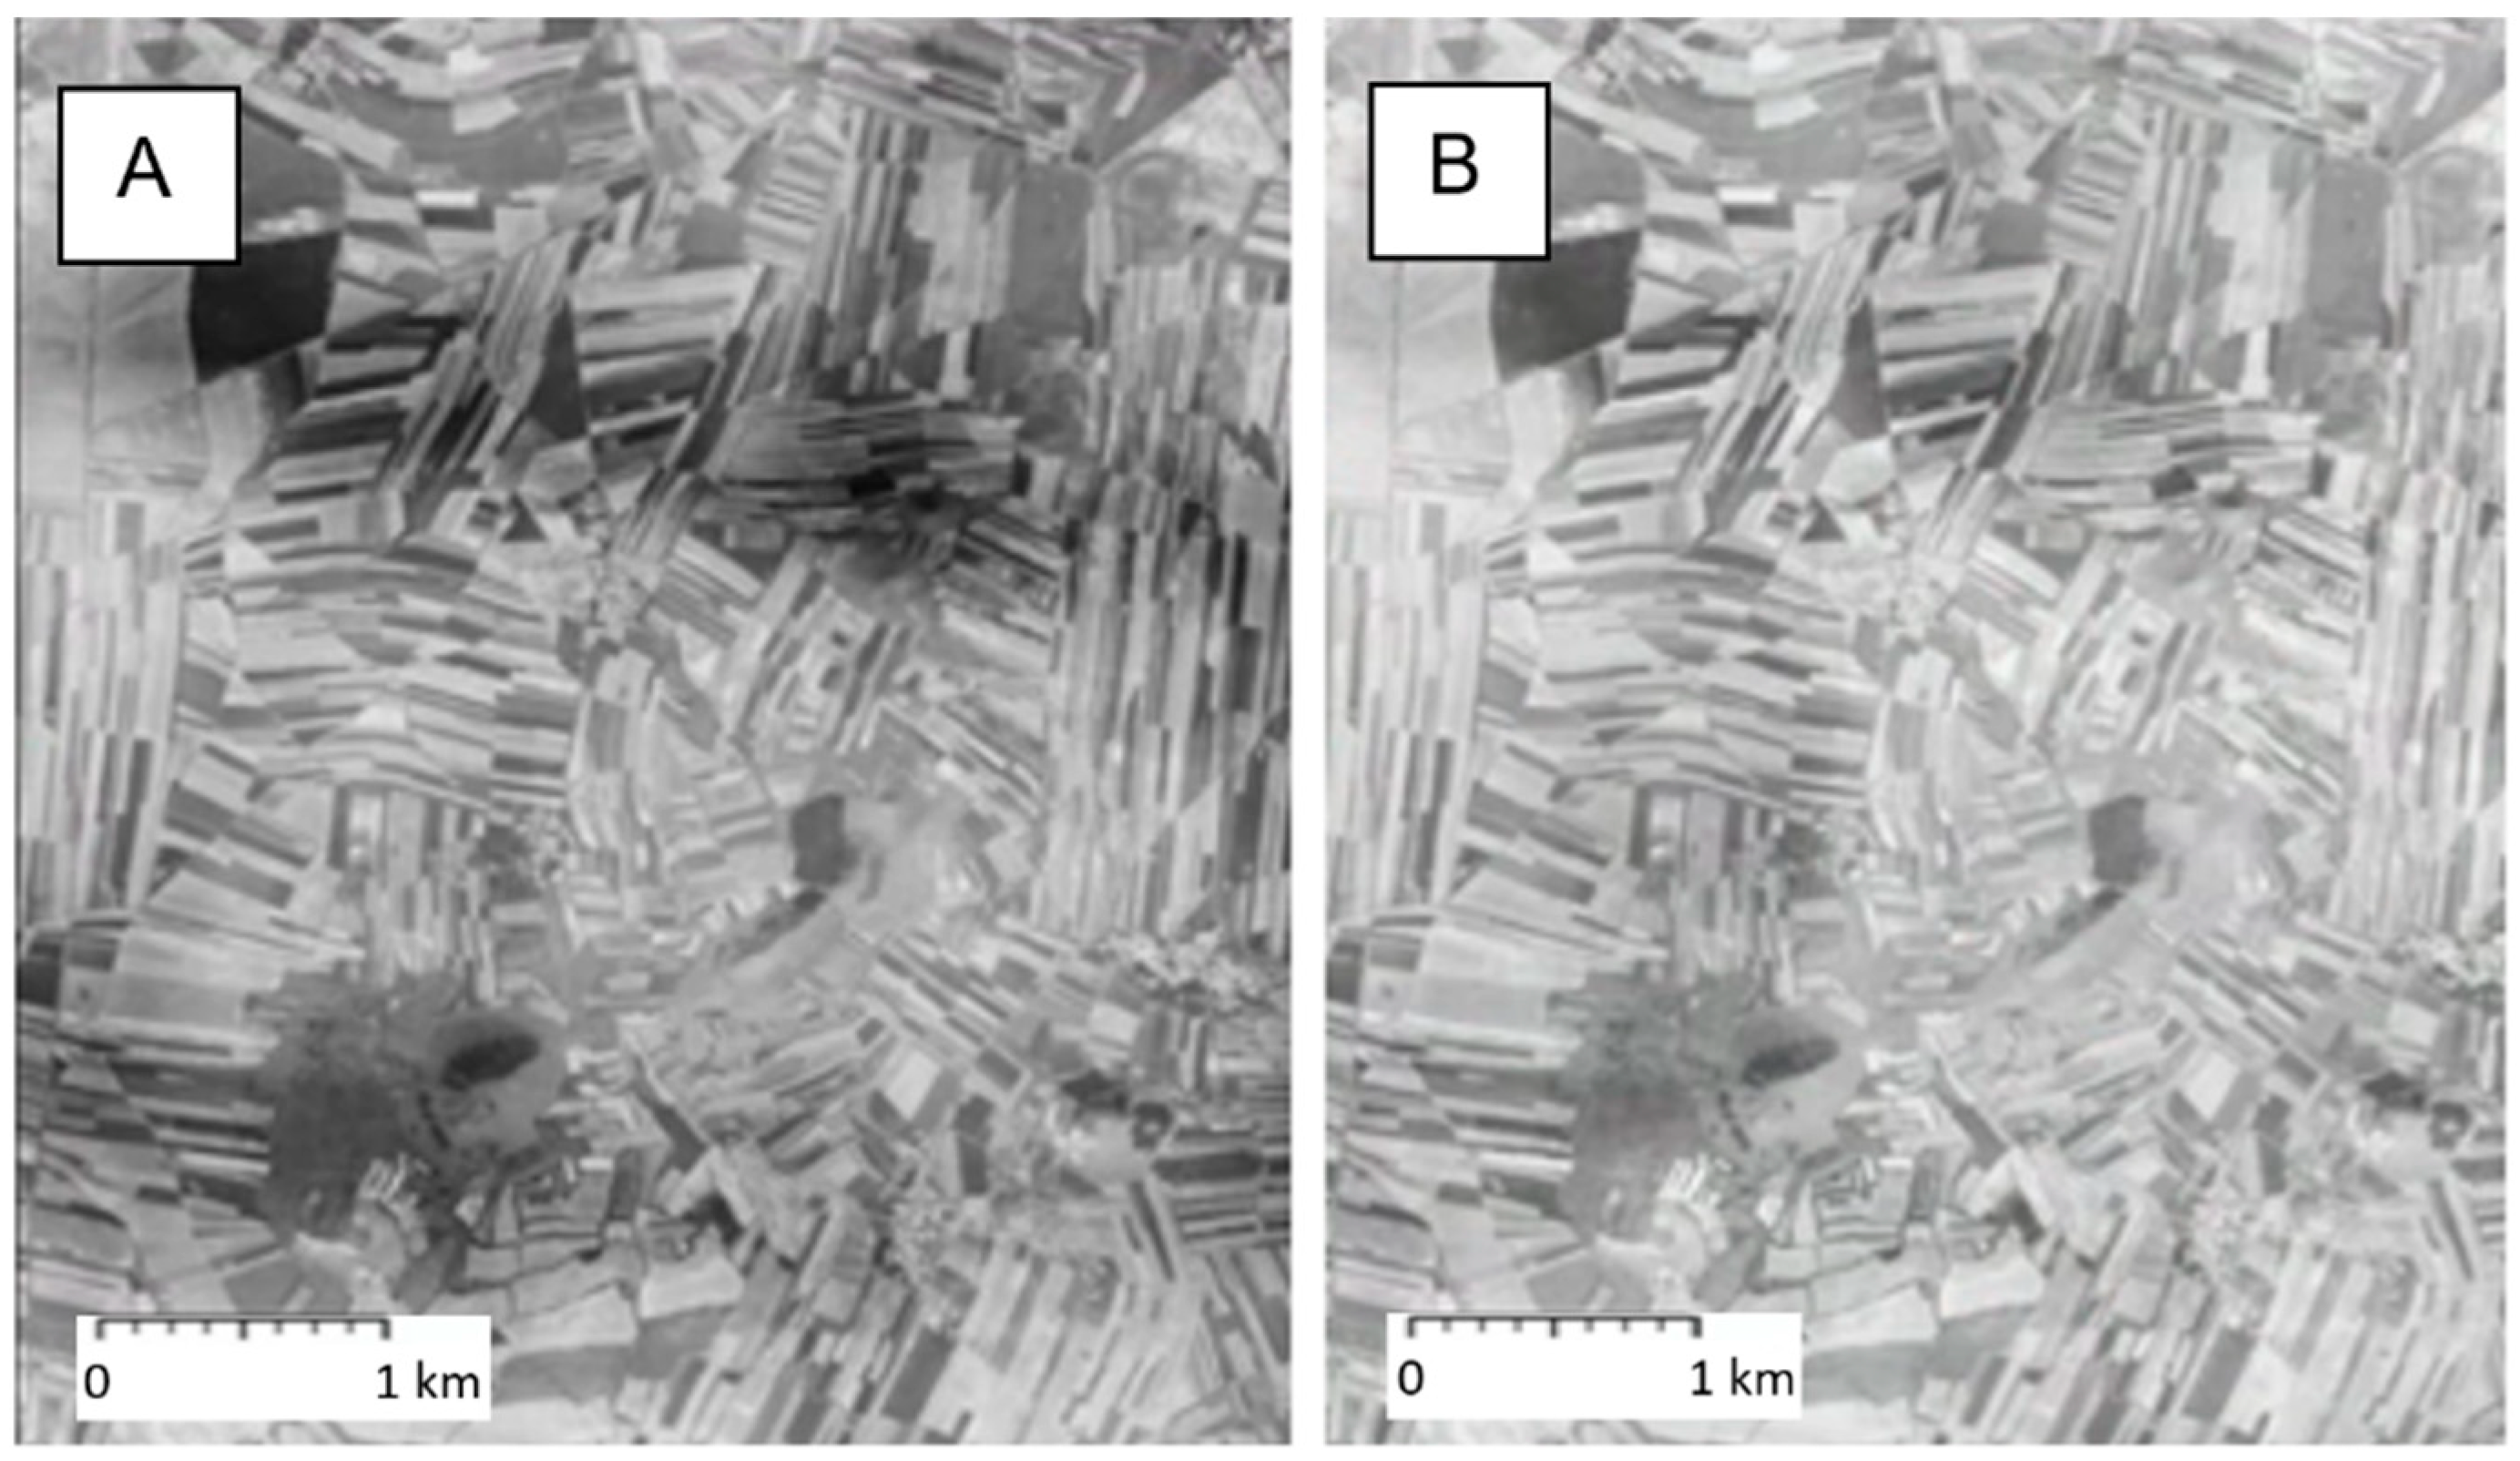
- Unified + Brightness: Identical to the Unified dataset, with the addition of radiometric normalization. Image brightness and histograms were unified across the block using the Adjustment Brush tool in Adobe Lightroom. This step ensured consistent feature detection during tie-point extraction, especially in darkened areas near the image edges (Figure 5).
Figure 3.
Image adjustment in GIMP using fiducial marks.
Figure 4.
Determination of focal length and its input into the processing software.
Figure 5.
Details of different brightness levels in the orthophoto—Original dataset (A), brightness-adjusted dataset (B).
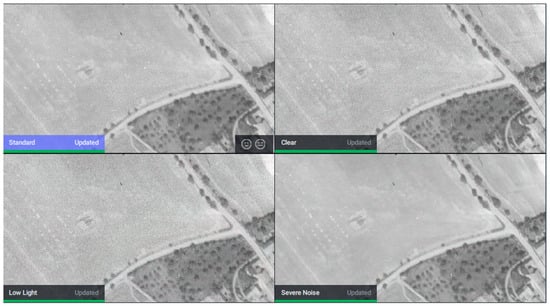
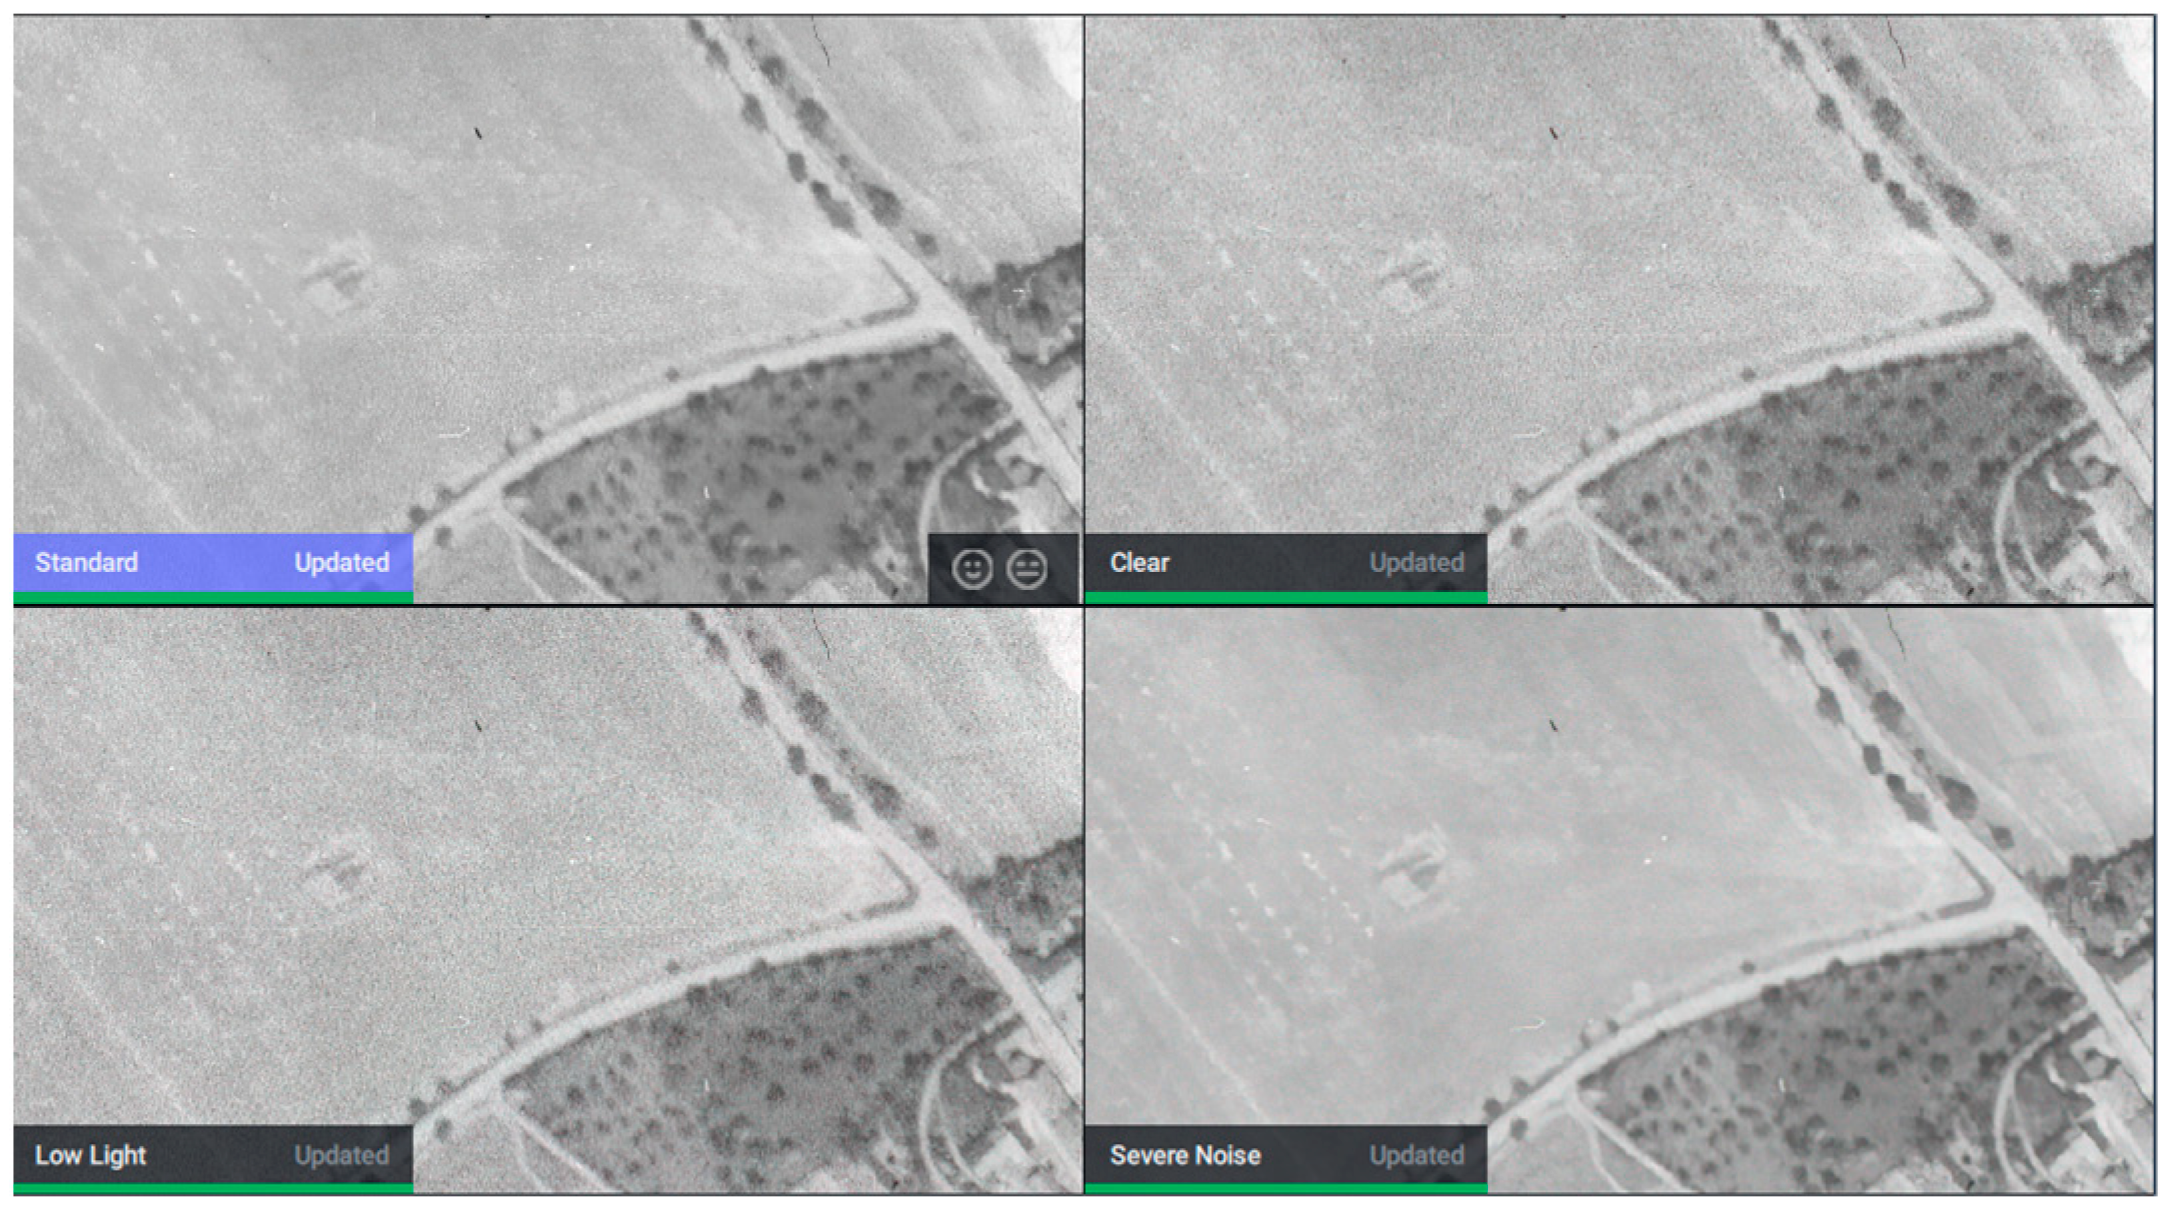
- Unified + AI (Deep Learning Denoising): The Unified images were enhanced using a deep-learning-based architecture (Topaz DeNoise AI, https://www.topazlabs.com/tools/denoise-image?srsltid=AfmBOoogBFcOzy0CYo48WGa7I58EPQXUBGNZtrJOeHb6PvQgs3ca8s9E, accessed on 14 June 2026), which leverages convolutional neural networks (CNNs) to differentiate between film grain and legitimate landscape textures. The “Standard” profile was applied (Noise Reduction: 40, Enhance Sharpness: 57) to eliminate scanning artifacts (Figure 6).
- Fusion AI (The Optimized Workflow): The final evaluated methodology. It sequentially combines geometric standardization, radiometric normalization, AI denoising, and—importantly—Geometric Fixation. By strictly constraining the focal length during the SfM import, the bundle adjustment algorithm is prevented from misinterpreting the AI-smoothed texture as a change in camera geometry. This multi-step approach leverages the visual clarity provided by AI while strictly maintaining the geometric rigidity of the camera model.
- Fusion without AI (Ablation Dataset): A composite dataset integrating geometric standardization, radiometric normalization, and strict internal orientation constraint (Focal Length = 211.09 mm). It explicitly omits the AI denoising step to isolate the impact of deep learning enhancements.
Figure 6.
Overview of noise reduction filters in Topaz DeNoise software.
Table 1.
Overview of adjusted parameters for each dataset.
3. Results
Two complementary approaches were used to assess the quality of the generated models. The first approach focused on point-based statistical analysis, comparing coordinate differences between GNSS-measured ground checkpoints and corresponding points derived from the processed imagery. The second approach involved a surface-based difference analysis, where LiDAR data served as a high-precision reference to evaluate spatial discrepancies across the validation area.
3.1. Point-Based Statistical Analysis
3.1.1. Absolute Accuracy and Descriptive Statistics
Descriptive statistics were calculated to evaluate the accuracy and distribution characteristics of each dataset on the Check Points (CPs). The results, summarized in Table 2, reveal distinct performance trends across the tested workflows:
Table 2.
Key metrics of each dataset.
Impact of Radiometric and Geometric Correction (H1): The application of basic preprocessing produced lower RMSE values. The “Unified + Brightness” dataset reduced the overall vertical RMSE (Z) from 13.77 m (Original) to 5.69 m, representing an improvement of nearly 59%. This confirms that homogenizing brightness and resolution assists the SfM algorithm in correctly matching features in shadowed or low-contrast areas.
Performance of AI Denoising (H2 and H3): The “Unified + AI” dataset exhibited the poorest vertical performance, with an overall RMSE (Z) surging to 16.48 m. This significant degradation directly supports Hypothesis 2. However, the evaluated “Fusion AI” workflow (combining AI enhancement with strict focal length fixation) successfully stabilized the model, achieving an overall RMSE (Z) of 6.48 m, which substantially outperforms the unconstrained AI results and is comparable to the best non-AI models. This validates Hypothesis 3.
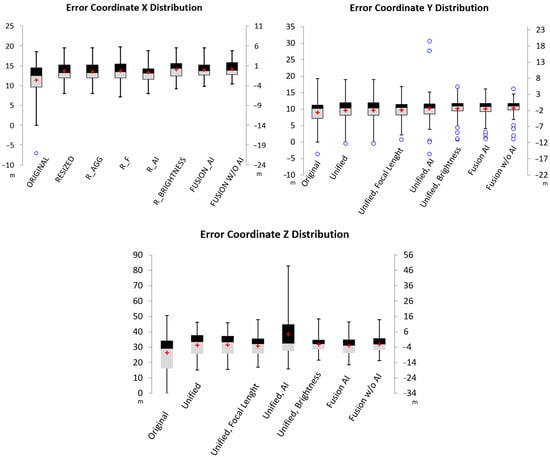
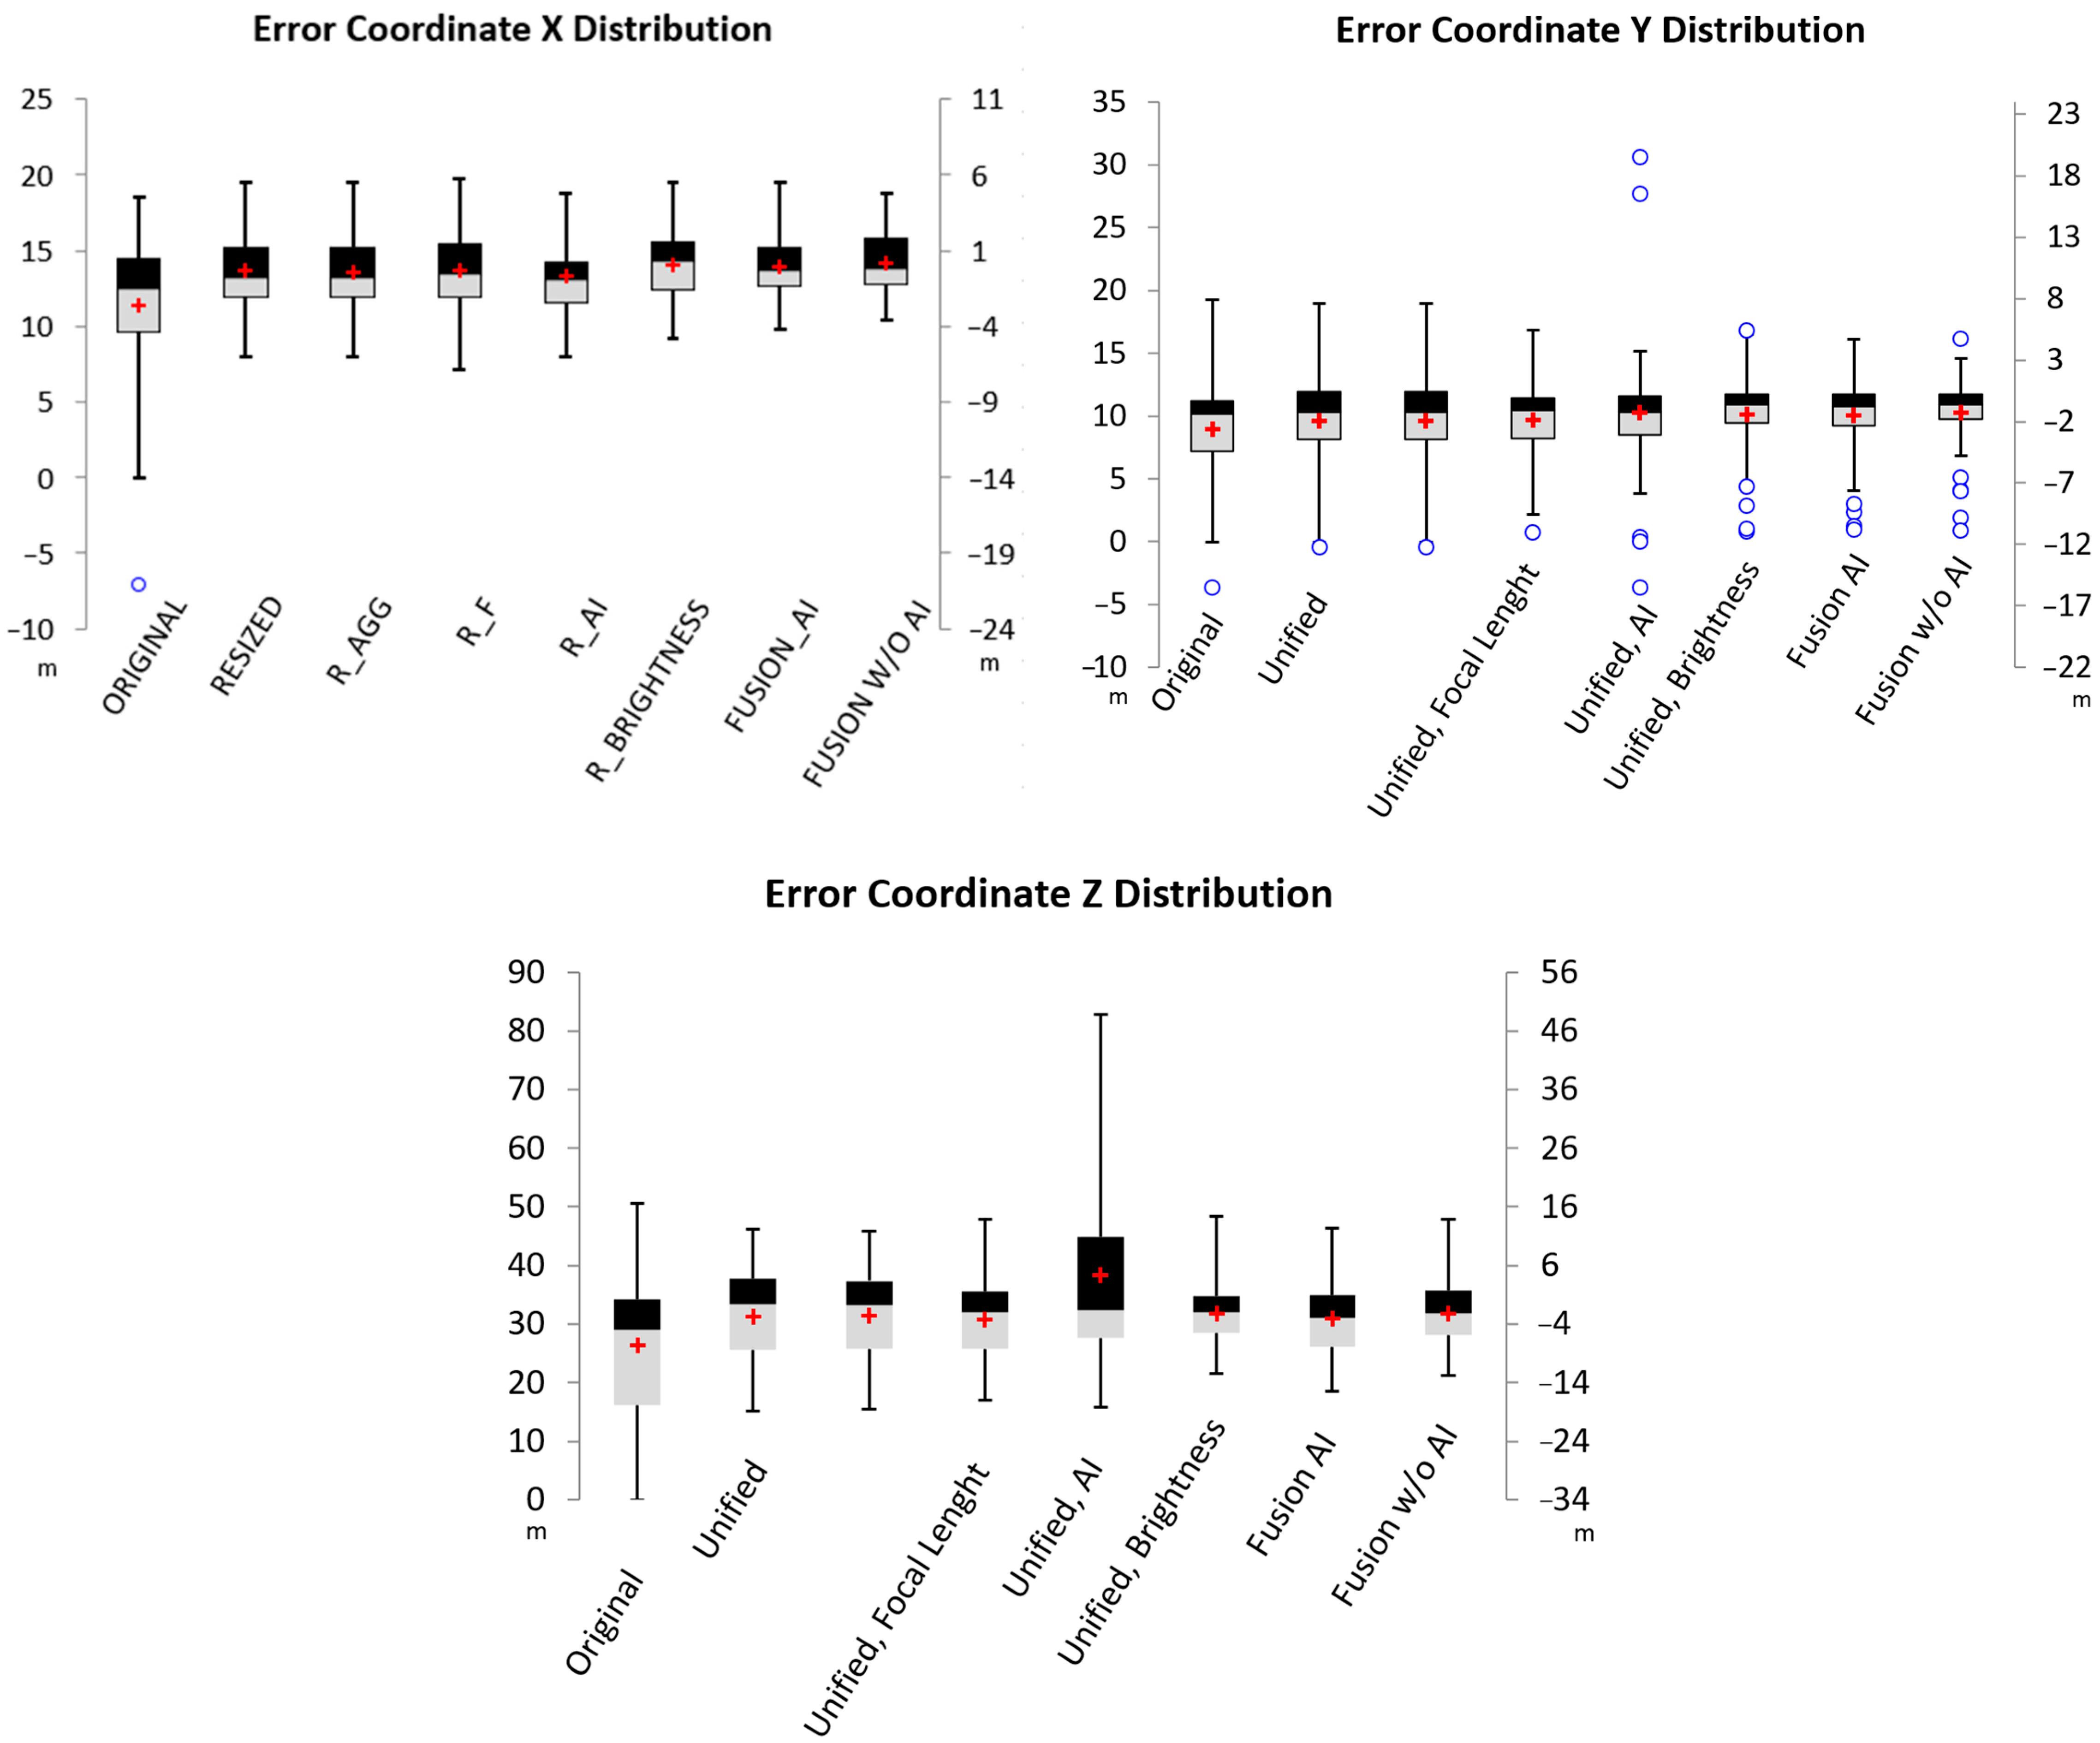
Figure 7 illustrates the distribution of vertical errors. Notably, the AI-only dataset exhibits extreme variance and outliers compared to the highly compact distribution of the “Fusion AI” workflow.
Figure 7.
Boxplots of X, Y, Z coordinates. The red crosses represent the mean values, and the blue open circles indicate outliers.
3.1.2. Spatial Distribution of Error (Central Block vs. Peripheral Area)
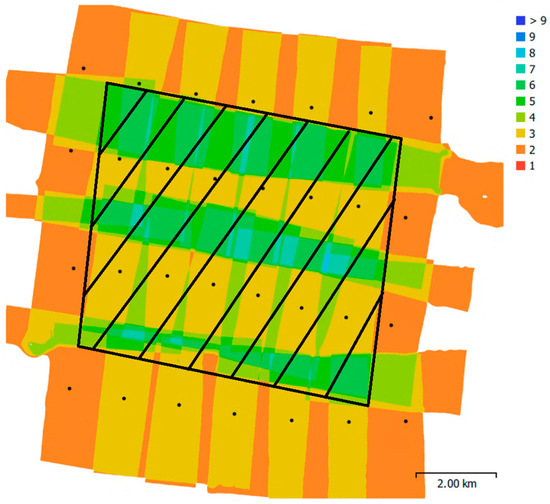
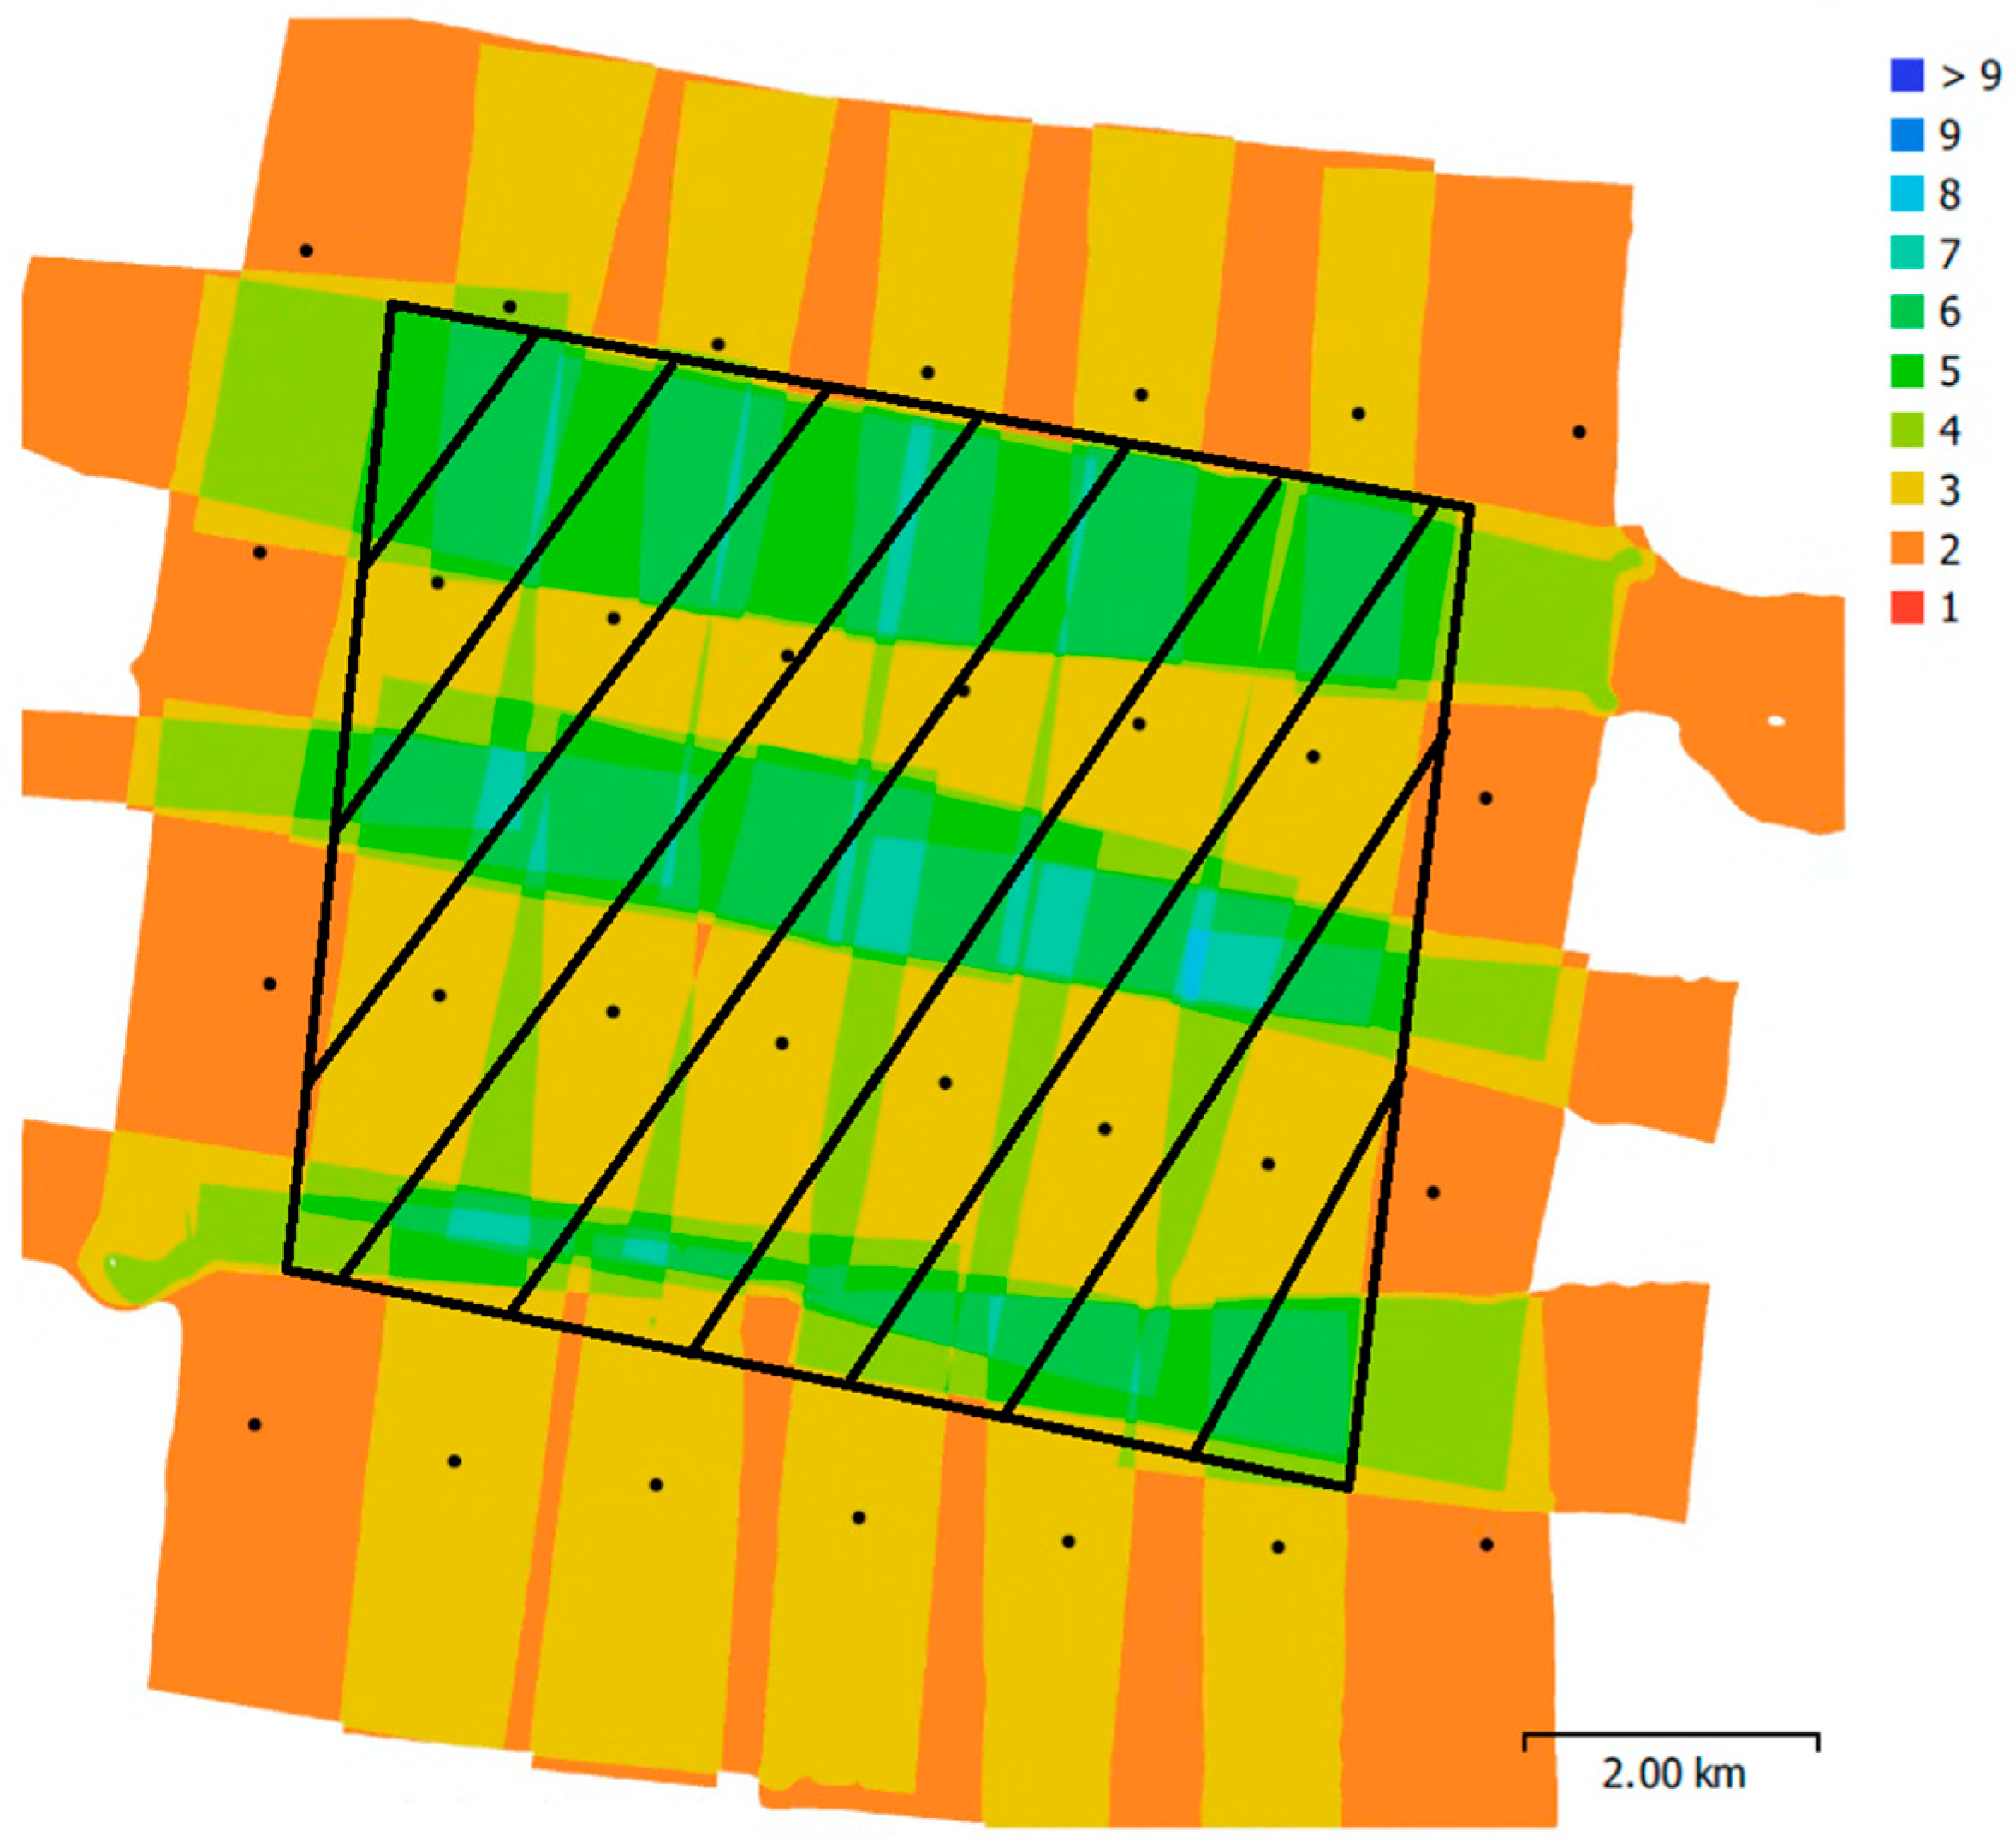
To further investigate the influence of geometric redundancy, an isolated spatial evaluation was conducted by dividing the Check Points (31 CPs) into a ‘sufficient overlap’ zone (the central block) and a ‘weak edge control’ zone (peripheral area, 22 CPs), see Figure 8. The analysis revealed that the models behave differently depending on image overlap, see Table 3.
Figure 8.
Spatial distribution of image overlap and camera locations (black dots). The diagonally hatched area delineates the boundary of the central block (sufficient overlap zone) from the peripheral area.
Table 3.
Quantitative comparison of geometric accuracy (RMSE in meters) for all processing workflows, explicitly separated into the sufficient overlap zone (center) and the weak control area.
In the central zone, the geometric stability was generally better, with the evaluated “Fusion AI” workflow achieving a central vertical RMSE (Z) of 4.05 m. However, the true impact of the workflows became starkly apparent in the weak edge control zones. Here, the unconstrained AI enhancement (“Unified + AI”) experienced catastrophic geometric failure, with the vertical RMSE surging to 23.55 m. In contrast, the geometrically constrained “Fusion AI” workflow successfully mitigated this severe edge distortion, maintaining a substantially lower edge RMSE of 8.79 m. This demonstrates that enforcing strict camera priors appears to be an important factor for stabilizing AI-enhanced models in peripheral areas.
3.1.3. Error Distribution and Spatial Autocorrelation
To assess the nature of the errors, the Shapiro–Wilk test was applied (Table 4). The majority of datasets (particularly for Y and Z coordinates) yielded p-values significantly below 0.05, indicating a non-normal error distribution. This deviation from normality is consistent with the “metadata vacuum” context; without precise camera calibration, the photogrammetric block is prone to systematic deformations (e.g., doming or warping) rather than purely random Gaussian noise. The “Fusion AI” dataset maintained similar distribution characteristics to the standard “Unified” datasets, suggesting that the integration of AI did not introduce unpredictable distribution anomalies when the focal length was constrained.
Table 4.
Statistical evaluation of error distributions: normality testing (Shapiro–Wilk) and systematic bias assessment (t-test).
Statistical comparisons were performed to support the interpretation of observed differences among workflows. Given that several datasets deviated from normality according to the Shapiro–Wilk test, inferential statistics were interpreted cautiously and used primarily as complementary evidence rather than as the sole basis for methodological conclusions. The primary evaluation criteria remained effect magnitude (RMSE), spatial error structure, and consistency across independent validation metrics. Given the sample size of n = 53 (df = 52), p-values were calculated to evaluate the robustness of the accuracy improvements.
Global Moran’s I analysis revealed a statistically significant clustered spatial pattern across all datasets (Index > 0.7 for Z coordinates, p < 0.01)(Table 5). This positive spatial autocorrelation suggests the presence of spatially structured reconstruction error, consistent with block deformation under weak geometric conditions. While the “Unified + AI” dataset showed the highest clustering intensity (Index = 0.963), the “Fusion AI” workflow (Index = 0.774) aligned with the baseline methods. This suggests that Fusion does not substantially increase spatial error clustering.
Table 5.
Global Moran’s indices of model errors.
3.1.4. Correlation with Terrain Elevation
Spearman’s rank correlation was computed to assess whether vertical errors were dependent on terrain elevation (Table 6):
Table 6.
Elevation independence.
Robustness of Standard Methods: Most datasets showed weak or negligible correlation (values < 0.25), indicating that accuracy remained relatively stable across both valley floors and hilltops.
AI Artifacts on Terrain Features: A significant exception was the “Unified + AI” dataset, which exhibited a strong negative correlation between vertical error and terrain elevation (−0.667, p < 0.01). This indicates a systematic trend where higher altitudes were underestimated, while depressions were overestimated (over-smoothing). In contrast, the “Fusion” workflow mitigated this dependency (correlation = 0.212), demonstrating a consistent error distribution across the entire elevation gradient.
3.2. Visual Quality of Orthomosaics
Beyond 3D geometric accuracy, preprocessing showed improved reconstruction of the 2D outputs. The orthomosaic generated from the brightness-adjusted dataset provided a more coherent and visually consistent representation of the terrain, with fewer distortions compared to the alternative datasets. As shown in Figure 9 and Figure 10, brightness adjustment enhances overall interpretability, whereas unconstrained datasets exhibited visible artifacts.
Figure 9.
Close-up view of the area shown in Figure 5—Original dataset (A), brightness-adjusted dataset (B).
Figure 10.
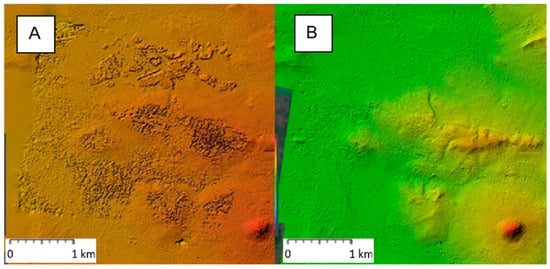
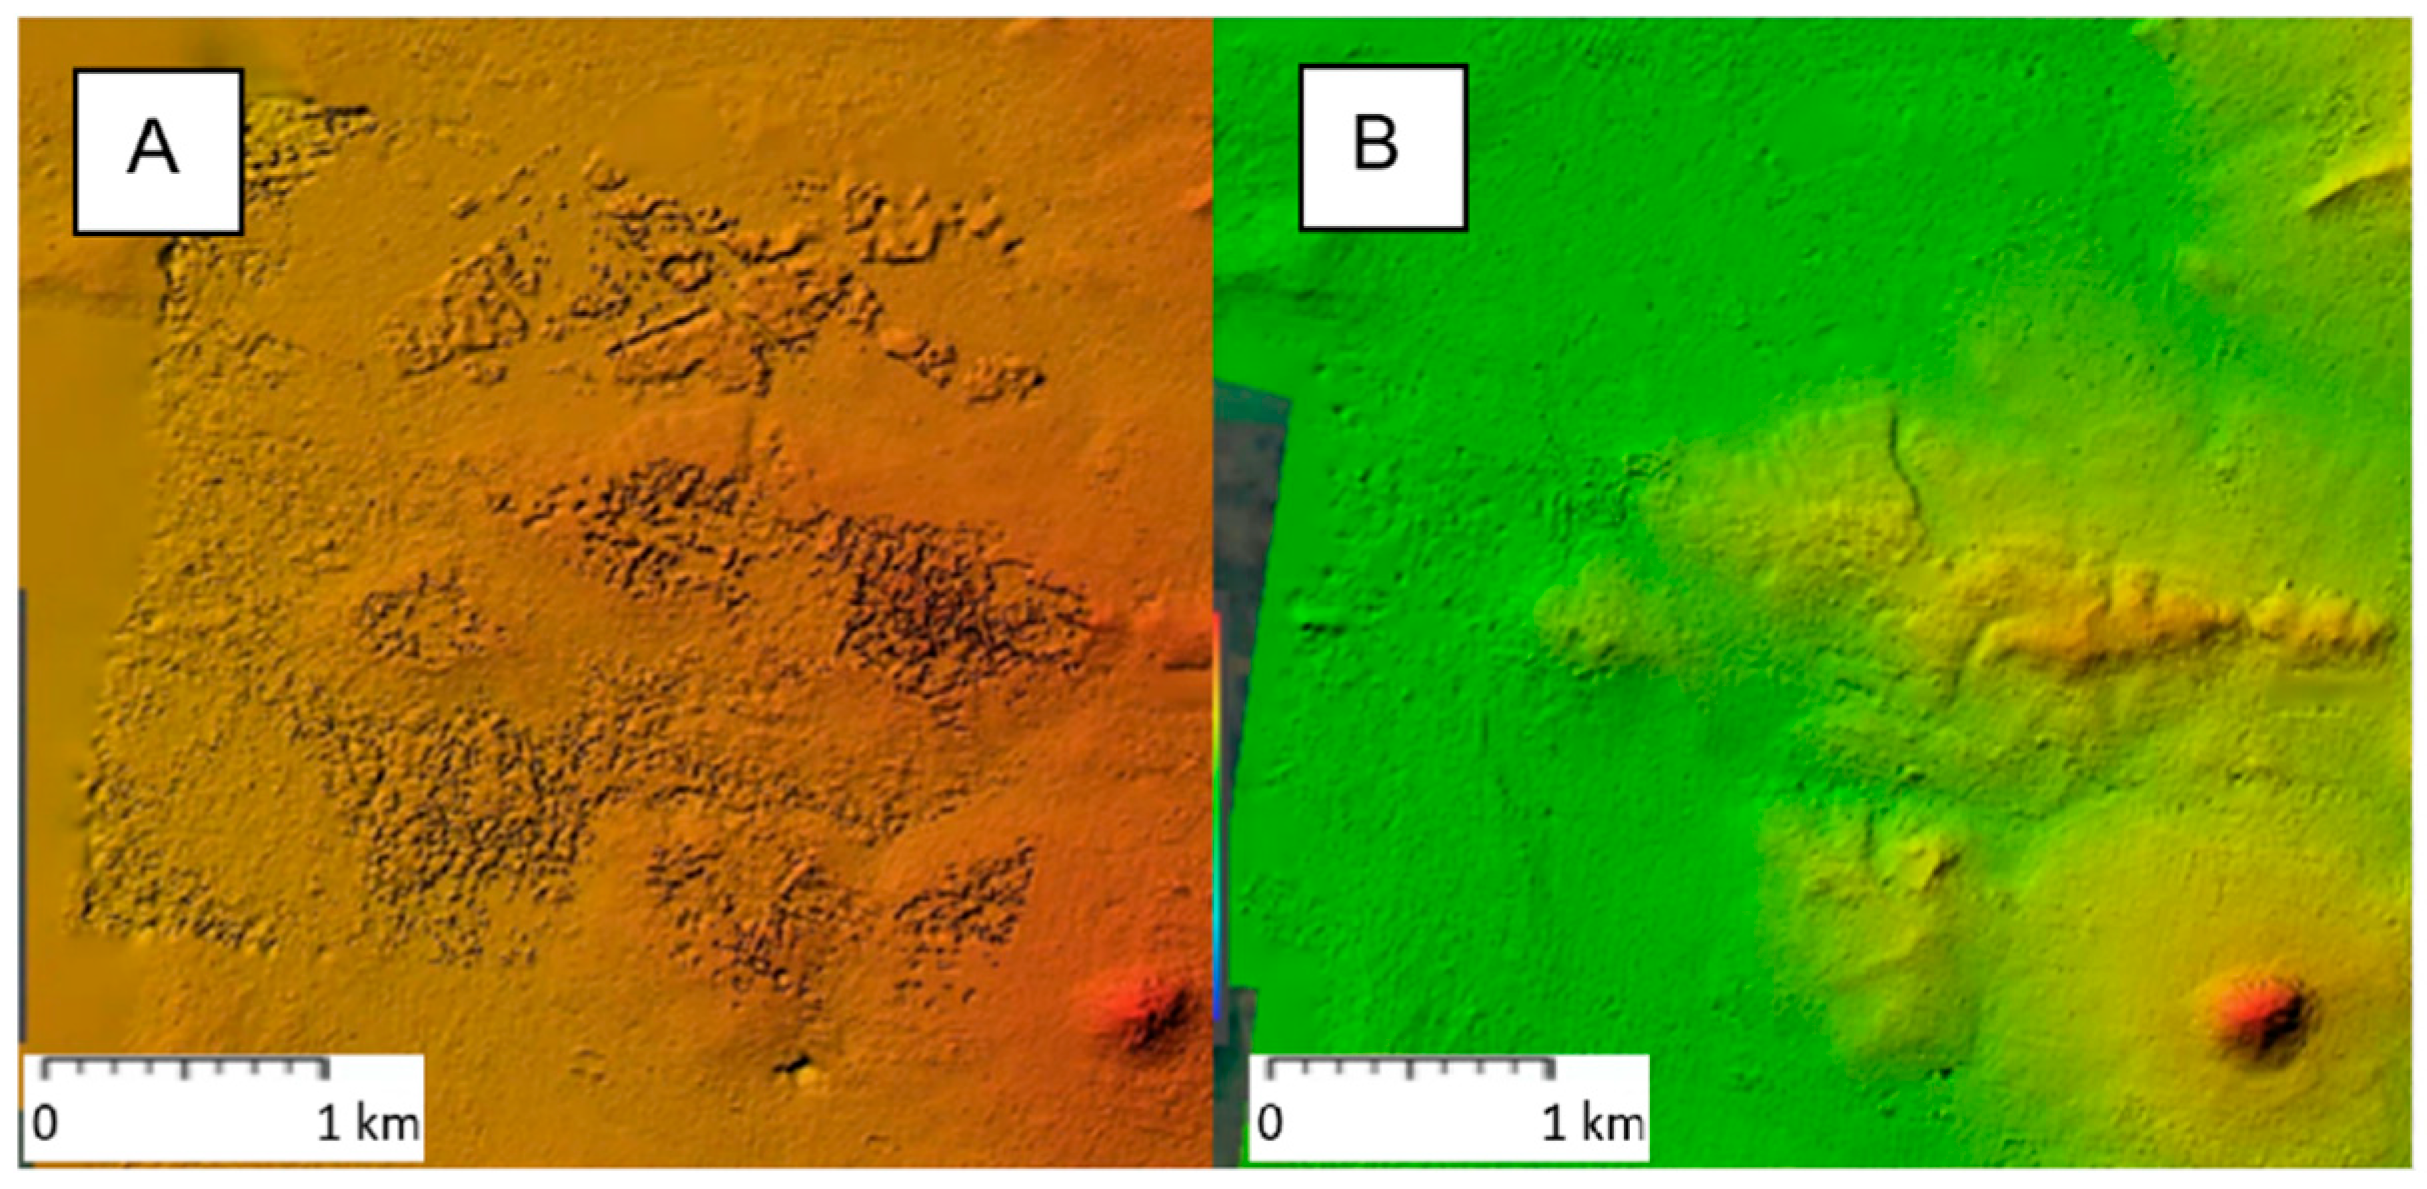
Difference between the quality of DSMs—Original dataset (A) and with brightness adjustment (B).
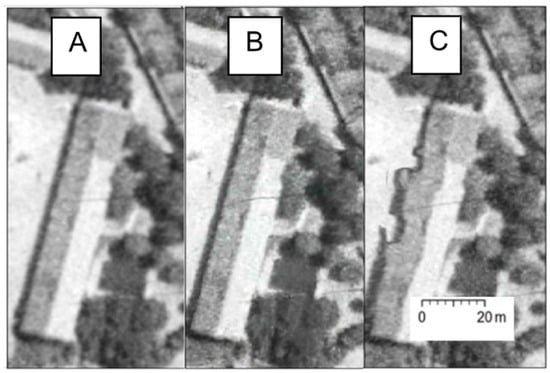
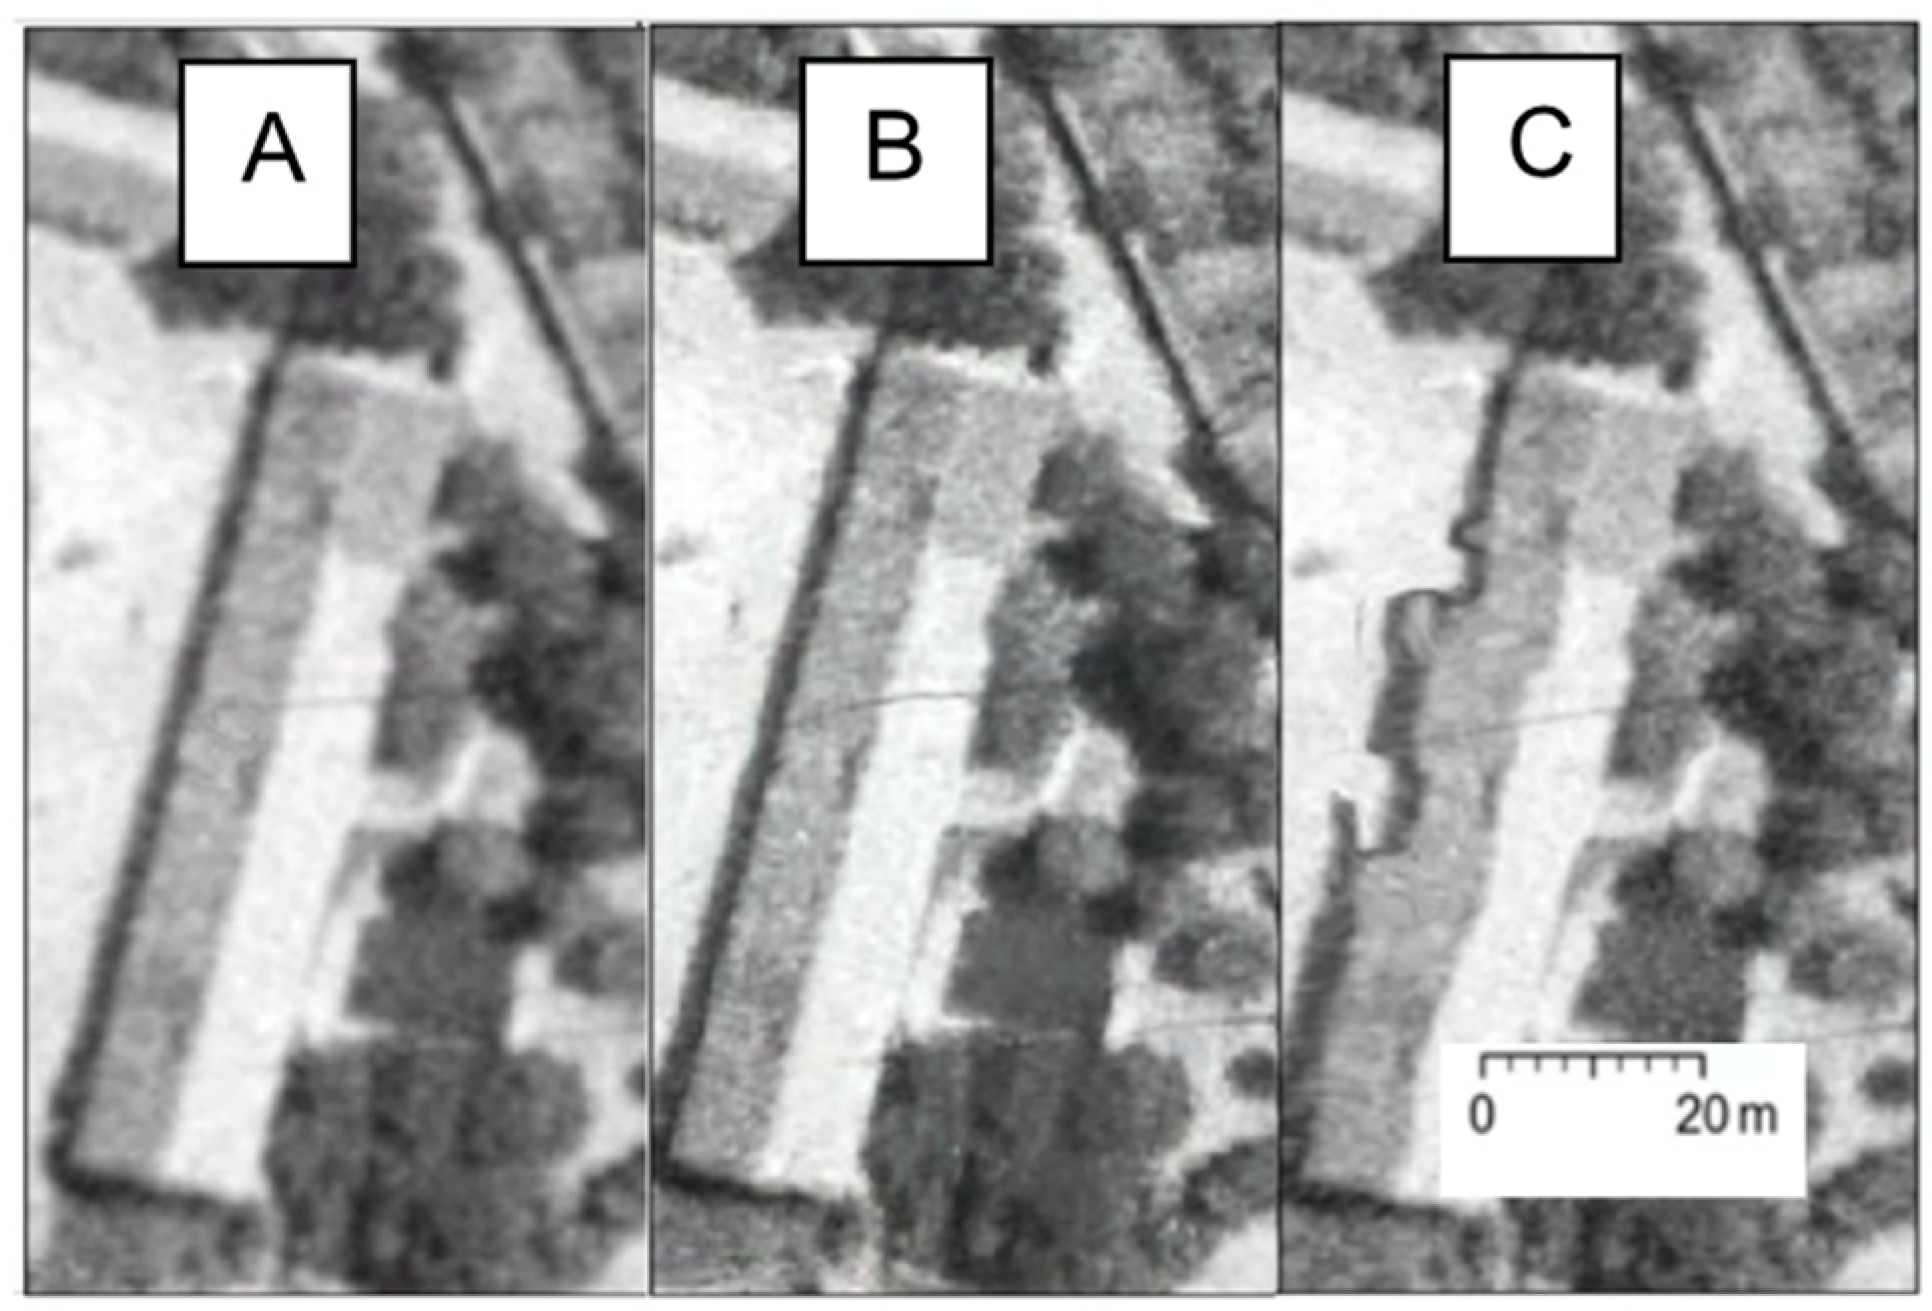
Visual Confirmation: The “Original” dataset displays large, systematic deformations characteristic of unstable block geometry. In contrast, the “Unified + Focal Length” dataset and the “Fusion with AI” dataset exhibit reduced deviations, confined mostly to localized vegetation patches. Conversely, the “Unified + AI” dataset aligns with the limited-control scenario, showcasing extreme surface warping (Figure 11).
Figure 11.
Deformation of the same building modeled from different datasets—Unified dataset (A), Unified+AI dataset (B), Original dataset (C).
3.3. Surface-Based Difference Analysis
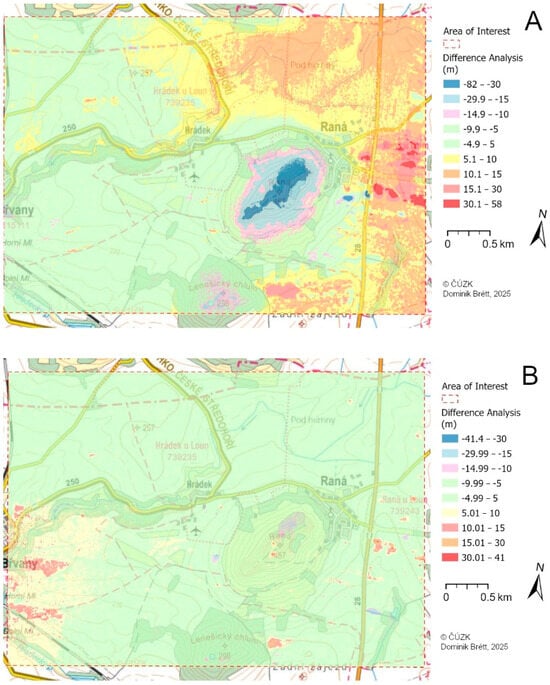
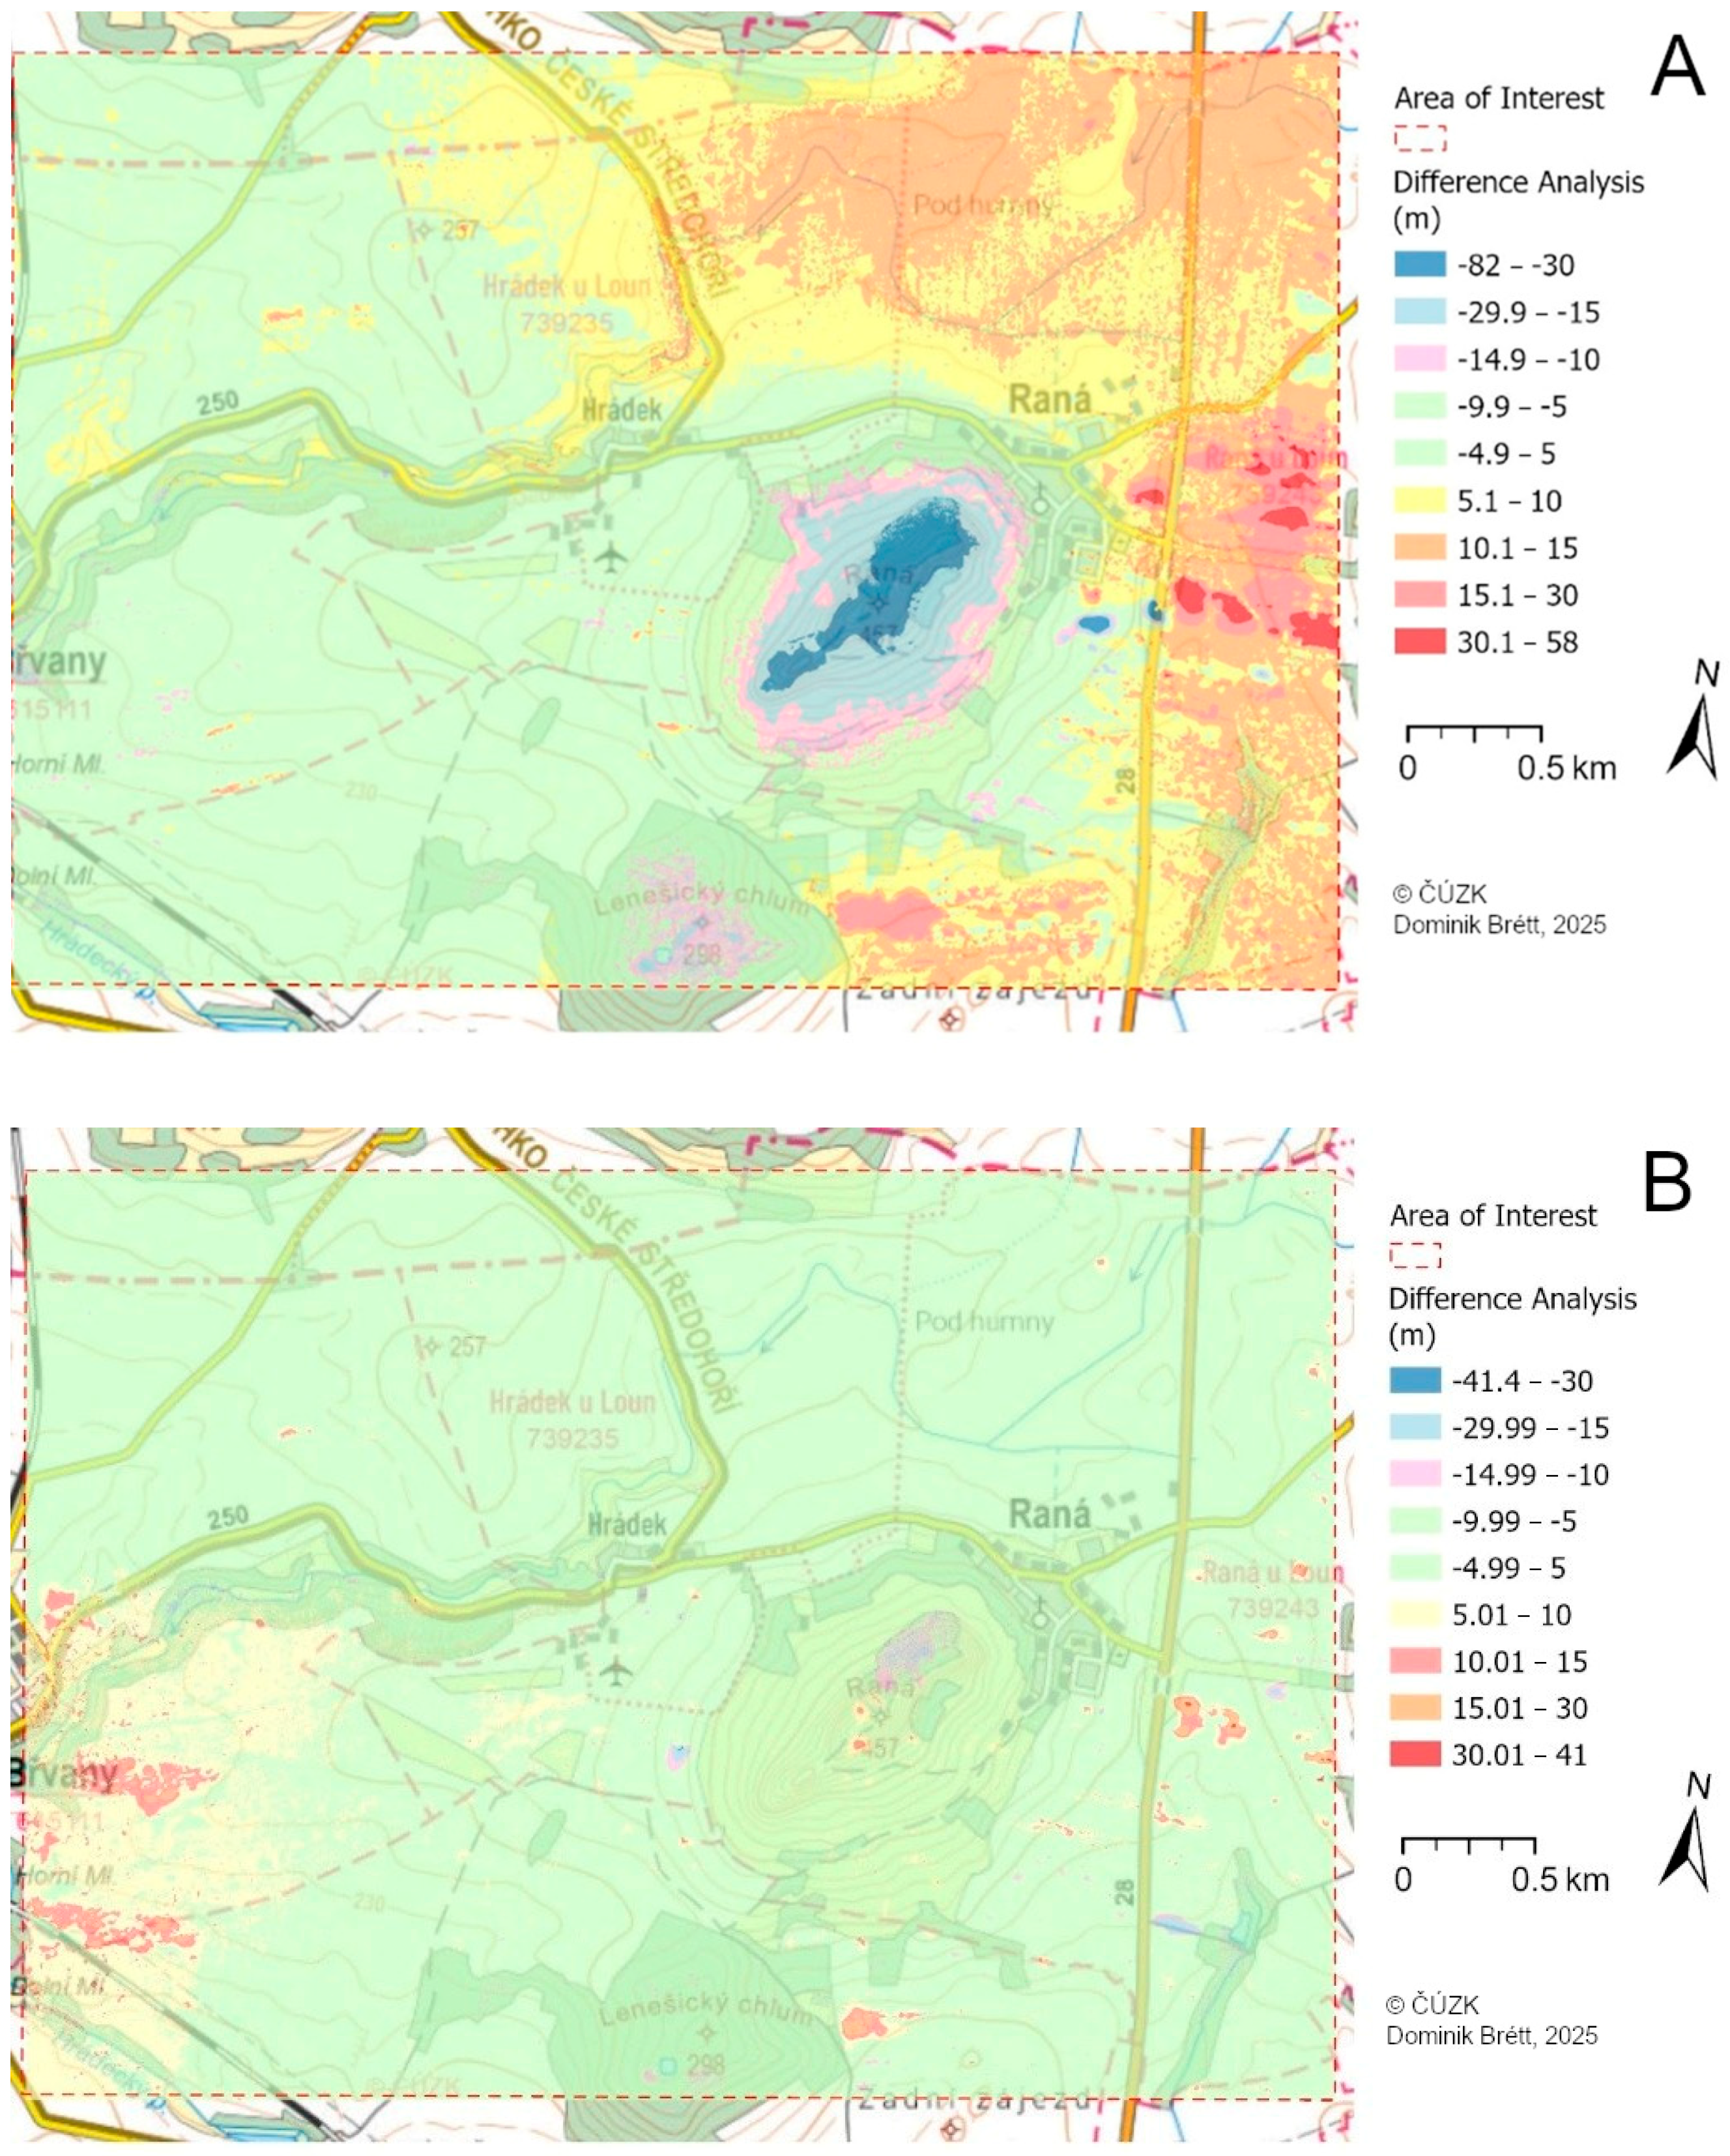
Difference analyses were performed by subtracting the generated DSMs from the reference LiDAR DSM to visualize and quantify continuous spatial error patterns across the complex terrain (Figure 12).
Figure 12.
Difference between the quality of the Original dataset (A) and with brightness adjustment (B).
Table 7 quantifies the performance of all tested methods across the continuous raster. The lowest standard deviation (Std. Dev. = 3.46 m) is observed for the “Unified + Focal Length” method, indicating superior consistency compared to the “Original” dataset (Std. Dev. = 9.02 m). The “Unified + AI” method exhibits the highest variability (Std. Dev. = 15.42 m), reinforcing the GNSS findings. The comparable performance of the Fusion AI workflow suggests that AI-based restoration can be incorporated without severe geometric penalties when combined with geometric constraints. While no clear geometric improvement over conventional preprocessing was observed, the workflow preserved acceptable reconstruction stability while maintaining the visual advantages of image enhancement.
Table 7.
Overview of Standard Deviations for each dataset.
4. Discussion
This study presents a structured evaluation of preprocessing techniques applied to archival aerial imagery, with a focus on improving the accuracy of derived geospatial products. Two complementary methods were employed to assess model quality: (1) point-based analysis using GNSS-derived checkpoints (CPs), and (2) area-based difference analysis using high-resolution LiDAR data as a reference. The LiDAR dataset was processed systematically (see above), ensuring consistency across the analyses. Furthermore, any actual terrain changes that may have occurred between the acquisition dates of the datasets and the LiDAR survey are constant for all datasets; thus, they do not distort the relative comparison of model variants. This dual approach enables both local precision evaluation and an assessment of broader spatial consistency across varied terrain.
All datasets were processed and evaluated using an identical georeferencing workflow, ensuring consistency and comparability. A fixed set of six ground control points (GCPs) was used to anchor the models, while 53 CPs were utilized for independent validation. Although the number of ground control points used in this study is limited (n = 6), this constraint reflects real-world conditions encountered in historical terrain reconstruction rather than a methodological simplification. In areas affected by large-scale land reshaping, the majority of historically visible reference features no longer exist. The use of a small but carefully selected GCP set, therefore, represents a pragmatic compromise between geometric stability and data availability. The emphasis of this study is placed on relative accuracy assessment and comparative evaluation of preprocessing workflows, not on achieving maximum absolute positional accuracy. This distinction is critical, as the primary objective is to determine which preprocessing strategies most effectively preserve terrain morphology under constrained georeferencing conditions. We acknowledge that model behavior may depend on GCP spatial configuration. The present study uses one carefully selected control configuration representative of realistic persistent-feature availability. Sensitivity analysis across alternative GCP distributions remains an important direction for future work.
Each of the seven datasets consisted of 30 scanned images from the same flight mission. These images were captured with consistent camera specifications and spatial coverage. Although a forward overlap of 60% and a side overlap of 30% is generally recommended, actual overlap levels within the dataset varied considerably. In particular, the final image row exhibited markedly lower coverage, which could compromise the reliability of 3D reconstruction in those areas. This limitation underscores the importance of applying comprehensive preprocessing techniques—such as resolution unification, brightness correction, and the inclusion of internal orientation parameters—to compensate for insufficient geometric redundancy and ensure consistent model quality across the entire image chunk. Similar challenges related to inconsistent overlap and physical degradation have been reported by Whiteside et al. [25] and Lu et al. [17], who emphasize the need for robust preprocessing to mitigate these effects. An evaluation of the image footprint density revealed that actual overlap levels within the datasets varied considerably. While the central portion of the block ensures sufficient stereoscopic coverage, reduced overlap in the terminal image rows necessitates the application of compensatory preprocessing steps to ensure uniform model accuracy.
A key limitation is the absence of original exterior orientation (EO) data—such as image positions or flight log orientations—which were neither available nor imported into the project. As a result, initial camera locations were estimated solely by image alignment using the Structure-from-Motion (SfM) process. This omission may have introduced minor geometric distortions into the reconstructions. However, since all datasets were aligned and evaluated under the same conditions, these small inaccuracies do not affect the internal validity of the comparative analysis.
To facilitate a clear overview of the preprocessing strategies tested, Table 1 summarizes the presence or absence of specific modifications for each dataset. The evaluation results confirm that basic preprocessing steps such as resolution unification and brightness correction can lead to meaningful improvements in model accuracy, both statistically and visually. These modifications enhance consistency across the image set, reduce local distortion, and improve the alignment process. More broadly, these results indicate that in archival aerial photogrammetry, radiometric normalization of scanned imagery often plays a more critical role for model stability than advanced image enhancement methods, particularly in situations where camera calibration data and dense ground control networks are unavailable.
Conversely, AI-based denoising alone—while visually appealing—tended to smooth important terrain features, resulting in degraded vertical accuracy. This observation aligns with recent work by Lu et al. [17], who caution that aggressive noise reduction may compromise the preservation of fine topographic details. However, its integration within a broader preprocessing workflow (“Fusion AI” dataset) showed substantial recovery of geometric performance, confirming that such enhancements should be applied judiciously and in combination with other corrective measures.
Beyond texture enhancement and noise reduction, artificial intelligence offers further potential in the radiometric restoration of historical imagery through automated colorization. Recent research has explored the adaptation of deep learning architectures, such as the Hyper-U-Net [28], specifically for the Czech landscape [29]. While such methods substantially enhance the visual interpretability of vanished landscapes for historical geography and public presentations, their integration into rigorous photogrammetric workflows remains challenging. As demonstrated in our results, even subtle AI-induced radiometric hallucinations can lead to severe geometric distortions (flattening of relief). Therefore, while AI colorization represents a promising future direction for visual heritage documentation, strict geometric constraints—as evaluated in our Fusion AI workflow—must remain a priority for scientific terrain reconstruction.
Lastly, this study illustrates the importance of transparent and replicable preprocessing workflows when working with scanned historical aerial imagery. While certain limitations persist—such as missing camera calibration or flight metadata—the consistent methodology and rigorous comparative evaluation employed here provide robust insights into the influence of individual preprocessing steps on final model quality. The results contribute to the growing body of literature advocating for standardized, reproducible approaches in historical photogrammetry [14,16], and offer a practical workflow for similar projects in heritage and environmental research.
5. Conclusions
This study evaluated the influence of multiple preprocessing strategies on the quality of Digital Surface Models (DSMs) and orthomosaics generated from scanned archival aerial imagery under conditions of incomplete metadata and limited ground control availability.
The results demonstrate that conventional radiometric preprocessing methods, particularly image unification and brightness correction, provide substantial improvements in reconstruction quality and remain highly effective under historical low-control conditions. This supports Hypothesis 1 and confirms that relatively simple preprocessing operations can improve reconstruction reliability.
The experiments further revealed that AI-based denoising applied without geometric constraints may substantially degrade vertical reconstruction accuracy despite improving visual appearance. This observation supports Hypothesis 2 and highlights the sensitivity of Structure-from-Motion reconstruction to modifications of fine image texture.
At the same time, the results indicate that introducing geometric constraints—particularly focal length fixation—can substantially reduce the negative effects associated with AI preprocessing. The Fusion AI workflow maintained acceptable geometric stability (RMSE Z = 6.48 m) while preserving the visual benefits of image enhancement. However, no consistent geometric improvement over the strongest conventional preprocessing workflow was observed. Therefore, Hypothesis 3 is considered partially supported.
Overall, the findings suggest that the primary determinant of reconstruction quality in historical aerial photogrammetry remains geometric consistency rather than aggressive image enhancement. AI-based restoration should therefore be treated as a complementary rather than dominant preprocessing component when working with archival imagery.
Supplementary Materials
The following supporting information can be downloaded at: https://www.mdpi.com/article/10.3390/app16126237/s1. Table S1: Processing parameters and software configurations used in the evaluated workflows.
Author Contributions
Conceptualization, D.B.; methodology, D.B., J.P.; software, D.B.; validation, D.B.; formal analysis, D.B.; investigation, D.B.; resources, J.P.; data curation, D.B.; writing—original draft preparation, D.B.; writing—review and editing, D.B., J.V. and J.P.; visualization, D.B.; supervision, J.P. All authors have read and agreed to the published version of the manuscript.
Funding
This research was funded by the Ministry of Culture of the Czech Republic under the NAKI program, grant number DH23P03OVV055 (project “Vltava 2—transformation of historical landscape, river as a connection and barrier”).
Institutional Review Board Statement
Not applicable.
Informed Consent Statement
Not applicable.
Data Availability Statement
The historical aerial imagery used in this study was provided by the Military Geographic and Hydrometeorological Office (VGHMÚř) under specific licensing agreements. The modern reference LiDAR data were acquired by the authors’ team, and the geodetic reference data were provided by the Czech Office for Surveying, Mapping and Cadastre (ČÚZK). Due to licensing restrictions and privacy/usage policies of the data providers, these datasets are not publicly accessible. However, they are available from the corresponding author upon reasonable request, subject to approval by the respective data providers.
Acknowledgments
The authors would like to acknowledge the Military Geographic and Hydrometeorological Office (VGHMÚř) for providing the historical aerial imagery. The modern reference LiDAR data were acquired by the authors’ team. We also thank the Czech Office for Surveying, Mapping and Cadastre (ČÚZK) for providing the spatial reference data and map services.
Conflicts of Interest
The authors declare no conflicts of interest. The funders had no role in the design of the study; in the collection, analyses, or interpretation of data; in the writing of the manuscript; or in the decision to publish the results.
References
- Housarová, E.; Pavelka, K.; Šedina, J. Study of Erbil Al-Qala Citadel Time Changes by Comparison of Historical and Contemporary Image Data. Eur. J. Remote Sens. 2019, 52, 202–208. [Google Scholar] [CrossRef] [Scilit]
- Dlesk, A.; Vach, K.; Pavelka, K. Structure from motion processing of analogue images captured by rollei metric camera, digitized with various scanning resolution. Acta Polytech. 2020, 60, 288–302. [Google Scholar] [CrossRef] [Scilit]
- Dlesk, A.; Uueni, A.; Vach, K.; Pärtna, J. From Analogue to Digital Photogrammetry: Documentation of Padise Abbey in Two Different Time Stages. Appl. Sci. 2020, 10, 8330. [Google Scholar] [CrossRef] [Scilit]
- Kostrzewa, A.; Farella, E.M.; Morelli, L.; Ostrowski, W.; Remondino, F.; Bakuła, K. Digitizing Historical Aerial Images: Evaluation of the Effects of Scanning Quality on Aerial Triangulation and Dense Image Matching. Appl. Sci. 2024, 14, 3635. [Google Scholar] [CrossRef] [Scilit]
- Aguilar, M.A.; Aguilar, F.J.; Fernández, I.; Mills, J.P. Accuracy Assessment of Commercial Self-Calibrating Bundle Adjustment Routines Applied to Archival Aerial Photography. Photogramm. Rec. 2013, 28, 96–114. [Google Scholar] [CrossRef] [Scilit]
- Hughes, M.L.; McDowell, P.F.; Marcus, W.A. Accuracy Assessment of Georectified Aerial Photographs: Implications for Measuring Lateral Channel Movement in a GIS. Geomorphology 2006, 74, 1–16. [Google Scholar] [CrossRef] [Scilit]
- Feurer, D.; Vinatier, F. Joining Multi-Epoch Archival Aerial Images in a Single SfM Block Allows 3-D Change Detection with Almost Exclusively Image Information. ISPRS J. Photogramm. Remote Sens. 2018, 146, 495–506. [Google Scholar] [CrossRef] [Scilit]
- Zhang, L.; Rupnik, E.; Pierrot-Deseilligny, M. Feature Matching for Multi-Epoch Historical Aerial Images. ISPRS J. Photogramm. Remote Sens. 2021, 182, 176–189. [Google Scholar] [CrossRef] [Scilit]
- Pavelka, K.; Matoušková, E.; Pavelka, K., Jr.; Pacina, J. Spatial 3D documentation of historical mining remnants in forested area in the erzgebirge/krušnohoří mining region unesco site. Int. Arch. Photogramm. Remote Sens. Spat. Inf. Sci. 2021, XLVI-M-1–2021, 523–529. [Google Scholar] [CrossRef] [Scilit]
- Brůna, V.; Pacina, J.; Pacina, J.; Vajsová, E. Modelling the Extinct Landscape and Settlement for Preservation of Cultural Heritage. Città e Stor. 2014, 9, 131. [Google Scholar]
- Elznicova, J. Reconstruction of historical landscape from aerial photographs for river development assessment. In Proceedings of the 14th International Multidisciplinary Scientific GeoConference SGEM 2014, Albena, Bulgaria, 17–26 June 2014. [Google Scholar]
- Pacina, J.; Cajthaml, J.; Vynikal, J.; Brétt, D.; Krejčí, J.; Tobiáš, P.; Cehák, V.; Kratochvílová, D. Comprehensive Reconstruction of the Pre-Dam Landscape in the Vltava River Valley Using Advanced Geoinformatics Methods. In Proceedings of the 9th International Conference on Cartography and GIS, Nessebar, Bulgaria, 16–21 June 2024. [Google Scholar]
- Mboga, N.; Grippa, T.; Georganos, S.; Vanhuysse, S.; Smets, B.; Dewitte, O.; Wolff, E.; Lennert, M. Fully Convolutional Networks for Land Cover Classification from Historical Panchromatic Aerial Photographs. ISPRS J. Photogramm. Remote Sens. 2020, 167, 385–395. [Google Scholar] [CrossRef] [Scilit]
- Malekian, A.; Fugazza, D.; Scaioni, M. 3D Surface Reconstruction and Change Detection of Miage Glacier (Italy) from Multi-Date Archive Aerial Photos. In Computational Science and Its Applications—ICCSA 2022 Workshops; Gervasi, O., Murgante, B., Misra, S., Rocha, A.M.A.C., Garau, C., Eds.; Lecture Notes in Computer Science; Springer International Publishing: Cham, Switzerland, 2022; Volume 13379, pp. 450–465. [Google Scholar]
- Knuth, F.; Shean, D.; Bhushan, S.; Schwat, E.; Alexandrov, O.; McNeil, C.; Dehecq, A.; Florentine, C.; O’Neel, S. Historical Structure from Motion (HSfM): Automated Processing of Historical Aerial Photographs for Long-Term Topographic Change Analysis. Remote Sens. Environ. 2023, 285, 113379. [Google Scholar] [CrossRef] [Scilit]
- Sevara, C.; Verhoeven, G.; Doneus, M.; Draganits, E. Surfaces from the Visual Past: Recovering High-Resolution Terrain Data from Historic Aerial Imagery for Multitemporal Landscape Analysis. J. Archaeol. Method Theory 2018, 25, 611–642. [Google Scholar] [CrossRef] [Scilit] [PubMed]
- Lu, L.; Zhou, Y.; Walker, R.T. Using Historical Aerial Photographs to Measure Earthquake Deformation: Testing the Effects of Scan Resolution. Remote Sens. Environ. 2021, 252, 112118. [Google Scholar] [CrossRef] [Scilit]
- Wu, B. Photogrammetry for 3D Mapping in Urban Areas. In Urban Informatics; Shi, W., Goodchild, M.F., Batty, M., Kwan, M.-P., Zhang, A., Eds.; The Urban Book Series; Springer: Singapore, 2021; pp. 401–413. [Google Scholar]
- Spiekermann, R.; Betts, H.; Dymond, J.; Basher, L. Volumetric Measurement of River Bank Erosion from Sequential Historical Aerial Photography. Geomorphology 2017, 296, 193–208. [Google Scholar] [CrossRef] [Scilit]
- Walstra, J. Historical Aerial Photographs and Digital Photogrammetry for Landslide Assessment. Ph.D. Thesis, Loughborough University, Loughborough, UK, 2006. [Google Scholar]
- Šafář, V.; Tlapáková, L. Alternative Methods of the Processing of Archival Aerial Photos [Alternativní postupy zpracování archivních leteckých snímků]. Geod. Kartogr. Obz. 2016, 62, 253–257. [Google Scholar]
- Pacina, J.; Novák, K.; Popelka, J. Georelief Transfiguration in Areas Affected by Open-cast Mining. Trans. GIS 2012, 16, 663–679. [Google Scholar] [CrossRef] [Scilit]
- Krejčí, J.; Cajthaml, J. Historical Vltava River Valley–Various Historical Sources within Web Mapping Environment. ISPRS Int. J. Geo-Inf. 2022, 11, 35. [Google Scholar] [CrossRef] [Scilit]
- Dymond, J. Steepland Erosion Measurements from Historical Aerial Photographs. J. Soil Water Conserv. 1986, 41, 252–255. [Google Scholar] [CrossRef] [Scilit]
- Whiteside, T.G.; Esparon, A.J.; Bartolo, R.E. A Semi-Automated Approach for Quantitative Mapping of Woody Cover from Historical Time Series Aerial Photography and Satellite Imagery. Ecol. Inform. 2020, 55, 101012. [Google Scholar] [CrossRef] [Scilit]
- Agisoft LLC. Agisoft Metashape User Manual: Professional Edition, Version 2.2; Agisoft LLC: St. Petersburg, Russia, 2025.
- Pernet, C.R.; Wilcox, R.; Rousselet, G.A. Robust Correlation Analyses: False Positive and Power Validation Using a New Open Source Matlab Toolbox. Front. Psychol. 2013, 3, 606. [Google Scholar] [CrossRef] [Scilit] [PubMed]
- Farella, E.M.; Malek, S.; Remondino, F. Colorizing the Past: Deep Learning for the Automatic Colorization of Historical Aerial Images. J. Imaging 2022, 8, 269. [Google Scholar] [CrossRef] [Scilit] [PubMed]
- Klimeš, M. Creation of an Application for Coloring a Historical Panchromatic Orthophoto. Bachelor’s Thesis, Czech Technical University in Prague, Prague, Czech Republic, 2024. [Google Scholar]



Disclaimer/Publisher’s Note: The statements, opinions and data contained in all publications are solely those of the individual author(s) and contributor(s) and not of MDPI and/or the editor(s). MDPI and/or the editor(s) disclaim responsibility for any injury to people or property resulting from any ideas, methods, instructions or products referred to in the content. |
© 2026 by the authors. Licensee MDPI, Basel, Switzerland. This article is an open access article distributed under the terms and conditions of the Creative Commons Attribution (CC BY) license.