


Abstract
Accurate bus passenger flow prediction is a critical prerequisite for optimizing resource allocation in intelligent bus systems and improving public transport service quality. However, due to dynamic fluctuations in passenger travel demand and the complex topological structure of bus networks, effectively capturing the inherent spatiotemporal dependencies of passenger flow remains a significant challenge. To address this issue, this paper proposes GAT-Informer, a hybrid deep learning model for short-term bus passenger flow prediction. Unlike conventional methods that mainly rely on fixed physical adjacency or single-view spatial correlations, the proposed model incorporates domain knowledge into graph construction through a four-dimensional associated-node mechanism. Specifically, four types of features, namely line connectivity, spatial proximity, OD correlation, and station functional similarity, are used to identify relevant associated nodes and construct a passenger flow interaction spatiotemporal graph that better reflects inter-station dependencies. Based on this graph, a Graph Attention Network (GAT) is introduced to adaptively learn spatial interaction features and differentiated influence weights among associated stations. The spatially enhanced features extracted by GAT are then fed into the Informer network, where probabilistic sparse self-attention and hierarchical timestamp encoding are employed to efficiently capture long-term temporal dependencies and periodic fluctuation patterns of passenger flow. Experimental results based on bus passenger flow data from Foshan City show that the proposed GAT-Informer model significantly outperforms benchmark models, including LSTM-Transformer, CNN-GRU, and STGCN, across different prediction horizons, validating its effectiveness and improved predictive performance in bus passenger flow prediction.
1. Introduction
With the rapid advancement of information technologies, including the Internet of Things [1], cloud computing [2], and edge computing [3], smart city development has continued to accelerate. As a critical component of urban infrastructure, intelligent public transport systems have attracted increasing attention in terms of operation optimization and service improvement. In 2025, the total volume of urban passenger transport in China reached approximately 104.346 billion passengers, among which rail transit accounted for 33.224 billion passengers and buses and trams accounted for 36.566 billion passengers [4]. Accurate prediction of bus stop passenger flow is essential for optimizing vehicle dispatching, balancing resource allocation, and improving public transport service quality [5]. In addition, passenger flow prediction provides a fundamental basis for passenger diversion strategies, including passenger-to-vehicle assignment [6] and rational bus route selection [7], and is therefore of great importance for improving the overall operational efficiency of public transport systems. However, passenger flow in public transport systems exhibits pronounced spatiotemporal complexity. Travel demand changes dynamically over time and is also affected by interactions among geographically proximate, topologically connected, or functionally similar stops. Therefore, developing prediction models that can effectively capture such complex dependencies has become an important research topic in intelligent transportation.
Early studies on passenger flow prediction mainly relied on statistical regression models, such as autoregressive (AR), autoregressive moving average (ARMA), and autoregressive integrated moving average (ARIMA) models [8]. These models can achieve acceptable performance for stationary time series, but their strict stationarity assumptions limit their ability to capture nonlinear variations caused by fluctuating travel demand and external environmental changes. With the development of machine learning, models such as support vector machines (SVMs) and deep neural networks (DNNs) have been widely used for passenger flow prediction owing to their nonlinear modeling capabilities [9]. Among recurrent neural network variants, long short-term memory (LSTM) networks have been extensively adopted because of their suitability for sequential data modeling [10]. To further improve prediction performance, researchers have increasingly explored hybrid model architectures. For example, Liu et al. combined SVMs with k-nearest neighbors (KNNs) to exploit their complementary advantages in classification and regression tasks, thereby improving prediction robustness under adverse weather conditions [11]. Ma et al. proposed a parallel CNN–LSTM framework for metro passenger flow forecasting, enabling the independent extraction of spatial and temporal features and reducing information interference in serial architectures [12]. Hao et al. incorporated an attention mechanism into LSTM and introduced exogenous features, including weather and holiday indicators, demonstrating the effectiveness of multi-factor feature integration [13].
Despite these advances, many passenger flow prediction methods still face a key limitation in representing the spatial structure of public transport networks. Conventional models often treat the public transport network as a Euclidean structure and convert it into a two-dimensional grid for convolutional processing. This representation may neglect the inherent topological relationships of the network and tends to perform poorly in scenarios with sparse station distributions [14]. To address this issue, graph neural networks (GNNs), which can operate directly on non-Euclidean graph structures while preserving network topology [15], have been increasingly applied to passenger flow prediction. Zhang et al. integrated residual networks (ResNet), graph convolutional networks (GCNs), and attention-enhanced LSTM, achieving strong performance in metro passenger flow prediction [16]. Further studies have shown that inter-station dependencies are not limited to physical connectivity. Researchers have therefore constructed multi-relational graph structures from different perspectives. For instance, Bao et al. developed GCNs based on geographical distance, functional similarity, and passenger flow patterns to learn diverse spatial correlation features [17]. Liu et al. incorporated the physical metro network, passenger flow similarity graph, and correlation graph into graph convolutional gated recurrent units (GCGRUs) to obtain more expressive spatiotemporal representations [18]. These studies indicate that integrating multi-dimensional station relationships is important for improving prediction accuracy. Meanwhile, Transformer architectures based on self-attention mechanisms and their graph-structured variants have demonstrated strong performance in sequence modeling tasks [19]. For example, the graph attention network (GAT) proposed by Velicković et al. adaptively assigns weights to neighboring node representations, thereby overcoming the limitation of uniform aggregation in conventional GCNs [20]. However, although Transformers are effective in capturing long-range temporal dependencies, their computational complexity increases quadratically with sequence length, which poses challenges for efficient long-horizon passenger flow prediction. To improve computational efficiency, several Transformer variants, such as LogTrans [21], Reformer [22], and Autoformer [23], have been proposed.
In summary, two issues remain to be further addressed in current passenger flow prediction research. First, although existing graph-based methods have introduced different types of spatial correlations, the construction of associated stations is still often based on fixed physical adjacency, single-view similarity, or data-driven correlation alone. Such methods do not fully integrate the transportation-domain attributes of bus networks, such as line connectivity, spatial proximity, OD travel correlation, and station functional characteristics, into a unified associated-node selection framework. As a result, the constructed graph may not sufficiently reflect the multi-dimensional interaction mechanisms among bus stations. Second, although the Informer model alleviates the efficiency bottleneck of the original Transformer through probabilistic sparse self-attention and is suitable for long-sequence prediction, its integration with dynamically constructed traffic graph structures remains insufficiently explored [24]. Therefore, it is necessary to develop a prediction framework that can jointly model domain-informed spatial interactions and long-term temporal dependencies in bus passenger flow.
To address these research gaps, this paper proposes GAT-Informer, a hybrid deep learning model for bus passenger flow forecasting. The proposed model first constructs a four-dimensional associated-node mechanism and builds a passenger flow interaction graph based on line connectivity, spatial proximity, OD travel correlation, and station functional similarity. On this basis, GAT is introduced to learn differentiated spatial influence weights among associated stations, and Informer is further used to capture long-term temporal dependencies and periodic fluctuation patterns. The main contributions of this paper are summarized as follows:
- Unlike conventional graph construction methods that rely mainly on predefined static adjacency or single-view spatial correlation, this paper identifies passenger flow-related stations from four complementary dimensions: line connectivity, spatial proximity, OD travel correlation, and station functional similarity. These dimensions represent the topological, spatial, behavioral, and semantic dependencies among bus stations, enabling the construction of a passenger flow interaction spatiotemporal graph that better reflects travel demand patterns.
- Based on the constructed associated-node graph, a graph attention network is introduced to adaptively learn the differentiated influence weights of associated stations for each target station. This enables the model to dynamically capture passenger flow interactions among bus stations and overcome the limitation of fixed aggregation weights in traditional GCN-based methods.
- The spatially enhanced features extracted by GAT are further integrated into the Informer module, enabling the joint modeling of dynamic spatial dependencies and long-term temporal patterns in bus passenger flow. Through probabilistic sparse self-attention and hierarchical timestamp encoding, the model efficiently captures long-range temporal dependencies and periodic fluctuations while preserving the spatial interaction information learned from the associated-node graph. In this way, the proposed framework achieves deep fusion between multi-dimensional station association modeling and long-sequence temporal forecasting, improving the adaptability of advanced time-series models to traffic graph-structured data.
Extensive experiments on a real-world bus passenger flow dataset from Foshan City demonstrate that GAT-Informer consistently outperforms established benchmark models, including LSTM-Transformer, CNN-GRU, and STGCN, across multiple evaluation metrics. These results validate the effectiveness and robustness of the proposed model for spatiotemporal bus passenger flow forecasting.
2. Materials and Methods
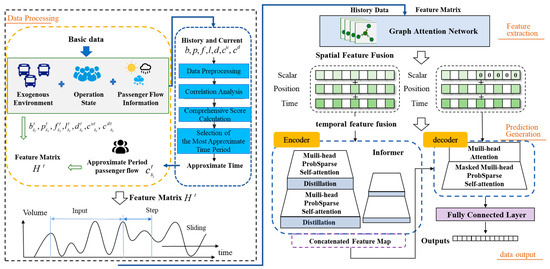
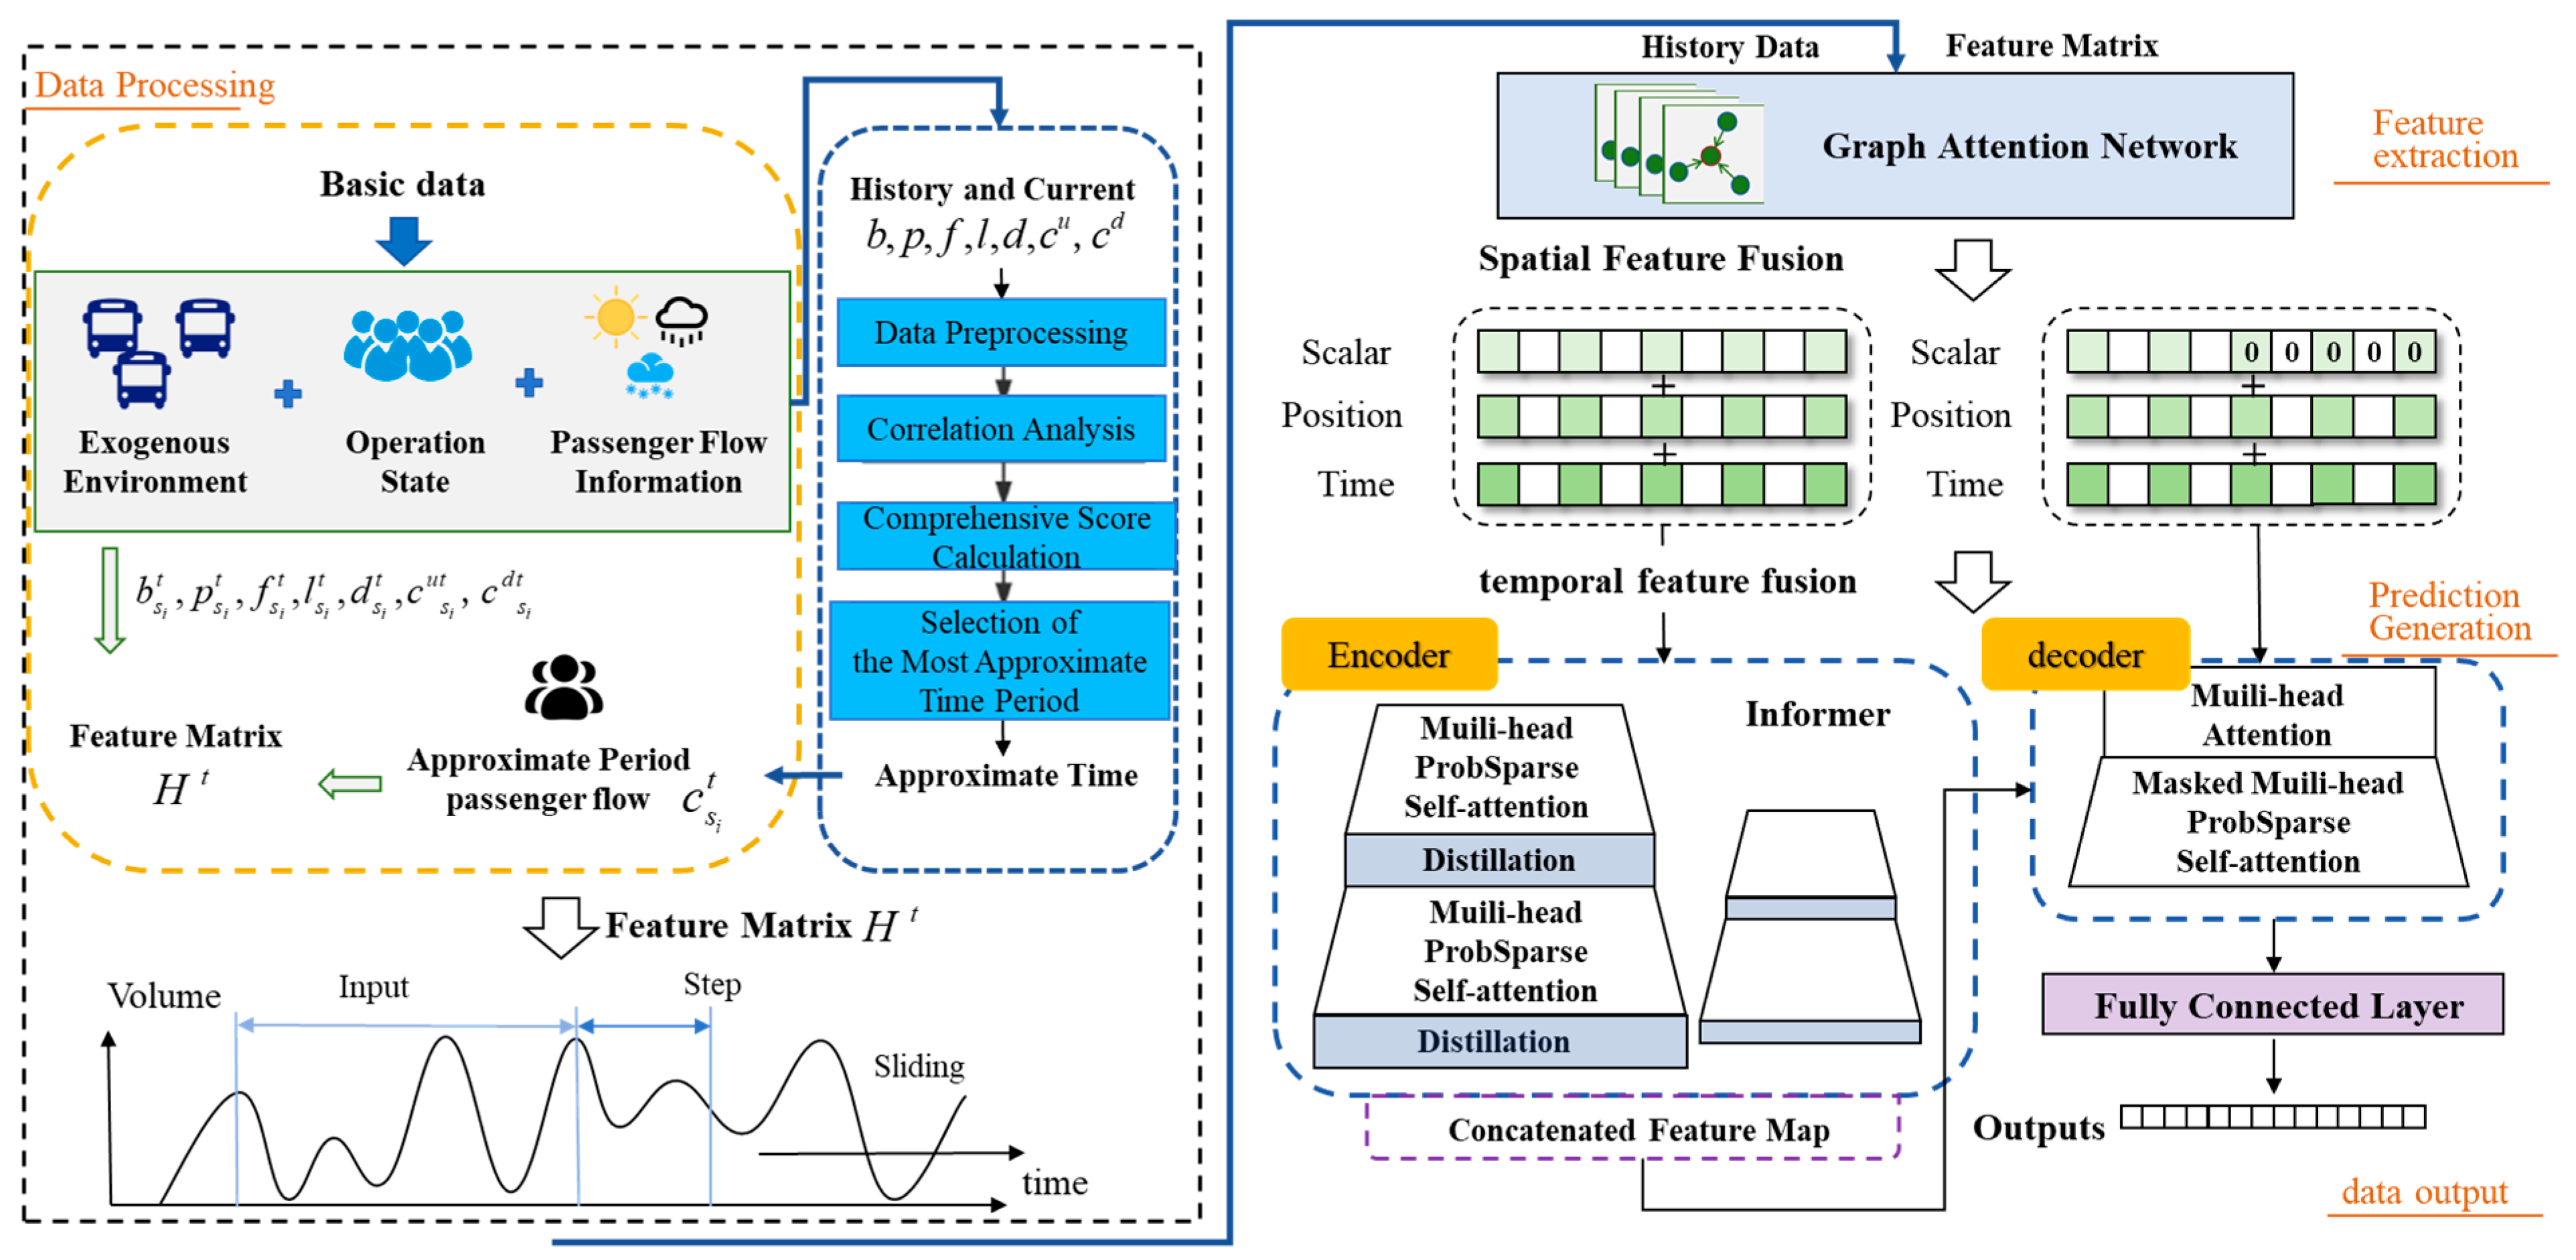
The proposed GAT-Informer model for bus passenger flow forecasting comprises four functional modules: a data processing module, a feature extraction module, a prediction generation module, and a data output module, as shown in Figure 1. The data processing module first describes station-related features to construct station-level feature representations. Considering that similar historical operating scenarios provide valuable references for passenger flow prediction, the features of historical time periods similar to the current prediction interval are further incorporated into the model input. Thus, a comprehensive similarity score is constructed to select reference feature windows, which is calculated based on the Pearson correlation coefficients between passenger flow and various influencing factors. The feature extraction module and prediction generation module successively introduce graph convolution and position encoding to realize effective fusion of spatial interaction rules and long-term temporal variation laws. Here, the feature extraction module uses graph attention network to extract spatial correlation characteristics between stations, and the prediction generation module adopts Informer to capture multi-factor coupled temporal dependence of passenger flow. The data output module employs fully connected layers to transform the features produced by the prediction generation module into the final passenger flow prediction sequences.
Figure 1.
Framework of the GAT-Informer Model for Bus Passenger Flow Forecasting.
2.1. Data Processing and Feature Matrix Construction
To achieve a reasonable representation of stochastic factors in passenger flow demand forecasting, a feature description system centered on station-specific inherent attributes (e.g., historical passenger flow and number of connecting bus lines) and exogenous variables (e.g., temperature and nighttime light intensity) is established to express the dynamic variations in station-level passenger flow, as shown in Equation (1). Meanwhile, to enhance the accuracy and stability of bus stop passenger flow prediction, this paper establishes a data preprocessing and historical approximate period selection mechanism. Correlation analysis is adopted to calculate the correlation degree between the selected multi-dimensional influencing factors and passenger count, thereby determining the effect of each factor on passenger demand. The passenger flow data corresponding to this period are then incorporated into the model as station-level features, thus expanding feature dimensionality and improving training effectiveness. It is emphasized that the similarity calculation between the current period and any historical period is performed using only past data. No future information is incorporated at any stage of the selection process. Specifically, the Pearson correlation analysis formula, as shown in Equation (2), is used to calculate the correlations among the selected multi-dimensional influencing factors, as shown in Equation (3), and then a comprehensive impact score is constructed. Based on the principle of minimizing error, the historical approximate period is selected, as shown in Equation (4).
Herein, the feature matrix comprises temperature and precipitation at the target station and associated stations at time , the number of connecting bus stations and nighttime light intensity , average bus headway , boarding and alighting passenger counts at and , and historical passenger flow from temporally similar periods. As shown in Equation (1), , denote the total number of nodes in the graph, with each node characterized by -dimensional features.
Herein, denotes the Pearson correlation coefficient between vectors and . Specifically, and are uncorrelated when ; positively correlated when ; and negatively correlated when . represents their covariance, while and denote the standard deviations of and , respectively. Accordingly, the Pearson correlation coefficient quantifying the linear association between each influencing factor and demand is defined as:
Herein, denotes the Pearson correlation coefficient between the -th influencing factor and passenger demand; denotes the -th influencing factor in feature vector ; denotes passenger demand.
Among them, denotes the comprehensive
score, which quantifies the similarity between station feature of the
historical time and station feature at current
time . denotes the Euclidean distance
between the feature at time period and target prediction time period
on the -th influencing factor. is the -th influencing factor in station
features at historical period . is the -th influencing factor in
station features at current time . A lower value of indicates higher similarity.
Accordingly, the historical period yielding the minimum is selected as the reference
time period for the target prediction time period, i.e., select the historical
period that satisfies .
2.2. Spatial Dependency Modeling and Feature Extraction
This section introduces the construction of the graph structure and the implementation of the graph attention mechanism to achieve effective representation of spatial interaction features among bus stations. First, candidate nodes are identified based on four dimensions—line connectivity, OD flow correlation, spatial proximity, and station functional similarity—and associated subsets are unified into a comprehensive candidate node set. Subsequently, an undirected spatiotemporal interaction graph is constructed, with its adjacency matrix explicitly encoding station pairwise correlations. Finally, the Graph Attention Network (GAT) model leverages its attention-weighted aggregation and multi-head mechanism to extract spatial interaction features and iteratively refine station representations.
2.2.1. Construction of the Candidate Node Set
To enable GAT-based extraction of spatial passenger flow characteristics, a mechanism is established to retrieve station status information from heterogeneous data sources, and candidate nodes with strong correlation to the target station’s passenger flow are expressed using correlation measures. On this basis, a multi-dimensional associated subset is constructed by jointly encoding line connectivity, spatial proximity, OD flow correlation, and station functional similarity to express the multiple correlations between stations. Assuming that these four dimensions jointly determine the strength of station correlations, the multi-dimensional associated subset can be expressed as the result of joint encoding of the above four dimensional features. Finally, a multi-subset unification strategy is established to unify all multi-dimensional associated subsets into a set , thereby expressing the final
candidate node set.
- Line-Connectivity Node Set : Within the physical topology of the bus network, stations and that share a direct bus route link exert strong reciprocal influence on each other’s passenger flow distribution patterns and temporal dynamics. Consequently, the nodes adjacent to station are selected to form the line-connectivity node set.
- OD-Related Node Set : Origin–destination (OD) flows between stations reflect the functional interaction strength of passenger movements. Specifically, when station contributes the dominant share of inbound flow to station , or when the outbound flow of station is predominantly directed toward station , the two stations exhibit strong functional coupling. The spatial correlation between stations and is quantified by the OD flow weight , computed via Equation (5). Accordingly, comprises the stations with the highest values, which exhibit the strongest similarity to station and form its similarity-driven adjacency set.
- Spatial Proximity Node Set : Geographically proximate stations exhibit stronger dynamic passenger flow interactions. The Euclidean distance between stations and is computed, and is defined as the set of the nearest-neighbor stations to station in geographical space, which are selected to establish spatial adjacency connections with station .
- Station Functional Node Set : Stations with similar temporal passenger arrival patterns typically share analogous functional roles in the urban transit network. To quantify functional similarity, a station-level functional descriptor vector is constructed, comprising four normalized features: the counts of shopping malls, residential areas, and educational institutions, as well as nighttime light intensity (which quantifies the surrounding economic vitality), all aggregated within an 800 m buffer around each station. The Manhattan distance between the functional vectors of stations and is computed via Equation (6), where and denote the -th element of the functional descriptor vectors for stations and , respectively. A smaller indicates higher functional similarity; thus, consists of the stations with the smallest values relative to station , which are selected to establish functional similarity-based connections with station .
Since different node selection rules may result in overlapping stations across subsets, a backtracking algorithm is applied for deduplication during set construction. The subsets are then integrated into the complete node set , which uniformly includes stations with high correlation to target station . These stations form the “edge” connections that characterize passenger flow interactions with station .
2.2.2. Spatiotemporal Graph Construction
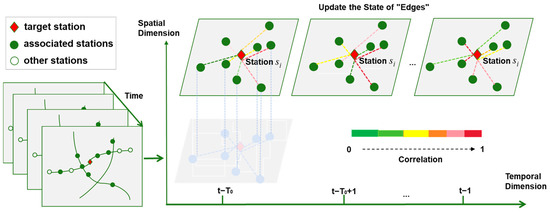
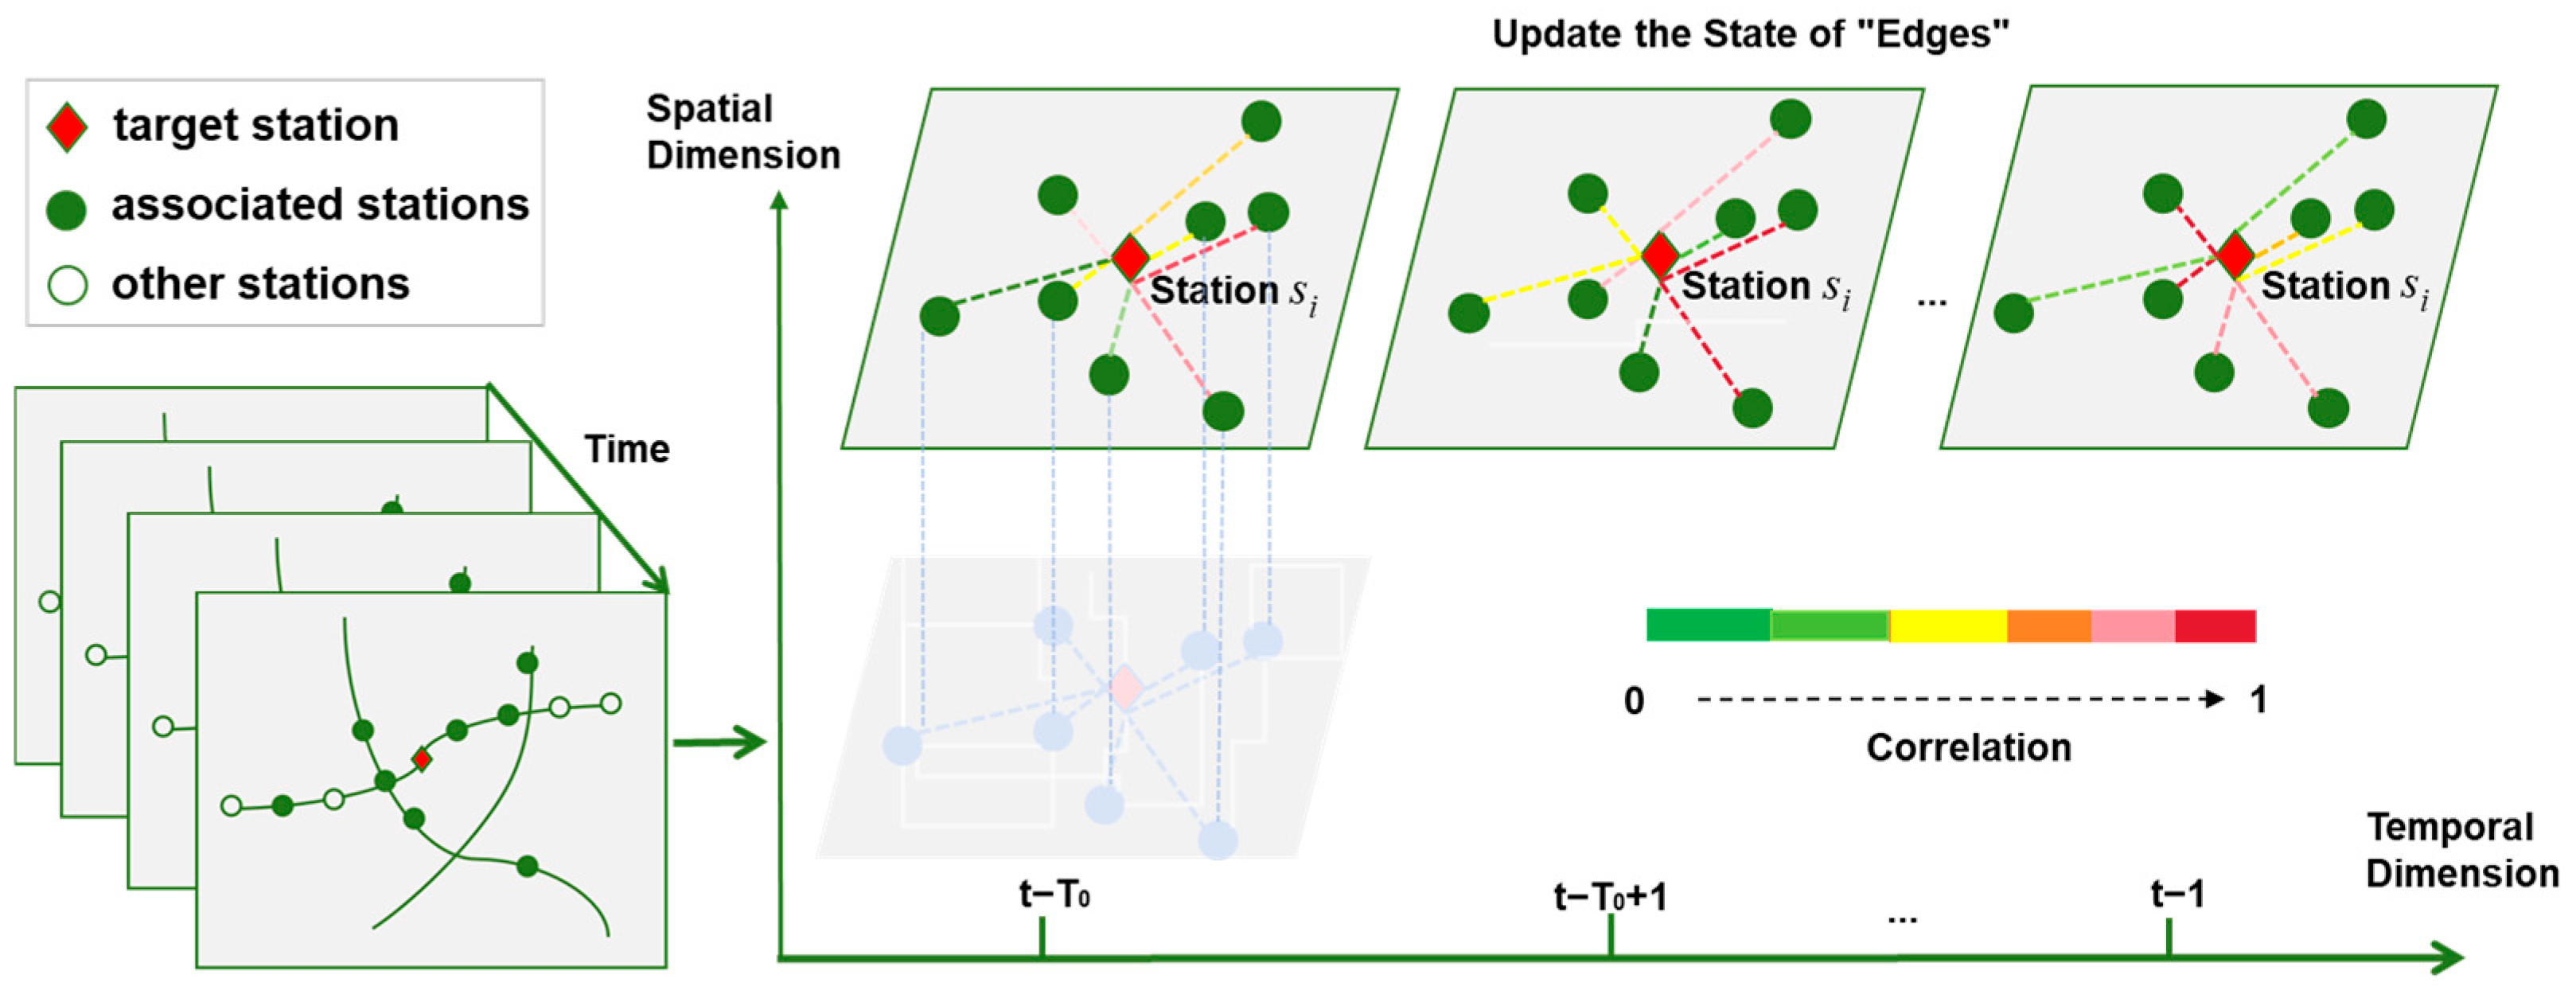
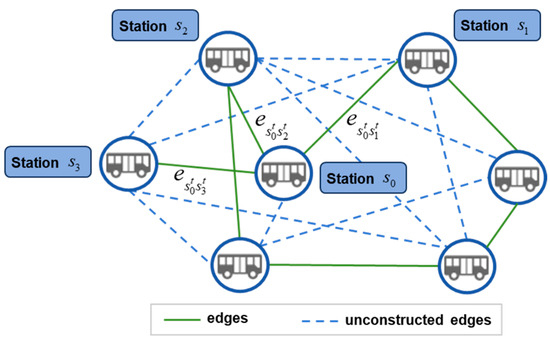
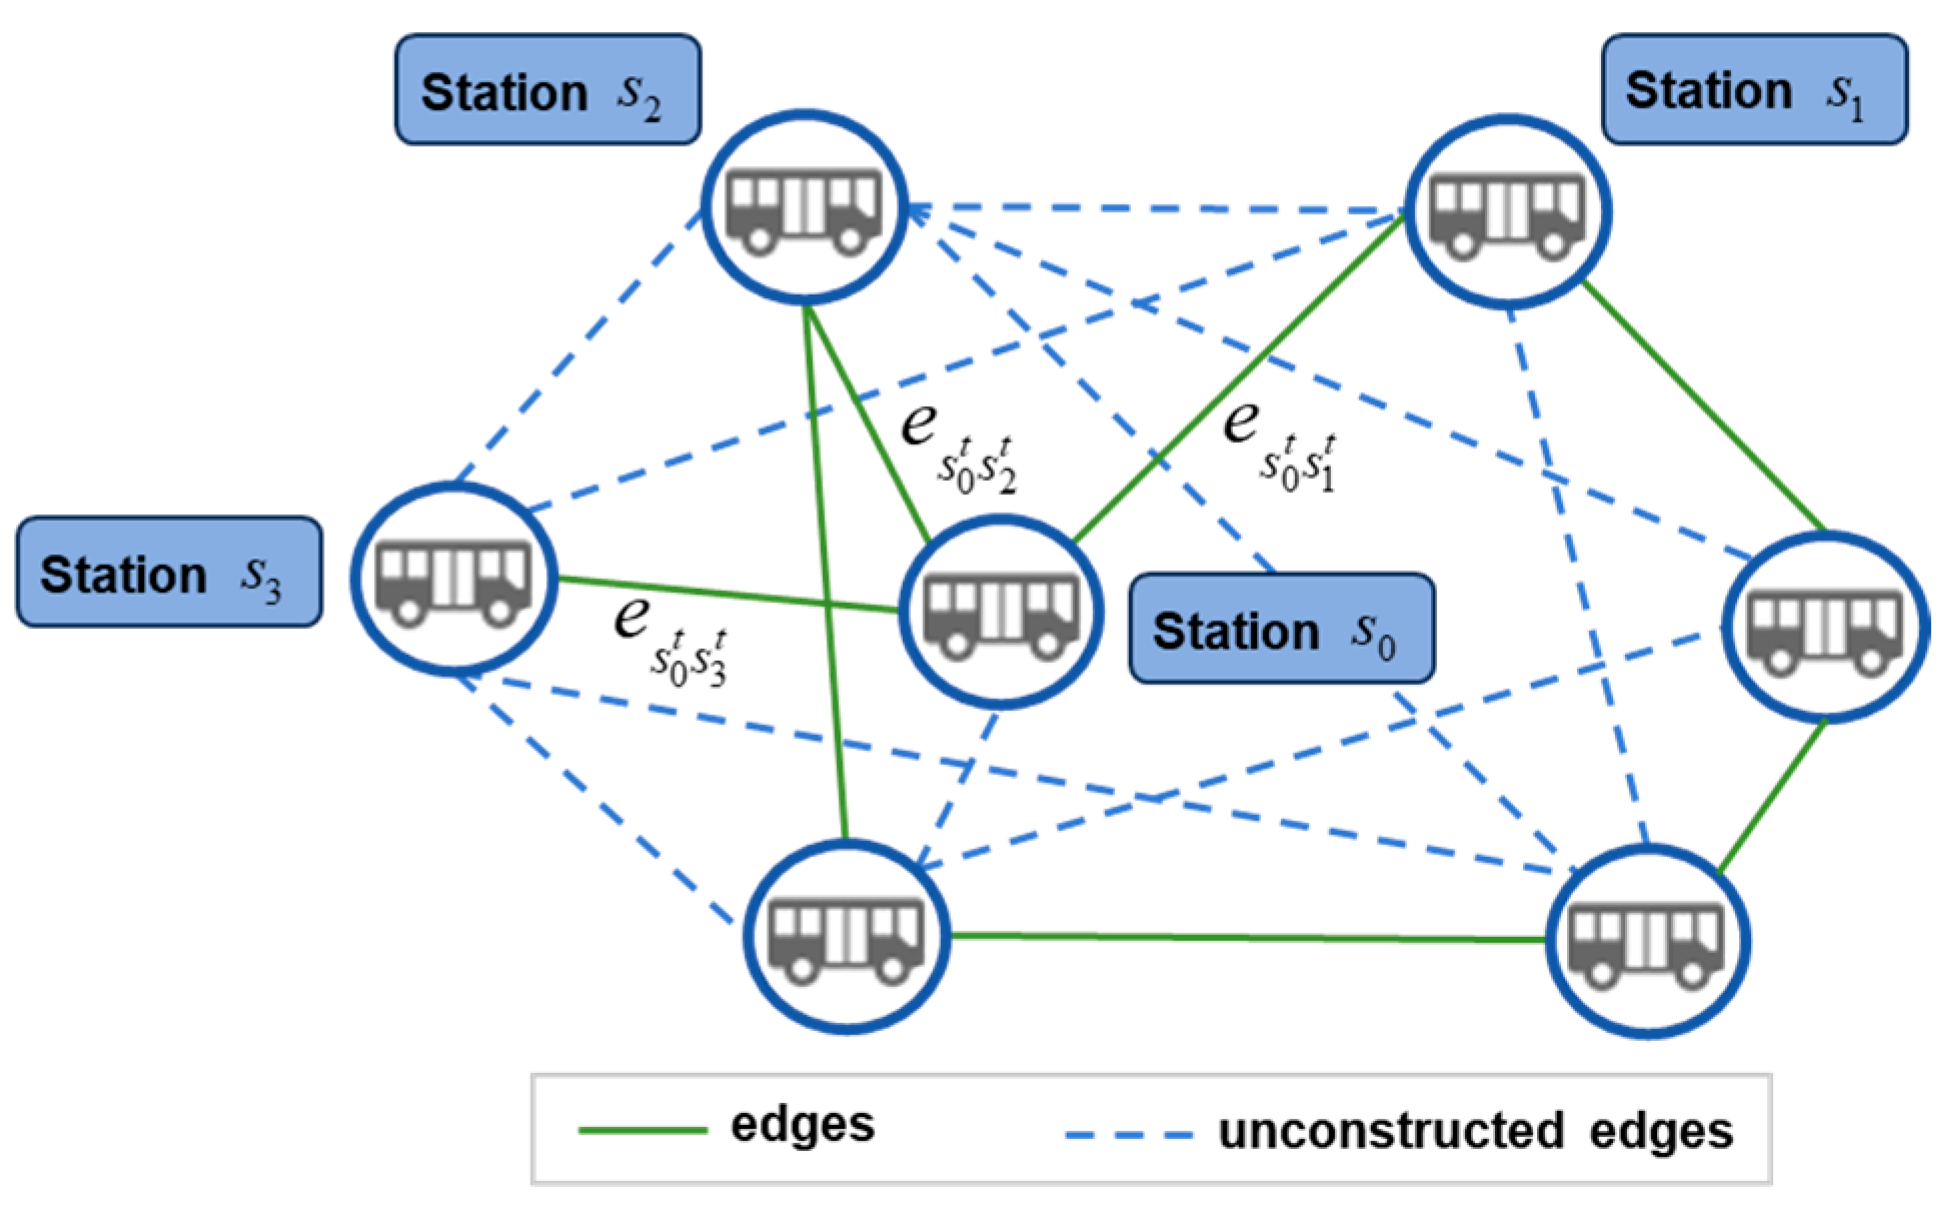
To achieve the construction of a spatiotemporal graph characterizing passenger flow interactions between stations based on the aforementioned integrated node set, a graph formulation is established. In this paper, the spatiotemporal graph is dynamically updated at a fixed interval of 5 min. At each update step, the associated nodes are recalculated according to the passenger flow and station characteristics observed in the current time interval, and a new adjacency matrix is generated to capture the dynamic evolution of inter-station passenger flow interactions. Specifically, stations in the integrated node set serve as graph nodes, and the mutual influence relationships between stations at the same time step are defined as “edges”. Assuming that interactions between stations are bidirectional in nature, then an undirected spatiotemporal sequence graph can be expressed as the one illustrated in Figure 2. To represent the spatiotemporal features of the target station, a spatiotemporal sequence graph is constructed, as shown in Figure 3. In this paper, the spatiotemporal sequence graph of the station is denoted as . represents the node set composed of the target station and its correlated bus stations. denotes the edge set formed by passenger flow interactions between each node and the target station, and represents the edge value between stations and at time that implicitly reflects passenger flow fluctuation characteristics. Furthermore, an adjacency matrix sequence is employed to quantify the correlations or associations among different stations, as defined in Equations (7) and (8).
Figure 2.
Spatiotemporal representation of station-level interactive passenger flow dynamics.
Figure 3.
Schematic Diagram of the Bus Stop Graph Structure for the GAT Network.
Here, denotes the spatial interaction graph of passenger flow among bus stations at time . The adjacency matrix sequence is defined, where stores the selection results of associated nodes for each station, indicating whether interactive correlations exist between stations in the bus network at time.
2.2.3. Graph Attention Mechanism
To achieve aggregation of node information in the spatial interaction graph based on the obtained feature matrix , a GAT-based aggregation mechanism is established. In this mechanism, attention is employed during the edge-weight updating process to enable information interaction and fusion between nodes. The edge information, which represents inter-node associations, is further incorporated into the attention score calculation and update. The specific information aggregation process is formulated in Equations (9) and (10).
Here, denotes the learnable weight vector for attention coefficients, which is derived by linearly transforming the joint feature vector into a one-dimensional scalar (i.e., the raw correlation coefficient ). is a learnable weight matrix used to project the input node features into a latent representation space. serves as the activation function to introduce nonlinear transformations. represents the raw correlation coefficient between station and the target station . refers to the attention weight normalized via , with a value range of [0, 1] and satisfying the constraint . is the set of correlation stations for station .
To capture feature representations from different subspaces, a multi-head attention mechanism is incorporated into the graph attention network. In this study, three attention heads are computed in parallel, with each head independently learning attention weights and aggregating neighboring node features. The outputs of the three heads are then fused to generate the final feature representation of station , as formulated in Equations (11)–(13).
Herein, denotes the independent linear transformation weight matrix for the -th attention head, here 3 attention heads are taken; serves as the activation function, employed to normalize the feature output; represents the concatenated feature vector; and refers to the aggregated spatial feature vector of the target station.
2.3. Temporal Feature Extraction
In the preceding section, the extraction and update of spatial features of passenger flow at bus stations were accomplished via the GAT network. This section will focus on the temporal dimension, leveraging the Informer network to realize the mining and extraction of temporal features.
2.3.1. Positional Encoding
To achieve simultaneous extraction of multi-scale temporal information (including year, month, week, hour, and minute) for model input, the Informer model employs a positional encoding mechanism consisting of scalar projection, local timestamps, and hierarchical timestamps [25]. To capture fine-grained sequential order, a local timestamp embedding mechanism is established, using sine-cosine positional encoding (PE) to express temporal order, as shown in Equation (14). The hierarchical timestamps are encoded using learnable stamp embeddings . Assuming that scalar projection, local PE, and global SE timestamps each contribute distinct temporal cues, then the final position-encoded sequence information can be expressed as the fusion of these three components, as formulated in Equation (15).
Herein, represents the sequence position number; denotes the dimension of the feature matrix after convolution mapping, where ; represents the length of the input passenger flow sequence; indicates the number of input sequence, with ; denotes the input vector after one-dimensional convolution and dimensionality reduction; denotes the type of global timestamp; is an adjustment factor that balances the inherent dimensionalities of local/hierarchical timestamps and scalar projections. When the input sequence is normalized, .
2.3.2. Multi-Head Probabilistic Sparse Self-Attention Mechanism
To achieve effective screening of time-series relationships that exert a decisive influence on passenger flow data and to optimize the complexity of exhaustive dot-product computation in the traditional Transformer model, this paper applies the Multi-Head Probabilistic Sparse Self-Attention Mechanism to both the encoder and decoder of the Informer model. The core calculations are presented in Equation (16).
Here, , , and denote the query matrix, key matrix, and value matrix, respectively, derived by projecting the dataset’s feature matrix through the three weight matrices , , and ; , , and represent the -th row of the query matrix, key matrix, and value matrix, respectively; denotes the feature dimension; is the asymmetric exponential kernel .
To quantify the discrepancy between the two probability distributions in the attention mechanism, a Kullback–Leibler (KL) divergence-based evaluation is established. Specifically, using the discrete KL divergence to compute the difference between the attention probability distribution and the uniform distribution yields an expression for evaluating the attention sparsity with respect to passenger flow fluctuations.
For any query vector , compute its inner product with all key vectors. The maximum value of these inner products is taken as the first term, while the arithmetic mean of all inner products serves as the second term. The difference between the first and second terms reflects the magnitude of the query vector’s influence on the passenger flow attention mechanism: a larger difference indicates a more significant influence. Within the predefined interval, queries with larger such differences are selected, and self-attention is computed only for the “active dot products” derived from these selected .
2.3.3. Distillation Operation
To improve model efficiency and computational speed, a downsampling mechanism is established between adjacent self-attention layers. Specifically, the distillation operation uses downsampling to express the halving of the sequence length of the self-attention layer output. The formula for the distillation operation between adjacent attention layers is given by:
Herein, and denote the output sequence of the multi-head probabilistic sparse self-attention layer. denotes the one-dimensional convolution which is applied to the passenger flow time series for local temporal feature extraction. is the Exponential Linear Unit activation function, and finally, the convolutional output is downsampled via max pooling .
2.3.4. GAT-Informer Prediction Model
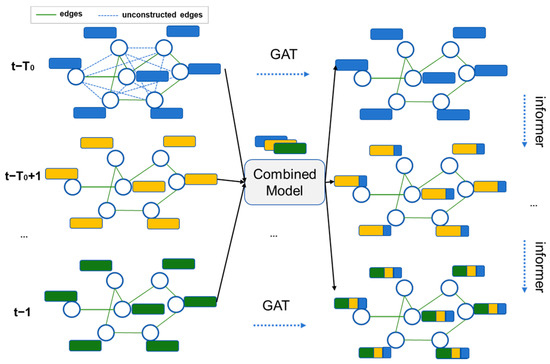
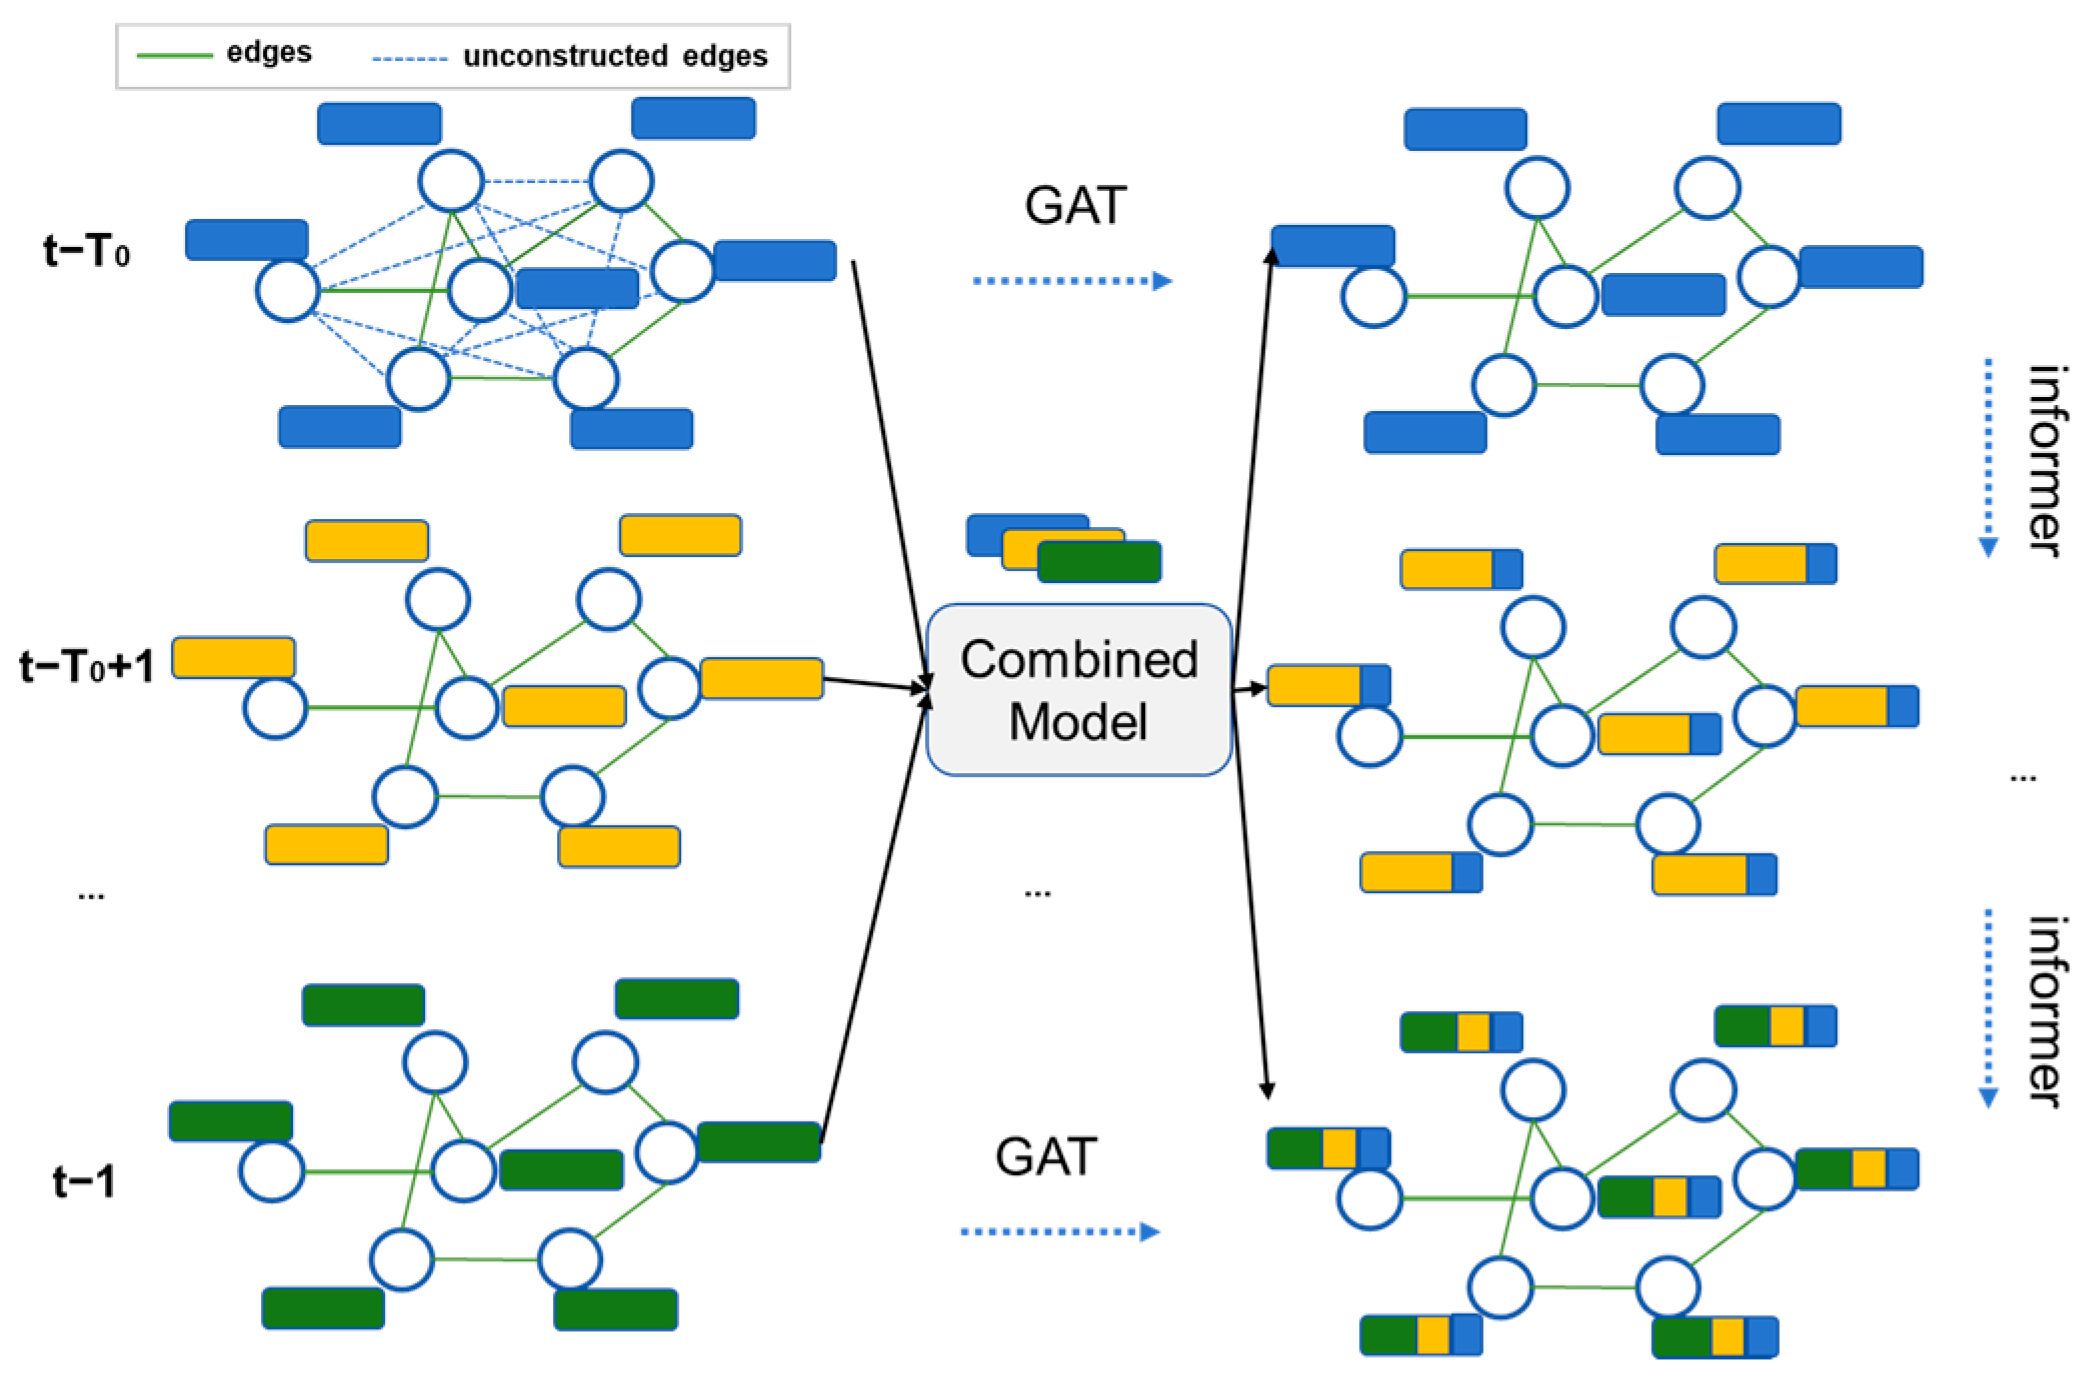
We further construct a bus passenger flow prediction model that integrates the GAT graph attention mechanism and the Informer network (as illustrated in Figure 4). The model takes as input a sequence of passenger flow feature matrices spanning from time to , where denotes the length of the historical time window; this input sequence captures the evolution of the passenger demand time series over multiple consecutive time steps prior to the prediction point. The Graph Attention Network (GAT) is employed to extract spatial dependencies between bus stops at each time step. Enhanced spatial features are generated based on the dynamically constructed passenger flow interaction graph and fed into the combined prediction architecture. The Informer network further captures long-term temporal dependencies via its hierarchical timestamp encoding and multi-head probabilistic sparse self-attention mechanism. Ultimately, by fusing the spatial correlations of stations with historical time series features, high-precision bus passenger flow prediction is achieved.
Figure 4.
Schematic Diagram of the Fusion Mechanism Between GAT and Informer.
3. Results and Discussion
In order to verify the prediction performance and model stability of the method in different scenarios, this section carried out experimental verification, including dataset, analysis of spatiotemporal feature extraction, performance testing, ablation study and scenario adaptability evaluation.
3.1. Dataset
This study employs operational passenger flow data from Foshan City’s Bus Route 116, collected over a three-month period (October–December 2022). The passenger capacity is 45 people, the fleet size is 22, the bus mileage is 24.85 km, and the line has 40 stations.
Following rigorous preprocessing—including data cleaning, outlier detection and removal, temporal interpolation for missing entries, and min–max normalization—we obtained 100,000 high-quality, temporally aligned samples. For testing the method, the samples are split into training and testing sets at a ratio of 8:2. The dataset spans different seasons of autumn and winter. The passenger flow data cover different temporal states, including morning peaks, midday periods, evening peaks, and off-peak periods. At the same time, the selected stations cover various urban functional scenarios, such as business districts, squares, and residential areas. Thus, the dataset contains rich samples, which can effectively validate the performance of the proposed method.
3.2. Analysis of Spatiotemporal Feature Extraction
3.2.1. Analysis of Spatial Characteristics
The GAT-based graph attention mechanism represents bus stops as nodes in a spatiotemporal interaction graph. Based on the associated-node graph constructed from line connectivity, spatial proximity, OD correlation, and station functional similarity, the model adaptively learns the influence weights between the target station and its associated stations. Through linear transformation, attention-weight calculation, and Softmax normalization, the learned attention coefficients provide an interpretable measure of the relative strength of spatial dependencies among stations.
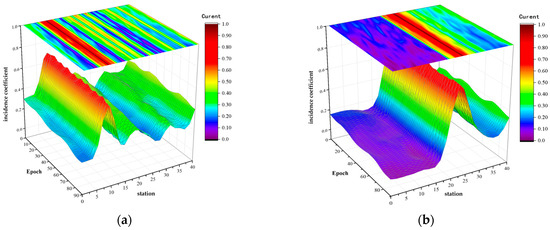
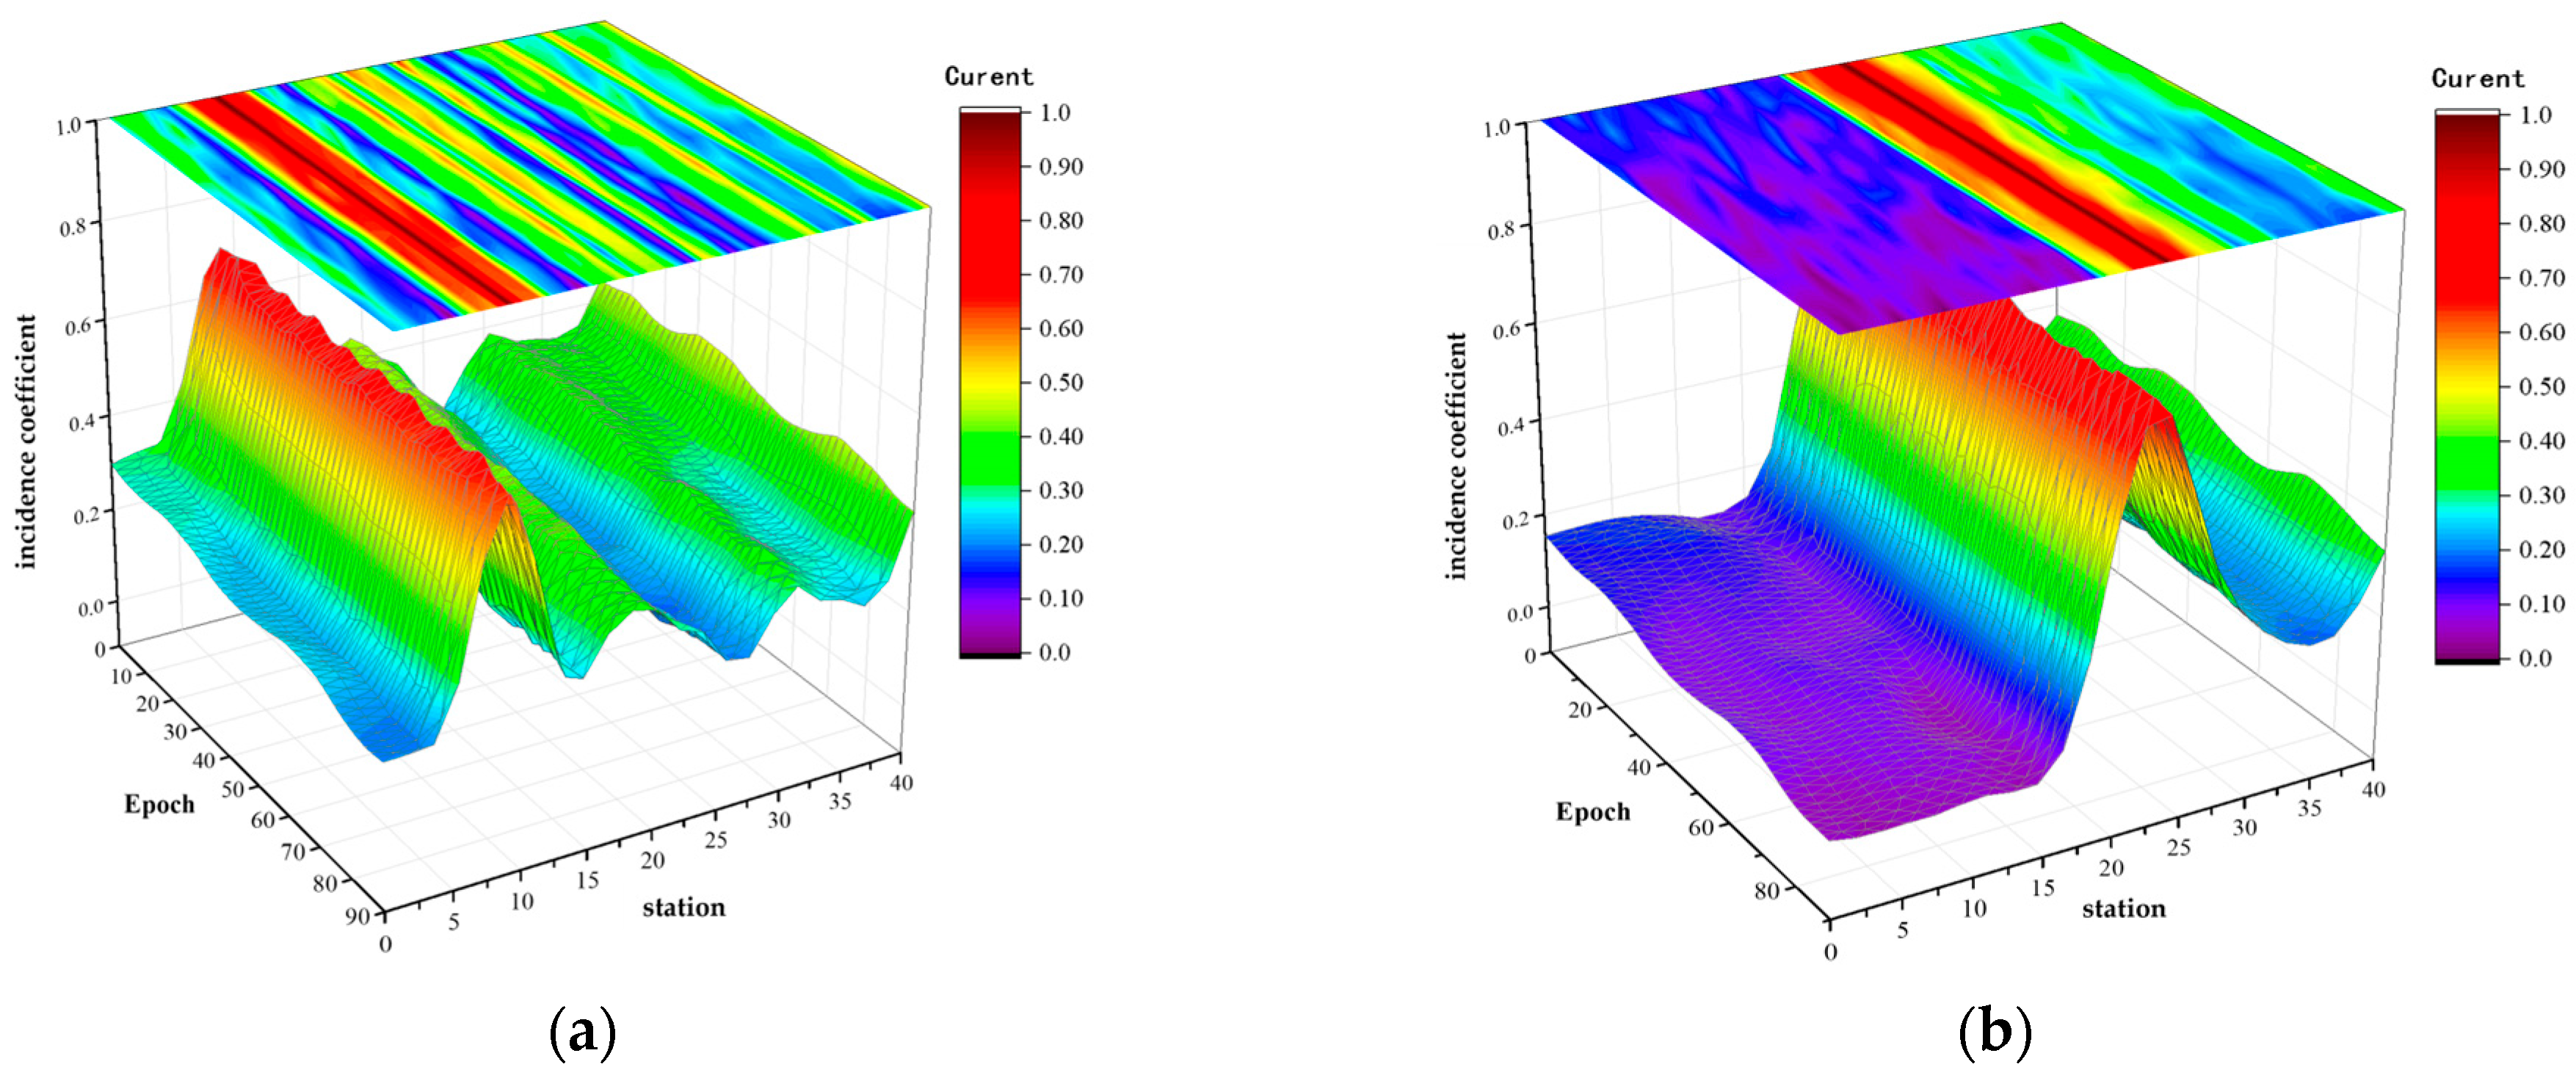
Figure 5 provides an intuitive visualization of the spatial feature extraction capability of the proposed model. Specifically, Figure 5a presents the attention-based correlation heatmap between Foshan Airport Station (Station 9) and other stations on Route 116. In the heatmap, the x-axis represents the station index, the y-axis represents the training epoch, and the correlation coefficient ranges from 0 to 1, with larger values indicating stronger learned spatial dependency. As expected, Station 9 shows a self-correlation coefficient close to 1 across the training process, indicating that the model preserves the self-representation of the target node. In addition, relatively high correlation values, generally greater than 0.6, are observed for several important transfer or transport-related stations, such as Station 17 (Foshan Bridge, interchange with Metro Line 2) and Station 19 (Foshan Railway Station). This suggests that the model can assign higher attention weights to stations with stronger transport connections or passenger flow interactions with the target station. By contrast, the terminal stations, including Stations 1 and 40, generally show moderate-to-low correlation coefficients, approximately within the range of 0.2–0.4. This indicates that the GAT mechanism can distinguish the relative importance of different stations and capture differentiated spatial dependencies instead of assigning fixed or uniform weights to all stations.
Figure 5.
Correlation coefficient heatmaps of representative stations. (a) Station 9; (b) Station 23.
Figure 5b presents the correlation heatmap for Ancestral Temple A Station, which is located in Foshan’s central business district (CBD). Adjacent stations, such as Stations 8 and 10, consistently show high attention coefficients in the range of 0.8–1.0, indicating strong localized spatial interactions between neighboring stations. This result suggests that the model can effectively identify stations with close spatial proximity and similar passenger flow patterns. In comparison, other commercial stations along the route, such as Station 29 (Dongjian Century Plaza), show moderate correlation coefficients of approximately 0.4–0.5. This indicates that the model can capture functional associations among stations with similar surrounding land-use characteristics, even when they are not directly adjacent. Meanwhile, residential stations, such as Station 32 (Shen Village), generally present relatively low-to-moderate coefficients, approximately within the range of 0.2–0.3, suggesting weaker direct spatial interactions with the CBD station. Overall, these attention patterns show that the GAT mechanism can distinguish different levels of spatial dependence among stations and learn interpretable spatial interaction features from multi-dimensional urban station attributes.
3.2.2. Temporal Characteristics Analysis
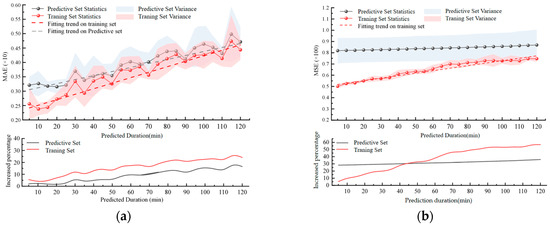
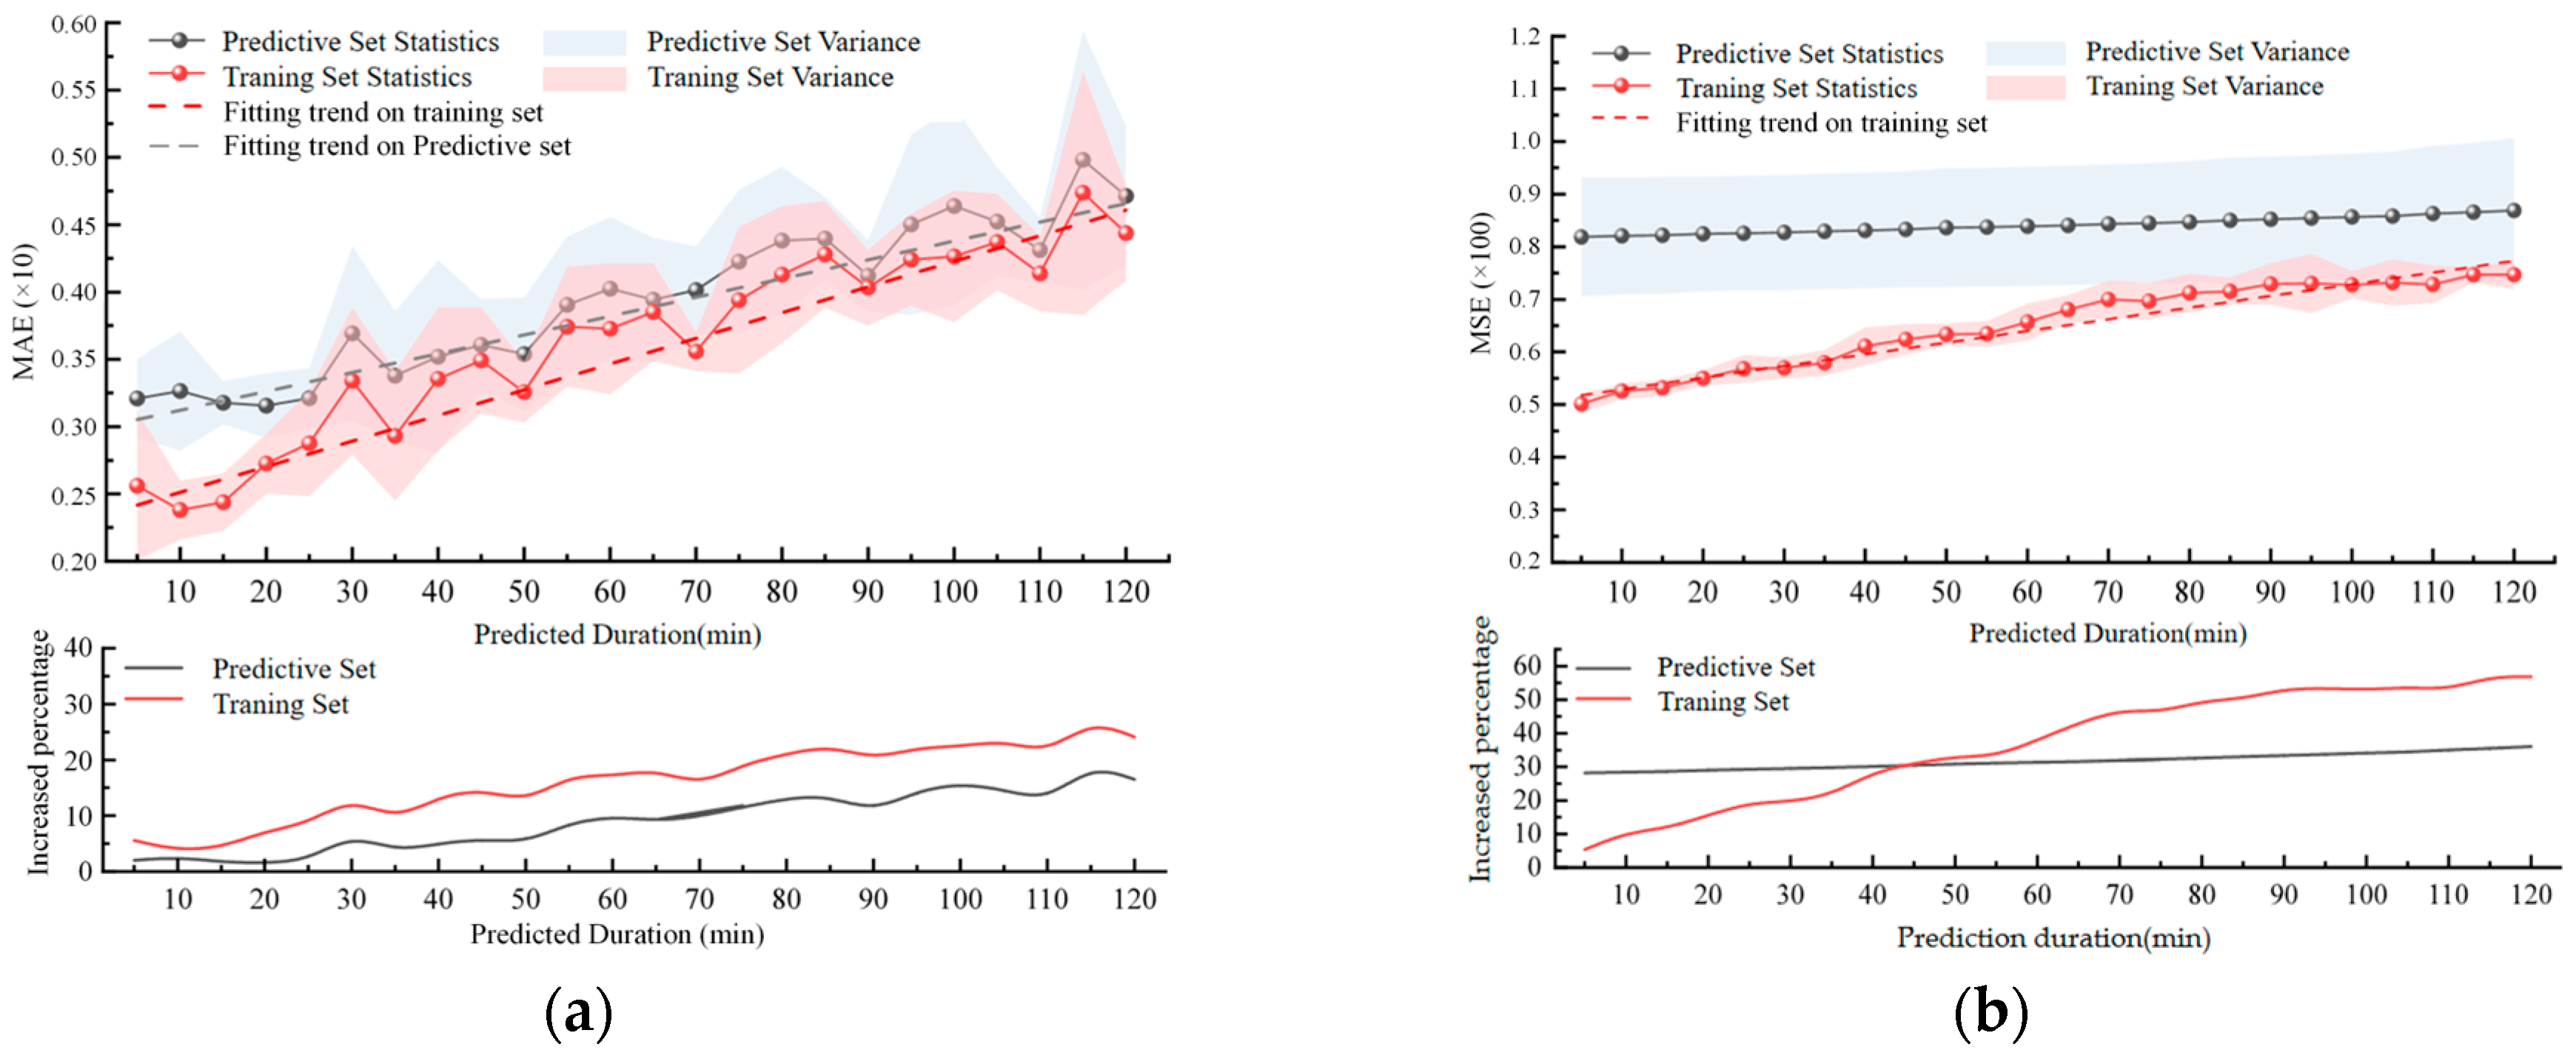
To evaluate the temporal feature extraction capability and multi-step forecasting stability of the proposed model, prediction errors were analyzed under different forecasting horizons. This experiment aims to examine whether GAT-Informer can maintain stable prediction performance as the forecasting horizon becomes longer. As shown in Figure 6a, the MAE increases gradually as the prediction horizon extends from 5 to 120 min, with an overall increase of less than 20%. The training and testing curves exhibit highly similar trends, and no obvious fluctuation or abrupt increase is observed. This indicates that the model maintains stable prediction accuracy as the forecasting horizon increases. Figure 6b presents the variation of MSE under different prediction horizons. The MSE of the training set remains relatively stable, while that of the testing set shows a gradual upward trend and stays within the range of 80–90. This result is consistent with the increasing uncertainty of passenger flow prediction over longer horizons. Overall, the gradual changes in both MAE and MSE, together with the close alignment between the training and testing curves, suggest that GAT-Informer can effectively capture long-term temporal dependencies and maintain stable performance in multi-step passenger flow forecasting.
Figure 6.
Prediction errors under different forecasting horizons. (a) MAE; (b) MSE.
3.3. Performance Testing
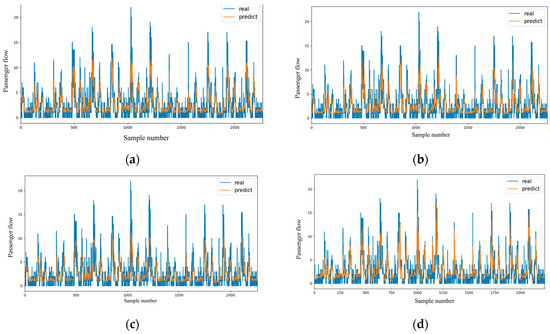
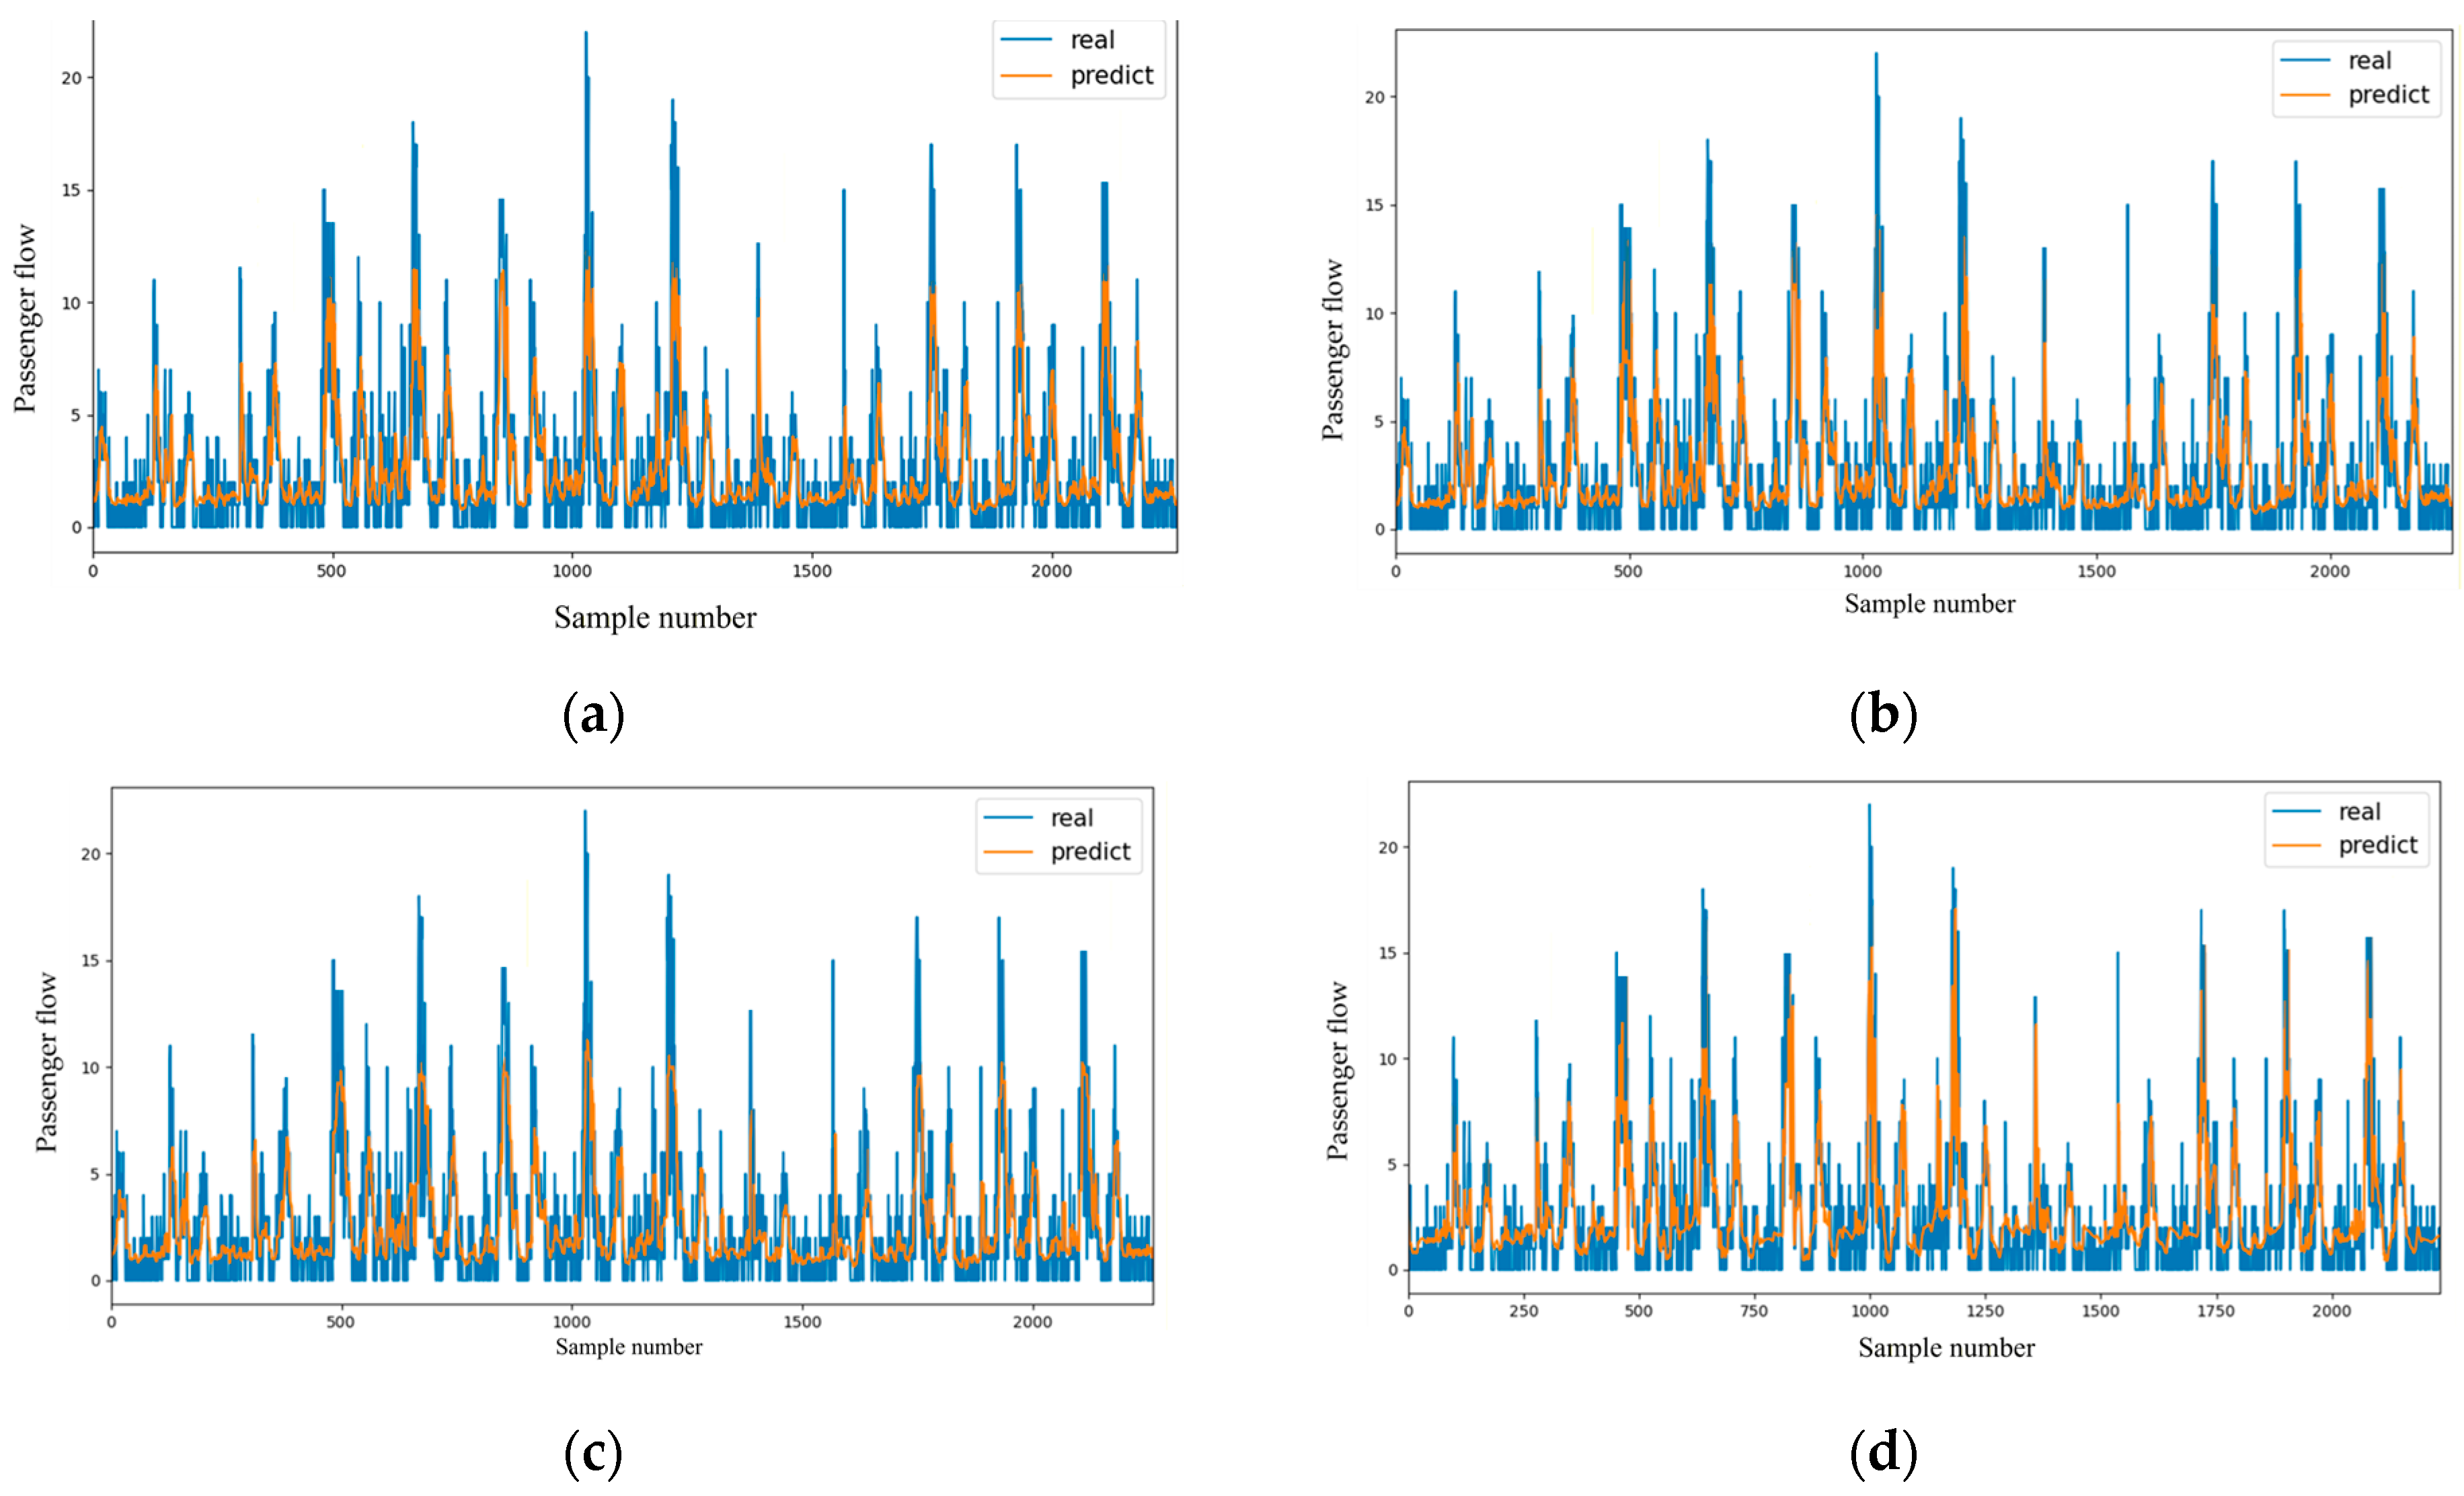
To test the predictive performance of the proposed method and evaluate its effectiveness in bus passenger flow prediction, comparative experiments were conducted. The proposed GAT-Informer model was compared with three representative baseline models: LSTM-Transformer, CNN-GRU, and STGCN. The LSTM-Transformer integrates recurrent gating (LSTM) with self-attention to model temporal dynamics but omits dedicated spatial modeling; the CNN-GRU employs convolutional layers to extract localized spatial patterns among adjacent bus stops before feeding the features into a GRU for sequential dependency learning; the STGCN explicitly encodes station-level spatial topology via graph convolutional networks (GCNs) and couples it with temporal gated convolution, thereby enabling end-to-end spatiotemporal joint modeling. The model performance was evaluated using MAE, MSE and RMSE. Then, Figure 7 presents the prediction results of all models on the testing set, while Table 1 reports the MAE, MSE and RMSE results of the four comparative methods.
Figure 7.
The prediction results of all models on the testing set. (a) LSTM-Transformer; (b) CNN-GRU; (c) STGCN; (d) GAT-Informer.
Table 1.
Prediction errors of different models on testing set.
Figure 7 shows that the prediction results of the proposed method are generally closer to the ground truth compared with the other comparison methods. Moreover, the proposed method achieves good prediction performance in both low-flow and high-flow intervals. LSTM-Transformer shows a noticeable decline in prediction accuracy during peak-demand intervals. CNN-GRU tends to produce larger prediction errors under complex and rapidly changing passenger flow conditions. STGCN shows relatively larger residuals in some periods with significant temporal fluctuations or complex spatial interactions. These results indicate that the proposed method achieves better overall fitting performance than the comparison models.
In Table 1, it can be seen that the proposed GAT-Informer has the lowest MAE, MSE, and RMSE with value of 8.452, 107.35, and 10.361. This indicates that the proposed method obtains the best overall prediction performance among the compared models. In particular, compared with STGCN, which also has spatiotemporal modeling capability, GAT-Informer reduces the prediction error by approximately 20–45%. This result indicates that the spatiotemporal features constructed based on the four types of attributes (line connectivity, spatial proximity, OD correlation, and station functional similarity) can more effectively characterize inter-station passenger flow correlations, thereby improving the prediction performance of the model.
In summary, these results demonstrate that the proposed method is capable of more effectively capturing the spatiotemporal coupling characteristics of bus passenger flow, thereby improving prediction accuracy.
3.4. Ablation Study
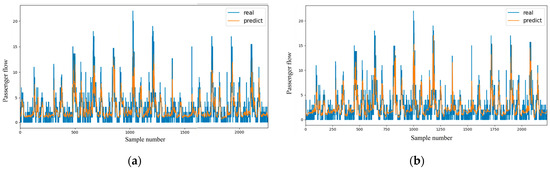
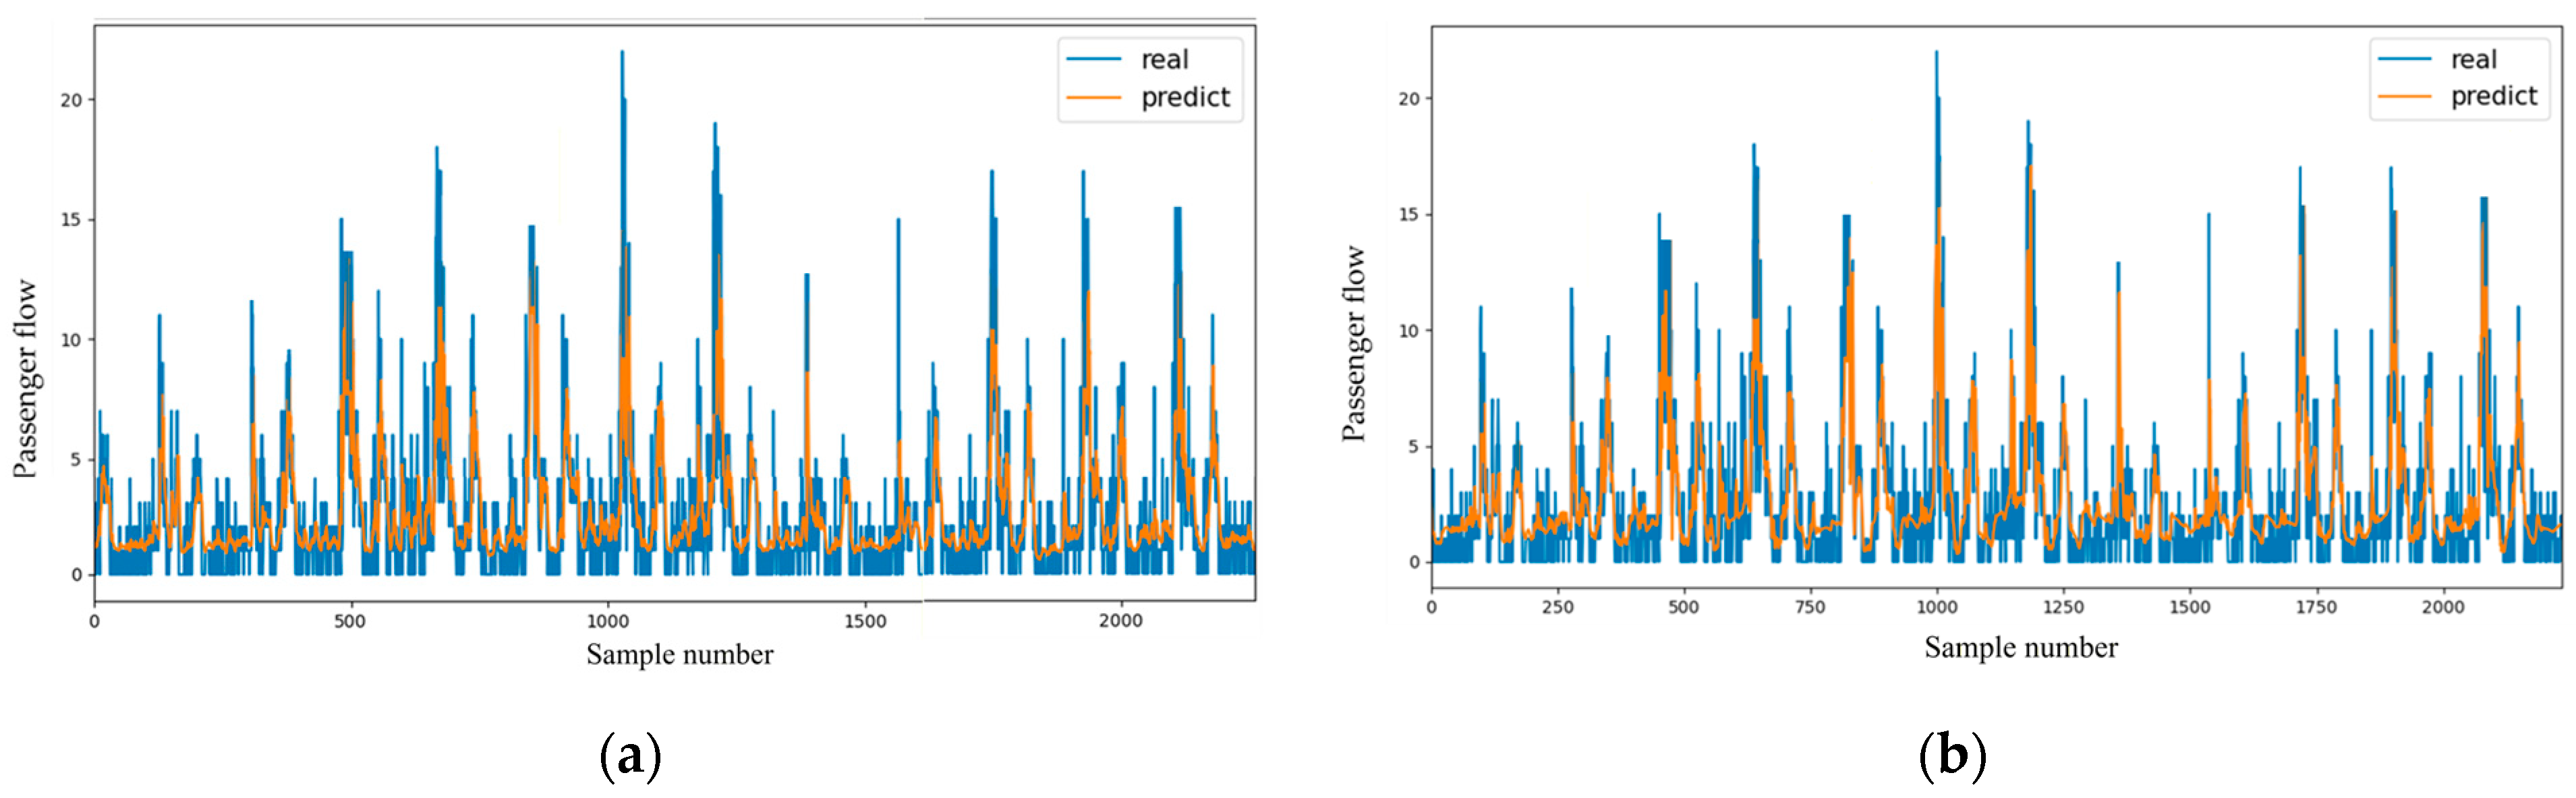
To evaluate the contribution of the graph features and spatial interactions constructed from the four-dimensional station attributes to passenger flow prediction, an ablation experiment was conducted. The original Informer model is used as the baseline, which retains only the temporal feature extraction components, including positional encoding, multi-head probabilistic sparse self-attention, and the distillation operation. It uses the same feature matrix as GAT-Informer as input, but does not incorporate the four-dimensional attribute-based associated node construction process or the corresponding spatial interaction modeling module. Therefore, the baseline model mainly captures long-term temporal dependencies of passenger flow, without explicitly considering spatial correlations between stations. In contrast, the proposed GAT-Informer constructs associated nodes based on line connectivity, spatial proximity, OD correlation, and station functional similarity, thereby introducing graph-based spatial dependency information into the prediction process. By comparing the prediction performance of the two models, this experiment aims to verify whether the four-dimensional attribute-based graph representation can effectively enhance the prediction accuracy of the Informer model. The experimental results on the testing set are shown in Figure 8.
Figure 8.
The prediction results of the two models. (a) Informer; (b) GAT-Informer.
As shown in Figure 8, the GAT-Informer model produces prediction results that are closer to the observed passenger flow than those of the pure Informer model. The improvement is particularly evident during peak and off-peak periods, where passenger flow fluctuates more significantly. In these intervals, the pure Informer model tends to show larger deviations and is less capable of accurately tracking rapid changes in passenger flow. By contrast, GAT-Informer maintains better consistency with the actual trend and shows smaller prediction errors across different flow levels. These results indicate that incorporating spatial interaction information derived from four-dimensional station attributes can improve the model’s ability to characterize complex passenger flow variations and enhance overall prediction performance.
3.5. Scenario Adaptability Evaluation
3.5.1. Analysis Across Different Types of Stations
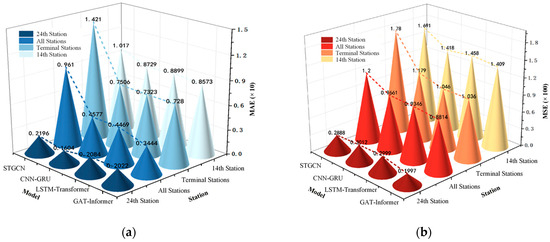
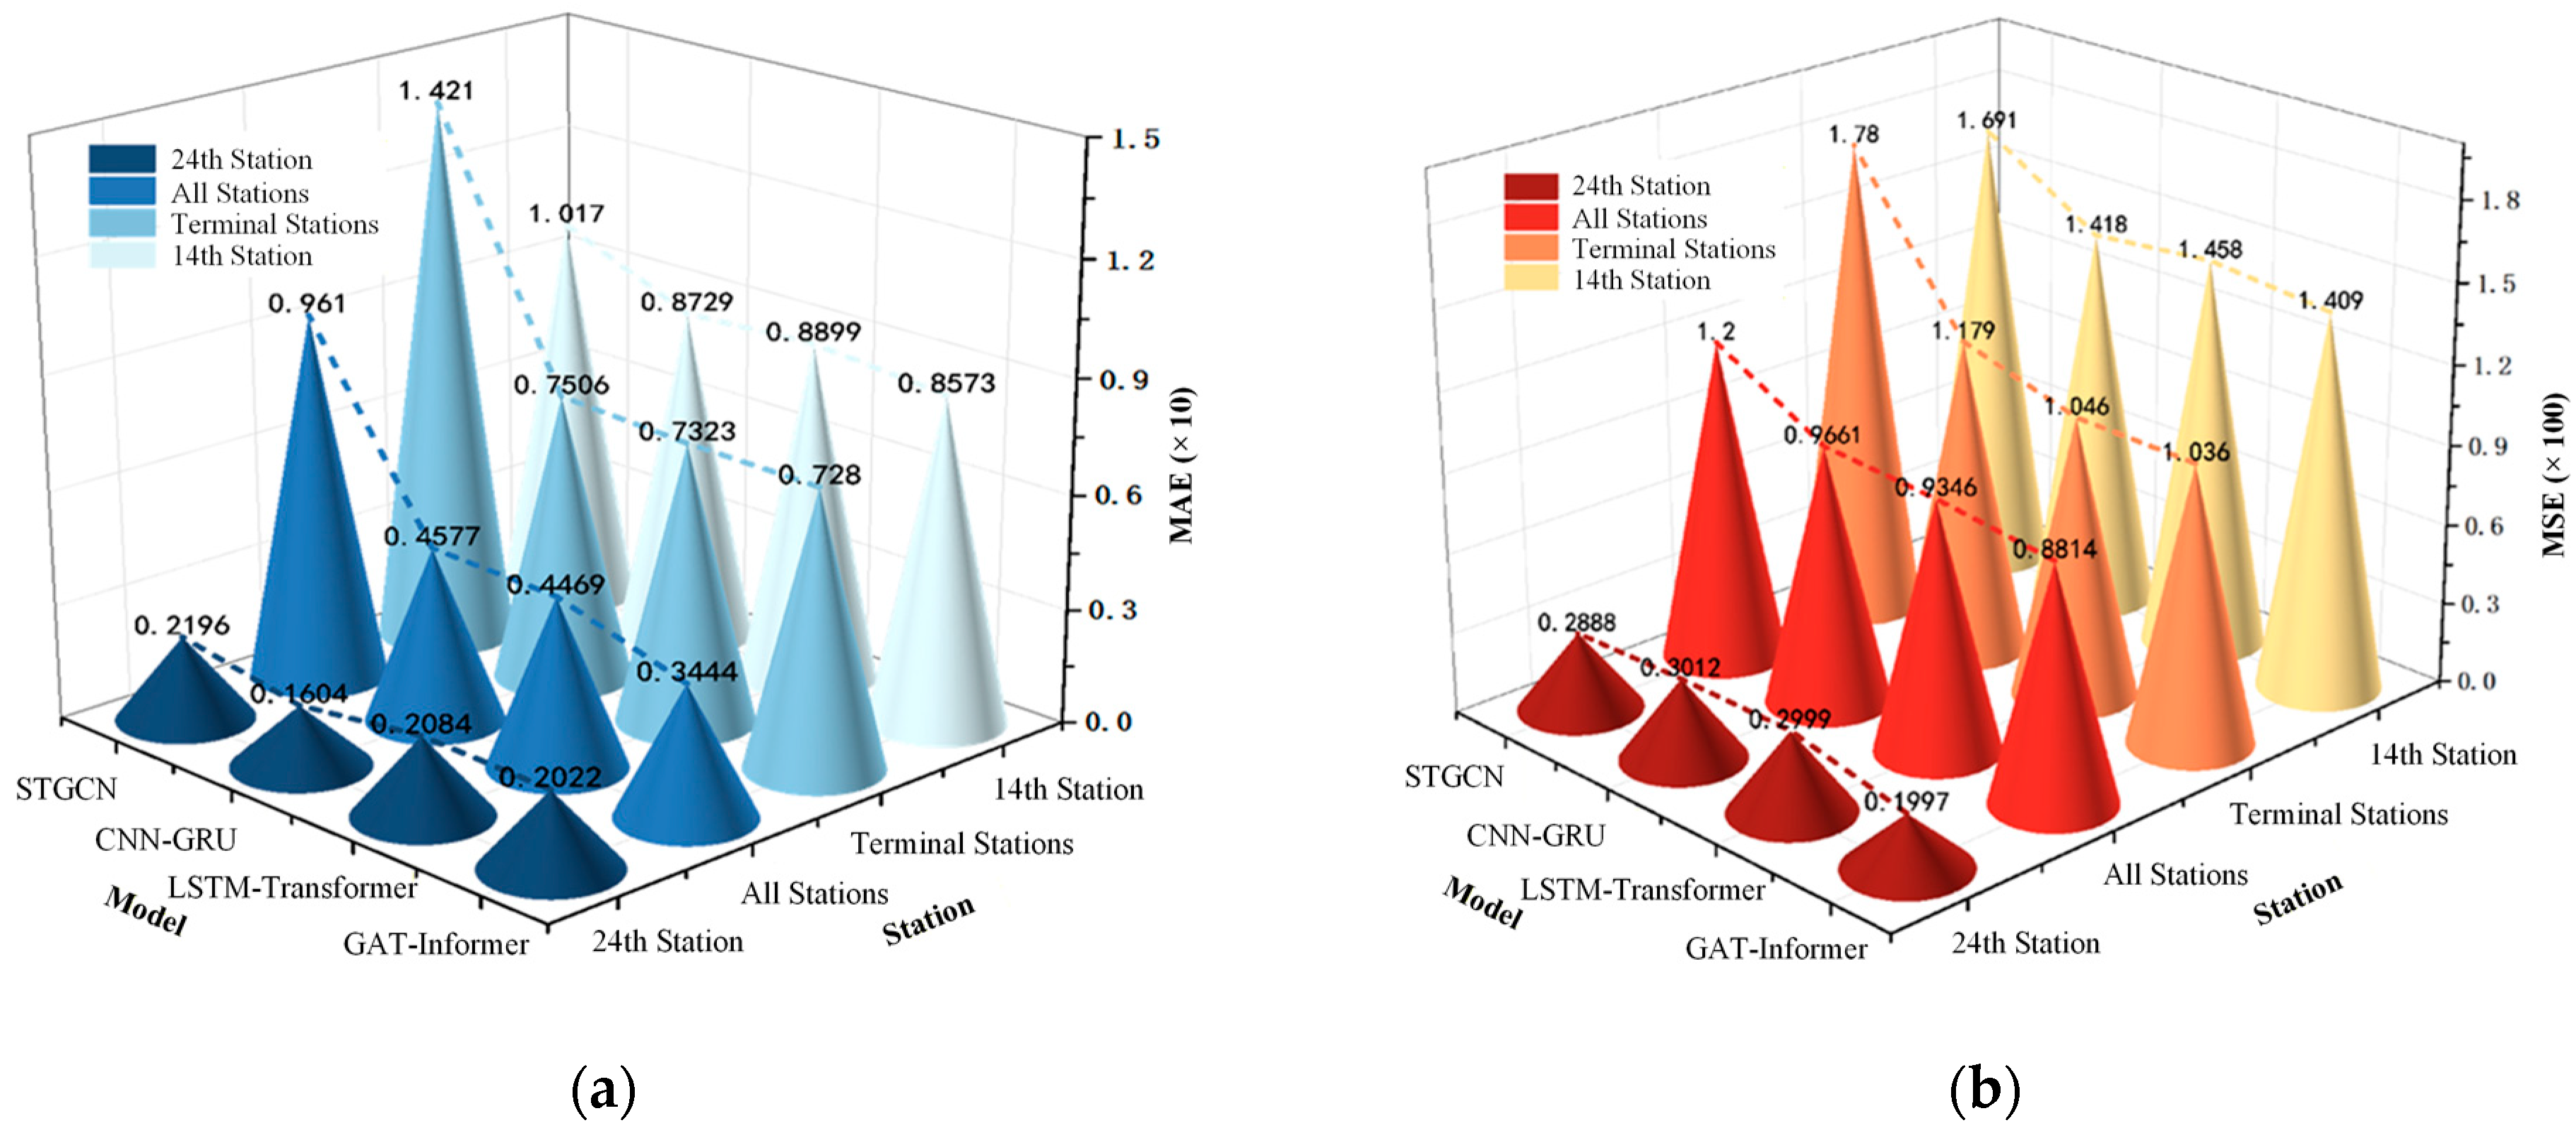
Bus passenger flow patterns vary significantly across different types of stations due to differences in station function, passenger attraction intensity, and boarding/alighting characteristics. Such heterogeneity may lead to scenario-dependent prediction performance. Therefore, to assess the generalization and adaptability of the proposed method to different station types, this study evaluates its prediction performance across various station scenarios and compares it with three baseline models. In the experiment, the 14th station, the 24th station, and the terminal station were selected as representative stations for model testing, while the overall statistical results of all stations were included as a reference. The 14th station, Armed Police Detachment station, is surrounded by various types of enterprises, and its passenger flow shows significant fluctuations. The 24th station, Zumiao Road station, is located near a commercial district, and its passenger flow is relatively stable. The MAE, MSE, and RMSE were used to evaluate the performance of methods on different stations. Table 2 reports the testing results, and Figure 9 visualizes the MAE and MSE values.
Table 2.
Prediction errors of various types of stations under different prediction models.
Figure 9.
MAE and MSE of various stations under different prediction models. (a) MAE; (b) MSE.
As shown in Table 2 and Figure 9, the prediction performance of different models varies across station scenarios, indicating that station-level passenger flow characteristics have an influence on model accuracy. Overall, GAT-Informer achieves lower MAE, MSE, and RMSE values than the three baseline models in most cases, showing better adaptability to different types of stations. For the 24th station, passenger flow is relatively stable, and all models obtain relatively small errors in this scenario. Nevertheless, GAT-Informer still achieves lower prediction errors than the comparison models. For the 14th station, passenger flow shows stronger fluctuations. In this more variable scenario, the errors of the baseline models increase to different extents, while GAT-Informer maintains relatively better prediction performance. For the terminal station, passenger flow is affected by route operation characteristics and concentrated boarding or alighting demand, resulting in more complex flow patterns. Under this scenario, GAT-Informer also achieves competitive or better results compared with the baseline models. The overall results of all stations further show that GAT-Informer obtains lower error values than the comparison models. These results indicate that the proposed method can maintain relatively stable prediction performance under different station scenarios and has better adaptability than the baseline models in bus passenger flow prediction.
3.5.2. Analysis Across Different Time Periods
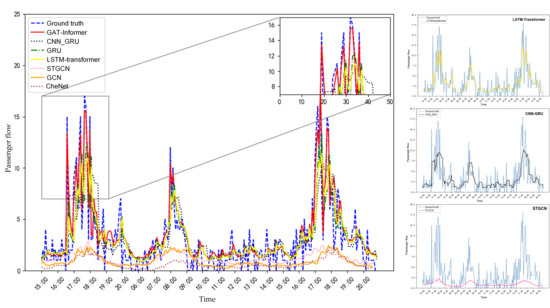
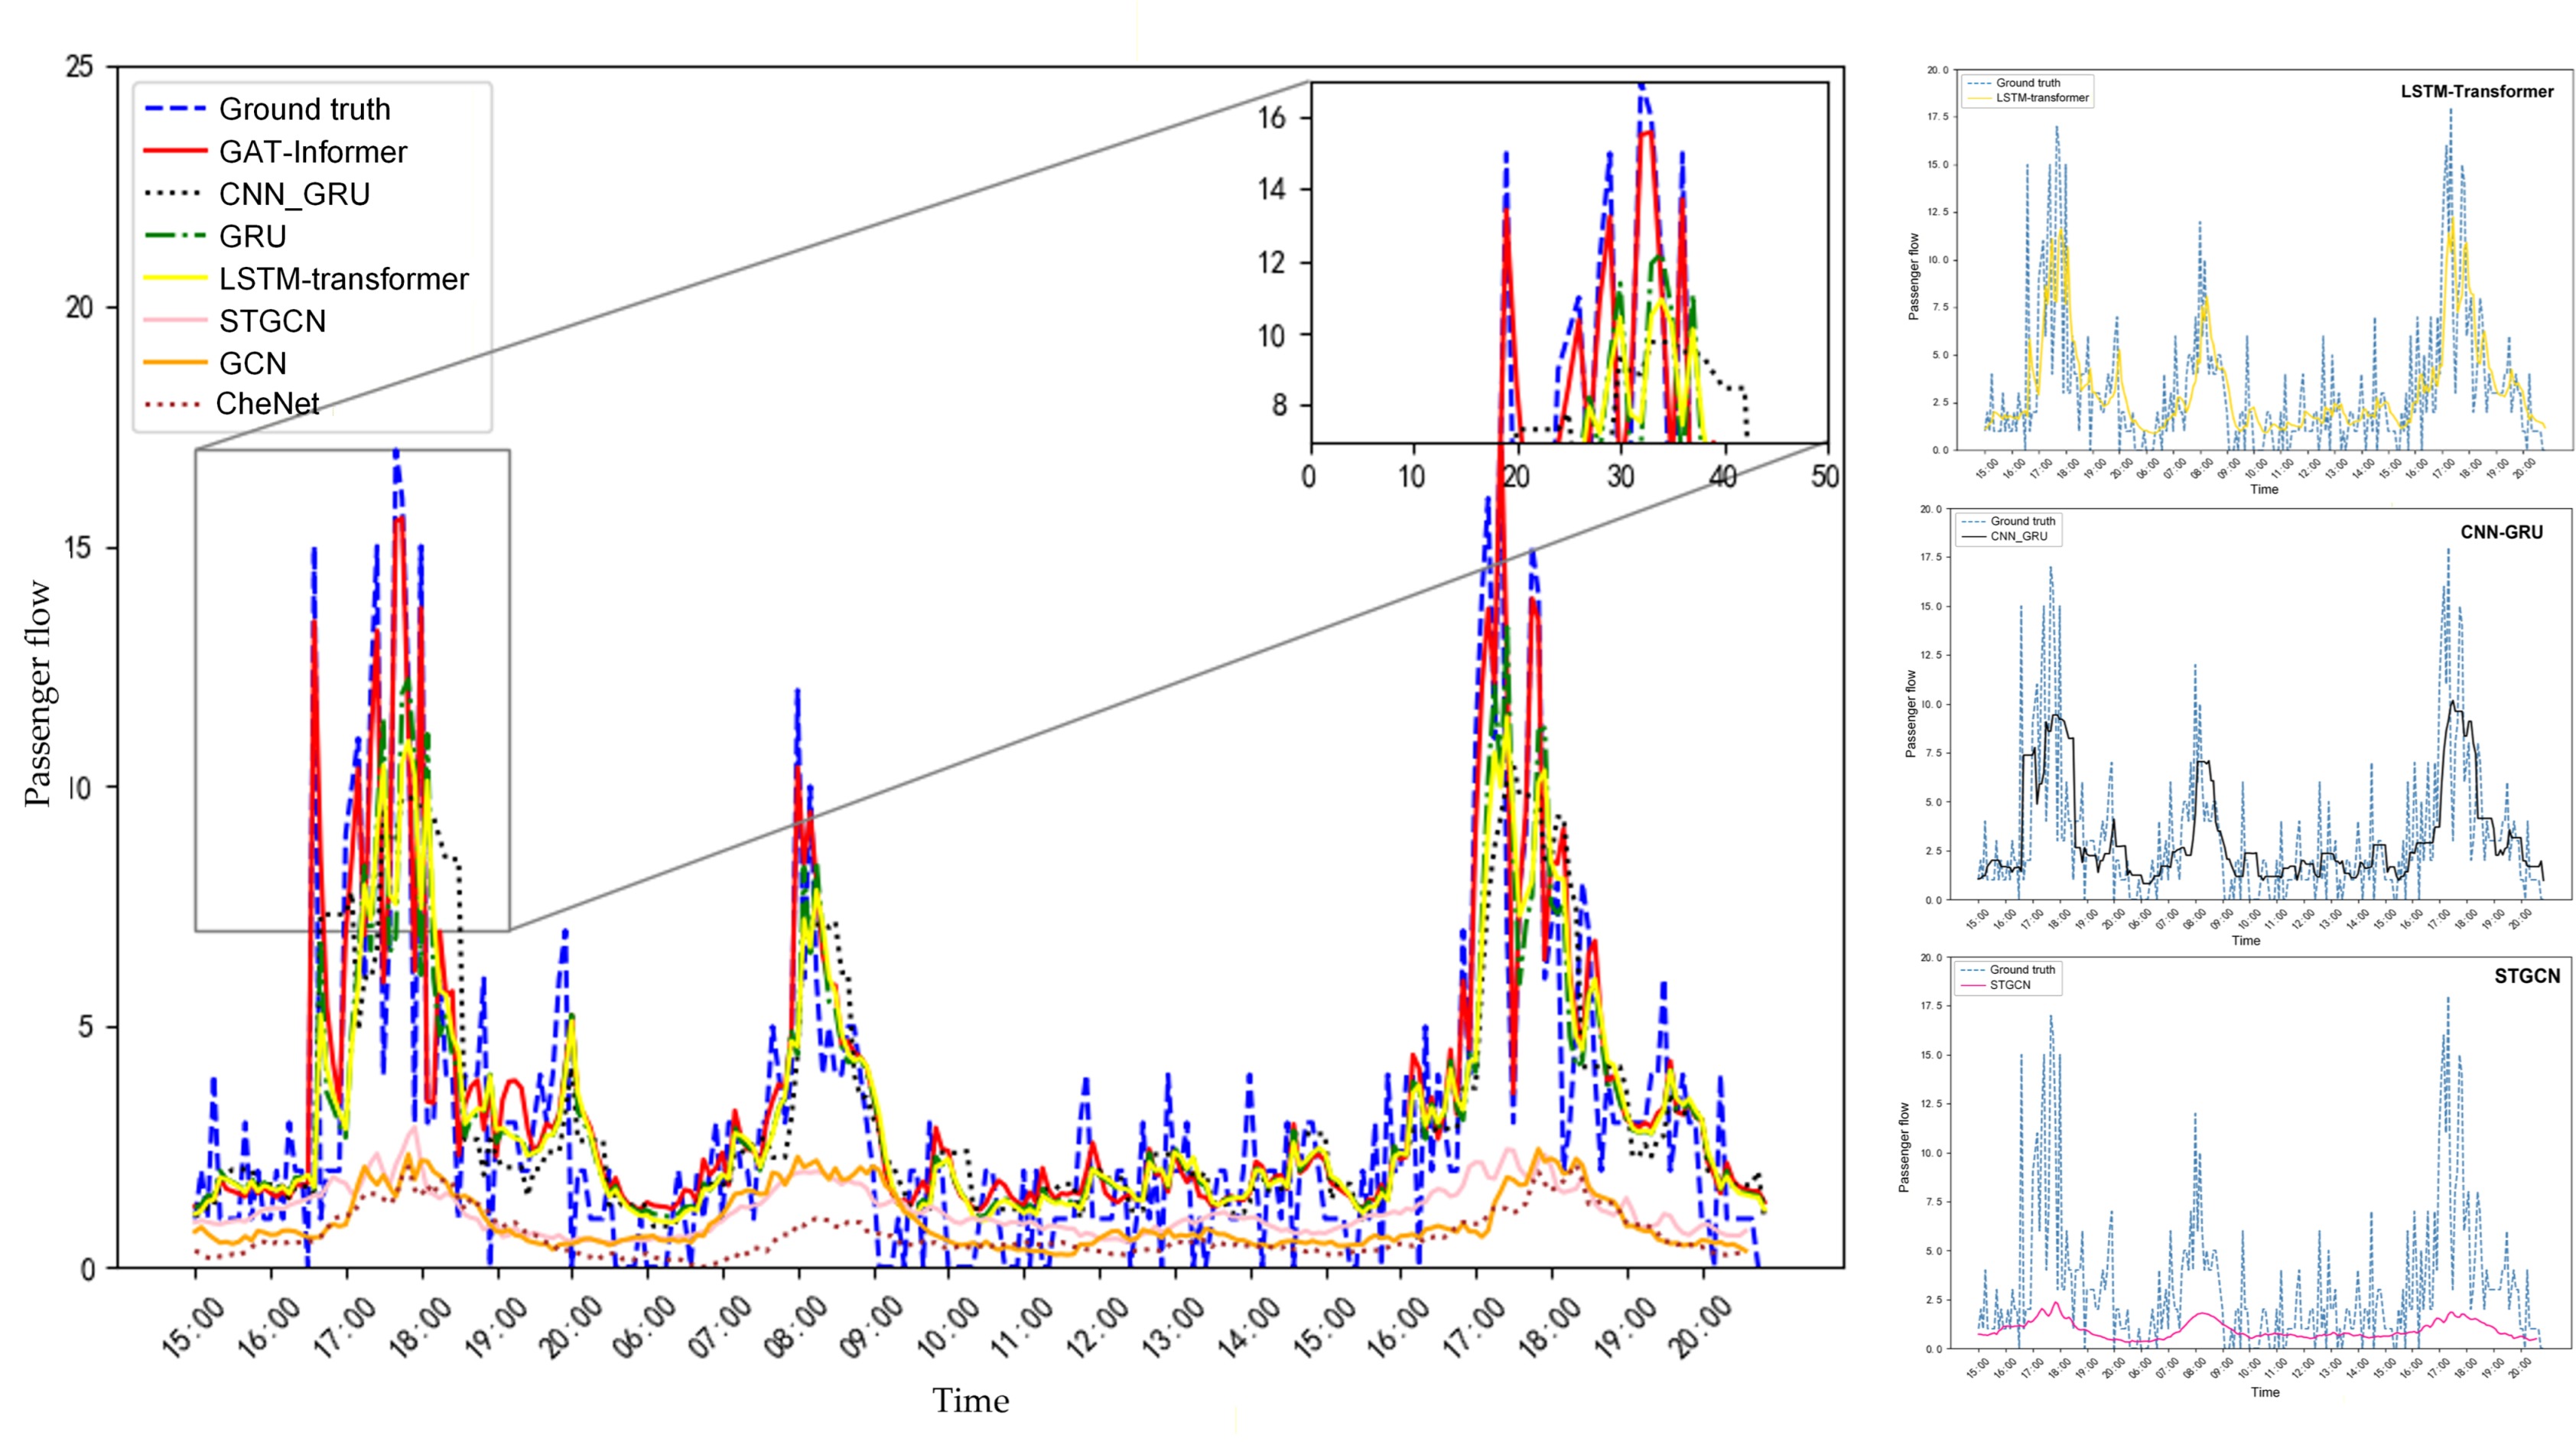
To further evaluate the adaptability of the proposed method under different temporal scenarios, this section analyzes the prediction performance of different models during peak and off-peak periods. In the experiment, a continuous time interval from the test set was selected, and the predicted passenger flow curves of different models were compared with the actual values. According to the temporal distribution characteristics of bus passenger flow, the morning peak period is defined as 07:00–09:00, the evening peak period as 17:00–19:00, and the remaining periods are regarded as flat or low-flow periods, including the daytime off-peak period from 09:00–17:00 and the night low-flow period after 19:00. This experimental setting is used to examine the prediction performance of different models under various temporal conditions, including rapid passenger flow growth, peak fluctuation, and relatively stable low-flow states. In the experiment, the proposed method was compared with the baseline models, and the prediction results of different models during the selected time interval are shown in Figure 10.
Figure 10.
Comparison of prediction curves of different models during the selected time period.
As shown in Figure 10, the prediction curve of GAT-Informer is generally closer to the actual passenger flow curve than those of the comparison models across different time periods. During the morning peak period of 07:00–09:00 and the evening peak period of 17:00–19:00, passenger flow changes more rapidly, leading to higher prediction difficulty. In these periods, GAT-Informer better captures the rising and falling trends of passenger flow and shows smaller deviations around peak values. During the daytime off-peak period of 09:00–17:00 and the night low-flow period after 19:00, passenger flow is relatively stable, and the proposed model also maintains good fitting performance. In contrast, the baseline models show different degrees of deviation in some intervals, particularly near the transition between off-peak and peak periods, where prediction lag or peak smoothing can be observed. Moreover, in the selected time interval, the coefficient of determination R2 between the predicted and actual values of GAT-Informer reaches 0.901, indicating a high consistency between the predicted results and the observed passenger flow. Overall, the results suggest that GAT-Informer maintains relatively stable prediction performance across morning peak, evening peak, and off-peak periods, demonstrating better temporal scenario adaptability than the baseline models.
4. Conclusions
To address the limitations of existing bus passenger flow prediction models in capturing complex spatiotemporal dependencies, this paper proposes a GAT-Informer model that integrates four-dimensional station association modeling, graph attention-based spatial feature extraction, and Informer-based long-term temporal prediction. The main innovation of this study lies in constructing associated nodes from four complementary attributes—line connectivity, spatial proximity, OD correlation, and station functional similarity—so as to better describe the interaction relationships among bus stations. Based on this graph representation, GAT is used to adaptively learn spatial influence weights, while Informer is employed to capture long-term temporal dependencies and periodic passenger flow variations. Experiments were conducted using real-world bus passenger flow data from Foshan City, including comparative experiments, ablation analysis, and scenario adaptability evaluation. The results show that GAT-Informer achieves lower MAE, MSE, and RMSE values than LSTM-Transformer, CNN-GRU, and STGCN, indicating better overall prediction accuracy. The ablation experiment further verifies that the graph features constructed from the four-dimensional station attributes contribute to improving the prediction performance of Informer. In addition, scenario tests across different station types and time periods demonstrate that the proposed model maintains relatively stable performance under both stable and fluctuating passenger flow conditions, as well as during morning peak, evening peak, and off-peak periods. Overall, the proposed GAT-Informer model effectively integrates attribute-driven spatial relationship modeling and efficient long-sequence temporal learning, providing a feasible approach for improving short-term bus passenger flow prediction. Future work will further expand the dataset, incorporate more external influencing factors, and improve the real-time computing capability of the model to better support bus dispatching and operational decision-making.
Author Contributions
Conceptualization, Y.M.; methodology, Y.M. and M.W.; software, Y.M., M.W. and X.Q.; validation, Y.M. and M.W.; formal analysis, M.W.; investigation, Y.M., M.W., W.Z., H.J., X.Q. and J.C.; resources, Y.M., H.J., L.D. and J.C.; data curation, Y.M.; writing—original draft preparation, Y.M. and M.W.; writing—review and editing, Y.M., M.W. and X.Q.; visualization, Y.M., M.W., X.Q. and L.D.; supervision, W.Z., H.J. and L.D.; project administration, H.J.; funding acquisition, Y.M., W.Z. and H.J. All authors have read and agreed to the published version of the manuscript.
Funding
This research was funded by Special Fund Project for Basic Scientific Research Operating Expenses of Central-Level Public Welfare Research Institutes, grant number 2025-9039.
Data Availability Statement
Restrictions apply to the availability of these data. Data are available from the corresponding author upon reasonable request.
Conflicts of Interest
Author Mingyang Wang was employed by the company Beijing Jingdong Century Trading Co., Ltd. The remaining authors declare that the research was conducted in the absence of any commercial or financial relationships that could be construed as a potential conflict of interest.
Abbreviations
The following abbreviations are used in this manuscript:
| LSTM-Transformer | Long Short-Term Memory-Transformer |
| CNN-GRU | Convolutional Neural Network-Gated Recurrent Unit |
| STGCN | Spatial-Temporal Graph Convolutional Network |
| GAT-Informer | Graph Attention Network-Informer |
References
- Wang, Y.; Chen, Q.X.; Zhang, N.; Feng, C.; Teng, F.; Sun, M.Y.; Kang, C.Q. Fusion of the 5G communication and the ubiquitous electric Internet of Things: Application analysis and research prospects. Power Syst. Technol. 2019, 43, 1575–1585. [Google Scholar]
- Rahimi, M.R.; Venkatasubramanian, N.; Mehrotra, S.; Vasilakos, A.V. On optimal and fair service allocation in mobile cloud computing. IEEE Trans. Cloud Comput. 2018, 6, 815–828. [Google Scholar] [CrossRef] [Scilit]
- Kong, X.; Tong, S.; Gao, H.; Shen, G.; Wang, K.; Collotta, M.; You, I.; Das, S.K. Mobile edge cooperation optimization for wearable Internet of Things: A network representation-based framework. IEEE Trans. Ind. Informat. 2021, 17, 5050–5058. [Google Scholar] [CrossRef] [Scilit]
- Ministry of Transport of the People’s Republic of China. National Urban Passenger Transport Volume in 2025. Available online: https://xxgk.mot.gov.cn/jigou/zhghs/202601/t20260130_4199408.html (accessed on 27 May 2026).
- Lättman, K.; Otsuka, N. Sustainable development of urban mobility through active travel and public transport. Sustainability 2024, 16, 534. [Google Scholar] [CrossRef] [Scilit]
- Lee, E.H.; Moon, S.; Cho, S.H.; Lee, H. Passenger to Train Assignment Using Only Smart Card Data. Transp. Res. Rec. 2026, 03611981251407915. [Google Scholar] [CrossRef] [Scilit]
- Yeh, C.-J.; Yen, B.T.H.; Mulley, C. Unveiling the impact of bus network design on route choice: An empirical review from smartcard data. Transp. Policy 2026, 183, 104121. [Google Scholar] [CrossRef] [Scilit]
- Gan, M.; Cheng, Y.; Liu, K.; Zhang, G.L. Seasonal and trend time series forecasting based on a quasi-linear autoregressive model. Appl. Soft Comput. 2014, 24, 13–18. [Google Scholar] [CrossRef] [Scilit]
- Liu, L.; Chen, R.-C. A novel passenger flow prediction model using deep learning methods. Transp. Res. Part C Emerg. Technol. 2017, 84, 74–91. [Google Scholar] [CrossRef] [Scilit]
- Du, B.; Peng, H.; Wang, S.; Alam Bhuiyan, Z.; Wang, L.; Gong, Q.; Liu, L.; Li, J. Deep irregular convolutional residual lstm for urban traffic passenger flows prediction. IEEE Trans. Intell. Transp. Syst. 2020, 21, 972–985. [Google Scholar] [CrossRef] [Scilit]
- Liu, X.; Huang, X.; Xie, B. A model of short-term forecast of passenger flow of buses based on SVM-KNN under rainy conditions. J. Transp. Inf. Saf. 2018, 36, 117–123. [Google Scholar]
- Ma, X.; Zhang, J.; Du, B. Parallel Architecture of Convolutional Bi-Directional LSTM Neural Networks for Network-Wide Metro Ridership Prediction. IEEE Trans. Intell. Transp. Syst. 2018, 20, 2278–2288. [Google Scholar] [CrossRef] [Scilit]
- Hao, S.; Lee, D.H.; Zhao, D. Sequence to sequence learning with attention mechanism for short-term passenger flow prediction in large-scale metro system. Transp. Res. Part C Emerg. Technol. 2019, 107, 287–300. [Google Scholar] [CrossRef] [Scilit]
- Liu, Y.; Liu, Z.; Jia, R. A deep learning based architecture for metro passenger flow prediction. Transp. Res. Part C Emerg. Technol. 2019, 101, 18–34. [Google Scholar] [CrossRef] [Scilit]
- Zhao, L.; Song, Y.; Zhang, C. T-GCN: A Temporal Graph Convolutional Network for Traffic Prediction. IEEE Trans. Intell. Transp. Syst. 2020, 21, 3848–3858. [Google Scholar] [CrossRef] [Scilit]
- Zhang, J.; Chen, F.; Cui, Z.; Guo, Y.; Zhu, Y. Deep Learning Architecture for Short-Term Passenger Flow Forecasting in Urban Rail Transit. IEEE Trans. Intell. Transp. Syst. 2021, 22, 7004–7014. [Google Scholar] [CrossRef] [Scilit]
- Bao, J.; Kang, J.; Yang, Z.; Chen, X. Forecasting network-wide multi-step metro ridership with an attention weighted multi-view graph to sequence learning approach. Expert Syst. Appl. 2022, 210, 118475. [Google Scholar] [CrossRef] [Scilit]
- Liu, L.; Chen, J.; Wu, H.; Zhen, J.; Li, G.; Lin, L. Physical-virtual collaboration modeling for intra-and inter-station metro ridership prediction. IEEE Trans. Intell. Transp. Syst. 2020, 23, 3377–3391. [Google Scholar] [CrossRef] [Scilit]
- Shen, G.; Han, X.; Chin, K.; Kong, X. An attention-based digraph convolution network enabled framework for congestion recognition in three-dimensional road networks. IEEE Trans. Intell. Transp. Syst. 2022, 23, 14413–14426. [Google Scholar] [CrossRef] [Scilit]
- Velickovic, P.; Cucurull, G.; Casanova, A.; Romero, A.; Lio, P.; Bengio, Y. Graph attention networks. In Proceedings of the International Conference on Learning Representations, Vancouver, BC, Canada, 30 April–3 May 2018. [Google Scholar]
- Li, S.; Jin, X.; Xuan, Y.; Zhou, X.; Chen, W.; Wang, Y.X.; Yan, X. Enhancing the locality and breaking the memory bottleneck of transformer on time series forecasting. Adv. Neural Inf. Process. Syst. 2019, 32, 5244. [Google Scholar]
- Kitaev, N.; Kaiser, Ł.; Levskaya, A. Reformer: The efficient transformer. arXiv 2020, arXiv:2001.04451. [Google Scholar] [CrossRef] [Scilit]
- Wu, H.; Xu, J.; Wang, J.; Long, M. AutoFormer: Decomposition transformers with auto-correlation for long-term series forecasting. Adv. Neural Inf. Process. Syst. 2021, 34, 22419–22430. [Google Scholar]
- Peng, H.; Zhan, M.; Wang, Y.; Liu, Z.; Sun, C. Informer-GAT-Based Fault Identification for Distribution Lines. In Proceedings of the 2025 IEEE International Conference on Smart Power and Energy Technologies (SPET), Wuhan, China, 19–20 September 2025. [Google Scholar]
- Zhou, H.; Zhang, S.; Peng, J.; Zhang, S.; Li, J.; Xiong, H.; Zhang, W. Beyond efficient transformer for long sequence time-series forecasting. arXiv 2021, arXiv:2012.07436. [Google Scholar] [CrossRef] [Scilit]

Disclaimer/Publisher’s Note: The statements, opinions and data contained in all publications are solely those of the individual author(s) and contributor(s) and not of MDPI and/or the editor(s). MDPI and/or the editor(s) disclaim responsibility for any injury to people or property resulting from any ideas, methods, instructions or products referred to in the content. |
© 2026 by the authors. Licensee MDPI, Basel, Switzerland. This article is an open access article distributed under the terms and conditions of the Creative Commons Attribution (CC BY) license.