Skip to Content
  • Article
  • Open Access

27 May 2026

Influence of Spool Impact on Preloaded Threaded Plugs in Hydraulic Valves


,
,
and
1
Faculty of Mechanical Engineering, University of Ljubljana, 1000 Ljubljana, Slovenia
2
Poclain Hydraulics d.o.o., 4226 Žiri, Slovenia
*
Author to whom correspondence should be addressed.
This article belongs to the Section Mechanical Engineering

Abstract

Preloaded threaded plugs that limit axial movement of spools in hydraulic valves are repeatedly loaded by spool impacts, which affects their fatigue strength. For proper dimensioning of these plugs, their loadings must be known. The aims of the study are to: (a) determine the spool impact force ( F i m p a c t ) on the plug head, (b) determine its influence on the force in the plug neck (FIPN) and (c) give design recommendations and practical considerations for plug–valve connections. Modified versions of the plugs were produced and equipped with strain gauges. The plugs were tightened into valves and loaded with spool impacts at three different pilot pressures. Meanwhile, F i m p a c t , FIPN, pilot pressure, and spool displacement were measured. As the FIPN was measured in the modified plug–valve connections, which had different stiffnesses from the original connections, the FIPN in the original plug–valve connections was calculated by considering the stiffness ratios of the original connections obtained from finite element analyses. The results show that the spool impact force and the resulting additional FIPN increase linearly with pilot pressure. To achieve smaller amplitudes of the FIPN and, consequently, higher fatigue strength, the tensioned parts of the plugs should have lower stiffness and the clamping parts higher stiffness.

1. Introduction

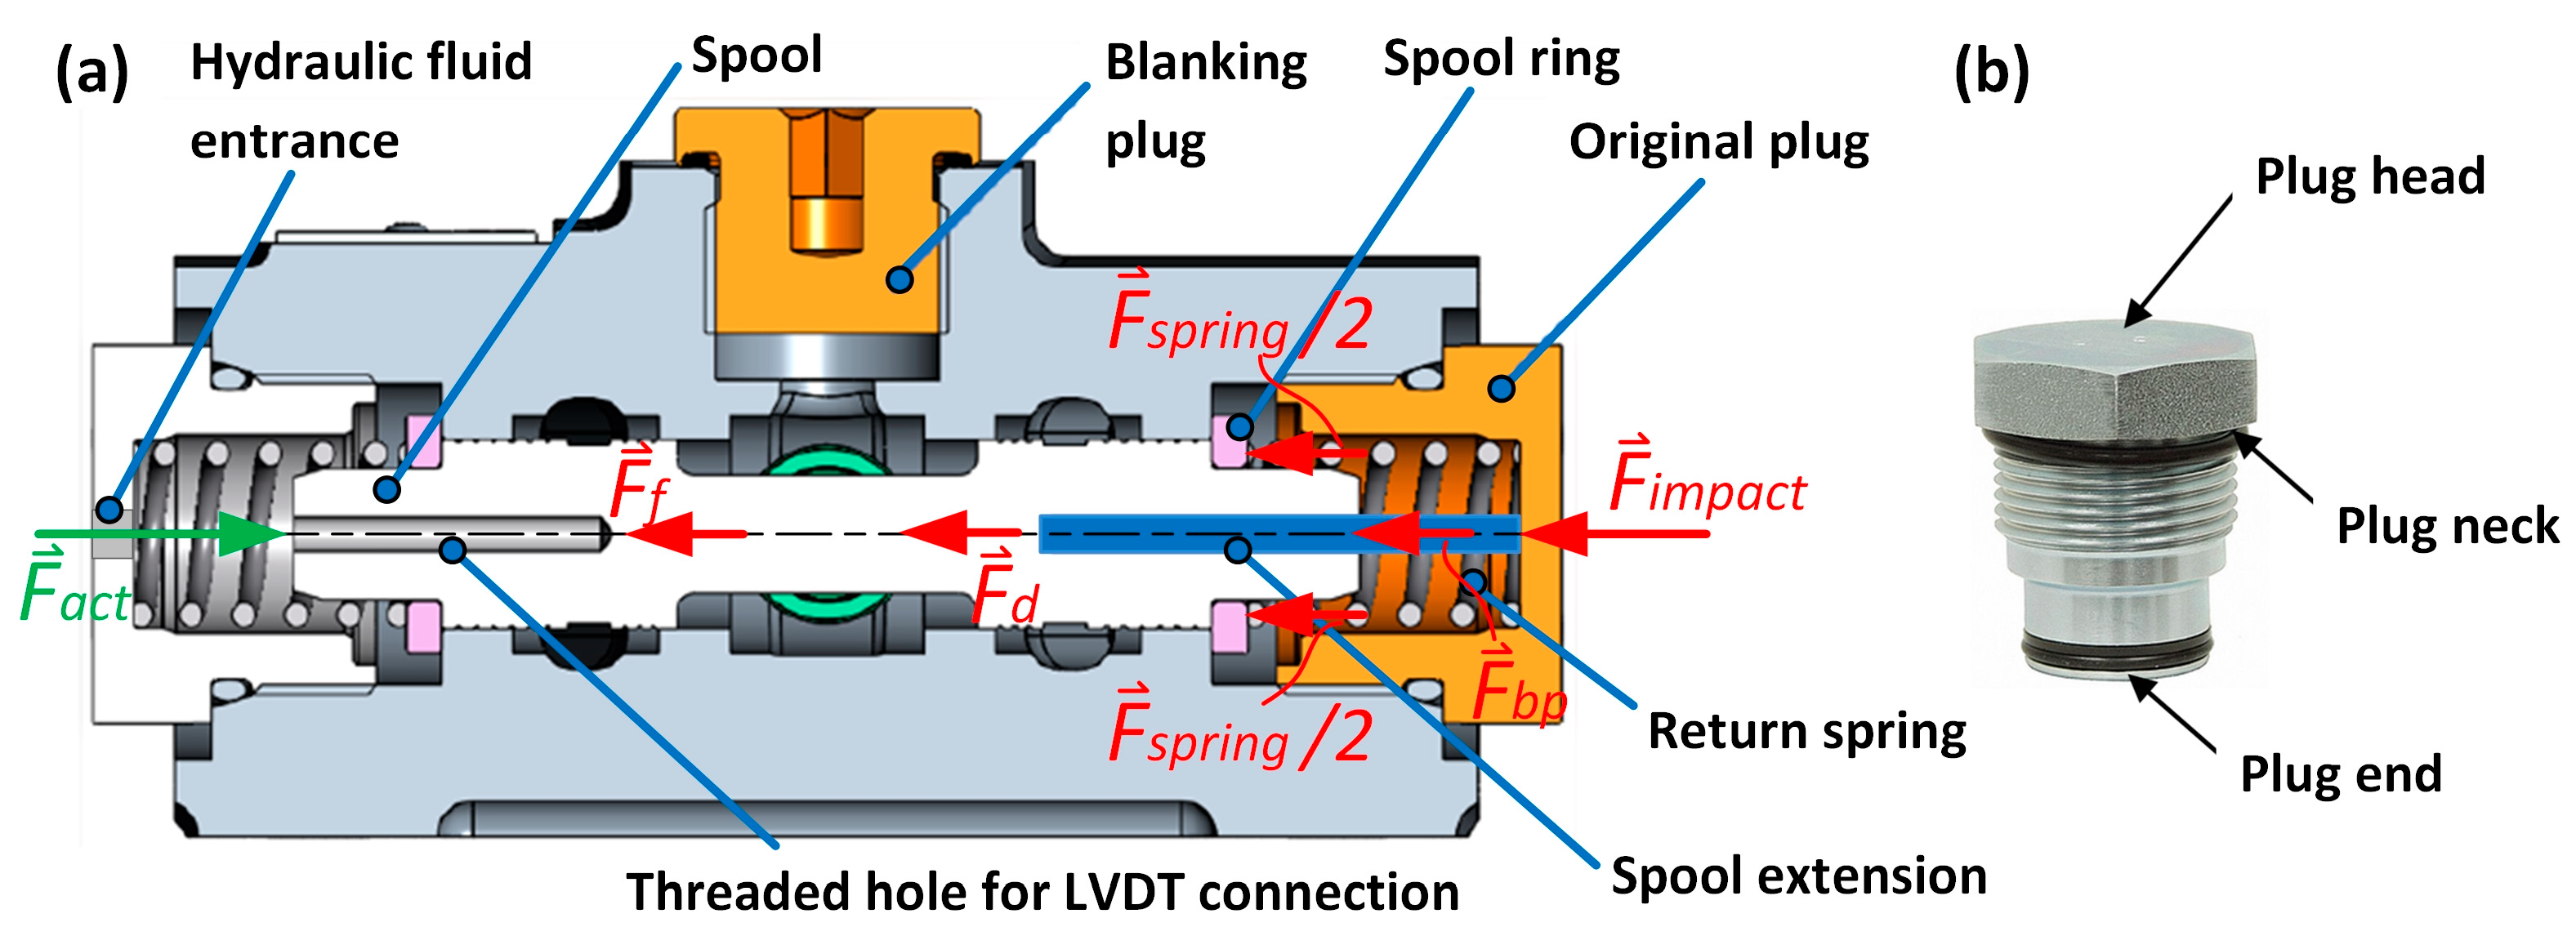
In hydraulics, threaded plugs are used to close various manufacturing holes and fluid channels, thereby preventing external leakage [1]. To ensure sufficient sealing force, the plugs must be preloaded (also prestressed or pre-tightened) in a manner analogous to bolts in preloaded bolted connections. In addition to their sealing function, some plugs also limit the axial movement of spools in hydraulic valves. This limitation is most commonly implemented by a return spring (Figure 1a), which returns the spool to its initial position when the pilot pressure decreases. During spool motion, the return spring contributes to spool deceleration and thus reduces the impact force acting on the plug. In some valve designs, the spool impact force is transmitted to the plug head (Figure 1b) through the return spring and by direct spool contact with the plug head, which can sometimes be achieved by a spool extension (Figure 1a). In some valves, the spool impact force is transmitted via a spool ring or a washer (Figure 1a) to the plug end (Figure 1b).
Figure 1. (a) Longitudinal cross-section of a directional control valve with annotated components and forces acting during spool impact on the plug head: F a c t … actuator force; F f … friction force between the spool and the valve housing; F s p r i n g … spring force; F d … hydraulic drag; F i m p a c t … impact force; F b p … back-pressure force. (b) Threaded plug with annotated parts.
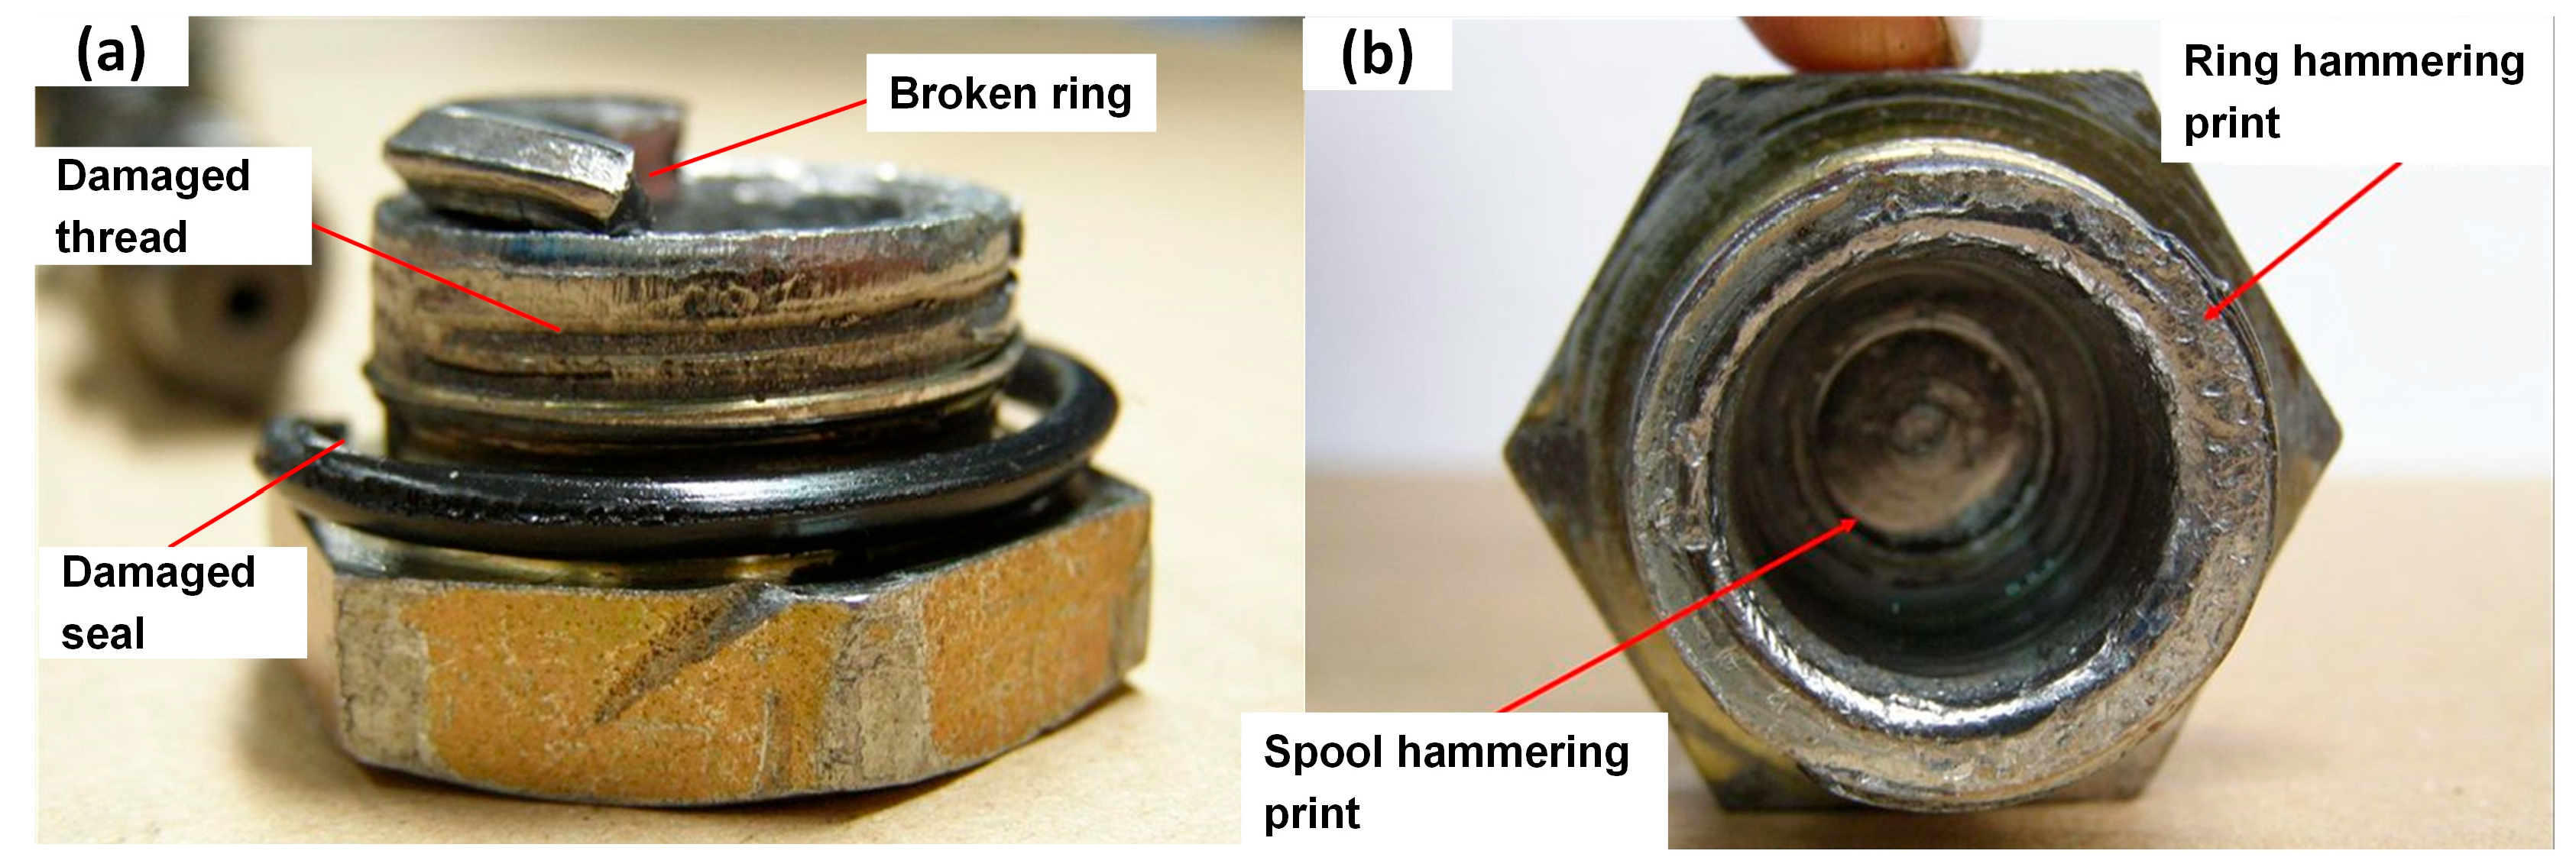
Hydraulic valves are frequently installed in applications where repeated switching occurs, resulting in frequent spool impacts against the plugs. Due to the high momentum of the spool and its short stopping distance—which, when neglecting the spring deformation, is represented solely by the axial deformation of the plug—the resulting impact forces can reach high peak values. If these force peaks are too high, fatigue damage of the plug–valve connection (Figure 2) and leakage of the valve can appear over time. Therefore, for proper dimensioning of the plug–valve connections, these impact forces must be known in addition to the preload and tightening torque.
Figure 2. Fatigue failure due to spool impact of an M27 × 1.5 threaded plug. (a) Front view and (b) bottom view.
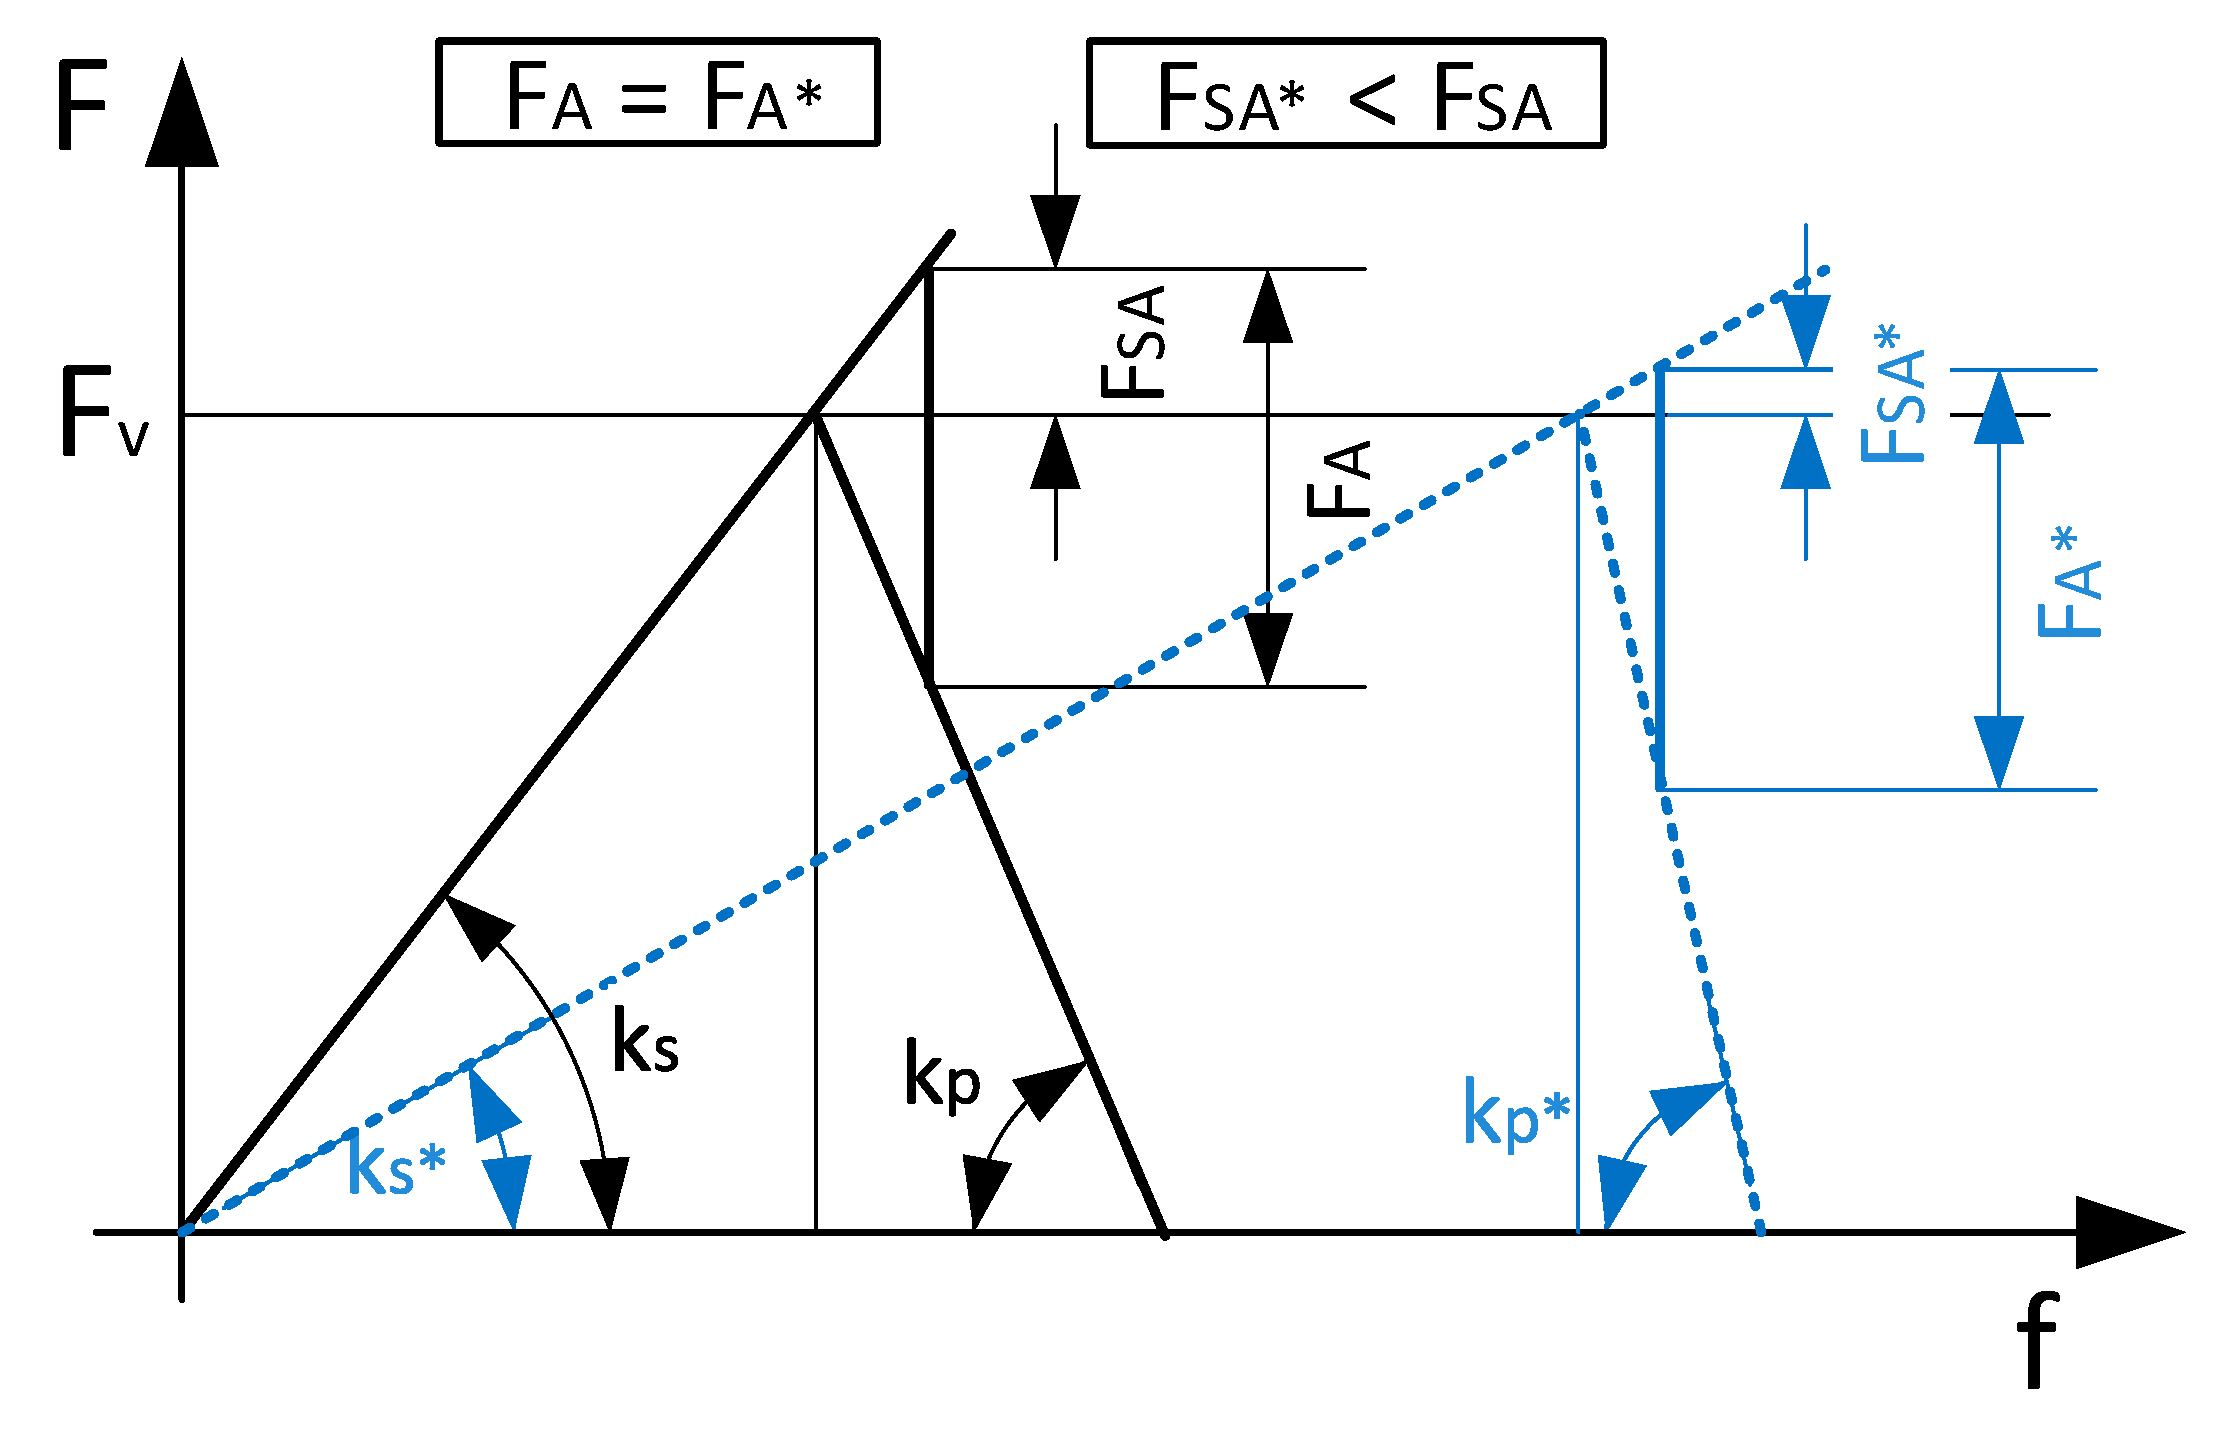
Although threaded plugs that limit the spool movement in valves are generally hollow, they may be treated as preloaded bolts [2,3,4]. The forces acting on a preloaded bolted connection loaded by an external load F A are depicted in Figure 3 (black lines). Since F A is distributed on the bolt and the clamping parts, the load increase F S A in the bolt is smaller in preloaded bolts than in non-preloaded bolts, where the load increase in the bolt equals F A . According to Wöhler stress-cycle curves [5], the stress range, which is proportional to F S A , typically governs fatigue life more strongly than the number of cycles or peak stress. Because the stress range in preloaded bolted connections is smaller than in non-preloaded connections (at the same external load F A ), preloaded connections generally have higher fatigue strength [6,7,8,9].
Figure 3. Force–deflection (F-f) diagrams of two bolted connections preloaded to the same preload F V . (1) Bolted connection with bolt stiffness k S and stiffness of the clamping parts k p (black lines), and (2) bolted connection with bolt stiffness k s * <   k S and stiffness of the clamping parts k p * >   k p (blue dashed lines). If the same external tensile load F A = F A * is applied to both connections, the force in the bolted connection 1 increases by an additional load F S A , while the force in the bolt in the bolted connection 2 increases by a smaller additional load F S A * < F S A .
In the presence of high repetitive external loads F A , the dimensioning of threaded plugs becomes challenging, since, on the one hand, the plugs must be sufficiently compliant to limit the additional load increase F S A induced by F A (Figure 3), while on the other hand, they must exhibit adequate fatigue strength, which inherently reduces compliance. Furthermore, the plugs must ensure sufficient clamping force and must not be prone to self-loosening [10].
Plugs are usually preloaded to approximately 0.7–0.9 of their yield stress [11], although classical design practice for bolts is to preload them in the range of 0.5–0.75 of their yield stress [12], while Motosh [13] suggests to preload bolts to their plastic limit. According to [4,14], incorrect preload at initial assembly is the main cause of common problems with bolted joints, resulting in decreased clamping force and joint failure.
On the basis of a simple spring–mass model, Duffey [15] found an analytical solution for the case of an initially peaked, exponentially decaying internal pressure pulse acting on a closure, and provided optimal preload values that minimize peak bolt stress in certain cases. These preload values present a small fraction of classical values, while for closures where sealing is a consideration, higher preloads are suggested.
Many studies have investigated the influence of bolt preload on fatigue strength [6,8,9], supporting the finding that higher preload increases fatigue strength. E.g., Kraemer et al. [8] investigated the influence of the length of thread engagement, nut thread type, and nut material on the fatigue properties of steel screws, and found that fatigue strength significantly depends on load distribution resulting from the varied parameters and the applied preload. They found that an over-elastic preload of the screw–nut connection leads to significantly higher load capacity due to homogenization of load introduction and load-induced compressive residual stresses at the thread root. Chapman et al. [6] measured the static and dynamic strength of preloaded bolts. They showed that all bolts behaved elastically when external loads were applied, even when the fastener was tightened to its torque-tension yield point. Kashyzadeh et al. [16] investigated the most common causes of failures related to the installation of the bolted connections, including preload value, improper torque application, and lack of a locking system. Feng et al. [17] performed fatigue tests on L-shaped component connections to assess bolt fatigue performance and provided stress-cycle curves. All fatigue failures occurred at the root of the first-engaged thread or within the thread engagement region, with preload decay exceeding 30% prior to fracture.
Some studies have focused on load propagation in preloaded bolted connections. For example, Feghhi [18] investigated shock propagation in bolted structures and discussed several error-analysis techniques for comparing time-domain response signals; he reported that bolted joints can reduce the maximum acceleration amplitude by a factor of three, and that using a washer and a bolt made of a lower-stiffness material can reduce shock by up to 40%. Somasundaram et al. [19] developed a numerical–experimental methodology for predicting impact shock transmission through a preloaded bolted joint and validated the approach experimentally. More recently, Zhang et al. [20] examined the dynamic behaviour of a preloaded bolt-group system under impact loading using drop-hammer experiments and numerical simulations. Amir et al. [21] studied the influence of thread geometry on stress-wave propagation through threads under impact loads using combined experimental and numerical methods.
Other studies investigated the loosening behaviour of preloaded bolts [9,10,22,23,24,25] in dependence from preload, friction coefficient, lubrication, repeated tightening, impact loading, amplitude, etc., by experimental and numerical methods.
In the literature review on hydraulic valves and forces acting on the spool, mostly studies analyzing the flow force resulting from changes in fluid momentum [26] were found. Bordovsky et al. [27] compared the measured and simulated axial flow force acting on a spool of a 2/2-way proportional test slide valve. Since direct measurement of the flow force was not feasible, the resulting axial force acting on the spool was measured, and the flow force was subsequently determined by considering friction and hydraulic drag forces. Li et al. [28] reviewed research and optimization of the flow force in hydraulic spool valves, focusing mainly on the definition, calculation methods, influencing factors, and methods for reducing the flow force of slide valves.
Many other studies analyzed the flow forces in hydraulic valves [1,24], but none addressed the forces acting on preloaded threaded plugs resulting from spool impact. The only studies on threaded plugs were the studies from Čelik et al. [1] and Hladnik et al. [24].
For proper dimensioning of preloaded hydraulic plugs, for prediction of their life expectancy, and for assuring safety against fatigue, knowledge of the loads acting on the plugs is crucial. Therefore, the aim of the study is to (a) measure the spool impact force F i m p a c t on the plug head (Figure 1b), (b) determine its influence on the force in the plug neck (FIPN, Figure 1b), and (c) to give design recommendations and practical considerations for preloaded threaded plugs that are loaded with spool impacts.

2. Methods

2.1. Measurements

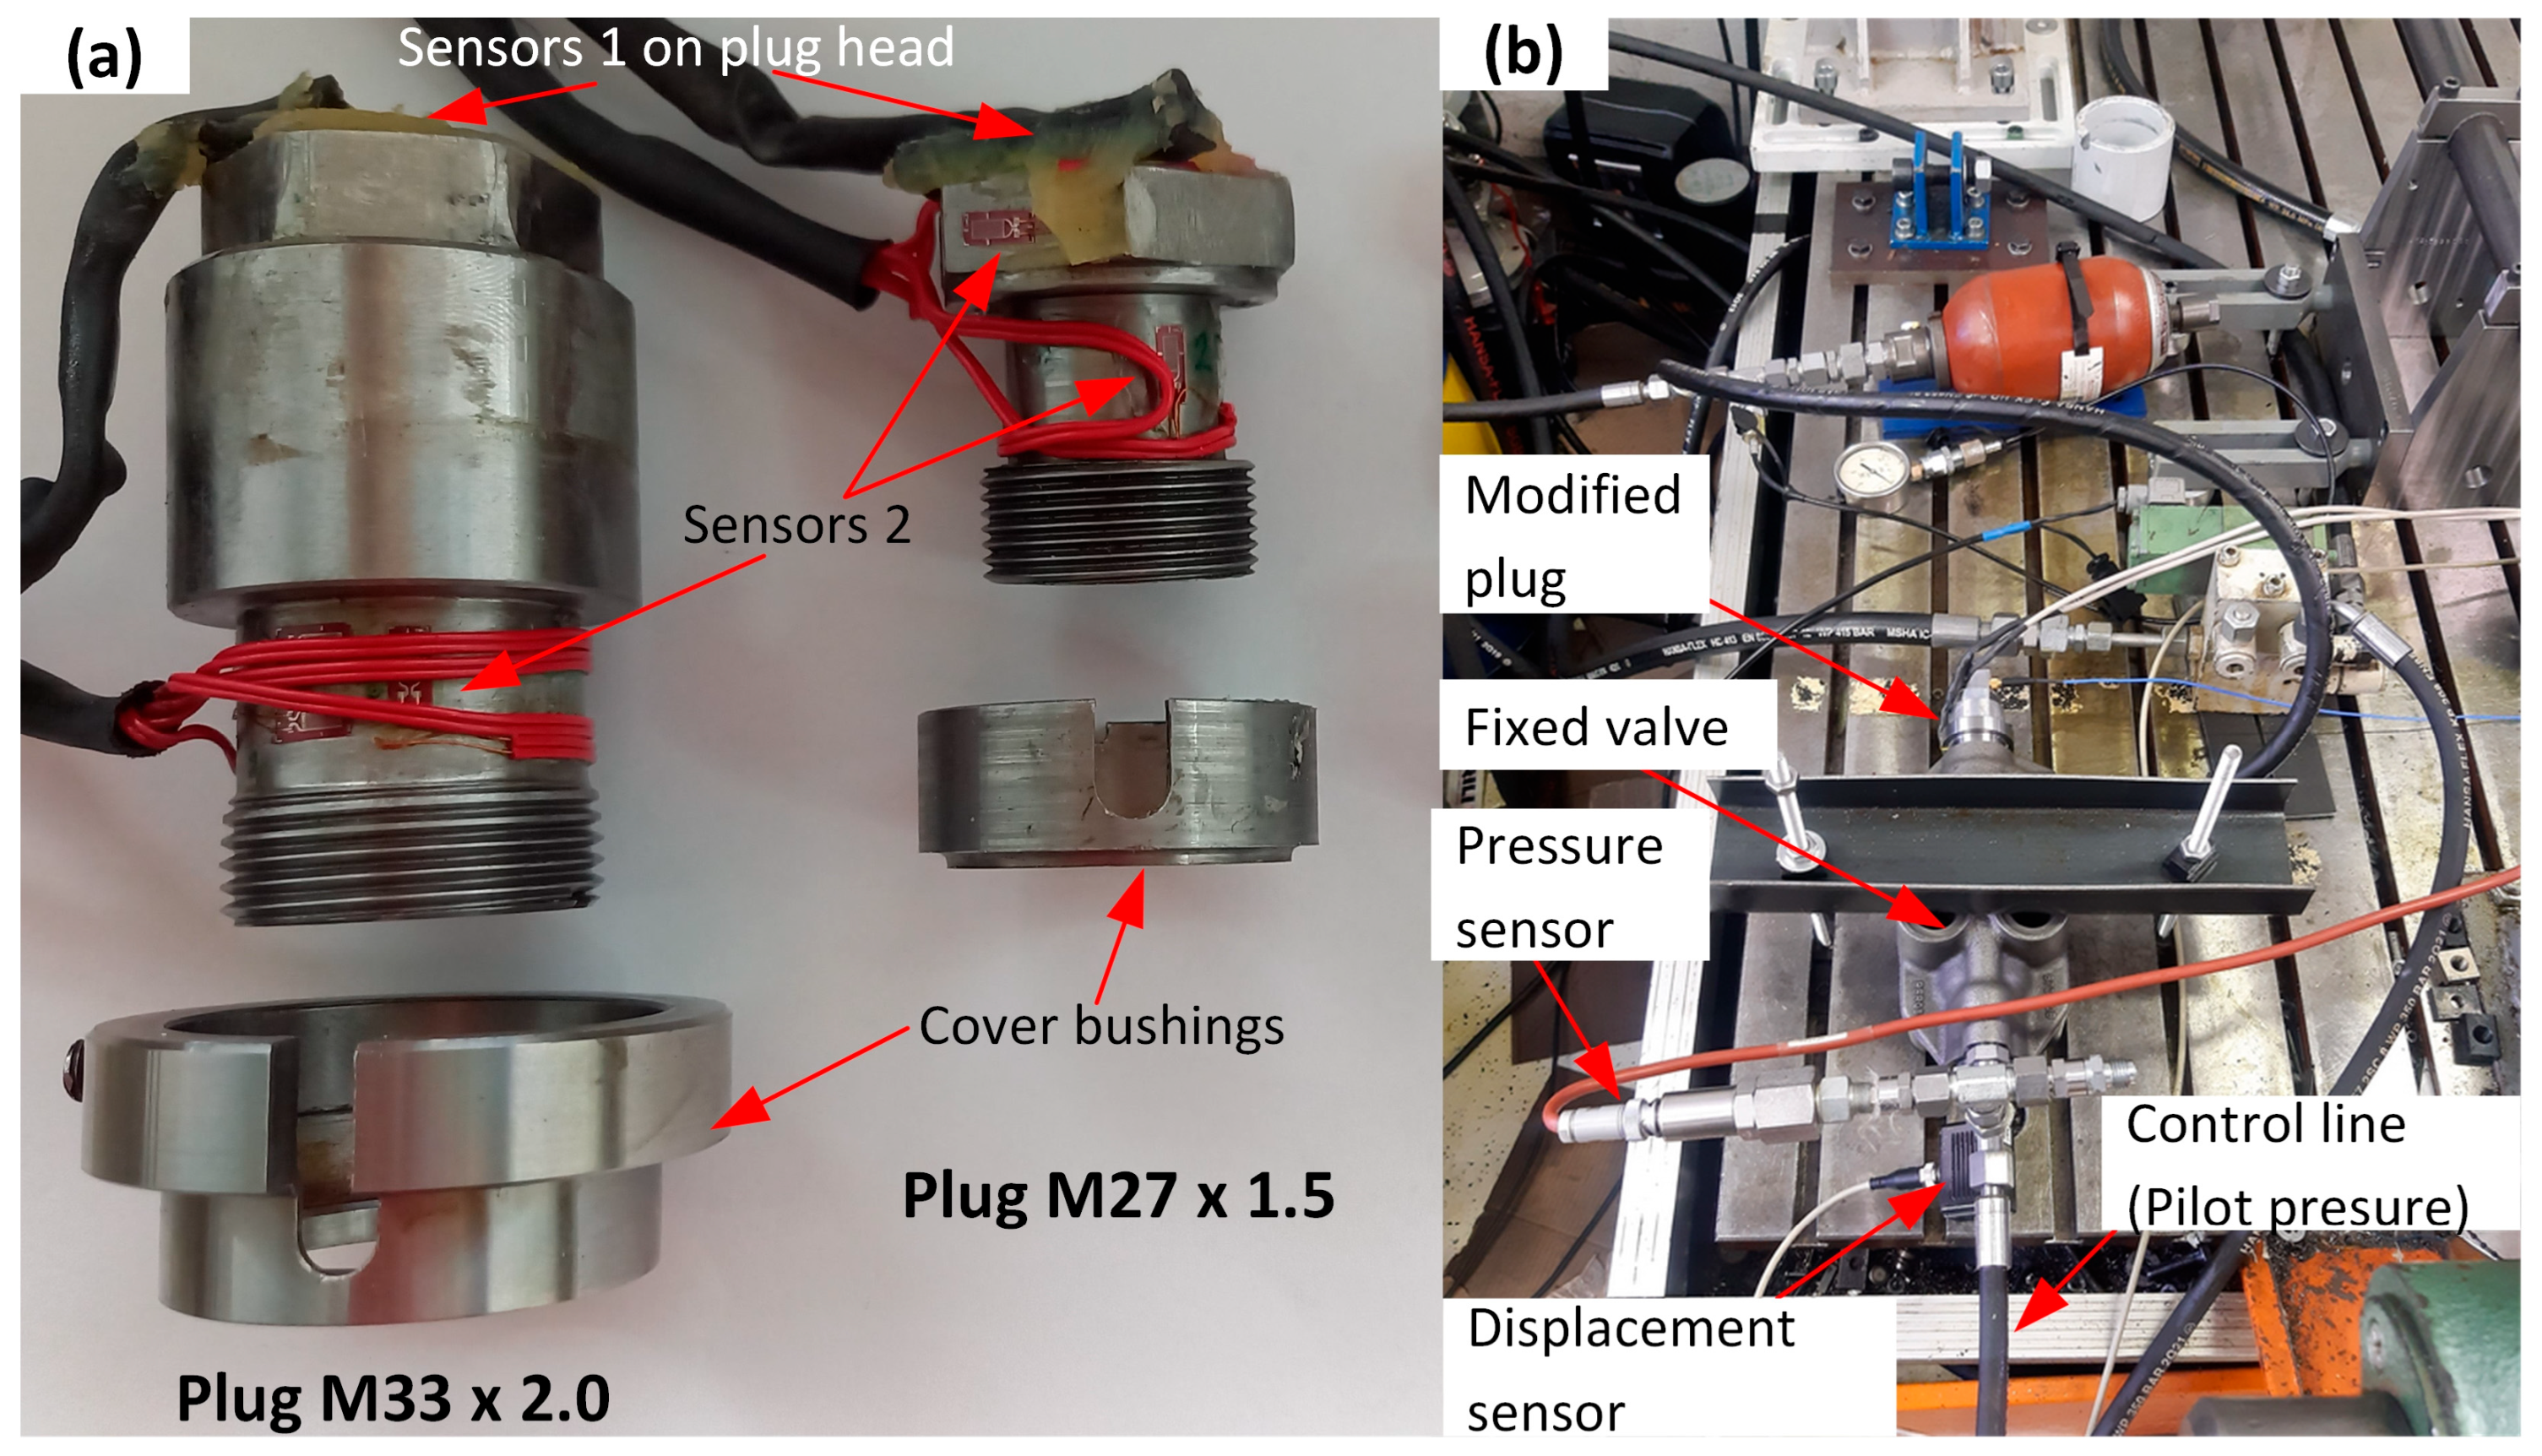
Two non-standard plugs (Figure 4a) with metric threads (M33 × 2.0 and M27 × 1.5, Poclain Hydraulics d.o.o., Žiri, Slovenia) were tightened into an exchange valve (VE60, Poclain Hydraulics d.o.o., Žiri, Slovenia) and into a free-wheeling valve (VDF, Poclain Hydraulics d.o.o., Žiri, Slovenia), with a custom-made torque wrench to their prescribed torques (110 Nm for M33 × 2.0 and 135 Nm for M27 × 1.5, for details see [24]). The threads of the connections were lubricated before tightening. The valves were connected to an electro-regulated hydraulic system (Figure 4b), which enabled various pilot pressures. The spool impact measurements were performed at three different pilot pressures: 20 bar, 30 bar and 60 bar. At each pilot pressure, five consecutive activations and deactivations of the control valve were performed at 1 Hz.
Figure 4. (a) Modified non-standard plugs M33 × 2.0 and M27 × 1.5 equipped with strain gauges. Sensors 1 measured the forces on the plug heads, Sensors 2 the forces in the plug necks. As extensions of the clamping parts, cover bushings were added. (b) Measurement setup. Valve with the modified plug was connected to a control line with variable pilot pressure, meanwhile the forces in the plug, pilot pressure and spool displacement were measured.
To measure the impact force F i m p a c t applied to the plug head and the FIPN, which considered the preload F V and the additional load F S A (Figure 3), the plugs were modified and equipped with strain gauges (Figure 4a). For the measurement of F i m p a c t , a strain gauge (FLAB-3-350-11-1LJB-F, Tokyo Measuring Instruments Lab. Co., Ltd., Shinagawa City, Tokyo, Japan, gauge factor k = 2.07, resistance 350 ± 1.0 Ω) connected in a quarter bridge (configuration Type I [29]) was attached at the centre of the hexagon heads (Sensor 1). For measurement of the FIPN, the studs of the plugs were extended and a bushing, as an extension of the clamping parts, was added (Figure 4a). Four strain gauges (FLAB-3-11-1LJB-F, Tokyo Measuring Instruments Lab. Co., Ltd., Shinagawa City, Tokyo, Japan, gauge factor k = 2.08, resistance 120 ± 0.5 Ω) were attached to the extended studs and connected in a full bridge, Type III configuration [29], representing Sensor 2. Two of the strain gauges were oriented in the axial plug direction and measured the axial strain/force in the stud, while the other two strain gauges were oriented in the circumferential direction of the plugs and were intended for temperature compensation. To obtain sufficient strain for sensor perception, the thicknesses of the plug walls were adapted.
In addition to forces, pilot pressure and spool displacement were measured. The pilot pressure was measured with a pressure sensor (B77539, 100 bar, HBM, Darmstadt, Germany, 0.1 accuracy class, ±0.1 bar), and the displacement was measured with an LVDT (A WE X 020 A01, Magnet-Schultz, Memmingen, Germany, estimated measurement uncertainty ±0.16 mm at ±8 mm), which was connected to the spool by a string (Figure 4b). All sensors were connected to a data acquisition system (SCXI 1520, National Instruments Corporation, Austin, TX, USA) and a measuring station (NI PXIw-1062Q, National Instruments Corporation, Austin, TX, USA). The 120 Ω strain gauges were excited with a 5 V DC supply, whereas the 350 Ω strain gauges were supplied with 10 V DC. Sensor output signals were recorded at a sampling frequency of 10 kHz and processed using LabView 16.0 (National Instruments Corporation, Austin, TX, USA). No filtering was applied to preserve all signal details. Prior to testing, the force sensors were calibrated [24] and left connected to the measuring system for at least 24 h to ensure stable thermal conditions. Before each measurement series the sensors were zeroed.

2.2. Force Calculations

The forces acting on the spool during spool impact into the plug head are depicted in Figure 1a. Before the spool impact, the pilot pressure p exerts an axial actuator force F a c t acting on the spool. When F a c t exceeds the initial frictional force ( F f , 0 ) and the initial spring force ( F s p r i n g , 0 ), the spool starts to move and the equation of motion yields:
m · a = F a c t F s p r i n g F f F d F b p
where m is the mass of the spool, a its acceleration, F s p r i n g the spring force, F f the frictional force, F d the hydraulic drag force and F b p the back-pressure force acting on the spool.
When the spool impacts the plug head, an impact force F i m p a c t decelerating the spool appears (Figure 1a) and the equation of motion yields:
m · a = F a c t F i m p a c t F s p r i n g F f F d F b p
Since there was no hydraulic fluid in the spring chamber, F b p   was neglected in the upper equations, while F a c t was estimated by the pressure force calculated by multiplication of the pilot pressure p and the circular area A of the spool at which the hydraulic pressure was applied:
F a c t = p · A
The return spring force F s p r i n g was calculated after the Hooke’s law as:
F s p r i n g = k · f
where k is the stiffness of the spring and f its contraction (Table 1).
Table 1. Spring and spool data (same for original and modified plug–valve connections).
In the context of preloaded bolted connections, the sum of F i m p a c t and of the spring force difference Δ F s p r i n g presents the total external load F A (Figure 3) applied on the preloaded plug:
F A = F i m p a c t + Δ F s p r i n g
where Δ F s p r i n g is the spring force difference between fully and initially compressed return spring (Table 1):
Δ F s p r i n g = F s p r i n g , f F s p r i n g , 0
Due to the compliance of the bolt and of the clamped parts, the influence of an external axial load F A acting on a preloaded connection is reduced to an additional load F S A in the bolt (Figure 3):
F S A = F A · ϕ
where ϕ presents the stiffness ratio (also force or load ratio). According to VDI 2230 [11], the stiffness ratio ϕ of a preloaded bolted connection is calculated from the stiffness k p (or compliance δ p ) of the clamped parts and the stiffness k s (or compliance δ s ) of the tensioned parts, or from the force ratio:
ϕ = k s k p + k s
ϕ = δ p δ p + δ s
ϕ = F S A F A
The portion of F S A in the bolt due to an external load F A is smaller, if the bolt (tensioned parts) is more compliant and the flange (clamped parts) is stiffer [30] (Figure 3).
F i m p a c t and FIPN were measured on the modified plug–valve connections, which had different stiffnesses than the original connections. Therefore, these forces were not directly valid for the original plug–valve connections. To obtain the additional loads due to external loads in the original plug–valve connections ( F S A , o r i g ), the external loads F A , which were assumed to be equal for the modified and original plug–valve connections, were multiplied with the stiffness ratios ϕ o r i g of the original plug–valve connections (Equation (7)). Here, ϕ o r i g were obtained from finite element (FE) models of the original plug–valve connections (Section 2.3).

2.3. FE Models of the Original Plug–Valve Connections

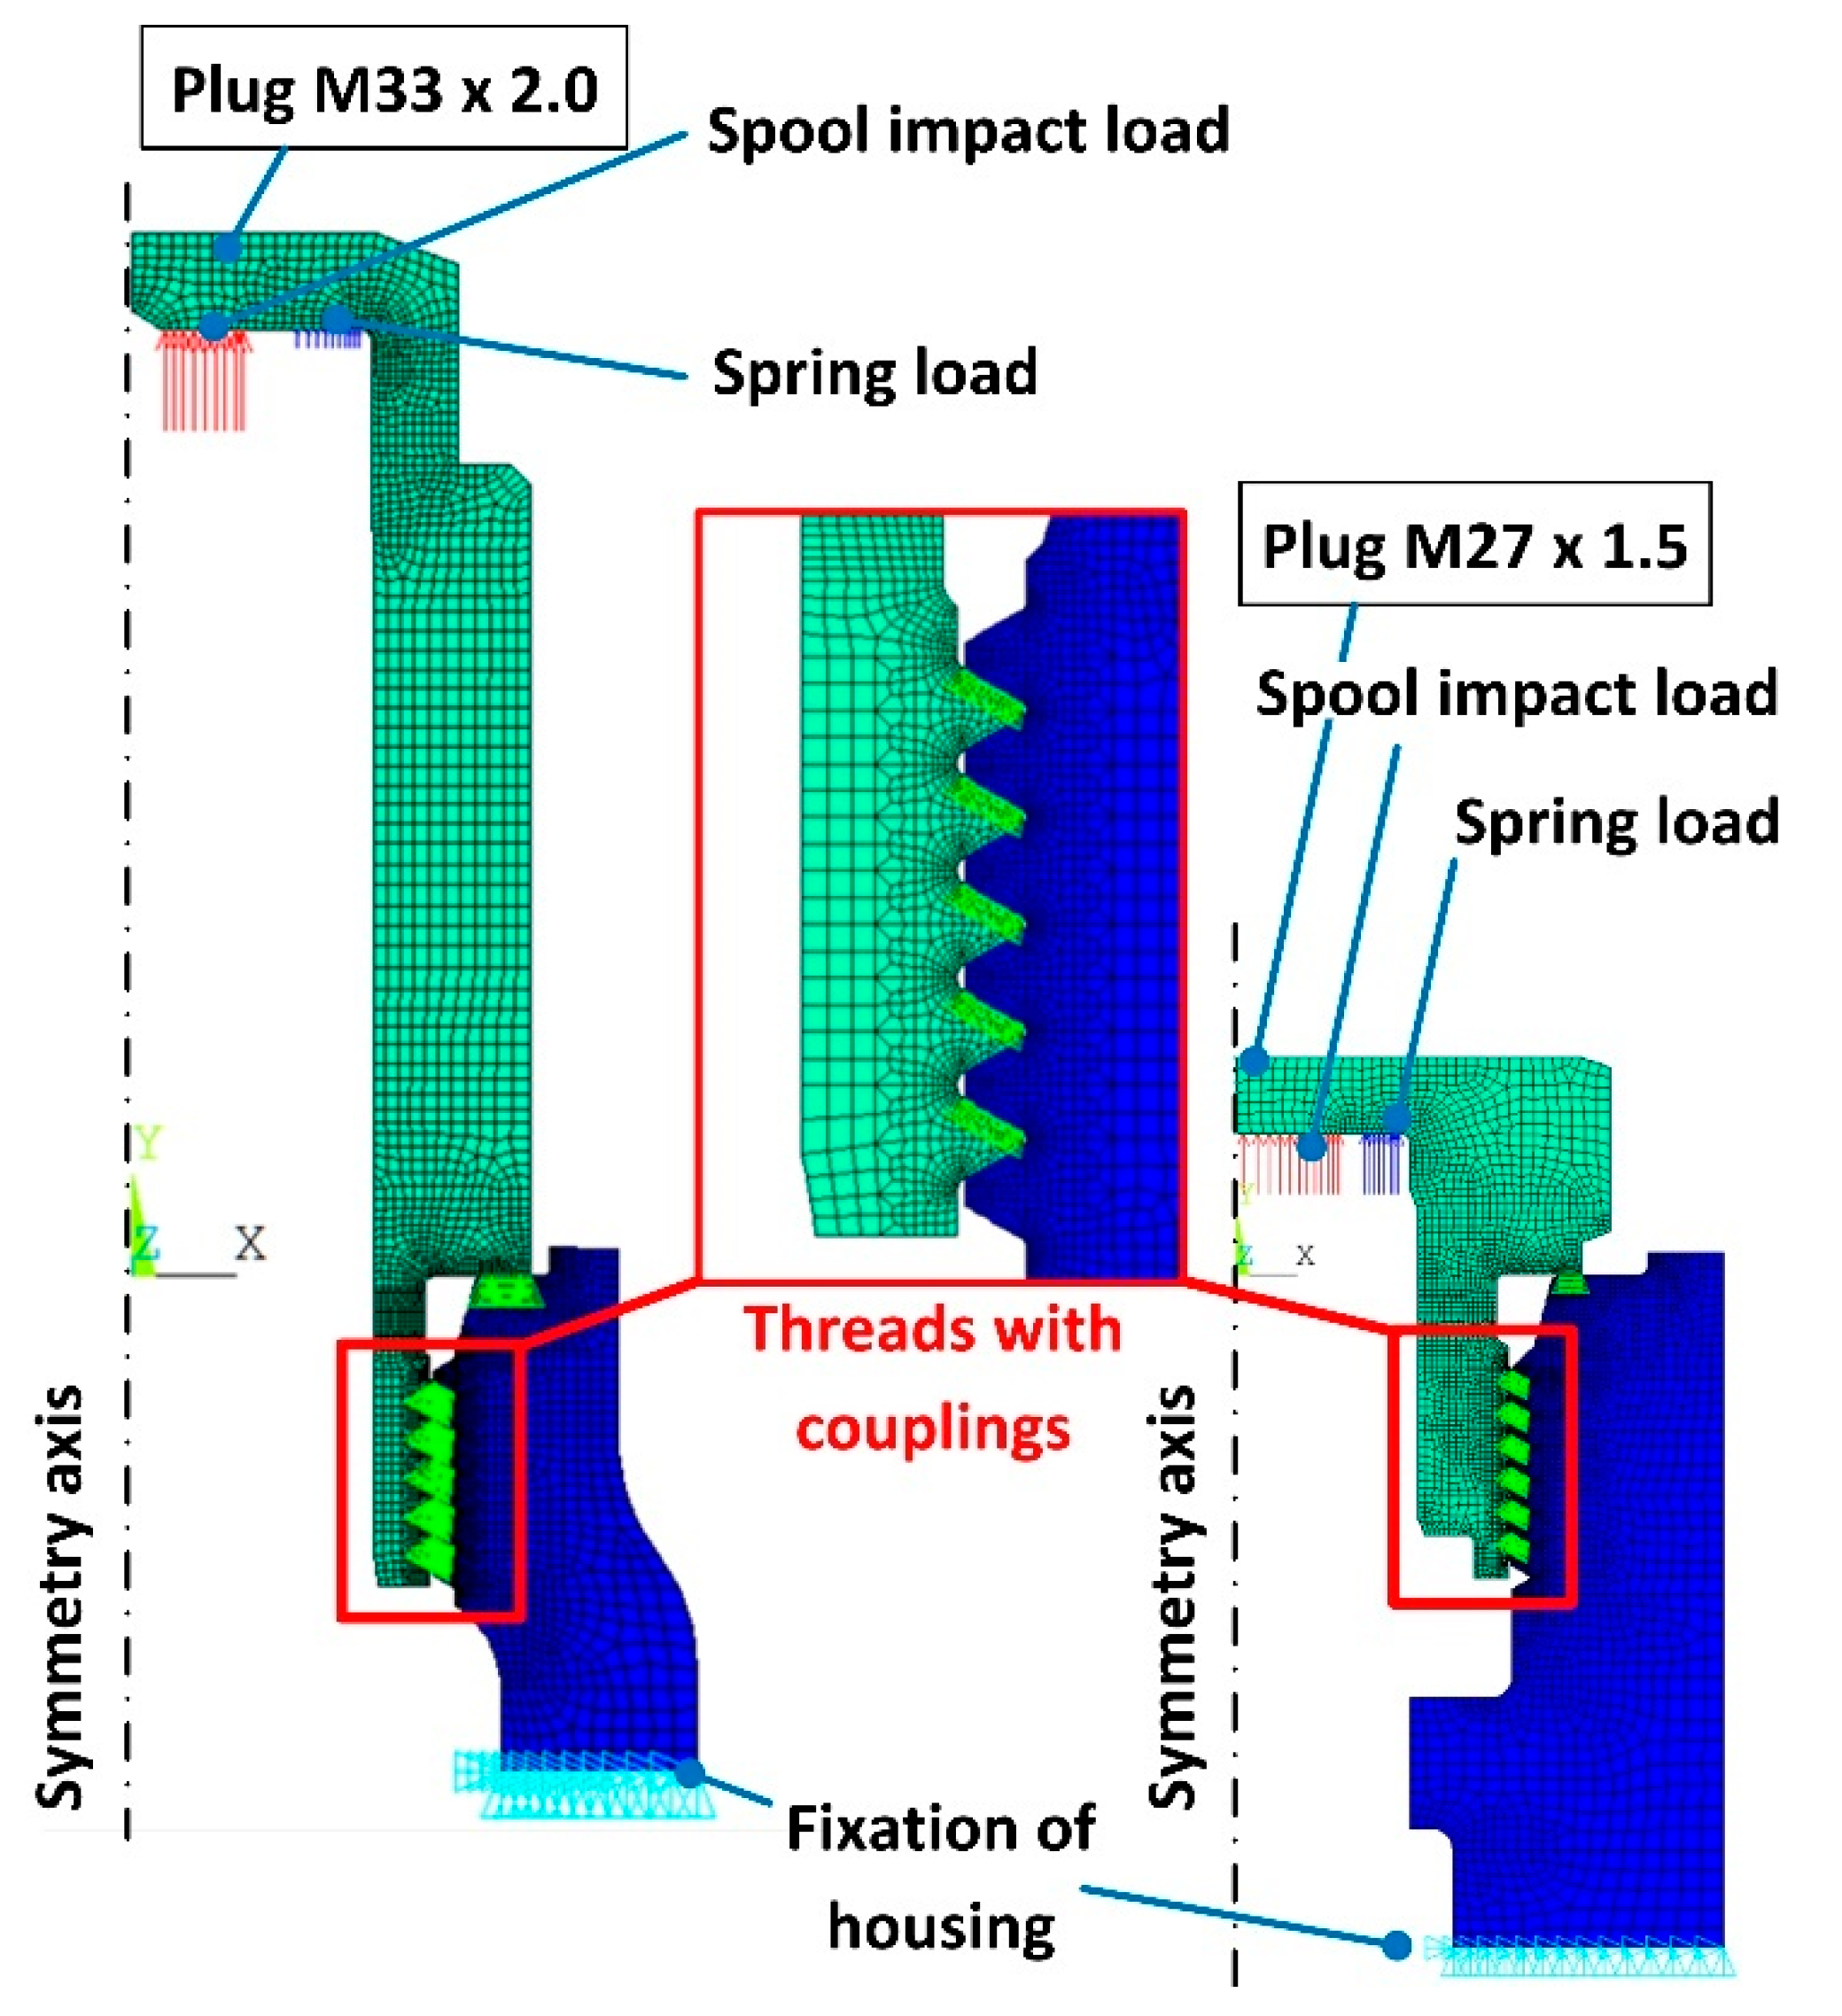
The stiffness ratios of the original plug–valve connections ϕ o r i g were obtained from their FE models (Figure 5). These were established in ANSYS Mechanical APDL software (Ansys, Inc., Version 12.0, Canonsburg, PA, USA). The connections were modelled as axisymmetric along their longitudinal axes and meshed with PLANE42 elements. Their threads were simplified as circular threads, considering only complete threads. The contacts between the threads of the plugs and the valve housings were established by couplings of adjacent pairs of nodes in the normal direction to the contacting edge, while the relative movement in the tangential direction was set free, without friction. The contacts between the heads of the plugs and the housings were likewise established.
Figure 5. Two axisymmetric FE models of the original M33 × 2.0 (left) and M27 × 1.5 (right) plug–valve connections with boundary conditions.
The simulations were divided into two steps. In the first step, preload of the plugs was applied by temperature contraction of appropriate FEs at the neck of the plug in its axial direction. Since the geometry and material characteristics of the threads were the same in the modified and original plug–valve connections, the measured preloads in the modified plugs were also applied to the FE models of the original plug–valve connections.
In the second step, the plugs were loaded with the impact forces F i m p a c t measured on the modified plugs, and with spring forces F s p r i n g , f of fully compressed springs at the inner side of the hexagon heads. These forces were applied as uniformly distributed loads acting on selected nodes (Figure 5). The FE models were fixed at multiple nodes of the valve housings. The materials were modelled as bilinear isotropic (Table 2).
Table 2. Material properties of the plug–valve connections used in the FE models.

3. Results and Discussion

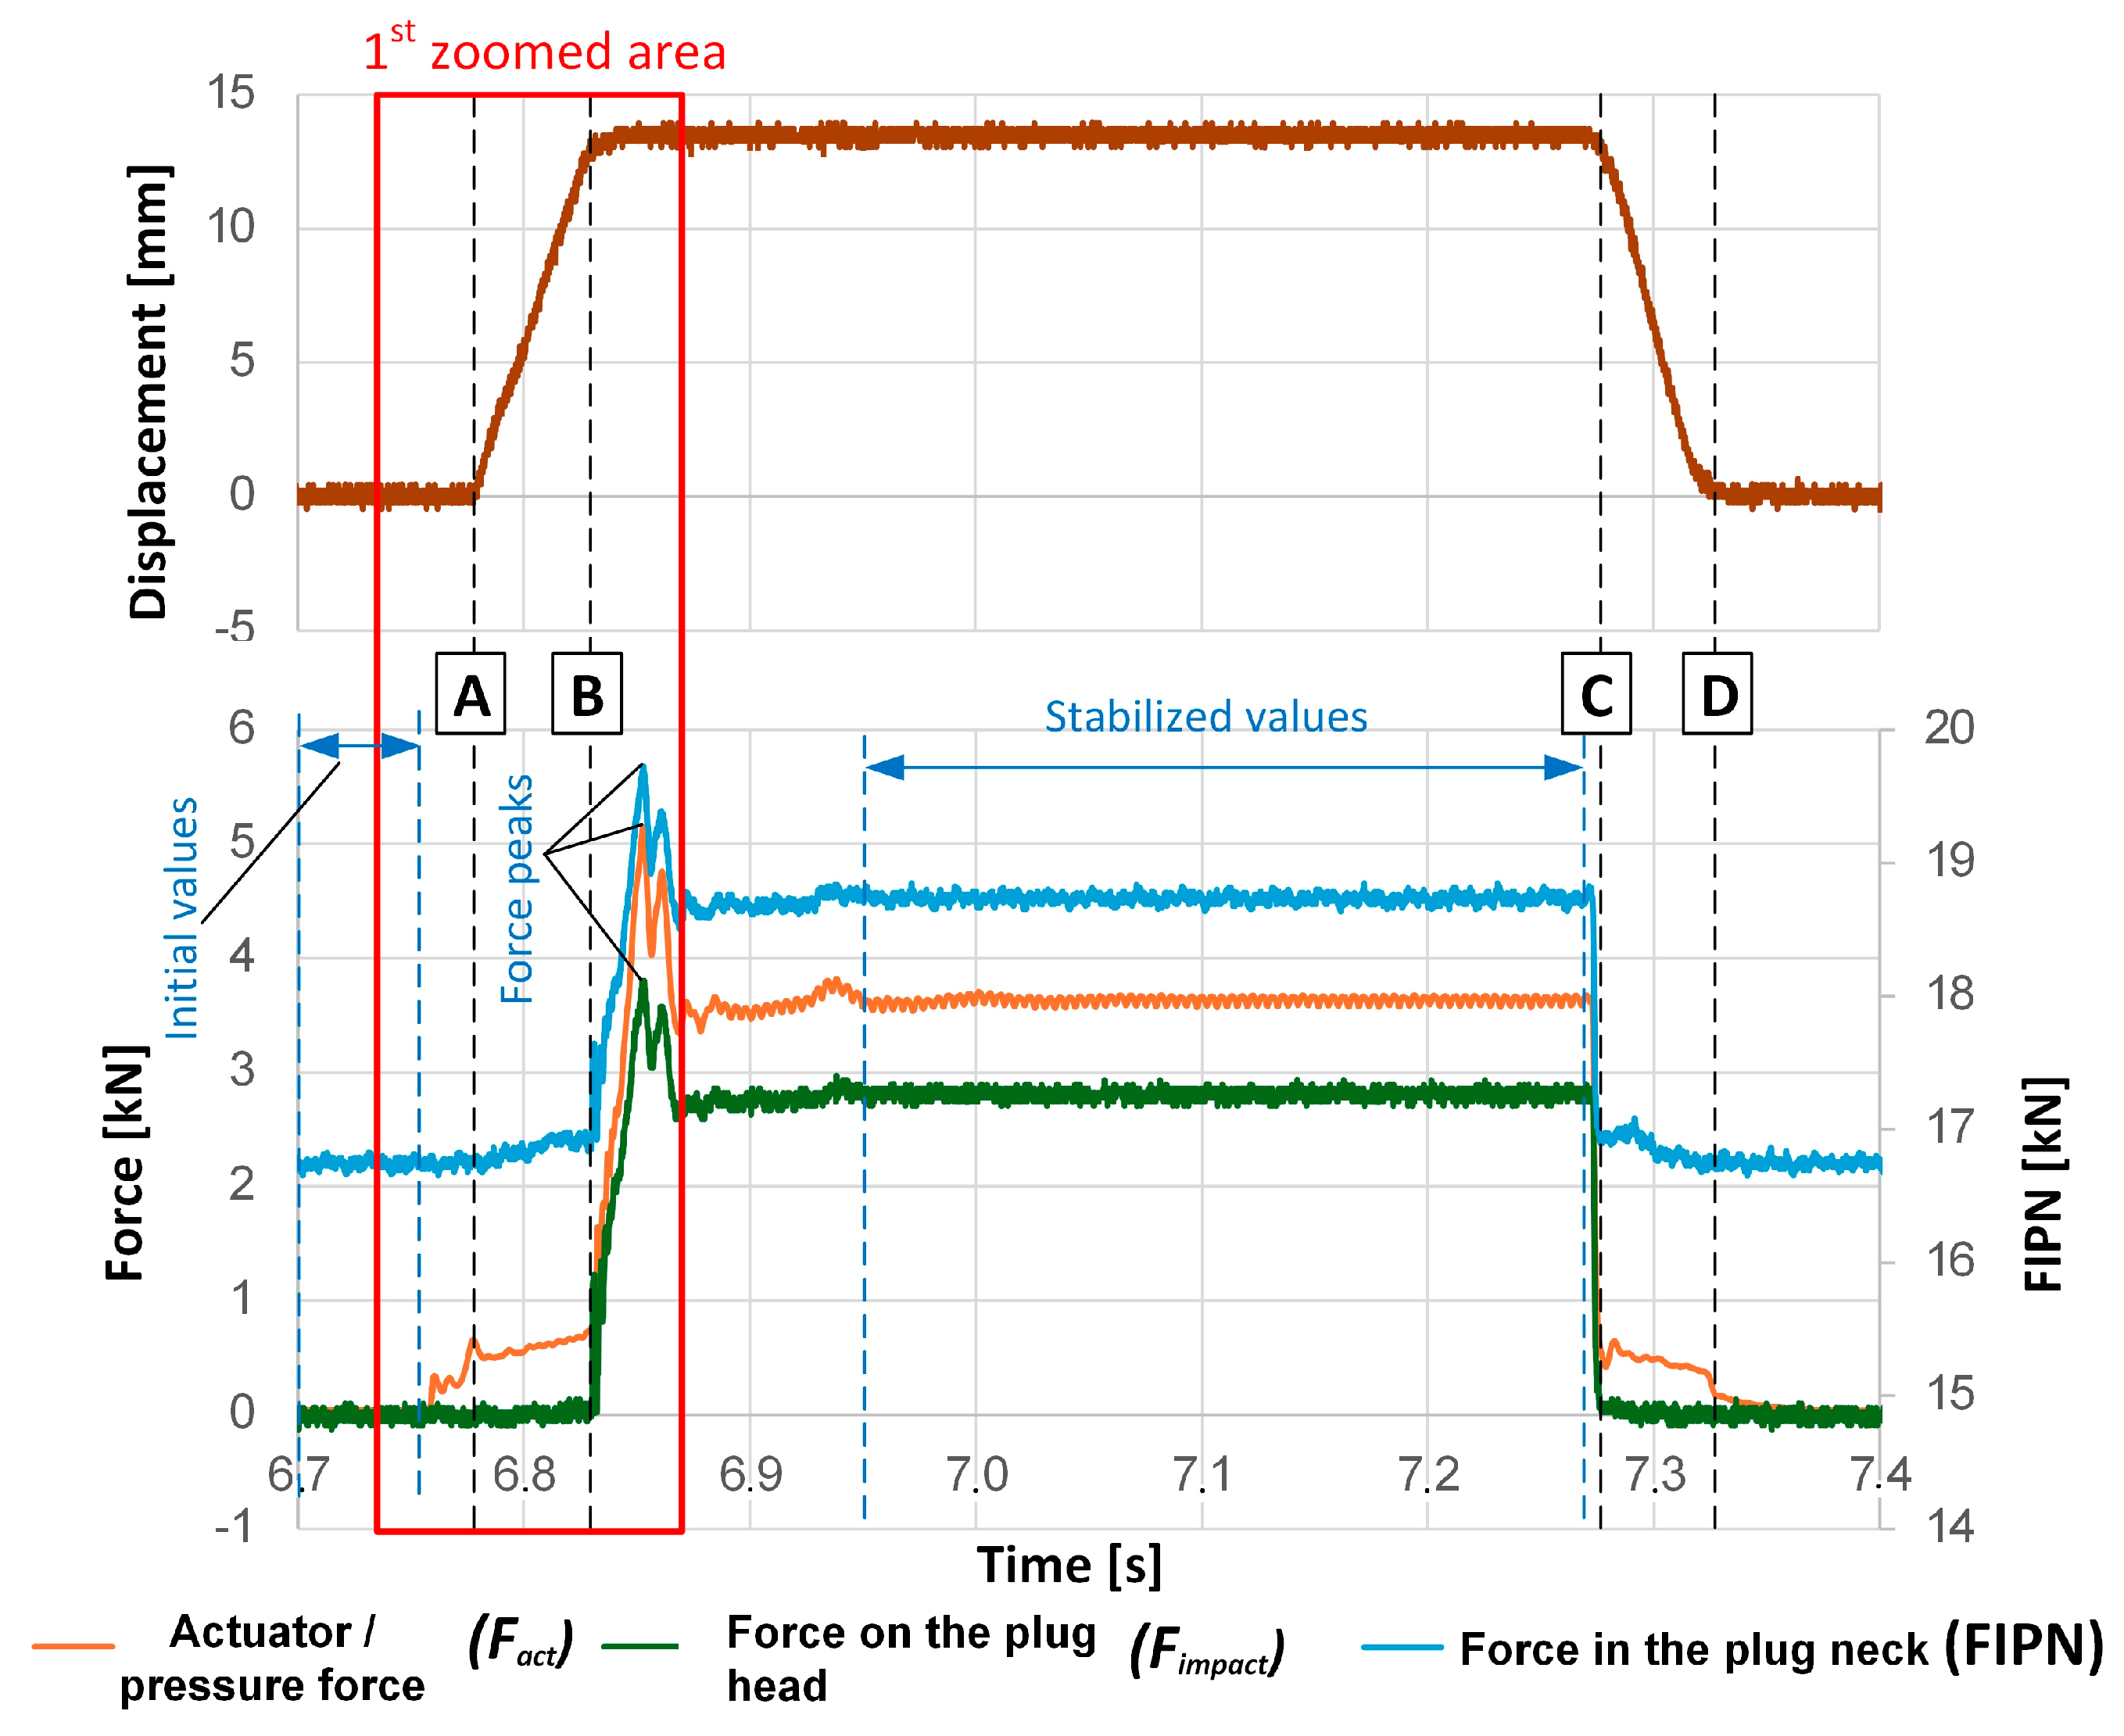
The measured forces and displacements had an identical profile for both plug–valve connections, but with different magnitudes. Also, the results of consecutive spool impacts were identical for individual plug–valve connections at a certain pilot pressure. Therefore, only the results of one spool impact (one activation and deactivation of the valve) at 60 bar of pilot pressure are presented for the M33 × 2.0 plug–valve connection in Figure 6. The actuator force F a c t , aka pressure force, had the same scaled course as the pilot pressure p , therefore only F a c t is presented.
Figure 6. Spool displacement, spool force on the plug head ( F i m p a c t ), force in the plug neck (FIPN = F V + F S A ) and actuator force ( F a c t , calculated as pressure force) during one spool impact. The results are presented for the M33 × 2.0 plug–valve connection at 60 bar of pilot pressure. A annotates the beginning of the spool movement, B spool impact, C separation of the plug and the spool, and D stopping of the spool. The 1st zoomed area at the beginning of the valve activation is presented in Figure 7.
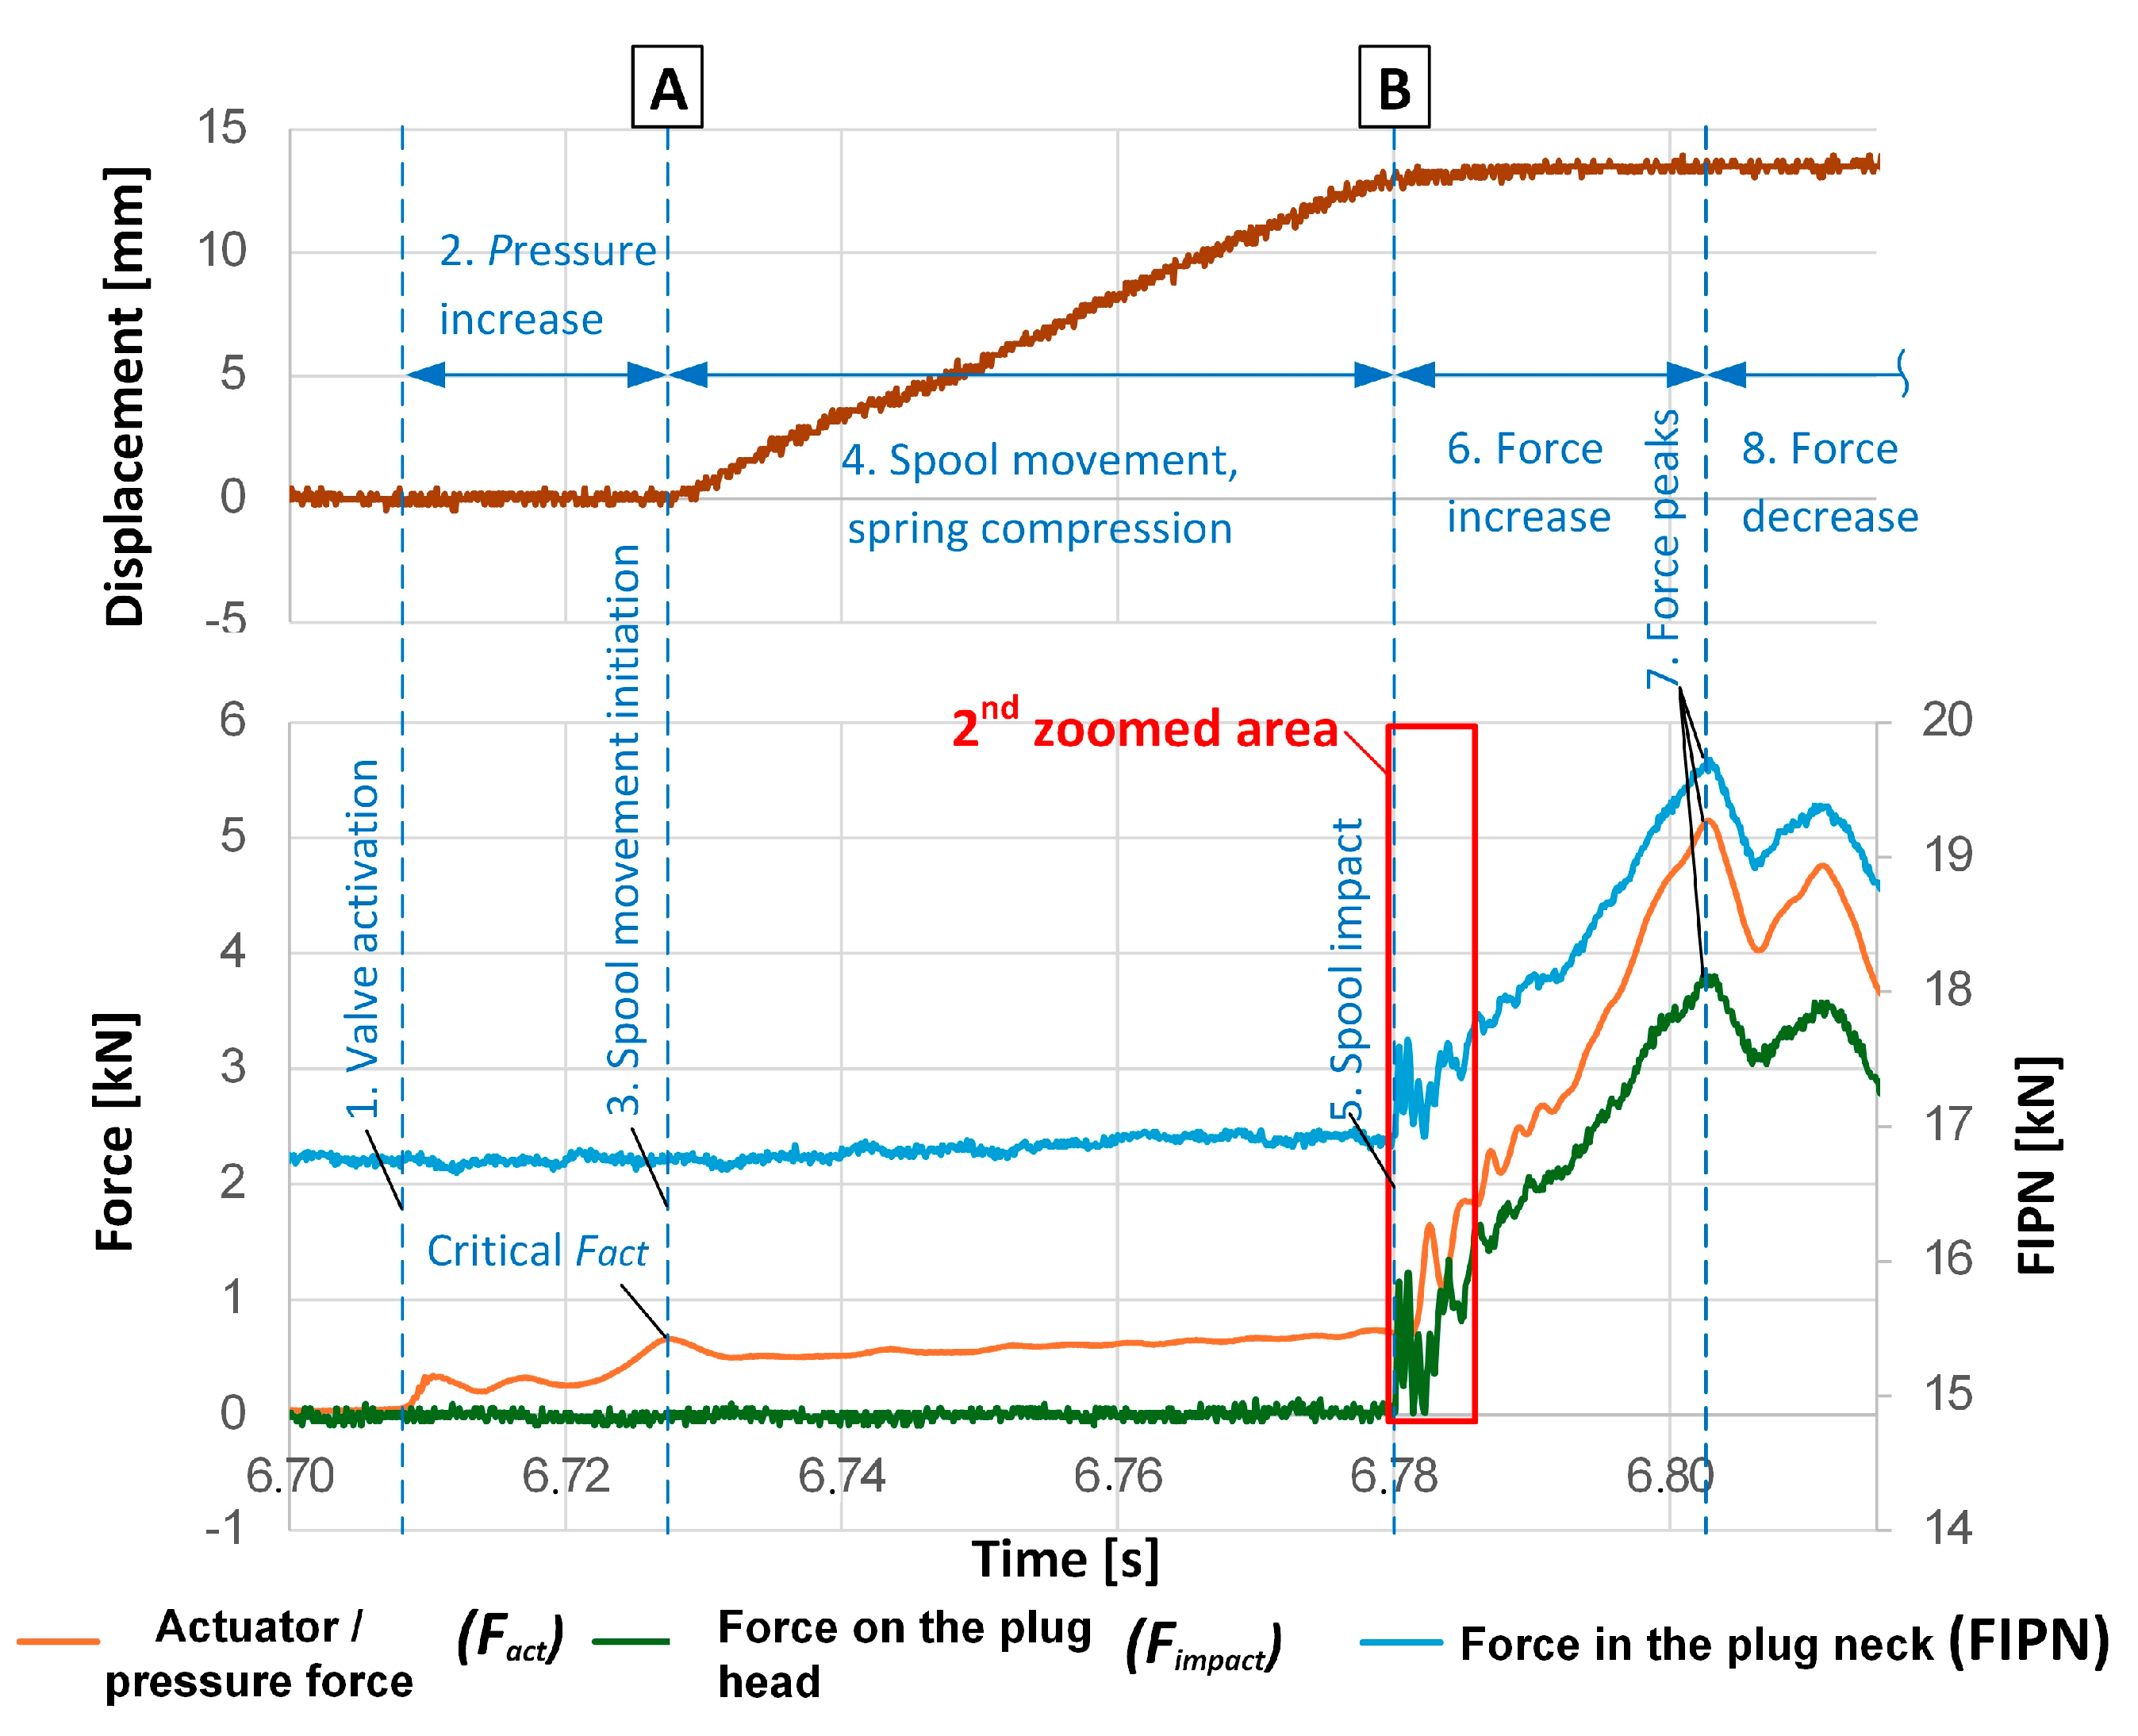
In Figure 6, four important events can be emphasized: (A) the beginning of the spool movement, (B) spool impact into the plug head and consecutive spool stopping, (C) spool and plug separation at valve deactivation, and (D) spool stopping. In Figure 7 the beginning of the spool movement is zoomed (1st zoomed area). When the valve was activated (point 1), the pilot pressure and the actuator force F a c t started to increase (point 2), but no spool movement was detected until F a c t was greater than the resistant forces (points A and 3). At zero spool velocity, the resistant forces can be approximated by the sum of the initial spring force F s p r i n g , 0 (Table 1) and the initial adhesion frictional force F f , 0 .
Figure 7. Spool displacement, spool force on the plug head ( F i m p a c t ), force in the plug neck (FIPN = F V + F S A ) and actuator force ( F a c t , calculated as pressure force) at the beginning of the valve activation (in Figure 6 marked as the 1st zoomed area). The results are presented for the M33 × 2.0 plug–valve connection at 60 bar of pilot pressure. A annotates the beginning of the spool movement, B the spool impact. The annotated 2nd zoomed area is presented in Figure 9, the 3rd in Figure 10.
After initiation of the spool movement (points A and 3), F a c t slightly dropped. After that, F a c t increased slowly due to compression of the return spring (point 4). This increase is also evident in the FIPN curve.
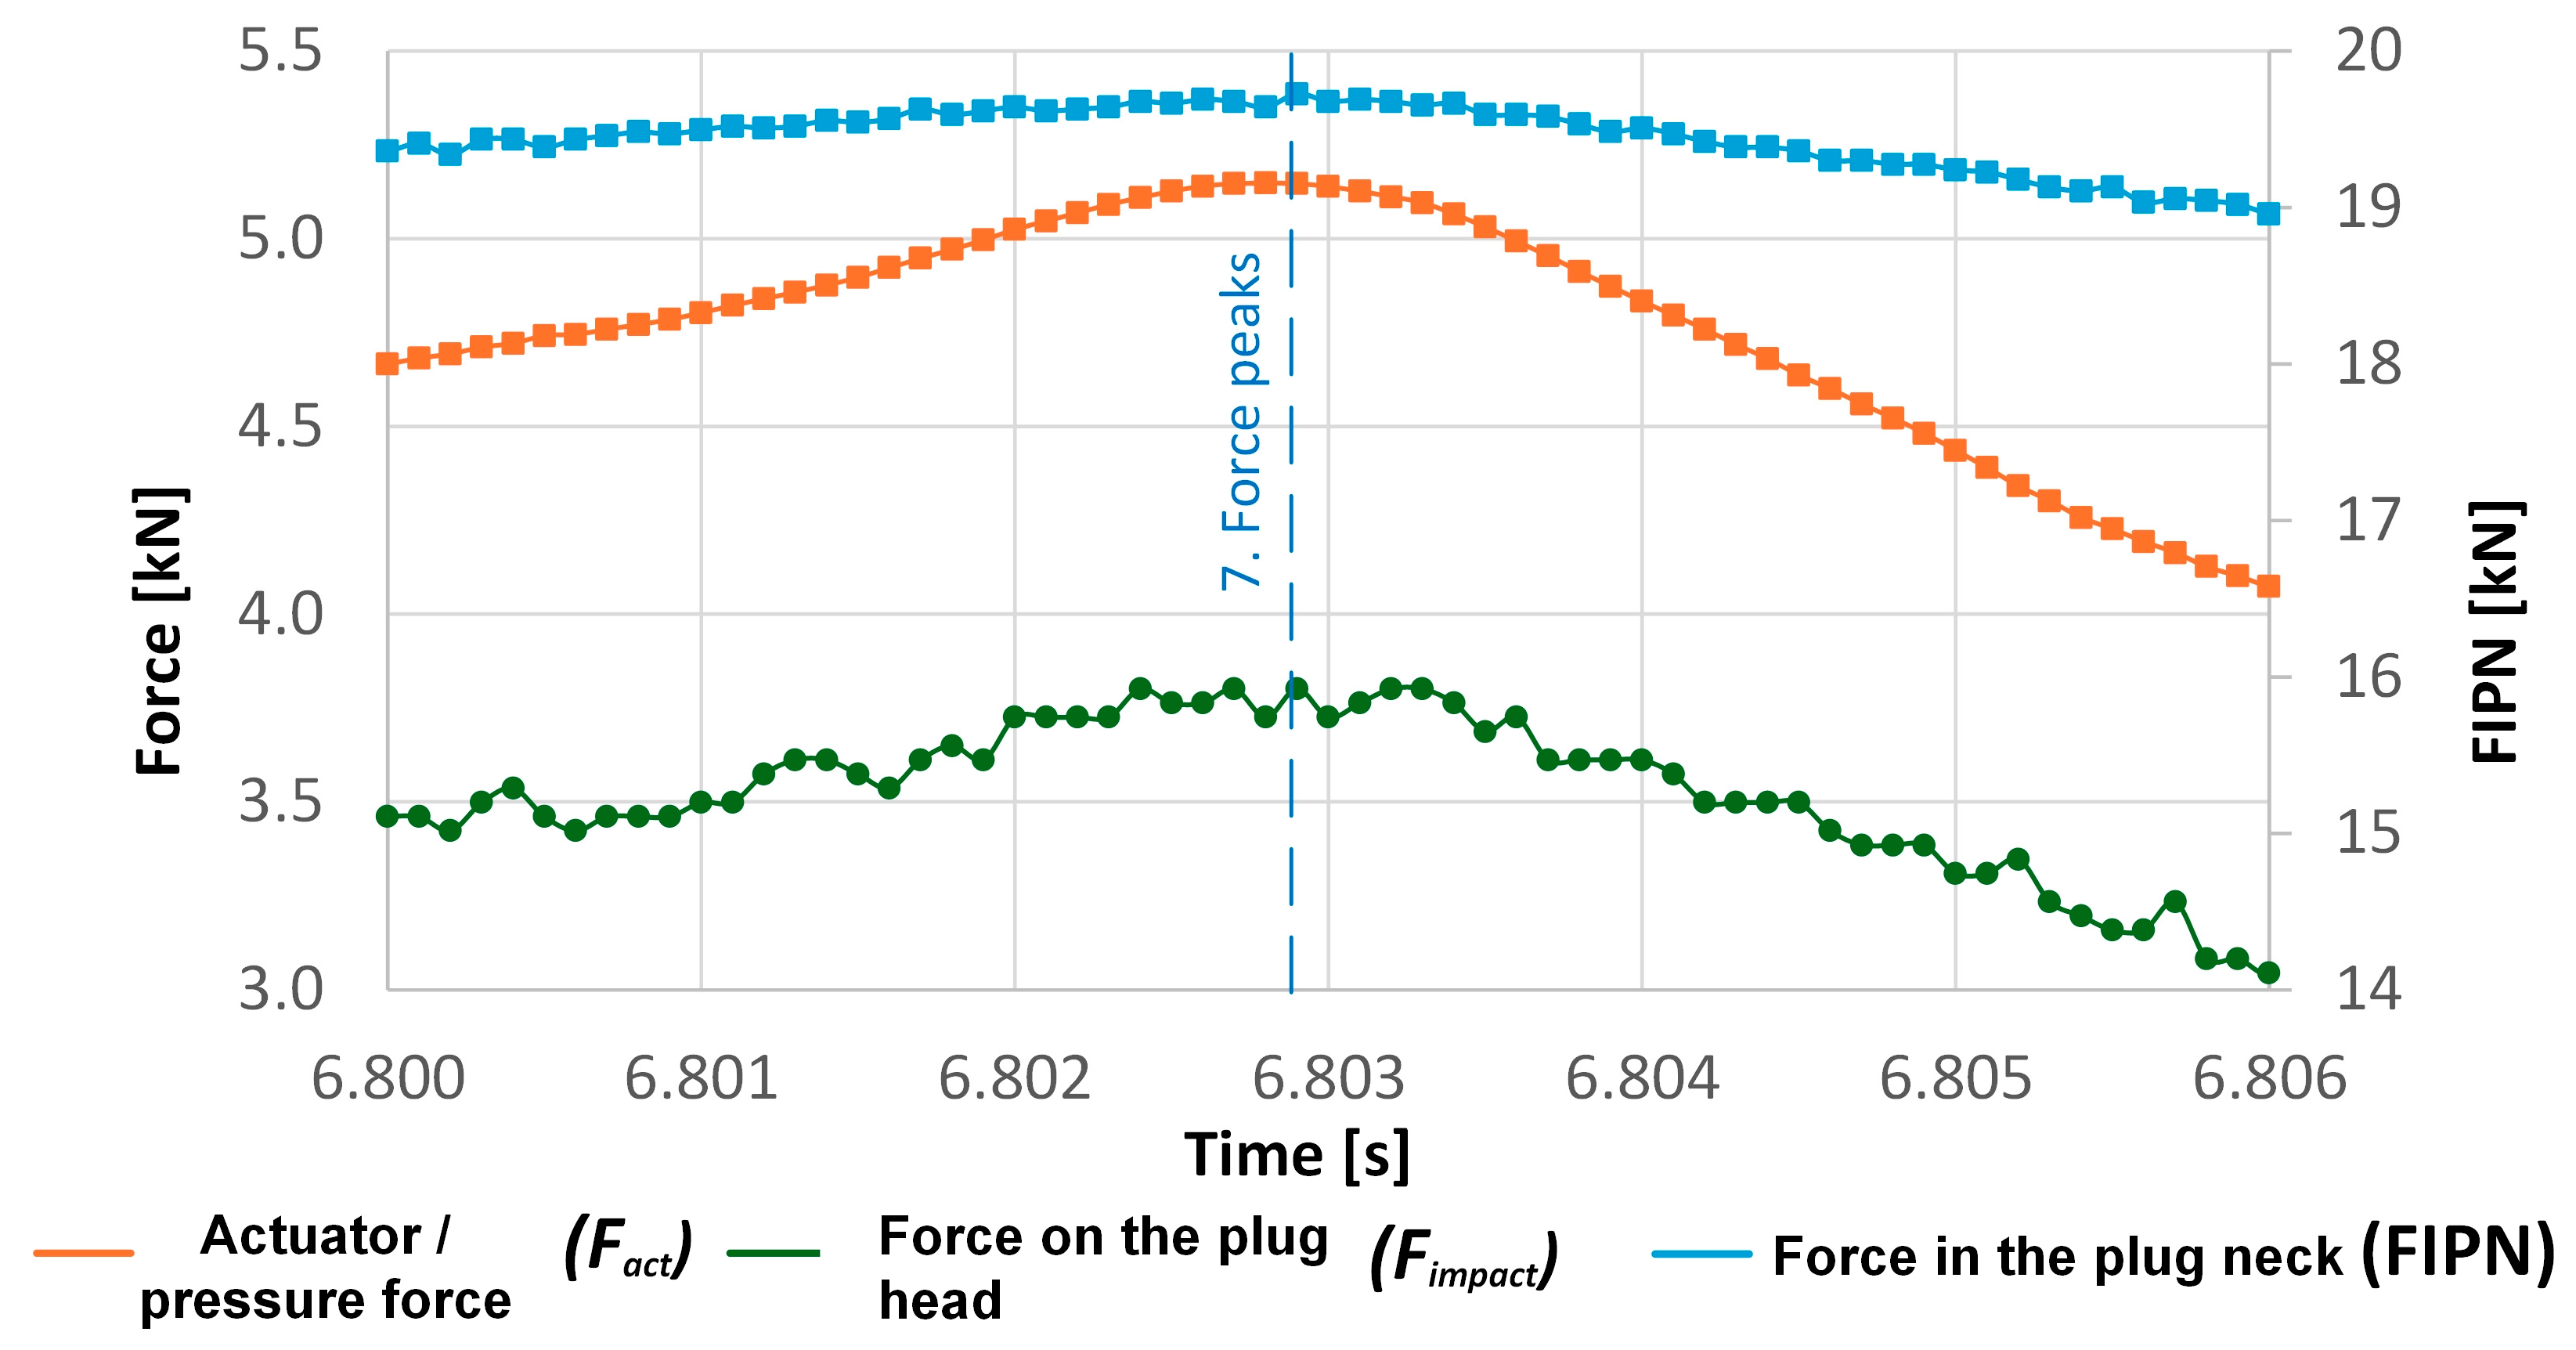
F i m p a c t remained zero until the spool impacted the plug head (points B and 5). From this point on, all the forces started to increase steeply (point 6) till their peaks were reached (point 7). The similar profiles of F a c t , F i m p a c t , and FIPN, with coinciding peak timings (see Section 3.2.), indicate that F i m p a c t and FIPN were mostly a consequence of the pilot pressure or F a c t . After the force peaks (point 7 in Figure 7 and Figure 10), the forces decreased and converged to their stabilized, “static” values (point 8 in Figure 6 and Figure 7), which were used for further calculations.
Figure 10. Spool force on the plug head ( F i m p a c t ), force in the plug neck ( F I P N ), and actuator force ( F a c t ) in the 3nd zoomed area (annotated in Figure 7), i.e., at the force and pilot pressure peaks. The results are presented for the M33 × 2.0 plug–valve connection at 60 bar of pilot pressure.
The preloads F V (i.e., FIPN at zero pilot pressure) before and after valve activations remained the same, which indicates that the FIPN sensors (Sensors 2) were stable over time and that the plugs did not self-loosen.

3.1. Stabilized Forces and Stiffness Ratios in Dependence from Pilot Pressure

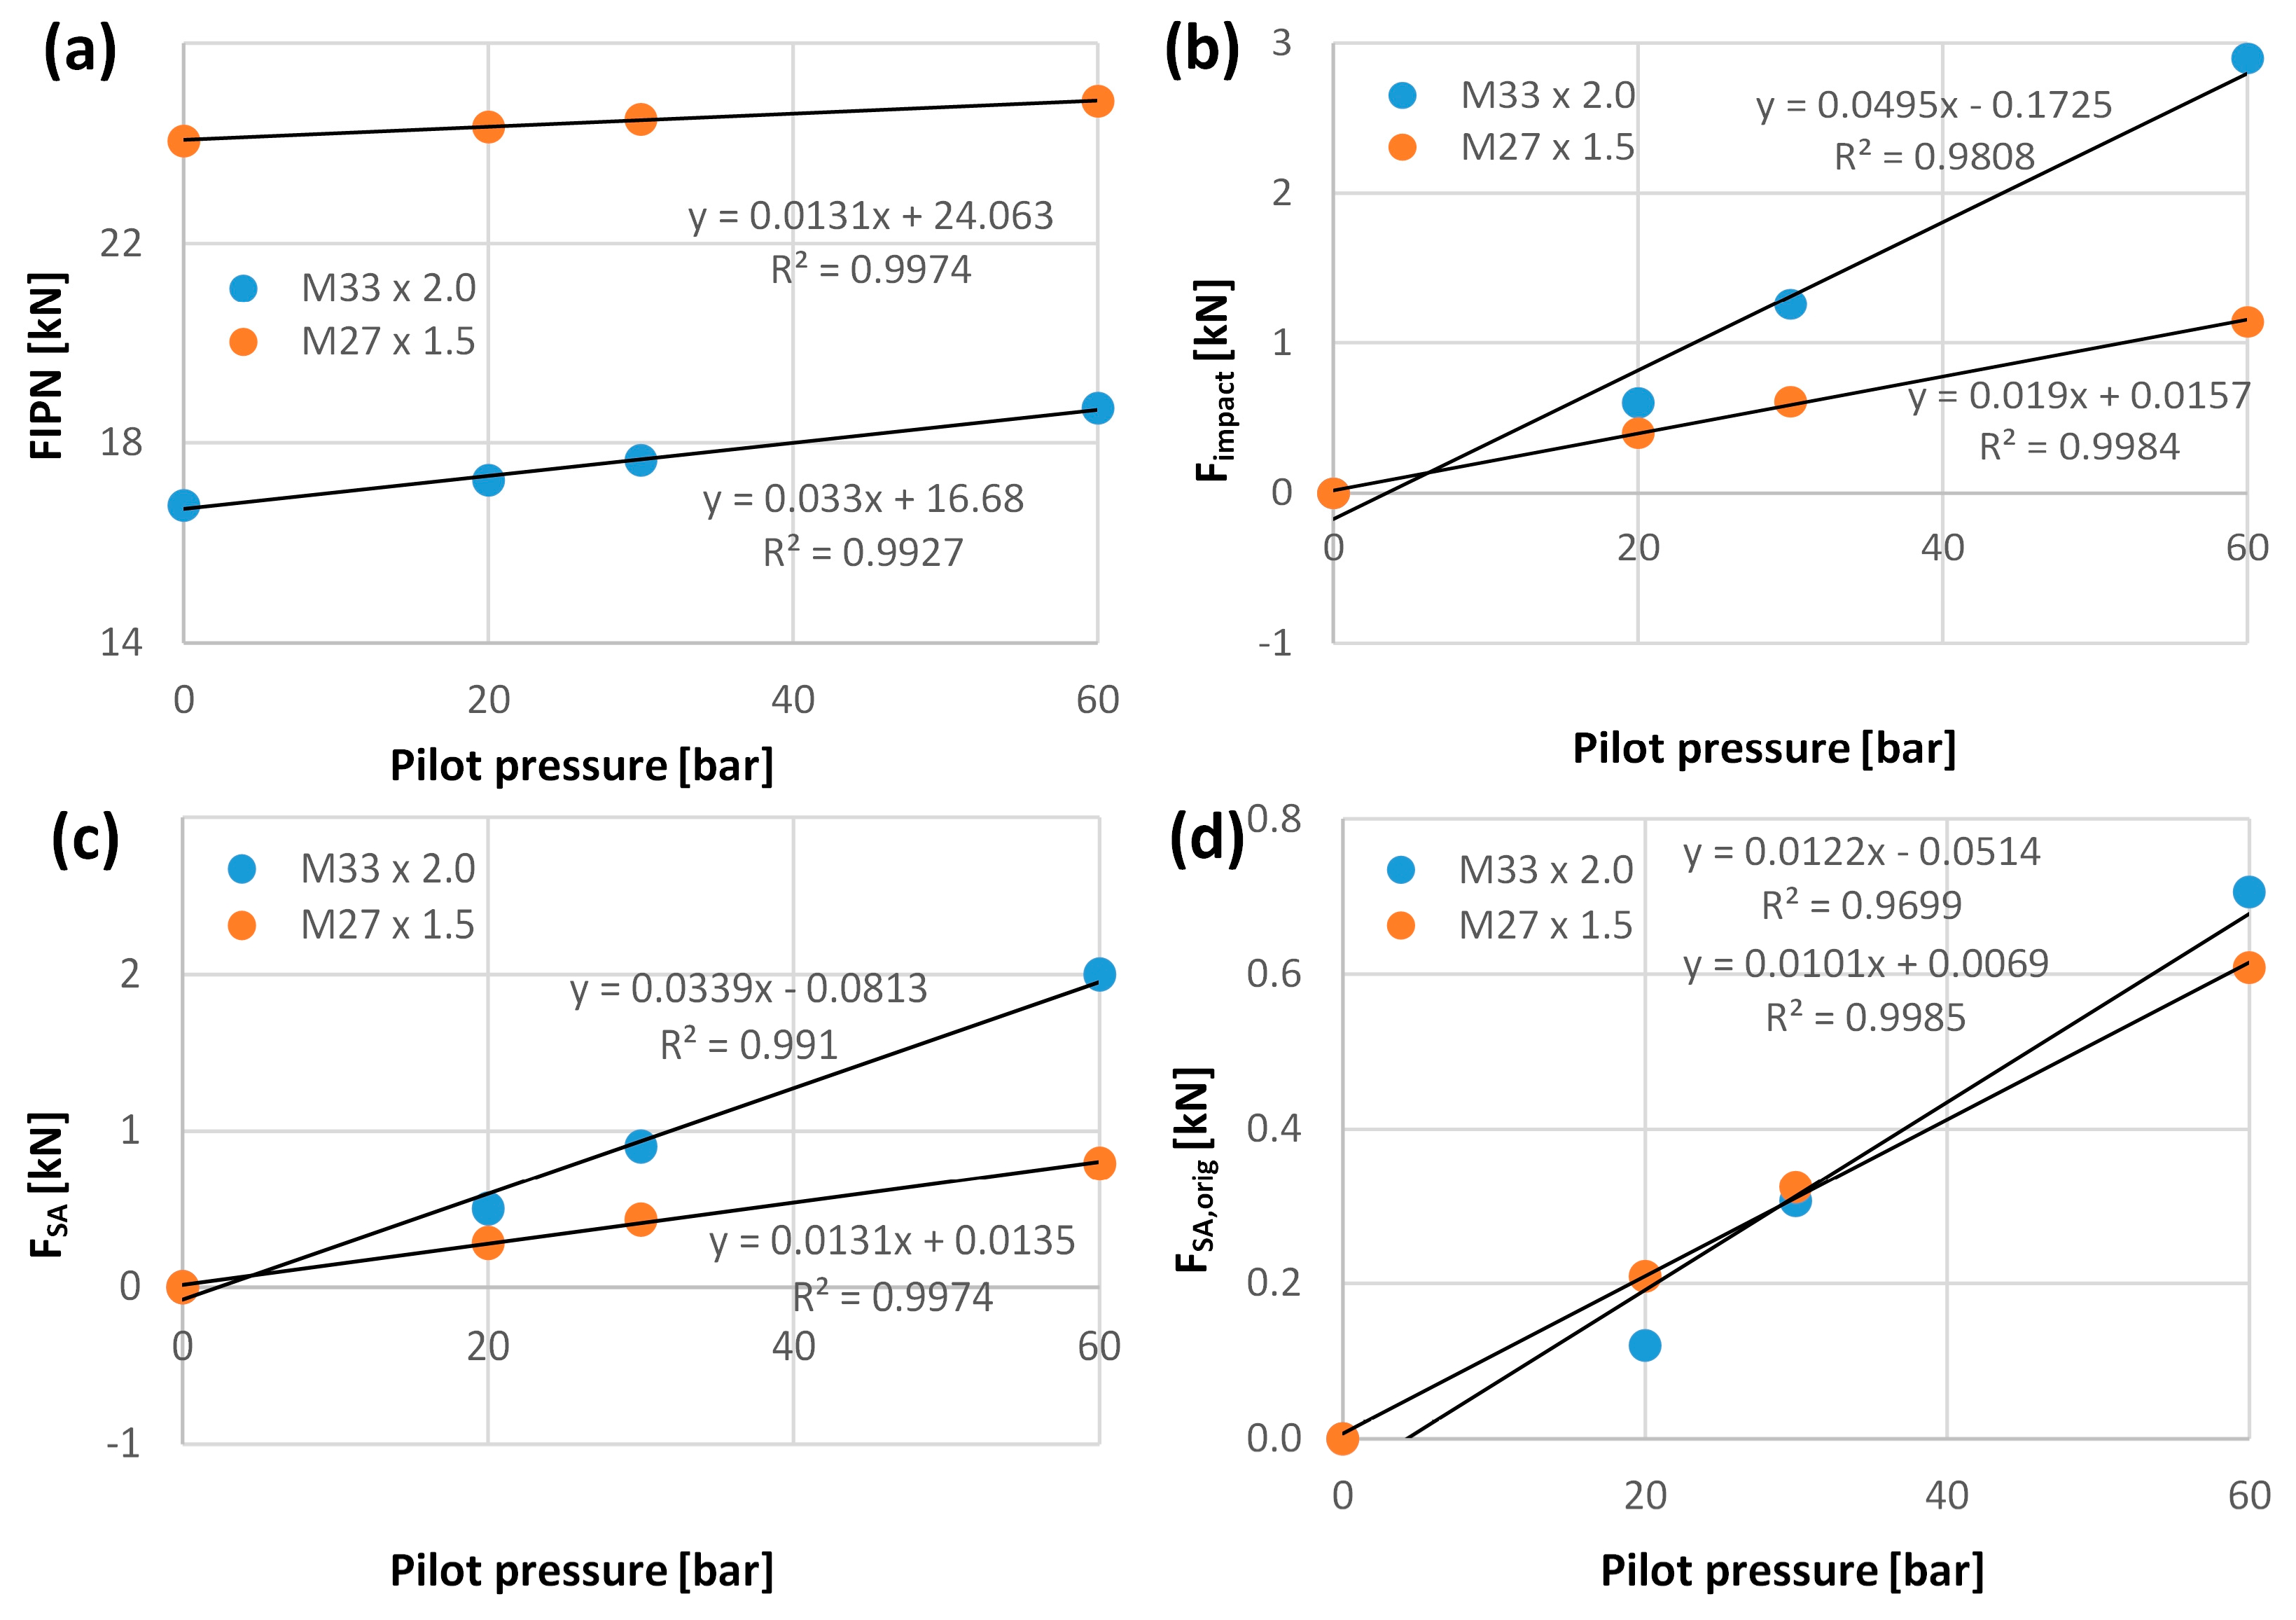
Stabilized results of both plug–valve connections at different pilot pressures are gathered in Table 3 and plotted in Figure 8. Since F A is practically the same as F i m p a c t , but shifted for Δ F s p r i n g (Equation (5)), only F i m p a c t is presented in Figure 8. Because F a c t is the same as p, only shifted (Equation (3)), it is also not shown in Figure 8.
Table 3. Measured and calculated stabilized results of the M33 × 2.0 and M27 × 1.5 plug–valve connections at different pilot pressures.
Figure 8. Measured and calculated forces of the M33 × 2.0 and M27 × 1.5 plug–valve connections at different pilot pressures. The forces were approximated by linear approximation functions. The deviations from the linear functions are given with coefficient of determination R2. (a) Measured force in the plug neck (FIPN), (b) measured impact force on the plug head, (c) additional force due to external spool force in the modified plugs, (d) additional force due to external spool force in the original plugs.
The force dependencies on pilot pressure in Figure 8 were approximated with linear functions (R2    0.97). By knowing these functions, the forces can be estimated also at other pilot pressures. Generally, the forces in the M33 × 2.0 plug–valve connection were more dependent on pilot pressure than in the M27 × 1.5 plug–valve connection, due to the larger spool area (Table 1).
The average stiffness ratios of the modified M33 × 2.0 and M27 × 1.5 plug–valve connections were 0.61 ± 0.018 and 0.65 ± 0.018, respectively, while the average stiffness ratios of the original connections were 0.21 ± 0.021 and 0.53 ± 0.005, respectively (Table 3). This means that the stiffness ratios of the modified M33 × 2.0 and M27 × 1.5 plug–valve connections were on average 65% and 18% higher than the stiffness ratios of their originals, respectively. In comparison to typical stiffness ratio values for general bolted connections, which are between 0.1 and 0.4 [2,3,4], the modified plug–valve connections were much higher, while their originals matched better. The high stiffness ratios in the modified plug–valve connections were mostly a consequence of the added slender cover bushings (Figure 4a).
From the measured F A and stiffness ratios ϕ o r i g of the original plug–valve connections, the additional load increases F S A , o r i g in the original plug–valve connections were calculated using Equation (7) (Table 3 and Figure 8d). F S A , o r i g had a similar dependency from the pilot pressure for both plug–valve connections. Knowledge of F S A , o r i g is important for dimensioning of the plug–valve connections on fatigue and presents the ultimate result of this study. Since their dependency on pilot pressure is described with linear approximation functions, F S A , o r i g at other pilot pressures can also be evaluated. F S A , o r i g were on average lower by 71.0% and 24.2% than the measured F S A in the modified M33 × 2.0 and M27 × 1.5 plug–valve connections, respectively.

3.2. Zoomed Forces

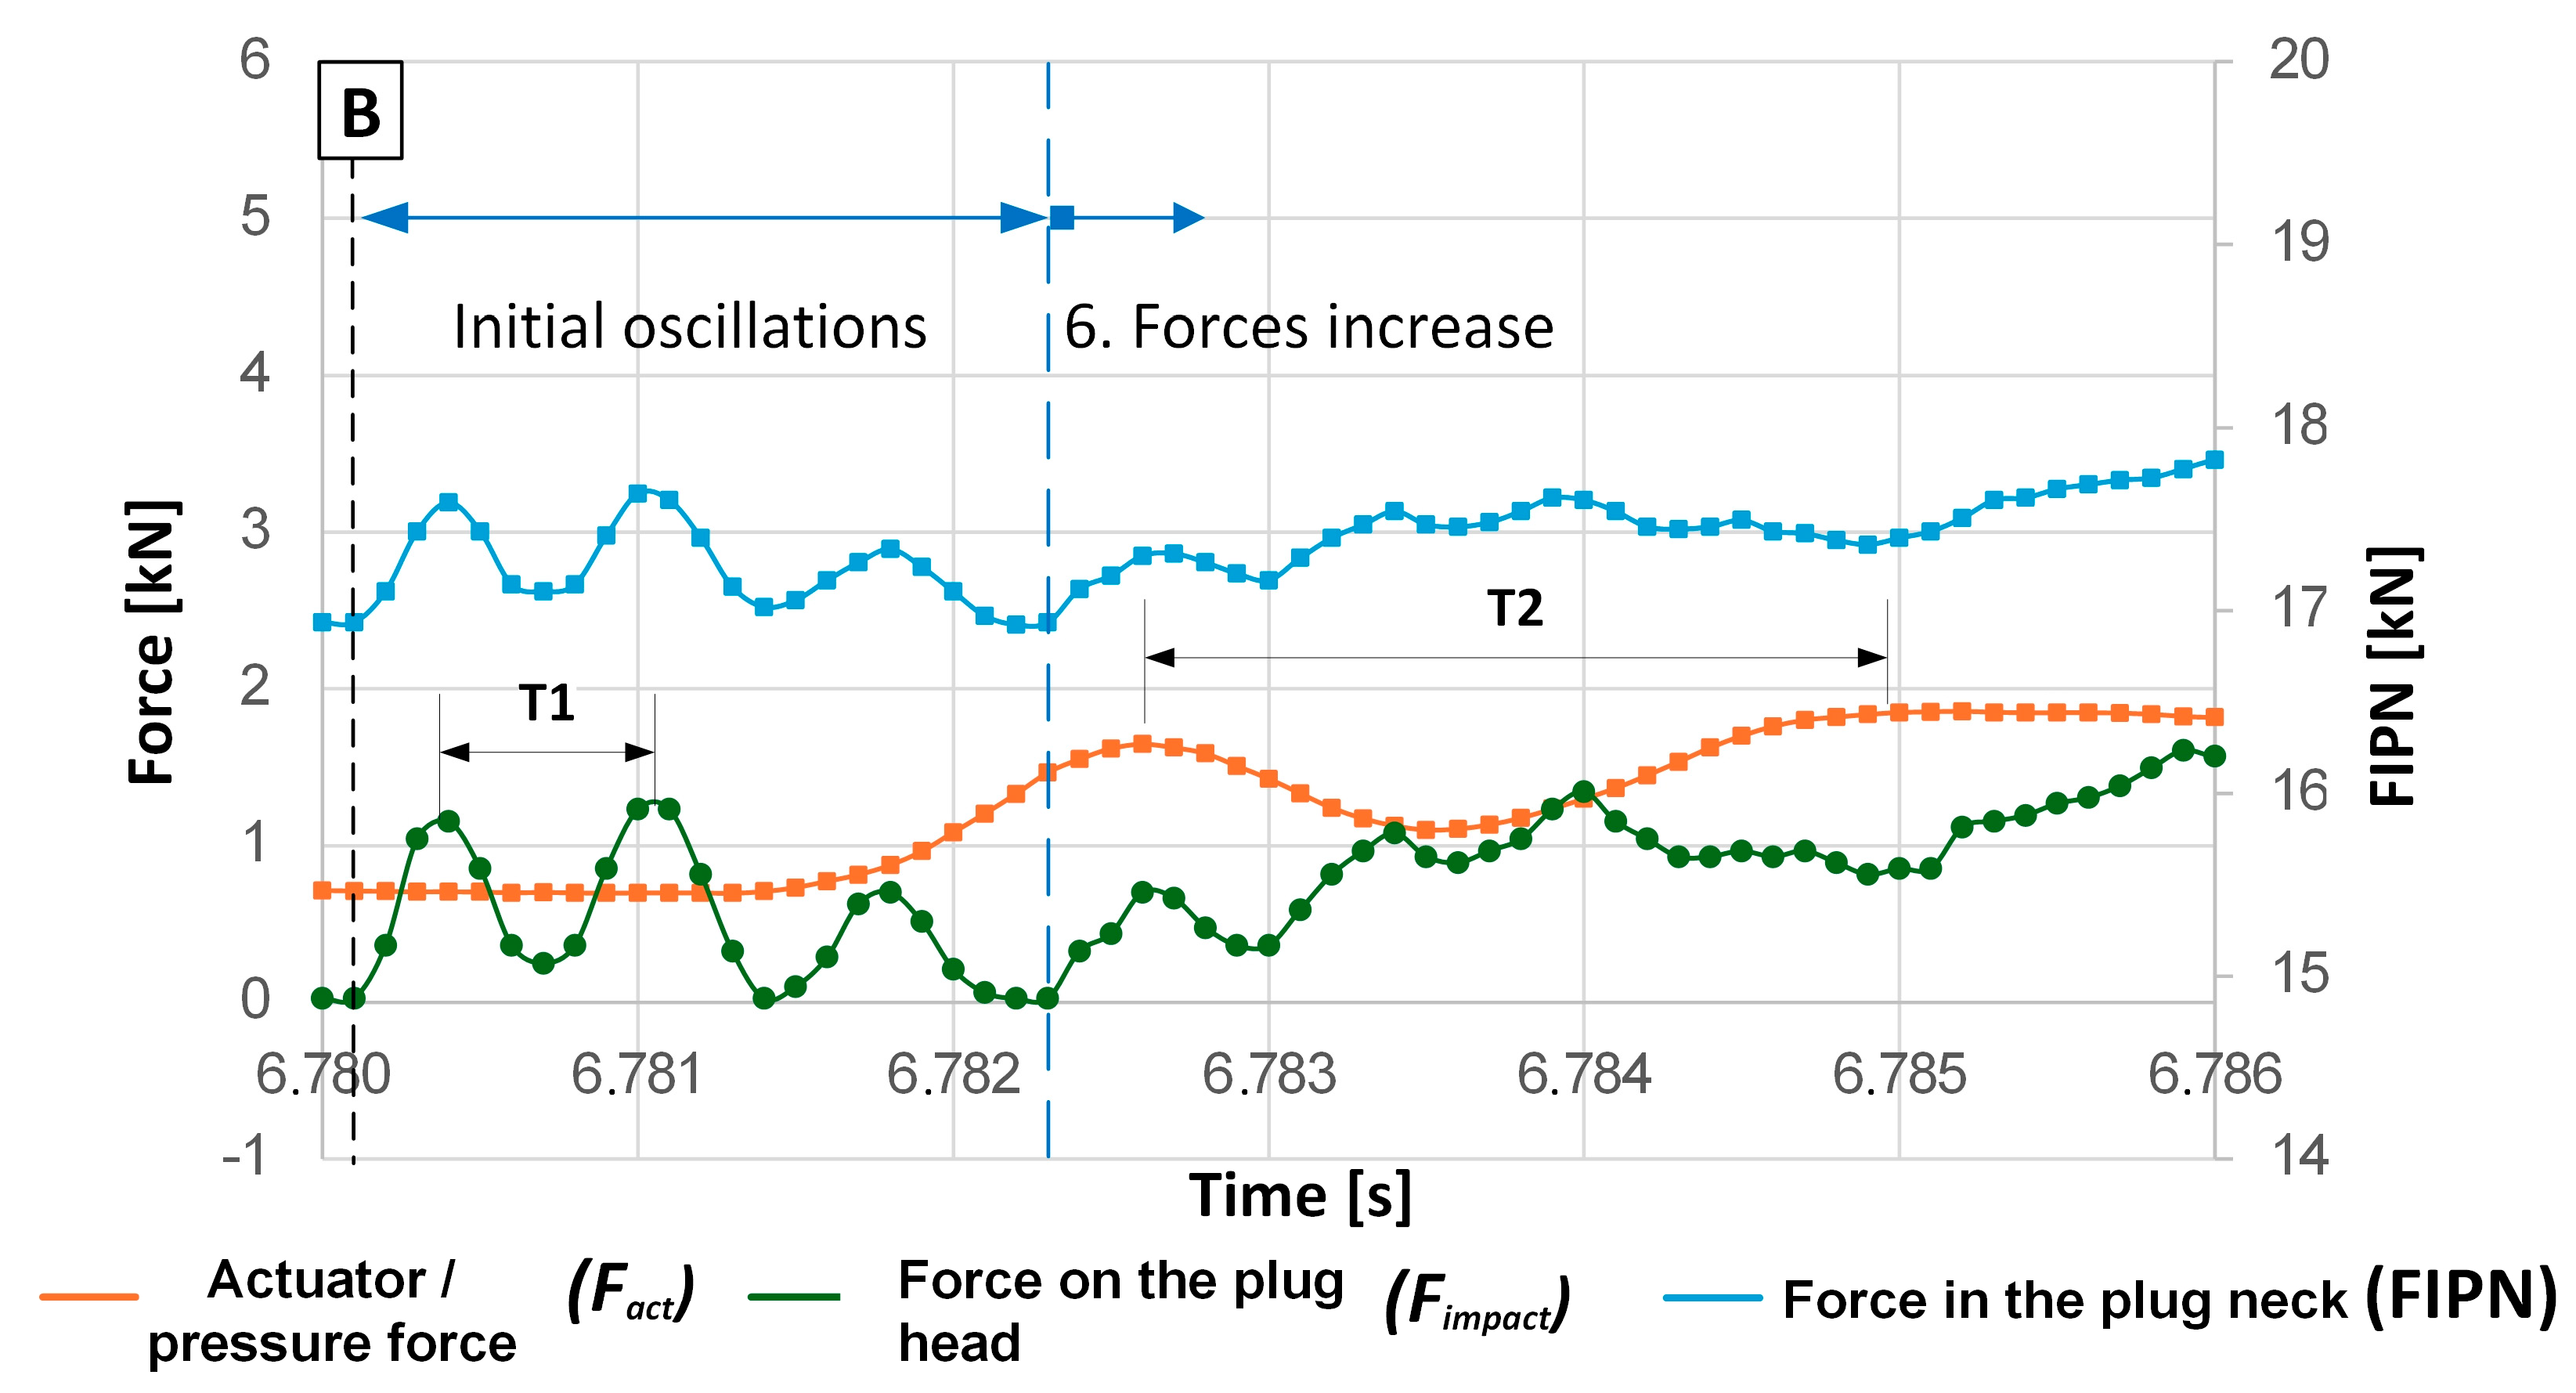
A closer look into the force diagrams at the beginning of the spool impact reveals that the forces did not just monotonically increase from the spool impact (point B), but they increased in an oscillating manner. This can be seen in the 2nd zoomed area (annotated in Figure 7) presented in Figure 9. After the second and third peak, F i m p a c t reached even zero Newtons, which indicates separation of the spool and the plug head. F i m p a c t and FIPN oscillated in phase with the same eigenfrequency ( ν 1 = 1 T 1 , Figure 9), while F a c t oscillated at a different eigenfrequency of the hydraulic system ( ν 2 = 1 T 2 , Figure 9). The differences between F a c t and   F i m p a c t or FIPN therefore also appeared to be due to the different eigenfrequencies.
Figure 9. Spool force on the plug head ( F i m p a c t ), force in the plug neck ( F I P N ) and actuator force ( F a c t ) in the 2nd zoomed area (annotated in Figure 7), i.e., at the beginning of the spool impact into the plug head. The results are presented for the M33 × 2.0 plug–valve connection at 60 bar of pilot pressure. B annotates the beginning of the spool movement.
A closer look into the force diagrams at the force peaks shows that the global force peaks of F i m p a c t and FIPN coincide with the F a c t or pilot pressure global peak (Figure 10).

3.3. Design Recommendations and Practical Considerations

  • Changes in design: The stiffness ratio corresponds directly to the ratio between the additional and actual external load applied to a preloaded connection (see Equation (10)). This implies that the fatigue strength of a plug–valve connection can be increased by decreasing its stiffness ratio. This can be achieved by decreasing the stiffness of the tensioned parts (plug stud) and increasing the stiffness of the clamped parts (valve housing), as recommended for preloaded bolts [30] (Figure 3). If the plug stiffness is reduced solely by decreasing its cross-sectional area, the stress in the plug will increase, which in turn will reduce its fatigue strength. Therefore, it is rather suggested to extend the stud of the plug in order to reduce its stiffness. However, such design changes also influence the sealing force, and should therefore be carefully balanced with the applied preload. Moreover, notch effects have a major influence on fatigue strength and should be minimized as much as possible.
  • Preload increase: According to previous studies on preloaded bolts [6,8,9], the preload levels should be as high as possible in order to increase the fatigue strength of the connections, provided that the peak stress at spool impact remains below the yield stress of the connection.
  • Preload accuracy: Attention should be paid to preload accuracy, since both excessively high and insufficient preload levels can lead to failure of the connection [4,14].
  • Preload stability: The preload may decrease over time, especially after repeated tightening of the plugs, which may also affect their life expectancy. To maintain stable preload, self-loosening of the plugs should be prevented. In case of repeated tightening of the plugs, they should be correctly retightened, considering the changed relationship between tightening torque and preload [24].
  • Pressure peak consideration: For determination of the influence of F A on the additional load in the plug F S A , the stabilized “static” values of the spool impact forces were used, rather than their peak values. This way the force–pressure relations were determined on a higher number of data points and were thus more reliable. Also, possible dynamic and other impact effects were avoided this way. However, in real-life applications, hydraulic valves can be connected to different hydraulic systems that express different pilot pressure peaks at the same nominal pressure. Although the user uses the valves at the prescribed nominal pressure, its peaks may be much higher, which may cause unexpected fatigue failures if these peaks are not considered in the valve design. Therefore, to achieve the expected life expectancy of the plugs, these pressure peaks should be considered in the plug–valve dimensioning.

3.4. Discussion on Measurement and Result Uncertainty

Because the results were obtained on minimal measurement points, the measurement uncertainty of the measured and calculated forces was estimated (Appendix A). However, on the measurement uncertainty of F S A , o r i g , also the uncertainty of the stiffness ratios ϕ , that were obtained from FE models, had influence. The accuracy of the FE models is primarily influenced by the uncertainties in the material models, boundary conditions, geometric simplifications, mesh discretization, contact definitions, and assumptions inherent to the constitutive model. In addition, numerical approximations introduced by the FE formulation itself further contribute to deviations between the FE model and the real physical system. Due to the cumulative influence of these factors, FE models can exhibit significant overall uncertainty. Therefore, complex FE models need to be validated by other methods. In the present study, basic static structural axisymmetric FE simulations were employed, where the threads were simplified as circular with no friction. Since such thread modelling is well established [31,32,33,34,35] and considered appropriate for evaluating axial load transfer and joint stiffness [31,35], the results from the FE simulations were assumed to be sufficiently accurate and were not further validated. The error in overall joint stiffness due to neglecting friction between the threads was estimated to be less than 4% according to previous studies on preloaded bolts [36].
However, the stiffness ratios ϕ are defined as ratios between the clamped and tensioned parts. Consequently, uncertainties are present in both the numerator and denominator. Since the error made in the FE simulations influences both quantities in a similar manner, part of the uncertainty cancels out when forming the ratio, resulting in a reduced overall uncertainty of the stiffness ratio.

3.5. Assumption of Same Stabilized Spool Impact Force in the Modified and Original Plug

For the original plug–valve connections, the same external loads F A acting on the plug head due to the spool impact (Equation (5)) were assumed. This assumption is reasonable because (i) the spool distance from the plug head at valve activation was the same in both cases, and (ii) the stabilized external force F A , which was mostly a consequence of pilot pressure (Figure 10), was used for determination of F S A , o r i g ; therefore, possible differences in dynamics at spool impact between the modified and original plug–valve connections had no influence on F S A , o r i g .

3.6. Future Studies

(i) The results of the study are a basis for future quantitative fatigue life assessment of plug–valve connections. (ii) For statistical relevance of the measured and calculated forces in this study, a larger number of plug–valve connections of the same size is suggested. (iii) In future studies, analysis of different plug–valve designs and sizes would be of great interest.

4. Conclusions

The design of preloaded threaded plug–valve connections is demanding, because they need to sustain high and frequent spool impact forces, assure sufficient sealing force, and should not self-loosen over time. On one hand, the plugs need to have sufficient structural and fatigue strength, while on the other hand they need to be compliant enough to reduce the influence of spool impact forces on the FIPN. For proper dimensioning of the plug–valve connections, it is crucial to know their loads. In the present study, the spool impact force and its influence on the FIPN were measured on two modified plug–valve connections, while FIPNs in the original plug–valve connections were estimated by the help of the stiffness ratios obtained from FE models. Based on estimated loads and knowledge on preloaded bolted connections, design recommendations to improve fatigue strength of the plug–valve connections were proposed: To reduce the oscillations of the FIPN, and thus to achieve a higher fatigue strength, the stiffness ratios of the connections should be decreased, which implies that the tensioned parts of the plugs should have lower stiffness and the clamping parts higher stiffness. Design and preload modifications of the connections should be carefully balanced, considering that their beneficial effects are limited to a certain extent. The methodology presented in the study enables assessment of impact-induced loads in preloaded threaded plugs and provides detailed insight into spool-impact forces. Since the study was performed on only two different plug–valve connections, the results of this study should be interpreted within the scope of the investigated plug–valve connections and testing conditions.

Author Contributions

Conceptualization, B.J., A.Č. and F.M.; methodology, B.J., A.Č., J.H. and F.M.; validation, B.J. and J.H.; analysis, B.J., J.H. and F.M.; investigation, B.J., J.H. and F.M.; resources, B.J., A.Č. and F.M.; data curation, B.J. and J.H.; writing—original draft preparation, J.H.; writing—review and editing, B.J., A.Č., J.H. and F.M.; supervision, B.J. and F.M.; project administration, B.J. and F.M.; funding acquisition, B.J. and F.M. All authors have read and agreed to the published version of the manuscript.

Funding

This work was supported by Poclain Hydraulics d.o.o., Slovenia, Žiri [grant number 20100109631, 2021].

Data Availability Statement

The original contributions presented in this study are included in the article. Further inquiries can be directed to the corresponding author.

Acknowledgments

The authors acknowledge Rok Jelovčan for providing help in the construction and assembly of the hydraulic test rig.

Conflicts of Interest

Author Anže Čelik was employed by the company Poclain Hydraulics d.o.o. The remaining authors declare that the research was conducted in the absence of any commercial or financial relationships that could be construed as a potential conflict of interest.

Nomenclature

Nomenclature and definitions used in the manuscript.
SymbolDefinitionUnit
Latin symbols
aSpool accelerationm/s2
a i Uncertainty of i-th quantity-
ASpool area exposed to pilot pressuremm2
c i Sensitivity coefficients-
d Spool diametermm
fSpring contraction/measured quantitymm
F a c t Actuator force acting on the spoolN
F A External loadN
F b p Back-pressure force acting on the spoolN
F d Hydraulic drag forceN
F f Friction force between the spool and valve housingN
F i m p a c t Spool impact forceN
FIPNForce in the plug neckN
F r e f Reference force applied on sensorsN
F s p r i n g Spring forceN
F S A Additional load increase due to the external loadN
F V Preload N
g Gravitational accelerationm/s2
k Stiffness of the springN/mm
k p Stiffness of the boltN/mm
k s Stiffness of the clamping partsN/mm
L1Lever arm between pivot and calibrated sensormm
L2Lever arm between pivot and weight applicationmm
mSpool masskg
m c a l i b Calibration masskg
pPilot pressurebar
R2Coefficient of determination-
TTime periods
u c ( y ) Total combined standard uncertaintyN
u ( x i ) Standard uncertainties of the input quantity estimates-
x i Source of uncertainty-
Greek symbols
δpCompliance of the clamping partsmm/N
δsCompliance of the tensioned partsmm/N
ϕ Stiffness ratio-
ν Eigenvalue frequencys−1
Subscripts
0Initial value-
fFinal value-
origValue of the original plug–valve connection-

Appendix A. Measurement Uncertainty

The measurement uncertainty estimation was made for F i m p a c t , FIPN, and F a c t of the modified M33 × 2.0 plug–valve connection in accordance with the JCGM guidelines [37]. The measurement uncertainties of the forces on the modified M27 × 1.5 plug–valve connection were assumed to be of similar size.
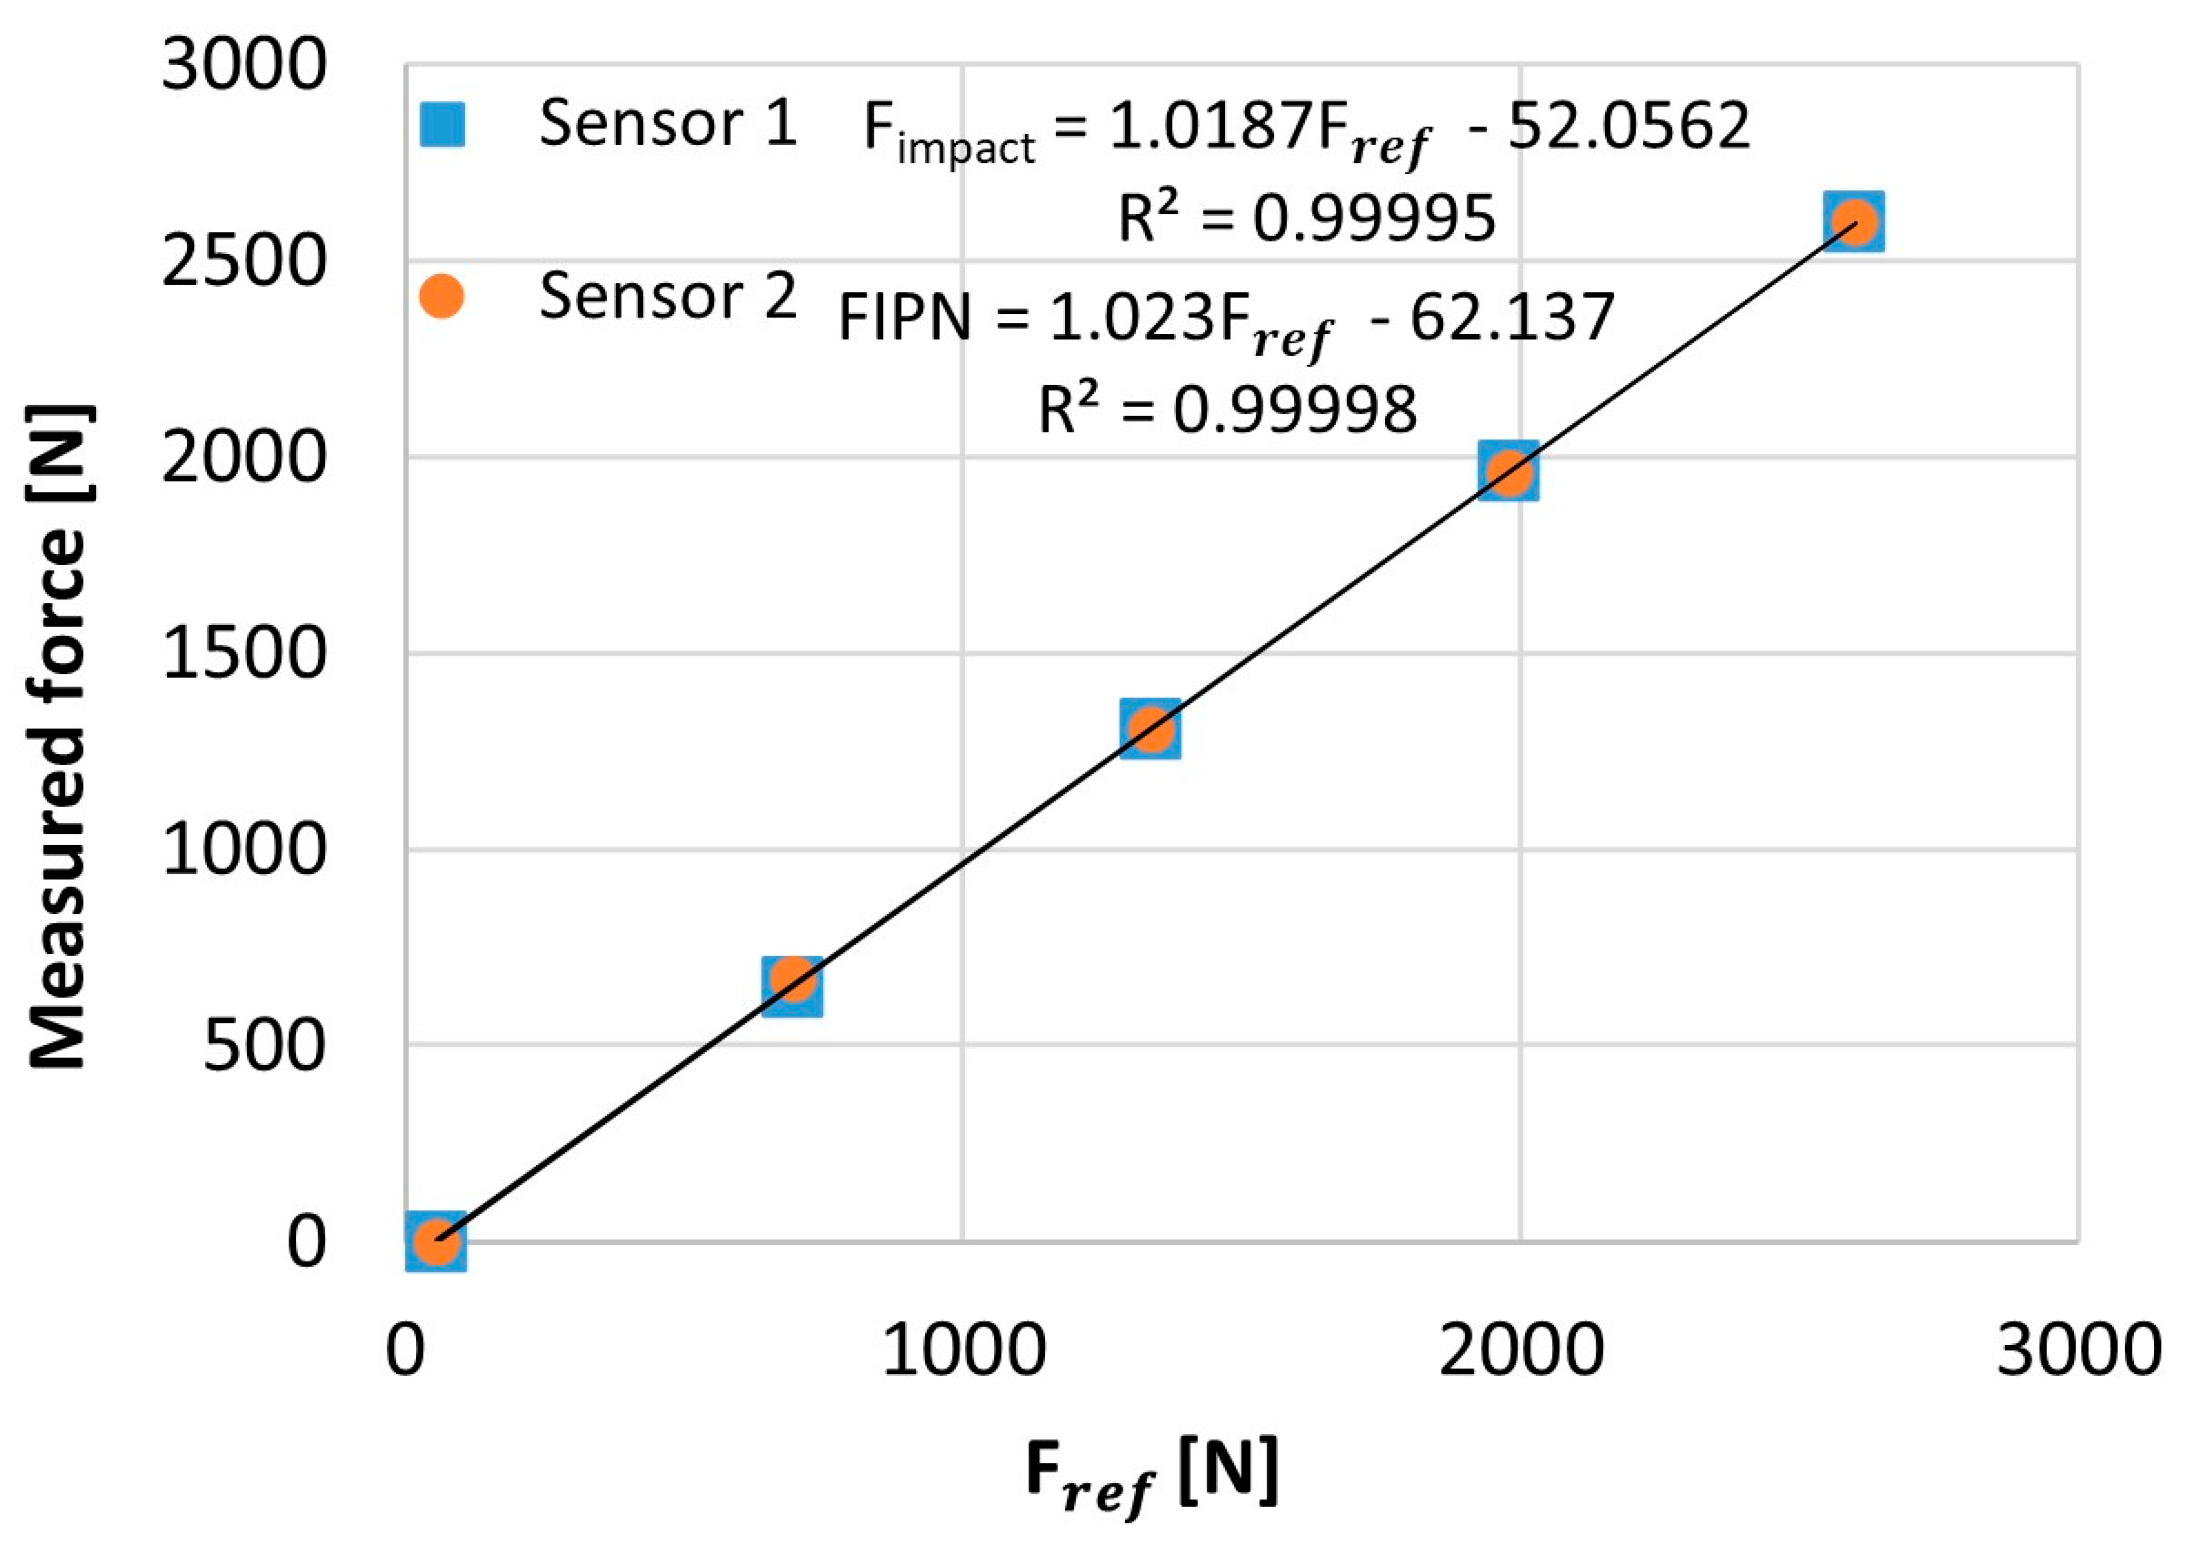
The calibration of force Sensors 1 and 2 of the modified plugs was performed by a special lever arm system [24]. Known weights of mass m c a l i b were applied at a lever arm L2 = 1675 mm, producing an increased force at lever arm L1 = 250 mm on the head of the calibrated plugs. The reference load applied to force Sensors 1 and 2 thus yielded:
F r e f = m c a l i b · g · L 2 L 1
where g represents gravitational acceleration. The calibration results for Sensors 1 and 2 of the modified M33 × 2.0 plug–valve connection are presented in Figure A1, including their linear approximation functions (R2 > 0.9999).
Figure A1. Calibration of Sensors 1 and 2 of the modified M33 × 2.0 plug including their linear approximations and coefficients of determination R2.
As sources of uncertainty for FIPN and F i m p a c t , the following were considered: mass of the calibration weights ( m c a l i b = ± 10   g ), location of the reference force application ( L 1 = ± 5 mm), calibration approximation functions (Figure A1), and measurement repeatability. The uncertainty due to measurement repeatability was determined over four consecutive loadings ( m c a l i b  = 49.16 kg, F r e f = 3231.4   N ). As sources of uncertainty for F a c t , pilot pressure ( p = ± 0.1 bar) and spool diameter ( d = ± 0.1 mm) were considered. Uncertainties related to the spring force Δ F s p r i n g , temperature influence, and the stiffness ratio ϕ (see Section 3.4) were not considered.
All sources of uncertainty were regarded as independent with rectangular distribution, except for uncertainties due to measurement repeatability, which were regarded to have a normal distribution. The total combined standard uncertainty of the results was calculated as follows:
u c ( y ) = i = 1 N f x i 2 u 2 ( x i )
where f x i = c i are the sensitivity coefficients or partial derivatives of the measured quantity f by its input quantity estimates x i (sources of uncertainty), and u ( x i ) are the standard uncertainties of the estimates of the input quantities. According to Equation (A1) and linear approximation functions (Figure A1), F i m p a c t and FIPN may be written in their extended forms as:
F i m p a c t = 1.019 · m c a l i b · g · L 2 L 1 52.056
F I P N = 1.023 · m c a l i b · g · L 2 L 1 62.137
The sensitivity coefficients for the error of the calibration weights and the location of the force application for F i m p a c t thus yield:
c 1 = F i m p a c t m c a l i b = 1.019 · g · L 2 L 1
c 2 = F i m p a c t L 1 = 1.019 · m c a l i b · g · L 2 L 1 2
And for FIPN:
c 1 = F I P N m c a l i b = 1.023 · g · L 2 L 1
c 2 = F I P N L 1 = 1.023 · m c a l i b · g · L 2 L 1 2
The sensitivity coefficients of the approximation functions and measurement repeatability were set to 1.
According to Equation (3) for F a c t calculation and the equation for the cross-sectional area of the spool ( A = π · d 2 / 4 ), the sensitivity coefficients for the pilot pressure error and spool diameter error are:
c 1 = F a c t p = A
c 2 = F a c t d = p · π · d / 2
The standard uncertainties for rectangularly distributed uncertainties were calculated as:
u = a 3
And for normally distributed uncertainties as:
u = S T D n
where a is the upper or lower boundary of uncertainty, S T D is the standard deviation, and n is the number of measurement points. For the approximation models, the maximum deviation observed during calibration was considered.
By multiplying the sensitivity coefficients c i by the standard uncertainties u ( x i ) , the contributions of specific sources to the combined standard measurement uncertainty at a confidence level of 68.3% were calculated. The combined uncertainties of the measured and calculated forces for the modified M33 × 2.0 plug at a confidence level of 95.5% (duplicated combined standard measurement uncertainties) are gathered in Table A1, while the specific intermediate values needed for their calculation are gathered in Table A2, Table A3 and Table A4.
Table A1. Total combined standard uncertainties of the measured and calculated forces for the modified M33 × 2.0 plug at a confidence level of 95.5%.
Table A2. Specific values for calculation of the measurement uncertainty of F i m p a c t measured on Sensor 1 for the modified M33 × 2.0 plug.
Table A3. Specific values for calculation of the measurement uncertainty of FIPN measured on Sensor 2 for the modified M33 × 2.0 plug.
Table A4. Specific values for calculation of the measurement uncertainty of F a c t for the modified M33 × 2.0 plug.

References

  1. Čelik, A.; Jerman, B.; Majdič, F. Design guidelines for non-standard plugs. In Proceedings of the International Conference Fluid Power 2023, Maribor, Slovenia, 20–21 September 2023. [Google Scholar]
  2. Budynas, R.G.; Nisbett, J.K. Shigley’s Mechanical Engineering Design, 10th ed.; McGrawHill: New York, NY, USA, 2015. [Google Scholar]
  3. Schmid, S.R.; Hamrock, B.J.; Jacobson, B.O. Fundamentals of Machine Elements, 3rd ed.; CRC Press: Boca Raton, FL, USA, 2014. [Google Scholar]
  4. Bickford, J. An Introduction to the Design and Behavior of Bolted Joints, 3rd ed.; Revised and Expanded; Taylor & Francis: New York, NY, USA, 1995. [Google Scholar]
  5. Schütz, W. A history of fatigue. Eng. Fract. Mech. 1996, 54, 263–300. [Google Scholar] [CrossRef]
  6. Chapman, I.; Newnham, J.; Wallace, P. The Tightening of Bolts to Yield and Their Performance under Load. J. Vib. Acoust. 1986, 108, 213–221. [Google Scholar] [CrossRef]
  7. Croccolo, D.; De Agostinis, M.; Vincenzi, N. Failure analysis of bolted joints: Effect of friction coefficients in torque-preloading relationship. Eng. Fail. Anal. 2011, 18, 364–373. [Google Scholar] [CrossRef]
  8. Kraemer, F.; Klein, M.; Oechsner, M. Fatigue strength of metric steel screws depending on pre-load and nut type. Eng. Fail. Anal. 2020, 112, 104484. [Google Scholar] [CrossRef]
  9. Mínguez, J.M.; Vogwell, J. Effect of torque tightening on the fatigue strength of bolted joints. Eng. Fail. Anal. 2006, 13, 1410–1421. [Google Scholar] [CrossRef]
  10. Jiang, Y.Y.; Zhang, M.; Park, T.W.; Lee, C.H. An experimental study of self-loosening of bolted joints. J. Mech. Des. 2004, 126, 925–931. [Google Scholar] [CrossRef]
  11. VDI 2230; Systematic Calculation of High Duty Bolted Joints—Joints with One Cylindrical Bolt. Verein Deutscher Ingenieure (VDI): Düsseldorf, Germany, 2014.
  12. Shigley, J.E.; Mitchell, J.D. Mechanical Engineering Design, 4th ed.; McGraw-Hill: New York, NY, USA, 1983. [Google Scholar]
  13. Motosh, N. Development of Design Charts for Bolts Preloaded up to Plastic Range. J. Eng. Ind. 1976, 98, 849–851. [Google Scholar] [CrossRef]
  14. Arghavani, J.; Derenne, M.; Marchand, L. Sealing performance of gasketed bolted flanged joints: A fuzzy decision support system approach. Int. J. Adv. Manuf. Technol. 2001, 17, 2–10. [Google Scholar] [CrossRef]
  15. Duffey, T.A. Optimal Bolt Preload for Dynamic Loading. Int. J. Mech. Sci. 1993, 35, 257–265. [Google Scholar] [CrossRef]
  16. Kashyzadeh, R.K.; Ghorbani, S.; Kasimovich, A.-A.M. Common causes of failures in the industrial bolt and nut connections. Eng. Fail. Anal. 2025, 173, 109431. [Google Scholar] [CrossRef]
  17. Feng, X.-Z.; Liu, X.-C.; Chen, X.; Zhou, W.; Tao, Y.-L.; Zhang, A.-l. Fatigue performance of Grade 10.9 M20 high-strength bolts in L-shaped component connections. Eng. Fail. Anal. 2026, 187, 110583. [Google Scholar] [CrossRef]
  18. Feghhi, M. Experimental and Finite Element Studies of Shock Transmission Through Bolted Joints. Ph.D. Thesis, Uneversity of Nevada, Las Vegas, NV, USA, 2007. [Google Scholar] [CrossRef]
  19. Somasundaram, D.S.; Trabia, M.B.; O’Toole, B.J. A methodology for predicting high impact shock propagation within bolted-joint structures. Int. J. Impact Eng. 2014, 73, 30–42. [Google Scholar] [CrossRef]
  20. Zhang, Y.; Jiang, W.; Guo, D.M.; Zhao, Z.F.; Yin, Z.H. Study on dynamic mechanical properties of prestressed bolt group under impact load. Structures 2024, 67, 107024. [Google Scholar] [CrossRef]
  21. Amir, B.; Lomnitz, A.; Kochavi, E.; Gruntman, S.; Sadot, O. Experimental and numerical studies on dynamic mechanical properties of threads under impact loads. Int. J. Impact Eng. 2023, 176, 104555. [Google Scholar] [CrossRef]
  22. Zheng, M.P.; Liu, Z.F.; Yan, X.; Niu, N.N.; Zhang, T.; Li, Y. Initial losing behavior of pre-tightening force for threaded fastener during repeated tightening. Eng. Fail. Anal. 2022, 134, 106021. [Google Scholar] [CrossRef]
  23. Zheng, Q.; Guo, Y.C.; Wei, Y.P.; Wang, Y.C.; Wang, X. Loosening of steel threaded connection subjected to axial compressive impact loading. Int. J. Impact Eng. 2020, 144, 103662. [Google Scholar] [CrossRef]
  24. Hladnik, J.; Majdic, F.; Celik, A.; Jerman, B. Dependence of the Preload on the Tightening Torque for Hydraulic Plugs. Appl. Sci. 2024, 14, 11920. [Google Scholar] [CrossRef]
  25. Zhou, W.; Wu, T.; Meng, M.; Huang, F.; Zhang, D. Loosening mechanism and evaluation method of double shear connecting bolts under lateral vibration. Eng. Fail. Anal. 2026, 185, 110380. [Google Scholar] [CrossRef]
  26. Herakovič, N. Flow-force analysis in a hydraulic sliding-spool valve. Strojarstvo 2009, 51, 555–564. [Google Scholar]
  27. Bordovsky, P.; Schmitz, K.; Murrenhoff, H. CFD Simulation and Measurement of Flow Forces Acting on a Spool Valve. In Proceedings of the 10th International Fluid Power Conference, Dresden, Germany, 8–10 March 2016. [Google Scholar]
  28. Li, R.; Sun, Y.; Wu, W.; Zhang, P.; Li, D.; Lin, J.; Xia, Y.; Sun, Q. Review of the Research on and Optimization of the Flow Force of Hydraulic Spool Valves. Processes 2023, 11, 2183. [Google Scholar] [CrossRef]
  29. NI Corp. LabVIEW User Manual. Available online: https://www.ni.com (accessed on 11 May 2026).
  30. Okorn, I.; Nagode, M.; Klemenc, J.; Oman, S. Analysis of Additional Load and Fatigue Life of Preloaded Bolts in a Flange Joint Considering a Bolt Bending Load. Metals 2021, 11, 449. [Google Scholar] [CrossRef]
  31. Sun, Y.J.; Liao, R.D. The Effect of Helix on the Nonlinear Analysis of Threaded Connection. Adv. Mater. Res. 2011, 148–149, 1741–1744. [Google Scholar] [CrossRef]
  32. Chen, J.-J.; Shih, Y.-S. A Study of the Helical Effect on the Thread Connection by Three Dimensional Finite Element Analysis. Nucl. Eng. Des. 1999, 191, 109–116. [Google Scholar] [CrossRef]
  33. Lehnhoff, T.F.; Bunyard, B.A. Effects of Bolt Threads on the Stiffness of Bolted Joints. J. Press. Vessel. Technol. 2001, 123, 161–165. [Google Scholar] [CrossRef]
  34. Sethuraman, R.; Kumar, T.S. Finite Element Based Member Stiffness Evaluation of Axisymmetric Bolted Joints. J. Mech. Des. 2009, 131, 011012. [Google Scholar] [CrossRef]
  35. Cardoso, R.C.; Nascimento, B.L.; Thompson, F.F.; Griza, S. Study of Bolted Joint Axial Stiffness Using Finite Element Analyses, Experimental Tests, and Analytical Calculations. Proc. Inst. Mech. Eng. Part C J. Mech. Eng. Sci. 2020, 234, 4671–4681. [Google Scholar] [CrossRef]
  36. Zhang, Y.; Wang, Q.; Liu, H. Stiffness Calculation Model of Thread Connection Considering Friction Factors. Math. Probl. Eng. 2019, 2019, 8424283. [Google Scholar] [CrossRef]
  37. JCGM 100:2008; Evaluation of Measurement Data—Guide to the Expression of Uncertainty in Measurement. Joint Committee for Guides in Metrology: Geneva, Switzerland, 2008.
Disclaimer/Publisher’s Note: The statements, opinions and data contained in all publications are solely those of the individual author(s) and contributor(s) and not of MDPI and/or the editor(s). MDPI and/or the editor(s) disclaim responsibility for any injury to people or property resulting from any ideas, methods, instructions or products referred to in the content.

Article Metrics

Citations

Article Access Statistics

Multiple requests from the same IP address are counted as one view.