


Abstract
Structural health monitoring of thick-walled industrial components remains challenging due to modal superposition and dispersion effects that limit conventional time-of-flight-based guided-wave analysis. This study proposes an active excitation-based monitoring framework using a self-developed flexible Macro Fiber Composite (MFC) transducer for defect characterization in 25 mm thick aluminum plates. Controlled three-cycle tone-burst excitation at 350 kHz was introduced, and the resulting elastic wave responses were analyzed using Short-Time Fourier Transform (STFT)-based time–frequency energy and spectral bandwidth metrics. Artificial V-shaped notches with depths of 10% and 30% of the plate thickness were introduced to evaluate defect severity. Compared to the intact specimen, the 10% notched plate exhibited a 22.5% reduction in STFT-based energy and a 3.37% decrease in spectral bandwidth, while the 30% notched specimen showed reductions of 37.5% and 7.78%, respectively. The results demonstrate that defect-induced structural discontinuities in thick plates not only attenuate overall guided-wave energy but also alter frequency distribution characteristics. The proposed approach enables quantitative defect evaluation without explicit modal separation and validates the dual actuation and sensing capability of the flexible MFC transducer, supporting the feasibility of transitioning from passive acoustic emission monitoring to an active, self-diagnostic structural health monitoring framework for thick industrial structures.
1. Introduction
Structural health monitoring (SHM) has become increasingly important in industrial infrastructures such as aerospace systems, power generation facilities, pressure vessels, and pipeline networks, where early-stage damage detection is critical for ensuring operational safety and reducing maintenance costs [1,2]. Among various nondestructive evaluation (NDE) techniques, acoustic emission (AE) technology has been widely adopted due to its capability to detect high-frequency elastic waves generated by damage-related phenomena such as crack initiation, friction, wear, and corrosion [1,3]. Unlike conventional inspection methods that require periodic shutdowns, AE enables real-time monitoring by capturing transient elastic waves emitted at the onset of structural degradation [2].
Despite these advantages, AE-based passive monitoring presents inherent limitations. In conventional AE systems, signal acquisition depends entirely on spontaneous elastic wave generation associated with active damage events. This event-driven characteristic restricts detection capability in situations where damage evolves gradually or remains subcritical, such as corrosion, fatigue accumulation, or material degradation under low-stress conditions. Under such circumstances, detectable AE activity may be minimal or intermittent, limiting early-stage detection reliability [4]. As a result, structural deterioration may progress unnoticed until reaching a critical threshold.
In addition to this fundamental limitation, practical industrial environments introduce various sources of noise that degrade signal quality. Mechanical vibration, electromagnetic interference, and operational disturbances can contaminate AE signals, complicating damage identification [5]. To address these challenges, advanced signal representation and feature extraction techniques such as wavelet transform, Short-Time Fourier Transform (STFT), and machine learning-based methods have been employed to facilitate discrimination between structural response and noise components [6,7,8]. However, while these approaches enhance signal interpretation under noisy conditions, they do not fundamentally resolve the difficulties associated with modal superposition and dispersion in thick structures.
A more fundamental limitation arises when applying Lamb-wave-based SHM approaches to thick industrial structures. Although guided waves have been applied to various structural geometries, a substantial portion of experimental validations has been conducted on relatively thin plate configurations where low-order Lamb modes dominate and modal separation is feasible [9,10]. In thin-plate structures, only a limited number of low-order Lamb wave modes are excited within the selected frequency range. Because these modes propagate with different group velocities, their corresponding wave packets can be separated in the time domain. This separation enables reliable application of time-of-flight (ToF)-based defect localization techniques.
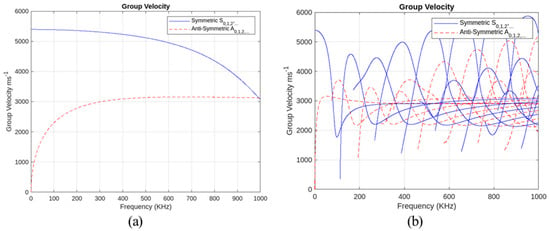
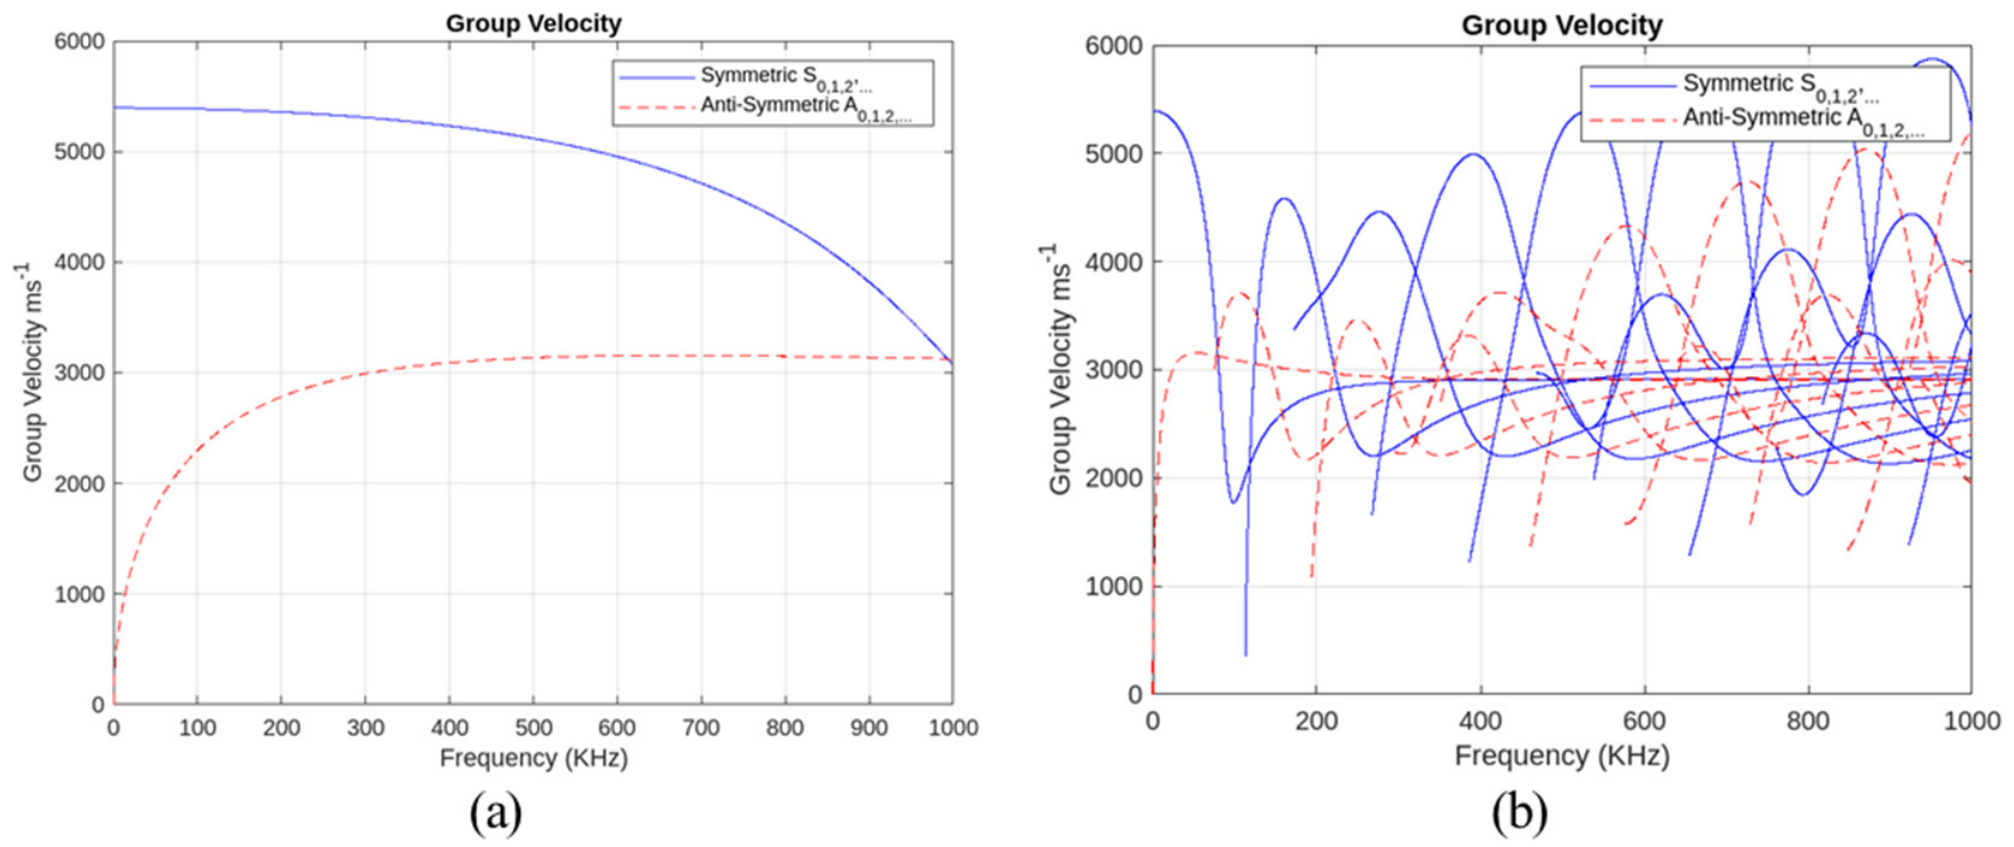
However, as structural thickness increases, the frequency–thickness product rises, and the number of propagating Lamb wave modes increases significantly within a given frequency range [11,12]. This effect is illustrated in Figure 1, where the group velocity dispersion curves for 2 mm and 25 mm aluminum plates are compared. In thick plates, higher-order symmetric and antisymmetric modes coexist, and their group velocities tend to converge, resulting in severe modal superposition and waveform overlap [13]. The increased modal density, combined with dispersion effects, makes it difficult to isolate distinct modal arrivals in the time domain. Therefore, methodologies validated primarily under thin-plate conditions may not be directly transferable to thick industrial components.
Figure 1.
Group velocity dispersion curves of Lamb waves in aluminum plates: (a) 2 mm plate; (b) 25 mm plate.
Furthermore, thick structures exhibit increased attenuation and frequency-dependent scattering due to geometric discontinuities and internal material damping [14]. Local stiffness reduction caused by defects induces partial reflection, mode conversion, and redistribution of spectral energy across multiple frequency components. Under these conditions, conventional ToF-based defect localization methods become unreliable, as isolating individual modal arrivals becomes impractical. Consequently, an analytical framework that does not rely on explicit mode separation but instead captures global changes in time–frequency energy distribution is required.
Time–frequency analysis techniques, including STFT and wavelet transform, have been widely used in structural damage detection due to their ability to represent transient elastic wave behavior in both time and frequency domains [6,15,16]. Among these methods, STFT provides consistent frequency resolution across the analyzed bandwidth and offers computational efficiency suitable for real-time implementation [15]. Unlike wavelet-based approaches that provide scale-dependent resolution, STFT maintains uniform frequency resolution, enabling more straightforward quantitative comparison of spectral energy within selected frequency bands. This characteristic is particularly advantageous for defect characterization in thick structures, where modal overlap complicates conventional time-domain interpretation.
To overcome the limitations of passive AE monitoring, active excitation-based monitoring has gained increasing attention. In active monitoring, externally generated excitation signals are periodically introduced into the structure, enabling evaluation of structural integrity independent of spontaneous damage events [4,17]. This approach allows not only damage detection but also system self-diagnosis, including assessment of sensor attachment conditions and signal transmission consistency. Such capabilities are particularly valuable in industrial environments where long-term monitoring reliability is essential.
In this study, an active excitation-based monitoring strategy is proposed using a self-developed flexible Macro Fiber Composite (MFC) transducer. MFC transducers consist of aligned piezoelectric fibers embedded in a polymer matrix, providing both actuation and sensing functionality while maintaining mechanical flexibility [18,19,20]. Unlike conventional rigid ceramic AE sensors, flexible MFC transducers can conform to curved industrial surfaces, thereby improving contact stability and expanding applicability to piping systems and pressure vessels. The dual functionality of the MFC enables its use as both an actuator for wave generation and a sensor for response acquisition, facilitating compact and integrated monitoring configurations [21].
To experimentally validate the proposed framework, tone-burst excitation signals were introduced into 25 mm thick aluminum plates containing artificial V-shaped notches of varying depth. This thickness represents a structural regime in which high-order Lamb wave modes are significantly present within the excitation bandwidth, leading to pronounced modal superposition effects [11,12]. Elastic wave responses were analyzed using STFT-based energy and spectral bandwidth metrics to quantify defect-induced changes in time–frequency characteristics without relying on explicit modal identification.
The primary contributions of this study are summarized as follows:
- Experimental validation of active guided-wave monitoring in a 25 mm thick aluminum plate where modal superposition is significant.
- Quantitative defect characterization using STFT-based energy and spectral bandwidth metrics that do not require explicit mode separation.
- Demonstration of dual actuation and sensing capability of a flexible MFC transducer in thick structures.
- Evaluation of the feasibility of transitioning from passive AE monitoring to active, self-diagnostic SHM for industrial components.
Through these contributions, this study provides a practical and experimentally validated framework for active elastic wave monitoring in thick structures, addressing limitations of conventional passive AE approaches and extending guided-wave-based SHM to more realistic industrial geometries. The present study considers a simplified defect configuration using V-shaped notches with two depths. The primary objective is to evaluate the sensitivity of STFT-based indicators to defect severity under controlled conditions while also demonstrating the feasibility of active sensing using a flexible MFC transducer. Extension to more complex and realistic damage scenarios will be addressed in future work.
2. Time–Frequency Analysis Methodology
2.1. Rationale for Time–Frequency Analysis in Thick Structures
As discussed in Section 1, thick-plate structures exhibit increased modal density and pronounced dispersion effects within the excitation bandwidth. Under such conditions, multiple higher-order Lamb wave modes coexist and overlap in the time domain, rendering explicit mode separation and arrival-time-based analysis unreliable. Instead of isolating individual modal components, this study adopts a time–frequency-based framework that captures global redistribution of spectral energy induced by structural discontinuities. By analyzing variations in energy concentration and spectral spreading, defect severity can be quantitatively evaluated without explicit identification of specific Lamb wave modes. Among various time–frequency methods, the Short-Time Fourier Transform (STFT) was selected due to its uniform frequency resolution and computational simplicity, which facilitates direct quantitative comparison of spectral energy within predefined frequency bands. The overall experimental workflow consisted of signal acquisition, preprocessing, STFT-based feature extraction, and defect characterization based on time–frequency metrics [22].
2.2. STFT Implementation and Parameter Selection
For a discrete-time signal x[n], the STFT is defined as follows [15]:
where
- w[n] is the window function;
- N is the window length;
- n is the discrete-time index;
- k is the frequency bin index.
In this study,
- Sampling interval: 0.1 µs.
- Sampling frequency: 10 MHz.
- Total acquisition time: 2 ms (20,000 samples).
- Window function: Hanning window.
- Window length: 2048 samples (204.8 µs).
- Overlap ratio: 97.66% (2000 samples).
This configuration yields a frequency resolution of approximately:
The window length was selected to balance time localization and frequency discrimination around the excitation center frequency (350 kHz), ensuring adequate resolution to capture defect-induced spectral redistribution while maintaining sufficient temporal precision.
2.3. Energy Estimation in the Time–Frequency Domain
The squared magnitude of the STFT, ∣STFT(n,k)∣2, represents the time–frequency energy density of the signal [15]. To quantify defect influence, total energy within a predefined time–frequency region Ω was computed as follows:
The region Ω was selected based on the dominant energy concentration observed in intact specimens, corresponding to:
- Time interval: 0.06–0.22 ms.
- Frequency range: 320–420 kHz.
This region captures the primary wave packet associated with the excitation response.
To reduce variability caused by sensor attachment conditions, five repeated measurements were performed for each specimen, and averaged STFT magnitudes were used for energy calculation.
For comparative analysis, normalized energy was defined as:
This normalization mitigates amplitude variations unrelated to structural damage.
2.4. Spectral Bandwidth Estimation
To characterize frequency redistribution effects, spectral centroid and bandwidth were calculated within the selected time–frequency region.
The spectral centroid is defined as:
where P(k) denotes spectral power.
The spectral bandwidth B is defined as:
Spectral bandwidth reflects the degree of frequency spreading around the centroid frequency.
In thick plates, defect-induced scattering and mode conversion redistribute energy across frequency components. Reduction in effective bandwidth indicates attenuation of higher-frequency components and concentration of energy within narrower bands due to increased structural discontinuity.
3. Experimental Setup
3.1. Specimen Configuration
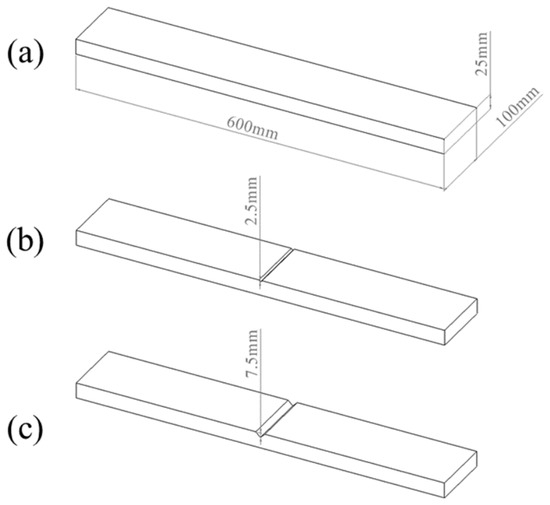
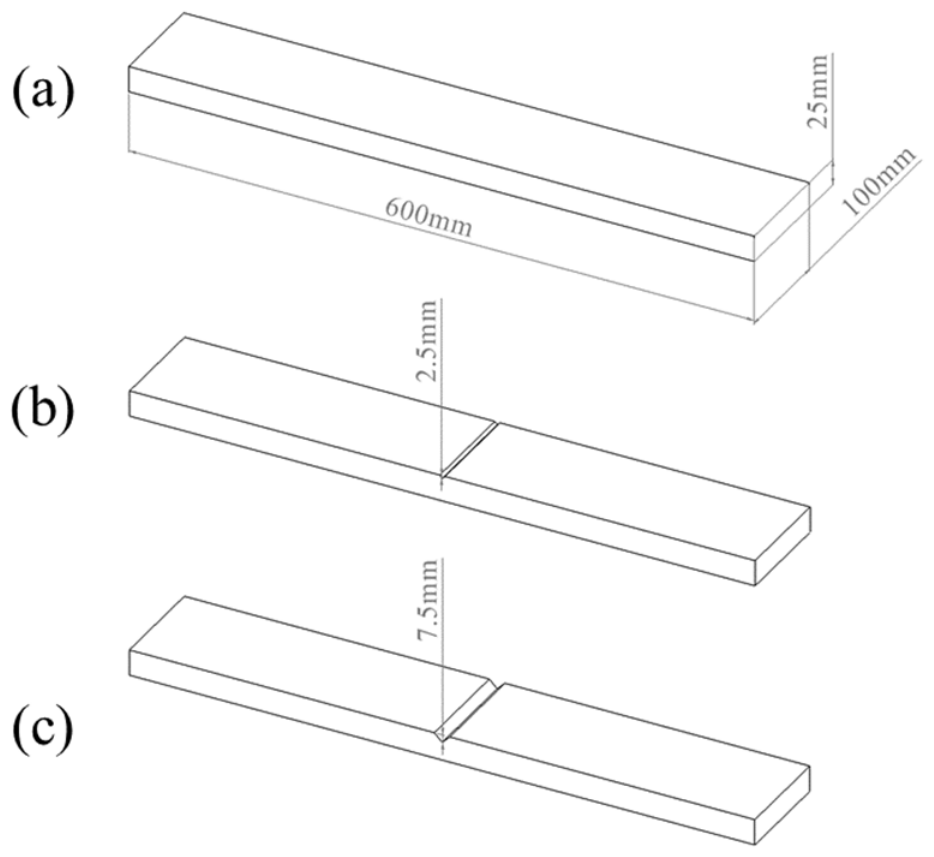
Three aluminum plates with dimensions of 600 × 100 × 25 mm were prepared for the experiments. The selected thickness (25 mm) was intended to represent a structural condition in which modal superposition effects are expected to be significant within the excitation frequency range. Artificial defects were introduced in the form of through-width V-shaped notches located at the center of the plate, as illustrated in Figure 2. One specimen remained intact without any notch, while the other two specimens contained notches with depths corresponding to 10% (2.5 mm) and 30% (7.5 mm) of the plate thickness, respectively. The notch geometry was designed to induce localized stiffness reduction while maintaining controlled and quantifiable defect severity.
Figure 2.
Specimen configuration. (a) Intact specimen, (b) 10% notched specimen, and (c) 30% notched specimen.
3.2. Flexible MFC Transducer
A self-developed flexible Macro Fiber Composite (MFC) transducer (model: FDP-31-1) developed by Rina Solution Corp. (Cheonan, Republic of Korea) was employed for both wave excitation and signal acquisition. The transducer consists of aligned PZT-5H piezoelectric fibers embedded within an epoxy matrix, enabling in-plane electromechanical coupling while maintaining mechanical flexibility. Unlike conventional rigid ceramic acoustic emission sensors, the flexible MFC transducer can conform to curved or uneven structural surfaces, thereby improving contact stability and expanding applicability to industrial components such as piping systems and pressure vessels.
3.3. Excitation System and Frequency Selection
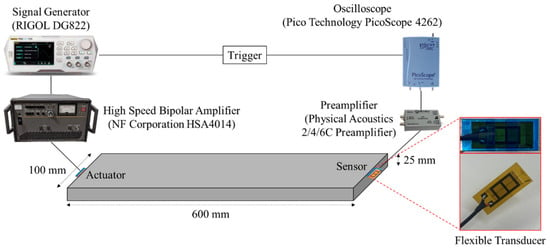
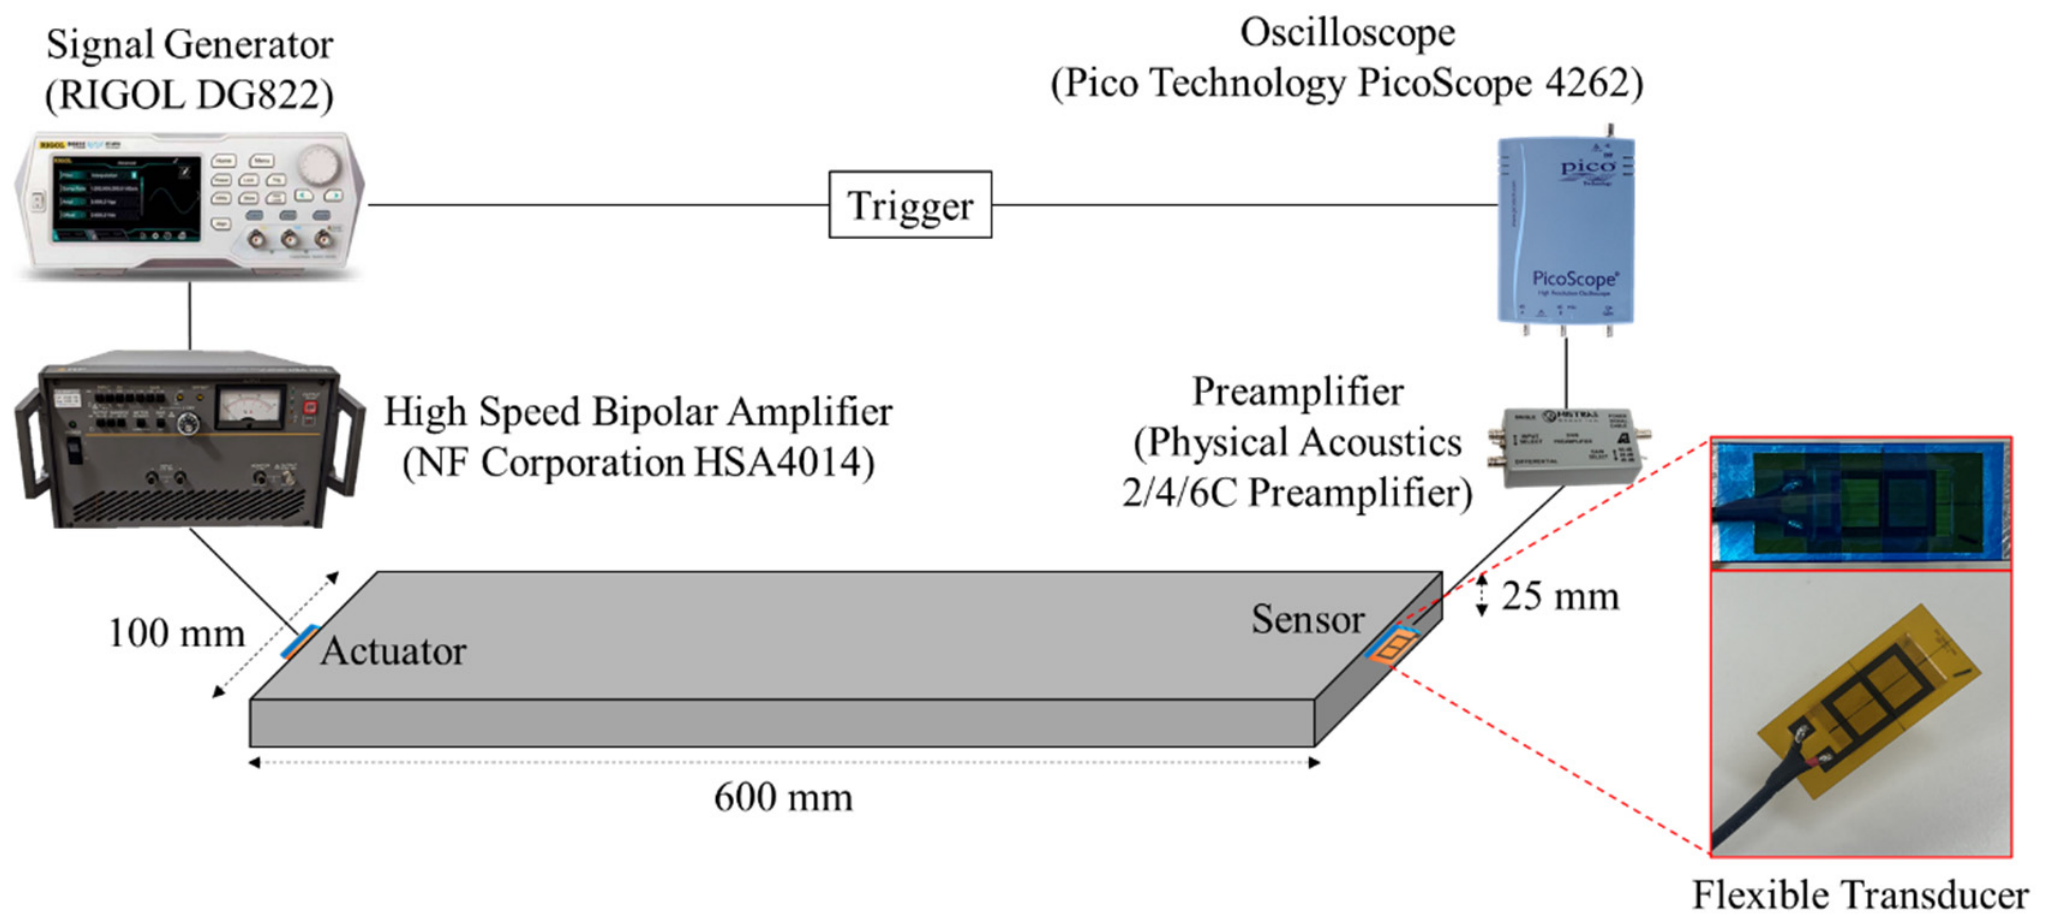
The overall configuration of the excitation and measurement system is shown in Figure 3. Elastic waves were generated using a function generator (RIGOL DG822) in combination with a high-speed bipolar power amplifier (NF Corporation HSA4014). A 3-cycle tone-burst signal was employed for excitation to provide narrowband frequency content while maintaining sufficient temporal localization.
Figure 3.
Signal generation and measurement system.
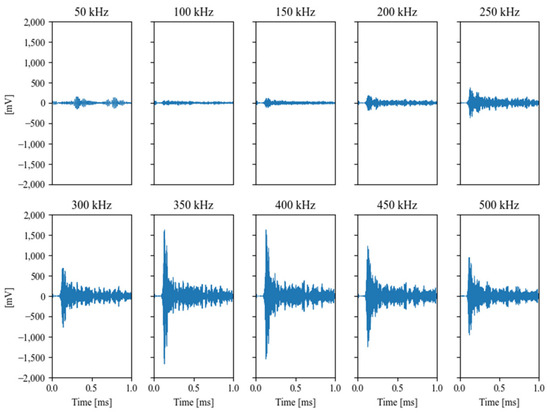
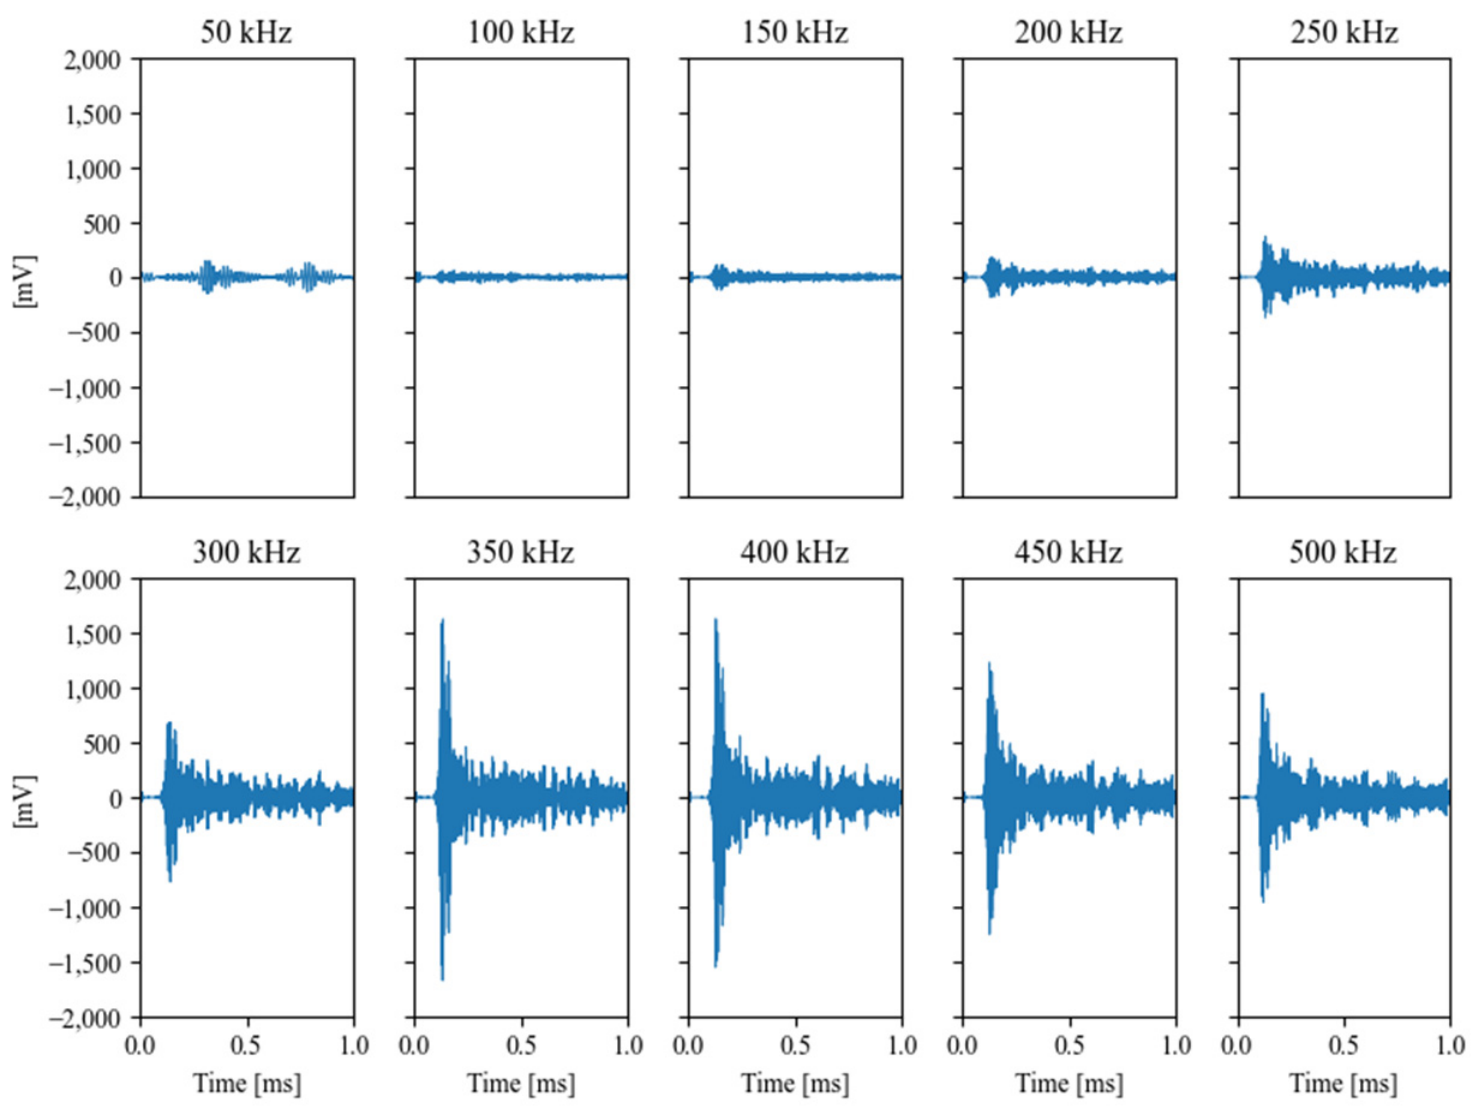
To determine the optimal excitation frequency, preliminary experiments were conducted on the intact specimen by sweeping the excitation frequency from 50 kHz to 500 kHz in increments of 50 kHz. The received waveforms corresponding to each frequency are presented in Figure 4. The largest response amplitude was observed at 350 kHz, which was therefore selected as the excitation frequency for subsequent defect characterization experiments. As summarized in Table 1, the excitation frequency of 350 kHz was selected based on preliminary frequency sweep experiments considering both signal response characteristics and SNR performance.
Figure 4.
Received waveforms of the intact specimen at different excitation frequencies (50–500 kHz) used for frequency selection.
Table 1.
Signal response characteristics and SNR values obtained from preliminary frequency sweep experiments.
3.4. Signal Acquisition and Measurement Conditions
The received signals were measured using a 2/4/6C Preamplifier (Physical Acoustics, Princeton Junction, NJ, USA) and recorded with a PicoScope 4262 oscilloscope (Pico Technology, St Neots, UK). Signal acquisition was synchronized with the excitation trigger to ensure temporal consistency between measurements. The preamplifier gain was set to 40 dB. The oscilloscope provided 16-bit resolution, and the sampling interval was set to 0.1 µs, corresponding to a sampling frequency of 10 MHz. A total of 20,000 data points were collected for each measurement, resulting in an acquisition duration of 2 ms.
3.5. Transducer Attachment and Repeatability
The performance of flexible MFC transducers is sensitive to attachment conditions, including applied pressure and surface contact uniformity [23]. To reduce variability associated with coupling conditions, the transducer was repeatedly attached and detached five times for each specimen. Vacuum grease was applied to enhance acoustic coupling, and sufficient pressure was manually applied to ensure uniform contact between the transducer and the specimen surface. The measured signals from repeated trials were subsequently averaged in the time–frequency domain to minimize experimental variability and improve repeatability of the extracted energy and bandwidth metrics.
4. Results and Discussion
4.1. Time–Frequency Response Comparison
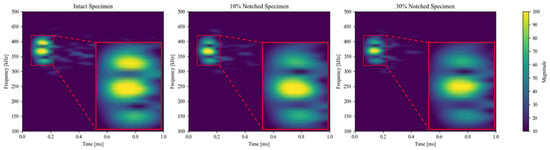
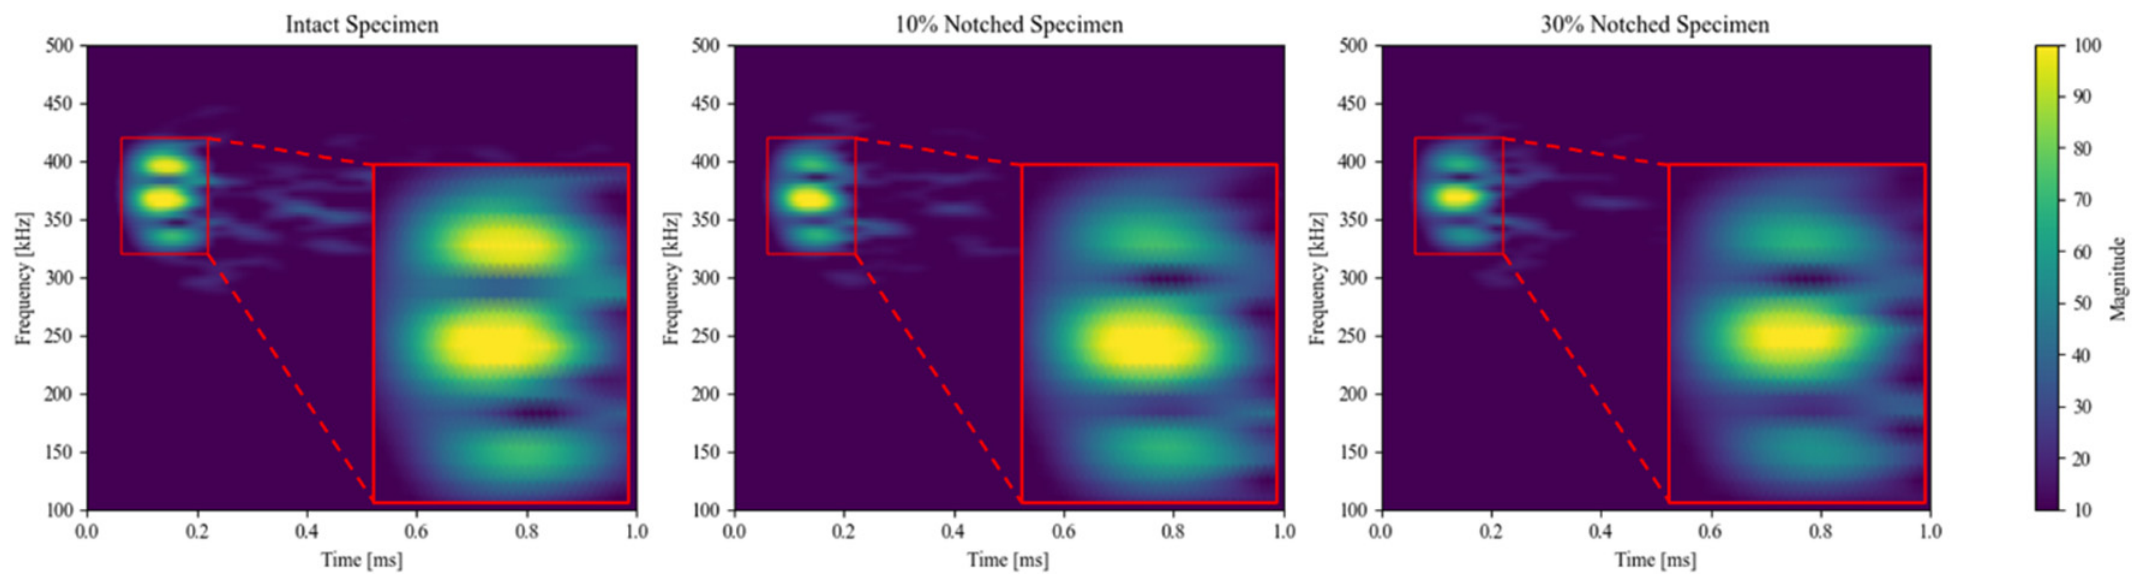
Figure 5 presents the averaged STFT results obtained from the intact, 10% notched, and 30% notched specimens under three-cycle tone-burst excitation at 350 kHz. The time–frequency maps clearly illustrate progressive changes in spectral energy distribution as the notch depth increases.
Figure 5.
Time–frequency response based on STFT for each specimen.
In the intact specimen, a concentrated energy region is observed within the 320–420 kHz band during the time interval of approximately 0.06–0.22 ms. The energy distribution is relatively strong and exhibits a wider frequency spread, indicating stable propagation of guided waves with preserved high-frequency components.
As the notch depth increases to 10%, a noticeable reduction in overall energy intensity is observed within the same time–frequency region. The amplitude of the dominant spectral components decreases, and the distribution becomes slightly narrower. This trend becomes more pronounced in the 30% notched specimen, where significant attenuation of high-frequency components is evident. The time–frequency energy appears more localized and less dispersed compared to the intact condition.
These observations suggest that structural discontinuity caused by the notch introduces scattering and partial mode conversion, resulting in redistribution and attenuation of guided-wave energy. In thick plates, higher-order modes are particularly sensitive to geometric discontinuities, and higher-frequency components tend to experience greater attenuation due to increased material damping and geometric scattering.
4.2. Quantitative Energy Analysis
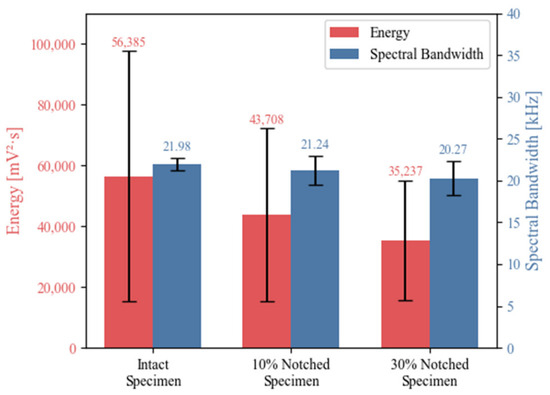
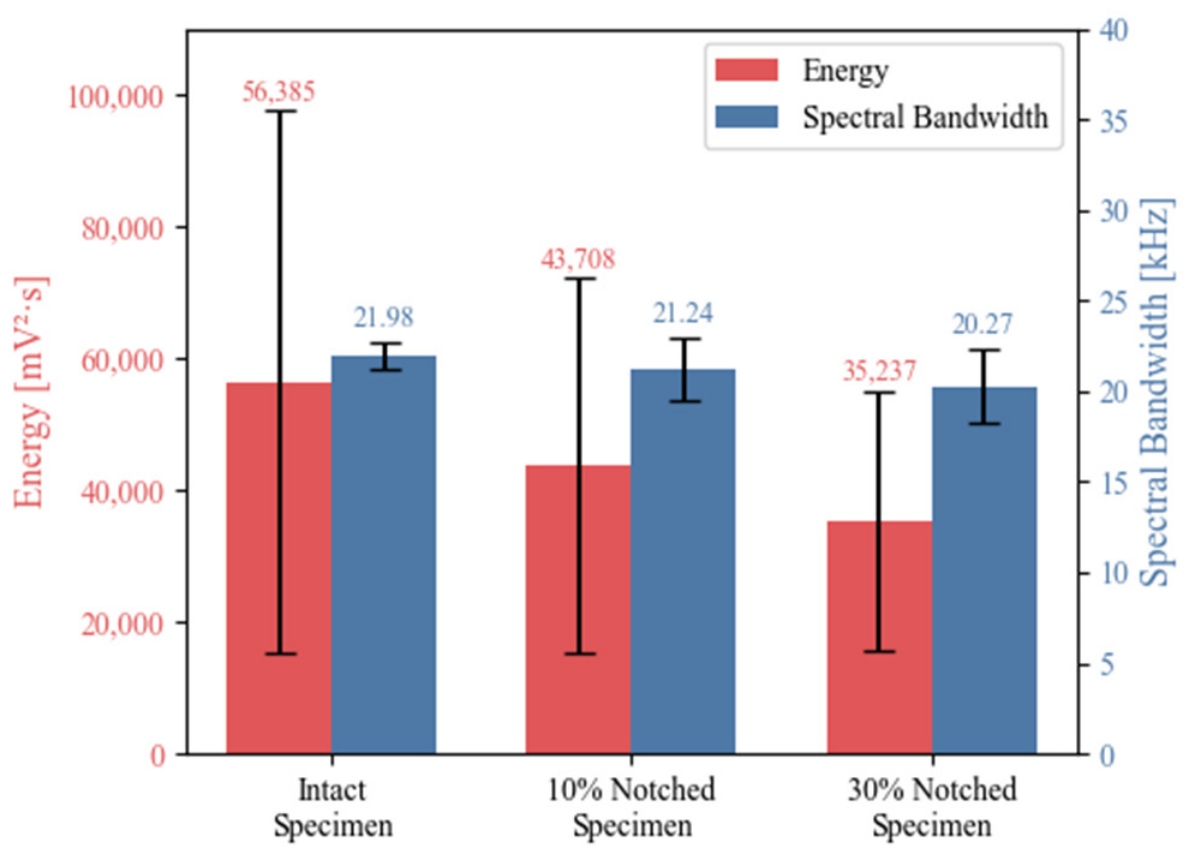
To quantify these observations, the total STFT-based energy within the predefined time–frequency region (0.06–0.22 ms, 320–420 kHz) was calculated for each specimen, as summarized in Figure 6 and Table 2.
Figure 6.
STFT-based energy and spectral bandwidth variation with notch depth in a 25 mm thick aluminum plate.
Table 2.
Statistical summary of STFT-based energy and spectral bandwidth metrics obtained from 5 repeated measurements.
Compared to the intact specimen, the 10% notched specimen exhibited a 22.5% reduction in energy, while the 30% notched specimen showed a 37.5% decrease. The progressive energy reduction with increasing notch depth demonstrates a clear correlation between defect severity and guided-wave attenuation.
The energy reduction can be attributed to several physical mechanisms. First, the notch reduces local stiffness, leading to partial reflection of incident wave energy. Second, mode conversion at the discontinuity redistributes energy into modes that may not be efficiently captured by the receiving transducer. Third, high-frequency components are preferentially attenuated in thick structures due to increased internal damping and multi-mode interference.
These combined effects result in measurable decreases in localized time–frequency energy concentration, supporting the feasibility of energy-based defect characterization in thick plates.
Although the energy metric exhibited relatively large variability across repeated measurements, a consistent decreasing trend with increasing notch depth was clearly observed. The variability is primarily attributed to the sensitivity of energy-based features to transducer coupling conditions and amplitude fluctuations, particularly because the transducer was detached, surface-cleaned, and reattached prior to each measurement sequence. Nevertheless, the averaged results demonstrated distinct differences between defect conditions, indicating that repeated measurements and statistical averaging can provide meaningful defect characterization in thick-plate structures.
4.3. Spectral Bandwidth Variation
In addition to energy reduction, spectral bandwidth exhibited systematic variation with notch depth. As illustrated in Figure 6, the spectral bandwidth decreased by approximately 3.37% in the 10% notched specimen and by 7.78% in the 30% notched specimen compared to the intact condition.
Bandwidth reduction indicates narrowing of the effective frequency distribution. In the present experiments, this behavior suggests preferential attenuation of higher-frequency components within the selected frequency band. In thick plates, high-frequency guided-wave components are more susceptible to scattering and damping effects, particularly near structural discontinuities.
As defect severity increases, the effective transmission of higher-frequency components decreases, resulting in a concentration of spectral energy within a narrower frequency range. This observation aligns with the qualitative time–frequency maps shown in Figure 5, where the spectral distribution becomes increasingly confined as notch depth increases.
The consistent reduction in both energy and spectral bandwidth indicates that defect severity influences not only signal magnitude but also frequency-domain characteristics, reinforcing the advantage of time–frequency-based analysis over purely time-domain metrics. Compared with the energy metric, the spectral bandwidth exhibited relatively lower variability across repeated measurements, indicating more stable frequency-domain behavior under the present experimental conditions.
4.4. Implications for Active Monitoring in Thick Structures
The results demonstrate that controlled active excitation combined with STFT-based analysis enables reliable defect characterization in thick-plate structures where modal superposition limits the effectiveness of conventional time-of-flight approaches.
Unlike passive AE monitoring, which depends on spontaneous damage events, the proposed active monitoring strategy provides repeatable and controllable interrogation of structural integrity. The observed sensitivity of both energy and bandwidth metrics to notch depth confirms that measurable time–frequency features can serve as quantitative indicators of structural degradation.
Furthermore, the dual actuation and sensing capability of the flexible MFC transducer simplifies system integration and enhances applicability to industrial components, including thick-walled pressure vessels and piping systems where curvature and surface irregularity are common.
Overall, the experimental results validate the feasibility of transitioning from passive AE-based monitoring to an active, self-diagnostic SHM framework suitable for thick industrial structures.
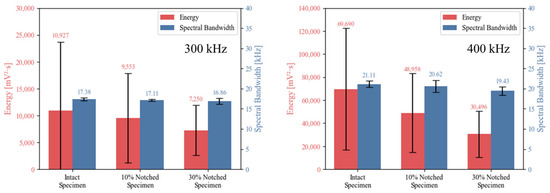
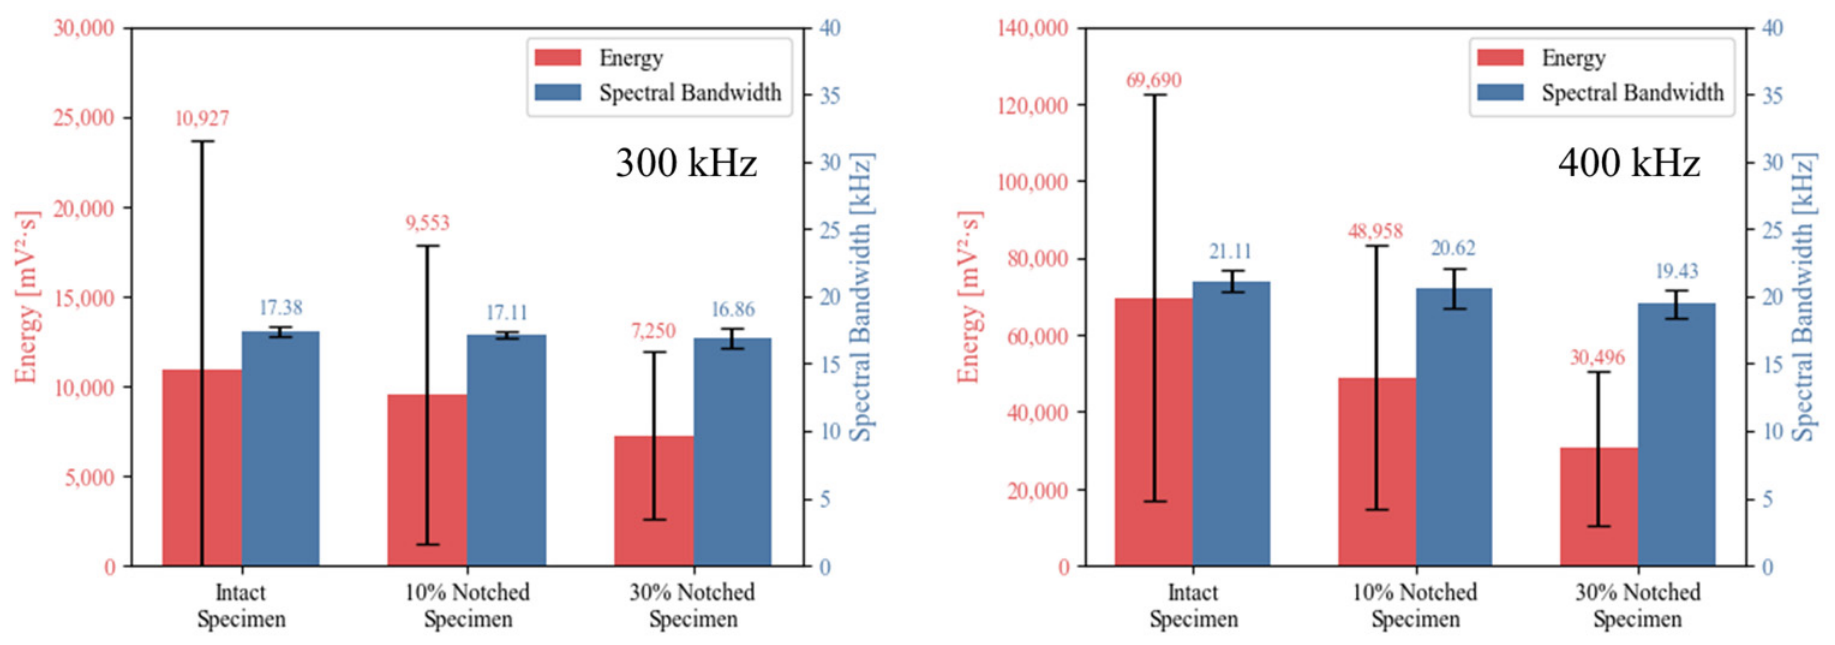
Additional validation experiments conducted at excitation frequencies of 300 kHz and 400 kHz (Figure 7) showed similar decreasing trends in both STFT-based energy and spectral bandwidth with increasing notch depth, supporting the robustness of the proposed framework under varying excitation conditions. Preliminary comparison with CWT-based analysis also showed generally consistent trend behavior, while the STFT approach provided advantages in computational efficiency and implementation simplicity for the present monitoring framework. Although the minimum detectable defect size was not systematically investigated in the present study, the difference between intact and 10% notch conditions remained larger than the observed experimental variability under the present conditions, suggesting that defects of similar or greater severity can be reliably distinguished using the proposed framework.
Figure 7.
Additional validation results obtained at excitation frequencies of 300 kHz and 400 kHz.
5. Conclusions
In this study, an active excitation-based monitoring framework using a self-developed flexible MFC transducer was experimentally validated in 25 mm thick aluminum plates containing artificial V-shaped notches. The selected thickness represents a structural regime characterized by significant modal superposition, where conventional time-of-flight-based guided-wave analysis becomes challenging.
By employing controlled three-cycle tone-burst excitation at 350 kHz and analyzing the resulting responses using STFT-based time–frequency energy and spectral bandwidth metrics, defect-induced changes were quantitatively characterized without requiring explicit mode separation. The results demonstrated clear reductions in both energy and spectral bandwidth with increasing notch depth, indicating that structural discontinuities in thick plates influence not only overall guided-wave attenuation but also frequency-domain characteristics.
The main conclusions of this study are summarized as follows:
- (1)
- The proposed STFT-based analysis enabled quantitative characterization of defect severity in thick aluminum plates under severe modal overlap conditions without explicit mode separation.
- (2)
- The STFT-based energy metric exhibited relatively high sensitivity to defect severity, whereas the spectral bandwidth demonstrated comparatively stable behavior across repeated measurements, suggesting complementary roles for defect evaluation.
- (3)
- The flexible MFC transducer successfully demonstrated dual actuation and sensing capability for active guided-wave monitoring, supporting the feasibility of active sensing in thick structures under controlled laboratory conditions.
Unlike passive AE monitoring, which depends on spontaneous damage events, the proposed active monitoring framework enables repeatable interrogation of structural integrity and offers potential applicability to thick-walled industrial structures. However, the current study is limited to simplified notch-type defects under controlled laboratory conditions. Additional validation under more realistic structural and environmental conditions will be necessary for practical field application. Future work will include validation under more complex defect configurations, additional experimental conditions, and numerical simulation-based analysis to further improve the general applicability of the proposed framework.
Author Contributions
Conceptualization, H.Y.; Methodology, S.-M.L.; Software, Y.K.; Validation, S.-M.L.; Data curation, T.K.; Writing—original draft, T.K. and H.Y.; Visualization, T.K. and Y.K.; Supervision, H.Y. All authors have read and agreed to the published version of the manuscript.
Funding
This research was financially supported by the Ministry of Trade, Industry and Energy (MOTIE), Korea, under the “Korean Research Alliance in Support for Technological Innovation in Materials, Components, and Equipment (RS-2025-02305287)”, supervised by the Korea Institute for Advancement of Technology (KIAT). This work was also supported by the Project for Collaborative R&D between Industry, University, and Research Institute funded by the Korea Ministry of SMEs and Startups in 2025 (RS-2025-02310175).
Institutional Review Board Statement
Not applicable.
Informed Consent Statement
Not applicable.
Data Availability Statement
The data presented in this study are available on request from the corresponding author. The data are not publicly available due to proprietary and confidentiality restrictions related to a commercial product. (RINA Solution Corp.).
Acknowledgments
During the preparation of this manuscript, the authors used ChatGPT (OpenAI, GPT-5.5) for language editing and improvement of English expressions. The authors reviewed and edited the output and take full responsibility for the content of this publication.
Conflicts of Interest
Author Hyeongmin Yoo serves as an advisor to RINA Solution Corp. All other authors were employed by RINA Solution Corp. The authors declare that the research was conducted in the absence of any commercial or financial relationships that could be construed as a potential conflict of interest.
References
- Grosse, C.U.; Ohtsu, M. Acoustic Emission Testing; Springer: Berlin, Germany, 2008. [Google Scholar]
- Sohn, H.; Farrar, C.R.; Hemez, F.M.; Shunk, D.D.; Stinemates, D.W.; Nadler, B.R.; Czarnecki, J.J. A Review of Structural Health Monitoring Literature: 1996–2001; Los Alamos National Laboratory Report LA-13976-MS; Los Alamos National Laboratory: Los Alamos, NM, USA, 2004. [Google Scholar]
- Pollock, A.A. Classical wave theory in practical acoustic emission testing. Prog. Acoust. Emiss. 1986, 4, 708–721. [Google Scholar]
- Giurgiutiu, V. Structural Health Monitoring with Piezoelectric Wafer Active Sensors; Academic Press: London, UK, 2008. [Google Scholar]
- Raghavan, A.; Cesnik, C.E.S. Review of guided-wave structural health monitoring. Shock Vib. Dig. 2007, 39, 91–116. [Google Scholar] [CrossRef] [Scilit]
- Staszewski, W.J.; Worden, K.; Tomlinson, G.R. Time–frequency analysis in structural damage detection. Mech. Syst. Signal Process. 1997, 11, 673–692. [Google Scholar] [CrossRef] [Scilit]
- Yan, R.; Gao, R.X.; Chen, X. Wavelets for fault diagnosis of rotating machinery: A review with applications. Mech. Syst. Signal Process. 2014, 43, 1–15. [Google Scholar]
- Michaels, J.E. Detection, localization and characterization of damage in plates with an in situ array. Smart Mater. Struct. 2008, 17, 035035. [Google Scholar] [CrossRef] [Scilit]
- Alleyne, D.N.; Cawley, P. Optimization of Lamb wave inspection techniques. NDT E Int. 1992, 25, 11–22. [Google Scholar] [CrossRef] [Scilit]
- Wilcox, P.D.; Lowe, M.J.S.; Cawley, P. Mode and transducer selection for long-range Lamb wave inspection. J. Intell. Mater. Syst. Struct. 2001, 12, 553–565. [Google Scholar] [CrossRef] [Scilit]
- Rose, J.L. Ultrasonic Guided Waves in Solid Media; Cambridge University Press: Cambridge, UK, 2014. [Google Scholar]
- Lowe, M.J.S. Matrix techniques for modeling ultrasonic waves in multilayered media. IEEE Trans. Ultrason. Ferroelectr. Freq. Control 1995, 42, 525–542. [Google Scholar] [CrossRef] [Scilit]
- Cho, Y. Estimation of ultrasonic guided wave mode conversion in a plate with thickness variation. IEEE Trans. Ultrason. Ferroelectr. Freq. Control 2000, 47, 591–603. [Google Scholar] [PubMed]
- Su, Z.; Ye, L. Identification of Damage Using Lamb Waves; Springer: London, UK, 2009. [Google Scholar]
- Cohen, L. Time–Frequency Analysis; Prentice Hall: Englewood Cliffs, NJ, USA, 1995. [Google Scholar]
- Pai, P.F.; Deng, H.; Sundaresan, M.J. Time–frequency characterization of Lamb waves for material evaluation and damage inspection of plates. Mech. Syst. Signal Process. 2015, 62–63, 183–206. [Google Scholar]
- Park, G.; Sohn, H.; Farrar, C.R.; Inman, D.J. Overview of piezoelectric impedance-based health monitoring and path forward. Shock Vib. Dig. 2003, 35, 451–463. [Google Scholar] [CrossRef] [Scilit]
- Wilkie, W.K.; Bryant, R.G.; High, J.W.; Fox, R.L.; Hellbaum, R.F.; Jalink, J., Jr.; Little, B.D.; Mirick, P.H. Low-cost piezocomposite actuator for structural control applications. Proc. SPIE 2000, 3991, 323–334. [Google Scholar]
- Ren, G.; Jhang, K.-Y. Application of macro fiber composite for smart transducer of Lamb wave inspection. Adv. Mater. Sci. Eng. 2013, 2013, 281575. [Google Scholar] [CrossRef] [Scilit]
- Tiwari, K.A.; Raisutis, R.; Mazeika, L. Analysis of wave patterns under the region of macro-fiber composite transducer to improve the analytical modelling for directivity calculation in isotropic medium. Sensors 2020, 20, 2280. [Google Scholar] [CrossRef] [Scilit] [PubMed]
- Zhou, S.; Shen, Y.; Wang, C.; Wang, B.; Tian, Y. Self-sensing piezoelectric composites via generation and reception of ultrasonic guided waves. Compos. Struct. 2025, 357, 118927. [Google Scholar] [CrossRef] [Scilit]
- Frankowski, P.K.; Majzner, P.; Mąka, M.; Stawicki, T. Non-Destructive Evaluation of Reinforced Concrete Structures with Magnetic Flux Leakage and Eddy Current Methods—Comparative Analysis. Appl. Sci. 2024, 14, 11965. [Google Scholar] [CrossRef] [Scilit]
- Eiras, J.N.; Gavérina, L.; Roche, J.-M. Durability assessment of bonded piezoelectric wafer active sensors for aircraft health monitoring applications. Sensors 2024, 24, 450. [Google Scholar] [CrossRef] [Scilit] [PubMed]

Disclaimer/Publisher’s Note: The statements, opinions and data contained in all publications are solely those of the individual author(s) and contributor(s) and not of MDPI and/or the editor(s). MDPI and/or the editor(s) disclaim responsibility for any injury to people or property resulting from any ideas, methods, instructions or products referred to in the content. |
© 2026 by the authors. Licensee MDPI, Basel, Switzerland. This article is an open access article distributed under the terms and conditions of the Creative Commons Attribution (CC BY) license.