


Featured Application
This work provides a practical workflow to improve dimensional accuracy in FFF-printed PLA components intended for assemblies. By predicting separate design compensation for outer and inner diameters from print speed and layer thickness, the approach reduces trial and error and supports faster production of pre-send final parts with tighter fits, such as bushings, sleeves, housings, jigs, fixtures, and functional prototypes requiring reliable dimensional tolerances.
Abstract
Fused Filament Fabrication (FFF) is a widely used additive manufacturing technology due to its versatility, low cost, and broad material compatibility. However, achieving high dimensional accuracy in FFF parts remains challenging because dimensional deviations are affected by material shrinkage, process parameters, and part geometry. This study analyses the dimensional deviations of PLA hollow cylindrical specimens manufactured by FFF, with particular attention to the different behaviour of outer and inner diameters. The methodology combines an iterative design-adjustment procedure with a neural-network-based compensation approach. First, specimens with different geometries were printed and measured to evaluate the evolution of dimensional error after successive design corrections. Then, the influence of print speed and layer thickness was analysed through the volumetric material flow rate, and the resulting data were used to train separate feedforward neural networks for the outer and inner diameters. The results showed that outer and inner diameters followed different deviation trends, confirming that they should be analysed independently. Print speed, layer thickness, and material flow affected dimensional accuracy in different ways depending on the measured diameter. The proposed neural network approach provided a practical means of estimating compensated design diameters within the experimental domain analysed, reducing the need for repeated trial and error adjustments. However, the results should be interpreted within the experimental limits of the study, particularly regarding the use of a single material, a single printer, and a limited validation dataset. Overall, the study provides a practical workflow for improving dimensional accuracy in FFF parts and highlights the importance of diameter-specific compensation strategies.
1. Introduction
Additive manufacturing has transformed modern manufacturing by enabling the rapid production of complex geometries. It also improves material efficiency and provides a high degree of flexibility and customisation. These advances have important implications for several industrial sectors, supporting innovation and improving production processes [1,2,3]. Among additive manufacturing (AM) techniques, Fused Filament Fabrication (FFF) is one of the most widely adopted methods due to its simplicity, low cost, and broad material compatibility. Its industrial adoption has increased because it enables a wide range of possibilities in terms of geometry, materials, and production time. The layer-by-layer manufacturing approach also enables the production of highly complex geometries that are difficult or impossible to obtain using conventional manufacturing methods [4,5].
This capability opens new opportunities to optimise part design for specific functional requirements. One example is the multi-material manufacturing of heat exchangers [6], where both geometry and material distribution can be optimised within a single manufacturing process [7]. However, achieving high dimensional accuracy in FFF parts remains a significant challenge. This limits its application in industries where tight tolerances are critical [8,9]. Many parameters are involved in the manufacturing process [10,11], and they directly affect the dimensional deviation of FFF parts [12]. It is therefore important to identify the factors that influence the process and to characterise the material response under different manufacturing conditions [13,14,15]. Together with the relative immaturity of additive manufacturing, this makes it difficult to fully control dimensional results.
FFF involves the deposition of material in a molten or softened state, followed by solidification. As in other processes involving thermal solidification, shrinkage plays a fundamental role in the final geometry of the manufactured part [16,17,18,19]. Therefore, temperature is one of the parameters with the greatest influence on dimensional accuracy. The temperature range used in FFF is wide and depends mainly on the material. PLA can be deposited at approximately 180 °C, whereas PEEK may require temperatures close to 400 °C. Intermediate temperatures are commonly used for materials such as ABS or HIPS. For this reason, numerous studies have analysed the effect of temperature on FFF manufacturing [20,21,22,23].
However, other parameters must also be considered. These include part orientation, deposition speed, layer thickness, part geometry, and filament colour, all of which have been studied in the field of 3D printing [24,25]. For example, in [25], increasing deposition speed reduced the error up to a certain point. In the same study, increasing layer thickness led to higher dimensional deviation. Part orientation was also shown to produce significant variations in dimensional accuracy. Similarly, ref. [24] investigated the accuracy of 3D printed PLA under different process parameters and colours. Their results showed that material colour can affect final dimensions because of differences in material propermensional accuracy of FFF parts. They demonstrated that material type and printing settings, such as temperature and print speed, can affect the precision of the produced components.
The mechanical properties of AM parts are also affected by printing parameters. One relevant property is interlayer strength, which is strongly influenced by temperature and print speed. For example, ref. [22] investigated the influence of printing temperature and filament colour on the dimensional accuracy, tensile strength, and friction performance of FFF-printed PLA specimens. Their study found that higher printing temperatures generally improved tensile strength but could negatively affect dimensional accuracy. Filament colour also influenced these variations, highlighting the complexity of optimising printing conditions. Similarly, Syamsuzzaman et al. [26] examined the effect of layer thickness on the performance of low-cost and commercial FFF printers. They observed that increased layer thickness often reduced print resolution and dimensional accuracy, while improving build speed. This highlights the trade-off between print quality and manufacturing efficiency. Luzanin et al. [27] studied the effects of layer thickness, deposition angle, and infill on the maximum flexural force of FFF specimens. They found that smaller layer thicknesses and suitable deposition angles enhanced flexural strength, while the infill pattern also played a relevant role. Additionally, Zharylkassyn et al. [13] showed that material type and printing settings, such as temperature and print speed, significantly influenced dimensional accuracy. These studies confirm the need for comprehensive parameter optimisation in FFF.
Artificial neural networks (ANNs) provide a useful approach for modelling and compensating dimensional deviations in FFF. Recent advances in ANNs have shown potential for predicting geometric deviations in additive manufacturing. For example, Zhu et al. [28] proposed a convolutional neural network-based method for predicting geometric deviations in additively manufactured parts. Their results showed that accurate predictions can support reverse compensation and improve geometric accuracy. Ferreira et al. [29] introduced a Bayesian neural network approach for automated geometric shape deviation modelling, reducing user input and improving predictive accuracy for different shapes and processes. Zhao et al. [30] developed a point-based deep neural network to predict deformation in real scenarios, improving the precision of AM products. Qi et al. [31] reviewed the integration of machine learning into additive manufacturing design, highlighting the ability of neural networks to model complex input–output relationships. Finally, Decker et al. [32] applied a random forest model based on triangular mesh data to predict and compensate shape deviations, reducing overall geometric errors by 44%.
Recent studies confirm that dimensional deviation in polymer FFF is strongly affected by process parameters (notably layer thickness and print speed) and local feature geometry, and that compensation strategies can reduce error when properly targeted. Comprehensive reviews outline the main drivers of dimensional accuracy in FFF [33]. Parameter-sensitivity experiments report speed and layer-height windows that minimise error [34,35], while feature-level analyses show that path deviation and geometry-feature effects can dominate over speed in certain cases [36]. The role of extrusion rate (material flow) on oversizing/undersizing has been quantified, highlighting thresholds beyond which size growth appears [37]. Algorithmic compensation via adaptive slicing also shows measurable, albeit modest, accuracy gains [38]. In parallel, recent data-driven approaches have extended the use of machine learning towards process control in extrusion additive manufacturing, including invertible neural networks for real-time control [39]. Open source thermomechanical simulation frameworks have also been proposed to analyse the thermal and mechanical response of additive manufacturing processes [40]. These works show the growing relevance of computational and data-driven tools in additive manufacturing. However, most approaches focus on global process control, thermomechanical simulation, adaptive slicing, or general geometric deviation. Fewer studies address diameter-specific compensation of outer and inner features in FFF hollow parts. These findings motivate the present study’s separate treatment of outer and inner diameters and the use of the volumetric material flow rate, , as a process descriptor to interpret deviation trends.
Despite the extensive literature on dimensional accuracy in FFF, several aspects still require further clarification. First, many studies analyse dimensional deviation as a global error or focus mainly on external dimensions. However, hollow parts may exhibit different deviation mechanisms in their outer and inner diameters. Second, the combined influence of geometry, print speed, and layer thickness is often discussed without clearly distinguishing whether the deviation affects the outer contour or the inner contour. Third, compensation strategies are frequently based on trial-and-error corrections or global predictive models, whereas fewer studies provide diameter-specific compensation values that can be directly introduced into the CAD model.
In this context, the specific contribution of this study lies in the separate analysis and compensation for the outer and inner diameters in FFF-printed PLA hollow cylinders. The work combines iterative dimensional adjustment, experimental analysis of print speed and layer thickness, and the use of the volumetric material flow rate, as a process descriptor to interpret the different deviation trends observed in Do and Di. Rather than proposing a general machine learning framework, the study presents a practical compensation workflow for a defined family of FFF parts. Two independent feedforward neural networks are used as diameter-specific compensation tools to estimate the corrected design diameters required to obtain target dimensions. Therefore, the contribution does not rely on the novelty of neural networks themselves, but on their integration into an experimentally supported compensation workflow.
Therefore, the aim of this work is threefold: to quantify the dimensional deviations of outer and inner diameters in FFF-manufactured PLA hollow cylinders, to analyse the influence of print speed and layer thickness through the volumetric material flow rate, , used as a process descriptor, and to evaluate the usefulness of diameter-specific neural network models for estimating compensated design diameters. This objective aligns with recent 2023 to 2025 contributions on parameter sensitivity, feature-dependent deviation, flow-related effects, and compensation strategies in polymer FFF [33,34,35,36,37,41].
2. Materials and Methods
The material used in this study was polylactic acid (PLA), specifically, Fillamentum PLA Extrafill, Light Ivory colour, supplied by Fillamentum Manufacturing Czech s.r.o. (Hulín, Czech Republic). PLA is one of the most widely used materials in FFF because of its ease of processing. Unlike many materials that require specific machine requirements, such as a closed environment, PLA can be processed in a wide range of low-cost FFF printers owing to its minimal shrinkage upon cooling and its relatively low optimal printing temperature of around 200 °C, compared to other materials. This, coupled with the proliferation of low-cost 3D printers—often open and operating at lower temperatures—and their cost-effectiveness, has propelled PLA to the forefront of material choices among users. However, it should be noted that PLA exhibits a comparatively low mechanical strength and is prone to significant deformation at temperatures exceeding 60 °C [42].
Therefore, material characterisation is advisable when FFF parts with improved dimensional accuracy are required. Data-driven tools, such as artificial neural networks, can support this process by relating printing parameters, measured dimensions, and compensated design values within a defined experimental domain.
Continuing the previous analysis of the printing process, a test was conducted to verify the dimensional deviations between individually printed samples (one print for a single specimen) and specimens printed in pairs (one print for two specimens). During this attempt, the printer experienced a clog. Upon inspection, the filament used had undergone expansion in areas distant from the heat source. When measuring the filament in this area, measurements of 2 mm were obtained compared to the required diameter of 1.75 mm for proper circulation through the guiding tube to the extruder. Due to this expansion, the filament was completely blocked between the metallic walls of the tube in this area. As a result, it was found that when the printer was completely closed, heat from the print bed and extruder was transferred to all printer components, resulting in very high temperatures. Additionally, due to the elevated position of the extruder relative to these heat sources, always being above them, it experiences greater heat transfer due to natural convection.
This factor is critical during specimen fabrication because when this failure occurs, the test specimens cannot be considered valid. Furthermore, it is suggested that due to expansion, the flow of the extruded filament may be altered by resistance to movement that may occur in the area, thereby affecting the deposited filament.
The expansion effect under the same manufacturing conditions should occur in both single-specimen and multiple-specimen prints simultaneously. However, jams occurred only in the prints of multiple specimens simultaneously. This can be explained by the extruder’s retraction during the empty movement from one piece to another. Note that the metallic parts of the extruders also demonstrate the expansion effect. However, during retraction, the filament reaches the extruder at a lower temperature, resulting in less expansion. This causes the extruder to jam when printing multiple pieces at once. Although this problem does not always occur and strongly depends on the printer and material used, it must be considered to avoid unfinished printing processes and clogging problems.
Thus, as indicated, it is expected that the phenomenon described will result in a loss of material flow due to movement opposition in the jammed area. For the samples, this can be translated into a smaller measurement of Do and a larger measurement of Di. However, in a test conducted to verify this with identical parameters used, the opposite behaviour was observed (Table 1). Although the opposite outcome was expected initially, this phenomenon can be explained by the layer time. In the manufacturing of the two test specimens, the time for each layer was doubled; therefore, the time available for cooling down was also doubled. Consequently, with slower cooling (since after finishing the layer of one specimen, the extruder moves away from the part, reducing local heat input), the shrinkage of the piece is less pronounced. This is another reason why it was decided to print the test specimens one by one, avoiding the need for additional process variables.
Table 1.
Simultaneous manufacturing test.
2.1. Sample Geometry, Modelling and Manufacturing
As commented previously, the geometry of the test specimens influenced the dimensional accuracy of the printed parts. Therefore, specimens with different dimensions were fabricated while keeping the geometric and manufacturing parameters constant. Additionally, given the problem this study addresses and the solution it aims to provide, it is essential for the artificial neural network to be trained on diverse different datasets to provide optimal design values for a wide dimensional range.
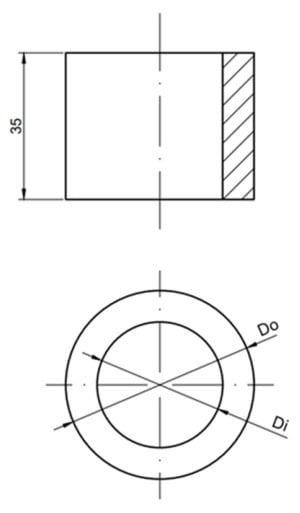
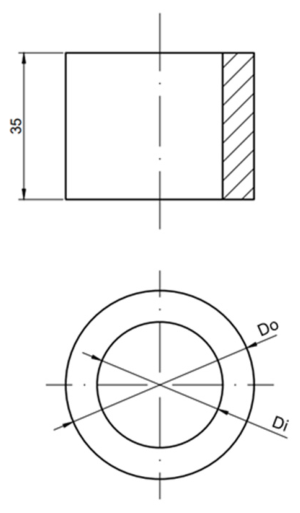
The specimens consisted of a hollow cylinder of a certain height (Figure 1). The values of Do and Di varied while the height remained constant.
Figure 1.
Sample geometry.
This specimen was designed to include both an axis and a hole in a single piece, representing two elements intended to be assembled together. In this case, height is not a subject of study. To optimise material and printing time, a height of 35 mm was chosen.
The specimens were modelled using SolidWorks (version 2025), Dassault Systèmes SolidWorks Corporation (Waltham, MA, USA). This software was selected because of the quality of the generated mesh and its widespread use in engineering design. In the first phase of the study (Table 2), for the adjustment through iterations and the dimensional analysis based on geometry, the manufacturing parameters were kept constant (deposition temperature 200 °C, layer thickness 0.2 mm, deposition speed 60 mm/s, infill percentage 50%, number of shells 2, bed temperature 60 °C), varying the test dimensions (Table 2). Conservative PLA printing parameters were selected based on a previously validated printing profile for the machine used [43,44,45].
Table 2.
Specimen geometries. First Part.
In the second part, two parameters, layer thickness (e) and deposition speed (v), were modified (0.1, 0.2, and 0.3 mm; and 40, 60, 80, and 100 mm/s, respectively) (Table 3). These parameters were selected because they are considered the most influential on geometric deviations, as shown in previous studies [43,46]. This is because they directly affect the amount of material deposited and subsequently cooled (by the layer fan) per unit of time. This influence was also observed in [47].
Table 3.
Tested specimens.
Additionally, as previously indicated, the effect of geometric parameters, specifically the difference in radius (dR), was also analysed. dR was added to consider the amount of material between the inner and outer walls. The greater the amount of material, the greater is the expected shrinkage. In Table 2, the first two parameters show the deviation based on the magnitude of the variable itself. The last parameter refers to the amount of material between the two walls of the part and, therefore, the amount of material that contracts after being melted. For this reason, a coherent combination of geometries was selected for this study to isolate and examine the effect of each variable as much as possible (Table 2 and Table 3).
For part printing, the STL files exported from the modelling software were conventionally used. The slicing process was conducted using IdeaMaker (5.3.2) software developed by Raise3D Technologies, Inc. (Stafford, TX, USA), the manufacturer of the used printer. The printer is equipped with dual extrusion capability and has a printing volume of 305 × 305 × 300 mm3. It features a maximum extrusion temperature of 300 °C and a maximum heated bed temperature of 110 °C. The printed volume is enclosed by a removable acrylic dome at the top. All axes were guided by linear guides consisting of 10-mm-diameter chrome-plated cylindrical bars, with 3 guides on the X-axis, 3 on the Y-axis, and 4 on the Z-axis to maintain perpendicularity between the Z-axis and the X and Y axes. The X- and Y-axes are driven by toothed belts, while the Z-axis movement is facilitated by two 16-mm-diameter lead screws. The extrusion was conducted directly by a dual pulley extruder with torque multiplication through gears. The programmed line width used in the slicing profile was 0.4 mm, matching the nominal nozzle diameter of the printer. This value was used later to define the volumetric material flow rate as a process descriptor.
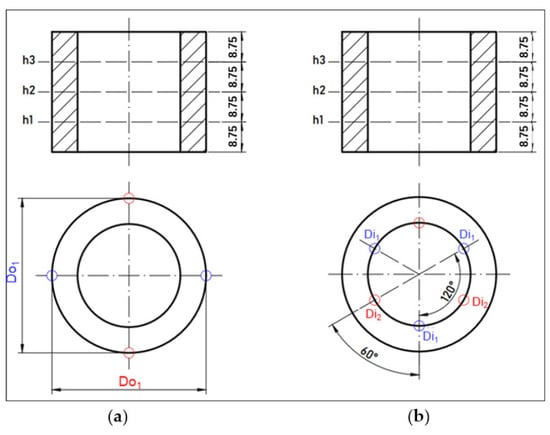
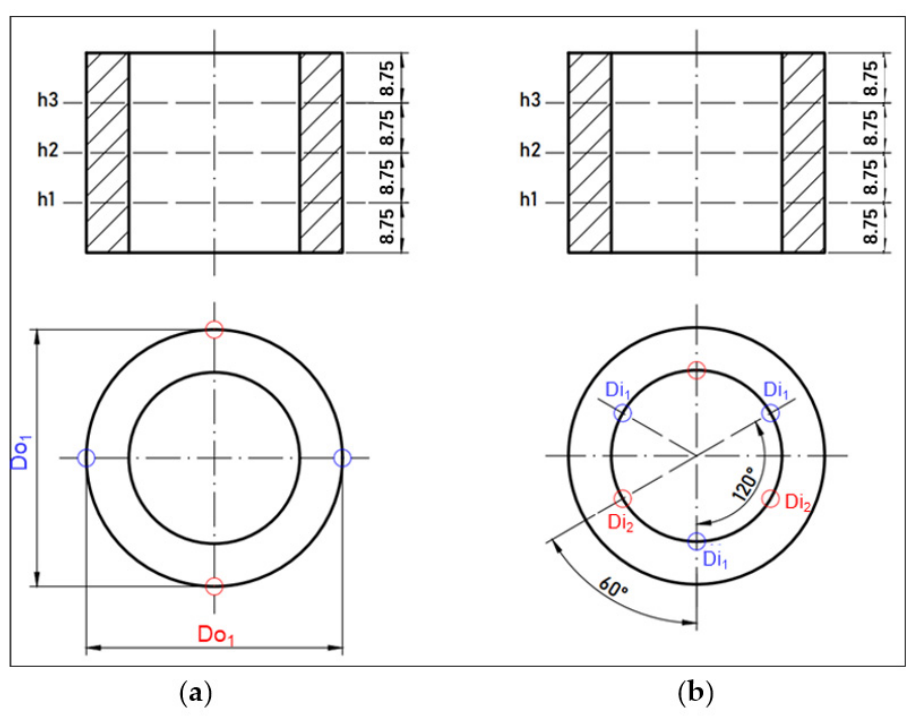
For the dimensional control of the samples, a digital calliper (Mitutoyo Corporation (Kawasaki, Japan), 0.01 mm scale division) was used for the external diameter, and an internal micrometre (Mitutoyo Corporation (Kawasaki, Japan), 0.01 mm scale division) was used for the internal diameter. For each dimension, a total of six measurements were performed at different points. The average value and standard deviation of these six measurements were calculated for each diameter to quantify measurement scatter. To prevent errors, contact with the layer start and end seams during measurement was avoided. The section joining the platform was also avoided, as it may present deformation due to overheating of the bed or a short distance between the nozzle and the bed (Figure 2).
Figure 2.
Measurement scheme used for the dimensional control of the specimens: (a) outer diameter, Do, and (b) inner diameter, Di. Measurements were performed at three different heights, h1, h2 and h3. Blue and red labels indicate the different angular measurement directions used to distribute the contact points around the circumference. For the inner diameter, the measurement directions were separated by 60° and 120°, as indicated in the scheme. Decimal points are used in all dimensions.
2.2. Iterative Adjustment and Artificial Neural Network
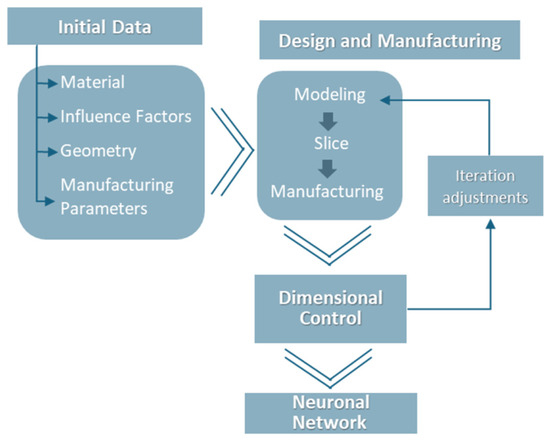
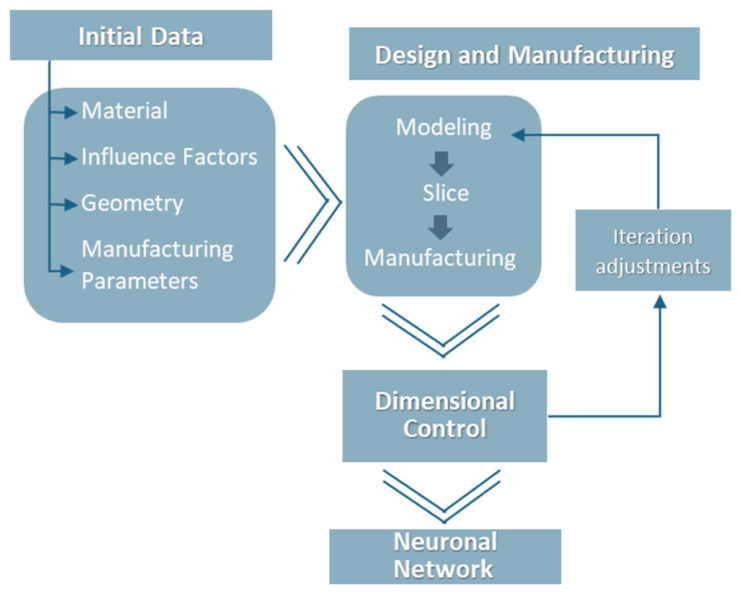
The methodology was divided into two main phases: iterative dimensional adjustment and analysis of dimensional deviation as a function of printing parameters (Figure 3). In the first phase, the design dimensions were modified according to the measured deviations in order to bring the printed specimens closer to the nominal target values. This procedure was repeated over three iterations. Four specimens with different geometries were used in each iteration to evaluate whether the dimensional deviation depended on the selected diameter range.
Figure 3.
Workflow for developing the artificial neural network.
In the second phase, the influence of print speed, v, and layer thickness, e, was analysed using specimens with the same nominal geometry. This made it possible to isolate the effect of the printing parameters from the effect of geometry. The radial increment, dR, defined as the difference between the outer and inner radii, was also evaluated as a complementary geometrical descriptor using the specimens manufactured during the iterative adjustment phase.
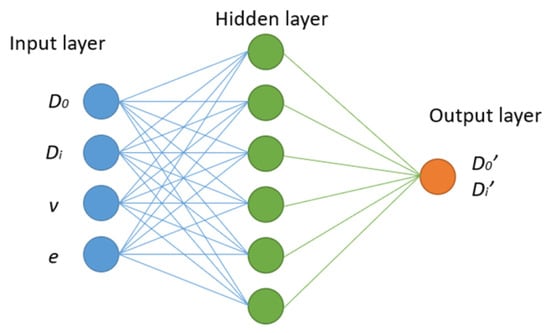
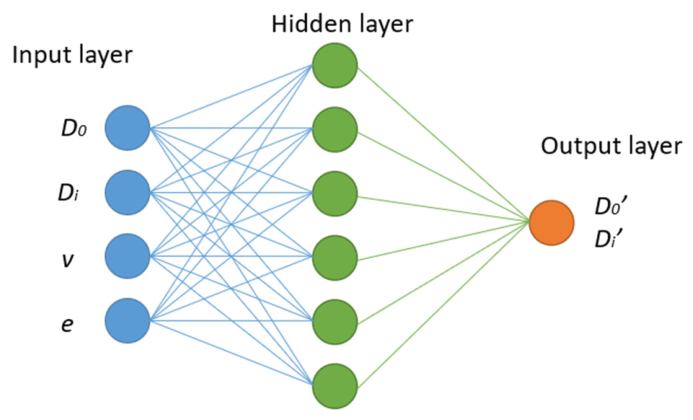
The experimental results revealed measurable dimensional deviations in the printed specimens. Consequently, a data-driven compensation approach was developed to estimate the design diameters required to obtain the target measured dimensions. For this purpose, a feedforward neural network (FNN) was implemented in MATLAB (version 2025b), The MathWorks, Inc. (Natick, MA, USA). The input variables were the measured diameter, the print speed, , and the layer thickness, , while the output variable was the compensated design diameter to be introduced into the CAD model. To account for the different behaviour observed for outer and inner diameters, two independent FNNs were developed: one for and one for (Figure 4).
Figure 4.
FNN schemes for the outer and the inner design diameter.
Bayesian regularisation was used to train both FNNs, since this strategy is suitable for small datasets and helps reduce overfitting [48,49]. Before training, input and output data were normalised using the standard MATLAB (version 2025b), The MathWorks, Inc. (Natick, MA, USA) normalisation procedure to avoid scale effects between dimensional and process variables. The available dataset was divided into training and internal validation subsets using an 80/20 random split within the MATLAB (version 2025b), The MathWorks, Inc. (Natick, MA, USA) training environment. A stratified division by printing condition was not applied because the number of specimens per parameter combination was limited, and the dataset combined geometric and process-parameter variation. The internal validation subset was therefore used to monitor network performance during training, whereas the additional specimens manufactured after model development were used as an external experimental check of the compensation strategy.
Each FNN consisted of one hidden layer and one output layer. The hidden layer used a hyperbolic tangent sigmoid transfer function, while the output layer used a linear transfer function. Several preliminary trials were conducted to determine the number of hidden neurons, ranging from 3 to 15 neurons. For the outer diameter network, no relevant improvement was observed beyond 9 neurons, and, therefore, 9 neurons were selected. For the inner diameter network, 8 neurons were selected. Network performance was assessed using the mean squared error (MSE) and the regression coefficient, R. A maximum of 1000 epochs was defined. Since Bayesian regularisation internally controls the weight update process, no fixed learning rate was manually imposed. Training stopped when the convergence parameter Mu reached its target value or when the maximum number of epochs was reached.
The dataset used for each FNN was organised so that the input variables were the average measured diameter, the print speed, , and the layer thickness, . The target output was the corresponding design diameter introduced into the CAD model. Therefore, the network was trained to estimate the design compensation required to obtain a target measured diameter under specific printing conditions. This structure was applied independently to the outer diameter and inner diameter networks, using the same training and internal validation procedure described above.
As shown in Table 3, the initial dataset included 23 specimens. Twelve specimens corresponded to the iterative adjustment phase, in which geometry was varied while the printing parameters were kept constant. The remaining specimens corresponded to the parameter study, in which print speed and layer thickness were varied while the geometry was held fixed. This dataset, therefore, combined geometric and process-parameter variation, but it did not cover all possible combinations of geometry, print speed, and layer thickness.
Preliminary tests with the network showed inaccurate outputs for some intermediate diameter values not included in the initial dataset, such as 52 mm. To improve the coverage of the input space, six additional specimens with different geometries and printing parameters were manufactured (Table 4). In addition, specimens 10 and 12 were excluded from the final ANN training dataset because their dimensional results were considered inconsistent with the remaining experimental trends.
Table 4.
Additional Specimens.
3. Results and Discussion
Given the scope of the analysis, Section 3 is divided into three sections.
3.1. Influence of Diameter Selection
The average values of and are shown in Table 5. Two error descriptors were used to avoid ambiguity between the direction of the deviation and its relative magnitude. First, the signed dimensional deviation, , was calculated as the difference between the measured diameter and the nominal CAD diameter:
Table 5.
Average diameter results, standard deviations, signed dimensional deviations, and absolute percentage errors.
A negative value of indicates contraction, whereas a positive value indicates oversizing. Second, the absolute percentage error, , was calculated to compare deviations between specimens with different nominal diameters:
where is the measured diameter and is the nominal CAD dimension of the corresponding specimen, that is, the target design diameter used in that phase. Therefore, the sign of the deviation is reported only through , while the percentage error is reported as an absolute value.
Throughout the analysis, a distinction was made between the outer and inner diameters. It was assumed that their deviation evolved differently, and this assumption was verified throughout the analysis.
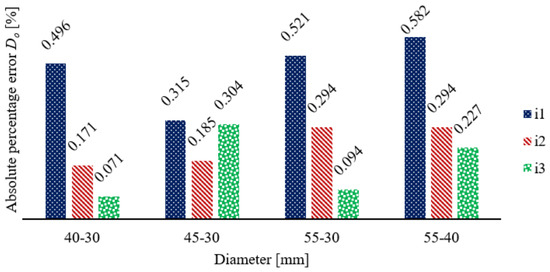
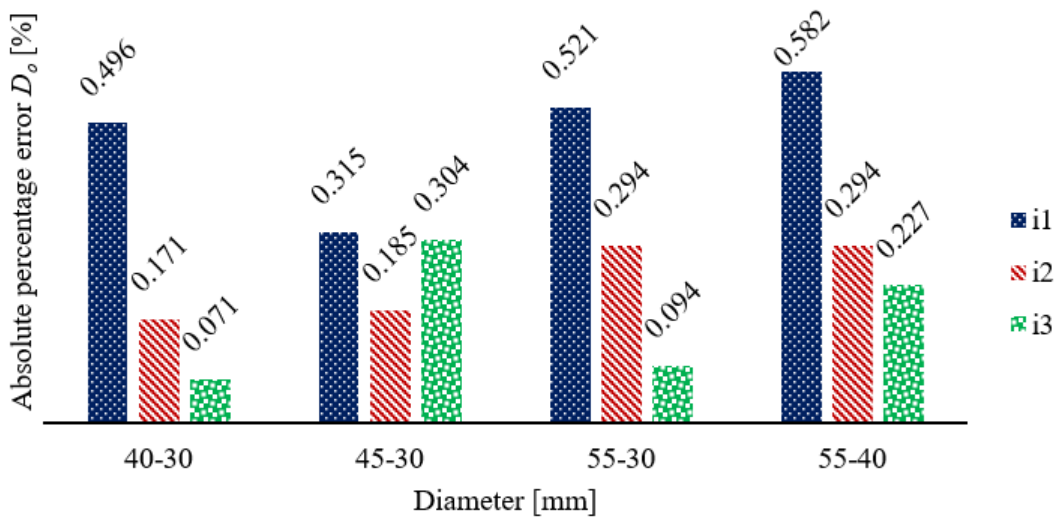
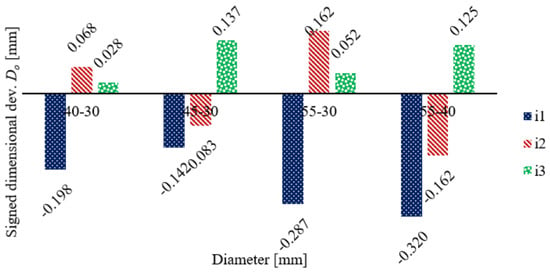
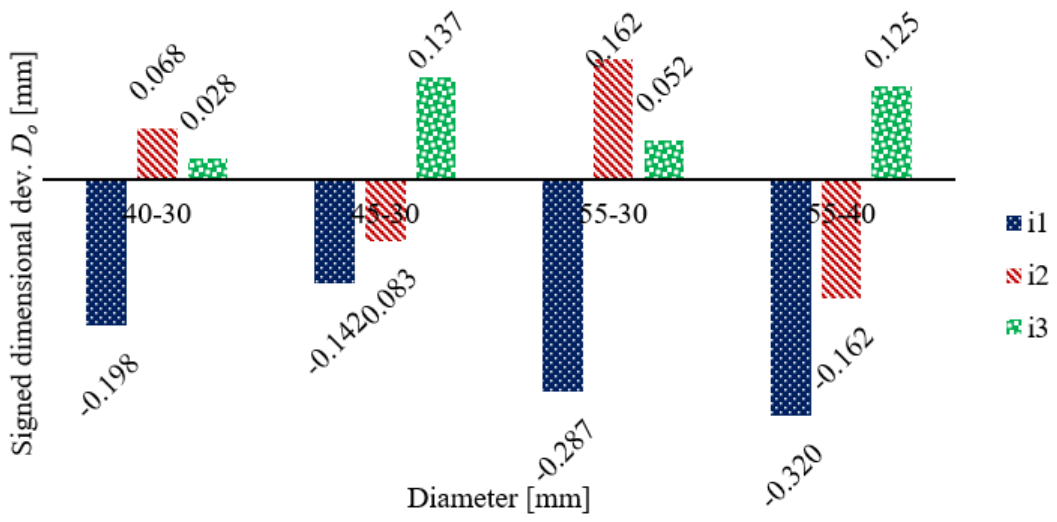
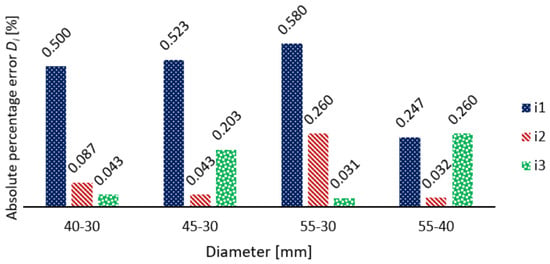
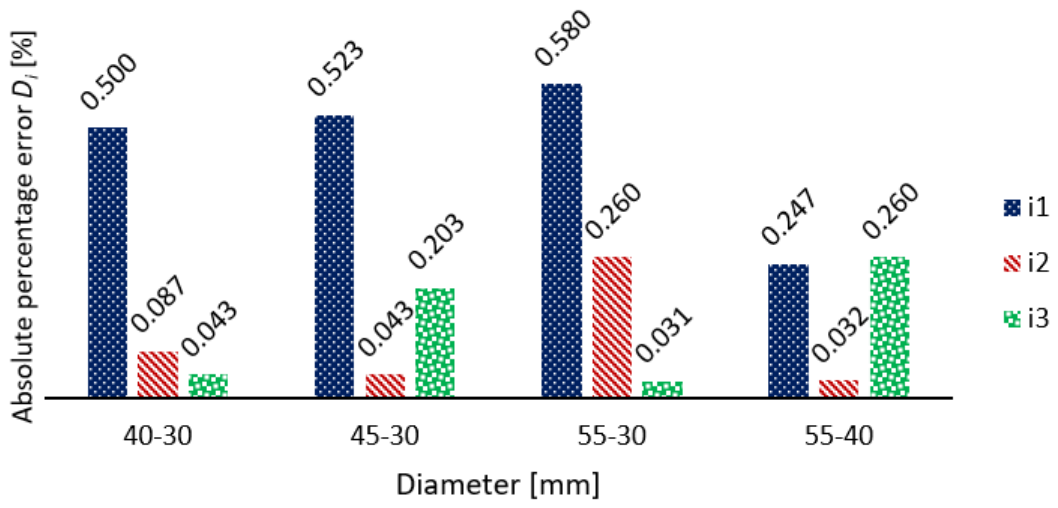
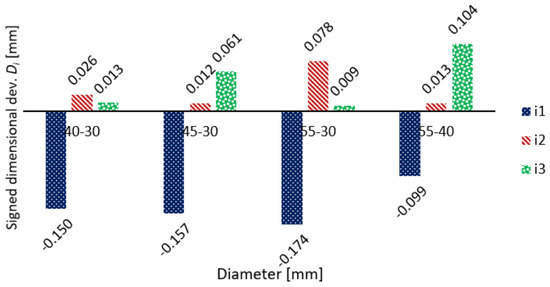
The initial errors were relatively high. Deviations greater than 0.3 mm, as in test four, are high values. Thus, three iterations were performed by modifying the dimensions of the specimen design. These results are shown in Figure 5 and Figure 6. The results are presented as bar charts showing the evolution of the adjustment across iterations in terms of percentage error (Figure 5) and deviations in millimetres (Figure 6). It can be seen that the results are as expected. After correction, the measured value gradually aligned with the nominal value.
Figure 5.
Iterative adjustment of Do in terms of absolute percentage error.
Figure 6.
Iterative adjustment of Do in terms of signed dimensional deviation.
As shown in Figure 5, the minimum absolute percentage error for Do was 0.071%, corresponding to specimen 9 (i3). In this case, the signed dimensional deviation was positive, with an oversizing of 0.028 mm for a nominal diameter of 40 mm (Figure 6). In terms of ISO 286-1:2010 tolerance grade, this value corresponds to IT8. For the same geometry, specimen 1 in the first iteration showed an absolute percentage error of 0.495%, corresponding to a signed dimensional deviation of −0.198 mm and an IT12 tolerance grade. The relative improvement between the two cases was 86%, which represents the maximum reduction in absolute deviation observed for Do. This relative improvement does not refer to the absolute geometric error itself, but to the reduction in absolute deviation with respect to a stated baseline, computed as
Unless noted otherwise, the baseline corresponds to the result before applying the proposed adjustment or prediction step, for example, pre-iteration or pre-ANN, whereas the method corresponds to the result after applying the corresponding correction. This metric was used only to quantify the reduction in absolute dimensional deviation and should not be confused with the absolute percentage error reported in Table 5. All measurements are static geometric measurements obtained with the digital calliper described in Section 2.
However, for the specimen with a nominal diameter of 45 mm in the third iteration, specimen 10, the absolute deviation increased compared with the previous iteration by 0.054 mm. This specimen showed the highest absolute percentage error for Do in the third iteration, with a value of 0.304%. The signed dimensional deviation was positive, with an oversizing of 0.137 mm, corresponding to an IT11 tolerance grade. Although this result breaks the trend observed in the graph, it was considered acceptable for several reasons. First, the deviation remained relatively small. In terms of tolerance grade, it changed from IT10 to IT11. Second, this result may be due to random variability inherent to the FFF process. Lastly, and partly related to the previous reasons, the deviation may also be associated with the condition of the machine at the time the specimen was printed.
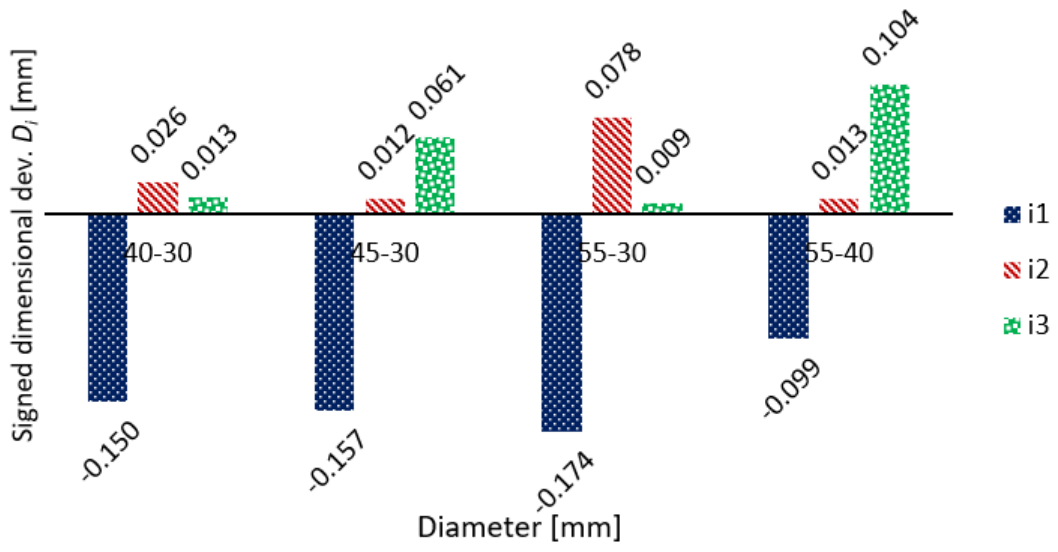
For Di (Figure 7 and Figure 8), a significant reduction in error magnitude was observed between the first and second iterations. In addition, the minimum error was smaller than that obtained for Do. The minimum absolute percentage error was 0.031%, corresponding to specimen 11 (i3). In this case, the signed dimensional deviation was positive, with an oversizing of 0.009 mm for a nominal diameter of 30 mm (Figure 8), corresponding to an IT5 tolerance grade. For the same geometry, specimen 3 in the first iteration showed an absolute percentage error of 0.580%, corresponding to a signed dimensional deviation of −0.174 mm and an IT12 tolerance grade. The relative improvement in this case was 95%, which represents the maximum reduction in absolute deviation obtained for Di.
Figure 7.
Iterative adjustment of Di in terms of absolute percentage error.
Figure 8.
Iterative adjustment of Di in terms of signed dimensional deviation.
Similar to the results obtained for Do, an increase in error was observed for specimens 10 and 12 in the third iteration. The maximum absolute percentage error obtained for Di in the third iteration corresponded to specimen 12, with a value of 0.260%. For a nominal diameter of 40 mm, this value corresponded to a signed dimensional deviation of 0.104 mm and an IT11 tolerance grade. Specimen 10 was the same specimen for which an increase in error was observed for Do, suggesting that the source of the error may have been related to the condition of the machine at the time of printing. In contrast, specimen 12 showed a reduction in Do error, whereas the trend for Di was not improved. The cause of this behaviour cannot be clearly identified because of the number of variables affecting the process. This result reinforces the need to analyse both diameters separately and supports the use of models able to capture the final relationship between process conditions, measured dimensions, and compensated design values.
The observations of predominantly negative deviations and the differentiated sensitivity of outer and inner diameters to print speed and layer thickness are consistent with recent parameter-sensitivity reports [34,35] and feature-level deviation analyses [36]. The practical relevance of a flow-related descriptor is supported by evidence that extrusion-rate adjustments can trigger size growth beyond specific thresholds [37]. Compared with algorithmic compensation approaches (e.g., adaptive slicing), our workflow provides a measurement-based path to prescribe design-to-target adjustments [28], while remaining compatible with the broader trends summarised in contemporary reviews [33].
3.2. Influence of the Selection of the Printing Parameters
The samples related to the influence of printing parameters on dimensional deviation are presented in Table 6. These samples were grouped into sets of three specimens with different layer thicknesses for the same speed, as shown in Table 7. For a speed value of 60 mm/s, only two specimens are shown, as the remaining one, with a layer thickness of 0.2 mm, corresponds to specimen 1, with matching parameters.
Table 6.
Dimensional results and measurement scatter for the print speed and layer thickness study.
Table 7.
Deviations versus printing speed and layer thickness.
The standard deviation values reported in Table 5 and Table 6 provide an estimate of the measurement scatter associated with the six measurements performed for each diameter. In general, the observed standard deviations were low compared with the corresponding dimensional deviations, indicating that the trends discussed in this section were not dominated by local measurement scatter. Nevertheless, the results should be interpreted as descriptive experimental evidence rather than as a full statistical uncertainty analysis. A complete robustness assessment would require repeated manufacturing runs for each process condition, which was outside the scope of the present study.
Table 7 presents the results for the samples with combinations of v and e for Do and Di, respectively. Since the same nominal diameter was used in each case, the results are presented in terms of the dimensional deviation in millimetres, including the corresponding sign. For better interpretation, the graphical representation is shown with the absolute value deviation. The maximum and minimum values on each table are highlighted in bold.
All deviation values were negative, indicating that the measured diameters were generally smaller than the nominal values. This behaviour is consistent with material contraction during cooling. However, the magnitude of the deviation depended on both the measured diameter and the printing parameters.
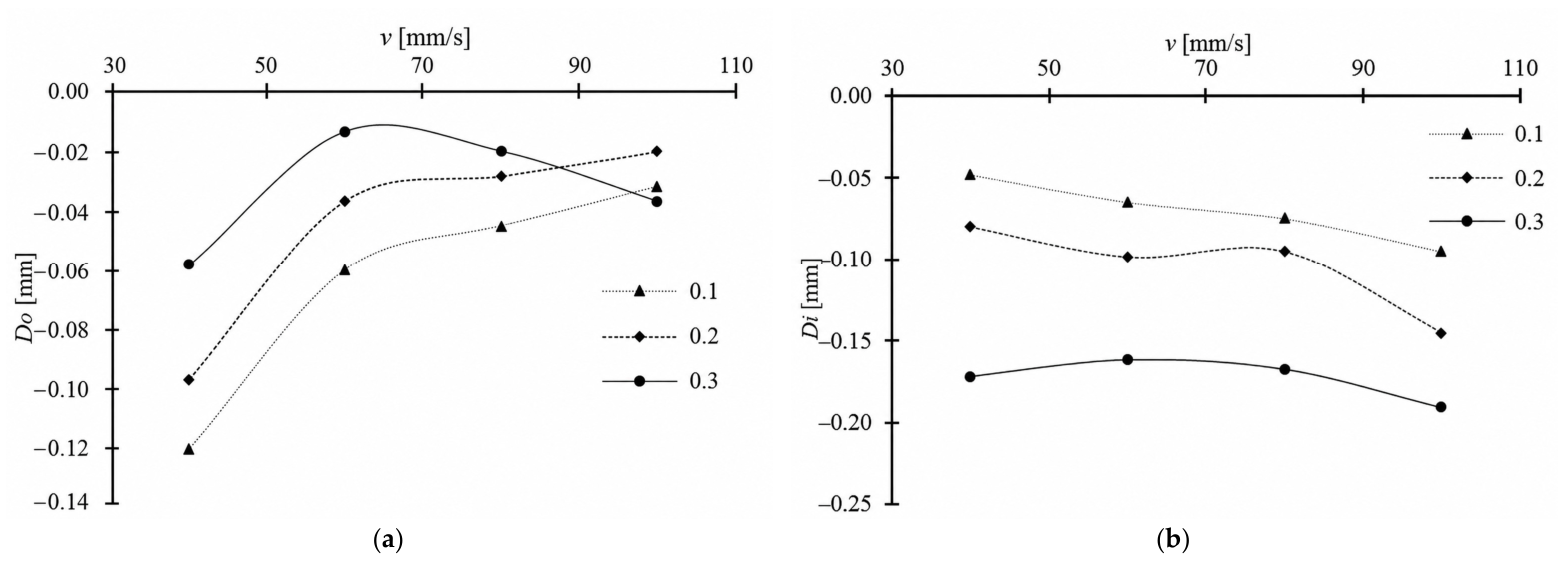
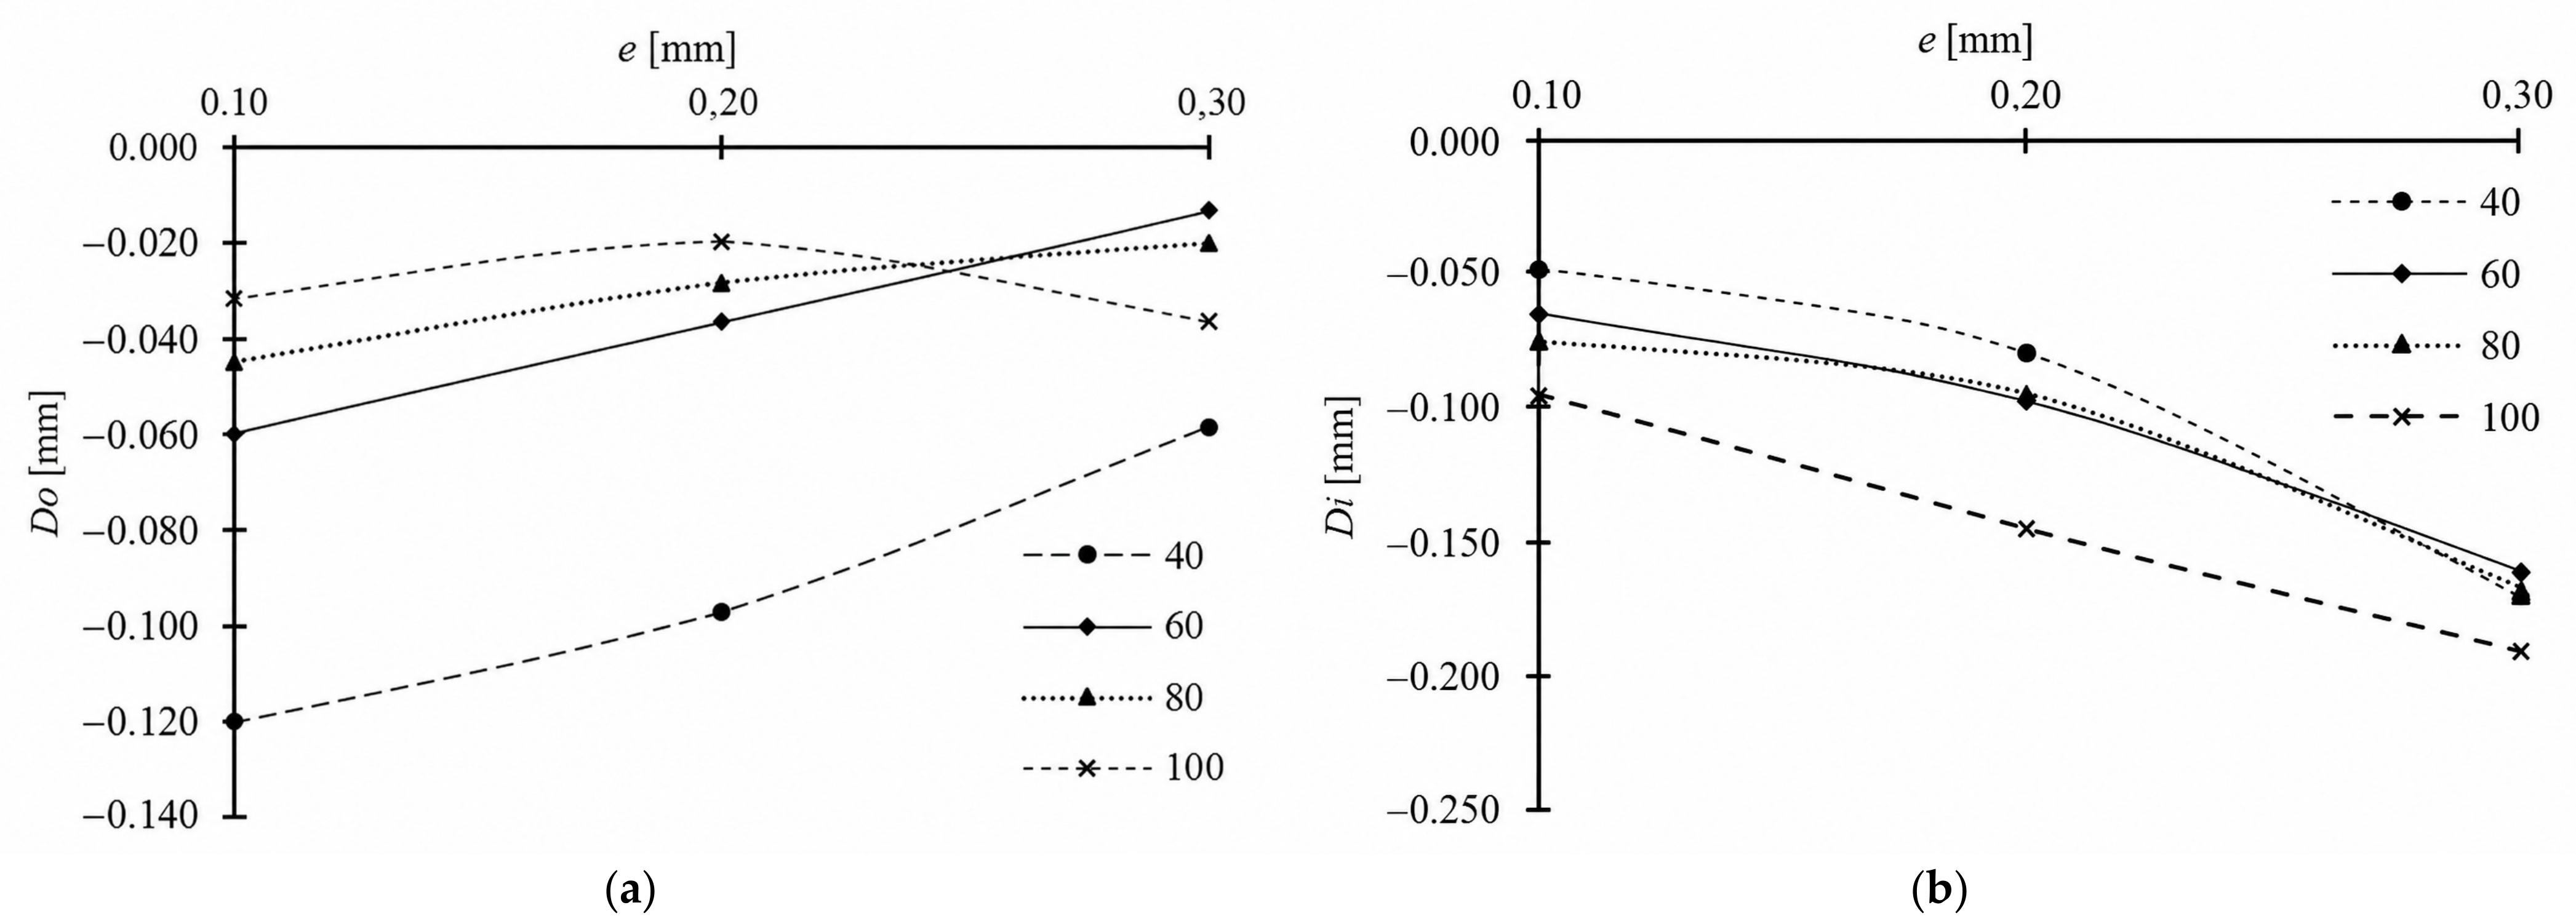
For Do, increasing print speed generally reduced the magnitude of the dimensional deviation (Figure 9a), in agreement with previous reports [25]. For specimens printed with a layer thickness of 0.2 mm, the deviation decreased from 0.097 mm at 40 mm/s to 0.020 mm at 100 mm/s, corresponding to a 79% reduction. The minimum deviation was 0.013 mm for specimen 17, manufactured with a layer thickness of 0.3 mm and a speed of 60 mm/s. In contrast, the maximum deviation was 0.120 mm for specimen 13, manufactured with a layer thickness of 0.1 mm and a speed of 40 mm/s.
Figure 9.
External (a) and Internal (b) Deviations vs. Printing Speed.
For Di, the opposite trend was observed (Figure 9b). As print speed increased, the magnitude of the internal deviation increased. The minimum deviation was 0.048 mm for specimen 13, whereas the maximum deviation was 0.191 mm for specimen 23, manufactured with a layer thickness of 0.3 mm and a speed of 100 mm/s. This confirms that the same change in process parameters can affect the outer and inner contours differently.
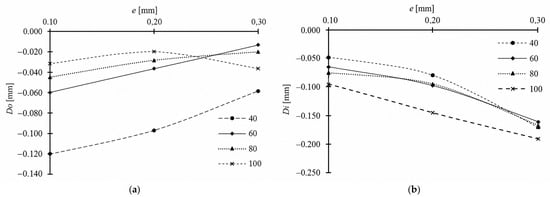
A similar contrast was observed for layer thickness (Figure 10). For Do, the deviation generally decreased as layer thickness increased, although the trend changed at high speed and high layer thickness values. This suggests that, beyond a certain deposition demand, the material may not reach the same thermal condition before deposition, leading to less stable material flow. For Di, the deviation increased consistently with layer thickness, indicating that the inner contour was more sensitive to bead spreading or material accumulation towards the hole region. Overall, the results indicate that Do was more affected by print speed, whereas Di was more affected by layer thickness.
Figure 10.
External (a) and Internal (b) Deviation vs. layer thickness.
As mentioned earlier, layer thickness and print speed directly influence the amount of material deposited per unit time. Therefore, the absolute percentage error was also analysed as a function of the volumetric material flow rate, . In this study, was calculated from the programmed print speed, , the layer thickness, , and the programmed line width, . The value of was set to 0.4 mm, corresponding to the nominal nozzle diameter and to the extrusion width defined in the slicing profile. Although the actual deposited bead width may differ slightly from this nominal value, the programmed value was used as a process descriptor to compare the tested conditions. The volumetric material flow rate was therefore calculated as:
where is the volumetric material flow rate in mm3/s, is the print speed in mm/s, is the layer thickness in mm, and is the programmed line width in mm.
The obtained results are shown in Table 8 and Figure 11. The dimensional deviations were fitted using second-degree polynomial functions of :
for Do, and:
for Di.
For Do, the deviation decreased as increased, reaching a minimum value of −0.013 mm at mm3/s. Above this value, the curve showed an increasing trend. This change may be associated with excessive material flow, which can lead to insufficient heating or less stable deposition. In contrast, the curve tended to increase with . These results were obtained at a fixed printing temperature of 200 °C. Since temperature directly affects melt viscosity, interlayer bonding, bead spreading, and cooling shrinkage, future studies should analyse its interaction with to define more robust compensation criteria.
Table 8.
Volumetric material flow rate used as process descriptor.
Figure 11.
Dimensional deviation as a function of volumetric material flow rate, Q.
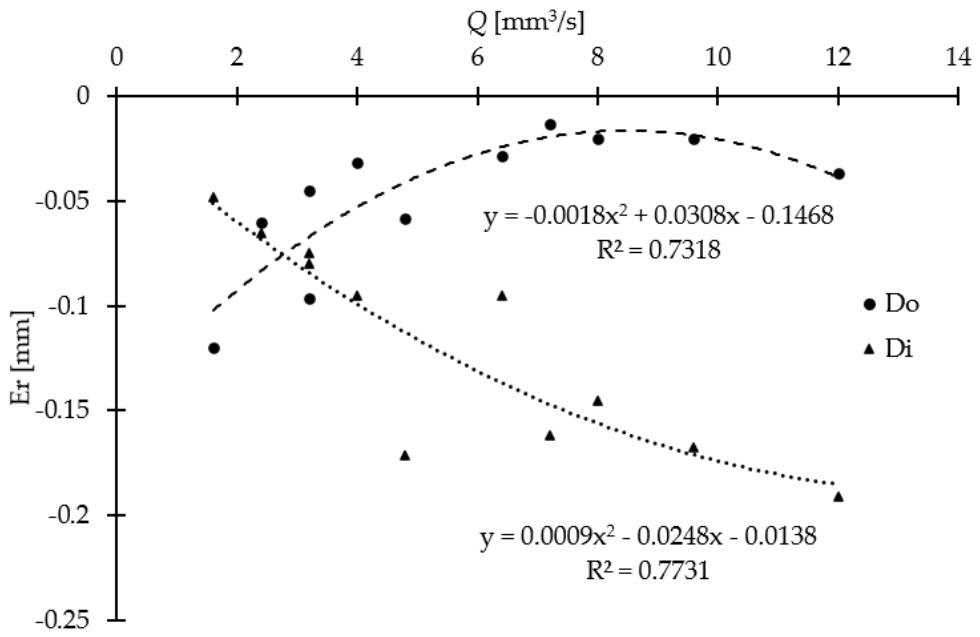
The opposite trends observed for Do and Di can be explained by the different ways in which material deposition affects external and internal contours. In the outer diameter, dimensional deviation is primarily associated with global contour shrinkage during cooling. In contrast, the inner diameter is more sensitive to material accumulation, bead spreading, and inward displacement of the deposited filament towards the hole region. Therefore, the same process change can reduce the deviation of the external contour while increasing the deviation of the internal contour. This behaviour confirms that Do and Di should be analysed and compensated separately, rather than through a single global correction.
3.3. Complementary Analysis of Radial Increment
The radial increment (dR) was evaluated as a complementary geometrical descriptor to account for the amount of material located between the inner and outer walls of the hollow cylindrical specimens. Since shrinkage occurs during cooling, a larger radial material thickness could be expected to influence the final dimensional deviation. For this analysis, specimens from the iterative adjustment phase were used, corresponding to specimens 1–12. Because the design diameter changed across iterations, the deviation was calculated with respect to the design diameter used in each iteration.
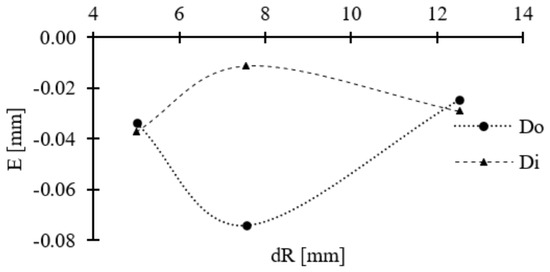
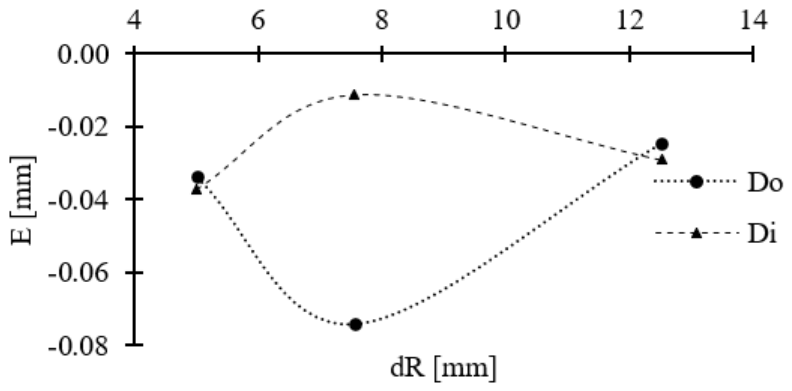
The specimens were grouped according to their radial increment, as shown in Table 9. Since slight differences existed among the design diameters across iterations, average values of dR and average deviation values were calculated for specimens with comparable geometry. The resulting trends are shown in Figure 12.
Table 9.
Average radial increment values.
Figure 12.
Error evolution according to radial increment.
The results indicate that radial increment did not show a sufficiently clear or monotonic relationship with dimensional deviation within the range analysed. Therefore, dR cannot be considered the main explanatory variable for the dimensional error observed in this study. This behaviour suggests that the influence of radial material thickness is secondary compared with the combined effect of print speed, layer thickness, and material flow. However, the analysis provides useful complementary information. The opposite trends observed for Do and Di confirm that outer and inner diameters respond differently to geometrical and process-related effects. Consequently, the radial increment analysis supports the decision to analyse and compensate both diameters separately, rather than using a single global dimensional correction.
3.4. Neural Network
The data used to train the network are shown in Table 10. The test specimens specifically fabricated to feed into the network are highlighted in green, while data points from two specimens (specimens 10 and 12) are marked in red as invalid.
Table 10.
The ANN training data. Highlighted in green, the test specimens specifically fabricated to feed into the network. Highlighted in red the data points from two specimens (specimens 10 and 12) as invalid.
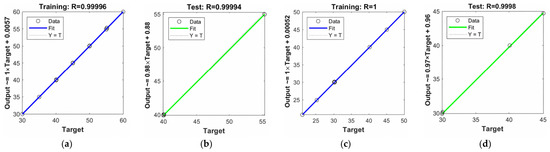
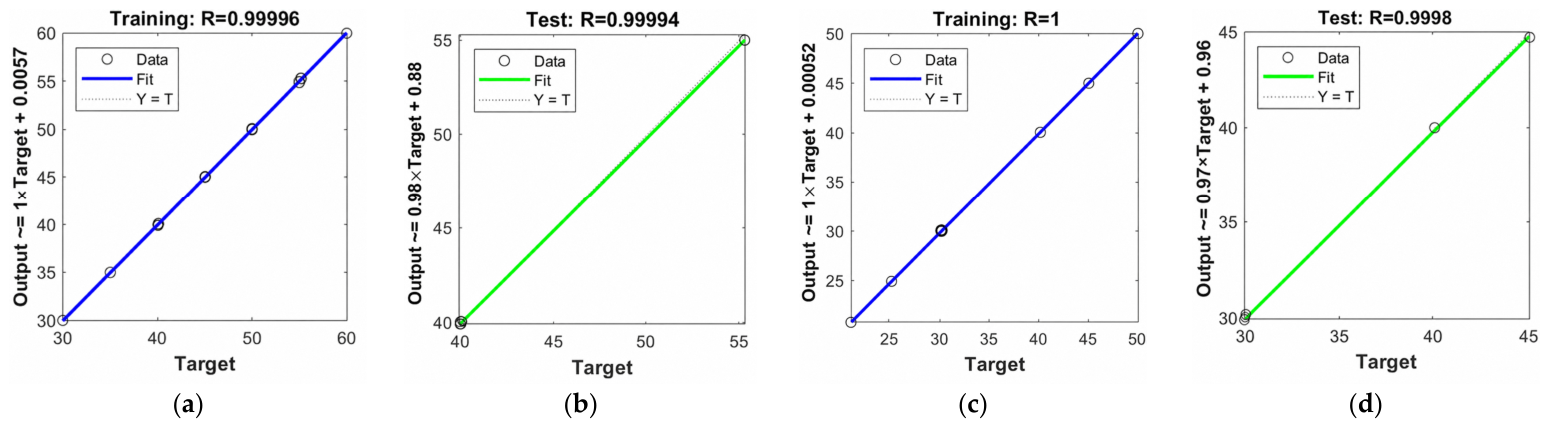
As mentioned earlier, two separate networks have been developed, one for Do and another for Di, yielding different results (Figure 13). For Do, convergence was rapid (90 iterations), resulting in low prediction error. The training was concluded when the Mu parameter reached its target value. The mean squared error was 0.00568, and the R parameter was 0.99996, indicating a good fit to the available training data. For Di, 298 iterations were required for convergence. Similar to the previous case, the Mu parameter first reached its target value. The mean squared error was 0.000304, and the R parameter was 1, indicating a low fitting error for the available training data.
Figure 13.
Regression results (a) Do training data; (b) Do test data; (c) Di training data; (d) Di test data.
The final network was implemented in the Simulink environment (2025), The MathWorks, Inc. (Natick, MA, USA). The application employs four input data points: exterior and interior diameters, printing speed, and layer thickness. The output values are the corresponding exterior and interior diameters. The input arrangement was based on identical manufacturing conditions for the exterior and interior diameters (Table 11).
Table 11.
Samples for NN validation.
The results obtained from the additional specimens are presented in Table 12. These specimens were used as an external experimental check of the compensation strategy, rather than as a statistically representative validation dataset. Although specimens 30 and 31 included diameter values and process conditions not directly used in the training dataset, the number of additional specimens was not sufficient to cover the full multidimensional design space. Therefore, this analysis should be understood as a preliminary external experimental check of the compensation strategy, not as a robust validation of the generalisation capability of the neural network.
Table 12.
Validation results.
The results were comparable to those obtained in the third iteration of the iterative adjustment. In terms of absolute percentage error, the smallest value was observed for the inner diameter of specimen 30, with , corresponding to an IT5 tolerance grade for a nominal diameter of 23 mm. The largest value was observed for the outer diameter of specimen 31, with , corresponding to an IT9 tolerance grade. These results indicate that the proposed compensation approach can reduce the dimensional deviation within the experimental scope analysed. However, owing to the reduced number of additional specimens, these results should be interpreted as a preliminary external check rather than as a full statistical validation of the neural network model.
Considering the four-dimensional outputs obtained from the two additional specimens, the external experimental check yielded a mean absolute deviation of 0.025 mm and a root mean square deviation of 0.029 mm. When the outer and inner diameters were analysed separately, the mean absolute deviation was 0.038 mm for Do and 0.013 mm for Di. In terms of absolute percentage error, the mean values were 0.095% for Do and 0.049% for Di. These metrics provide a quantitative description of the error obtained in the additional specimens. However, due to the reduced number of specimens, they should not be interpreted as statistically representative validation metrics. Therefore, the neural network model should be interpreted as a bounded compensation tool within the experimental domain analysed, rather than as evidence of broad generalisation across materials, printers, geometries, or process windows.
To address the comparison with simpler modelling approaches, the polynomial relationships fitted as a function of the volumetric material flow rate, , can be considered an interpretable baseline. These expressions provide a simple description of the average deviation trends for and and are useful for identifying the different responses of both diameters to material flow. However, their applicability is limited because they were obtained for a fixed nominal geometry and only relate the dimensional error to . They do not directly provide the compensated design diameter required for a target dimension when geometry, print speed, and layer thickness vary simultaneously. In contrast, the FNN receives the measured diameter and process parameters as inputs and outputs the compensated design diameter to be introduced into the CAD model. Therefore, the advantage of the FNN in this study is not that it is statistically proven to outperform all simpler models, but that it provides a direct compensation tool within the analysed experimental domain. A more extensive comparison with linear regression, polynomial regression, and other baseline models will require a larger dataset and is included as future work.
To provide a more direct comparison with previous compensation approaches, Table 13 summarises selected quantitative indicators reported in related studies and compares them with the results obtained in the present work. Since the studies differ in material, geometry, measured feature, compensation strategy, and validation procedure, the values should not be interpreted as a direct ranking. Nevertheless, they provide a quantitative context for assessing the magnitude of the dimensional improvement achieved in this study.
Table 13.
Quantitative comparison with selected studies on geometric or dimensional compensation in additive manufacturing.
Compared with the 44% reduction in overall shape deviation reported by Decker et al. [32], the present study achieved larger reductions in specific cylindrical features, with maximum reductions in absolute deviation of 86% for Do and 95% for Di after iterative adjustment. However, this comparison must be interpreted with caution because Decker et al. analysed global shape deviation in more complex 3D geometries, whereas the present work focuses on outer and inner diameters of hollow cylindrical PLA specimens. The external experimental check of the neural network compensation yielded a mean absolute deviation of 0.025 mm and a root-mean-square deviation of 0.029 mm. These values indicate that the proposed workflow can provide low-dimensional error within the experimental scope analysed. Nevertheless, the limited number of additional specimens precludes a statistically robust comparison with broader machine learning compensation frameworks.
4. Conclusions
The results obtained in this study show that dimensional shrinkage was the dominant behaviour under the analysed conditions. Most measurements showed negative deviations, meaning that the measured diameters were smaller than the corresponding design values.
The results also show that inner and outer diameters should be analysed separately. The reason is the significant difference between the results of the two variables.
The iterative adjustment reduced dimensional deviations in most specimens after successive design corrections. However, this trial-and-error procedure requires additional manufacturing time and material consumption. For this reason, the neural network compensation stage was implemented as a complementary tool to estimate corrected design diameters more directly.
Print speed and layer thickness strongly influenced dimensional deviation, but their effect depended on whether the outer or inner diameter was analysed. The volumetric material flow rate, , provided a compact descriptor for interpreting the combined effect of both parameters. The results also suggest that, for a fixed printing temperature, there may be a flow range beyond which deposition stability and dimensional accuracy change. Therefore, future analyses should consider the interaction between and thermal variables.
Neural network modelling was used as a complementary compensation tool within the proposed workflow. Within the experimental domain analysed, the feedforward neural network provided a practical way to estimate compensated design diameters. However, these results should not be interpreted as evidence of general superiority over simpler modelling approaches. Rather, the network should be understood as a data-driven compensation tool that can be progressively improved as additional experimental data are incorporated.
This study has several limitations. The experiments were carried out using PLA specimens manufactured with a single FFF printer and within a defined set of process parameters. Therefore, direct extrapolation to other materials, printer architectures, or geometrical families requires further validation. Extrusion temperature, chamber temperature, and environmental conditions were not systematically varied, although they may affect shrinkage, material flow, and dimensional accuracy. In addition, the ANN dataset was limited, and the external experimental check was based on only two additional specimens. Although measurement scatter was quantified using the standard deviation of six measurements per diameter, a complete uncertainty and robustness analysis would require repeated manufacturing runs for each process condition. Future work should expand the dataset, include other materials and printer configurations, analyse thermal variables, and compare the proposed compensation strategy with simpler baseline models.
Overall, the proposed methodology provides a practical approach for improving dimensional accuracy in FFF manufacturing within the experimental scope analysed. The neural network model should be understood as a compensation tool that can be progressively improved as new experimental data are incorporated. In this sense, the proposed workflow provides a basis for future studies involving other materials, printer configurations, and processing conditions.
Author Contributions
Conceptualisation, C.B.G. and S.M.-B.; methodology C.B.G., S.M.-B. and J.M.-C.; data interpretation, S.M.-B. and F.B.G.; writing—original draft preparation, C.B.G. and J.M.-C.; writing—review and editing, C.B.G. and S.M.-B.; supervision, F.B.G. and J.M.-C. All authors have read and agreed to the published version of the manuscript.
Funding
This research received no external funding.
Data Availability Statement
The raw and processed data generated and analysed during the current study are available from the corresponding author upon reasonable request.
Acknowledgments
The authors thank the University of Malaga-Andalucia Tech Campus of International Excellence.
Conflicts of Interest
The authors declare no conflicts of interest.
References
- Alogla, A.A.; Baumers, M.; Tuck, C.; Elmadih, W. The Impact of Additive Manufacturing on the Flexibility of a Manufacturing Supply Chain. Appl. Sci. 2021, 11, 3707. [Google Scholar] [CrossRef] [Scilit]
- Quinlan, H.E.; Hasan, T.; Jaddou, J.; Hart, A.J. Industrial and Consumer Uses of Additive Manufacturing: A Discussion of Capabilities, Trajectories, and Challenges. J. Ind. Ecol. 2017, 21, S15–S20. [Google Scholar] [CrossRef] [Scilit]
- Membrilla, J.A.V.; Pantoja, M.F.; Puerta, A.P.V.; Souza, V.H.; Sánchez, C.C. Design of Transcranial Magnetic Stimulation Coils with Optimized Stimulation Depth. IEEE Access 2024, 12, 1330–1340. [Google Scholar] [CrossRef] [Scilit]
- Colosimo, B.M.; Grasso, M.; Garghetti, F.; Rossi, B. Complex geometries in additive manufacturing: A new solution for lattice structure modeling and monitoring. J. Qual. Technol. 2022, 54, 392–414. [Google Scholar] [CrossRef] [Scilit]
- Bahnini, I.; Rivette, M.; Rechia, A.; Siadat, A.; Elmesbahi, A. Additive manufacturing technology: The status, applications, and prospects. Int. J. Adv. Manuf. Technol. 2018, 97, 147–161. [Google Scholar] [CrossRef] [Scilit]
- Wang, D.; Liu, L.; Deng, G.; Deng, C.; Bai, Y.; Yang, Y.; Wu, W.; Chen, J.; Liu, Y.; Wang, Y.; et al. Recent progress on additive manufacturing of multi-material structures with laser powder bed fusion. Virtual Phys. Prototyp. 2022, 17, 329–365. [Google Scholar] [CrossRef] [Scilit]
- García-Collado, A.; Blanco, J.M.; Gupta, M.K.; Dorado-Vicente, R. Advances in polymers based Multi-Material Additive-Manufacturing Techniques: State-of-art review on properties and applications. Addit. Manuf. 2022, 50, 102577. [Google Scholar] [CrossRef] [Scilit]
- Abas, M.; Habib, T.; Noor, S.; Salah, B.; Zimon, D. Parametric Investigation and Optimization to Study the Effect of Process Parameters on the Dimensional Deviation of Fused Deposition Modeling of 3D Printed Parts. Polymers 2022, 14, 3667. [Google Scholar] [CrossRef] [Scilit]
- Lyu, J.; Manoochehri, S. Modeling Machine Motion and Process Parameter Errors for Improving Dimensional Accuracy of Fused Deposition Modeling Machines. J. Manuf. Sci. Eng. 2018, 140, 121012. [Google Scholar] [CrossRef] [Scilit]
- Kristiawan, R.B.; Imaduddin, F.; Ariawan, D.; Ubaidillah Arifin, Z. A review on the fused deposition modeling (FDM) 3D printing: Filament processing, materials, and printing parameters. Open Eng. 2021, 11, 639–649. [Google Scholar] [CrossRef] [Scilit]
- Kumar Mawandiya, B.; Pancholi, K.; Shah, D.B.; Joshi, S.J. Parametric study on process parameters of FDM 3D printer for thermoplastic materials. Mater. Today Proc. 2022, 59, 373–378. [Google Scholar] [CrossRef] [Scilit]
- Papazetis, G.; Vosniakos, G.C. Feature-based process parameter variation in continuous paths to improve dimensional accuracy in three-dimensional printing via material extrusion. Proc. Inst. Mech. Eng. Part B J. Eng. Manuf. 2019, 233, 2241–2250. [Google Scholar] [CrossRef] [Scilit]
- Zharylkassyn, B.; Perveen, A.; Talamona, D. Effect of process parameters and materials on the dimensional accuracy of FDM parts. Mater. Today Proc. 2021, 44, 1307–1311. [Google Scholar] [CrossRef] [Scilit]
- Ciotti, M.; Campana, G.; Mele, M. A review of the accuracy of thermoplastic polymeric parts fabricated by additive manufacturing. Rapid Prototyp. J. 2022, 28, 358–389. [Google Scholar] [CrossRef] [Scilit]
- Lieneke, T.; Denzer, V.; Adam, G.A.O.; Zimmer, D. Dimensional Tolerances for Additive Manufacturing: Experimental Investigation for Fused Deposition Modeling. Procedia CIRP 2016, 43, 286–291. [Google Scholar] [CrossRef] [Scilit]
- Ramian, J.; Ramian, J.; Dziob, D. Thermal deformations of thermoplast during 3D printing: Warping in the case of ABS. Materials 2021, 14, 7070. [Google Scholar] [CrossRef] [Scilit] [PubMed]
- Rădulescu, B.; Mihalache, A.M.; Hrițuc, A.; Rădulescu, M.; Slătineanu, L.; Munteanu, A.; Dodun, O.; Nagîț, G. Thermal Expansion of Plastics Used for 3D Printing. Polymers 2022, 14, 3061. [Google Scholar] [CrossRef] [Scilit]
- Solomon, I.J.; Sevvel, P.; Gunasekaran, J. A review on the various processing parameters in FDM. Mater. Today Proc. 2020, 37, 509–514. [Google Scholar] [CrossRef] [Scilit]
- Minetola, P.; Calignano, F.; Galati, M. Comparing geometric tolerance capabilities of additive manufacturing systems for polymers. Addit. Manuf. 2020, 32, 101103. [Google Scholar] [CrossRef] [Scilit]
- Xiaoyong, S.; Liangcheng, C.; Honglin, M.; Peng, G.; Zhanwei, B.; Cheng, L. Experimental Analysis of High Temperature PEEK Materials on 3D Printing Test. In Proceedings of the 2017 9th International Conference on Measuring Technology and Mechatronics Automation (ICMTMA), Changsha, China, 14–15 January 2017; IEEE: New York, NY, USA, 2017. [Google Scholar]
- Butt, J.; Bhaskar, R.; Mohaghegh, V. Investigating the effects of extrusion temperatures and material extrusion rates on FFF-printed thermoplastics. Int. J. Adv. Manuf. Technol. 2021, 117, 2679–2699. [Google Scholar] [CrossRef] [Scilit]
- Frunzaverde, D.; Cojocaru, V.; Ciubotariu, C.R.; Miclosina, C.O.; Ardeljan, D.D.; Ignat, E.F.; Marginean, G. The Influence of the Printing Temperature and the Filament Color on the Dimensional Accuracy, Tensile Strength, and Friction Performance of FFF-Printed PLA Specimens. Polymers 2022, 14, 1978. [Google Scholar] [CrossRef] [Scilit]
- Alsoufi, M.S.; Alhazmi, M.W.; Suker, D.K.; Alghamdi, T.A.; Sabbagh, R.A.; Felemban, M.A.; Bazuhair, F.K. Experimental Characterization of the Influence of Nozzle Temperature in FDM 3D Printed Pure PLA and Advanced PLA+. Am. J. Mech. Eng. 2019, 7, 45–60. [Google Scholar] [CrossRef] [Scilit]
- Hanon, M.M.; Zsidai, L.; Ma, Q. Accuracy investigation of 3D printed PLA with various process parameters and different colors. Mater. Today Proc. 2021, 42, 3089–3096. [Google Scholar] [CrossRef] [Scilit]
- Agarwal, K.M.; Shubham, P.; Bhatia, D.; Sharma, P.; Vaid, H.; Vajpeyi, R. Analyzing the Impact of Print Parameters on Dimensional Variation of ABS specimens printed using Fused Deposition Modelling (FDM). Sens. Int. 2022, 3, 100149. [Google Scholar] [CrossRef] [Scilit]
- Syamsuzzaman, M.; Mardi, N.A.; Fadzil, M.; Farazila, Y. Investigation of layer thickness effect on the performance of low-cost and commercial fused deposition modelling printers. Mater. Res. Innov. 2014, 18, S6-485–S6-489. [Google Scholar] [CrossRef] [Scilit]
- Luzanin, O.; Plancak, M.; Lužanin, O.; Movrin, D.; Plančak, M. Effect of layer thickness, deposition angle, and infill on maximum flexural force in FDM-built specimens. Adv. Technol. Mater. 2014, 39, 49–58. [Google Scholar]
- Zhu, Z.; Ferreira, K.; Anwer, N.; Mathieu, L.; Guo, K.; Qiao, L. Convolutional Neural Network for geometric deviation prediction in Additive Manufacturing. Procedia CIRP 2020, 91, 534–539. [Google Scholar] [CrossRef] [Scilit]
- de Souza Borges Ferreira, R.; Sabbaghi, A.; Huang, Q. Automated Geometric Shape Deviation Modeling for Additive Manufacturing Systems via Bayesian Neural Networks. IEEE Trans. Autom. Sci. Eng. 2020, 17, 584–598. [Google Scholar] [CrossRef] [Scilit]
- Zhao, M.; Xiong, G.; Wang, W.; Fang, Q.; Shen, Z.; Wan, L.; Zhu, F. A Point-Based Neural Network for Real-Scenario Deformation Prediction in Additive Manufacturing. In Proceedings of the 2022 IEEE 18th International Conference on Automation Science and Engineering (CASE), Mexico City, Mexico, 20–24 August 2022; IEEE: New York, NY, USA, 2022; pp. 1656–1661. [Google Scholar]
- Qi, X.; Chen, G.; Li, Y.; Cheng, X.; Li, C. Applying Neural-Network-Based Machine Learning to Additive Manufacturing: Current Applications, Challenges, and Future Perspectives. Engineering 2019, 5, 721–729. [Google Scholar] [CrossRef] [Scilit]
- Decker, N.; Lyu, M.; Wang, Y.; Huang, Q. Geometric Accuracy Prediction and Improvement for Additive Manufacturing Using Triangular Mesh Shape Data. J. Manuf. Sci. Eng. 2021, 143, 061006. [Google Scholar] [CrossRef] [Scilit]
- Equbal, A.; Murmu, R.; Kumar, V.; Equbal, A.M. A recent review on advancements in dimensional accuracy in fused deposition modeling (FDM) 3D printing. AIMS Mater. Sci. 2024, 11, 950–990. [Google Scholar] [CrossRef] [Scilit]
- Solouki, A.; Aliha, M.R.M.; Makui, A.; Choupani, N.; Seiti, H. Analyzing the effects of printing parameters to minimize the dimensional deviation of polylactic acid parts by applying three different decision-making approaches. Sci. Rep. 2024, 14, 27674. [Google Scholar] [CrossRef] [Scilit]
- Ardeljan, D.D.; Frunzaverde, D.; Cojocaru, V.; Turiac, R.R.; Bacescu, N.; Ciubotariu, C.R.; Marginean, G. The Impact of Elevated Printing Speeds and Filament Color on the Dimensional Precision and Tensile Properties of FDM-Printed PLA Specimens. Polymers 2025, 17, 2090. [Google Scholar] [CrossRef] [Scilit]
- Sherugar, S.; Birkett, M.; Blacklock, M. Characterisation of print path deviation in material extrusion. Prog. Addit. Manuf. 2024, 9, 1049–1060. [Google Scholar] [CrossRef] [Scilit]
- Lendvai, L.; Fekete, I.; Rigotti, D.; Pegoretti, A. Experimental study on the effect of filament-extrusion rate on the structural, mechanical and thermal properties of material extrusion 3D-printed polylactic acid (PLA) products. Prog. Addit. Manuf. 2025, 10, 619–629. [Google Scholar] [CrossRef] [Scilit]
- Elayeb, A.; Tlija, M.; Eltaief, A.; Louhichi, B.; Zemzemi, F. Minimizing Dimensional Defects in FFF Using a Novel Adaptive Slicing Method Based on Local Shape Complexity. J. Manuf. Mater. Process. 2024, 8, 59. [Google Scholar] [CrossRef] [Scilit]
- Roach, D.J.; Rohskopf, A.; Leguizamon, S.; Appelhans, L.; Cook, A.W. Invertible neural networks for real-time control of extrusion additive manufacturing. Addit. Manuf. 2023, 74, 103742. [Google Scholar] [CrossRef] [Scilit]
- Romero-Hdz, J.; Saha, B.N.; Vallikavungal, J.; Zambrano-Robledo, P. OpenAM-SimCCX: An Open-Source Framework for Thermo-Mechanical Analysis of Additive Manufacturing with CalculiX. Materials 2025, 18, 4990. [Google Scholar] [CrossRef] [Scilit]
- Neacșa, A.; Diniță, A.; Iacob Ștefan, V. Can the Dimensional Optimization of 3D FDM Manufactured Parts Be a Solution for a Correct Design? Materials 2024, 18, 408. [Google Scholar] [CrossRef] [Scilit]
- Valerga Puerta, A.P.; Fernandez-Sanz, G.; Bañon, F.; Fernandez-Vidal, S.R. Biodegradable materials with FDM technology under the aging effect of solar and saltwater exposure. Adv. Mech. Eng. 2023, 15, 16878132231201297. [Google Scholar] [CrossRef] [Scilit]
- Bermudo Gamboa, C.; Martín-Béjar, S.; Vilches, F.J.T.; Fernández, M.H.; Hurtado, L.S. Fatigue Behavior Analysis in Reinforced PLA Parts Manufactured by FDM. Key Eng. Mater. 2023, 956, 91–98. [Google Scholar] [CrossRef] [Scilit]
- Martín-Béjar, S.; Trujillo Vilches, F.J.; Herrera Fernández, M.; Bermudo Gamboa, C.; Sevilla Hurtado, L. Análisis comparativo de las desviaciones macrogeométricas en procesos de torneado en seco frente a operaciones de fabricación aditiva. An. Ing. Mecánica Rev. Asoc. Española Ing. Mecánica 2021, 1, 155. [Google Scholar]
- Bermudo Gamboa, C.; Martín Béjar, S.; Trujillo Vilches, F.J.; Sevilla Hurtado, L. Geometrical analysis in material extrusion process with polylactic acid (PLA)+carbon fiber. Rapid Prototyp. J. 2022, 29, 21–39. [Google Scholar] [CrossRef] [Scilit]
- García Montesinos, A.; Bermudo Gamboa, C.; Martín Béjar, S.; Sevilla Hurtado, L. Influence of layer thickness on the fatigue lofe of PLA + Carbon Fiber specimens by additive manufacturing. In Advances in Design Engineering III, Proceedings of the 31 International Conference INGEGRAF, Málaga, Spain, 29 June–1 July 2022; Book of Extended Abstracts (Universidad de Málaga); Springer: Cham, Switzerland, 2022; pp. 401–412. [Google Scholar]
- Valizadeh, M.; Wolff, S.J. Convolutional Neural Network applications in additive manufacturing: A review. Adv. Ind. Manuf. Eng. 2022, 4, 100072. [Google Scholar] [CrossRef] [Scilit]
- Duma, I.S.; Twala, B.; Marwala, T. Predictive modeling for default risk using a multilayered feedforward neural network with Bayesian regularization. In Proceedings of the 2013 International Joint Conference on Neural Networks (IJCNN), Dallas, TX, USA, 4–9 August 2013; IEEE: New York, NY, USA, 2013; pp. 1–10. [Google Scholar]
- Bhekisipho Twala, O.A. Modelling the Flow Stress of Alloy 316L using a Multi-Layered Feed Forward Neural Network with Bayesian Regularization. IOP Conf. Ser. Mater. Sci. Eng. 2017, 225, 012052. [Google Scholar] [CrossRef] [Scilit]

Disclaimer/Publisher’s Note: The statements, opinions and data contained in all publications are solely those of the individual author(s) and contributor(s) and not of MDPI and/or the editor(s). MDPI and/or the editor(s) disclaim responsibility for any injury to people or property resulting from any ideas, methods, instructions or products referred to in the content. |
© 2026 by the authors. Licensee MDPI, Basel, Switzerland. This article is an open access article distributed under the terms and conditions of the Creative Commons Attribution (CC BY) license.