


Abstract
Image generation of plant disease in the natural environment has always been a challenging task. Traditional methods applied in the image generation of plant disease are without sufficient diversity and detailed lesions. Thus, this paper applies an image harmonization method to generate diverse combinations of disease images by integrating different backgrounds and target regions to enhance diversity. To construct the dataset, we captured real disease images of soybean and rice in natural environments. Next, the Squeeze-and-Excitation (SE) attention mechanism was integrated into the domain verification network (DoveNet), together with a mask guide generator, to focus more attention on lesions. Two discriminators worked together to capture global and local features, ensuring the preservation of critical contextual information. Finally, the improved DoveNet achieved a MSE of 43.77, a PSNR of 33.02, and an SSIM of 0.9806, showing a reduction of 3.61 in the MSE, an increase of 0.50 in the PSNR, and a 2.49% improvement in the SSIM compared with the original DoveNet. Meanwhile, through visual Turing tests we confirmed that images generated using the improved DoveNet were of much better quality and more convincing.
1. Introduction
In recent years, plant disease image generation has become a common research field in intelligent agriculture and image processing. As China’s economy has reached new heights, crop demand has steadily risen each year, but crop yields have not shown a corresponding increase, and the quality of many crops is declining, which is attributed to the proliferation of plant pests and diseases. According to recent reports from the Food and Agriculture Organization (FAO) [1], up to 40% of global food crops are lost annually due to plant pests and diseases, causing economic losses exceeding USD 220 billion worldwide. Soybean and rice are important crops; soybean is rich in protein and provides food and seed oils [2], and rice is a staple food for the majority of people around the world. However, leaf diseases in soybean and rice cause considerable yield losses each year, presentinge a threat to food security. With the increasing spread of climate-driven plant diseases and fungal infections, global agriculture is facing severe yield and economic losses, further emphasizing the critical importance of intelligent and accurate plant disease detection systems [3,4]. Therefore, in recent years, scholars have been committed to applying deep learning to detect plant diseases and pests. To support model training, deep learning requires a high number of datasets. Otherwise, overfitting may occur [5]. In order to collect plant disease datasets in accordance with the criteria, it is essential to cultivate plants in tightly controlled, isolated environments to prevent contamination. But it is generally labor-intensive and highly costly. Despite plants being cultivated in strictly regulated environments, the development of disease is still heavily affected by surrounding conditions like temperature, insect vectors, and weather [6], and several diseases are uncommon, making them extremely difficult to collect. On the other hand, when plants are cultivated in regulated environments to assure training images’ quality, the background diversity of plant disease images tends to be limited. This implies that collecting comprehensive and diverse field data would require continuous monitoring and timely imaging throughout the entire growth process of the plant, which is clearly impractical. For these reasons, deep learning is applied to generate plant disease images.
With the continuous advancement of GANs in image generation, various GAN variants have gradually been applied across diverse fields. However, the issue of limited diversity in generated data has become increasingly pronounced [7,8], presenting a problem that urgently requires attention. In addition, in the field of plant sciences, generating diverse and authentic detailed lesions is crucial. Researchers are dedicated to developing generative networks tailored specifically to plant science applications. Although frameworks like CycleGAN and LeafGAN have improved disease image generation, they still face challenges. For instance, CycleGAN often introduces unintended variations in the background due to a lack of attention mechanisms, while newer models like LeafGAN may struggle to capture critical contextual information when training data is scarce.
To address these limitations, we creatively introduce DoveNet—an image harmonization method designed to address the mismatch between the foreground and background in composite images. Unlike traditional GANs, DoveNet focuses on resolving the mismatch between the foreground (diseased leaves) and background, thereby enhancing data diversity and consistency. To further improve the fidelity of diseased areas, we incorporated the Squeeze-and-Excitation (SE) attention mechanism into the DoveNet architecture. This allows the model to precisely guide the generator in focusing on the regions of interest (RoIs), particularly the intricate textures of lesions, while maintaining global spatial consistency. Moreover, DoveNet incorporates both a global discriminator and domain verification discriminator to jointly capture global and local features, ensuring the preservation of critical contextual information.
The main contributions of this paper are outlined as follows:
- (1)
- By focusing on the vertical application of image harmonization within the agricultural field, this study proposes an improved DoveNet that generates high-fidelity disease spots for soybean and rice, effectively overcoming the limited diversity inherent in traditional GAN-based methods;
- (2)
- By utilizing three distinct color transfer methods to construct a dataset comprising real disease images, composite disease images, and foreground masks specifically dedicated to soybean and rice disease image generation, our dataset facilitates the vertical application of image harmonization in the field of plant disease image generation research;
- (3)
- By adding the SE module to DoveNet to maintain the high-level features of the diseased area of generated images, and through a series of comparative experiments, the quality of generated images is proved through both subjective and objective aspects.
2. Related Work
Many researchers focus on plant disease image generation as the wide application of deep learning. Image generation is the most widely used method of data augmentation, such as GANs. Based on a dual generative adversarial network (DualGAN), Zhang et al. [9] used the improved training of Wasserstein GANs and Optimized-Real-ESRGAN to obtain high-quality disease images of rice leaf. Liu et al. [10] proposed LeafGAN, a generator model with degressive channels and a discriminator fused with instance normalization and a dense connectivity strategy. In this way, LeafGAN improved the feature extraction ability and generated a sufficient number of grape leaf disease images with prominent lesions. Wu et al. [11] utilized DCGAN as a method of dataset augmentation for generating tomato leaf disease images. After that, they confirmed that the generated images are of better quality and higher diversity through t-SNE and Turing tests. Based on CycleGAN, Nazki et al. [12] introduced AR-GAN, which not only applied adversarial loss but also applied the activation reconstruction loss function to generate more compelling tomato disease images. They also utilized the Fréchet Inception Distance (FID) score [13] and NIMA score [14] to verify that high-quality tomato plant synthetic disease images had been generated. Based on CycleGAN, Cap et al. [6] proposed a novel model with an attention mechanism named LeafGAN. Because of its special attention mechanism, LeafGAN can only transform relevant disease areas in images with a messy background. In addition, they visually confirmed that compared with vanilla CycleGAN, LeafGAN can generate better-quality and more compelling images. Guo et al. [15] improved the original CycleGAN by integrating category activation mapping attention and introducing the feature recombination loss function. They also used a series of evaluation indicators, such as the peak signal-to-noise ratio, grayscale histogram, and so on, to prove that generated maize leaf disease images had high quality.
As a method that can quickly generate training data, image composition can not only generate a large amount of data, but also obtain accurate image labeled information, so it is a more meaningful image generation method. In composite images, the foreground and background are sourced from different images; therefore, discrepancies in lighting conditions often result in an unrealistic appearance and noticeable color inconsistencies between the foreground and background. To enhance coherence between the foreground and background and reduce disparities between composite images and real images, researchers have introduced the concept of image harmonization, which involves adjusting the distribution characteristics of the foreground area to better align with the background, thereby creating a more seamless and realistic image. Harmonious image generation can effectively solve the current artificial intelligence domain’s lack of image data pain point; using existing small sample data can generate a lot of data, which is difficult to obtain or labeled expensive, and is thus a popular research direction.
Extensive research results have been achieved in image harmonization. Xue et al. [16] evaluated the standard statistical indicators applied in 2D images and picked out the most important indicator in composite images. Then, they described a data-driven algorithm that can automatically adjust the foreground to match with the background and organized a subjective experiment. In 2015, ref. [17] introduced a CNN into synthetic image quality assessment for the first time. They trained a CNN model to predict an image’s realism based on texture compatibility, lighting, and color, without any human annotations. An end-to-end deep CNN model was first proposed in an image harmonization task by Tsai et al. [18]. This model generated high-quality images through capturing the context and semantic information. Ref. [19] proposed a spatial-separated attention module (S2AM) and applied a special encoder–decoder structure U-Net. The S2AM can learn feature maps in masked regions individually. U-Net’s structure consists of high-level filters and fully convolutional layers; through this structure, features are concatenated between encoder and decoder. Adding the S2AM model to U-Net has proved that harmonized images gain better results. Cong et al. [20] proposed a DoveNet structure, which included a generator and two discriminators called the global discriminator and domain verification discriminator. Through this method, a lot more harmonized images were generated. They also provided a large dataset for image harmonization, which was a huge contribution. Guo et al. [21] proposed the harmony of reflectance and illumination. Cong et al. [22] proposed Collaborative Dual Transformation (CDTNet), which combined pixel-to-pixel transformation and RGB-to-RGB to gain high-resolution harmonized images. Although recent generative AI and harmonization models from 2024 to 2025 [23,24] offer impressive synthesis, their heavy reliance on massive datasets and high computational power limits their utility in the plant pathology domain, where expert-labeled data is scarce. Our methodology prioritizes a streamlined harmonization route to ensure the biological fidelity of lesions while maintaining the high efficiency required for data-constrained agricultural tasks.
From the above literature, it is clear that while GANs and image harmonization networks have shown some potential in their own field, applying image harmonization tasks to plant disease image generation has not been fully explored. This paper was developed based on this. We are not only constructing our own plant disease dataset, but also feeding composite images and masks to DoveNet to generate various plant disease images. This innovative application method provides support in the face of problems of insufficient generation diversity and loss of disease information driven by plant disease image data.
3. Materials and Methods
3.1. Methods of Dataset Construction
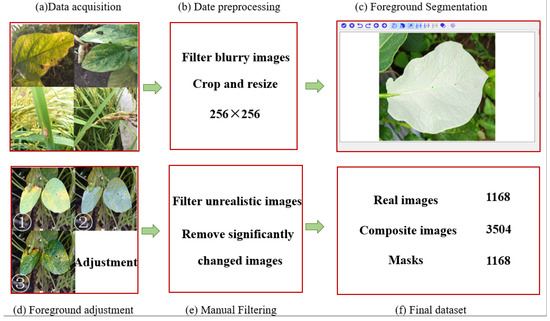
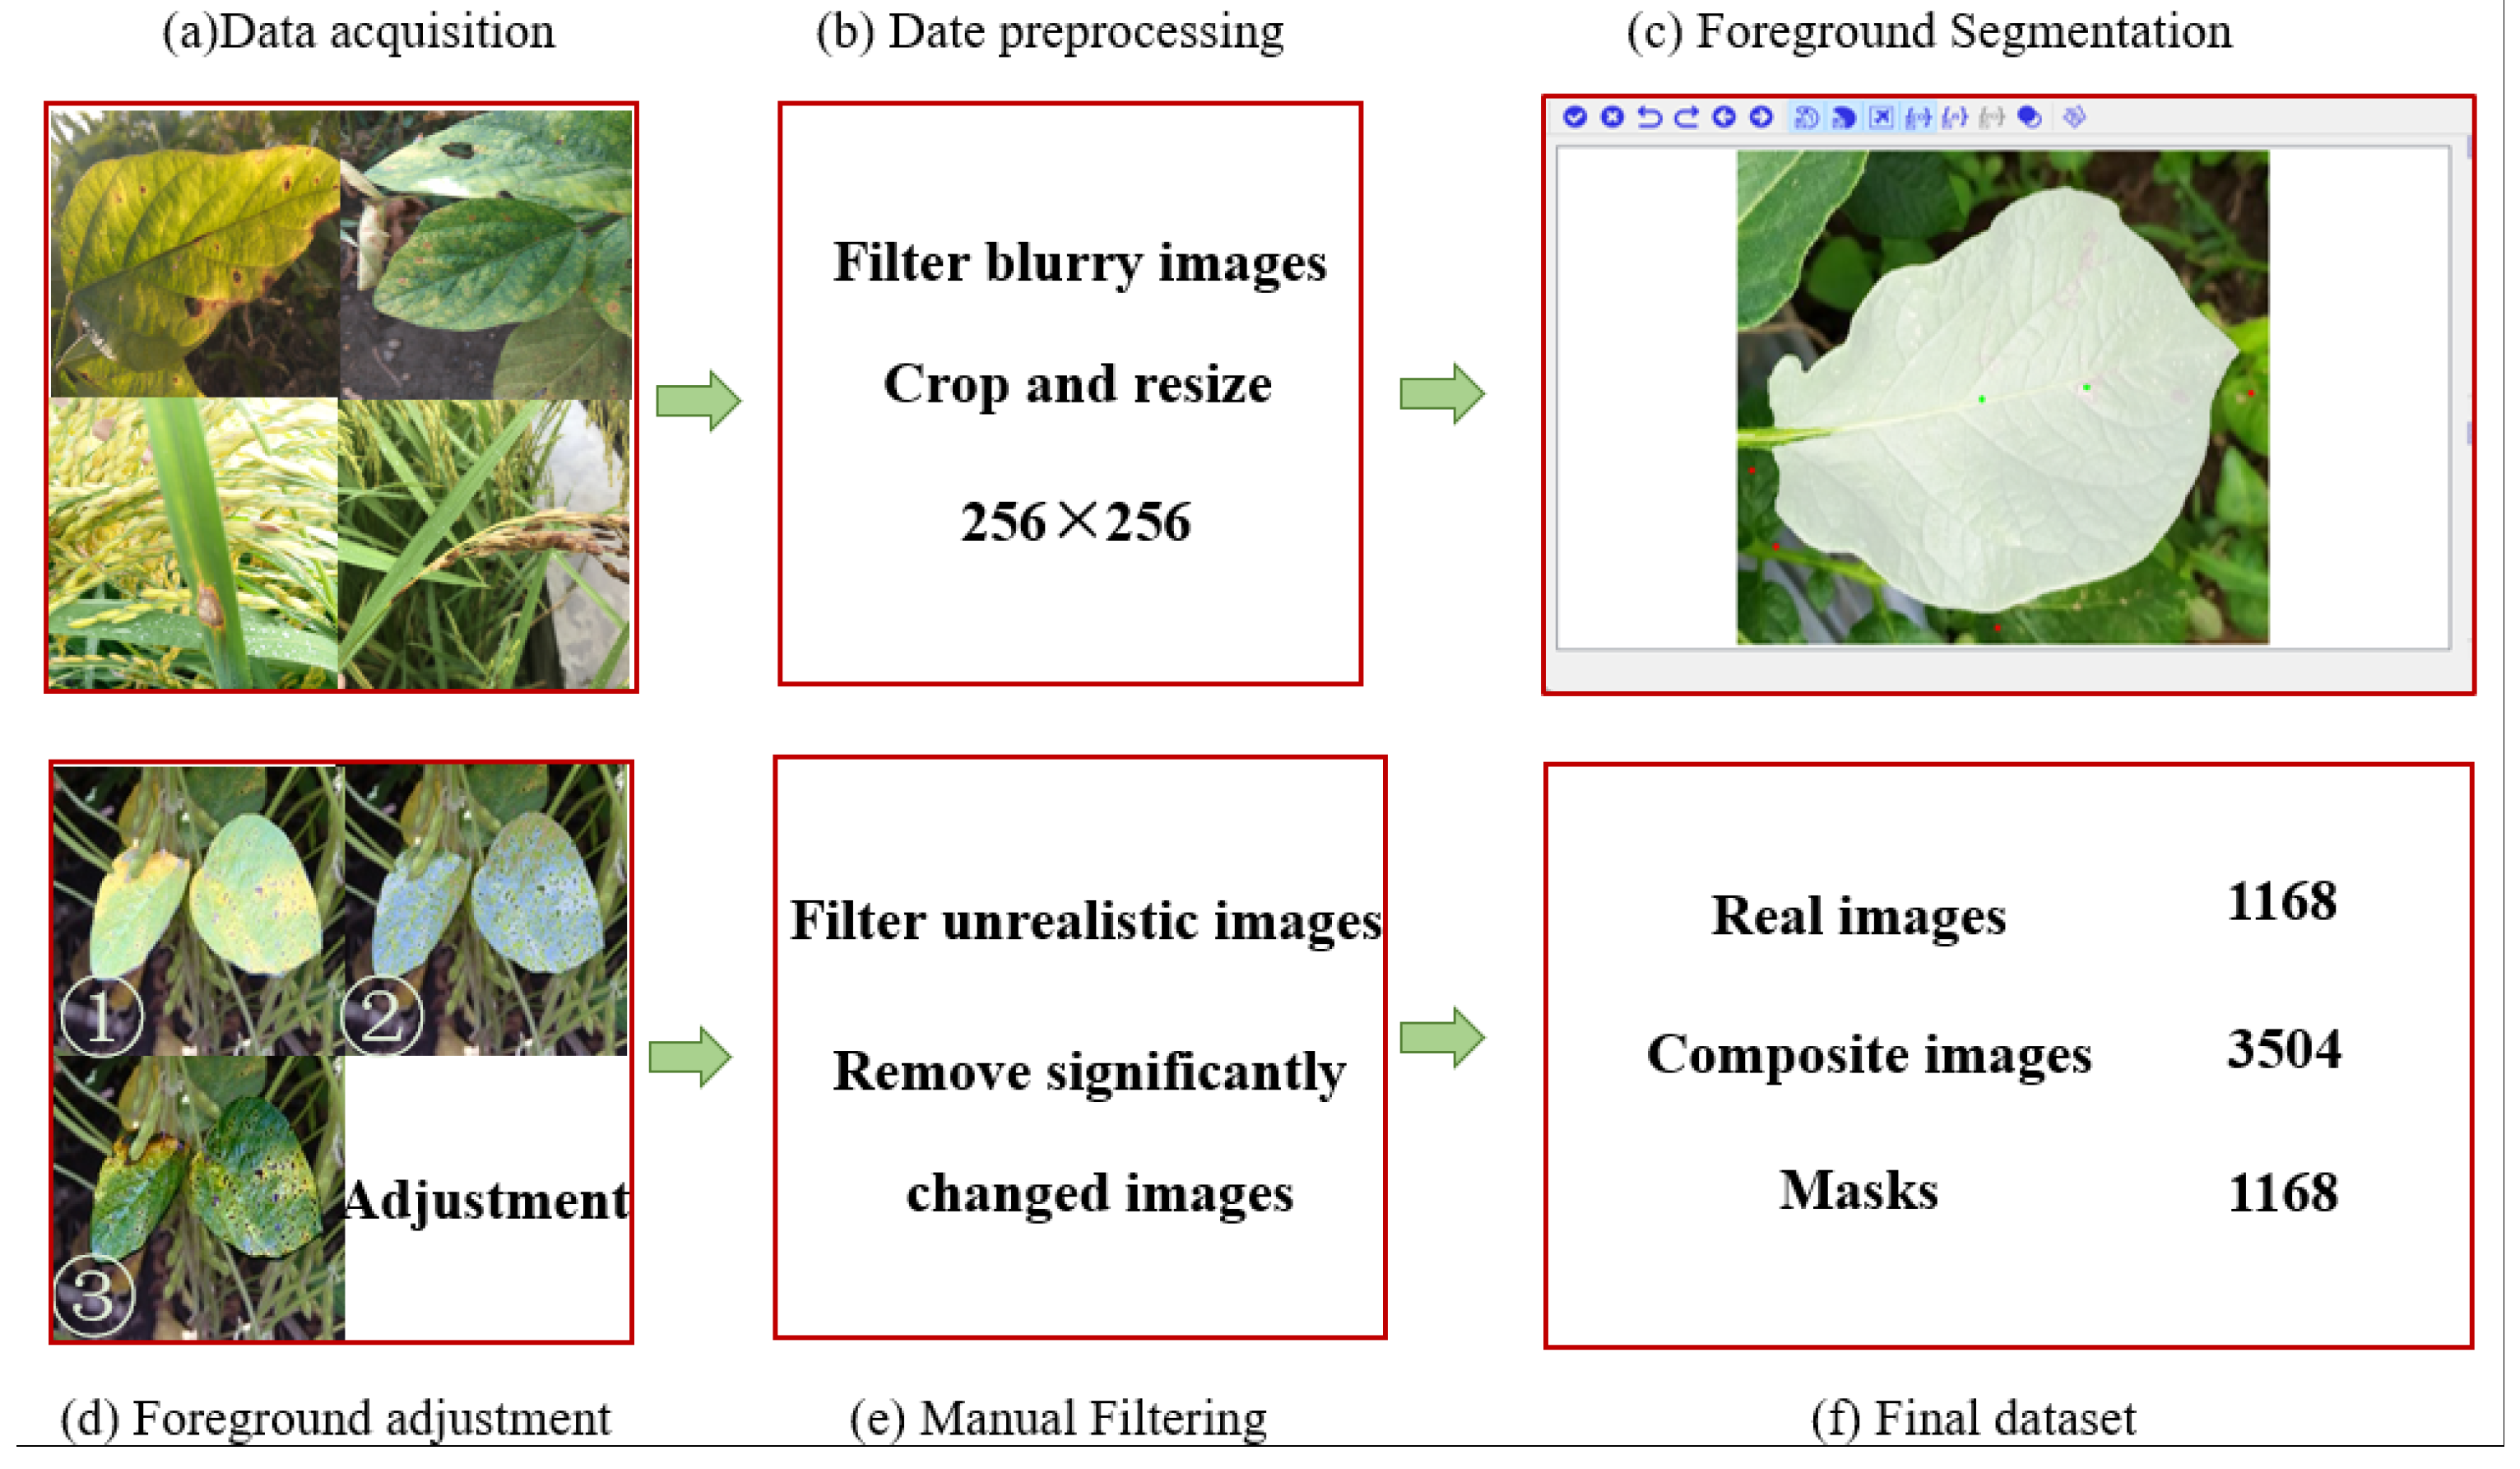
Dataset construction is an essential step. Unlike other unsupervised learning tasks, where obtaining training pairs is relatively simple, image harmonization requires skilled expertise to produce harmonized images, making the data collection process too time-consuming. Therefore, in the training process, we adopted the strategy proposed in [18], which treats real images as harmonized images, and images with an adjusted foreground as composite images, thereby eliminating the need for labor-intensive expert editing in data collection. Considering our goal, though the iharmony4 dataset contains various sceneries and categories, it lacks a sufficient number of plant disease images. As a result, generating high-quality plant disease images using this dataset is impracticable. Therefore, we decided to construct our own plant disease dataset; the construction steps are shown in Figure 1.
Figure 1.
The steps of dataset construction. The numbers ①, ②, and ③ denote the composite images obtained by three different color transfer methods.
3.1.1. Data Acquisition
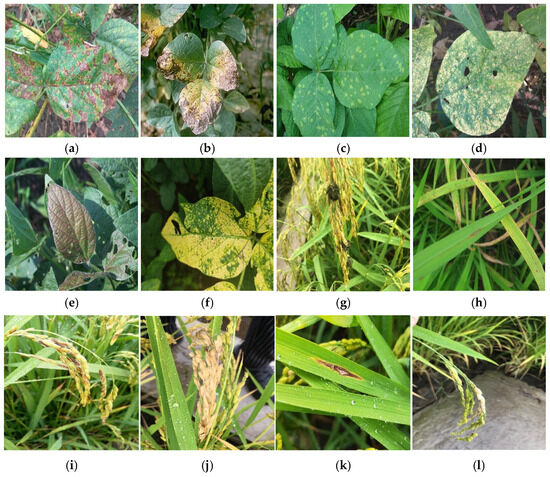
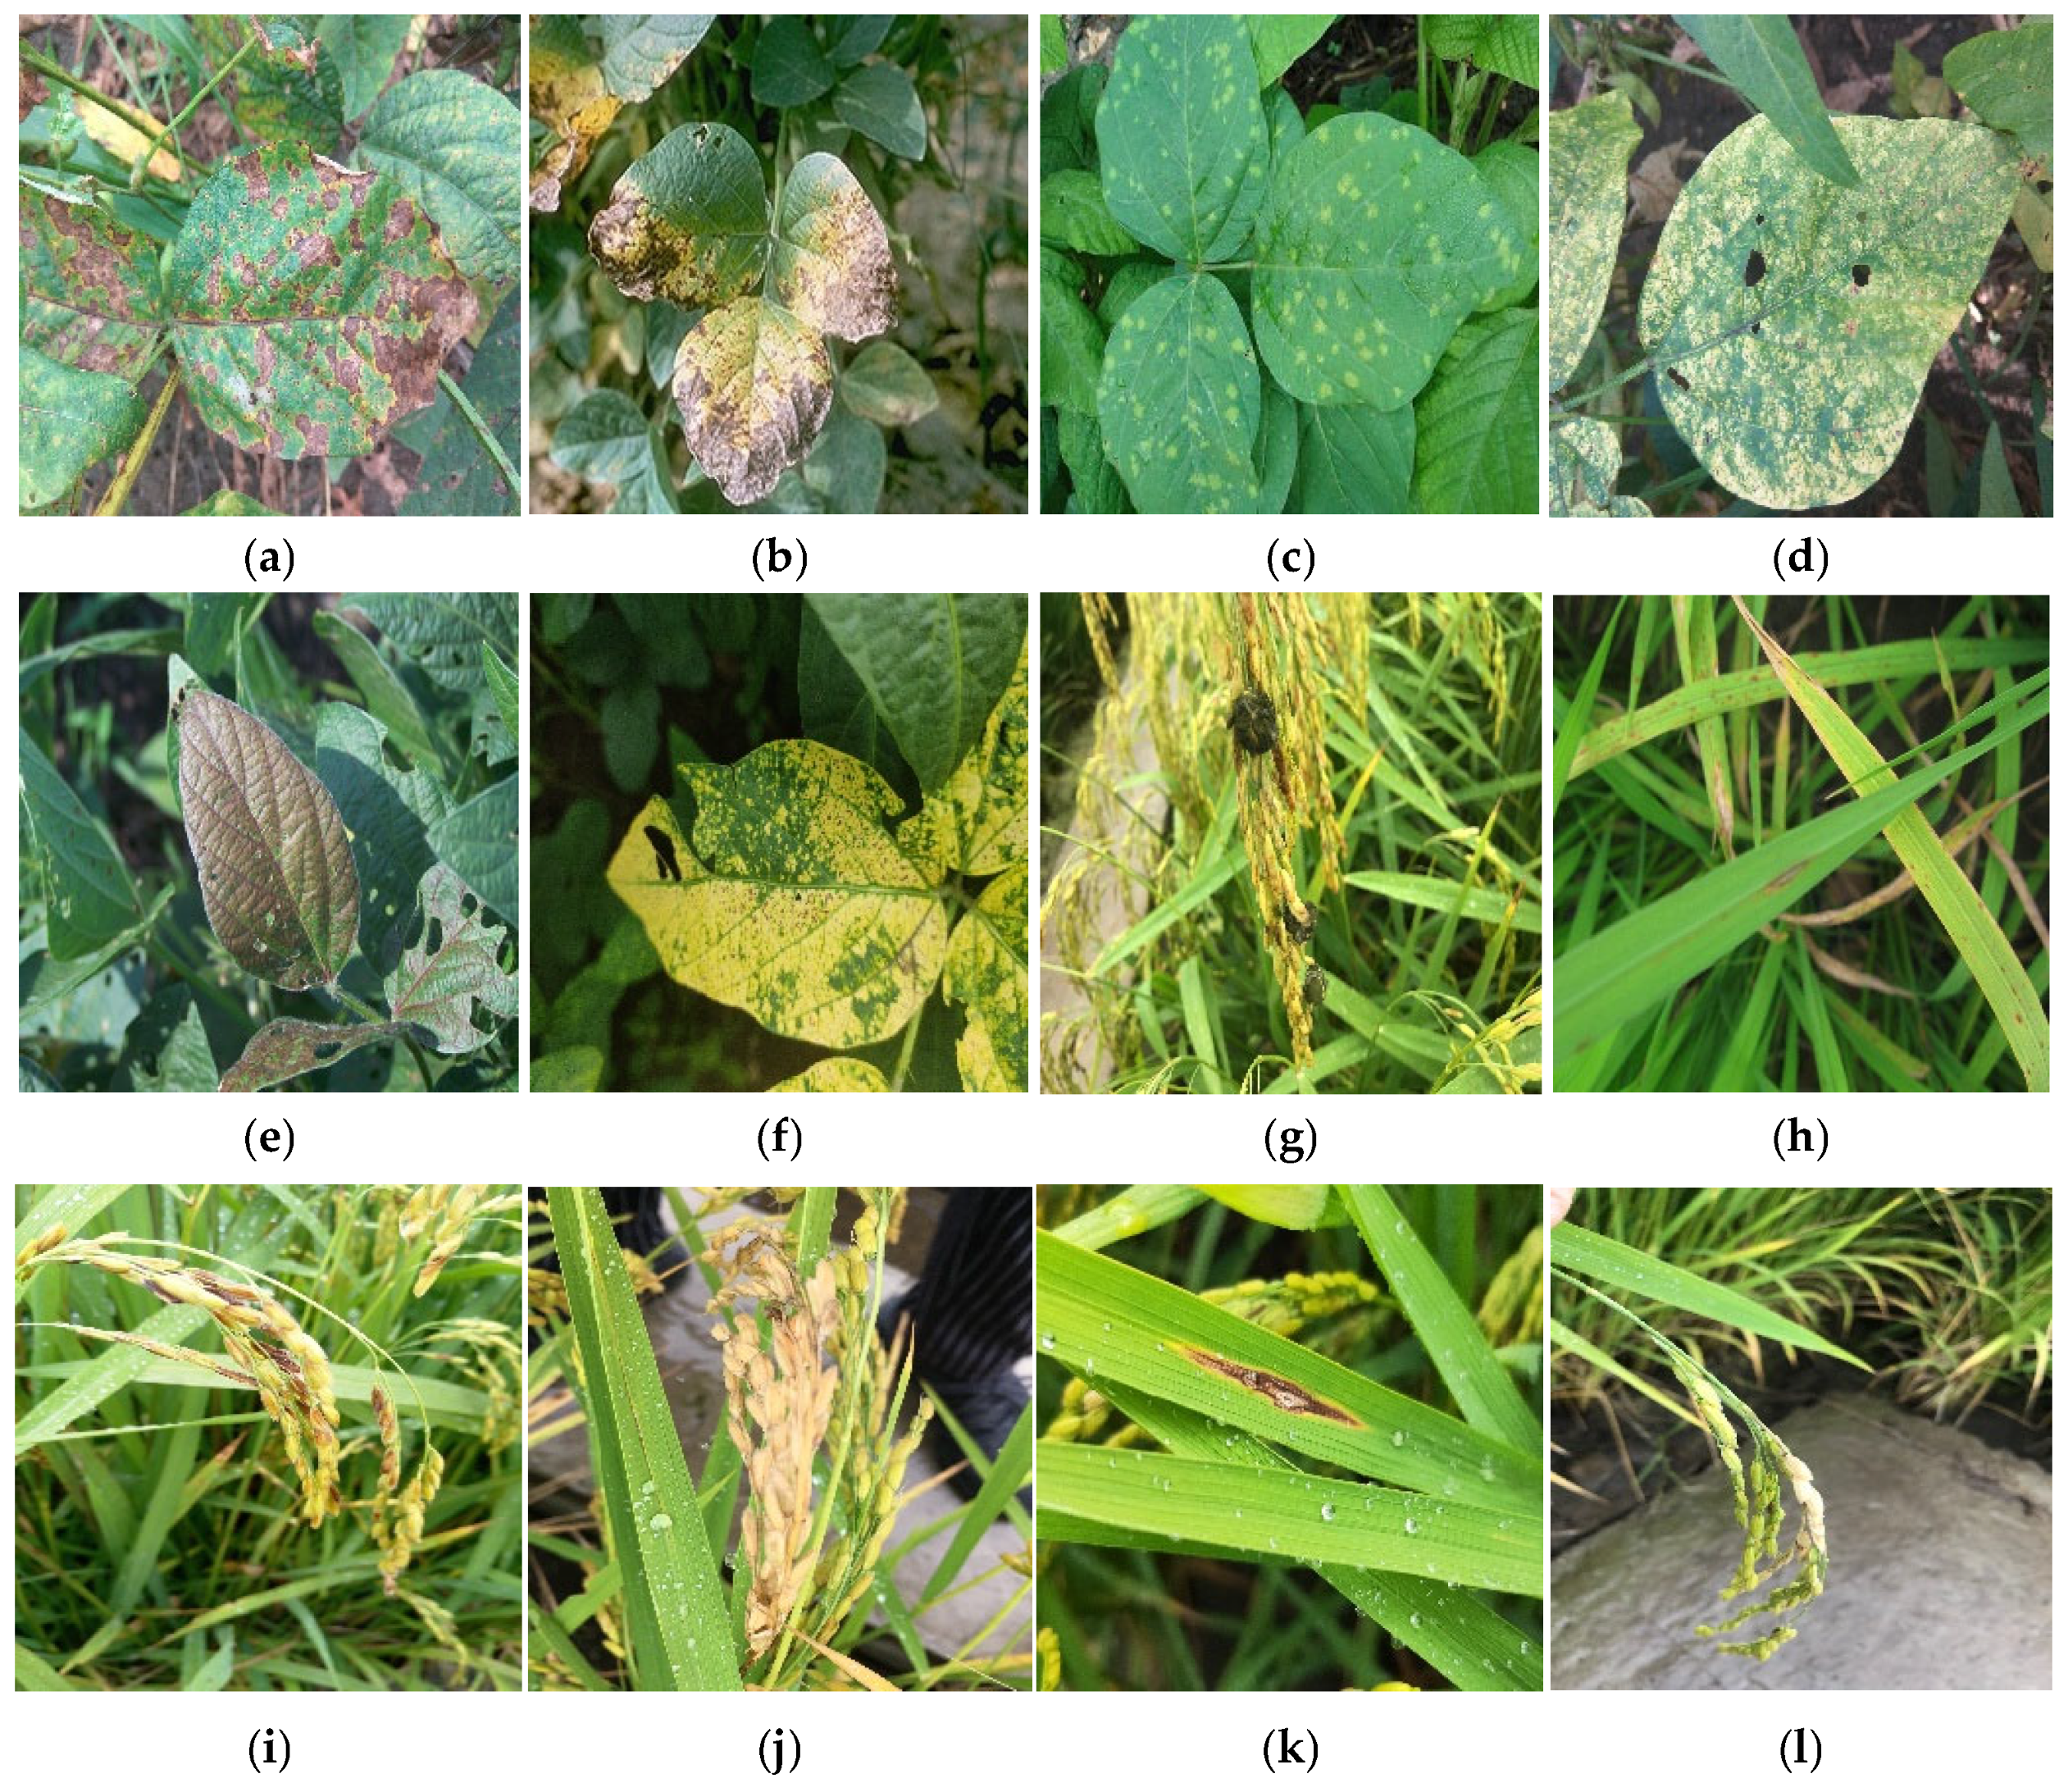
Soybean and rice were specifically selected to represent contrasting morphological archetypes: the complex reticulated venation of broad-leaf dicots and the narrow, linear geometry of monocots. These distinct structures facilitate a comprehensive evaluation regarding the robustness of the proposed model in managing diverse textural consistencies and spatial constraints during the harmonization process. The primary dataset was collected from field sites in Xiangyang, Nenjiang, and Jiusan Farm in Heilongjiang Province, China. To ensure environmental diversity, images were captured under various illumination and weather conditions. Specifically, soybean images were acquired on 12 July 2025 (sunny) and 19 July 2025 (cloudy), while rice images were captured on 5 August 2025 (sunny) and 14 August 2025 (cloudy). Both morning (8:00–10:00 AM) and noon (11:30 AM–1:30 PM) sessions were conducted to capture plant disease images. Additionally, a few soybean disease images from the platform Kaggle were used. To enhance the variety of the constructed dataset, we selected 6 types of soybean disease (soybean mosaic virus, septoria brown spot in soybean, and downy mildew in soybean, etc.) and 6 types of rice disease, such as bakanae disease in rice, cereal grains, branch pestilence, and so on. After filtering, 742 images of soybean diseases and 1304 images of rice diseases were maintained. The specific number of soybean and rice disease images is shown in Table 1 and sample images for each category are presented in Figure 2a.
Table 1.
The specific number of datasets.
Figure 2.
Samples of dataset images. (a) Soybean sudden death syndrome, (b) septoria brown spot in soybean, (c) downy mildew in soybean, (d) bacterial blight in soybean, (e) purple spot in soybean, (f) soybean mosaic virus, (g) bakanae disease, (h) rice blast disease, (i) rice blast, (j) neck blast, (k) leaf blast in rice, and (l) node blast in rice.
3.1.2. Composite Disease Image Generation
There are two steps in generating composite disease images: foreground segmentation and foreground adjustment [20], as illustrated in detail in the following section.
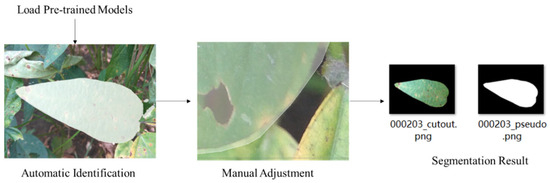
Disease Image Foreground Segmentation: Foreground segmentation aims to segment diseased leaves from the background. Due to our dataset being collected in a natural environment, which lacked matched foreground masks, we manually segmented one or two foreground regions (diseased leaves as foreground) for each plant disease image. However, manual segmentation of the foreground in plant disease images using Labelme is time-consuming, labor-intensive, and prone to inaccuracies, primarily due to the complex and varied nature of plant leaves. To enhance labeling accuracy and reduce labor costs, we employed the efficient and intelligent interactive segmentation software EISeg V1.1.2 [25], which is built on a PaddlePaddle framework. EISeg enables semi-automatic labeling, which greatly reduces the need for manual labeling.
Since EISeg lacks a dedicated model for plant disease image segmentation, it provides four available options: high-precision and lightweight models for general scenes and portraits. Considering the requirements of computational resources, task demands, and the need to balance accuracy with efficiency, we employed the pre-trained, built-in HRNet18s_OCR48 (lightweight general scene model in EISeg) for initial segmentation to leverage its interactive function and refine foreground edges, ensuring complete foreground segmentation. Compared with manual segmentation, EISeg significantly improves both segmentation efficiency and accuracy. The specific steps of foreground segmentation are shown in the Figure 3.
Figure 3.
The steps of foreground segmentation.
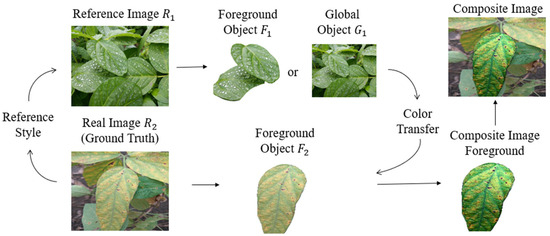
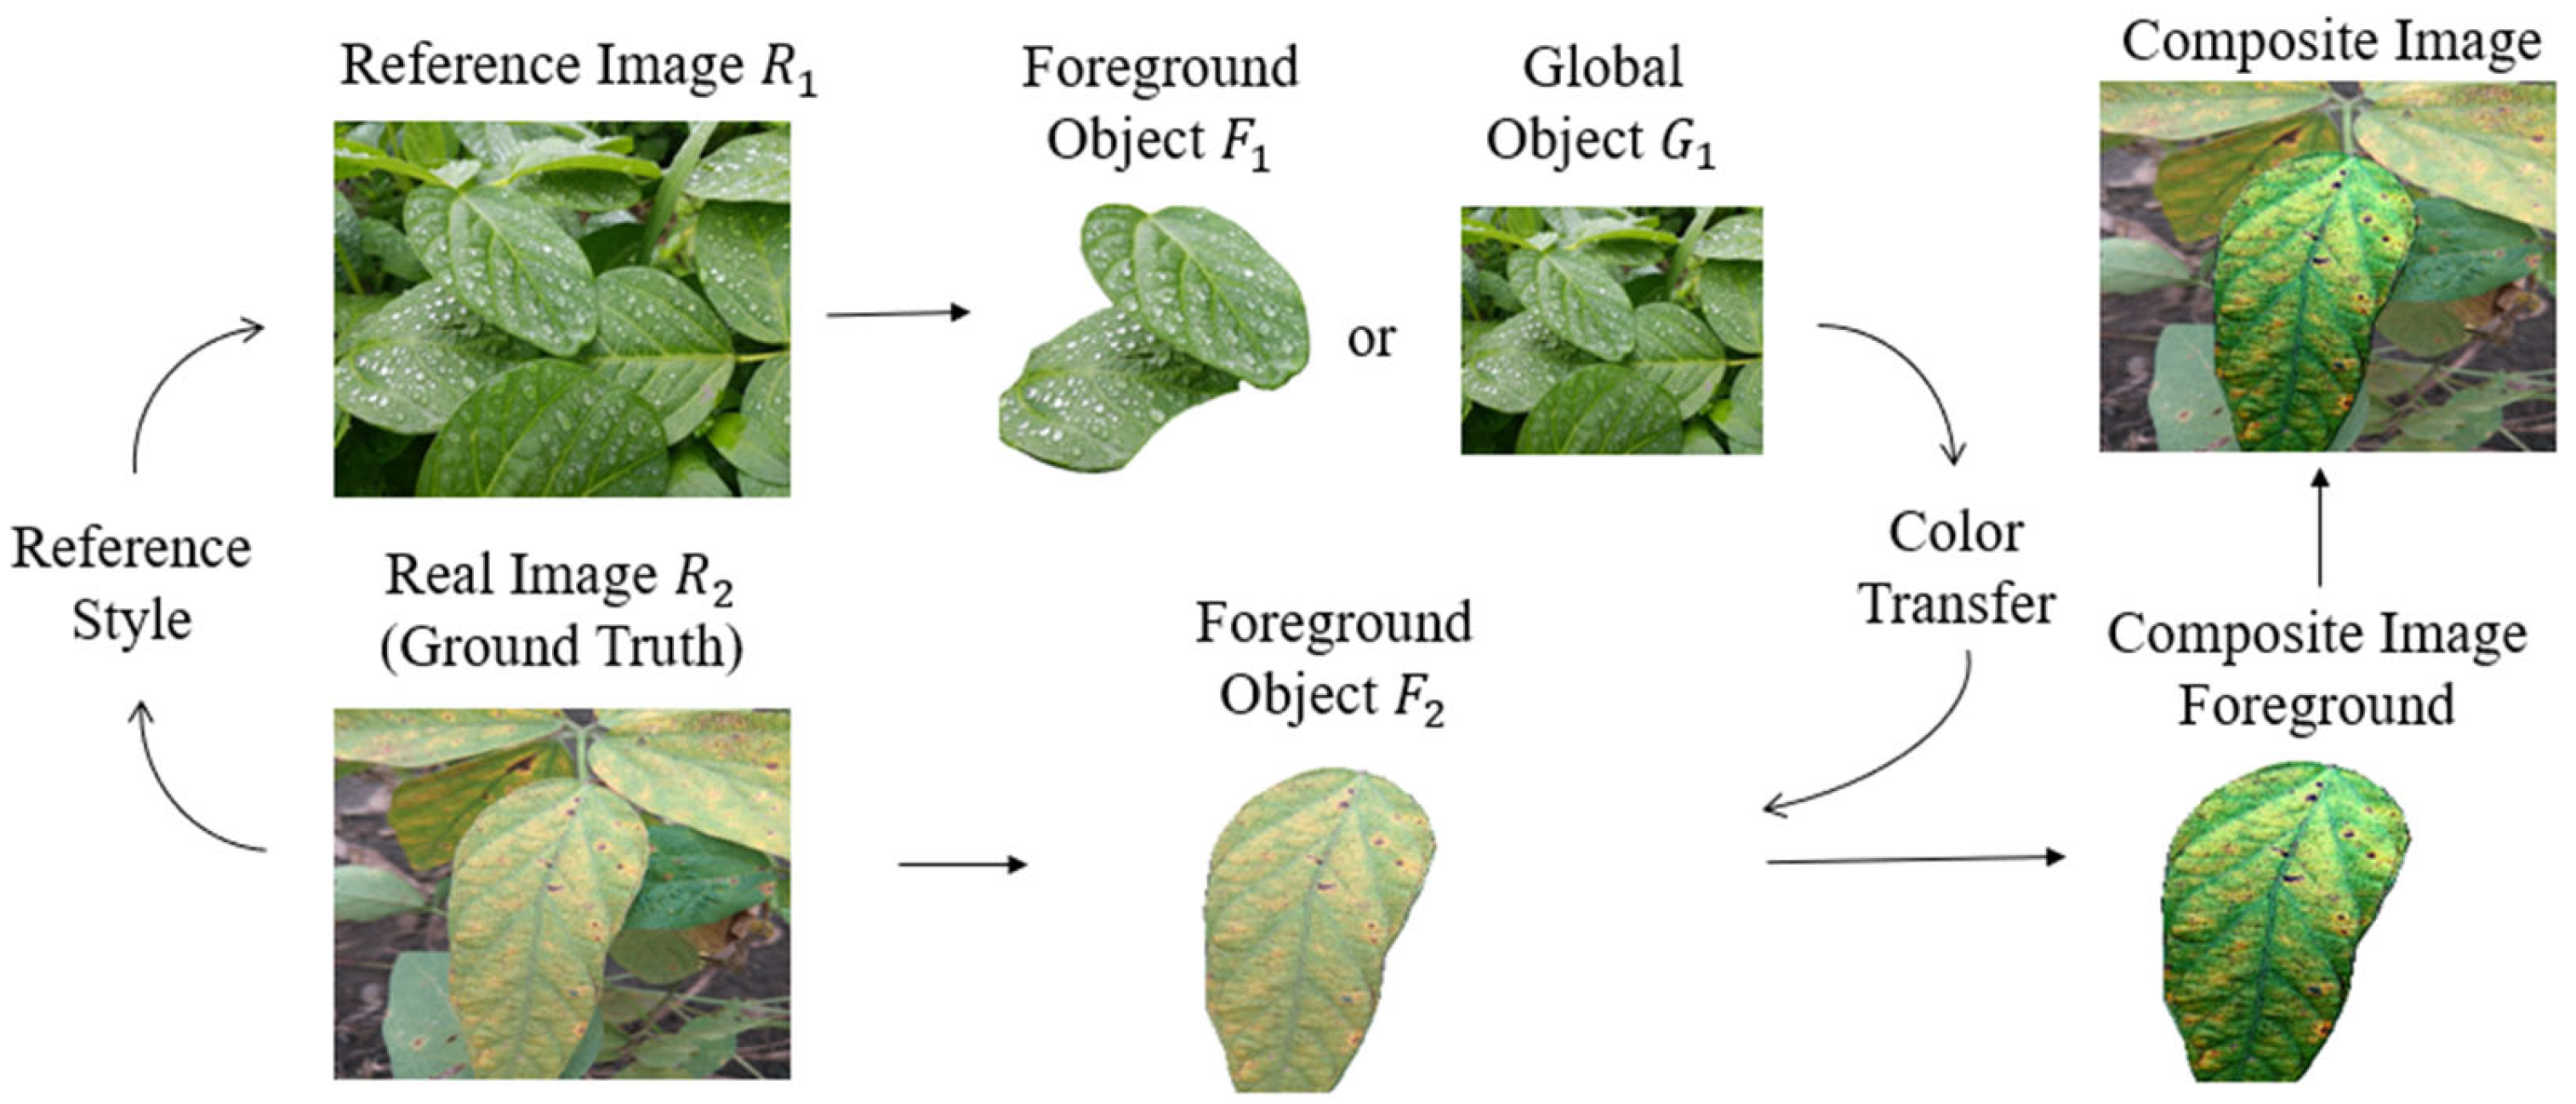
Disease Image Foreground Adjustment. Foreground adjustment is the second step in generating composite disease images. We employed color transfer methods to adjust diseased leaves’ foreground, ensuring that the foreground and background came from different domains. In this paper, we refer to five styles of plant disease images with sunny, rainy, morning, noon, and evening collectively as the reference images. In order to better explain the process of foreground adjustment, we used to represent the reference image and to represent the foreground of the reference image. Similarly, was dubbed as the real disease image and was dubbed as the foreground of the real disease image. In the process of color transfer, we transferred the color of or (according to the color transfer method to select the transfer color of foreground object or global object) to to obtain the composite image foreground. Finally, we moved the composite image foreground to the original position of . We illustrate this process in detail and intuitively in Figure 4.
Figure 4.
The process of foreground adjustment.
We applied Global Color Transfer [26], Greyscale Images Color Transfer [27], and Cumulative Histogram Mapping [28] to transfer the color of plant disease images. Specifically, for Global Color Transfer and Cumulative Histogram Mapping, the color transfer process consisted of three steps: (1) We randomly disrupted the dataset and gave reference images: sunny, rainy, morning, noon, and evening; (2) the color of each reference image type (sunny, rainy, morning, noon, and evening) was transferred to 20% of the real disease images; and (3) we transferred the global color of reference images to real disease images, as the effect was not sufficiently obvious when using the two methods of Global Color Transfer and Cumulative Histogram Mapping to transfer the foreground color of reference images to real disease images. Additionally, for the Grayscale Images Color Transfer, our dataset and reference images were randomly disrupted, and then color transfer was performed by mapping the foreground of the reference images onto the foreground of the real disease images to acquire composite images.
3.1.3. Composite Disease Image Filtering
After completing the steps described above, some composite images exhibited unintended color shifts. Therefore, a rigorous manual quality control process was implemented to check all generated results. A total of 2634 composite images were filtered out and removed due to issues such as blurriness or unrealistic color transitions (e.g., leaf color shifting from green to blue), which did not contribute positively to the image generation task. After processing, the dataset contained 3504 composite images and 1168 real images and foreground masks. We divided the dataset at a ratio of 8:2. To ensure strict independence, no overlap existed between the images in the two sets, thereby avoiding any data leakage during the training and evaluation phases. The specific statistics are listed in Table 2.
Table 2.
The specific statistics of the dataset.
3.2. Model Building
3.2.1. Model Workflow
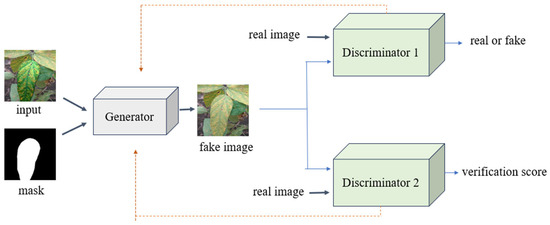
Since traditional GANs often struggle with limited diversity and insufficiently detailed disease characteristics in plant disease image generation [9,10,29], we propose a novel method based on DoveNet, designed to enhance both the variability and fidelity of plant disease images. The proposed model consists of three main modules: (a) an integrated U-Net and SE-Net generator, (b) a global discriminator, and (c) a domain verification discriminator. The whole process of generating plant disease images using improved DoveNet is illustrated in Figure 5. The orange line represents the gradient backpropagation path.
Figure 5.
The process of generating plant disease images. The orange dashed lines represent the backpropagation and gradient update paths.
As shown in Figure 5, during forward propagation, the model takes a synthesized plant disease image and its corresponding mask as the input. These inputs are preprocessed and resized to 256 × 256 pixels before being fed into the U-Net-based generator to generate negative samples. The global discriminator receives negative samples and real images as the input to evaluate their authenticity, while the domain verification discriminator processes the same inputs, extracting foreground and background features separately and computing a similarity score to assess domain consistency.
3.2.2. Attention-Enhanced U-Net Generator
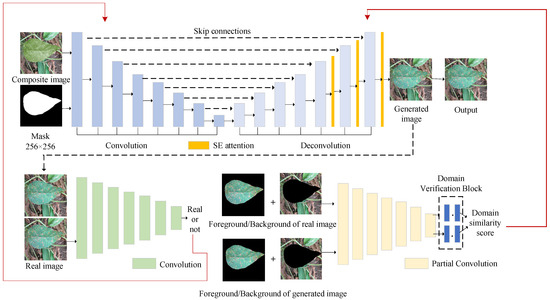
The architecture of the generator is based on U-Net [30]. Since its introduction, U-Net has become widely adopted in GANs [31,32] due to its distinctive architecture and ability to effectively capture and extract features. Squeeze-and-Excitation (SE) modules adaptively recalibrate channel-wise feature responses by explicitly modeling interdependencies between channels [33]. In the field of computer vision, the SE module has been demonstrated to significantly enhance network performance [34,35,36,37]. Furthermore, integrating SE-Net as a lightweight module into the generator of GAN leads to an effective and efficient combination [38,39]. In this paper, to guide the generator to focus on disease-related features during the image generation process, we employed the SE module as an attention mechanism embedded into the final three layers (yellow block in Figure 6) of the generator. The architecture of our method and detailed structures of each module are shown in Figure 6.
Figure 6.
The architecture of our method. Top part is generator’s structure, bottom left is the structure of global discriminator, and bottom right is domain verification discriminator. In the generator, the black solid lines denote the forward feature extraction, while the horizontal dashed lines represent the skip connections that preserve spatial details. The long black dashed line routes the generated image as input to the discriminators. The red lines represent the backpropagation paths of the adversarial loss and domain verification loss, which dynamically guide the optimization of the generator’s weights and attention mechanisms during training. The black dots (∙) denote the inner product operation.
In the generator, the encoder extracts image features and performs down-sampling, reducing the image resolution while capturing contextual information through encoding to produce high-level semantic features. The decoder applies transposed convolution on the features to progressively restore the image resolution, thereby producing low-level semantic features. Skip connection combines high-level semantic features and low-level semantic features in the channel dimension to ensure that the details lost in the down-sampling process are complete and the spatial information of the original image is retained, so that the model has higher accuracy and robustness.
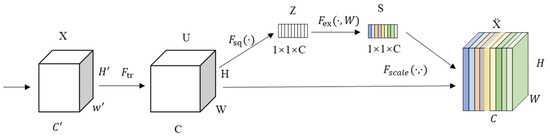
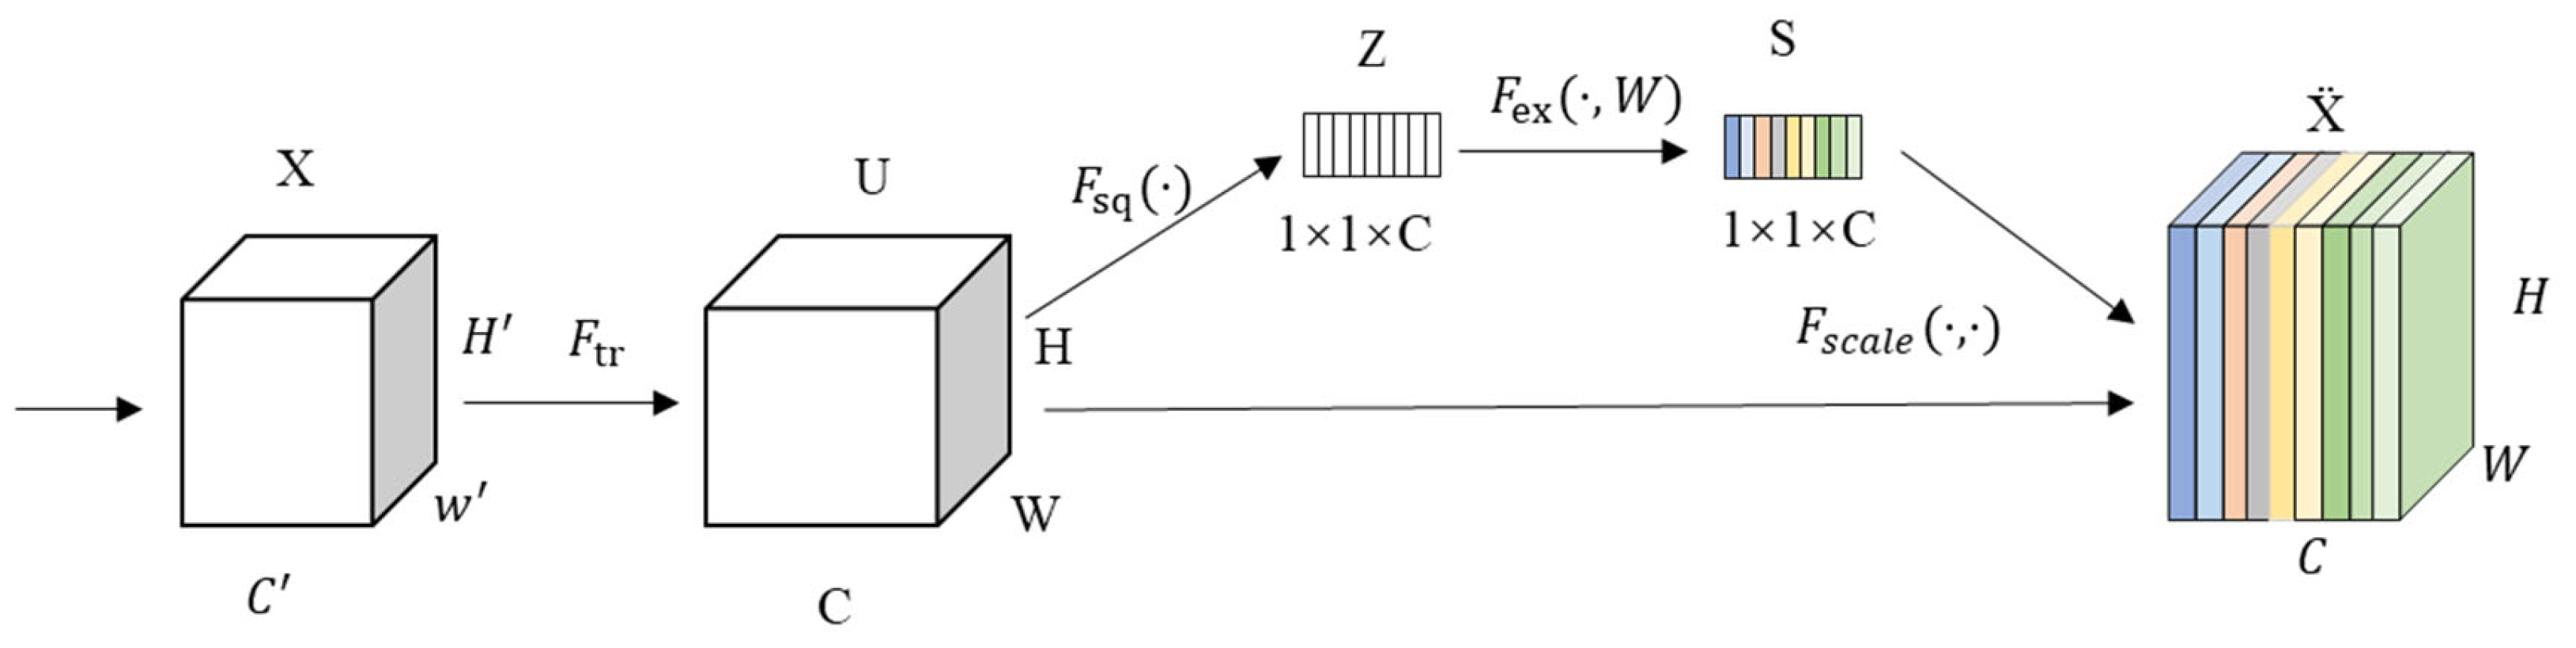
In this paper, three SE blocks were integrated into the decoder to enhance the performance of the generator by adaptively recalibrating the channel-wise feature responses. As illustrated in Figure 7, the SE block processed the input feature maps through a specific sequence of operations: , , , and .
Figure 7.
The structure of SE-Net.
Transformation (): The process begins with a standard convolutional mapping , where the input is transformed into a feature map . This stage captures the initial spatial and channel features of the plant disease images.
Squeeze (): To aggregate the global spatial information, the squeeze operation is applied. It performs global average pooling to condense the feature maps over the spatial dimensions (). This operation allows the model to perceive the global distribution of the lesion and background pixels. The calculation of the squeeze operation for a single channel is expressed as follows:
where represents the global channel descriptor vector formed after squeezing all C channels.
Excitation (): Next, an excitation operation is applied to model channel-wise dependencies. This operation employs a self-gating mechanism using two fully connected layers to learn channel-specific activations. It determines which high-level semantic features (e.g., specific disease textures) should be emphasized and which redundant background information should be suppressed. The mathematical form is expressed as follows:
where and are the weights of the fully connected layers, is the Sigmoid activation function, is the ReLU activation function, and represents the learned weight activation vector.
Scale (): Finally, the scale operation performs channel-wise multiplication between the learned weights and the original feature map . This step re-weights the feature channels, ensuring that the decoder reconstructs the disease images with higher fidelity and improved spatial consistency. The operation can be represented as follows:
where denotes the feature maps enhanced by the SE mechanism.
By integrating this sequence, the generator can more effectively refine the low-level semantic features during the up-sampling process, leading to higher accuracy and robustness in image generation. In order to preserve more detailed information, we used the L1 loss, which is shown as follows, in which stands for the harmonized image and P is the real image.
3.2.3. Global Discriminator
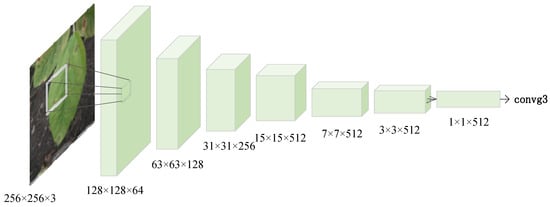
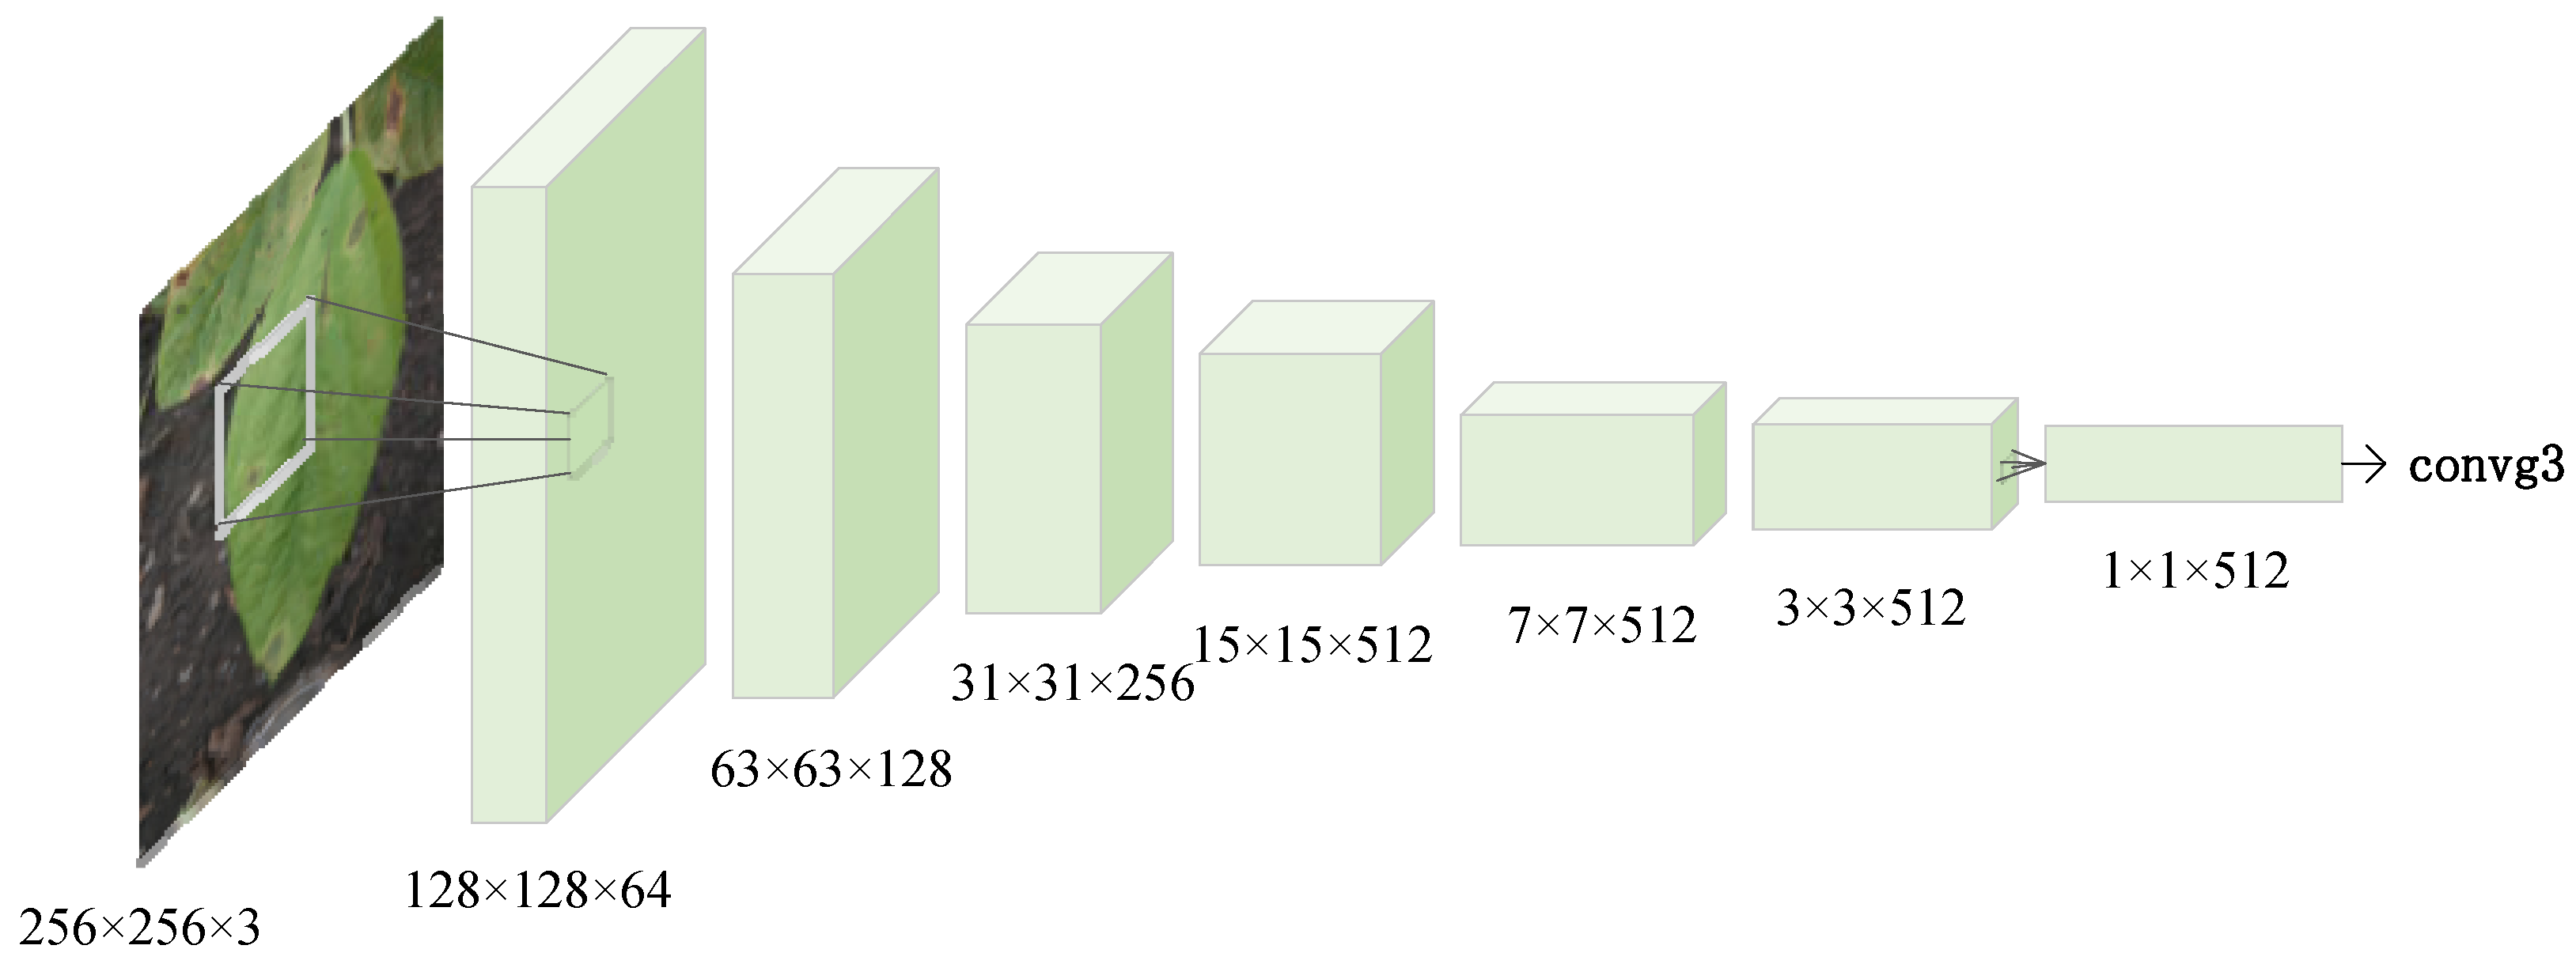
The global discriminator’s initial layer accepts two inputs, each consisting of 3 channels, and processes them via convolution to generate 64 feature channels. In the subsequent layers, the output feature map from the preceding layer serves as the input, with the number of channels progressively increasing at each stage. Following seven convolutional layers, the network produces 512 feature channels. A subsequent convolutional network further refines these 512 channel features, adjusting the feature dimensionality to yield a single channel output, which is utilized to assess the authenticity of the input image. The global discriminator’s structure is shown in Figure 8.
Figure 8.
Global discriminator.
It is worth noting that spectral normalization [40] is incorporated after each convolutional layer to improve the training stability. Hinge loss is used to enhance the robustness, which constructs a GAN discriminant loss function, expressed as follows:
Here, stands for the global discriminator and G stands for the generator. P, , , and M are the real image, harmonized image, composite image, and foreground masks, respectively.
When training by minimizing , if the inputs are real images, is encouraged to obtain large scores. If the inputs are generated images, is encouraged to obtain small scores. When minimizing to train G, generated images are expected to gain large scores to fool .
3.2.4. Domain Verification Discriminator
The domain verification discriminator is designed for confirming domain scores. When the lighting conditions, seasonal variations, and other conditions are consistent, it indicates that the foreground and background originate from same domain called a positive foreground–background pair. For instance, the foreground and background of real images are captured under identical conditions, thereby categorizing them within the same domain.
Firstly, let M denote the foreground mask and define the background mask as = 1 − M. By performing element-wise multiplication of real images (P) and generated images (), with masks M and , respectively, we can extract the foreground and background components of both real and generated images. Then, the domain verification discriminator receives these inputs. After passing through seven layers of partial convolutional layers, these inputs yield extracted representations of the foreground and background: the foreground representation of real images is , the background representation is ; the foreground representation of harmonized images is , the background representation is . Finally, we calculate the domain similarity score, and the expressions are as follows: stands for the real image domain similarity score; stands for the generated image domain similarity score, where represents the inner product. To provide a clearer overview of the software implementation for the domain verification process, the detailed steps are summarized in Algorithm 1.
| Algorithm 1: Domain Verification Similarity Calculation |
| Input: Real image P, Generated image , Foreground mask M 1: Define background mask = 1 − M; 2: Extract; 3: Extract; 4: for each image pair do 5: Pass ; 6: Pass; 7: end for 8: Calculate; 9: Calculate; 10: Compute domain verification loss: ; 11: return. |
In addition, partial convolution [41] is an improved convolution operation that, during computation, considers only the valid regions while ignoring the masked out invalid regions. This approach enhances robustness when handling inputs with missing data. The domain verification discriminator loss function is as follows:
When training by minimizing , if the inputs are positive (negative) foreground–background pairs, is encouraged to obtain large (small) scores. When minimizing to train G, generated images are encouraged to gain large scores to fool .
From the above description, the total loss of the generator is as follows:
where λ is set as 0.01, the generator and discriminator are essentially independent networks; therefore, during training, we employed an alternating independent training strategy.
4. Results and Discussion
4.1. Experimental Details
The model training and testing procedures outlined in this chapter were conducted on a Windows operating system, utilizing Python as the programming language (version 3.9). The development environment employed was Pycharm, which served as the Integrated Development Environment (IDE) for debugging and executing code. PyTorch version 1.12.0 was chosen as the deep learning framework. Table 3 lists other configuration parameters. In this paper, four evaluations were selected: MSE, PSNR, SSIM, and FID, but the MSE required real images as references so that it did not use a network without real images; in this situation we selected the FID instead. The formulas of these evaluation indicators are as follows:
Table 3.
Workstation specifications.
In the MSE, represents the predicted value, while is the true value.
In the SSIM, and stand for the average of x and y, respectively. and are the variances of x and y, respectively. is the covariance of x and y, and are the constants and , of which = 0.001 and = 0.03, and L is the dynamic range of pixel values.
In the FID, subscripts g and r represent generated and real images, respectively. and are the mean and covariance matrices of feature vectors of generated images, respectively. Tr is the trace of the matrix.
4.2. Hyperparameter Configuration
In our network, the weights were initialized using a hybrid strategy of Normal and Kaiming distributions to ensure stable gradient propagation. LeakyReLU was selected as the activation function, and instance normalization was applied. All input images were standardized to a resolution of 256 × 256 pixels. The entire training process on a single NVIDIA RTX 3080 GPU took approximately 8 h. After fine-tuning, the model achieved optimal performance when trained for 100 epochs using the Adam optimizer, with the loss curves reaching a stable convergence state at approximately 85 epochs. Specific hyperparameter settings and implementation details are summarized in Table 4.
Table 4.
Specific hyperparameter settings in our model.
4.3. Ablation Studies
In order to find the best newly added module and certify the effectiveness of the model, ablation experiments were carried out. The result of ablating each component is shown in Table 5. Firstly, the impact of different attention mechanisms including SE attention and Efficient Channel Attention (ECA) [42] was compared. It was observed that both attention-enhanced U-Net generators outperformed the baseline U-Net across all indicators. Notably, the SE attention module achieved superior results compared to the ECA module, with a lower MSE of 441.8941 and a higher PSNR of 21.6465. While the ECA mechanism is designed for efficiency through local cross-channel interactions, it appeared less effective at capturing the intricate and non-linear dependencies of crop lesions. The SE module, with its global channel-wise recalibration capability via fully connected layers, provided more robust feature representation for diverse soybean and rice disease symptoms. Consequently, the SE module was selected as the optimal attention component for our generator.
Table 5.
The results of ablation studies.
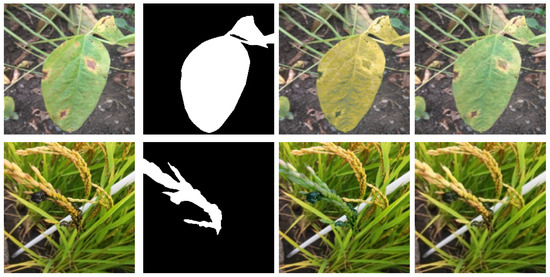
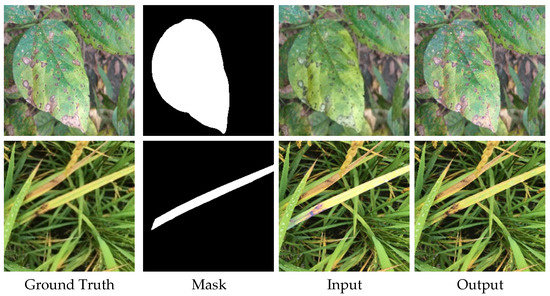
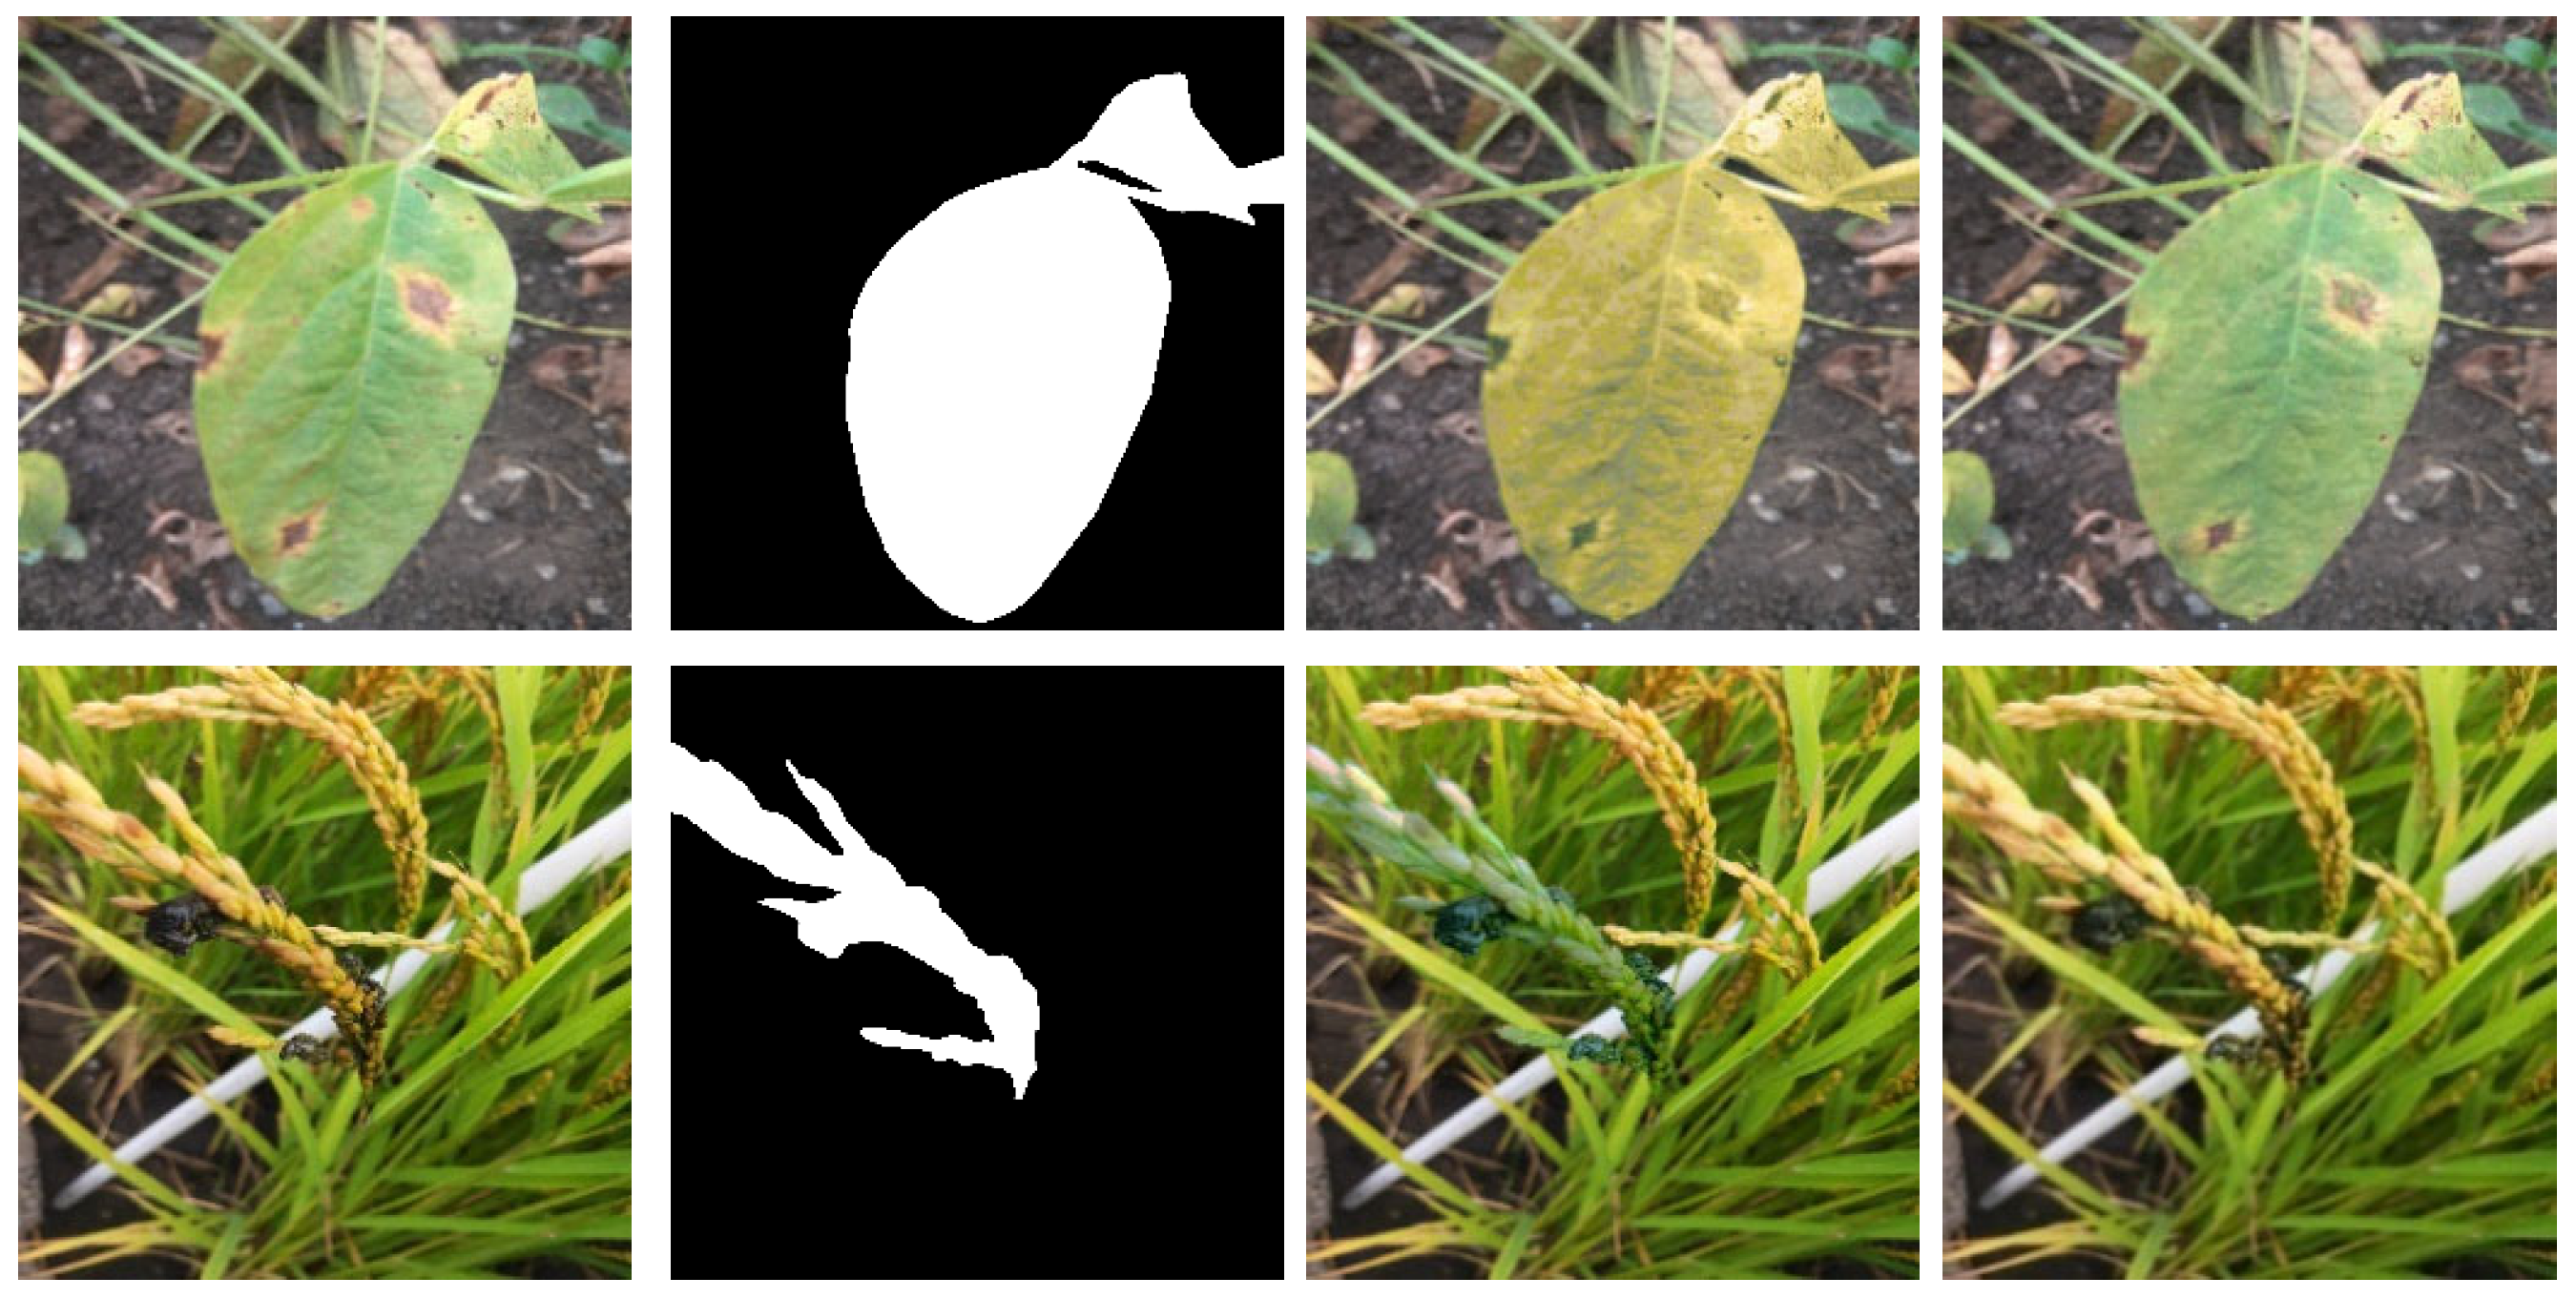
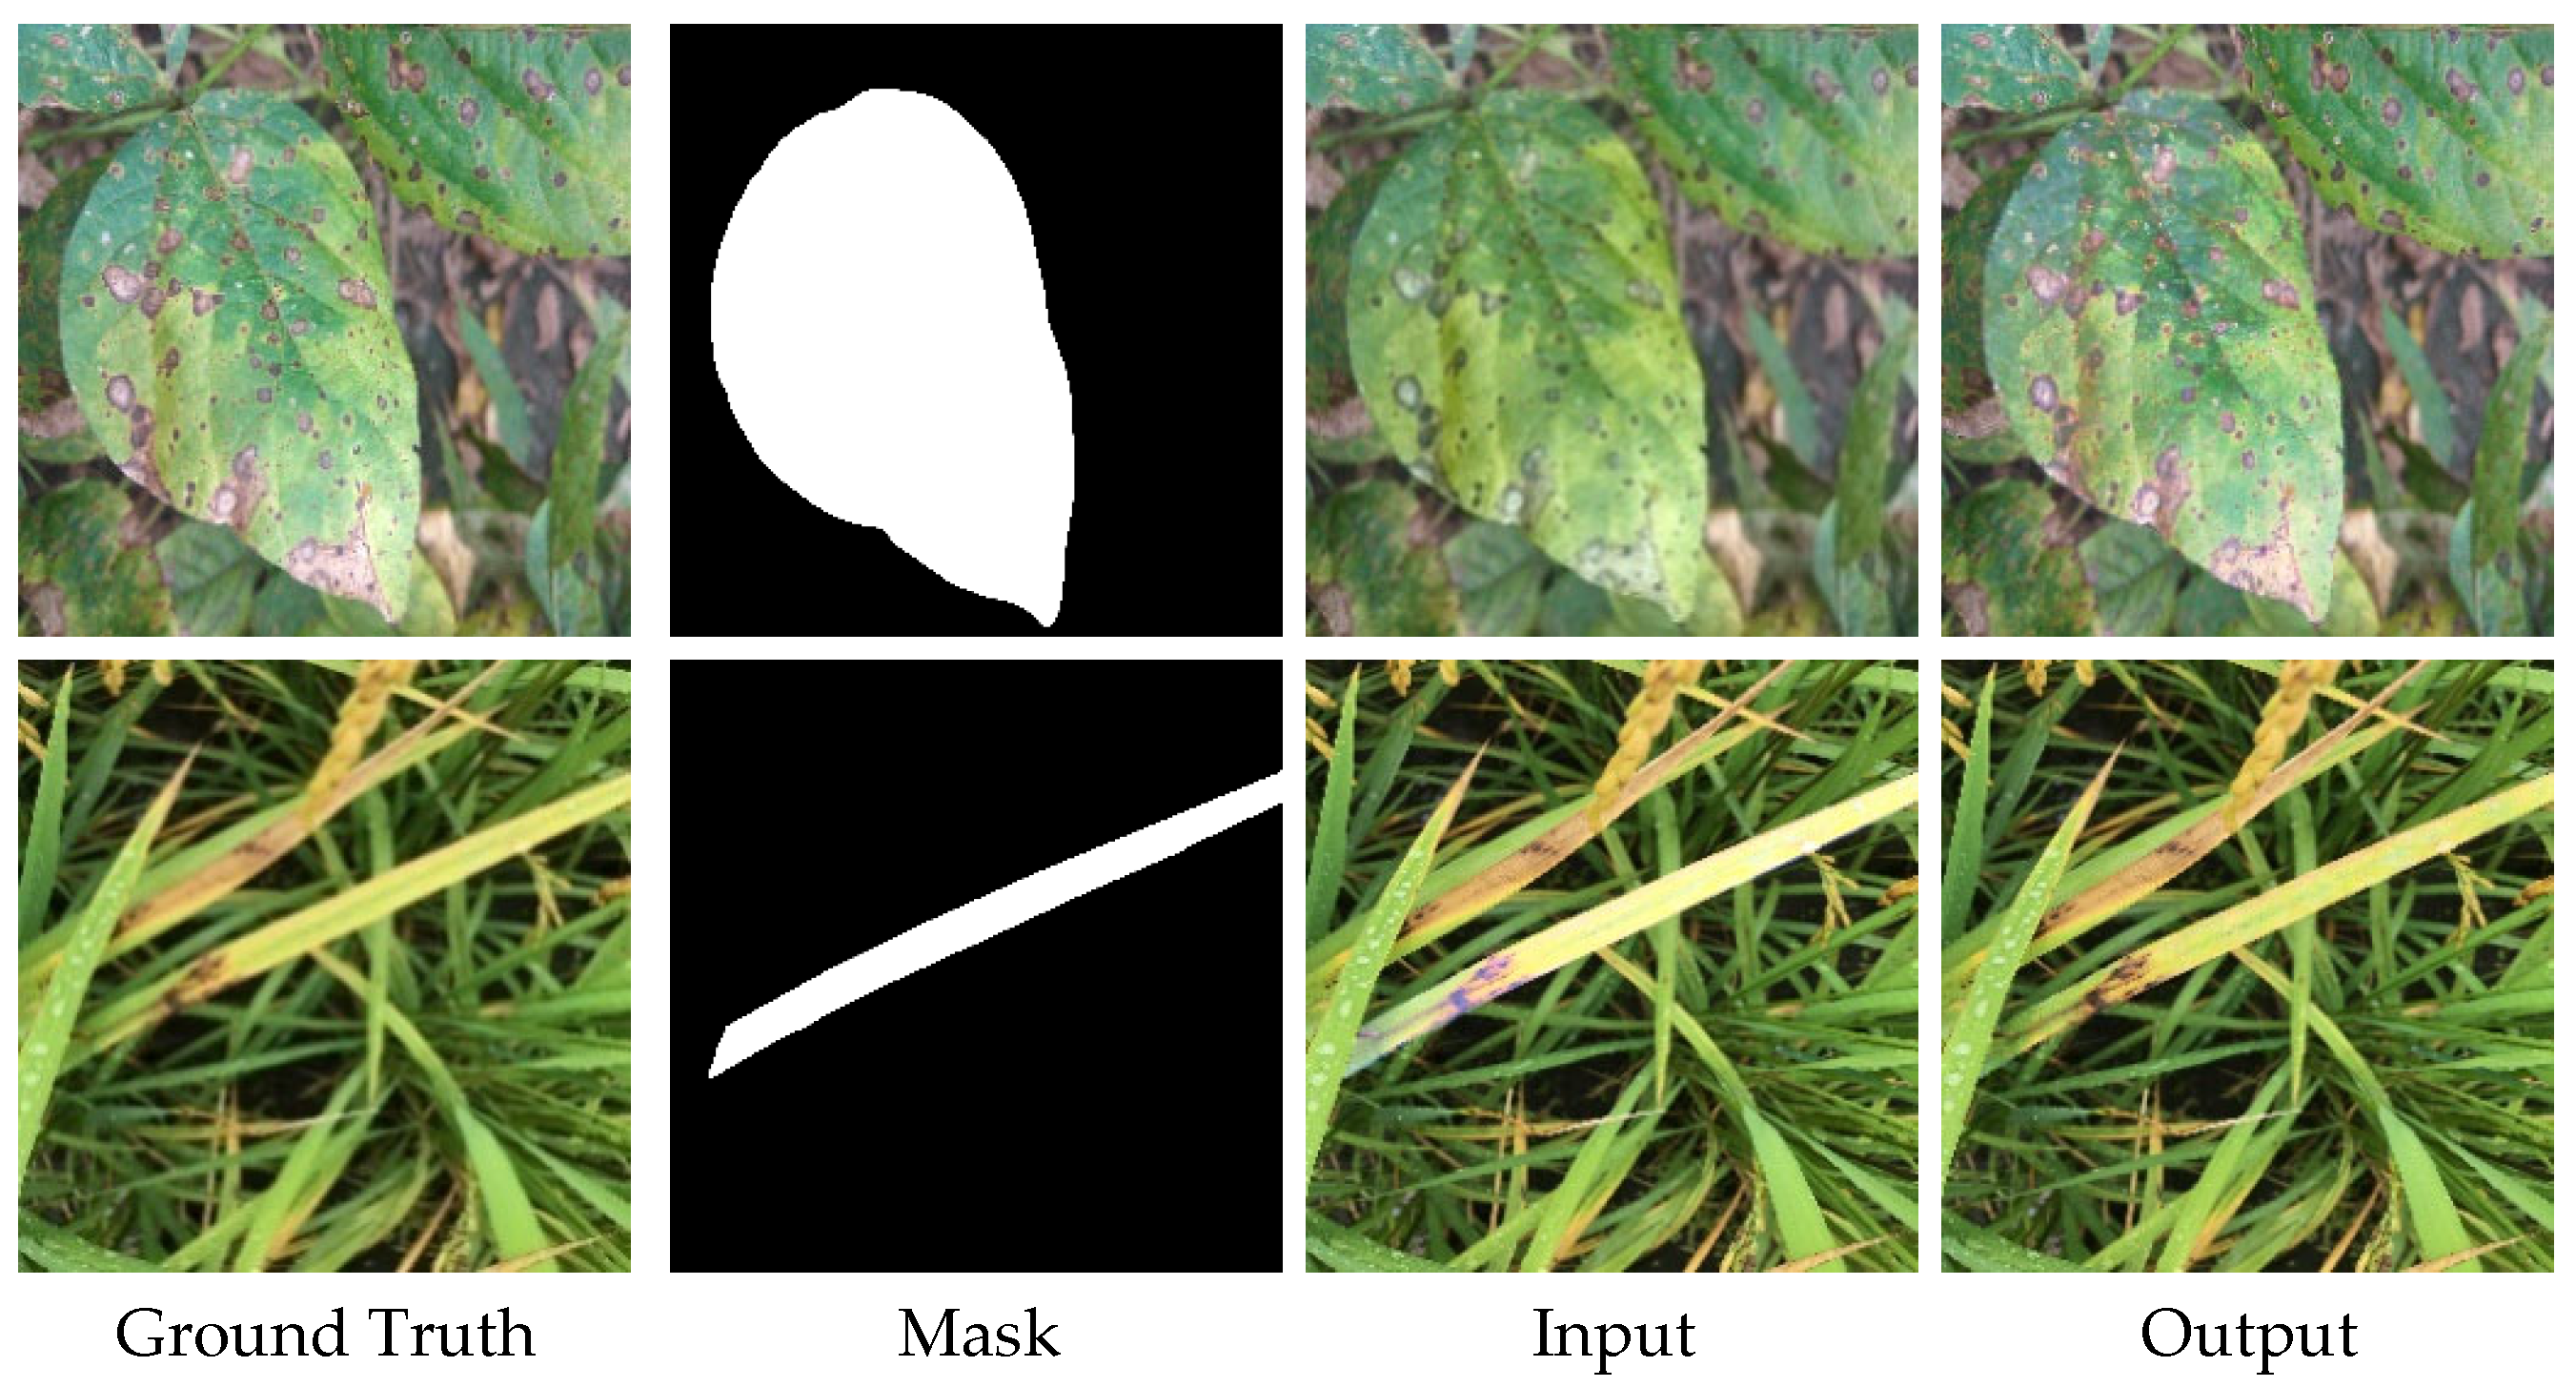
Next, two discriminators were integrated into the U-Net + SE module. Both global discriminator and domain verification discriminator experiments showed a significant performance leap, dramatically reducing the MSE. The introduction of adversarial training led to a second sharp decline in the FID scores, reaching 58.2934 and 64.8872, respectively, which highlights the critical role of discriminators in suppressing artifacts and enhancing the perceptual realism of synthesized images. Finally, the model combining both global and domain verification discriminators achieved the best overall performance, with an MSE of 43.7725, a PSNR of 33.0245, and an SSIM of 0.9806. This confirms that the synergistic effect of the dual-discriminator structure and the SE attention mechanism provides the highest fidelity and consistency in plant disease image generation. The images generated by our model are depicted in Figure 9.
Figure 9.
Example results of our method.
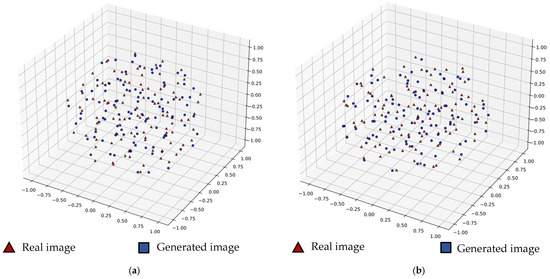
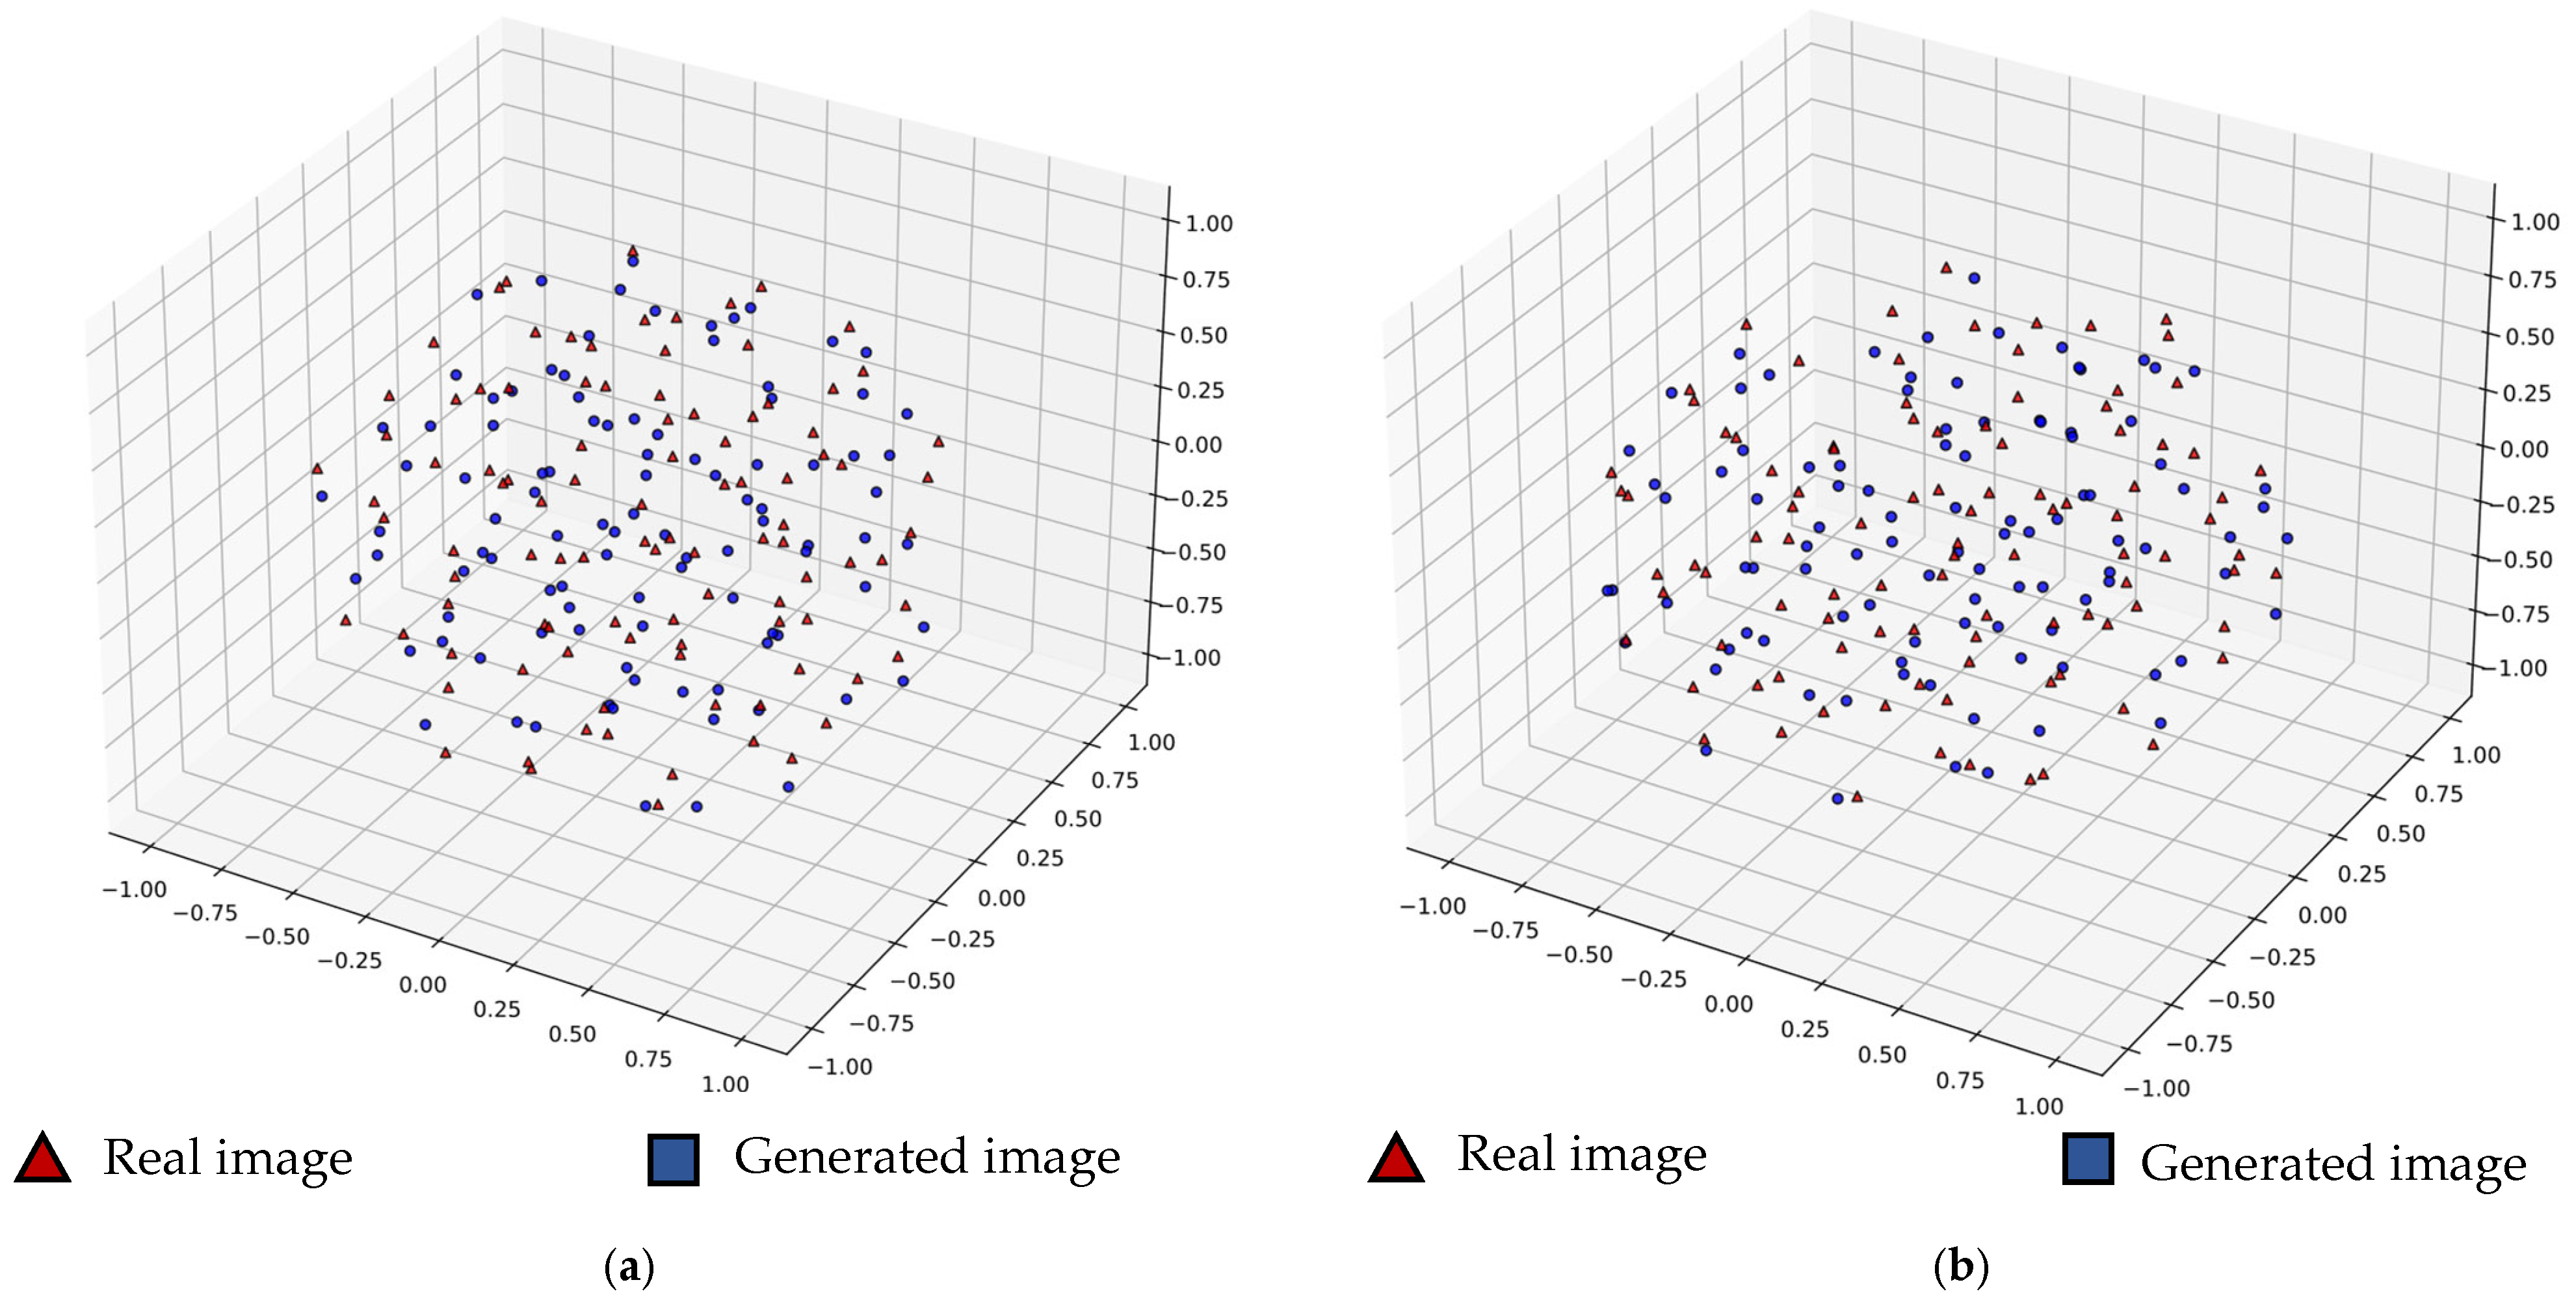
Additionally, we used t-Distributed Stochastic Neighbor Embedding (t-SNE) [43], with soybean sudden death syndrome and neck blast as case studies. For each disease, we selected 100 images from both real and generated datasets to map and compare their feature distributions in three-dimensional space. The visualization images are shown in Figure 10.
Figure 10.
Visualization of generated images and real images. (a) Three-dimensional feature distribution map of soybean; (b) three-dimensional feature distribution map of rice.
The visualization results demonstrate that the feature distribution of the generated images closely aligns with that of the real images, which is further supported by the quantitative results presented in Table 6. Specifically, the Silhouette Score (SC) of −0.0075, approaching zero, together with the relatively high Davies–Bouldin Index (DBI) of 88.2575, indicate a substantial overlap between the two feature distributions. This suggests that the generated samples effectively preserve the core semantic information and critical diagnostic characteristics of the original data. Furthermore, both the visual analysis and the Volume Expansion Ratio of 1.1248 (>1.0) reveal that the generated samples not only cover the manifold real images, but also expand their distribution boundaries by filling potential structural gaps within the original dataset. These results provide strong mathematical and visual evidence that the proposed model significantly improves the diversity of the generated dataset.
Table 6.
Quantitative analysis of the t-SNE feature space.
4.4. Comparative Experiments with GAN-Based Networks
In this comparative experiment, we aimed to validate the effectiveness of our DoveNet-based image generation approach by benchmarking its performance against five state-of-the-art models in plant disease image generation: DualGAN, UNIT, CUT, CycleGAN, and LeafGAN. Since soybean is one of the most widely cultivated crops and septoria brown spot is a common and economically significant disease affecting soybean, we consider healthy soybean → septoria brown spot as a representative example, which makes this disease pair particularly relevant for evaluating the model’s effectiveness in real-world agricultural applications. We downloaded 1044 healthy soybean images from Kaggle and divided them into training sets and test sets in an 8:2 ratio. For the compared networks, we trained each model for 200 epochs with a batch size of 1. Since there was no ground truth with compared networks, we replaced the MSE with the FID metric, which evaluated the discrepancy between generated and real images within the feature space. The results of various indicators for each network are shown in Table 7.
Table 7.
The results of comparative experiments with GAN-based networks.
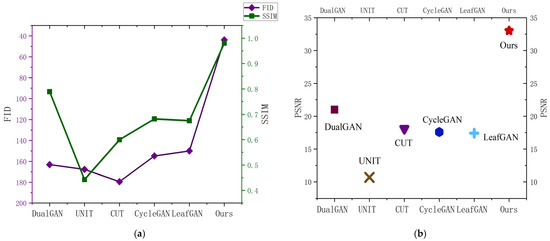
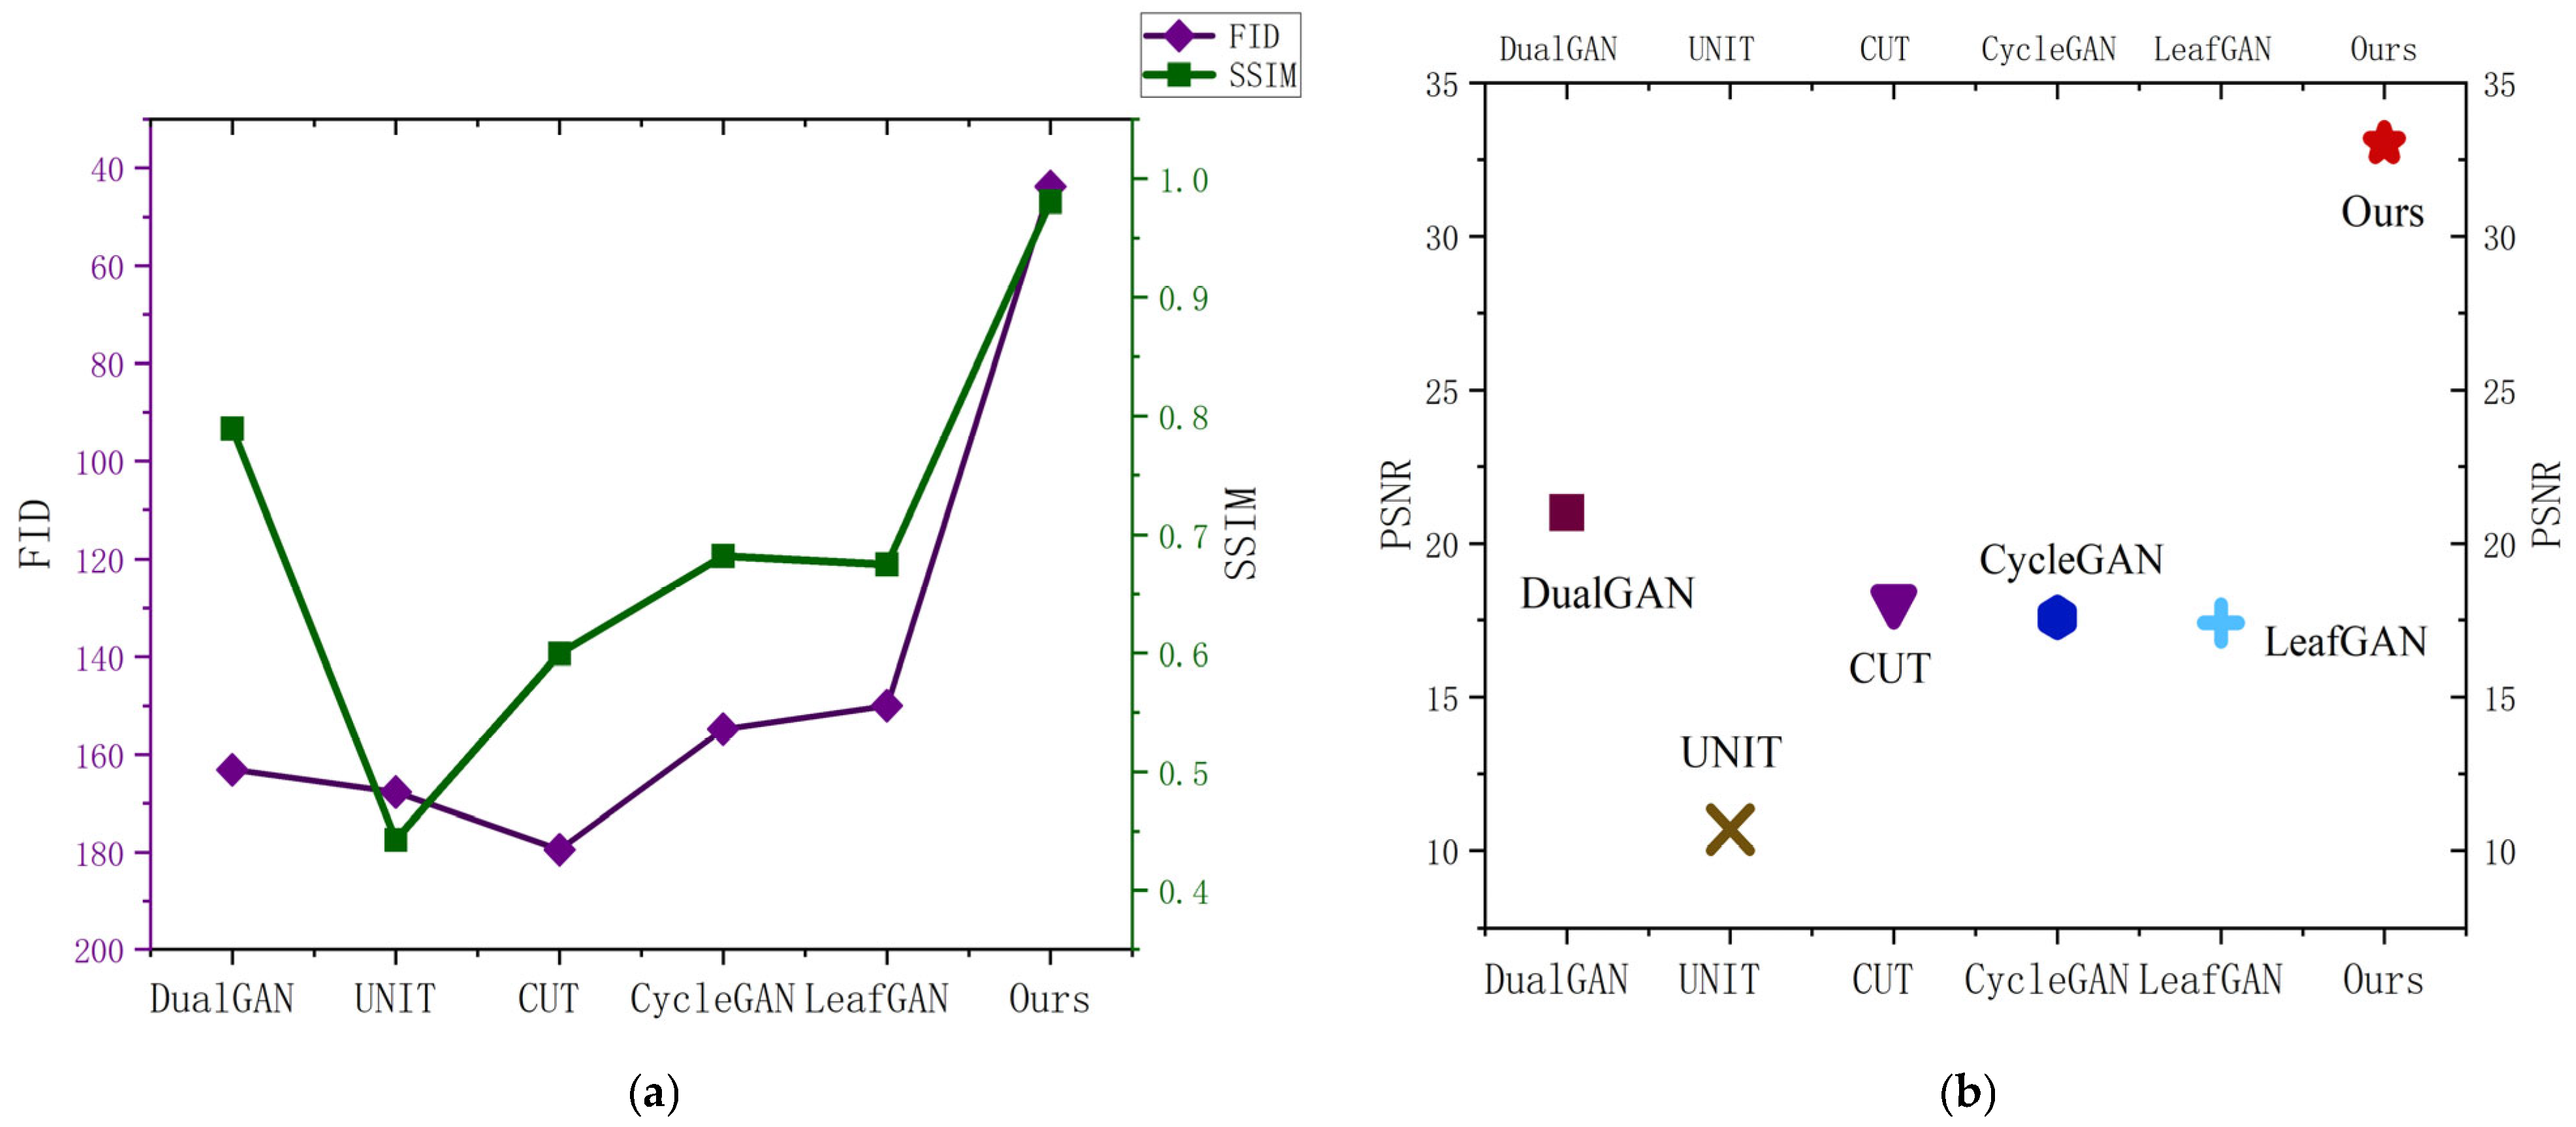
As shown in Table 7, our model outperformed the compared networks across all evaluation metrics, achieving an FID score of 45.6713, a PSNR of 33.0245, and an SSIM of 98.60%. Compared to the suboptimal results, our model achieved a remarkable improvement of 104.3624 in the FID score. Likewise, it demonstrated an increase of 12.0192 in the PSNR. In terms of the SSIM, our approach surpassed the second-best result by 19.13%, further underscoring its effectiveness. To facilitate an intuitive comparison of quantitative performance, Figure 11 presents the FID and SSIM metrics using a dual-axis plot, while the PSNR values are illustrated separately as a scatter plot. As demonstrated in Figure 11, our network consistently outperformed GAN-based networks across all three metrics.
Figure 11.
Visualization of quantitative evaluation metrics. (a) illustrates the FID and SSIM metrics for each model; (b) presents the PSNR results for each model.
To further evaluate the practical feasibility of our proposed model, we conducted a comparative study of computational efficiency, as summarized in Table 8. The results show that our model (Ours) achieved a parameter count of 54.4107 M, which was higher than the lightweight ResNet-based models (e.g., CycleGAN and CUT) but comparable to the U-Net-based DualGAN. This increased capacity allowed our network to better capture complex agricultural textures and illumination features. Most notably, our model achieved an average inference time of 9.8462 ms per image, outperforming all baseline models, including the simplest CycleGAN. This efficiency is attributed to the lightweight nature of the SE attention module and the optimized parallel structure of our backbone. Furthermore, the GPU memory consumption was maintained at 1105.7423 MB, which is well within the capabilities of standard consumer-grade hardware. These metrics collectively demonstrate that our model achieves an optimal trade-off between generative quality and operational efficiency.
Table 8.
Efficiency analysis of different models.
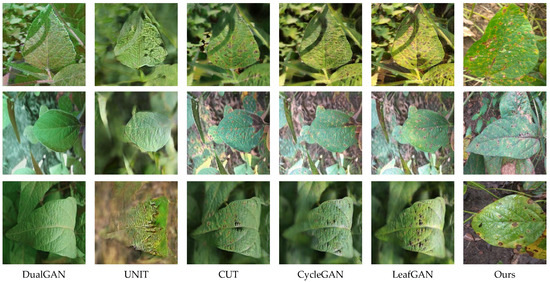
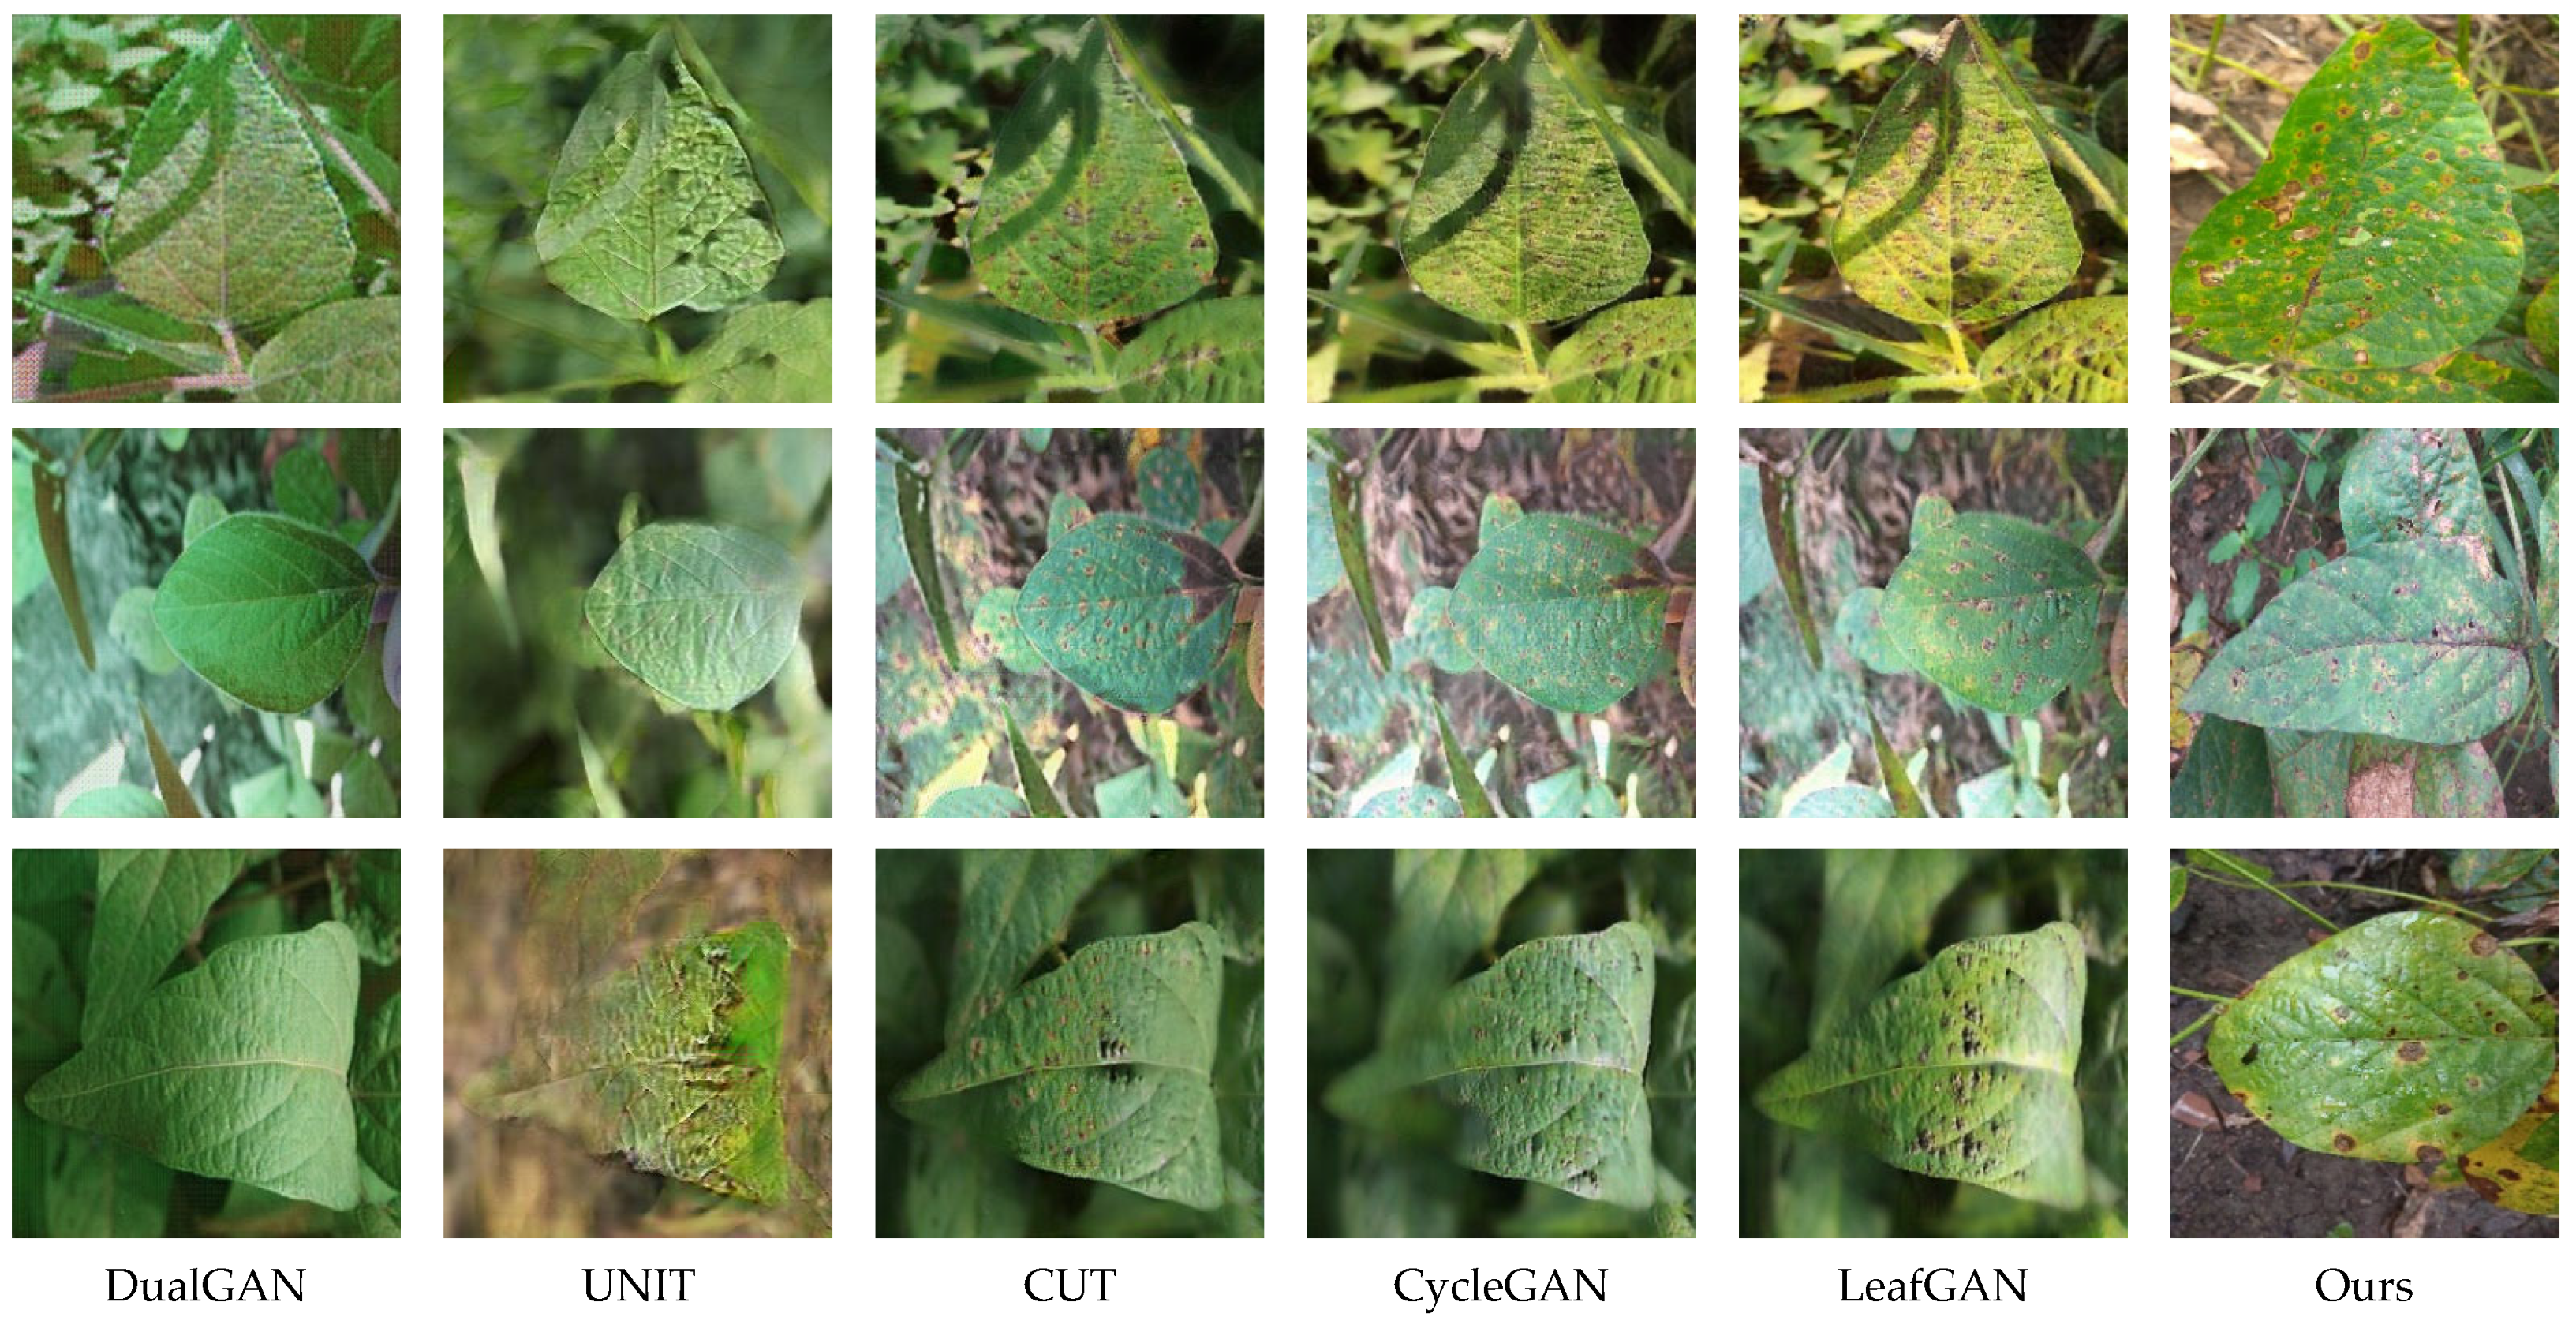
The images generated using DualGAN, UNIT, CUT, CycleGAN, LeafGAN, and the improved DoveNet are arranged in a left-to-right order, as shown in Figure 12. It must be emphasized that fundamentally different image generation paradigms are adopted by traditional GAN-based networks and the proposed method. Consequently, no direct one-to-one correspondence is maintained between the images generated using these alternative approaches and the proposed method. This comparison is intended to evaluate the realism of the generated lesions and the quality of their integration with the background. For this reason, we present a qualitative evaluation of the images produced by each network. It was observed that the images generated using DualGAN contain very few, if any, disease spots. The background of the images generated using UNIT has undergone significant changes, and the disease spots are not clearly visible. Compared to other methods, the images generated using CUT, CycleGAN, and LeafGAN are relatively clear, but their biggest drawback is that there is a lot of noise and blurriness in the images. We can see that although CUT can generate high-quality images, it cannot produce obvious lesions, and the lesions are blurred with a lot of noise. Images generated using CycleGAN present obvious lesions, and aside from in the diseased region, there is considerable image blurring. The blurred edges observed in CycleGAN-generated images may be attributable to an improper balance between adversarial and cycle consistency loss. As for images generated using LeafGAN, we intuitively find that they are similarly afflicted by such issues. Furthermore, we observed noticeable color variations in the RoI of the images generated using LeafGAN. This could be attributed to the limited dataset or to LeafGAN’s inability to effectively capture contextual information. According to comparison, our model is more fitting for generating plant disease images because it not only generates obvious lesions, but also ensures a smooth transition between diseased regions, with no noise artifacts at the boundaries.
Figure 12.
Display of results generated using different networks.
4.5. Comparison with Existing Methods
In order to fully assess our model, we conducted a comparison with recently proposed models in the image harmonization field. The methods described have demonstrated promising results on the image harmony dataset iHarmony4. However, since iHarmony4 comprises general scenes rather than domain-specific disease-related images, transfer learning techniques may not be directly applicable. Therefore, we retrained and fine-tuned each model using the dataset specifically constructed in this study. The performance outcomes of several models on the newly constructed dataset are presented in Table 9.
Table 9.
Comparison of the proposed method with the existing methods.
As illustrated in Table 9, although RainNet yields the minimum MSE at 17.4110, its performance in the PSNR and SSIM is less competitive. This disparity indicates that pixel-wise error metrics often fail to capture the complex spatial textures and local context essential for diagnosing plant diseases under natural conditions.
Compared with the classic DoveNet, the proposed model achieves a comprehensive performance gain, elevating the PSNR to 33.0245 and the SSIM to 0.9806. While BargainNet prioritizes global distribution alignment and thus achieves a slightly lower FID, our approach demonstrates superior pixel-level fidelity and structural coherence. Notably, our method attains the state-of-the-art LPIPS value of 0.0815, which is the lowest among all evaluated methods. This leading LPIPS score quantitatively confirms that the proposed harmonization methodology better preserves human-perceivable biological textures and lesion boundaries. In agricultural diagnostics, the integrity of fine-grained symptomatic details—as evidenced by the superior SSIM and LPIPS—is of greater practical significance than the minor statistical distribution shifts reflected by the FID metric.
4.6. Visual Turing Tests
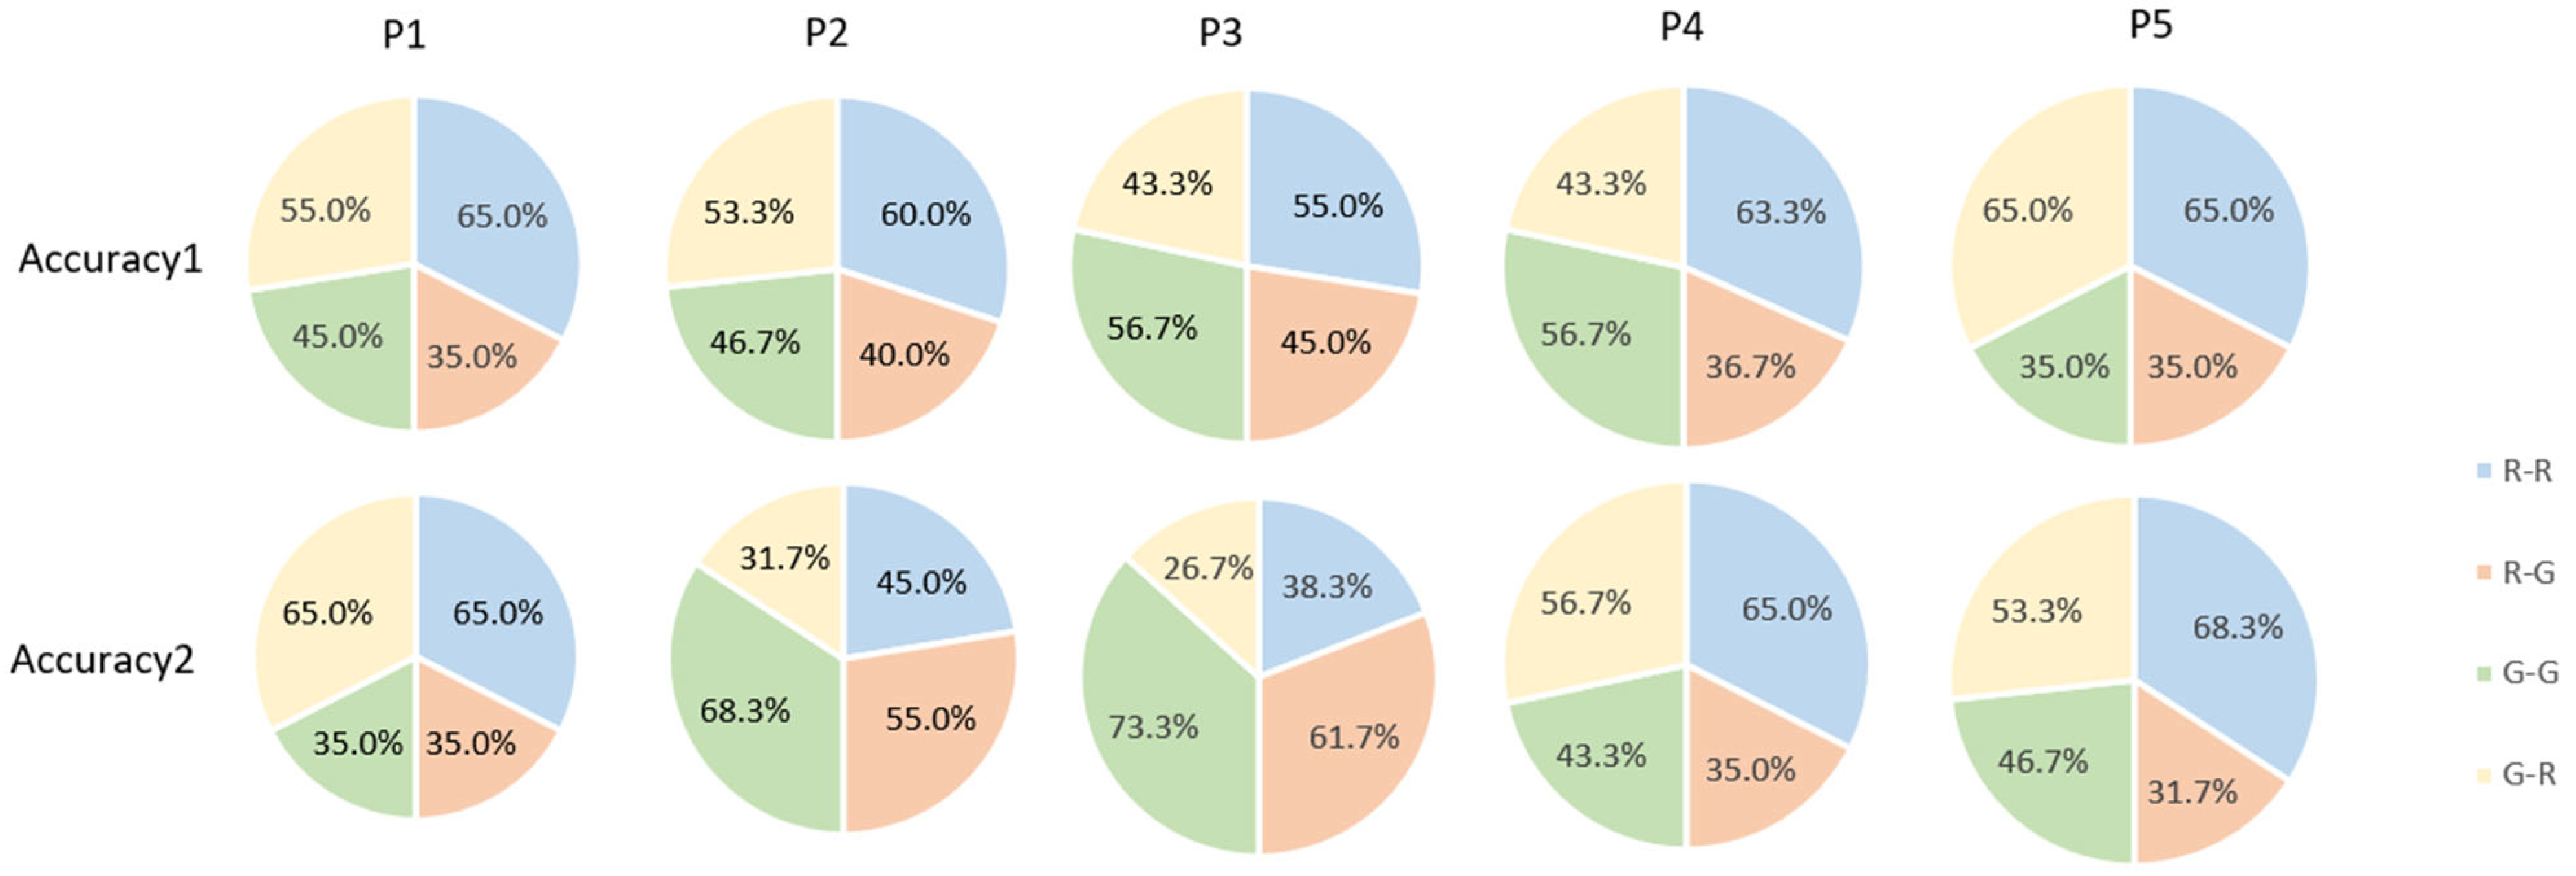
In the above experiments, we verified the performance of the model from an objective experimental perspective. In order to be more convincing and objectively evaluate the quality of generated images, we invited five botanists to conduct Turing tests. To maintain clarity, Table 10 outlines their specific expertise levels, specializations, and years of professional experience. In the tests, we concealed information and a total of 120 images were tested, consisting of 60 real images and 60 generated images. Botanists needed to carry out the following: (a) confirm whether images were real or generated (Accuracy 1); (b) from the perspective of the lesions, determine whether images were real or generated (Accuracy 2). We randomly selected images between generated images and real images to ensure reliability.
Table 10.
The statistical results of the Turing tests.
To quantitatively assess whether the experts could distinguish between real and synthetic images, a two-tailed binomial test was performed for each participant. As shown in Table 11, the individual p-values for all five experts across both test metrics exceeded the significance threshold of 0.05. Specifically, the identification accuracies ranged from 50.0% to 60.0%, with p-values as high as 1.000, indicating that their performance was statistically indistinguishable from random guessing (p = 0.5). The identification accuracies ranged from 50.0% to 60.0%, while the corresponding Cohen’s h effect sizes varied from 0.000 to 0.201, all of which can be interpreted as small effect sizes. These results suggest that the experts exhibited only a weak ability to discriminate between generated and real images. Furthermore, the overall Fleiss’ κ coefficient was 0.14, corresponding to a slight agreement level among the five botanists. This low inter-rater consistency indicates that even experienced experts could not form stable and consistent judgments regarding the authenticity of the generated samples. The results reflect that experienced researchers could not reliably identify the generated images. This high level of confusion confirms that the proposed method generates images with exceptional visual authenticity and realism.
Table 11.
Statistical results of the visual Turing tests.
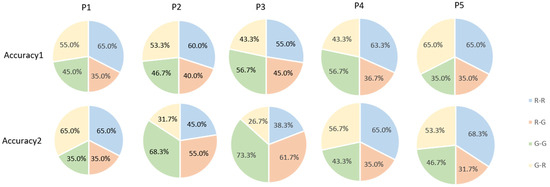
We present the results of the Turing tests and plot the results in Table 10 and Figure 13, respectively. From observation, plenty of images are not classified correctly. This implies that the characteristics of the real data were represented by generated images, resulting in an average accuracy of 54.8%. The above experiments show that even botanists could not accurately determine which images were generated by the network, whether from the perspective of the image as a whole or from the perspective of the lesions, indicating that generated images successfully captured the features of the real data.
Figure 13.
Visualization of Turing test results. R-R: real images are correctly identified; R-G: real images are identified as generated images; G-R: generated images are identified as real images; and G-G: generated images are correctly identified.
5. Conclusions and Future Works
5.1. Conclusions
Plant disease images in natural environments are often difficult to collect, and the diversity of plant disease images is insufficient to conduct research. In addition, existing GANs are unable to generate images with distinct disease lesions. To address these limitations, this study applied an image harmonization method based on DoveNet to generate plant disease images with high quality and diversity. During the dataset construction process, we employed EISeg to generate masks, followed by the application of three color transfer methods to create composite images, which were subsequently filtered to yield the final dataset. The three modules U-Net, global discriminator, and domain verification discriminator were used as effective components of the network. SE-Net was integrated into the U-Net generator to enhance feature extraction. The experimental results demonstrate that the improved DoveNet obtained an MSE of 43.77, and demonstrated a better performance than classical image harmonization models and other GAN models. In addition, our model obtained higher PSNR and SSIM results than the original.
5.2. Discussion of Limitations and Future Works
Although the proposed method achieves promising results, several limitations remain to be addressed in future research. Firstly, while our framework utilizes an adversarial loss in the domain verification discriminator to ensure realism, it inherently introduces a degree of instability during the training process. Moreover, while diffusion models and transformers have shown remarkable generative capabilities, their high computational demands and inference latency remain challenges for real-time agricultural applications. Secondly, the diversity of the constructed dataset is currently constrained, and the image harmonization techniques employed could be further refined to reduce the data discard rate. Thirdly, the model encounters challenges in accurately processing extremely small lesions, complex leaf occlusions, and intricate shadow distributions, which may hinder the discriminator’s ability to perform precise domain verification. Finally, the generalization capability of the model across extensive, large-scale general datasets has not been fully explored, indicating a need for broader cross-domain validation in subsequent studies.
In future research, several strategic improvements should be implemented to further enhance the diversity and quality of the generated data. First, to address the training instability of the current network, deep supervision mechanisms will be introduced. By incorporating auxiliary loss functions, deeper feature learning can be facilitated, thereby ensuring more stable convergence. We also plan to explore lightweight transformer architectures to further enhance the long-range dependency modeling of lesion textures. Second, the realism of synthesized images is expected to be improved through more extensive comparative experiments across various backbone networks. Based on these evaluations, the integration of style loss or texture loss into the objective function (similar to the dual-style loss approach in StarGAN v2) will be explored to ensure finer alignment between the generated lesions and the leaf backgrounds. Third, to enhance the autonomy of the generation pipeline, future efforts should focus on integrating advanced color transfer architectures and illumination-aware modules. These additions are intended to mitigate unpredictable color shifts and minimize the need for manual intervention. Finally, the cross-domain transferability between general and agricultural datasets will be investigated. Furthermore, the use of advanced image segmentation networks is planned to automate the acquisition of plant disease masks, thereby facilitating the construction of more robust and diverse datasets.
In terms of practical application, image generation is designed as a foundational upstream task to support downstream diagnostic systems. Future work should focus on integrating this generative framework into mobile-based diagnostic ecosystems. By synthesizing high-fidelity samples of rare and emerging diseases, the model can augment training sets for lightweight mobile classifiers, effectively overcoming the common data scarcity bottleneck in agricultural AI. This approach would allow farmers to utilize robust, real-time diagnostic tools in the field, facilitating early intervention and reducing crop loss. In summary, a commitment is maintained toward the continuous optimization of model performance for practical agricultural applications.
Author Contributions
Conceptualization, X.S.; methodology, X.S.; software, X.S.; validation, X.S.; formal analysis, X.M.; investigation, X.S.; resources, X.S.; data curation, X.S.; writing—original draft preparation, X.S.; writing—review and editing, X.M. and Q.W.; visualization, X.S.; supervision, X.M.; project administration, Q.W.; funding acquisition, Q.W. All authors have read and agreed to the published version of the manuscript.
Funding
The authors acknowledge the support of the Excellent Young Teachers Basic Research Support Program for Provincial Undergraduate Universities in Heilongjiang Province (No. YQJH2023200) and Heilongjiang Provincial Philosophy and Social Sciences Research Planning Project (No. 23JYD254).
Data Availability Statement
The data presented in this study are available on request from the corresponding author. The data are not publicly available due to ongoing research extensions and institutional data privacy.
Acknowledgments
This work was completed by the author during her master’s degree in Northeast Agricultural University of Heilongjiang Province, China. The author wishes to thank Xiangyan Meng, Qiufeng Wu, and the laboratory team. The authors acknowledge the support of the Excellent Young Teachers Basic Research Support Program for Provincial Undergraduate Universities in Heilongjiang Province (No. YQJH2023200) and Heilongjiang Provincial Philosophy and Social Sciences Research Planning Project (No. 23JYD254). Finally, the author thanks the anonymous reviewers of this paper.
Conflicts of Interest
The authors declare no conflicts of interest.
References
- Food and Agriculture Organization (FAO). The Hidden Health Crisis: How Plant Diseases Threaten Global Food Security. Food and Agriculture Organization of the United Nations. 2024. Available online: https://www.fao.org/one-health/highlights/how-plant-diseases-threaten-global-food-security/en (accessed on 18 May 2026).
- Hang, Y.; Meng, X.; Wu, Q. Application of Improved Lightweight Network and Choquet Fuzzy Ensemble Technology for Soybean Disease Identification. IEEE Access 2024, 12, 25146–25163. [Google Scholar] [CrossRef] [Scilit]
- Gai, Y.; Wang, H. Plant Disease: A Growing Threat to Global Food Security. Agronomy 2024, 14, 1615. [Google Scholar] [CrossRef] [Scilit]
- Shafay, M.; Abdelhamid, A.A.; El-Henawy, I.M. Recent Advances in Plant Disease Detection: Challenges and Opportunities. Plant Methods 2025, 21, 45. [Google Scholar] [CrossRef] [Scilit]
- Dai, Q.; Guo, Y.; Li, Z.; Song, S.; Lyu, S.; Sun, D.; Wang, Y.; Chen, Z. Citrus Disease Image Generation and Classification Based on Improved FastGAN and EfficientNet-B5. Agronomy 2023, 13, 988. [Google Scholar] [CrossRef] [Scilit]
- Cap, Q.H.; Uga, H.; Kagiwada, S.; Iyatomi, H. LeafGAN: An Effective Data Augmentation Method for Practical Plant Disease Diagnosis. IEEE Trans. Autom. Sci. Eng. 2020, 19, 1258–1267. [Google Scholar] [CrossRef] [Scilit]
- Gurumurthy, S.; Sarvadevabhatla, R.K.; Babu, R.V. DeliGAN: Generative Adversarial Networks for Diverse and Limited Data. In Proceedings of the IEEE Conference on Computer Vision and Pattern Recognition (CVPR) 2017, Honolulu, HI, USA, 21–26 July 2017; pp. 166–174. [Google Scholar]
- Dubiński, J.; Deja, K.; Wenzel, S.; Rokita, P.; Trzcinski, T. Selectively Increasing the Diversity of GAN-Generated Samples. In Proceedings of the International Conference on Neural Information Processing (ICONIP) 2022, Indore, India, 22–26 November 2022; pp. 260–270. [Google Scholar]
- Zhang, Z.; Gao, Q.; Liu, L.; He, Y. A High-Quality Rice Leaf Disease Image Data Augmentation Method Based on a Dual GAN. IEEE Access 2023, 11, 21176–21191. [Google Scholar] [CrossRef] [Scilit]
- Liu, B.; Tan, C.; Li, S.; He, J.; Wang, H. A Data Augmentation Method Based on Generative Adversarial Networks for Grape Leaf Disease Identification. IEEE Access 2020, 8, 102188–102198. [Google Scholar] [CrossRef] [Scilit]
- Wu, Q.; Chen, Y.; Meng, J. DCGAN-Based Data Augmentation for Tomato Leaf Disease Identification. IEEE Access 2020, 8, 98716–98728. [Google Scholar] [CrossRef] [Scilit]
- Nazki, H.; Yoon, S.; Fuentes, A.; Park, D.S. Unsupervised image translation using adversarial networks for improved plant disease recognition. Comput. Electron. Agric. 2020, 168, 105117. [Google Scholar] [CrossRef] [Scilit]
- Heusel, M.; Ramsauer, H.; Unterthiner, T.; Nessler, B.; Hochreiter, S. GANs Trained by a Two Time-Scale Update Rule Converge to a Local Nash Equilibrium. Adv. Neural Inf. Process. Syst. 2017, 30, 6626–6637. [Google Scholar]
- Talebi, H.; Milanfar, P. NIMA: Neural Image Assessment. IEEE Trans. Image Process. 2018, 27, 3998–4011. [Google Scholar] [CrossRef] [Scilit]
- Guo, H.; Li, M.; Hou, R.; Liu, H.; Zhou, X.; Zhao, C.; Chen, X.; Gao, L. Sample Expansion and Classification Model of Maize Leaf Diseases Based on the Self-Attention CycleGAN. Sustainability 2023, 15, 13420. [Google Scholar] [CrossRef] [Scilit]
- Xue, S.; Agarwala, A.; Dorsey, J.; Rushmeier, H. Understanding and improving the realism of image composites. ACM Trans. Graph. 2012, 31, 1–10. [Google Scholar] [CrossRef]
- Zhu, J.Y.; Krahenbuhl, P.; Shechtman, E.; Efros, A.A. Learning a Discriminative Model for the Perception of Realism in Composite Images. In Proceedings of the IEEE International Conference on Computer Vision (ICCV) 2015, Santiago, Chile, 7–13 December 2015; pp. 3943–3951. [Google Scholar] [CrossRef] [Scilit]
- Tsai, Y.H.; Shen, X.; Lin, Z.; Sunkavalli, K.; Lu, X.; Yang, M.H. Deep Image Harmonization. In Proceedings of the IEEE Conference on Computer Vision and Pattern Recognition (CVPR) 2017, Honolulu, HI, USA, 21–26 July 2017; pp. 2799–2807. [Google Scholar] [CrossRef] [Scilit]
- Cun, X.; Pun, C.-M. Improving the Harmony of the Composite Image by Spatial-Separated Attention Module. IEEE Trans. Image Process. 2020, 29, 4759–4771. [Google Scholar] [CrossRef] [Scilit]
- Cong, W.; Zhang, J.; Niu, L.; Liu, L.; Ling, Z.; Li, W.; Zhang, L. DoveNet: Deep Image Harmonization via Domain Verification. In Proceedings of the IEEE/CVF Conference on Computer Vision and Pattern Recognition (CVPR) 2020, Seattle, WA, USA, 13–19 June 2020; pp. 8391–8400. [Google Scholar] [CrossRef] [Scilit]
- Guo, Z.; Zheng, H.; Jiang, Y.; Gu, Z.; Zheng, B. Intrinsic Image Harmonization. In Proceedings of the IEEE/CVF Conference on Computer Vision and Pattern Recognition (CVPR) 2021, Nashville, TN, USA, 20–25 June 2021; pp. 16362–16371. [Google Scholar] [CrossRef] [Scilit]
- Cong, W.; Tao, X.; Niu, L.; Liang, J.; Gao, X.; Sun, Q.; Zhang, L. High-Resolution Image Harmonization via Collaborative Dual Transformations. In Proceedings of the IEEE/CVF Conference on Computer Vision and Pattern Recognition (CVPR) 2022, New Orleans, LA, USA, 18–24 June 2022; pp. 19065–19074. [Google Scholar]
- Hatamizadeh, A.; Song, J.; Liu, G.; Kautz, J.; Vahdat, A. DiffiT: Diffusion Vision Transformers for Image Generation. In Proceedings of the European Conference on Computer Vision (ECCV) 2024, Milan, Italy, 29 September–4 October 2024. [Google Scholar]
- Huang, S.; Li, Q.; Liao, J.; Wang, S.; Liu, L.; Li, L. Controllable Image Synthesis Methods, Applications and Challenges: A Comprehensive Survey. Artif. Intell. Rev. 2024, 57, 336. [Google Scholar] [CrossRef] [Scilit]
- Hao, Y.; Liu, Y.; Chen, Y.; Han, L.; Peng, J.; Tang, S.; Chen, G.; Wu, Z.; Chen, Z.; Lai, B. EISeg: An Efficient Interactive Segmentation Tool based on PaddlePaddle. arXiv 2022, arXiv:2210.08788. [Google Scholar] [CrossRef] [Scilit]
- Reinhard, E.; Adhikhmin, M.; Gooch, B.; Shirley, P. Color transfer between images. IEEE Comput. Grap. Appl. 2001, 21, 34–41. [Google Scholar] [CrossRef] [Scilit]
- Welsh, T.; Ashikhmin, M.; Mueller, K. Transferring Color to Greyscale Images. In Proceedings of the 29th Annual Conference on Computer Graphics and Interactive Techniques (SIGGRAPH) 2002, San Antonio, TX, USA, 23–26 July 2002; pp. 277–280. [Google Scholar] [CrossRef] [Scilit]
- Fecker, U.; Barkowsky, M.; Kaup, A. Histogram-Based Prefiltering for Luminance and Chrominance Compensation of Multiview Video. IEEE Trans. Circuits Syst. Video Technol. 2008, 18, 1258–1267. [Google Scholar] [CrossRef] [Scilit]
- Min, B.; Kim, T.; Shin, D.; Shin, D. Data augmentation method for plant leaf disease recognition. Appl. Sci. 2023, 13, 1465. [Google Scholar] [CrossRef] [Scilit]
- Ronneberger, O.; Fischer, P.; Brox, T. U-Net: Convolutional Networks for Biomedical Image Segmentation. In Proceedings of the International Conference on Medical Image Computing and Computer-Assisted Intervention (MICCAI) 2015, Munich, Germany, 5–9 October 2015; pp. 234–241. [Google Scholar] [CrossRef] [Scilit]
- Chi, J.; Wu, C.; Yu, X.; Ji, P.; Chu, H. Single low-dose CT image denoising using a generative adversarial network with modified U-Net generator and multi-level discriminator. IEEE Access 2020, 8, 133470–133487. [Google Scholar] [CrossRef] [Scilit]
- Yin, L.; Zhao, W. Graph Attention-based U-net Conditional Generative Adversarial Networks for the Identification of Synchronous Generation Unit Parameters. Eng. Appl. Artif. Intell. 2023, 126, 106896. [Google Scholar] [CrossRef] [Scilit]
- Hu, J.; Shen, L.; Sun, G. Squeeze-and-Excitation Networks. In Proceedings of the IEEE Conference on Computer Vision and Pattern Recognition (CVPR) 2018, Salt Lake City, UT, USA, 18–23 June 2018; pp. 7132–7141. [Google Scholar] [CrossRef] [Scilit]
- Chao, X.; Hu, X.; Feng, J.; Zhang, Z.; Wang, M.; He, D. Construction of Apple Leaf Diseases Identification Networks Based on Xception Fused by SE Module. Appl. Sci. 2021, 11, 4614. [Google Scholar] [CrossRef] [Scilit]
- Xie, Y.; Tian, W.; Yu, Z. Robust facial expression recognition with transformer block enhancement module. Eng. Appl. Artif. Intell. 2023, 126, 106795. [Google Scholar] [CrossRef] [Scilit]
- Lin, H.; Tse, R.; Tang, S.K.; Qiang, Z.P.; Pau, G. The Positive Effect of Attention Module in Few-Shot Learning for Plant Disease Recognition. In Proceedings of the 5th International Conference on Pattern Recognition and Artificial Intelligence (PRAI) 2022, Xiamen, China, 23–25 September 2022; pp. 114–120. [Google Scholar]
- Wenyi, H.U.; Hongkun, W.A.N.G.; Yujia, D.U. Identification Method of Tomato Diseases and Pests Based on SE Module and ResNet. Agric. Eng. 2022, 12, 33–40. [Google Scholar]
- Rundo, L.; Han, C.; Nagano, Y.; Zhang, J.; Hataya, R.; Militello, C.; Tangherloni, A.; Nobile, M.S.; Ferretti, C.; Besozzi, D.; et al. USE-Net: Incorporating Squeeze-and-Excitation blocks into U-Net for prostate zonal segmentation of multi-institutional MRI datasets. Neurocomputing 2019, 365, 31–43. [Google Scholar] [CrossRef] [Scilit]
- Fu, B.; Sun, X.; Ma, S.; Ma, X.; Liu, Z. CSEU-Net: ConvNeXt-SE-U-Net for river ice floe segmentation using unmanned aerial vehicle grayscale remote sensing images. J. Appl. Remote Sens. 2024, 18, 046505. [Google Scholar] [CrossRef] [Scilit]
- Miyato, T.; Kataoka, T.; Koyama, M.; Yoshida, Y. Spectral Normalization for Generative Adversarial Networks. In Proceedings of the International Conference on Learning Representations (ICLR) 2018, Vancouver, BC, Canada, 3 May–30 April 2018. [Google Scholar]
- Liu, G.; Reda, F.A.; Shih, K.J.; Wang, T.-C.; Tao, A.; Catanzaro, B. Image Inpainting for Irregular Holes Using Partial Convolutions. In Proceedings of the European Conference on Computer Vision (ECCV) 2018, Munich, Germany, 8–14 September 2018; pp. 85–100. [Google Scholar] [CrossRef] [Scilit]
- Wang, Q.; Wu, B.; Zhu, P.; Li, P.; Zuo, W.; Hu, Q. ECA-Net: Efficient Channel Attention for Deep Convolutional Neural Networks. In Proceedings of the IEEE/CVF Conference on Computer Vision and Pattern Recognition (CVPR) 2020, Seattle, WA, USA, 13–19 June 2020; pp. 11534–11542. [Google Scholar] [CrossRef] [Scilit]
- Van der Maaten, L.; Hinton, G. Visualizing data using t-SNE. J. Mach. Learn. Res. 2008, 9, 2579–2605. [Google Scholar]
- Yi, Z.; Zhang, H.; Tan, P.; Gong, M. DualGAN: Unsupervised Dual Learning for Image-to-Image Translation. In Proceedings of the IEEE International Conference on Computer Vision (ICCV) 2017, Venice, Italy, 22–29 October 2017; pp. 2868–2876. [Google Scholar] [CrossRef] [Scilit]
- Liu, M.Y.; Breuel, T.; Kautz, J. Unsupervised Image-to-Image Translation Networks. Adv. Neural Inf. Process. Syst. (NeurIPS) 2017, 30, 700–708. [Google Scholar]
- Park, T.; Efros, A.A.; Zhang, R.; Zhu, J.Y. Contrastive Learning for Unpaired Image-to-Image Translation. In Proceedings of the European Conference on Computer Vision (ECCV) 2020, Glasgow, UK, 23–28 August 2020; pp. 319–345. [Google Scholar] [CrossRef] [Scilit]
- Zhu, J.-Y.; Park, T.; Isola, P.; Efros, A.A. Unpaired Image-to-Image Translation using Cycle-Consistent Adversarial Networks. In Proceedings of the IEEE International Conference on Computer Vision (ICCV) 2017, Venice, Italy, 22–29 October 2017; pp. 2223–2232. [Google Scholar] [CrossRef] [Scilit]
- Cong, W.; Niu, L.; Zhang, J.; Liang, J.; Zhang, L. BargainNet: Background-Guided Domain Translation for Image Harmonization. In Proceedings of the 2021 IEEE International Conference on Multimedia and Expo (ICME), Shenzhen, China, 5–9 July 2021; pp. 1–6. [Google Scholar]
- Ling, J.; Xue, H.; Song, L.; Xie, R.; Gu, X. Region-aware Adaptive Instance Normalization for Image Harmonization. In Proceedings of the IEEE/CVF Conference on Computer Vision and Pattern Recognition (CVPR) 2021, Nashville, TN, USA, 20–25 June 2021; pp. 9361–9370. [Google Scholar] [CrossRef] [Scilit]

Disclaimer/Publisher’s Note: The statements, opinions and data contained in all publications are solely those of the individual author(s) and contributor(s) and not of MDPI and/or the editor(s). MDPI and/or the editor(s) disclaim responsibility for any injury to people or property resulting from any ideas, methods, instructions or products referred to in the content. |
© 2026 by the authors. Licensee MDPI, Basel, Switzerland. This article is an open access article distributed under the terms and conditions of the Creative Commons Attribution (CC BY) license.