


Abstract
Midsole mechanical properties are typically assessed under single-frequency loading conditions, which may not capture how running shoes respond across the range of impact rates encountered during actual running. This study examined the effects of impact frequency on vertical stiffness, peak displacement, and energy return percentage in six running shoe constructions varying in midsole material (ethylene-vinyl acetate [EVA] vs. polyether block amide [PEBA]) and stack height, with hardness varying within the PEBA constructions. Each construction was loaded to a peak force of 1500 N across five impact frequencies (1.5–2.5 Hz). Linear mixed-effects models were used to evaluate the effects of frequency, material, and midsole properties on each outcome. Stiffness increased significantly with frequency across all constructions, while peak displacement decreased with increasing frequency. Energy return percentage also decreased with frequency, although the magnitude of change was small. PEBA constructions displaced more than EVA under equivalent loading conditions, and harder PEBA constructions displaced less than softer PEBA. These findings indicate that impact frequency meaningfully alters the mechanical behaviour of running shoe midsoles and suggest that single-frequency testing protocols may not fully represent how shoes perform across realistic running speeds.
1. Introduction
Midsole cushioning governs how running shoes manage impact forces during ground contact. During the stance phase, the midsole attenuates impact forces and returns a portion of the stored energy to the runner [1,2]. These functions are primarily determined by the mechanical properties and thickness of the midsole foam. As running shoes continue to adopt novel foam materials and thicker midsole geometries, understanding how these constructions respond mechanically under varying loading conditions has become increasingly important [3].
The mechanical behaviour of midsole foams depends not only on material composition and geometry but also on loading rate. During running, step frequency varies between individuals and increases with speed, typically ranging from approximately 150 to ≥300 steps·min−1 (≈1.25–2.5 Hz per leg). Higher frequencies correspond to shorter ground contact times (≈150–300 ms), thereby increasing the rate of midsole compression [4,5]. Midsole foams are viscoelastic, and this increased loading rate alters their mechanical response, generally producing higher apparent stiffness, reduced peak deformation, and greater energy dissipation [6]. A given running shoe may therefore respond differently at slower versus faster running speeds, even when its geometry remains unchanged [3,6].
At present, running shoe midsoles are primarily constructed from two materials: ethylene-vinyl acetate (EVA) and polyether block amide (PEBA). EVA remains widely used due to its low density and moldability, but it is highly strain-rate sensitive; under faster or repeated loading, EVA becomes stiffer and dissipates more energy [6,7]. In contrast, PEBA foams are designed to provide high resilience, low energy loss, and stable mechanical behaviour over repeated impacts [8]. PEBA midsoles are also more compliant and elastic than EVA, which has enabled the design of thicker, more responsive midsole geometries [3,9]. These distinct material properties suggest that EVA and PEBA may differ in their mechanical response to loading rate.
Despite this established rate dependence, many mechanical evaluations continue to assess footwear under a single loading condition [10]. Standard protocols such as ASTM F1976 and ASTM F1614 prescribe fixed impact energies of approximately 5 J and simplified loading waveforms, reporting a limited set of summary metrics from single impacts or steady-state cycles [11,12]. Recent work has questioned whether such constant-energy tests accurately represent the nonlinear behaviour of modern midsole systems [13]. Single-frequency evaluations may therefore fail to capture how midsole properties change across the range of impact frequencies encountered during running.
To date, no studies have compared the frequency-dependent mechanical response of EVA and PEBA midsoles in complete shoe constructions with matched geometry [3,14]. The present study addresses this gap by examining how impact frequency (1.5–2.5 Hz) affects the vertical stiffness, peak displacement, and energy return of six running shoe constructions varying in midsole material and stack height, while holding upper construction, outsole composition, and last geometry constant. It was hypothesised that increasing impact frequency would increase stiffness, reduce peak displacement, and reduce energy return across all constructions. It was further hypothesised that PEBA midsoles would show smaller frequency-dependent changes than EVA. Finally, it was hypothesised that thicker midsoles would reduce the magnitude of frequency-related changes, particularly in EVA constructions.
2. Materials and Methods
A repeated-measures experimental design was used to assess the mechanical performance of six female size United States (US) 8.5 running shoe constructions. The constructions varied by midsole material (EVA vs. PEBA) and, within the PEBA conditions, by foam hardness (37 vs. 50 Asker C), resulting in three midsole constructions. Each midsole material had two stack heights (low vs. high), yielding six unique constructions (Table 1). All other shoe characteristics, including upper construction, last geometry, and outsole composition, were constant. Midsole hardness values (Table 1) were measured on the exposed midsole surface using a manual Asker C1L durometer (Model NE10C; Maizoon, China). For each midsole, 15 readings were taken at locations adapted from ASTM D2240 [15] to correspond to the subsequent impact test sites, and the median value was recorded.
Table 1.
Midsole constructions of six female size United States (US) 8.5 running shoes.
Internal shoe length was measured from the inside of the heel counter to the tip of the longest toe using a calibrated digital calliper (Mitutoyo 500-196-30 Absolute Digimatic Caliper, Mitutoyo Corp., Kawasaki, Japan). Measurement points were marked on the insole at 12% and 75% of this length. At each point, stack height was measured vertically from the insole surface to the flat platform beneath the shoe, at the midline of the shoe’s width, using the same calliper [16].
2.1. Mechanical Impact Testing Protocol
Each construction was tested at the heel location (12% of internal shoe length) at five impact frequencies: 1.5, 1.75, 2.0, 2.25, and 2.5 Hz. Each loading cycle represents a single-leg ground contact; therefore, the corresponding bilateral step rates are 3.0, 3.5, 4.0, 4.5, and 5.0 Hz (180–300 steps·min−1). Assuming an average step length of ~1 m, these frequencies correspond to running speeds of approximately 10–18 km·h−1 [4].
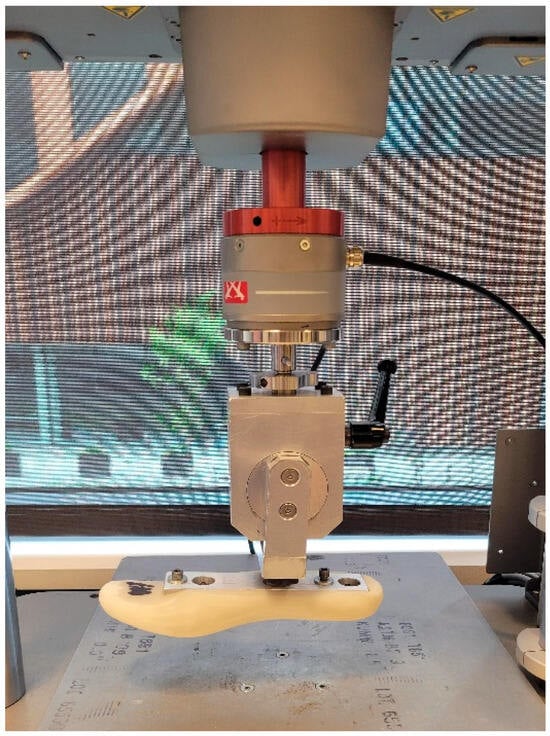
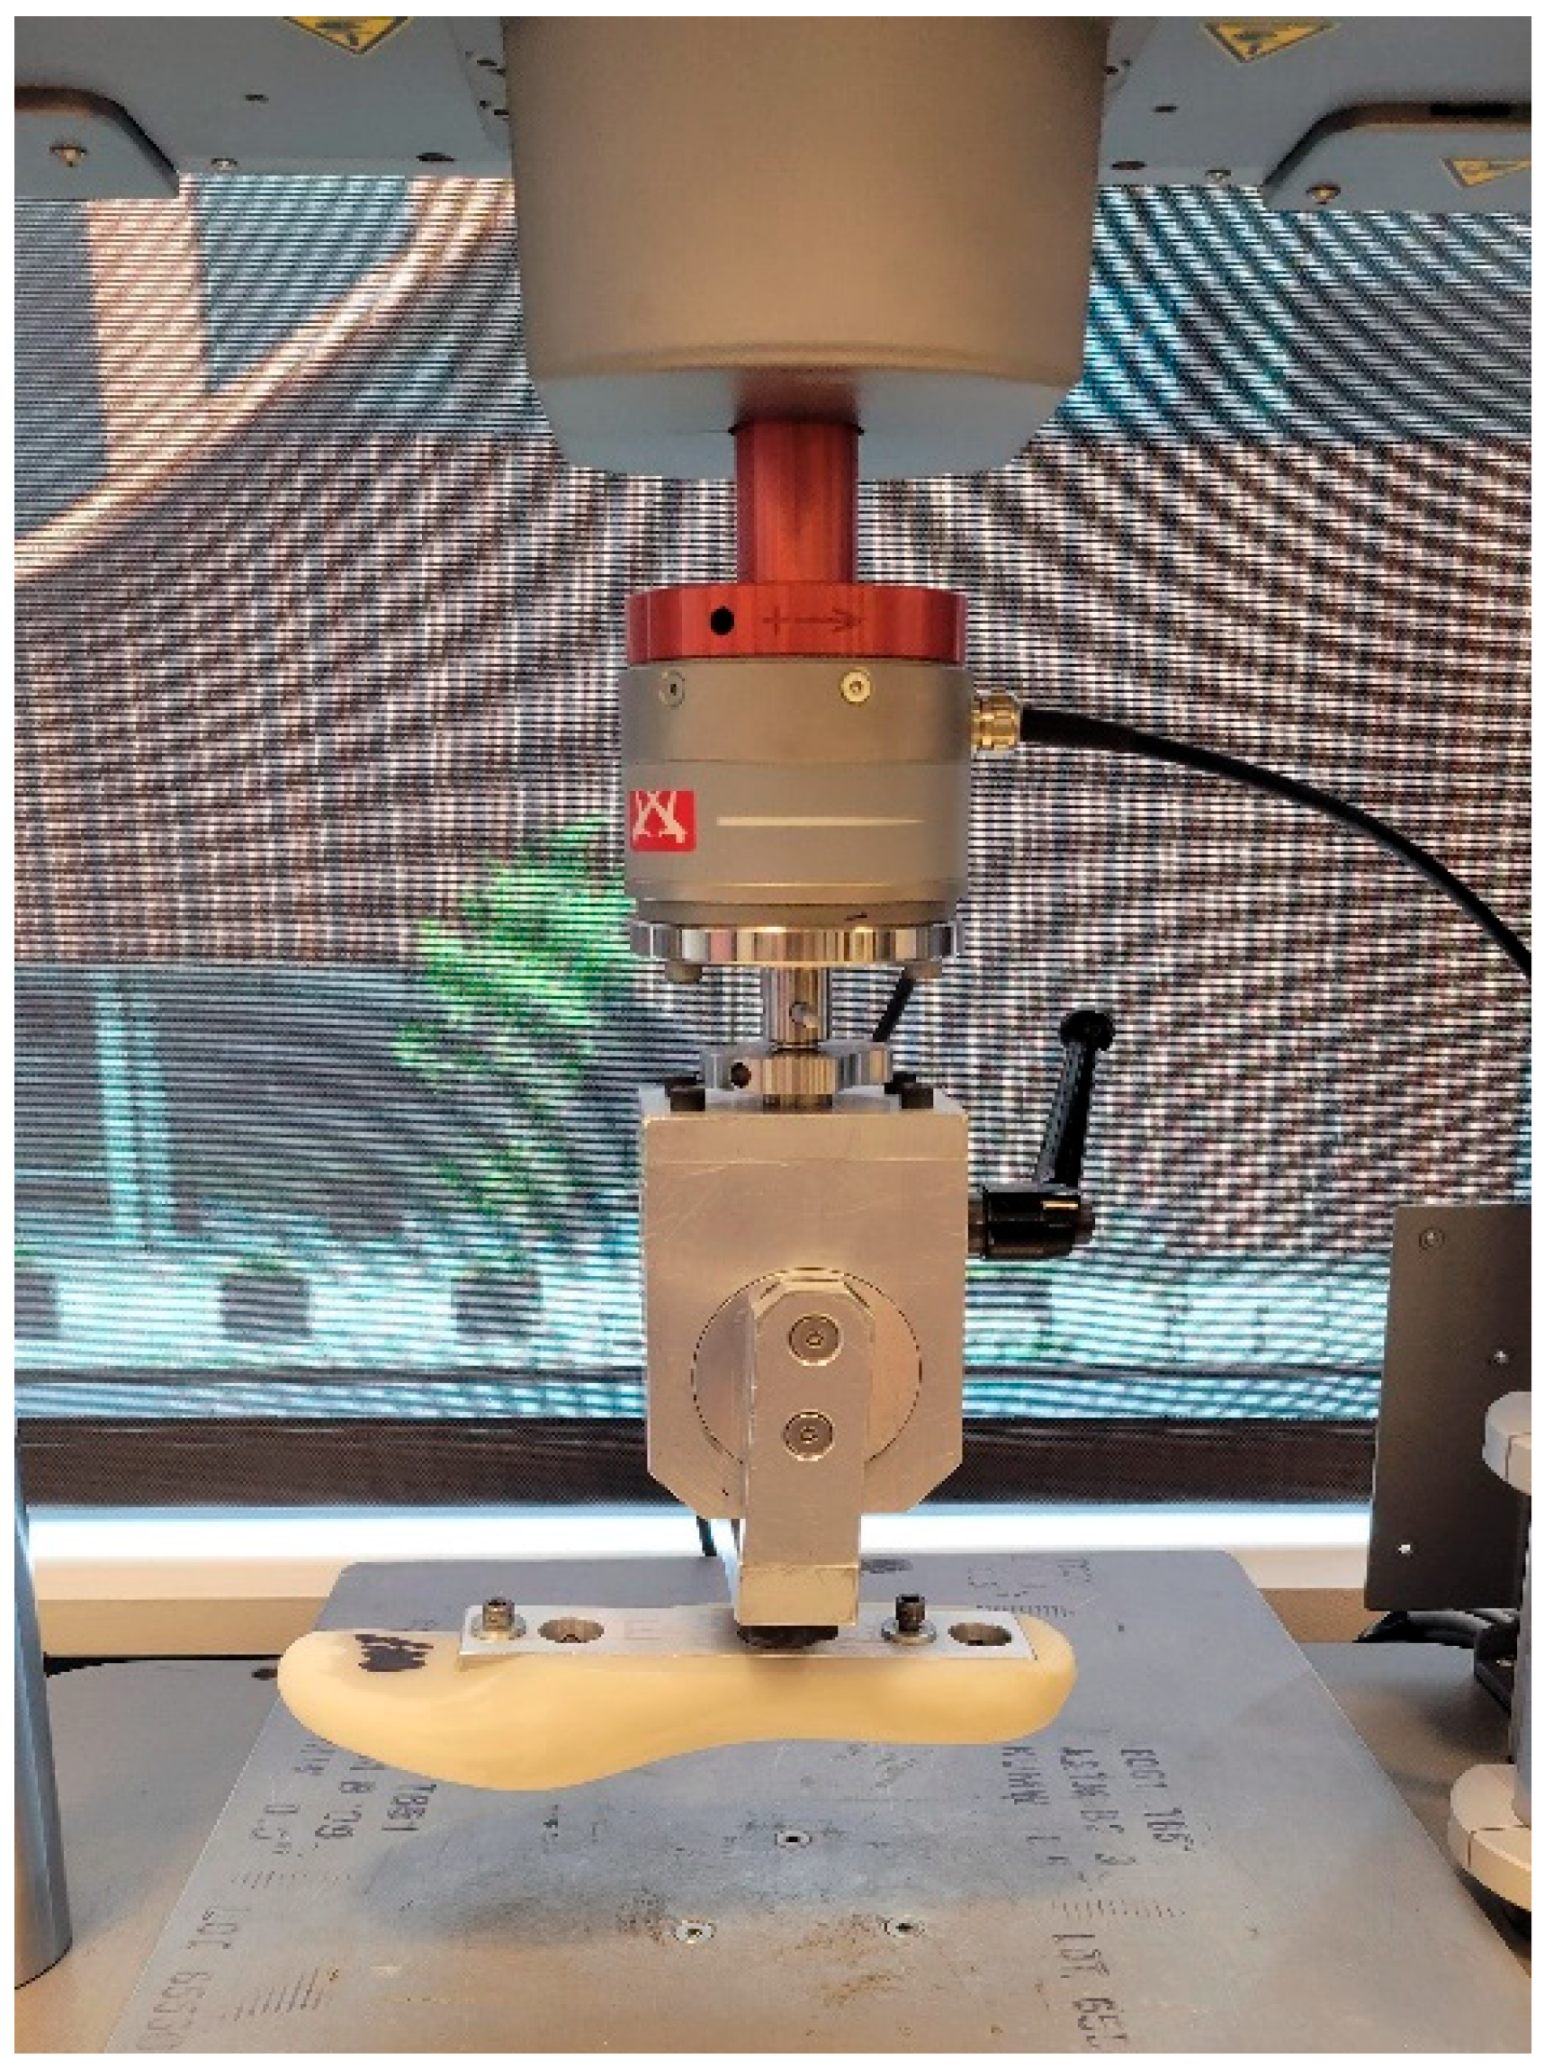
Impact attenuation was evaluated with a custom adaptation of ASTM F1614 Procedure B [11]. Shoes were loaded to a peak force of 1500 N, approximating ~2.5 × body weight for a 60 kg runner [17]. Peak force was constant across test conditions. Each shoe underwent 30 preconditioning impacts at 1.5 Hz to stabilise foam response, followed immediately by 25 recorded impacts for data collection at each impact frequency (1.5, 1.75, 2.0, 2.25, and 2.5 Hz). The order of frequency conditions was balanced across shoe constructions, with the testing sequence of intermediate frequencies (1.75 and 2.25 Hz) alternated between ascending and descending order, to avoid confounding frequency effects with cumulative loading history. Testing was performed using an Instron ElectroPuls E3000 electrodynamic machine (Instron, Norwood, MA, USA) with closed-loop control of force and displacement. Each loading cycle consisted of a sinusoidal force profile cycling between a minimum preload of approximately 50 N and a peak force of 1500 N. Increasing impact frequency shortened the total cycle period proportionally while maintaining the same waveform shape. Each shoe was loaded beneath a female US size 8.5 last to replicate a typical foot shape (Figure 1).
Figure 1.
Instron ElectroPuls E3000 electrodynamic machine with a size 8.5 (US) women’s shoe last attached.
This protocol was designed to characterise the intrinsic mechanical properties of the midsole under controlled loading conditions rather than to simulate the full complexity of ground reaction forces during human running. The last was set at zero degrees of flexion to load the midsole. Outcome measures included vertical compression stiffness, energy absorption, energy return, energy loss, and peak displacement. Stiffness was calculated as the slope between 70% and 90% of peak load on the loading portion of the force-displacement curve, expressed in N·mm−1. This range captures the quasi-linear region of the loading curve, avoiding the nonlinear toe region at low loads and the densification zone near peak force, consistent with methods used in footwear stiffness evaluation [18]. Energy absorption (J) was obtained by trapezoidal numerical integration of the loading curve. Energy return was determined by integrating the unloading curve and was reported in joules (J) and as a percentage of loading work. Hysteresis (energy loss) was calculated as the difference between loading and unloading work, expressed in joules and as a percentage (100 minus the energy return percentage). Peak displacement was the maximum compression at peak load. Laboratory conditions were maintained at 21 °C and 49% relative humidity throughout testing. Stiffness, peak displacement, and energy return percentage were selected as primary outcomes for statistical modelling; energy absorption and hysteresis were used to detect outliers.
2.2. Data Processing
The raw force-displacement data from the Instron testing system were processed using a custom R script (version 4.3.1; R Foundation for Statistical Computing, Vienna, Austria). For each of the five test frequencies, 25 loading impacts were recorded; impacts 1–5 were excluded to allow for viscoelastic settling after frequency transitions, yielding impacts 6–25 (20 impacts per frequency) for analysis.
Outliers were identified within each shoe construction using the interquartile range (IQR) method (values exceeding 1.5 × IQR beyond Q1 or Q3), applied separately to peak force, stiffness, peak displacement, hysteresis, and energy absorbed. Preliminary inspection confirmed that the removal thresholds aligned with visible anomalies in force-displacement curves. A total of 43 impacts (7.2%) were removed as outliers, with the distribution of removals across shoe constructions and frequencies detailed in Table 2. This preprocessing yielded a final dataset of 557 observations across six shoe constructions and five impact frequencies.
Table 2.
Summary of impacts removed during data preprocessing by shoe construction.
2.3. Statistical Analysis
A linear mixed-effects model was used to analyse the effects of midsole material, stack height, and impact frequency on mechanical outcome measures. The outcome variables included stiffness, peak displacement, and energy return percentage. Two models were fitted: Model 1 assessed the effects of material type (EVA vs. PEBA), stack height (34.5 mm vs. 40.5 mm), and impact frequency across the four shoe constructions sharing the same foam hardness. Model 2 examined PEBA exclusively to assess the effects of midsole hardness (37 vs. 50 Asker C), stack height, and impact frequency. In both models, shoe construction was included as a random intercept to account for repeated measures within each shoe. Impact cycle number was included as a continuous covariate (centred at cycle 6, the first retained cycle) to account for systematic within-test changes in mechanical response across the 20 loading impacts per frequency condition.
In both models, material (or hardness) and stack height were included as categorical fixed effects (Model 1 reference: EVA, 40.5 mm; Model 2 reference: 37 Asker C, 40.5 mm). Impact frequency was modelled as a categorical fixed effect with five levels (1.5, 1.75, 2.0, 2.25, and 2.5 Hz). For each outcome, a baseline random-intercept model containing only the cycle covariate was first fitted. Each candidate predictor (material or hardness, stack height, and frequency) was then screened individually against this baseline; univariable coefficient estimates are reported in Appendix A Table A1 and Table A2. Candidate predictors were identified a priori based on biological plausibility. Predictors with p < 0.2 in the univariable analysis were entered as candidates into a forward selection process. Only predictors that significantly improved model fit, based on a chi-squared likelihood ratio test (p < 0.05) and confirmed by Akaike Information Criterion (AIC) comparison, were retained in the final models. This approach evaluates overall model fit improvement rather than individual predictor p-values and is functionally equivalent to information criterion-based selection for nested models.
The variance explained by the shoe random effect was quantified using marginal R2m (variance explained by fixed effects only) and conditional R2c (variance explained by fixed and random effects combined). The difference (R2c − R2m) represents the additional variance attributable to between-shoe differences beyond the named fixed effects. Model assumptions were evaluated by visually inspecting residual plots and testing for normality and homoscedasticity. To examine whether the magnitude of frequency response differed between constructions, shoe-specific frequency slopes were estimated for each outcome. For each shoe, the mean value at each frequency level was computed across all loading cycles, and a linear regression of these frequency-level means against frequency was fitted to obtain a shoe-specific slope (change per 1 Hz). In Model 1, the two shoe slopes within each material group (EVA, PEBA) were averaged to obtain material-level frequency slopes. In Model 2, shoe-specific slopes are reported individually to illustrate the variation in frequency response across the four PEBA constructions, with slopes also averaged by hardness group for comparison. To test whether the rate of frequency response differed between groups, a frequency × group interaction term was fitted in a linear mixed-effects model using all individual observations, with impact cycle number as a covariate and shoe construction as a random intercept. The interaction p-value indicates whether the slopes differ significantly between groups. All statistical calculations were performed using RStudio (version 4.3.1; R Foundation for Statistical Computing, Vienna, Austria) with statistical significance set at p < 0.05.
3. Results
3.1. Descriptive Results
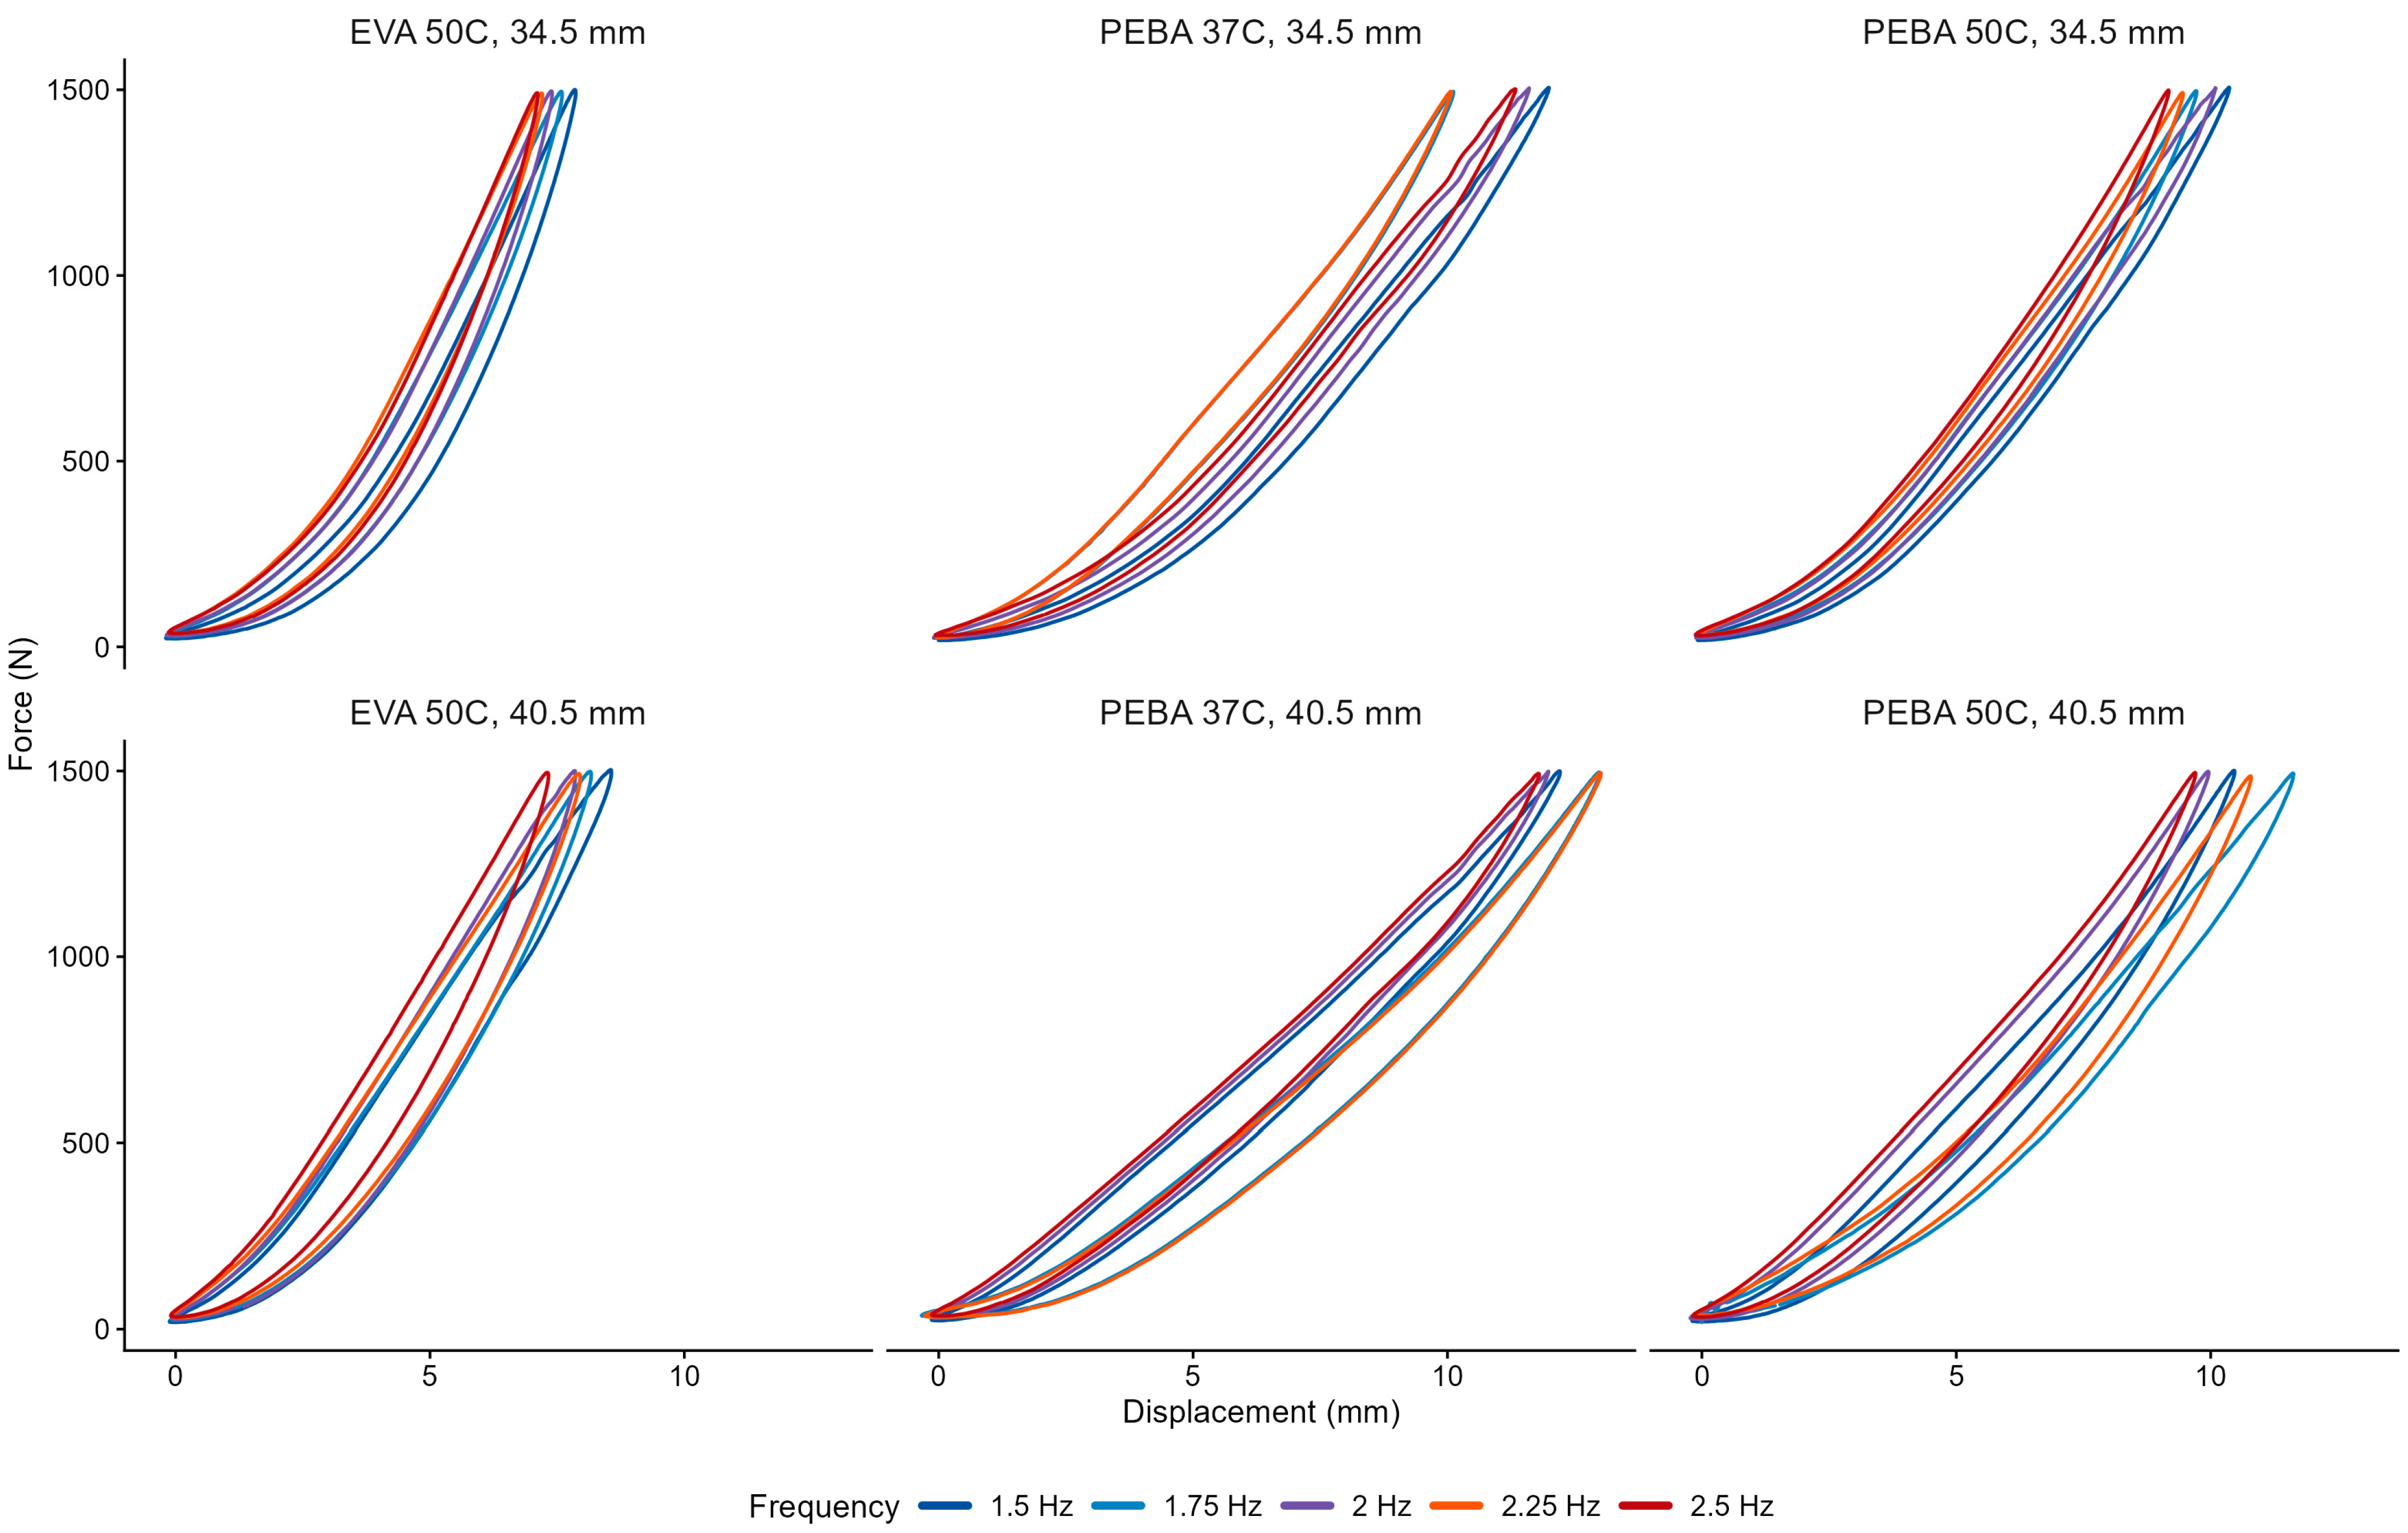
Descriptive statistics for stiffness, peak displacement, and energy return percentage across six shoe constructions and five impact frequencies are presented in Table 3. Representative force-displacement hysteresis at five impact frequencies (1.5–2.5 Hz) for each shoe construction are presented in Appendix A Figure A1.
Table 3.
Descriptive statistics (mean ± SD) for mechanical properties in 6 female US size 8.5 shoes at 5 different impact frequencies.
3.2. Model 1: Material Comparison (EVA vs. PEBA)
Fixed-effect coefficients from the final models are presented in Table 4. Univariable coefficient estimates are provided in Appendix A Table A1. The shoe random effect accounted for most of the total variance across all outcomes, with intraclass correlation coefficients (ICCs) ranging from 0.902 to 0.981, indicating that repeated measurements within each shoe were highly similar and that between-shoe differences were large.
Table 4.
Mixed-effects model coefficients for stiffness, peak displacement, and energy return. Reference levels: 1.5 Hz (frequency), EVA (material, Model 1), 37 Asker C (hardness, Model 2), 40.5 mm stack height. R2m = marginal R2 (fixed effects); R2c = conditional R2 (fixed + random effects); ICC = intraclass correlation coefficient.
3.2.1. Stiffness
Stiffness increased with impact frequency, with coefficients at each frequency level significantly greater than the 1.5 Hz reference (all p ≤ 0.015; Table 4).
3.2.2. Peak Displacement
Peak displacement decreased at higher frequencies relative to 1.5 Hz (Table 4). PEBA shoes displaced more than EVA shoes (p = 0.034), consistent with the lower stiffness of PEBA constructions. This was the outcome for which the fixed effects captured the greatest share of total variance (R2m = 0.848), with material and frequency together explaining the majority of observed differences between constructions.
3.2.3. Energy Return Percentage
3.3. Model 2: PEBA Hardness Comparison
Fixed-effect coefficients from the PEBA-only model are presented in Table 4 and univariable screening results in Appendix A Table A2. The random effect of the shoe accounted for most (76.6–98.4%) of the total variance across outcomes. Fixed effects alone explained between 0.3% (energy return) and 43.8% (peak displacement) of variance (R2m), while the full model explained 81.2–98.7% of variance (Table 4). The cycle covariate was significant for all three outcomes (all p < 0.001), with stiffness, peak displacement, and energy return each increasing across successive loading impacts.
3.3.1. Stiffness
Stiffness increased with frequency across all PEBA constructions (all p < 0.001; Table 4). Neither hardness nor stack height were retained in the model.
3.3.2. Peak Displacement
3.3.3. Energy Return Percentage
Energy return decreased with frequency at all levels (Table 4). Neither hardness nor stack height were retained in the model.
3.4. Shoe-Specific Frequency Slopes
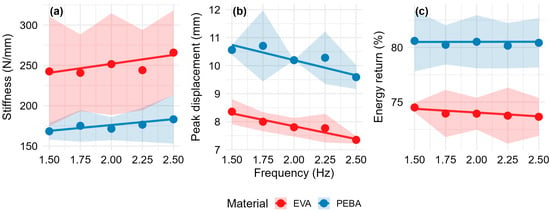
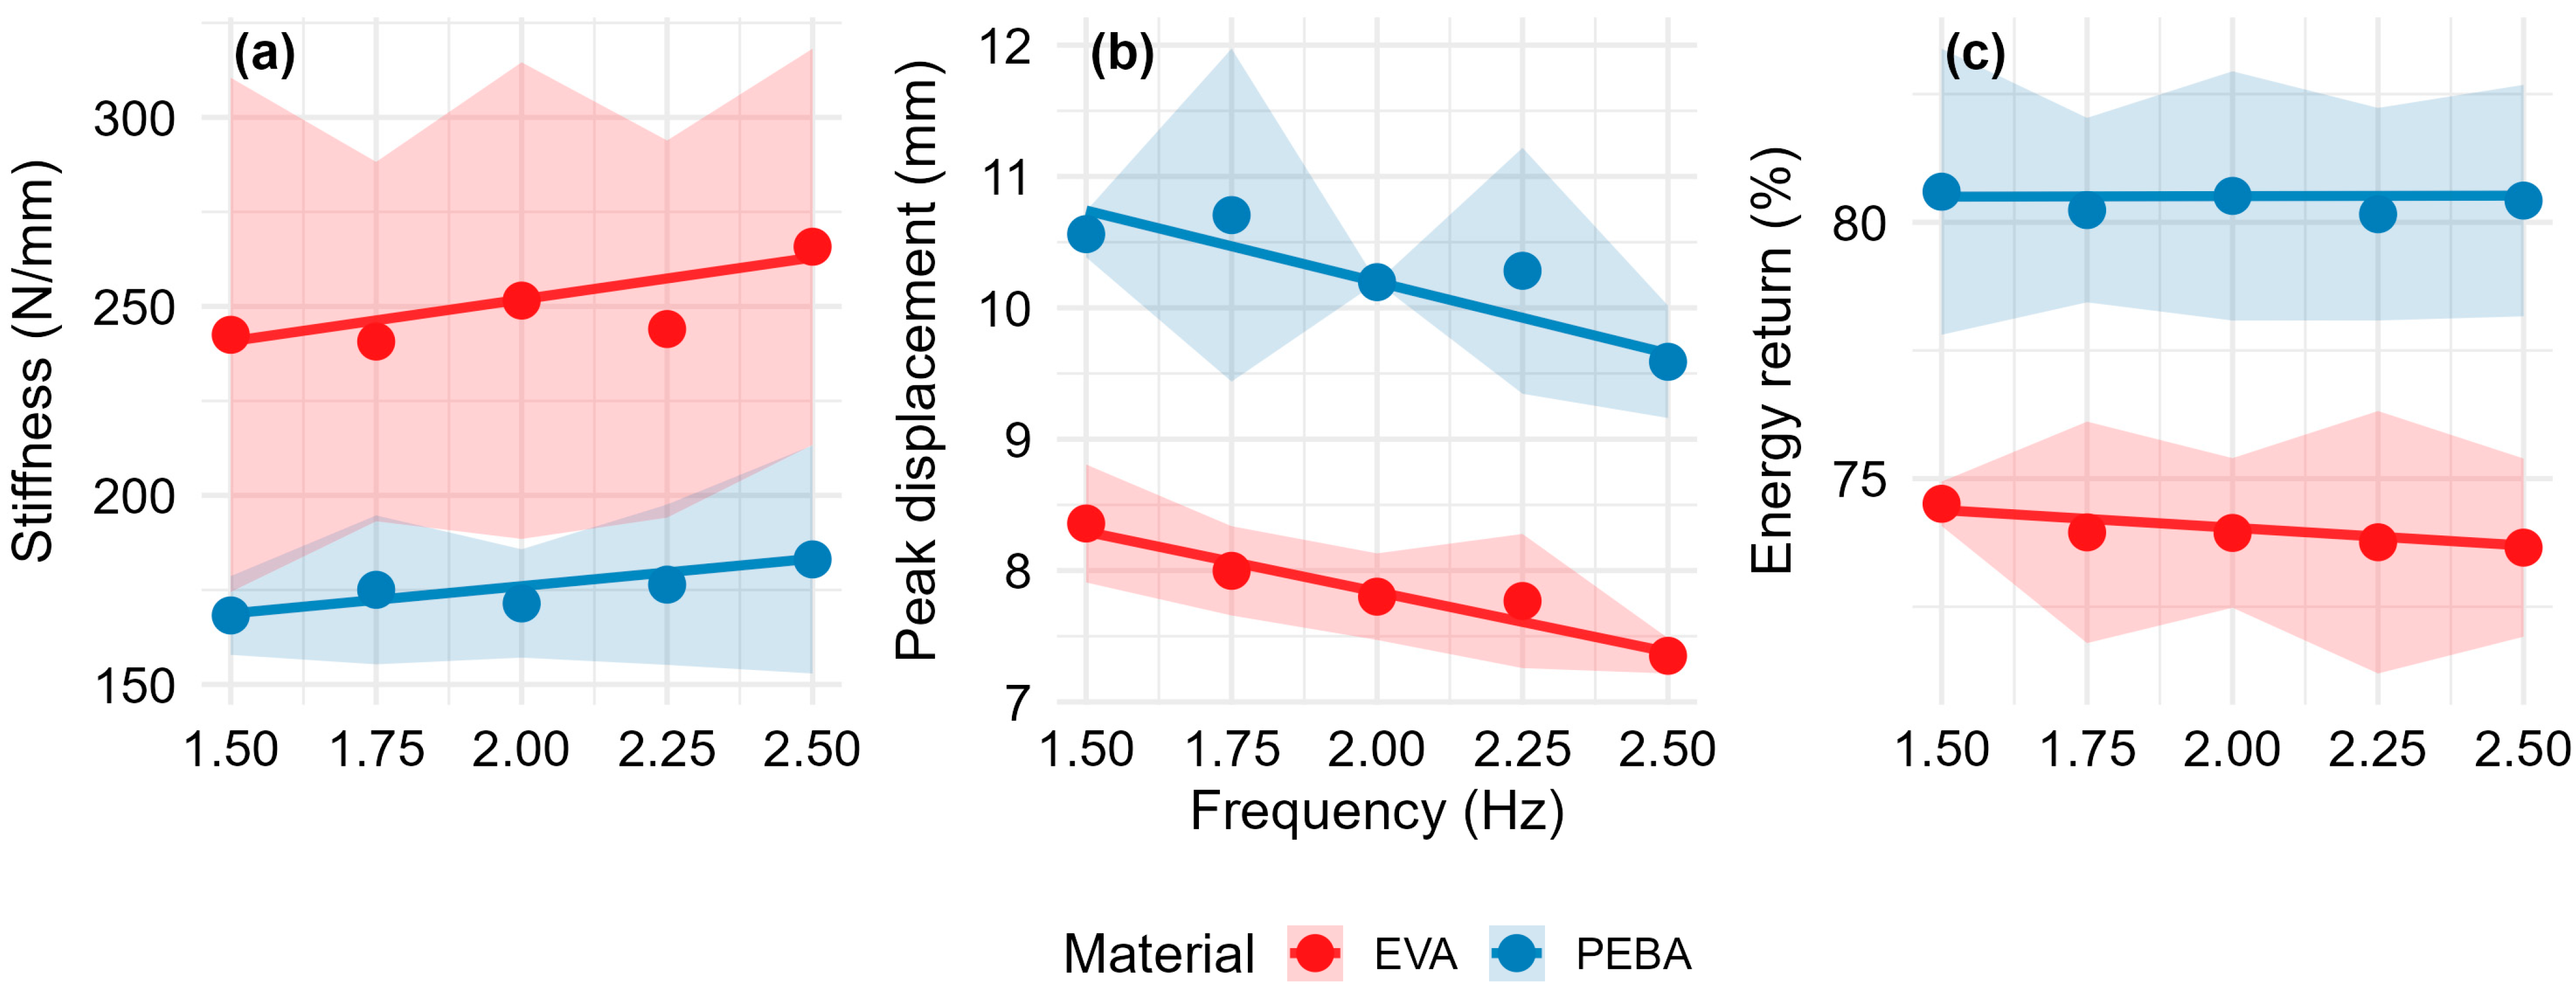
Shoe-specific frequency slopes averaged by material for Model 1 are presented in Figure 2. EVA constructions showed a steeper mean stiffness increase with frequency than PEBA (19.97 vs. 12.41 N·mm−1 per Hz; p = 0.001). Energy return declined more steeply in EVA than PEBA (−0.76 vs. −0.17% per Hz; p < 0.001). Peak displacement decreased at a similar rate for both materials (−0.90 vs. −0.95 mm per Hz; p = 0.206).
Figure 2.
Shoe-specific frequency slopes averaged by material for Model 1 (EVA vs. PEBA at matched 50 Asker C hardness). Markers represent group means at each frequency; lines represent ordinary least squares regressions. Shaded bands represent ± 1 SD between the two shoes within each group. Panels show stiffness (a), peak displacement (b), and energy return (c).
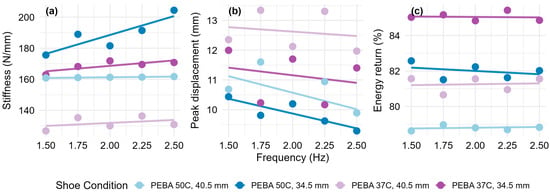
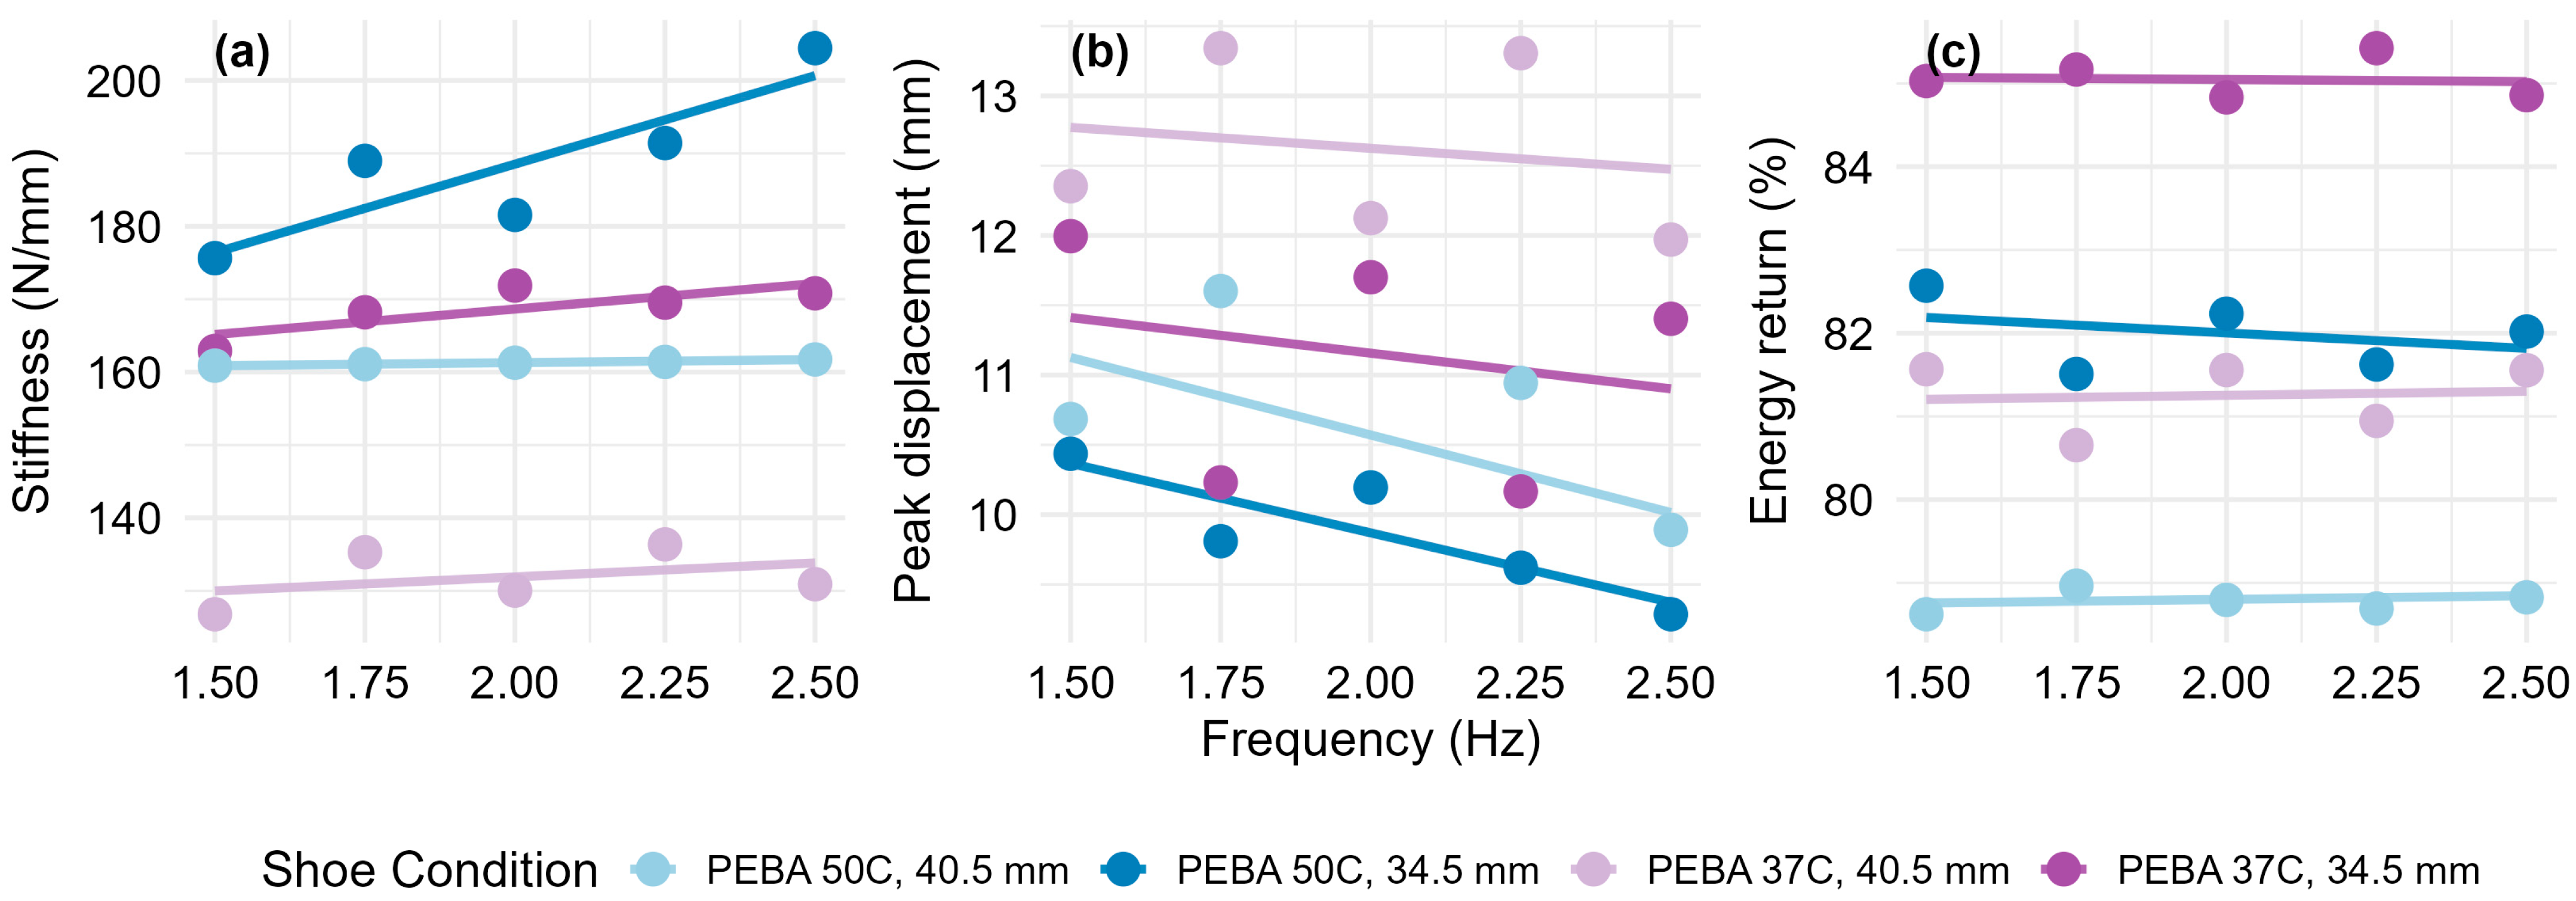
Shoe-specific frequency slopes for Model 2 are presented individually in Figure 3. For stiffness, individual shoe slopes were 6.85 and 3.72 N·mm−1 per Hz for PEBA 37 (34.5 and 40.5 mm) and 24.02 and 0.81 N·mm−1 per Hz for PEBA 50 (34.5 and 40.5 mm), with slopes differing significantly between hardness groups (p < 0.001). For peak displacement, individual shoe slopes were −0.50 and −0.32 mm per Hz for PEBA 37 (34.5 and 40.5 mm) and −1.00 and −0.90 mm per Hz for PEBA 50 (34.5 and 40.5 mm), with slopes differing significantly between hardness groups (p < 0.001). For energy return, individual shoe slopes were −0.03 and 0.11% per Hz for PEBA 37 (34.5 and 40.5 mm) and −0.39 and 0.05% per Hz for PEBA 50 (34.5 and 40.5 mm), with no difference between hardness groups (p = 0.064).
Figure 3.
Shoe-specific frequency slopes for Model 2 (PEBA hardness comparison: 37 vs. 50 Asker C). Markers represent individual shoe means at each frequency; lines represent ordinary least squares regressions with the slope indicating the change in each outcome per 1 Hz. Solid lines denote 34.5 mm stack height; dashed lines denote 40.5 mm stack height. Panels show stiffness (a), peak displacement (b), and energy return (c).
4. Discussion
This study examined how impact frequency influenced the mechanical response of running shoes with EVA or PEBA midsoles under controlled loading conditions. Across the six shoe constructions tested, impact frequency was a consistent determinant of mechanical behaviour. Stiffness increased, peak displacement decreased, and energy return decreased as frequency increased. However, between-shoe baseline differences explained most of the total variance across outcomes. This indicates that shoe construction remained the dominant determinant of absolute midsole behaviour. From a mechanical testing perspective, this is important because single-frequency protocols may not capture the range of mechanical behaviours a shoe exhibits across use-relevant frequencies.
The first hypothesis, that increasing impact frequency would lead to higher stiffness, reduce peak displacement, and reduce energy return, was supported. Energy return also decreased significantly with frequency, although the magnitude of change was small. The second hypothesis, that PEBA midsoles would show smaller frequency-dependent changes than EVA, was partially supported. Shoe-specific frequency slopes indicated that EVA constructions stiffened more rapidly with increasing frequency than PEBA and showed a steeper decline in energy return. However, the rate of displacement change was similar for both materials. The third hypothesis, that thicker midsoles would reduce the magnitude of frequency-related changes, was not clearly supported. Within the PEBA constructions, thicker shoes (40.5 mm) had shallower stiffness slopes than thinner shoes (34.5 mm) in both hardness groups. In contrast, the opposite pattern was observed in EVA, with the thicker shoe having a steeper stiffness slope than the thinner shoe. With only two shoes per group, these observations are descriptive and should be regarded as exploratory. The cycle covariate was significant for stiffness and peak displacement in both models, with both increasing across successive impacts. This is consistent with progressive within-test conditioning [3,19].
The increase in stiffness with impact frequency is consistent with the viscoelastic behaviour of polymer foams. Under faster loading, the deformation of cellular materials occurs over shorter time scales, increasing resistance to compression and producing a higher apparent stiffness [6]. The absolute stiffness may reflect distinct deformation mechanisms within the two foam materials. EVA deforms through compression of its closed-cell structure, including entrapped gas and polymer walls [20], whereas PEBA deforms primarily through elastic deformation within its alternating hard- and soft-segment architecture [8,21]. Despite these distinct deformation mechanisms, the frequency effect was consistent across all constructions. Shoe-specific frequency slopes revealed that EVA stiffened more rapidly with increasing frequency than PEBA, suggesting that the rate of frequency-dependent stiffening may differ between materials.
Peak displacement decreased as impact frequency increased, reflecting the increased apparent stiffness limiting midsole compression under faster loading. In Model 1, material type was the only additional predictor retained beyond frequency and cycle number, with PEBA shoes displacing approximately 2.4 mm more than EVA shoes. This finding is consistent with the lower stiffness of PEBA constructions and aligns with the higher compliance reported for PEBA-based midsoles [22]. In Model 2, the reduction in displacement was not uniform across frequency. No difference was observed between 1.5 Hz and 1.75 Hz, whereas significant reductions were observed at 2.0 Hz and progressively larger reductions at 2.25 and 2.5 Hz. This pattern suggests that at lower frequencies, the interval between impacts provides sufficient time for molecular relaxation, whereas at higher frequencies, shortened inter-impact intervals restrict recovery and reduce deformation [6]. Within PEBA constructions, hard foam (50 Asker C) displaced less than softer foam (37 Asker C). Hardness was retained as a predictor for peak displacement only.
PEBA returned more energy than EVA across all frequencies and stack heights, which is consistent with previous literature [8,22,23]. Frequency had a significant effect on energy return in both models, but the practical magnitude was modest. Within-material variation across the full frequency range averaged less than one percentage point. PEBA showed smaller reductions in energy return across frequencies than EVA. This likely reflects the greater elastic recovery properties of PEBA foams [8,21]. Within PEBA constructions, the harder foams (50 Asker C) displaced less than the softer foams (37 Asker C), with hardness retained as a predictor of peak displacement only, not for stiffness or energy return. The harder PEBA constructions were also 6–16 g lighter than the softer constructions at matched stack heights (Table 1) but did not demonstrate superior energy return. This is consistent with previous work showing that increasing the proportion of hard segments within PEBA foams increases compressive strength but can reduce rebound [21]. This suggests that the mechanical consequences of material hardness may offset some of the theoretical advantages of reduced mass [24].
The present findings have methodological implications for the evaluation of running shoe midsoles. Standard testing protocols such as ASTM F1614 and ASTM F1976 [11,12] prescribe fixed loading conditions and report summary metrics from single-energy impacts. The same shoe construction tested at 1.5 Hz and 2.5 Hz can produce meaningfully different stiffness and displacement values. This indicates that impact frequency should be considered a key parameter in mechanical testing protocols rather than being fixed at a single condition. Testing across multiple frequencies may provide a more representative assessment of how midsoles behave across the range of impact frequencies encountered at different running speeds. It should be noted, however, that the sinusoidal loading profile used in this study does not replicate the shape, duration, or force magnitude variation in ground reaction forces during running. The present protocol was designed to isolate the intrinsic rate sensitivity of the midsole under controlled conditions. Further work is required to determine whether the frequency-dependent mechanical differences translate to human movement.
Several limitations should be acknowledged. Only one shoe per configuration was tested, so between-shoe manufacturing variability could not be assessed directly. Although shoe-specific frequency slopes revealed significant differences in the rates of stiffening and energy-return decline between EVA and PEBA, with only two shoes per material group, these comparisons are constrained by limited replication and should be interpreted as exploratory. Testing was performed at 21 °C in a controlled lab setting. Midsole temperatures can increase up to 13 °C above ambient during running [25], but this varies with environmental conditions. In-shoe temperatures were not measured in this study, leaving the potential impact of temperature on viscoelastic properties as a confounding factor. The settling period following frequency transitions may also influence results, and the optimal duration has not been established. Shoes were mounted on a rigid last with zero flexion, which does not replicate the three-dimensional force patterns occurring during running. Finally, the constant peak force of 1500 N does not capture the variation in ground reaction force magnitude and rate that accompanies changes in a person’s speed. Nonetheless, the controlled laboratory conditions and standardised loading protocol enabled consistent comparison across constructions and frequencies. The use of matched shoe geometry further ensured that observed differences were attributable to midsole properties rather than confounding structural variation.
Future research should prioritise human running trials across a range of speeds to determine whether the frequency-dependent mechanical differences observed here translate into measurable biomechanical changes. Expanding the force range to reflect the full spectrum of ground reaction forces encountered at different running speeds would further strengthen the link between mechanical testing and in-person performance.
5. Conclusions
This study demonstrates that impact frequency is a consistent and statistically significant determinant of the mechanical behaviour of running shoe midsoles. Across both EVA and PEBA constructions, increasing impact frequency from 1.5 to 2.5 Hz produced higher vertical stiffness, reduced peak displacement, and small but significant reductions in energy return percentage. This protocol maintained a constant peak force of 1500 N, thereby isolating the effect of loading rate from concurrent changes in force magnitude that accompany increases in running speed. The present findings, therefore, characterise the isolated frequency response of the midsole under controlled laboratory conditions and should not be interpreted as a direct simulation of speed-dependent running mechanics. Between-shoe baseline differences accounted for most of the variance in stiffness and energy return, whereas fixed effects, particularly frequency and material, explained a substantial share of variance in peak displacement. These results support the use of multi-frequency testing protocols when characterising midsole mechanical properties, as the mechanical response of a given construction varies meaningfully across the range of frequencies representative of running speeds spanning approximately 10–18 km·h−1.
Author Contributions
Conceptualization, D.S., K.A.L., C.W.R. and D.J.C.; methodology, D.S., K.A.L., C.W.R., D.J.C. and J.S.G.; software, D.S. and K.A.L.; validation, D.S. and K.A.L.; formal analysis, D.S. and K.A.L.; investigation, D.S. and K.A.L.; resources, D.S. and K.A.L.; data curation, D.S. and K.A.L.; writing—original draft preparation, D.S., K.A.L., C.W.R. and D.J.C.; writing—review and editing, D.S., K.A.L., C.W.R. and D.J.C.; visualization, D.S., K.A.L., C.W.R. and D.J.C.; supervision, K.A.L., C.W.R. and D.J.C. All authors have read and agreed to the published version of the manuscript.
Funding
This research received no external funding.
Institutional Review Board Statement
Not applicable.
Informed Consent Statement
Not applicable.
Data Availability Statement
The data presented in this study are available on request from the corresponding author.
Acknowledgments
The authors thank New Balance for providing the footwear used in this study and for access to laboratory facilities.
Conflicts of Interest
Author J.S.G. is employed by New Balance. The remaining authors declare no conflicts of interest. New Balance had no role in the design of the study, in the collection, analyses, or interpretation of data.
Appendix A
Table A1.
Univariable screening for Model 1 (EVA vs. PEBA at matched 50 Asker C hardness; 4 shoe constructions, N = 364). Baseline model: cycle covariate + random intercept for shoe construction. Reference levels: EVA, 40.5 mm, 1.5 Hz.
Table A2.
Univariable screening for Model 2 (PEBA hardness comparison: 37 vs. 50 Asker C; 4 shoe constructions, N = 373). Baseline model: cycle covariate + random intercept for shoe construction. Reference levels: 37 Asker C, 40.5 mm, 1.5 Hz.
Figure A1.
Representative force-displacement hysteresis loops (cycle 15) for each shoe construction at five impact frequencies (1.5–2.5 Hz). (Top) row: 34.5 mm stack height; (bottom) row: 40.5 mm stack height. Increasing frequency produced steeper loading curves (higher stiffness) and reduced peak displacement across all constructions, with greater frequency-dependent separation observed in EVA than PEBA constructions.
References
- Even-Tzur, N.; Weisz, E.; Hirsch-Falk, Y.; Gefen, A. Role of EVA viscoelastic properties in the protective performance of a sport shoe: Computational studies. Biomed. Mater. Eng. 2006, 16, 289–299. [Google Scholar]
- Waskiewicz, Z.; Akbas, A.; Grzywacz, T.; Borysiuk, Z. Footwear technology and biomechanical adaptations in ultramarathon running: A PRISMA-Guided narrative review integrating direct and laboratory evidence. Front. Bioeng. Biotechnol. 2025, 13, 1642555. [Google Scholar] [CrossRef] [Scilit]
- Shorten, M.R. Energy return in footwear–revisited. Footwear Sci. 2024, 16, 149–162. [Google Scholar] [CrossRef] [Scilit]
- Malisoux, L.; Napier, C.; Gette, P.; Delattre, N.; Theisen, D. Reference Values and Determinants of Spatiotemporal and Kinetic Variables in Recreational Runners. Orthop. J. Sports Med. 2023, 11, 23259671231204629. [Google Scholar] [CrossRef] [Scilit]
- Weyand, P.G.; Sternlight, D.B.; Bellizzi, M.J.; Wright, S. Faster top running speeds are achieved with greater ground forces not more rapid leg movements. J. Appl. Physiol. 2000, 89, 1991–1999. [Google Scholar] [CrossRef] [Scilit] [PubMed]
- Wu, J.; Lu, F.; Chen, J.; Wang, M. A One-Dimensional Dynamic Constitutive Modeling of Ethylene Vinyl Acetate (EVA) Foam. Polymers 2023, 15, 4514. [Google Scholar] [CrossRef] [Scilit]
- Liu, D.-S.; Chen, Z.-H.; Tsai, C.-Y.; Ye, R.-J.; Yu, K.-T. Compressive mechanical property analysis of EVA foam: Its buffering effects at different impact velocities. J. Mech. 2017, 33, 435–441. [Google Scholar] [CrossRef] [Scilit]
- Wang, G.; Zhao, G.; Dong, G.; Mu, Y.; Park, C.B.; Wang, G. Lightweight, super-elastic, and thermal-sound insulation bio-based PEBA foams fabricated by high-pressure foam injection molding with mold-opening. Eur. Polym. J. 2018, 103, 68–79. [Google Scholar] [CrossRef] [Scilit]
- Rodrigo-Carranza, V.; Hoogkamer, W.; Gonzalez-Rave, J.M.; Horta-Munoz, S.; Serna-Moreno, M.D.C.; Romero-Gutierrez, A.; Gonzalez-Mohino, F. Influence of different midsole foam in advanced footwear technology use on running economy and biomechanics in trained runners. Scand. J. Med. Sci. Sports 2024, 34, e14526. [Google Scholar] [CrossRef] [Scilit]
- Mohammadi, M.M.; Nourani, A. Testing the effects of footwear on biomechanics of human body: A review. Heliyon 2025, 11, e42870. [Google Scholar] [CrossRef] [Scilit]
- ASTM F1614-99; Standard Test Method for Shock Attenuating Properties of Materials Systems for Athletic Footwear. ASTM International: West Conshohocken, PA, USA, 2006.
- ASTM F1976-06; Standard Test Method for Impact Attenuation Properties of Athletic Shoes Using an Impact Test. ASTM International: West Conshohocken, PA, USA, 2006.
- Aimar, C.; Orgeas, L.; Rolland du Roscoat, S.; Bailly, L.; Ferre Sentis, D. Compression fatigue of elastomeric foams used in midsoles of running shoes. Footwear Sci. 2024, 16, 93–103. [Google Scholar] [CrossRef] [Scilit]
- Burns, G.T.; Joubert, D.P. Running Shoes of the Postmodern Footwear Era: A Narrative Overview of Advanced Footwear Technology. Int. J. Sports Physiol. Perform. 2024, 19, 975–986. [Google Scholar] [CrossRef] [Scilit]
- ASTM D2240-21; Standard Test Method for Rubber Property—Durometer Hardness. ASTM International: West Conshohocken, PA, USA, 2021.
- World Athletics. Athletic Shoe Regulations (Technical Rule 5: Shoes); World Athletics: Monaco, Monaco, 2021. [Google Scholar]
- Lieberman, D.E.; Venkadesan, M.; Werbel, W.A.; Daoud, A.I.; D’Andrea, S.; Davis, I.S.; Mang’eni, R.O.; Pitsiladis, Y. Foot strike patterns and collision forces in habitually barefoot versus shod runners. Nature 2010, 463, 531–535. [Google Scholar] [CrossRef] [Scilit] [PubMed]
- Cigoja, S.; Fletcher, J.R.; Nigg, B.M. Can changes in midsole bending stiffness of shoes affect the onset of joint work redistribution during a prolonged run? J. Sport Health Sci. 2022, 11, 293–302. [Google Scholar] [CrossRef] [Scilit]
- Verdejo, R.; Mills, N. Simulating the effects of long distance running on shoe midsole foam. Polym. Test. 2004, 23, 567–574. [Google Scholar] [CrossRef] [Scilit]
- Chen, H.; Sun, D.; Gao, L.; Liu, X.; Zhang, M. Mechanical behavior of closed-cell ethylene-vinyl acetate foam under compression. Polymers 2024, 16, 34. [Google Scholar] [CrossRef] [Scilit] [PubMed]
- Li, W.; Zhao, G.; Wang, G.; Zhang, L.; Li, X. Study of the microstructure, foaming property and cyclic compression performance of poly(ether-block-amide) foams fabricated by supercritical CO2 foaming. J. Supercrit. Fluids 2023, 202, 106052. [Google Scholar] [CrossRef] [Scilit]
- Hoogkamer, W.; Kipp, S.; Frank, J.H.; Farina, E.M.; Luo, G.; Kram, R. A comparison of the energetic cost of running in marathon racing shoes. Sports Med. 2018, 48, 1009–1019. [Google Scholar] [CrossRef] [Scilit]
- Xu, Z.; Wang, G.; Zhao, J.; Zhang, A.; Zhao, G. Super-elastic and structure-tunable poly (ether-block-amide) foams achieved by microcellular foaming. J. CO2 Util. 2022, 55, 101807. [Google Scholar] [CrossRef] [Scilit]
- Hoogkamer, W.; Kipp, S.; Spiering, B.A.; Kram, R. Altered Running Economy Directly Translates to Altered Distance-Running Performance. Med. Sci. Sports Exerc. 2016, 48, 2175–2180. [Google Scholar] [CrossRef] [Scilit]
- Shariatmadari, M.R.; English, R.; Rothwell, G. Effects of temperature on the material characteristics of midsole and insole footwear foams subject to quasi-static compressive and shear force loading. Mater. Des. 2012, 37, 543–559. [Google Scholar] [CrossRef] [Scilit]

Disclaimer/Publisher’s Note: The statements, opinions and data contained in all publications are solely those of the individual author(s) and contributor(s) and not of MDPI and/or the editor(s). MDPI and/or the editor(s) disclaim responsibility for any injury to people or property resulting from any ideas, methods, instructions or products referred to in the content. |
© 2026 by the authors. Licensee MDPI, Basel, Switzerland. This article is an open access article distributed under the terms and conditions of the Creative Commons Attribution (CC BY) license.