


Abstract
Visual similarity analysis of ethnic brocades is valuable for image retrieval, style comparison, and digital archiving in cultural heritage informatics. However, although deep neural networks provide powerful visual representations, their encoded similarity structures are often difficult to interpret. This study presents an interpretable deep feature framework for analyzing inter-ethnic visual similarity in brocade images from ten minority groups in Southwest China. Four convolutional neural network backbones, including AlexNet, VGG-16, ResNet-18, and an SE-enhanced ResNet-18 (SResNet-18), were first evaluated to identify a reliable feature extractor. The best-performing model was then used to construct deep feature-based similarity and distance relationships among ethnic categories. To interpret this structure, five handcrafted descriptor types, namely color, texture, geometric, local-structure, and frequency-domain features, were compared with the deep feature similarity matrix using Spearman correlation analysis and weighted descriptor fusion. Experimental results showed that SResNet-18 achieved the best classification performance, with an accuracy of 95.15% and an F1-score of 95.14%. Among the handcrafted descriptors, color showed the strongest correspondence with the RGB-based deep similarity structure (), followed by local-structure descriptors (), whereas classical texture descriptors showed near-zero correspondence (). The optimal weighted fusion further improved the correlation to . These findings suggest that the SResNet-18 feature space is more strongly associated with color composition and local motif organization than with the specific grayscale texture, global geometric, or frequency-domain descriptors used in this study. The proposed framework provides an interpretable approach for understanding deep visual similarity in cultural heritage images and offers methodological support for pattern-based retrieval, comparative style analysis, and digital documentation.
1. Introduction
Some forms of Chinese brocade craftsmanship, such as the craftsmanship of Nanjing Yunjin brocade, have been inscribed on the UNESCO Representative List of the Intangible Cultural Heritage of Humanity [1]. The motifs, color schemes, and weaving techniques of ethnic brocades are often regarded as visual archives that document collective histories and everyday life [2]. From the perspective of digital heritage informatics, image-based analysis provides an important means for documenting, organizing, retrieving, and comparing textile heritage [3,4]. Exploring the visual similarity of brocades across different ethnic groups not only enables quantitative analyses of stylistic affinity in costume studies and art history, but also provides methodological support for the digital preservation of intangible cultural heritage, museum collection management, and cross-ethnic image retrieval.
Visual similarity is a core concept for describing perceptual proximity across multiple dimensions, including color, texture, structure, and semantics. It plays a fundamental role in computer vision and image analysis and has been widely applied in image retrieval [5,6], visual similarity recommendation [7], neural style transfer and image stylization [8], cross-domain image retrieval [9], cultural heritage digitization and retrieval [3,4], as well as clothing recognition and fashion image analysis [10]. For ethnic brocade images, visual similarity analysis is particularly meaningful because visual appearance contains multiple interpretable cues, such as color composition, motif organization, geometric layout, and craft-related pattern regularity. However, most existing digital documentation practices emphasize image collection and metadata description, whereas fewer studies examine how computational visual representations organize stylistic relationships among ethnic textile categories.
Traditional visual similarity metrics can generally be divided into two categories. The first category focuses on image reconstruction and objective quality assessment, including peak signal-to-noise ratio (PSNR) [11], structural similarity index (SSIM) [12], feature similarity index (FSIM) [13], and visual information fidelity (VIF) [14]. These metrics usually assume the availability of a reference image and quantify distortion using low-level attributes such as pixel-wise error, luminance and contrast variation, structural consistency, and gradient- or phase-related information. Although they often correlate well with subjective perception in compression and reconstruction tasks, they do not explicitly capture higher-level semantics such as object category, component composition, or overall style. They are therefore inadequate for characterizing semantic- and style-level similarity in complex images [12,13,14]. The second category is based on content representation. In this paradigm, images are embedded into a multidimensional feature space using handcrafted descriptors, such as color features, texture features, geometric configuration features, and local structural features, and similarity is then measured by distances in this space [15,16]. Compared with reference-based distortion metrics, these methods are more suitable for general similarity measurement across complex patterns and natural images, and they also provide an interpretable basis for analyzing complementary visual dimensions such as color, texture, and structure.
In recent years, deep learning-based image similarity modeling, particularly using convolutional neural networks (CNNs), has become the dominant paradigm. Liu et al. developed DeepFashion, a public dataset for clothing research, which laid an important foundation for the study and application of deep features in apparel images [10]. In ethnic costume recognition, CNNs and their improved variants have been adopted to substantially improve recognition accuracy [17,18]. In general clothing retrieval, CNN features have also been combined with color histograms, texture descriptors, and topological features to enhance retrieval and recommendation performance [19]. Overall, compared with methods relying mainly on low-level cues such as color histograms and edge orientations, CNN-based deep features have demonstrated clear advantages in clothing image retrieval and classification [10,19]. For perceptual similarity modeling, Zhang et al. proposed LPIPS (Learned Perceptual Image Patch Similarity), which measures perceptual distance between image patches by comparing intermediate-layer features extracted from CNNs such as VGG. Based on large-scale human-judgment datasets, they systematically compared deep feature-based metrics with classical measures such as PSNR, SSIM, and FSIM, and showed that deep perceptual metrics align more closely with human visual judgments [20].
Although CNN-based deep features are effective, their learned representations are often difficult to interpret. This limits their explanatory value in cultural heritage studies, where researchers are not only interested in recognition accuracy or retrieval performance, but also in understanding which visual cues support similarity judgments. In this context, explainable artificial intelligence provides a useful perspective for relating learned representations to human-understandable visual attributes. Instead of treating deep features as opaque numerical vectors, interpretable analysis can connect them with visual factors such as color, texture, shape, local motifs, and frequency patterns. However, most existing studies still focus primarily on demonstrating the overall superiority of deep metrics over traditional quality metrics, whereas systematic association analysis between deep features and interpretable handcrafted descriptors remains limited [17,18]. Consequently, it remains unclear, in a quantitative and systematic sense, to what extent deep feature spaces correspond to interpretable visual factors such as color, texture, and geometric configuration.
To address these issues, this study investigates brocade images from ten representative minority groups in Southwest China and presents an interpretable deep feature analysis framework for visual similarity analysis. The framework focuses on computational visual similarity derived from feature representations and examines how such similarity can be interpreted through complementary handcrafted visual descriptors. Representative CNN backbones, including AlexNet, VGG-16, ResNet-18, and an attention-enhanced SResNet-18, were first benchmarked through transfer learning. The best-performing model was then selected as the feature extractor for subsequent similarity analysis. Deep feature prototypes were constructed for each ethnic category and used for inter-ethnic distance analysis with Euclidean, Manhattan, and cosine distances. To improve interpretability, category-level cosine similarity matrices were constructed for the deep features and for five categories of handcrafted descriptors, namely color, texture, geometry, local-structure, and frequency-domain features, to support the subsequent correlation and fusion analyses. Spearman correlation analysis and weighted fusion experiments were then conducted to quantify the extent to which handcrafted descriptors approximate the organization of deep similarity. The main contributions of this study are as follows:
- (1)
- An interpretable deep feature analysis framework is proposed for visual similarity analysis of ethnic brocade images in a digital heritage context.
- (2)
- A curated dataset of ethnic brocade images covering ten minority groups in Southwest China is established for comparative visual analysis.
- (3)
- Four CNN backbones are evaluated under consistent training conditions, and SResNet-18 is selected as the feature extractor for subsequent similarity analysis.
- (4)
- Five types of handcrafted visual descriptors are used to interpret the learned deep feature similarity structure, allowing the visual basis of the model’s similarity organization to be examined.
The remainder of this paper is organized as follows. Section 2 describes the study framework, the ethnic brocade dataset, the CNN backbones, the implementation details, and the handcrafted visual descriptors and distance-based similarity analysis used in this study. Section 3 presents the experimental results, including the comparison of CNN backbone performance and the interpretation of SResNet-18-based similarity using traditional visual descriptors, as well as the distance-based analysis of inter-ethnic brocade similarity and spatial distribution. Section 4 discusses the main findings, implications, and limitations of the study and outlines directions for future research. Finally, Section 5 concludes the paper.
2. Materials and Methods
2.1. Overall Technical Framework
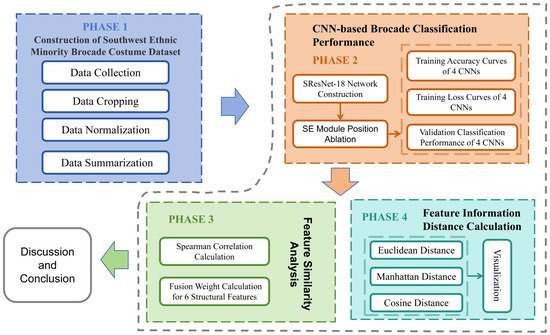
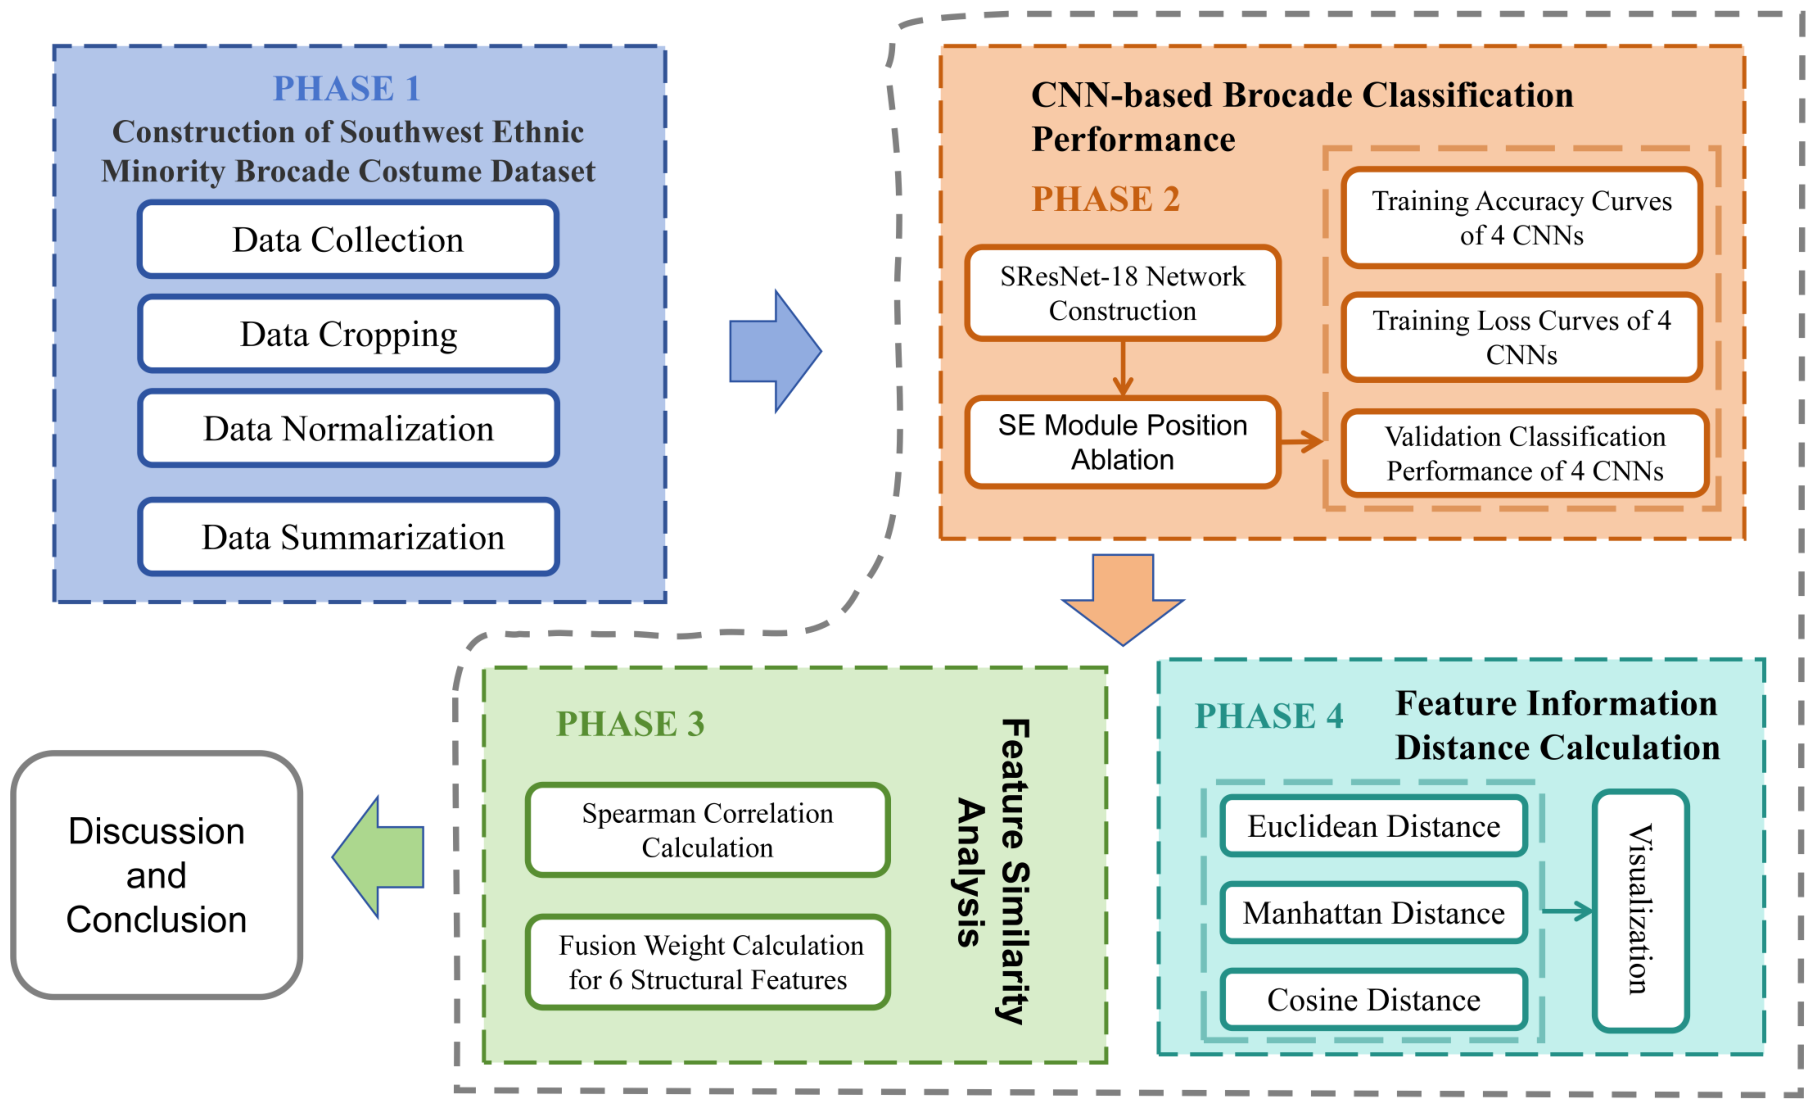
The overall framework of this study consists of four stages (Figure 1): dataset construction, backbone benchmarking, deep feature-based similarity analysis, and descriptor-based interpretation. First, brocade images from ten minority groups in Southwest China were collected, curated, and standardized to construct a balanced ethnic brocade dataset. Second, representative CNN backbones were benchmarked under consistent training settings to identify a reliable feature extractor for subsequent analysis. Third, category-level deep feature prototypes were computed, and inter-ethnic visual relationships were quantified using Euclidean, Manhattan, and cosine distances. Fourth, five categories of handcrafted visual descriptors were constructed to interpret the deep similarity structure from complementary perspectives, including color, texture, geometry, local-structure, and frequency-domain descriptors. This workflow was designed to emphasize the interpretability of inter-ethnic similarity patterns rather than classifier comparison alone, and to support subsequent style analysis, retrieval, and digital documentation of ethnic brocades.
Figure 1.
Overall Framework of the Study.
2.2. Ethnic Brocade Dataset
2.2.1. Image Sources and Acquisition
The ethnic brocade image dataset constructed in this study covers ten representative minority groups in Southwest China, namely the Bai, Dong, Li, Miao, Yi, Zhuang, Shui, Tujia, Yao, and Qiang. The images were collected from two primary sources. The first source consisted of physical brocade artifacts preserved in museums and ethnic cultural research institutions. In these cases, curators either provided original high-resolution images or granted permission for high-resolution photography of representative brocade products, such as garments, shawls, and belts, thereby helping ensure consistency between ethnic attribution and documented records. The second source comprised publicly available online images, including those obtained from the official websites of museums and national or provincial intangible cultural heritage programs, local cultural tourism and public cultural service platforms, and selected craft- and design-oriented websites where the ethnic provenance of the brocade images was clearly identified.
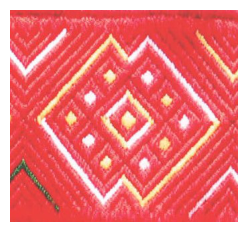
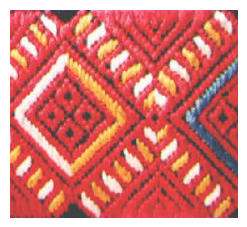
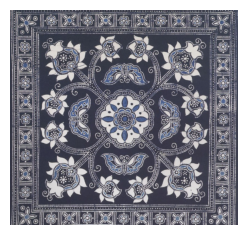
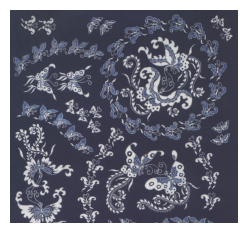
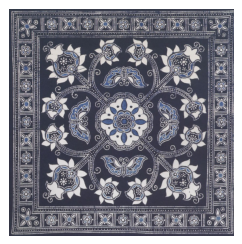
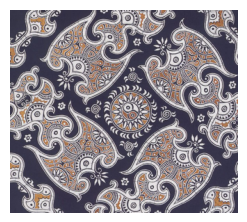
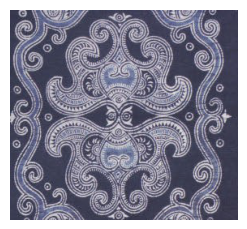
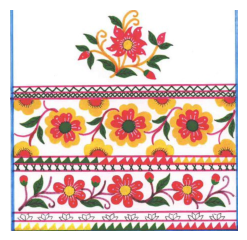
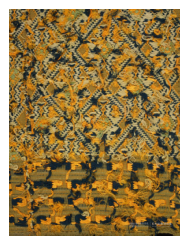
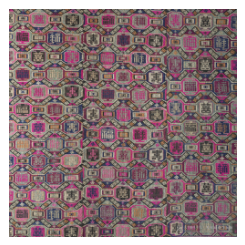
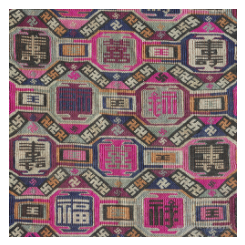
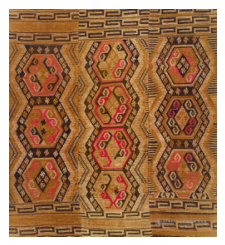
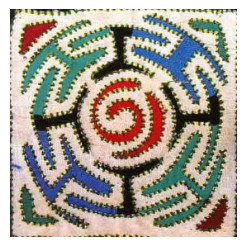
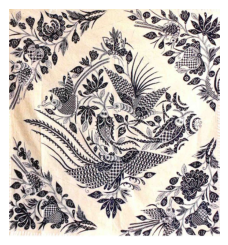
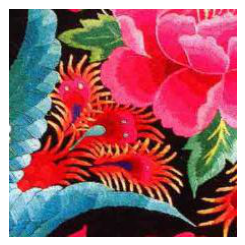
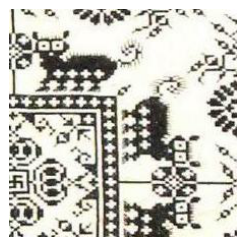
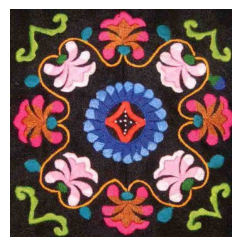
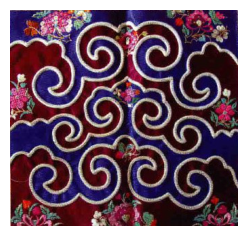
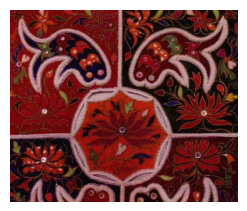
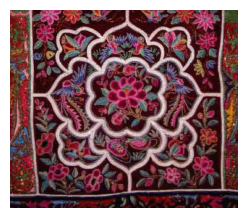
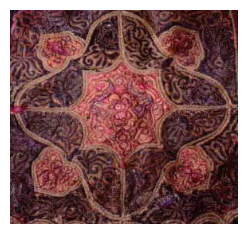
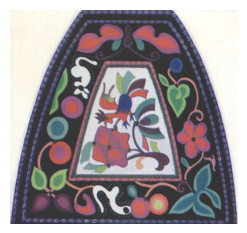
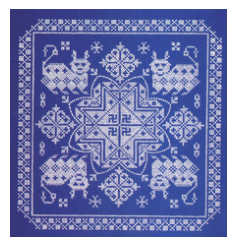
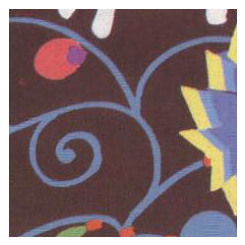
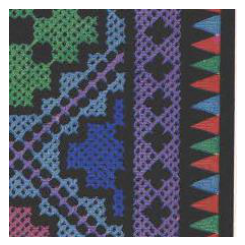
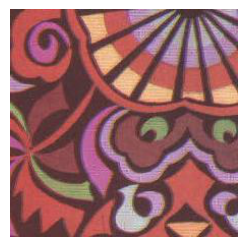
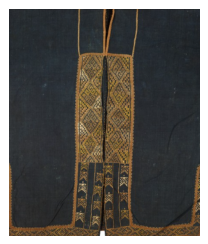
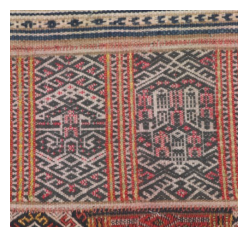
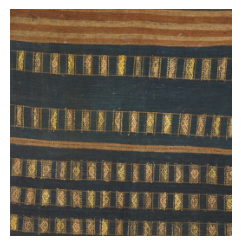
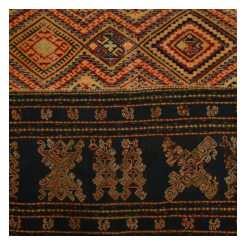
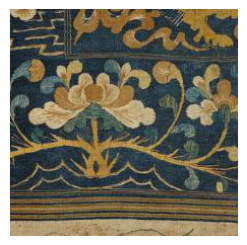
After collection, all raw images underwent unified quality control and preprocessing. Specifically, samples with insufficient resolution, severe compression artifacts, ambiguous ethnic labels, or unclear provenance were excluded. Images containing substantial background clutter, human subjects, or exhibition text were cropped to retain an effective field of view dominated by the brocade region. Duplicate and near-duplicate images were removed during curation. Finally, all images were resized to a standardized input scale for CNN-based analysis and organized by ethnic category to form the dataset used in subsequent experiments. Representative samples are shown in Table 1.
Table 1.
Representative brocade pattern samples from ten minority groups in Southwest China.
2.2.2. Ethnic Categories and Dataset Composition
Based on the ten ethnic groups described above, a dataset of 1430 annotated ethnic brocade images was established, with 143 samples for each group. For category-level similarity analysis, 33 images were randomly selected from each ethnic group (330 images in total). These images were used to construct balanced category prototypes and to provide visualization examples. These images were excluded from the classification benchmarking procedure. The remaining 110 images per group (1100 images in total) were used for classification benchmarking and were split into training and test sets at a ratio of 7:3, resulting in 770 training images and 330 test images. Given the limited size of the training set, data augmentation was applied during model training, including random rotation, flipping, scaling, and translation, to improve robustness to viewpoint variation and local deformation.
2.3. Convolutional Neural Network Models
2.3.1. Baseline CNNs: AlexNet, VGG-16, and ResNet-18
As a pioneering deep learning model, AlexNet achieved a Top-5 error rate of 15.3% in the 2012 ImageNet Large Scale Visual Recognition Challenge, demonstrating the effectiveness of convolutional neural networks (CNNs) for visual recognition tasks [21]. AlexNet employs an eight-layer architecture consisting of five convolutional layers and three fully connected layers. It introduced the rectified linear unit (ReLU) activation function to alleviate the vanishing gradient problem [22] and used local response normalization and dropout to improve generalization performance [23]. Owing to its historical importance and representative architecture, AlexNet was selected as one of the baseline models for comparative analysis.
VGG-16 adopts stacked convolutional kernels in place of larger kernels, enabling deeper feature extraction with a simple and uniform architecture [24]. It consists of consecutive convolutional and max-pooling layers followed by fully connected layers for classification. This design achieved strong performance on the ImageNet dataset and highlighted the importance of network depth in visual representation learning [24]. Owing to its strong representation ability and classical architectural design, VGG-16 was selected as a benchmark model for ethnic brocade image classification.
ResNet-18 introduces residual connections to alleviate gradient vanishing and optimization difficulties in deep neural networks [25]. Compared with VGG-style architectures, ResNet-18 provides a better balance between representational capacity, parameter efficiency, and computational complexity. Its robust performance and broad applicability have made it a widely adopted backbone for visual recognition tasks. Therefore, ResNet-18 was selected as a benchmark model to further evaluate its effectiveness in ethnic brocade image classification.
2.3.2. Squeeze-and-Excitation ResNet-18
Although the benchmark models described above perform well in general image recognition and classification tasks, their feature representation capability remains limited when applied to ethnic pattern images with complex structures and rich details. To enhance the network’s ability to capture discriminative texture information and channel-wise dependencies, this study introduces the Squeeze-and-Excitation (SE) module into ResNet. Proposed by Hu et al. in 2018, the SE module has been shown to significantly improve network performance on large-scale datasets such as ImageNet [26]. Because the SE module was originally designed for residual architectures such as ResNet, it was incorporated into the residual blocks of ResNet-18 in this study to further improve the baseline model.
The SE module enhances network performance by modeling inter-channel dependencies through a channel attention mechanism. Its operation consists of two main stages: Squeeze and Excitation. In the Squeeze stage, global average pooling is applied to each feature channel to aggregate spatial information into a channel descriptor, thereby generating a vector that reflects the relative importance of different channels. In the subsequent Excitation stage, this vector is passed through a small fully connected network to produce adaptive weights for each channel.
Specifically, let the output feature map of a convolutional block be , where C denotes the number of channels, and H and W represent the height and width of the feature map, respectively.
The SE module first applies global average pooling to each channel:
This operation produces the channel descriptor vector .
Subsequently, the Excitation operation is implemented through a gating mechanism composed of two fully connected layers:
Here, and are learnable weight matrices, r denotes the channel reduction ratio, is the ReLU activation function, and is the Sigmoid activation function. The resulting represents the adaptive weights assigned to each channel.
Finally, these weights are used to recalibrate the original feature map in a channel-wise manner:
This operation yields the recalibrated feature map after channel attention adjustment.
2.3.3. Training Strategy and Implementation Details
All experiments were conducted on a platform equipped with an AMD R7-5800H processor (Advanced Micro Devices, Inc., Sunnyvale, CA, USA), 16 GB of RAM, and an NVIDIA GeForce RTX 3060 GPU (NVIDIA Corporation, Santa Clara, CA, USA) running Windows. The deep learning environment was configured with Python 3.9, PyTorch 1.12, and CUDA 11.3.
To ensure fair and reproducible model comparison, AlexNet, VGG-16, ResNet-18, and the SE-enhanced SResNet-18 were trained under the same experimental environment using a unified training protocol and consistent hyperparameter settings. Considering the small-sample nature of the ethnic brocade dataset, the batch size, number of training epochs, and initial learning rate were set to 64, 50, and 0.001, respectively. Stochastic gradient descent (SGD) was used as the optimizer, with a momentum coefficient of 0.9 to improve the stability and convergence efficiency of gradient updates. The cross-entropy loss function was adopted for multi-class classification.
Before training, all input images underwent unified preprocessing and normalization. For the training set, data augmentation techniques, including random cropping, scaling, and random horizontal and vertical flipping, were applied to increase sample diversity and enhance the model’s robustness to scale variation and directional changes in pattern appearance. In contrast, the test set only underwent deterministic preprocessing, including scale normalization and center cropping, to ensure consistency during evaluation.
Given the relatively limited size of the ethnic brocade dataset, a transfer learning strategy was adopted [27]. Specifically, all backbone models were initialized with ImageNet pre-trained weights and then fine-tuned on the dataset constructed in this study. This strategy enabled the models to learn more discriminative feature representations of ethnic brocade patterns from limited samples while reducing the risk of overfitting.
2.4. Similarity Analysis of Ethnic Textiles Based on Distance Metrics
2.4.1. Image Feature Extraction and Class Prototypes
Leveraging the feature representation capability of convolutional neural networks (CNNs), an input image x can be mapped by the model to a feature vector . During inference, the model parameters remain fixed, and the feature vectors obtained through forward propagation capture the salient visual characteristics of the input images.
For each ethnic category, image-level feature vectors were aggregated to construct a category-level prototype. To reduce the influence of extreme feature values and potential outlier samples, this study used a dimension-wise 10% trimmed mean rather than a simple arithmetic mean. For each feature dimension, the values within the same category were sorted, the lowest and highest 10% were removed, and the remaining values were averaged to obtain the corresponding dimension of the category prototype. This robust aggregation strategy was applied consistently to both SResNet-18 deep features and handcrafted descriptor features in the subsequent similarity analysis. The category prototype is expressed as
where denotes the number of images in category i, represents the feature vector of the j-th image in category i, and denotes the dimension-wise 10% trimmed mean.
2.4.2. Euclidean Distance
Euclidean distance is a widely used metric for measuring the straight-line distance between two points in a multidimensional space. For two feature vectors
their Euclidean distance is given by
Euclidean distance directly reflects geometric differences between samples in a continuous feature space and is widely used in machine learning tasks such as clustering, classification, and feature similarity analysis [28]. However, because it is sensitive to feature scale, improved variants such as standardized Euclidean distance and Mahalanobis distance have been proposed to reduce its dependence on dimensional units [29].
2.4.3. Manhattan Distance
Manhattan distance, also known as the distance or city-block distance, measures the sum of the absolute coordinate differences between two points in a multidimensional space. For the feature vectors P and Q, it is defined as
Compared with Euclidean distance, Manhattan distance is generally more robust to outliers [30] and is therefore often more suitable for high-dimensional data analysis, sparse feature spaces, and applications emphasizing axis-aligned variation [31,32].
2.4.4. Cosine Distance
Cosine distance measures the directional difference between two feature vectors based on cosine similarity and is commonly used for high-dimensional representations [33]. Given two feature vectors P and Q, the cosine similarity is defined as
and the corresponding cosine distance is defined as
Unlike Euclidean and Manhattan distances, cosine distance emphasizes vector direction rather than magnitude, making it suitable for comparing normalized high-dimensional feature representations. In general, cosine distance can range from 0 to 2. In this study, however, the SResNet-18 feature vectors were extracted after ReLU-activated convolutional representations and global average pooling. We confirmed that the cosine similarities among category prototypes were non-negative; therefore, the cosine distances used in this study fell within .
2.4.5. Distance Matrix Construction
In the visual relationship analysis of ethnic brocades, three distance metrics, namely Euclidean distance, Manhattan distance, and cosine distance, were employed to quantify the pairwise relationships among different ethnic groups. Based on the selected metric, a distance matrix was constructed to characterize the visual relationships between ethnic brocade categories and to provide a quantitative basis for subsequent analysis.
Specifically, given the class prototypes and of ethnic groups i and j, respectively, the element in the distance matrix is defined as
where denotes the adopted distance metric, i.e., Euclidean distance, Manhattan distance, or cosine distance.
2.5. Traditional Visual Descriptors and Similarity Analysis
Ethnic brocades exhibit distinctive visual characteristics in terms of color composition, pattern regularity, global configuration, and local decorative motifs. To better interpret the feature representations learned by SResNet-18, this study introduces a set of handcrafted visual descriptors and compares their similarity structures with those of deep representations. The design of these descriptors was informed by previous studies on textile recognition, clothing pattern analysis, and classical image description methods [18,34,35,36,37]. Considering the visual properties of ethnic brocades, the handcrafted descriptors were organized into five categories: color descriptors, texture descriptors, geometric descriptors, local-structure descriptors, and frequency-domain descriptors.
2.5.1. Color Descriptors
Color is one of the most salient visual cues of ethnic brocades, reflecting both aesthetic preference and cultural symbolism. To characterize global color composition, this study adopts the HSV color space, which separates hue (H), saturation (S), and value (V) and is generally more consistent with human color perception than RGB [18]. Specifically, each image was proportionally resized so that its shorter side was no less than 256 pixels and its longer side did not exceed 512 pixels, and was then converted into the HSV color space following the OpenCV encoding convention. Uniform quantization with was applied over the ranges , , and , resulting in an -dimensional color descriptor vector. This descriptor captures the overall color composition of ethnic brocades in terms of dominant hues and saturation–value combinations.
2.5.2. Texture Descriptors
To characterize fabric texture and fine surface patterns, this study combines Local Binary Pattern (LBP) and Gabor filter responses to construct texture descriptors [34,38]. LBP encodes local grayscale texture by comparing each pixel with its neighboring pixels, whereas Gabor filters provide multi-scale and orientation-sensitive responses in both spatial and frequency domains. Their combination therefore captures complementary texture information from local and multi-scale perspectives.
For LBP extraction, the operator was adopted under two parameter settings, namely and , producing 10-dimensional and 26-dimensional uniform-pattern histograms, respectively. These two histograms were concatenated to form a 36-dimensional LBP feature vector. For Gabor extraction, the kernel size was set to , with , wavelength set , orientation set , and aspect ratio . For each scale–orientation combination, the mean and standard deviation of the filter response were computed, resulting in a 48-dimensional Gabor feature vector. Finally, the LBP and Gabor vectors were concatenated to form an 84-dimensional texture descriptor.
2.5.3. Geometric Descriptors
The patterns of ethnic brocades often exhibit distinctive global organization and symmetrical layout. To characterize such configurational properties, this study constructs geometric descriptors from two aspects: directional symmetry and invariant shape moments.
First, all images were resized to grayscale images. The normalized correlation coefficients between each image and its horizontally flipped, vertically flipped, and diagonally reflected versions (across the main diagonal and the anti-diagonal) were then computed, yielding four directional symmetry indices. Next, seven Hu invariant moments were extracted from the same grayscale image, and signed logarithmic compression was applied to reduce magnitude differences while preserving invariance to translation, rotation, and scaling [35]. The four symmetry indices and the seven Hu moments were concatenated to form an 11-dimensional geometric descriptor, reflecting differences in symmetry, configurational stability, and overall shape complexity among ethnic brocades.
2.5.4. Local Descriptors
In addition to global patterns, ethnic brocades contain numerous local motif units and fine-grained decorative details, such as petals, folded-line patterns, and local contours of animals or artifacts. To characterize such distinctive local structures, this study adopts ORB (Oriented FAST and Rotated BRIEF) together with the Bag-of-Visual-Words (BoVW) framework to construct local descriptors.
Specifically, up to 800 ORB keypoints were detected for each image, and the extracted local descriptors from all selected images used for similarity analysis were collected to build a visual vocabulary. A codebook of size was then learned using MiniBatch K-Means clustering. For each image, its ORB descriptors were quantized to the nearest visual words, and the occurrence frequencies of these visual words were counted to obtain a 300-dimensional BoVW histogram. The histogram was further L2-normalized to produce the final local descriptor. This descriptor captures the statistical distribution and combinational patterns of local motif units, thereby providing a complementary view of fine-grained stylistic variation [37].
2.5.5. Frequency-Domain Descriptors
Traditional brocade patterns often exhibit repeated geometric units and macro-level periodic organization, which can be effectively characterized in the frequency domain. To describe such global periodic structures, this study constructs frequency-domain descriptors based on the two-dimensional Fast Fourier Transform (2D FFT).
Each image was first converted to grayscale and resized to . A 2D FFT was then applied, followed by FFT shift to move the low-frequency components to the center of the spectrum, producing the amplitude spectrum . Under a polar-coordinate representation of the frequency plane, the spectrum was divided into radial intervals and angular intervals. The average spectral energy within each interval was computed, yielding a -dimensional frequency-domain descriptor, which was subsequently L2-normalized. This descriptor characterizes pattern density, repetition scale, and dominant orientation from the perspective of global frequency structure [36].
2.5.6. Similarity Matrix Construction
All handcrafted descriptor vectors were first L2-normalized to reduce the influence of dimensionality and scale. For each ethnic category, prototypes of the five descriptor types were computed using a 10% trimmed mean of the selected image-level features, which reduces the influence of outliers compared with simple averaging. Cosine similarity between category prototypes was then used to construct five category-level similarity matrices.
The SResNet-18 deep features extracted from the penultimate layer were aggregated in the same way to obtain the deep feature similarity matrix. Since prototype-based analysis represents each category by a single central vector, we further evaluated prototype representativeness by calculating the intra-class cosine distance between each image-level deep feature and its corresponding category prototype :
The mean and standard deviation of this distance were reported for each category to assess prototype representativeness, and t-SNE was used as a qualitative visualization of category compactness and overlap in the image-level deep feature space.
Spearman’s rank correlation coefficient was computed on the vectorized upper-triangular entries of each pair of category-level similarity matrices, excluding the diagonal. This resulted in 45 pairwise observations for each correlation analysis. Given this limited number of category-level comparisons, the correlations were interpreted as exploratory indicators of representational alignment rather than definitive evidence of feature dependence.
To quantify uncertainty, bootstrap 95% confidence intervals were estimated by resampling the 45 upper-triangular pairwise values of the category-level similarity matrices. Permutation tests were used to assess statistical significance by randomly permuting the category labels of one matrix. For descriptor fusion, the five handcrafted descriptor-based similarity matrices were linearly combined using non-negative weights summing to one, and the weights were optimized to maximize the Spearman correlation with the RGB-based SResNet-18 deep feature similarity matrix.
3. Results
3.1. Ablation on SE Attention Placement
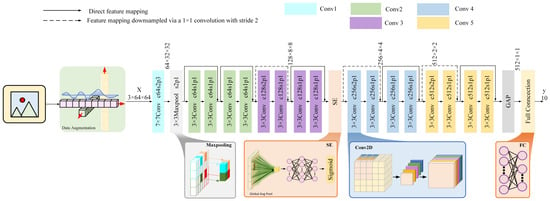
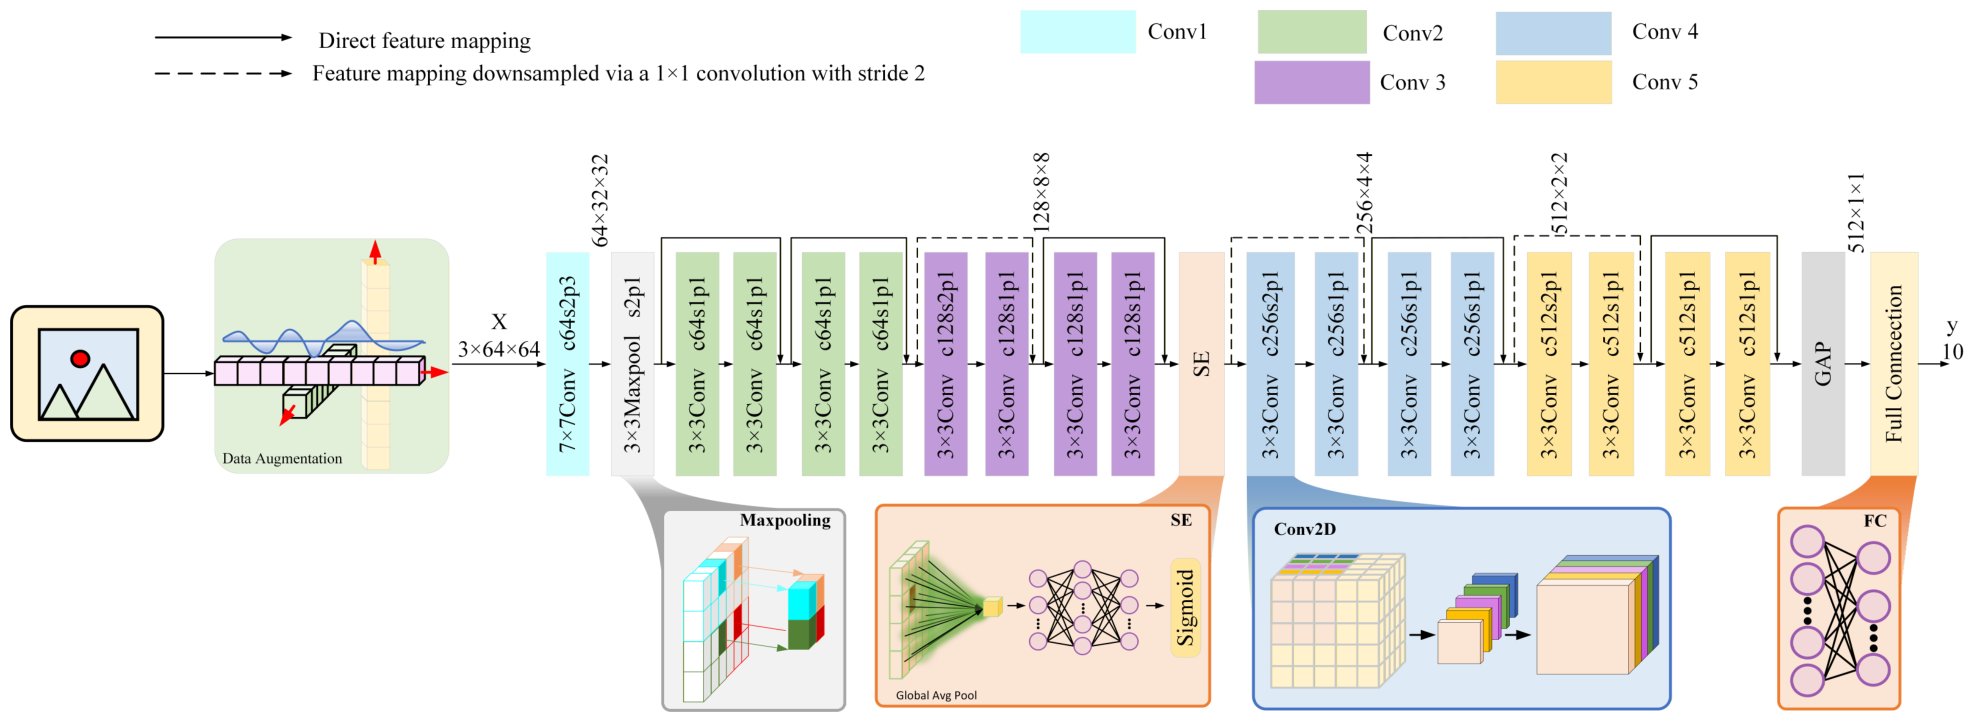
By inserting the SE module between the Conv3 and Conv4 stages of ResNet-18, this study developed an enhanced network architecture termed SResNet-18, as shown in Figure 2. In this architecture, the first two stages of ResNet-18 (Conv1 and Conv2) are used for basic feature extraction. The output feature maps of Conv3 are then recalibrated by the SE module through fine-grained channel reweighting, after which the refined feature maps are passed to Conv4 for subsequent computation. This modification is intended to enhance the network’s capacity to capture informative features and improve its ability to extract discriminative representations of ethnic patterns.
Figure 2.
Architecture of the proposed SResNet-18 with the SE module inserted between Conv3 and Conv4.
To further examine the effect of SE-module placement on model performance, ablation experiments were conducted by inserting the SE module at different positions within the network. Four insertion schemes were considered: before Conv2 (Scheme 1), between Conv2 and Conv3 (Scheme 2), between Conv3 and Conv4 (Scheme 3), and between Conv4 and Conv5 (Scheme 4). Under the same dataset and training settings, the experimental results are presented in Table 2.
Table 2.
Classification accuracy of ResNet-18 with the SE module inserted at different positions.
As shown in Table 2, the classification accuracy generally improves as the SE module is inserted into deeper layers of the original network, and the best performance is achieved in Scheme 3, where the SE module is placed between Conv3 and Conv4. However, when the SE module is inserted into an even deeper stage, namely between Conv4 and Conv5 (Scheme 4), the accuracy slightly declines. This result suggests that, under the relatively limited scale of the dataset, introducing the attention mechanism at overly deep layers may increase the risk of overfitting and thereby reduce model generalization performance.
3.2. Benchmarking CNN Backbones for Subsequent Similarity Analysis
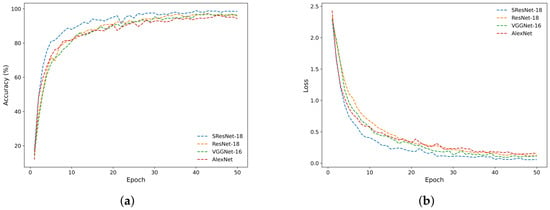
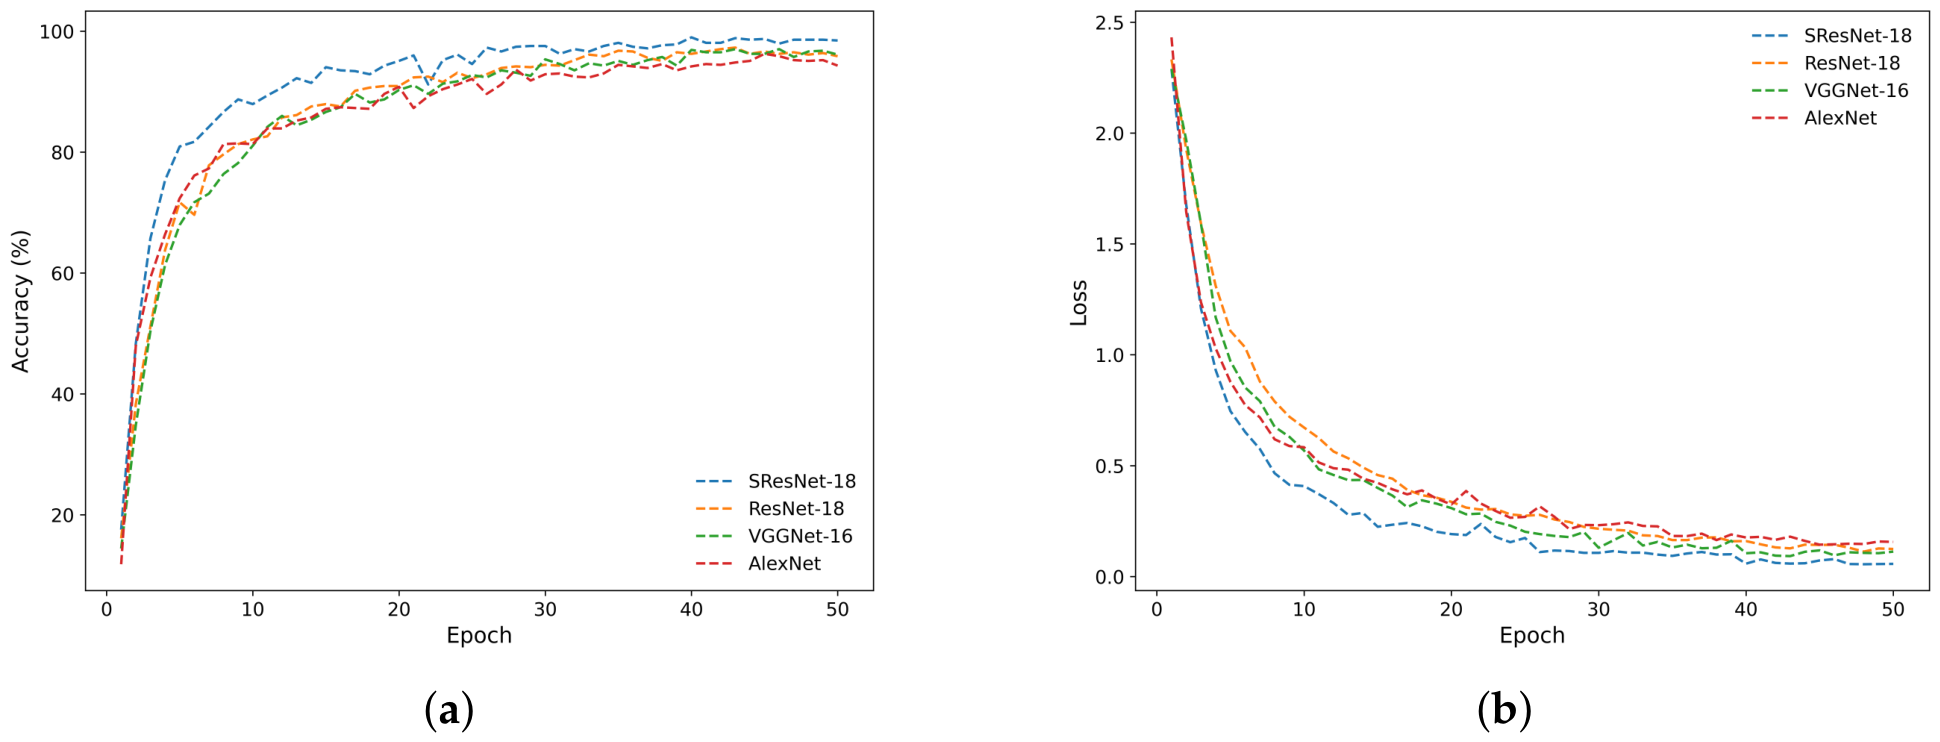
To identify a reliable feature extractor for subsequent similarity analysis, four CNN backbones, namely ResNet-18, VGG-16, AlexNet [21], and SResNet-18, were benchmarked on the ethnic brocade classification task under identical data partitioning, augmentation, and training settings. All models were trained by transfer learning for 50 epochs using the same optimizer, learning rate, batch size, and training schedule. As summarized in Table 3, SResNet-18 achieved the best overall performance (Accuracy = 95.15%, F1 = 95.14%) and was therefore selected as the feature extractor for subsequent deep similarity analysis. The training curves in Figure 3 further demonstrate that SResNet-18 exhibits faster and more stable convergence than the competing backbones. These two evaluations confirm the suitability of SResNet-18 as the core feature extractor for subsequent inter-ethnic brocade visual similarity analysis.
Table 3.
Overall classification performance of four CNN models on the ethnic brocade test set.
Figure 3.
Comparison of training dynamics of four CNN backbones on the ethnic brocade classification task. (a) Training accuracy curves. (b) Training loss curves.
For quantitative comparison, Table 3 summarizes the overall classification results of the four models on the ethnic brocade test set, including Accuracy, Precision, Recall, and F1-score. SResNet-18 performs best on all four metrics, with each metric improved by approximately 3.6–3.7% compared with ResNet-18, while ResNet-18 is overall superior to VGG-16 and AlexNet. On this basis, Table 4 further reports the per-class classification results for ten ethnic brocade categories. The results show that model performance varies across different ethnic categories. For the Dong category, all four models achieve perfect recognition, with both Accuracy and F1-score reaching , mainly because Dong brocades have bright colors and distinctive geometric patterns that make salient features easy to extract. For the Tujia, Qiang, and Miao categories, all four models also achieve strong performance, with both Accuracy and F1-score above , reflecting their strong stylistic consistency and high pattern repeatability.
Table 4.
Recognition performance of four CNN models across ethnic brocade categories (%).
By contrast, larger differences emerge in more challenging categories. For Zhuang, SResNet-18 and ResNet-18 perform substantially better than VGG-16 and AlexNet. Zhuang brocades often exhibit a layered layout with central motifs and edge decorative textures, while their main colors are concentrated in relatively low-saturation tones such as deep red and navy blue. Similar-colored pattern elements often show blurred boundaries and intertwined details, which increases the difficulty of feature discrimination. In addition, intra-class variation is considerable: some samples are centered on realistic floral motifs, whereas others are dominated by abstract geometric patterns, and even visually similar pattern types show marked differences in detailed decoration. These characteristics make Zhuang brocades difficult to classify, as the task requires stronger hierarchical feature learning, finer texture perception, and better adaptability to intra-class heterogeneity, which also explains why SResNet-18 and ResNet-18 perform better than VGG-16 and AlexNet.
In the classification of Yi, Shui, and Yao brocades, SResNet-18 also outperforms ResNet-18, VGG-16, and AlexNet. This difference is closely related to the characteristics of these categories. Yi brocades are characterized by strong geometric symmetry, which can be captured more effectively by the channel attention mechanism of SResNet-18. The highly repetitive textures of Shui brocades are also well matched to the residual feature enhancement mechanism, which helps preserve periodic texture information in deep networks. Similarly, the regular rhombic and square geometric patterns of Yao brocades rely on stable hierarchical feature transmission, for which the residual-attention structure of SResNet-18 appears more suitable. The classification of Li brocades further highlights the contribution of the SE channel attention mechanism. ResNet-18 is the only model whose Accuracy () and F1-score () are both below , whereas SResNet-18 achieves the best performance in this category, with an Accuracy of and an F1-score of .
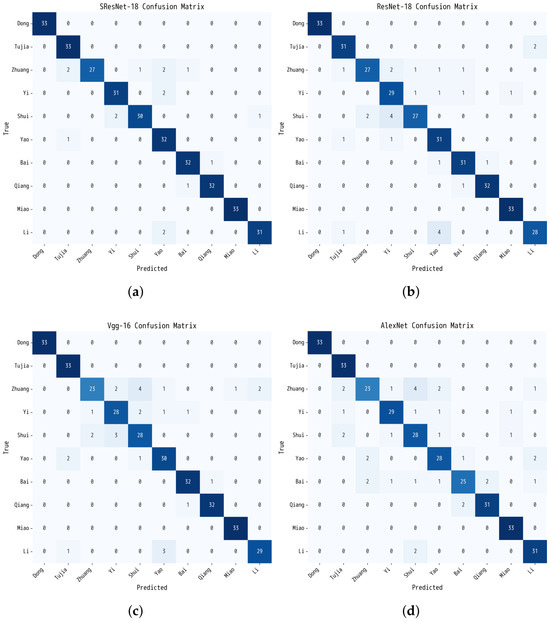
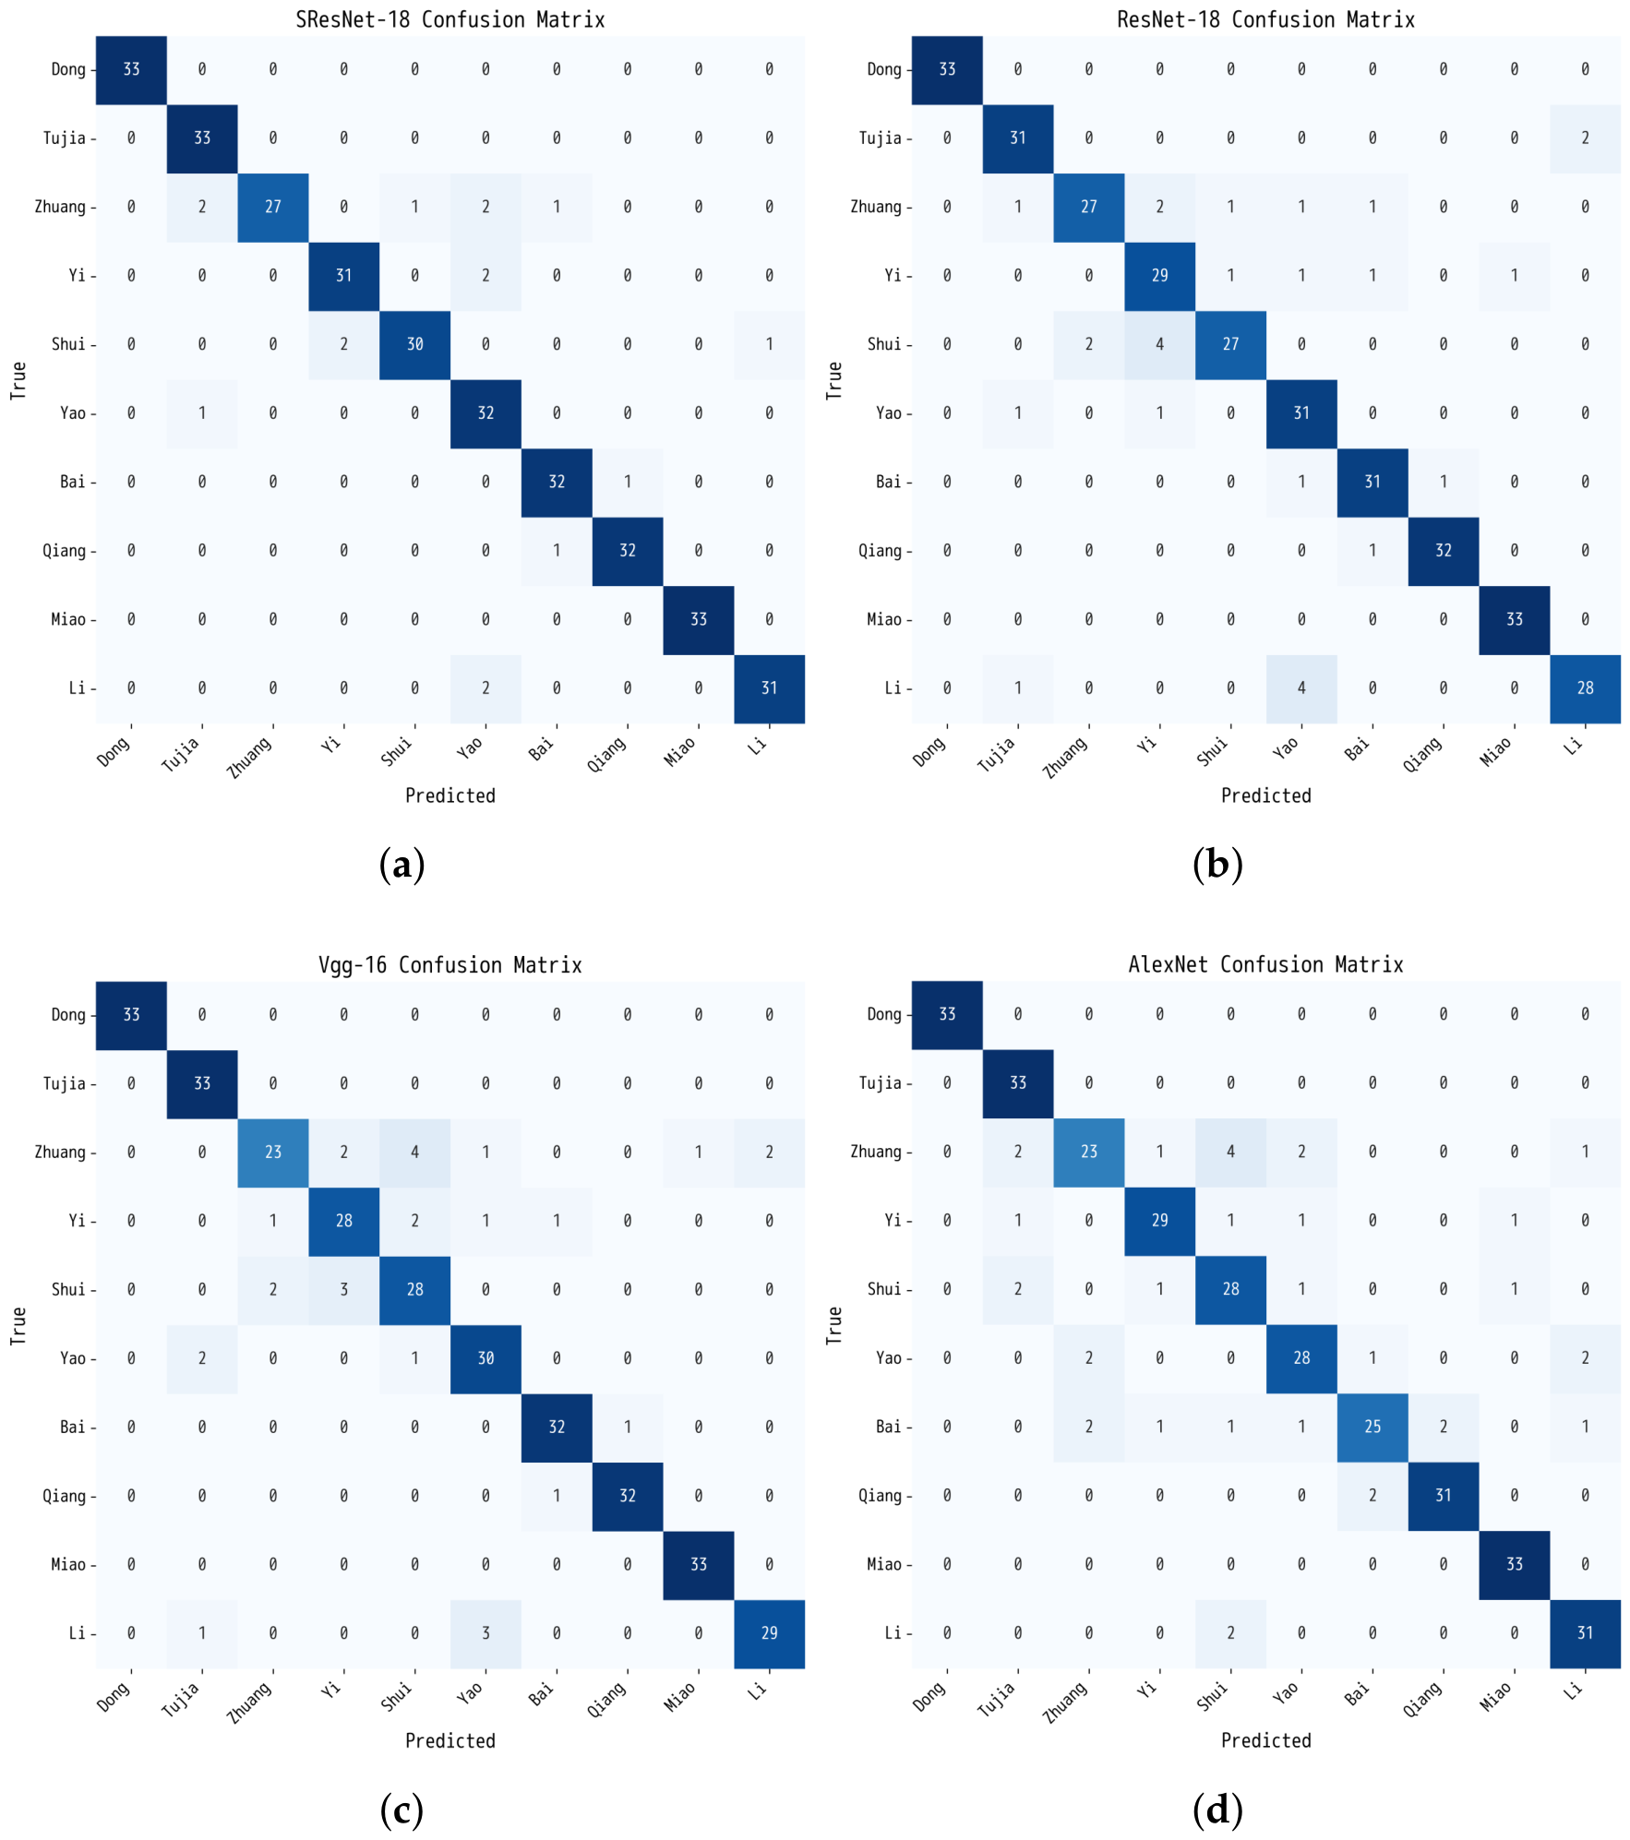
To further analyze the recognition differences across networks, Figure 4 presents the confusion matrices of ResNet-18, SResNet-18, VGG-16, and AlexNet on the test set. The recognition rates of all models on categories such as Dong and Miao are nearly saturated, whereas obvious confusions remain for categories such as Zhuang, Shui, and Li, which is highly consistent with their visual similarity in color matching and pattern structure. For example, some Zhuang and Shui brocades both adopt deep red as the dominant color and are supplemented by dense small-scale geometric patterns, making them prone to confusion in the absence of stronger global semantic information. Compared with ResNet-18, SResNet-18 further improves the diagonal elements for categories such as Yi, Shui, and Li, while reducing misclassifications for several confusing category pairs, such as Shui → Zhuang and Li → Yao. This indicates that the channel attention mechanism helps the model extract more discriminative mid- and high-level semantic features under conditions of similar color matching and texture. In contrast, the confusion matrices of VGG-16 and AlexNet show more obvious cross-category misclassification for categories such as Zhuang, Shui, and Bai, indicating that their feature representations remain insufficient for handling subtle texture differences.
Figure 4.
Comparison of confusion matrices of different CNN models on the ethnic brocade test set. (a) SResNet-18. (b) ResNet-18. (c) VGG-16. (d) AlexNet.
3.3. Interpretation of SResNet-18 Deep Feature Space via Handcrafted Descriptors
To interpret the discriminative basis of SResNet-18 in recognizing Southwest Chinese ethnic brocades, five complementary handcrafted visual descriptors were constructed: color, texture, geometric, local-structure, and frequency-domain descriptors. These descriptors capture visual cues at different levels, including global color composition, grayscale texture, geometric configuration, local motif organization, and periodic frequency structure. For each descriptor type, category-level prototypes were computed using a 10% trimmed mean of the L2-normalized image-level features to reduce the influence of potential outliers. Cosine similarity matrices were then constructed from these prototypes and compared with the category-level similarity matrix derived from RGB-based SResNet-18 deep features.
Spearman’s rank correlation coefficient was computed from the 45 upper-triangular pairwise values of each category-level similarity matrix, excluding the diagonal. Therefore, these correlations should be interpreted as exploratory indicators of representational alignment rather than definitive evidence of feature dependence. Bootstrap 95% confidence intervals and permutation-based p-values were reported to quantify uncertainty under the limited number of category-level pairwise comparisons. The results are summarized in Table 5.
Table 5.
Spearman correlations between handcrafted descriptors and RGB-based SResNet-18 deep features, computed from 45 upper-triangular pairwise values. Bootstrap 95% confidence intervals and permutation-based p-values are reported.
From the single-descriptor correlations, the SResNet-18 similarity structure shows the strongest alignment with color descriptors. The correlation between the color descriptor similarity matrix and the RGB-based deep feature similarity matrix is (95% CI [0.393, 0.812], ), indicating a relatively strong association with differences in overall color composition. Local-structure descriptors show a moderate correlation (, 95% CI [0.142, 0.641], ), suggesting partial correspondence between local motif organization and the SResNet-18 similarity structure. However, this correlation corresponds to approximately 17.3% shared rank-order variance, indicating that most variation in the deep similarity structure remains unexplained by local descriptors alone. Thus, local structural cues should be interpreted as partially aligned with, rather than determining, the organization of the SResNet-18 feature space.
In contrast, texture descriptors (, 95% CI [−0.364, 0.256], ), geometric descriptors (, 95% CI [−0.362, 0.242], ), and frequency-domain descriptors (, 95% CI [−0.243, 0.380], ) show near-zero and statistically insignificant correlations. These results indicate limited correspondence between these handcrafted similarity structures and the RGB-based SResNet-18 category-level similarity structure under the present experimental setting.
The weighted fusion of all five descriptor types was optimized to approximate the SResNet-18 similarity structure. In the optimal solution, color received the largest weight (), followed closely by local-structure descriptors (). Frequency-domain descriptors contributed modestly (), whereas texture and geometric descriptors received very small weights ( and , respectively). The fused similarity matrix achieved a Spearman correlation of (95% CI [0.563, 0.838], ), which is higher than any single descriptor. This suggests that the SResNet-18 feature space is best approximated by a combination of color and local-structure information, with only limited additional contribution from the other handcrafted descriptors.
To further examine whether the weak correspondence of LBP+Gabor texture descriptors was caused by color-texture confounding, a grayscale ablation analysis was conducted. The original RGB images were converted to grayscale and replicated into three channels before being passed through the trained SResNet-18 feature extractor. The resulting grayscale-based deep feature similarity matrix was then compared with the same LBP+Gabor texture similarity matrix used in Table 5. The results are shown in Table 6.
Table 6.
Grayscale ablation analysis for the alignment between LBP+Gabor texture descriptors and SResNet-18 deep feature similarity structures.
The correlation between LBP + Gabor descriptors and RGB-based SResNet-18 features is close to zero and statistically insignificant (, 95% CI [−0.364, 0.256], ). After grayscale conversion, the correlation remains near zero (, 95% CI [−0.260, 0.328], ). It is worth noting that the correlation changes from slightly negative for RGB-based deep features () to slightly positive after grayscale conversion (). This directional change suggests that removing chromatic information may slightly reduce the mismatch between LBP + Gabor texture descriptors and the deep feature similarity structure. However, the magnitude of this change is very small, and both correlations remain near zero with wide confidence intervals and non-significant permutation-based p-values. Therefore, the weak alignment cannot be attributed solely to color-texture confounding. Instead, it suggests that classical grayscale texture descriptors and CNN-based deep representations may capture different aspects of brocade appearance.
This interpretation is also consistent with the per-category classification results in Table 4. Among the ten ethnic groups, Zhuang brocade shows the lowest recognition performance, with an Accuracy of 81.82%. As discussed above, Zhuang brocades exhibit considerable intra-class variation in motif type, layout, and decorative details. Their visual similarity to categories such as Shui and Yi may increase classification difficulty. However, given the weak alignment between LBP + Gabor descriptors and the deep similarity structure, this difficulty should not be attributed simply to a lack of texture sensitivity in SResNet-18. Instead, it more likely reflects the fact that the network encodes visual differences through a combination of color, local motif organization, and higher-level feature interactions.
By contrast, Dong, Miao, and Tujia brocades exhibit stronger distinctiveness in color and local-structure. Dong brocades are characterized by bright overall colors and strong contrast, whereas Miao and Tujia brocades show relatively stable color combinations and local motif units. Because these differences correspond more closely to the descriptor dimensions most strongly aligned with the SResNet-18 similarity structure, the network can separate their category prototypes more clearly in the feature space. As a result, both Accuracy and F1-score for these categories reach high levels, reflecting the model’s strong discriminative ability in cases where color and local structural cues are more distinctive.
3.4. Representativeness of Category Prototypes in the Deep Feature Space
Since the subsequent similarity and inter-ethnic distance analyses are based on category-level prototypes, we further examined how well these prototypes summarize the image-level SResNet-18 feature distributions. Specifically, the intra-class cosine distance between each image-level deep feature and its corresponding category prototype was calculated. A smaller distance indicates that samples are more closely distributed around the prototype, whereas a larger distance reflects greater within-category variation. The results are reported in Table 7.
Table 7.
Intra-class dispersion of SResNet-18 deep features measured by cosine distance to category prototypes.
As shown in Table 7, the mean intra-class cosine distance ranges from 0.0865 to 0.2517 across the ten categories, indicating different degrees of compactness in the SResNet-18 feature space. Dong shows the most compact distribution, with the lowest mean distance of 0.0865. Qiang and Miao also show relatively low intra-class dispersion, suggesting that their image-level features are closely organized around their corresponding prototypes.
By comparison, Zhuang and Yi show higher mean intra-class distances of 0.2517 and 0.2290, respectively. These values do not invalidate the use of category prototypes, but indicate that these categories contain richer within-category visual variation. This observation is consistent with the classification results in Table 4, where Zhuang shows relatively lower recognition performance, and with the visual characteristics discussed above, including variations in motif type, layout, and decorative details.
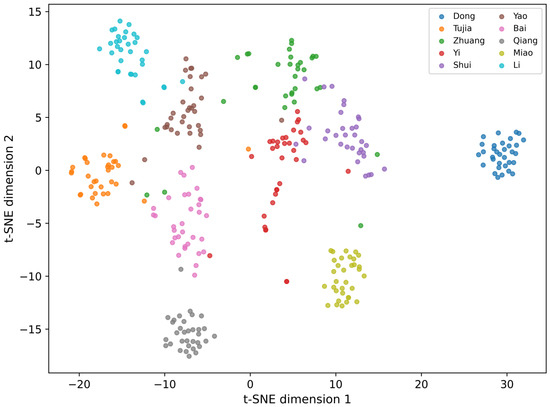
The t-SNE visualization in Figure 5 provides qualitative support for this pattern. Several categories, including Dong, Qiang, Miao, and Li, form relatively compact clusters, which is consistent with their lower intra-class dispersion. In contrast, Zhuang and Yi display broader distributions, reflecting greater internal visual diversity. The relatively close positions of Zhuang, Yi, and Shui also suggest that these categories share certain visual similarities in the learned feature space.
Figure 5.
t-SNE visualization of image-level SResNet-18 deep features. Each point represents one brocade image, and colors indicate ethnic categories.
Overall, the intra-class dispersion analysis and t-SNE visualization support the use of category prototypes as approximate category-level summaries in the SResNet-18 feature space. At the same time, the results show that prototype representativeness varies across categories. Therefore, the subsequent prototype-based similarity and distance analyses should be understood as broad category-level comparisons, while the internal diversity of visually heterogeneous categories such as Zhuang and Yi should be interpreted with appropriate caution.
3.5. Inter-Ethnic Distance Analysis in the Deep Feature Space
Based on the preceding prototype representativeness analysis, category prototypes were used as approximate category-level summaries for inter-ethnic distance comparison. To quantify the relative differences among brocade categories, three distance metrics, namely Euclidean distance, Manhattan distance, and cosine distance, were computed between the Shui reference prototype and the prototypes of the other ethnic brocade categories. The results are presented in Table 8.
Table 8.
Euclidean, Manhattan, and cosine distances from the Shui reference category in the SResNet-18 feature space.
Across the three metrics, Zhuang and Yi consistently show the smallest distances from the Shui reference category, suggesting that their category prototypes are located closer to Shui in the SResNet-18 feature space. Several categories, including Miao, Li, Yao, and Bai, fall within an intermediate distance range, with only moderate differences among them. By contrast, Qiang shows the largest distance from the Shui prototype, while Dong and Tujia also exhibit relatively large distances under most metrics. Although minor ranking differences appear across Euclidean, Manhattan, and cosine distances, the overall distance pattern is broadly consistent, suggesting that the observed relative relationships are not specific to a single distance metric.
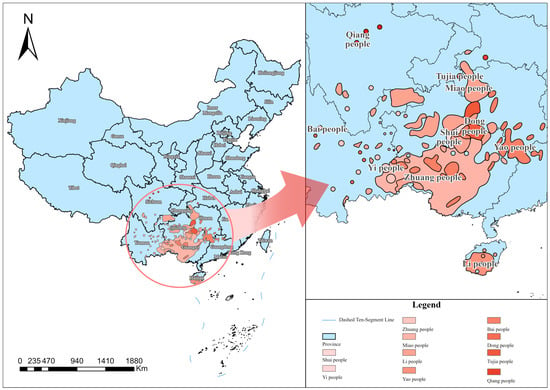
Since the three distance metrics produce broadly similar relative patterns, the Euclidean-distance results were projected onto an ethnic thematic map to provide an intuitive visualization of the feature space distances from the Shui reference category (Figure 6). In this map, the geographic polygons indicate the distribution areas of the ethnic groups, while color variation represents relative distance from the Shui prototype in the SResNet-18 feature space.
Figure 6.
Geographic visualization of Euclidean distances from the Shui reference category in the SResNet-18 feature space.
The map suggests that geographic proximity does not correspond to brocade feature space similarity in a simple or uniform manner. For example, Zhuang and Shui are geographically adjacent and their brocade prototypes also show a relatively small feature space distance, which may be associated with shared visual tendencies such as high-saturation warm-color contrasts, modular pattern organization, and relatively regular compositional arrangements. By contrast, although Dong and Shui are also geographically adjacent, their brocade prototypes show a larger feature space distance. This contrast suggests that geographic proximity may coincide with visual similarity in some cases, but it is not sufficient by itself to explain the learned visual relationships among ethnic brocade categories. Differences in motif vocabulary, compositional structure, and symbolic emphasis may contribute to the observed separation in the SResNet-18 feature space.
Taken together, these observations suggest that the learned feature space distances can reveal visual patterns that are relevant to cultural and historical interpretation. However, the present analysis is based on image-derived feature representations, and the relationship between visual similarity, geographic proximity, and cultural transmission should be further examined together with cultural-historical, ethnographic, and craft-related evidence.
4. Discussion
This study investigated the classification and interpretability of Southwest Chinese ethnic brocades using SResNet-18 and handcrafted visual descriptors. The results show that SResNet-18 achieved strong classification performance on the constructed dataset, while the descriptor-based similarity analysis provided an interpretable view of the visual cues reflected in the learned feature space. Overall, the RGB-based SResNet-18 similarity structure was most strongly aligned with color descriptors, followed by local-structure descriptors, whereas texture, geometric, and frequency-domain descriptors showed weak or statistically insignificant correspondence. Together with the prototype representativeness analysis, these results suggest that category prototypes provide useful category-level summaries, but the resulting similarity relationships should be understood as visual patterns at the category level rather than complete descriptions of all within-category variations. Because the descriptor correlations were computed from 45 upper-triangular pairwise values of the category-level similarity matrices, these results should be interpreted as exploratory evidence of representational alignment, with bootstrap confidence intervals and permutation-based p-values used to reflect statistical uncertainty.
The stronger alignment of color and local-structure descriptors is consistent with the classification results. Categories such as Dong, Miao, and Tujia, which exhibit distinctive color combinations and relatively stable local motif units, were more clearly separated in the learned feature space. In contrast, categories with richer internal variation, such as Zhuang and Yi, showed higher intra-class dispersion and were less compactly represented. The grayscale ablation further showed that the weak correspondence of LBP + Gabor descriptors was not simply caused by the absence of color information. Instead, classical grayscale texture operators and CNN-based representations appear to capture different aspects of brocade appearance, with SResNet-18 likely encoding texture through more complex motif-level and context-dependent patterns.
The decision-level fusion experiment further clarifies how handcrafted descriptors interact with SResNet-18 outputs under different weights. Descriptor-based prediction scores were obtained from cosine similarities between image-level handcrafted features and category prototypes, converted into probability-like outputs, and then linearly combined with the SResNet-18 softmax predictions. As shown in Table 9, the weight-scanning results reveal two different patterns. When color descriptors were fused with SResNet-18, classification accuracy remained stable across all tested weights, fluctuating only slightly around the original SResNet-18 accuracy. This indicates that handcrafted color descriptors are largely consistent with the color information already encoded by the network and therefore provide limited additional information at the decision level.
Table 9.
Weight-scanning results for decision-level fusion of SResNet-18 with color or texture descriptors.
By contrast, texture fusion remained stable at low descriptor weights but dropped sharply when the texture weight reached 0.5, with accuracy decreasing to 33.03%. This result suggests that texture-based similarity scores become difficult to combine with SResNet-18 probability outputs when assigned a high weight under the current linear fusion scheme. Rather than indicating that texture descriptors are intrinsically unsuitable, this result highlights the limited compatibility of heterogeneous prediction scores under naive decision-level fusion. Differences in feature dimensionality, normalization, score calibration, and similarity-to-probability conversion may all affect the fused decision distribution. Thus, texture cues may require more carefully designed integration strategies, such as score calibration, learnable weighting, feature-level fusion, or attention-based fusion, before their potential contribution can be fully evaluated.
The inter-ethnic distance analysis provides another view of the learned feature space. Using the Shui prototype as a reference, the results showed that Zhuang and Yi brocades are consistently closest to Shui. Several categories, including Miao, Li, Yao, and Bai, fall within an intermediate distance range, with only moderate differences among them. By contrast, Qiang shows the largest distance from the Shui prototype, while Dong and Tujia also exhibit relatively large distances under most metrics. The thematic map further suggests that geographic proximity and feature space similarity are not related in a simple or uniform manner. For example, Zhuang and Shui brocades are geographically adjacent and also relatively close in the SResNet-18 feature space, which may be associated with shared visual tendencies such as high-saturation warm-color contrasts and modular pattern organization. By contrast, although Dong and Shui are also geographically adjacent, their brocade prototypes show a larger feature space distance. This contrast suggests that geographic proximity may coincide with visual similarity in some cases, but it is not sufficient by itself to explain the learned visual relationships among ethnic brocade categories. These observations highlight the potential of deep feature analysis to reveal visual relationships that can guide further cultural, historical, and craft-transmission studies.
Future work can extend this study in several directions. First, the dataset should be expanded to include more samples per category, more diverse imaging conditions, and broader regional and historical coverage. Second, repeated prototype sampling, cross-validation, and external test sets should be used to further evaluate the stability of category-level similarity patterns. Third, the fusion strategy can be improved by moving beyond fixed linear weights. Learnable weighting, confidence calibration, feature-level fusion, and attention-based multimodal fusion may better handle scale differences between handcrafted descriptors and CNN representations. This is particularly important for texture descriptors, whose contribution may depend on appropriate normalization and calibration before fusion. Finally, structural priors such as motif layout, symmetry axes, compositional skeletons, and repeated pattern units could be introduced as auxiliary cues to enhance the model’s sensitivity to global organization and improve interpretability.
Overall, this study provides an interpretable framework for linking deep visual representations with handcrafted descriptors in ethnic brocade recognition. The findings indicate that color composition is strongly reflected in the SResNet-18 feature space, while local motif organization shows a moderate association with the learned similarity structure. In contrast, classical grayscale texture, global geometric, and frequency-domain descriptors capture complementary but less directly aligned aspects of brocade appearance. The weight-scanning experiment further shows that different handcrafted descriptors interact differently with deep predictions: color fusion is stable but largely redundant, whereas texture fusion requires more careful calibration and integration. These results provide a basis for future work on larger datasets, more robust validation, and adaptive fusion strategies for interpretable digital documentation and comparative analysis of ethnic textile heritage.
5. Conclusions
This study proposed an interpretable computational framework for visual similarity analysis of ethnic brocade images from Southwest China. By combining backbone benchmarking with descriptor-based interpretation, the framework moves beyond conventional classification evaluation and provides a structured way to analyze how deep representations encode inter-ethnic visual relationships. The main conclusions are as follows:
- (1)
- Among the evaluated backbone networks, SResNet-18 achieved the best classification performance (Accuracy = 95.15%, F1 = 95.14%), demonstrating its effectiveness as a feature extractor for brocade image representation and subsequent similarity analysis.
- (2)
- The deep similarity structure is most strongly associated with color-related information, followed by local-structure information. In contrast, geometric and frequency-domain descriptors contribute less, while classical grayscale texture descriptors show weak correspondence with deep representations.
- (3)
- The weighted fusion of handcrafted descriptor-based similarity matrices improved the approximation of the deep similarity structure, indicating that the similarity relationships learned by deep models can be better interpreted through multiple complementary visual cues rather than through a single descriptor family.
- (4)
- Comparative analysis under three distance metrics suggests that the visual similarity among ethnic brocades cannot be explained by geographic distance alone. The feature space relationships reveal image-based visual patterns that can provide clues for subsequent studies integrating cultural-historical, ethnographic, and craft-transmission evidence.
In summary, the proposed framework provides an effective and interpretable approach for visual similarity analysis in cultural heritage images. Its findings have potential applications in image retrieval, pattern comparison, and digital documentation of ethnic textile heritage. Future work will focus on larger-scale datasets, repeated prototype sampling, external validation, finer-grained motif annotation, and more adaptive interpretable fusion and explainable deep learning methods to further improve the robustness and generalizability of the findings.
Author Contributions
Conceptualization, H.L.; Methodology, H.L. and Q.L.; Software, Q.L. and S.L.; Formal Analysis, Q.L.; Data Curation, Q.L. and D.S.; Validation, Q.L.; Writing-Original Draft Preparation, Q.L. and S.L.; Writing-Review and Editing, Q.L. and H.L.; Visualization, Q.L.; Supervision, H.L.; Project Administration, H.L. and B.Z.; Funding acquisition, H.L. and B.Z. All authors have read and agreed to the published version of the manuscript.
Funding
This research was funded by the National Social Science Foundation of China, grant number 22VMZ004.
Institutional Review Board Statement
Not applicable.
Informed Consent Statement
Not applicable.
Data Availability Statement
The raw data supporting the conclusions of this article will be made available by the authors on request.
Conflicts of Interest
The authors declare no conflicts of interest.
References
- UNESCO Intangible Cultural Heritage. Craftsmanship of Nanjing Yunjin Brocade. 2009. Available online: https://ich.unesco.org/en/RL/craftsmanship-of-nanjing-yunjin-brocade-00200 (accessed on 5 May 2026).
- Liu, Y.; Zhang, D.; Lu, G.; Ma, W.Y. A survey of content-based image retrieval with high-level semantics. Pattern Recognit. 2007, 40, 262–282. [Google Scholar] [CrossRef] [Scilit]
- Kwan, P.W.; Kameyama, K.; Gao, J.; Toraichi, K. Content-based image retrieval of cultural heritage symbols by interaction of visual perspectives. Int. J. Pattern Recognit. Artif. Intell. 2011, 25, 643–673. [Google Scholar] [CrossRef] [Scilit]
- Blettery, E.; Gouet-Brunet, V. Heritage Iconographic Content Structuring: From Automatic Linking to Visual Validation. ACM J. Comput. Cult. Herit. 2024, 17, 1–32. [Google Scholar] [CrossRef] [Scilit]
- Hameed, I.M.; Abdulhussain, S.H.; Mahmmod, B.M. Content-based image retrieval: A review of recent trends. Cogent Eng. 2021, 8, 1927469. [Google Scholar] [CrossRef] [Scilit]
- Datta, R.; Joshi, D.; Li, J.; Wang, J.Z. Image retrieval: Ideas, influences, and trends of the new age. ACM Comput. Surv. (Csur) 2008, 40, 1–60. [Google Scholar] [CrossRef] [Scilit]
- Ay, B.; Aydin, G. Visual similarity-based fashion recommendation system. In Generative Adversarial Networks for Image-to-Image Translation; Elsevier: Amsterdam, The Netherlands, 2021; pp. 185–203. [Google Scholar]
- Cai, Q.; Ma, M.; Wang, C.; Li, H. Image neural style transfer: A review. Comput. Electr. Eng. 2023, 108, 108723. [Google Scholar] [CrossRef] [Scilit]
- Huang, J.; Feris, R.S.; Chen, Q.; Yan, S. Cross-domain image retrieval with a dual attribute-aware ranking network. In Proceedings of the IEEE International Conference on Computer Vision, Santiago, Chile, 7–13 December 2015; pp. 1062–1070. [Google Scholar]
- Liu, Z.; Luo, P.; Qiu, S.; Wang, X.; Tang, X. Deepfashion: Powering robust clothes recognition and retrieval with rich annotations. In Proceedings of the IEEE Conference on Computer Vision and Pattern Recognition, Las Vegas, NV, USA, 27–30 June 2016; pp. 1096–1104. [Google Scholar]
- Jähne, B. Digital Image Processing; Springer: Berlin/Heidelberg, Germany, 2005. [Google Scholar]
- Wang, Z.; Bovik, A.C.; Sheikh, H.R.; Simoncelli, E.P. Image quality assessment: From error visibility to structural similarity. IEEE Trans. Image Process. 2004, 13, 600–612. [Google Scholar] [CrossRef] [Scilit]
- Zhang, L.; Zhang, L.; Mou, X.; Zhang, D. FSIM: A feature similarity index for image quality assessment. IEEE Trans. Image Process. 2011, 20, 2378–2386. [Google Scholar] [CrossRef] [Scilit] [PubMed]
- Sheikh, H.R.; Bovik, A.C. Image information and visual quality. IEEE Trans. Image Process. 2006, 15, 430–444. [Google Scholar] [CrossRef] [Scilit]
- Manjunath, B.S.; Ohm, J.R.; Vasudevan, V.V.; Yamada, A. Color and texture descriptors. IEEE Trans. Circuits Syst. Video Technol. 2001, 11, 703–715. [Google Scholar] [CrossRef] [Scilit]
- Lowe, D.G. Distinctive image features from scale-invariant keypoints. Int. J. Comput. Vis. 2004, 60, 91–110. [Google Scholar] [CrossRef] [Scilit]
- Wang, T.; Wen, B. Research on image recognition of ethnic minority clothing based on improved vision transformer. Math. Found. Comput. 2024, 7, 84–97. [Google Scholar] [CrossRef] [Scilit]
- Ding, X.; Li, T.; Chen, J.; Zou, F. Research on She nationality clothing recognition based on color feature fusion with PSO-SVM. AUTEX Res. J. 2023, 24, 20230005. [Google Scholar] [CrossRef] [Scilit]
- Maji, S.; Bose, S. CBIR using features derived by deep learning. ACM/IMS Trans. Data Sci. (TDS) 2021, 2, 1–24. [Google Scholar] [CrossRef] [Scilit]
- Zhang, R.; Isola, P.; Efros, A.A.; Shechtman, E.; Wang, O. The unreasonable effectiveness of deep features as a perceptual metric. In Proceedings of the IEEE Conference on Computer Vision and Pattern Recognition, Salt Lake City, UT, USA, 18–22 June 2018; pp. 586–595. [Google Scholar]
- Krizhevsky, A.; Sutskever, I.; Hinton, G.E. Imagenet classification with deep convolutional neural networks. In Proceedings of the Advances in Neural Information Processing Systems 25 (NIPS 2012), Lake Tahoe, NV, USA, 3–6 December 2012; pp. 1097–1105. [Google Scholar]
- Nair, V.; Hinton, G.E. Rectified linear units improve restricted boltzmann machines. In Proceedings of the 27th International Conference on Machine Learning (ICML-10), Haifa, Israel, 21–24 June 2010; pp. 807–814. [Google Scholar]
- Srivastava, N.; Hinton, G.; Krizhevsky, A.; Sutskever, I.; Salakhutdinov, R. Dropout: A simple way to prevent neural networks from overfitting. J. Mach. Learn. Res. 2014, 15, 1929–1958. [Google Scholar]
- Simonyan, K.; Zisserman, A. Very deep convolutional networks for large-scale image recognition. arXiv 2014, arXiv:1409.1556. [Google Scholar]
- He, K.; Zhang, X.; Ren, S.; Sun, J. Deep residual learning for image recognition. In Proceedings of the IEEE Conference on Computer Vision and Pattern Recognition, Las Vegas, NV, USA, 27–30 June 2016; pp. 770–778. [Google Scholar]
- Hu, J.; Shen, L.; Sun, G. Squeeze-and-excitation networks. In Proceedings of the IEEE Conference on Computer Vision and Pattern Recognition, Salt Lake City, UT, USA, 18–22 June 2018; pp. 7132–7141. [Google Scholar]
- Pan, S.J.; Yang, Q. A survey on transfer learning. IEEE Trans. Knowl. Data Eng. 2009, 22, 1345–1359. [Google Scholar] [CrossRef] [Scilit]
- Hartigan, J.A.; Wong, M.A. Algorithm AS 136: A k-means clustering algorithm. J. R. Stat. Soc. Ser. C (Appl. Stat.) 1979, 28, 100–108. [Google Scholar] [CrossRef] [Scilit]
- Yang, L. Distance Metric Learning: A Comprehensive Survey; Technical Report; Department of Computer Science and Engineering, Michigan State University: East Lansing, MI, USA, 2006; pp. 1–51. [Google Scholar]
- Aggarwal, C.C. Data Mining: The Textbook; Springer: Berlin/Heidelberg, Germany, 2015; Volume 1. [Google Scholar]
- Han, J.; Kamber, M.; Mining, D. Concepts and techniques. Morgan Kaufmann 2006, 340, 94104–103205. [Google Scholar]
- Rosenfeld, A.; Pfaltz, J.L. Distance functions on digital pictures. Pattern Recognit. 1968, 1, 33–61. [Google Scholar] [CrossRef] [Scilit]
- You, K. Semantics at an Angle: When Cosine Similarity Works Until It Doesn’t. arXiv 2025, arXiv:2504.16318. [Google Scholar]
- Ojala, T.; Pietikainen, M.; Maenpaa, T. Multiresolution gray-scale and rotation invariant texture classification with local binary patterns. IEEE Trans. Pattern Anal. Mach. Intell. 2002, 24, 971–987. [Google Scholar] [CrossRef] [Scilit]
- Hu, M.K. Visual pattern recognition by moment invariants. IRE Trans. Inf. Theory 1962, 8, 179–187. [Google Scholar] [CrossRef] [Scilit]
- Tao, Y. A Texture Feature Extraction Technique Using 2D-DFT and Hamming Distance Yu Tao, Vallipuram Muthukkumarasamy, Brijesh Verma and Michael Blumenstein School of Information Technology Griffith University, Gold Coast Campus, QLD 9726, Australia. In Proceedings of the Fifth International Conference on Computational Intelligence and Multimedia Applications: ICCIMA 2003, Xi’an, China, 27–30 September 2003; Institute of Electrical & Electronics Engineers (IEEE): Washington, DC, USA, 2003; p. 120. [Google Scholar]
- Lande, M.V.; Bhanodiya, P.; Jain, P. An effective content-based image retrieval using color, texture and shape feature. In Proceedings of the Intelligent Computing, Networking, and Informatics: Proceedings of the International Conference on Advanced Computing, Networking, and Informatics, Raipur, India, 12–14 June 2013; Springer: New Delhi, India, 2014; pp. 1163–1170. [Google Scholar]
- Zhu, L.; Chen, T.; Yin, J.; See, S.; Liu, J. Learning gabor texture features for fine-grained recognition. In Proceedings of the IEEE/CVF International Conference on Computer Vision, Paris, France, 2–3 October 2023; pp. 1621–1631. [Google Scholar]



Disclaimer/Publisher’s Note: The statements, opinions and data contained in all publications are solely those of the individual author(s) and contributor(s) and not of MDPI and/or the editor(s). MDPI and/or the editor(s) disclaim responsibility for any injury to people or property resulting from any ideas, methods, instructions or products referred to in the content. |
© 2026 by the authors. Licensee MDPI, Basel, Switzerland. This article is an open access article distributed under the terms and conditions of the Creative Commons Attribution (CC BY) license.