


Abstract
Quarries represent critical sites for raw material extraction, for which regular monitoring and mine surveying documentation, along with its updating, is essential to ensuring safety, environmental protection, and effective management of the mining process. This article aims to evaluate the modern approach to quarry surveying and the creation of a base mining map using advanced laser scanning methods, such as terrestrial laser scanning (TLS) and simultaneous localization and mapping (SLAM)-based mobile laser scanning (MLS). Particular attention is given to the analysis of noise generated using TLS and SLAM-based MLS methods. An analysis of mutual differences between point clouds is presented to compare the spatial accuracy of the point clouds obtained using MLS technology against those from the reference TLS method on both horizontally and vertically oriented test areas. To assess the quality and usability of data obtained using the TLS and MLS methods, a selected section of the mining wall was analyzed based on the distance between points (Cloud-to-Cloud analysis), cross-section analysis, and volume calculations based on 3D mesh models generated from stage edges and point clouds. The findings offer valuable insights into the effective use of each method in quarry surveying, contributing to the development of innovative approaches to spatial data collection as a base for creating Digital Twins of quarries. The article also evaluates the efficiency of both measurement approaches in terms of accuracy, measurement speed, and practical applicability in mining practices. The results show that the point cloud obtained by the TLS Leica RTC360 device, compared to that by the MLS method using the FARO Orbis device (FARO Technologies, Inc., Lakemary, FL, USA), achieves better values in terms of average noise level, standard deviation, interval of highest point density, and RMSD (Root Mean Square Deviation) in test areas. Our conclusions highlight the high potential of laser scanning for the modernization of mining documentation and the improvement of surveying processes in the smart mining industry, particularly for updating Digital Elevation Models (DEMs), Digital Terrain Models (DTMs), Digital Surface Models (DSMs), and other 3D models of quarries for the creation of their Digital Twins.
1. Introduction
The surveying of quarries is a key process in smart mining and a key process in Digital Twin creation and 3D model actualization. Digital data from geodetic measurements is essential for efficient mining management, tracking of stock changes in the quarry, slope stability assessment, and minimization of environmental impacts. Accurate and regular spatial data collection enables the identification of potential risks, optimization of mining procedures, and assurance of workplace safety. Nowadays, modern technologies such as TLS, MLS, and UAS (Unmanned Aerial System) photogrammetric and Lidar (Light Detection and Ranging) scanning are increasingly used in mining geodesy and cartography. These methods represent a revolutionary approach to spatial data collection, combining high accuracy, flexibility, and the ability to cover extensive and complex areas.
Among these modern approaches to spatial data collection, TLS plays a significant role as one of the most accurate non-contact measurement technologies [1,2]. It is based on the principle of static scanning, where measurements are performed from fixed, predefined positions to achieve maximum accuracy and detail of the resulting data. The main output of this method is a highly detailed point cloud that accurately represents the shape, structure, and surface of the documented object [3,4]. TLS is characterized by high precision, a dense distribution of measured points, and the ability to capture complex geometries [5,6]. It is used for precise mapping of objects and terrains that require detailed geometric records—for example, documentation of walls and slopes in quarries, where it provides data essential for shape-change analysis, volume calculations, or stability assessment [7,8].
Another technology with increasing significance is MLS, which extends the capabilities of TLS by enabling dynamic data collection on the move [9,10,11]. The MLS system consists of a laser sensor, cameras, and positioning units (GNSS and IMU), which allow the determination of the device’s position and orientation during measurement [12,13,14]. This system is also capable of digitizing complex 3D scenes while moving without GNSS, thanks to simultaneous localization and mapping (SLAM) algorithms [15,16]. The MLS method assists in capturing extensive or hard-to-access areas in a short time, producing point clouds with high accuracy and detail [17,18]. All these advantages can also be applied in quarry environments, where this method is effective for spatial data acquisition [19,20,21]. Such an approach currently represents a valuable tool for modern geodetic applications in mining and industrial sites [22,23]. Compared to TLS, MLS offers greater flexibility for mapping large or difficult-to-access areas, as it allows data collection while moving, whereas TLS requires static positions and more time to cover larger surfaces [24,25]. On the other hand, TLS provides higher accuracy and point density on smaller objects or areas, which is advantageous for detailed 3D modeling [26,27].
TLS technology was used by the authors of [28], where surface mines were scanned using the TLS method for the purpose of three-dimensional mapping and monitoring. The article presents a methodological framework for generating point clouds from TLS, as well as their processing, integration, and object-based classification for 3D mapping. Scanning was performed using a Leica device, specifically the Leica HDS8800 scanner. For additional georeferencing, 97 circular GCPs were used. A digital surface model (DSM) was generated for each area to assess the accuracy of the outputs. In conclusion, the authors state that the overall accuracy of land cover classification was 90.67%, based on the object-based image analysis approach in mining areas. The proposed framework, supported by additional TLS input data, can provide detailed information for monitoring, assessment, and planning of mining areas with high precision and frequent data acquisition. Furthermore, the positional accuracy based on GCPs derived from TLS point clouds is close to that obtained through GNSS-based surveying. The results also demonstrate that TLS point clouds can be more frequently used in mountainous and high-risk areas, where GNSS surveying is difficult to perform.
The authors of [29] focused on modern, fast, and accurate mapping of surface mines by exploring advanced digital technological solutions aimed at automating the processes of data acquisition, processing, and analysis related to deposit management. The research was conducted at the Mikoszów granite surface mine, located in Poland. A mobile LiDAR system, mounted on a terrain vehicle equipped with the necessary devices, was used to collect accurate data. In this study, the Riegl VMZ400i laser scanner was employed, capturing 97,018,764 points with an average density of approximately 1500 points/m2. For comparison, the authors also used a handheld mobile scanner, the Velodyne VLP-16, in the same location. It captured 2,241,746 points with an average density of 50 points/m2. There is also a significant difference in data density: the Riegl VMZ400i provides an average of 1500 points/m2, while SLAM offers only 50 points/m2. The results of the experiment at the Mikoszów surface mine confirm that combining MLS and SLAM technologies enables effective creation and updating of 3D mine models. LiDAR technologies provide fast and accurate 3D information on mining processes, which can be used throughout the entire life cycle of surface mines—from exploration and extraction to reclamation and post-mining land management. MLS technology is experiencing dynamic development in geodesy, demonstrated by increased measurement accuracy, higher data acquisition volumes, faster scanning speeds, and broader applicability across various industries.
The research in [30] focused on a full three-dimensional kinematic analysis method applied to the steep rock faces of an abandoned quarry near Florence. A RIEGL VZ1000 terrestrial laser scanner was used for high-resolution scanning, with an average point spacing of 8 mm. For georeferencing, six marker reflectors were used. The final point cloud consisted of 100,000,000 points. The results of the test application at the abandoned quarry site clearly demonstrate that the proposed method is capable of thoroughly assessing the kinematic feasibility of structurally controlled instabilities.
In [31], the authors focused on an analysis aimed at assessing the stability of a rock slope. Data collection was conducted using the TLS method with a Topcon 2000 device and the UAS method with a DJI Phantom 4 Pro UAV. The combination of terrestrial laser scanning and unmanned aerial systems, which generates three-dimensional point data, is perceived as an alternative approach to traditional geological surveying for evaluating the stability of rock slopes.
Our research provides a comprehensive overview of the methodology, surveying equipment, and software tools used, as well as the results of applying these technologies to a specific location. We believe that the existing literature has so far not paid sufficient attention to the systematic evaluation of the quality of input data acquired by modern SLAM-based mobile laser scanners, particularly in terms of their applicability to Digital Twin creation in surface mining. Our study is focused on mapping a quarry in eastern Slovakia using non-contact surveying methods such as TLS and MLS. Our motivation in conducting this study is to confirm the assumption of efficient and precise large-scale data acquisition, contributing to detailed analysis and mapping of the area, in the process of creating a geospatial base for the Digital Twin of the quarry. Research was conducted using TLS with the Leica RTC360 terrestrial laser scanner, as well as MLS with the FARO Orbis mobile laser scanner. The second section provides a detailed description and characterization of the study area. The third section focuses on specific field measurements, describing the conducted fieldwork and different types of ground control points (GCPs). We also highlight the design of the study regarding the accuracy of GCP coordinate determination based on a precise local geodetic network. Additionally, technical parameters of all measuring instruments and tools used are provided. The fourth section discusses the processing of collected data. The Results section presents the findings from the field measurements, analyzing and comparing various methodological approaches. In this section, we focus on the analysis of mutual differences between point clouds in selected test areas and analysis of the applied methods based on the distances of the points. Noise analysis was also performed in selected test areas. The practical output is the creation of a base mining map, which provides a comprehensive overview of the data used for planning, managing, and ensuring the safety of mining activities and, above all, serves as a fundamental part of the Digital Twin of the mine. Three cross-sections were created and compared based on the minimum and maximum differences and the mean error. Finally, the Discussion section covers the advantages and limitations of each approach, recommendations for their future use in quarry documentation, volume calculations using two different approaches, and an overview of other authors’ studies addressing similar issues. We aspire to contribute, through our research, to the optimization of data collection methods and their application within the digital transformation of the mining industry.
2. Study Area
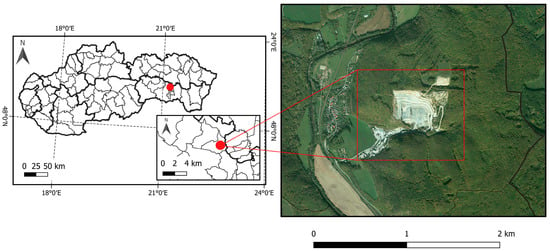
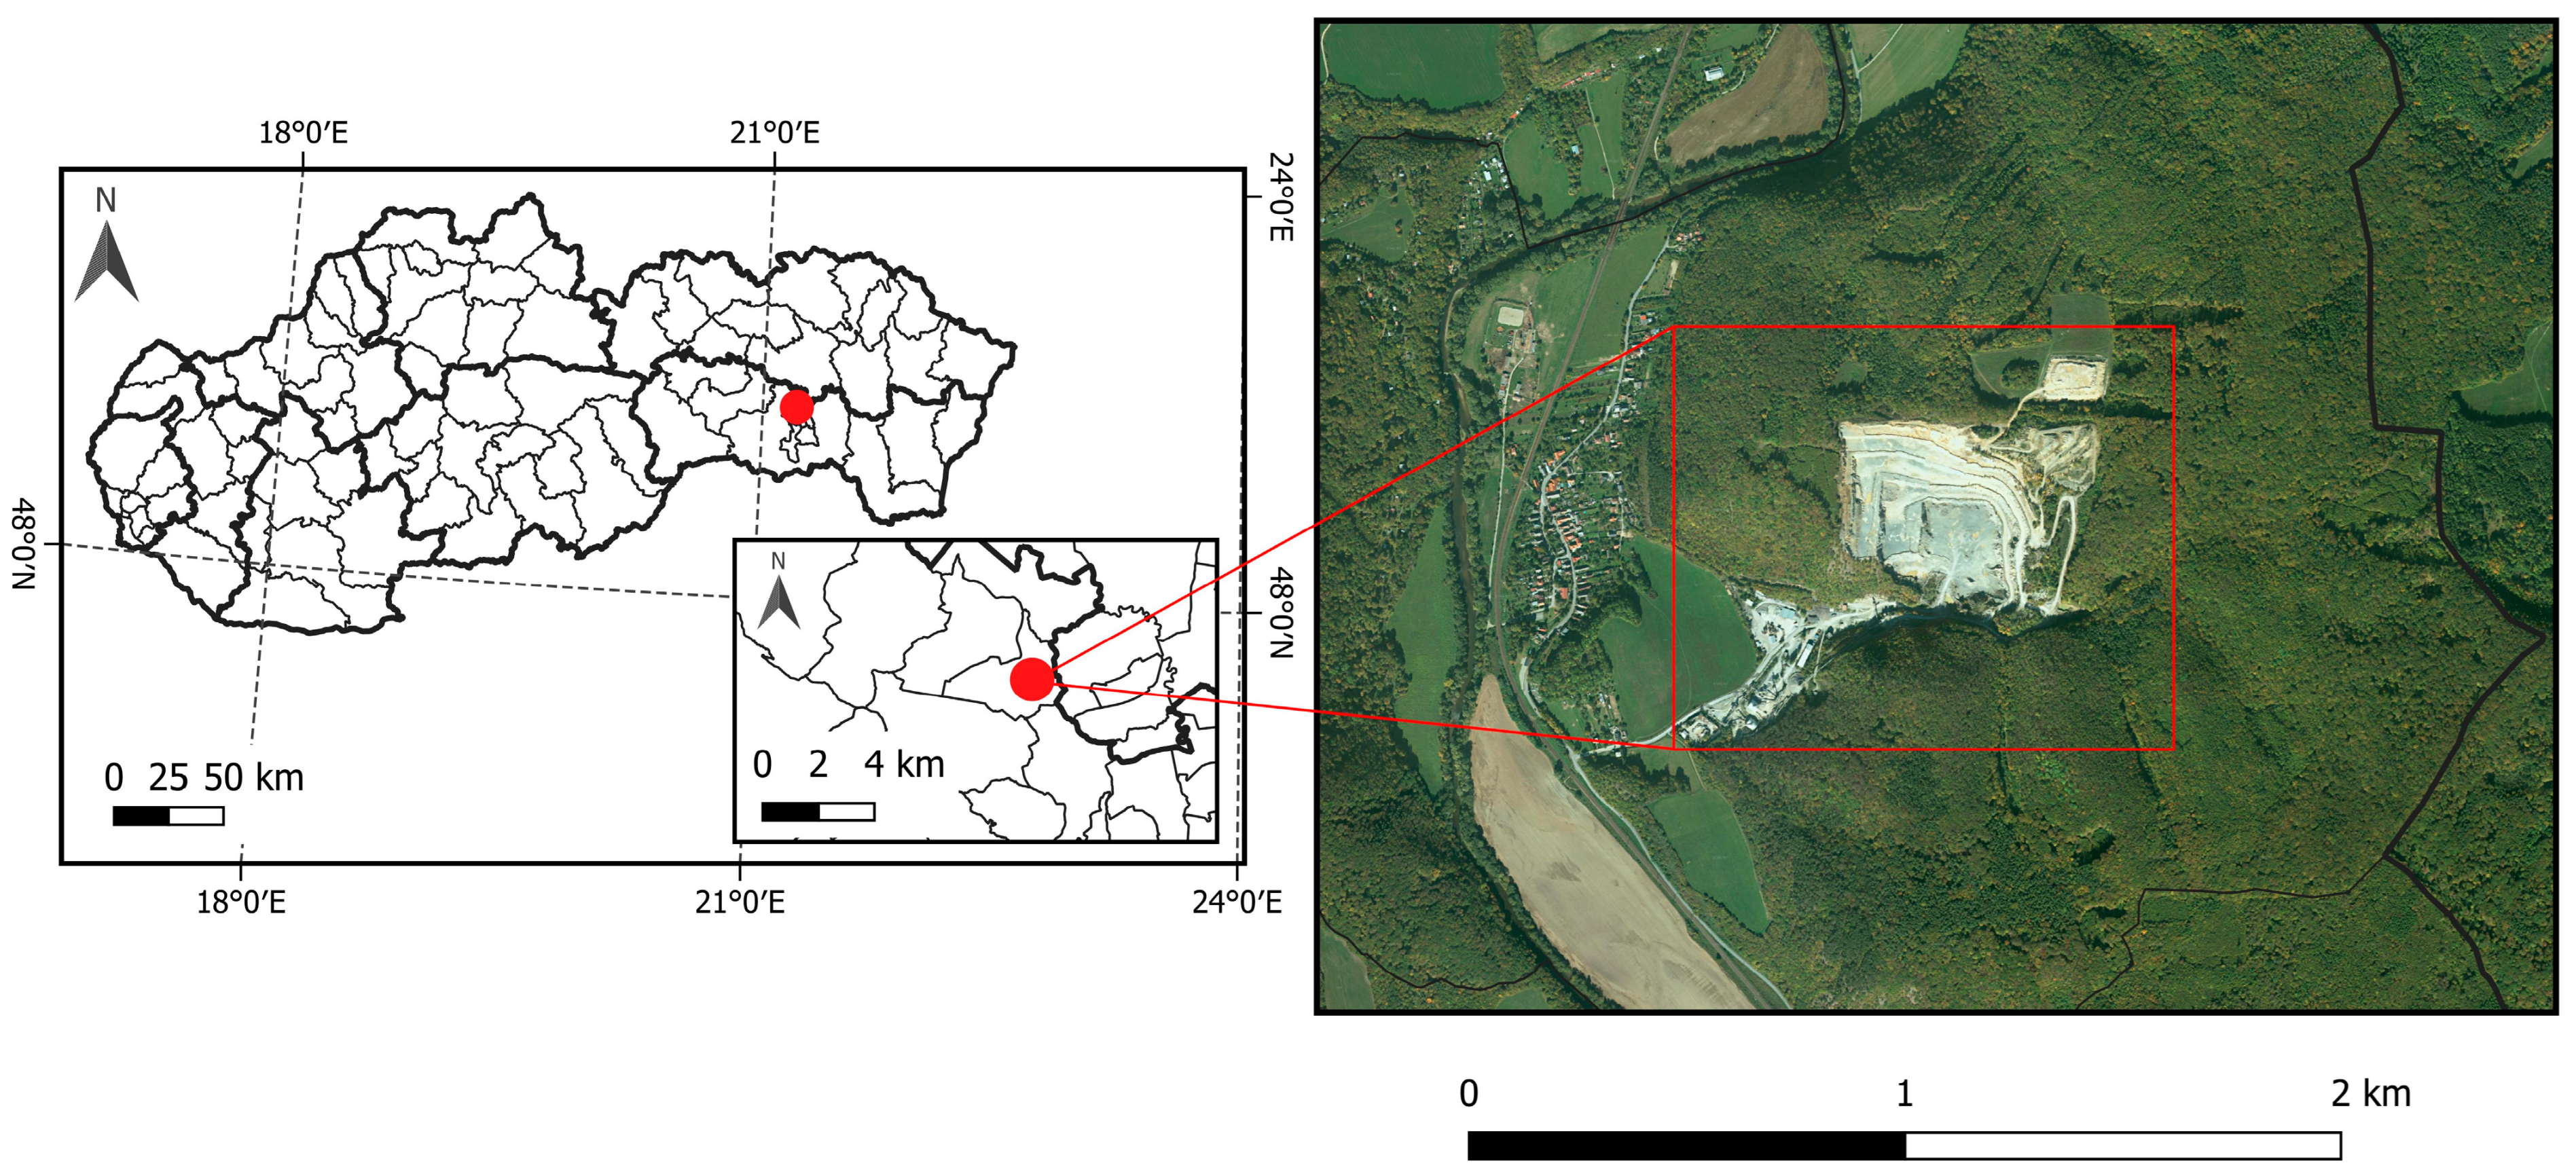
The quarry is located in eastern Slovakia, approximately 15 km north of the city of Košice (Figure 1). It is situated in the Čierna hora mountain range, an area with rich geological bedrock composed of Paleozoic and Mesozoic rocks [32].
Figure 1.
Location of the study area.
3. Materials and Methods
This study focuses on the mapping and documentation of a quarry using non-contact methods—TLS and MLS. These methods were chosen for their high efficiency in generating DEMs and digital maps, as they complement each other and provide comprehensive spatial data. For both surveying methods, GCPs were used for georeferencing the point clouds. Coordinates of GCPs were determined by a total station using the spatial polar method. The fieldwork in this study area was conducted according to the following procedure:
- Terrain reconnaissance and determination of the study area.
- Location and determination of the coordinates of the GCPs for TLS and MLS.
- Measurement using the TLS method.
- Measurement using the MLS method.
The aim of this survey was to accurately capture the current state and morphology of the quarry. To achieve this goal, appropriate surveying instruments, tools, and equipment were used. For TLS, the Leica RTC360 terrestrial laser scanner (Leica Geosystems AG, Heerbrugg, Switzerland) was used. The MLS method was carried out using the FARO Orbis mobile laser scanner. Coordinates of GCPs for TLS and MLS were measured by the Leica Viva TS 15 I total station (Leica Geosystems AG, Heerbrugg, Switzerland). All applied measurement methods, surveying instruments, and input parameters used for data collection are presented in Table 1.
Table 1.
Device settings, surveying parameters, and remarks during data collection.
3.1. The Establishment of the Surveying Network
After determining the extent of the study area and conducting a field survey, three temporarily stabilized survey points were established. These points were stabilized using survey nails and measured using the Leica GS07 GNSS set [33,34] with a quick static method. Measurements were conducted using the RTN method, connected to the Slovak Real-time Positioning Service (SKPOS)—the national active geodetic reference network. The estimated accuracy of coordinate determination for the temporarily stabilized survey points was 0.02 m in position and 0.04 m in height. These points served to connect to the standard reference systems used in the Slovak Republic—the Uniform Trigonometric Cadastral Network (S-JTSK) and Baltic Vertical Datum after Adjustment (Bpv). Inner accuracy of the net has been improved by measurement using the Leica Viva TS 15 I total station with the following adjustment. The accuracy of the coordinates then reaches the value mp ≅ mh = 1 mm.
3.2. Surveying of GCPs and CPs for TLS and MLS
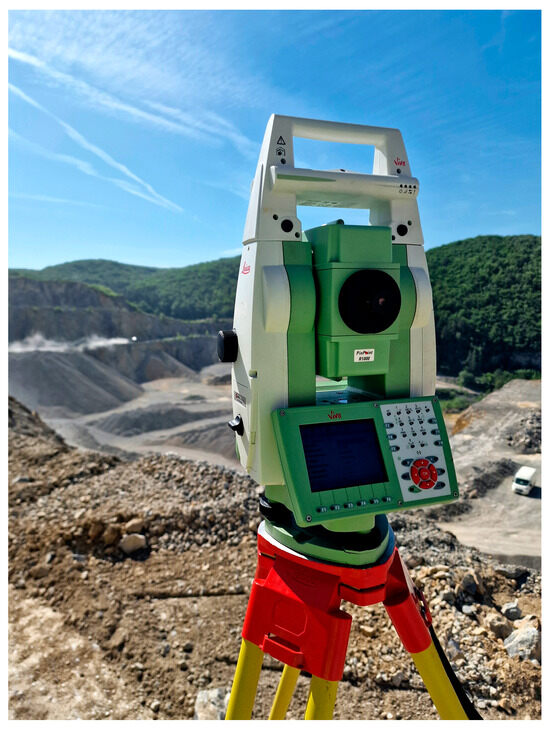
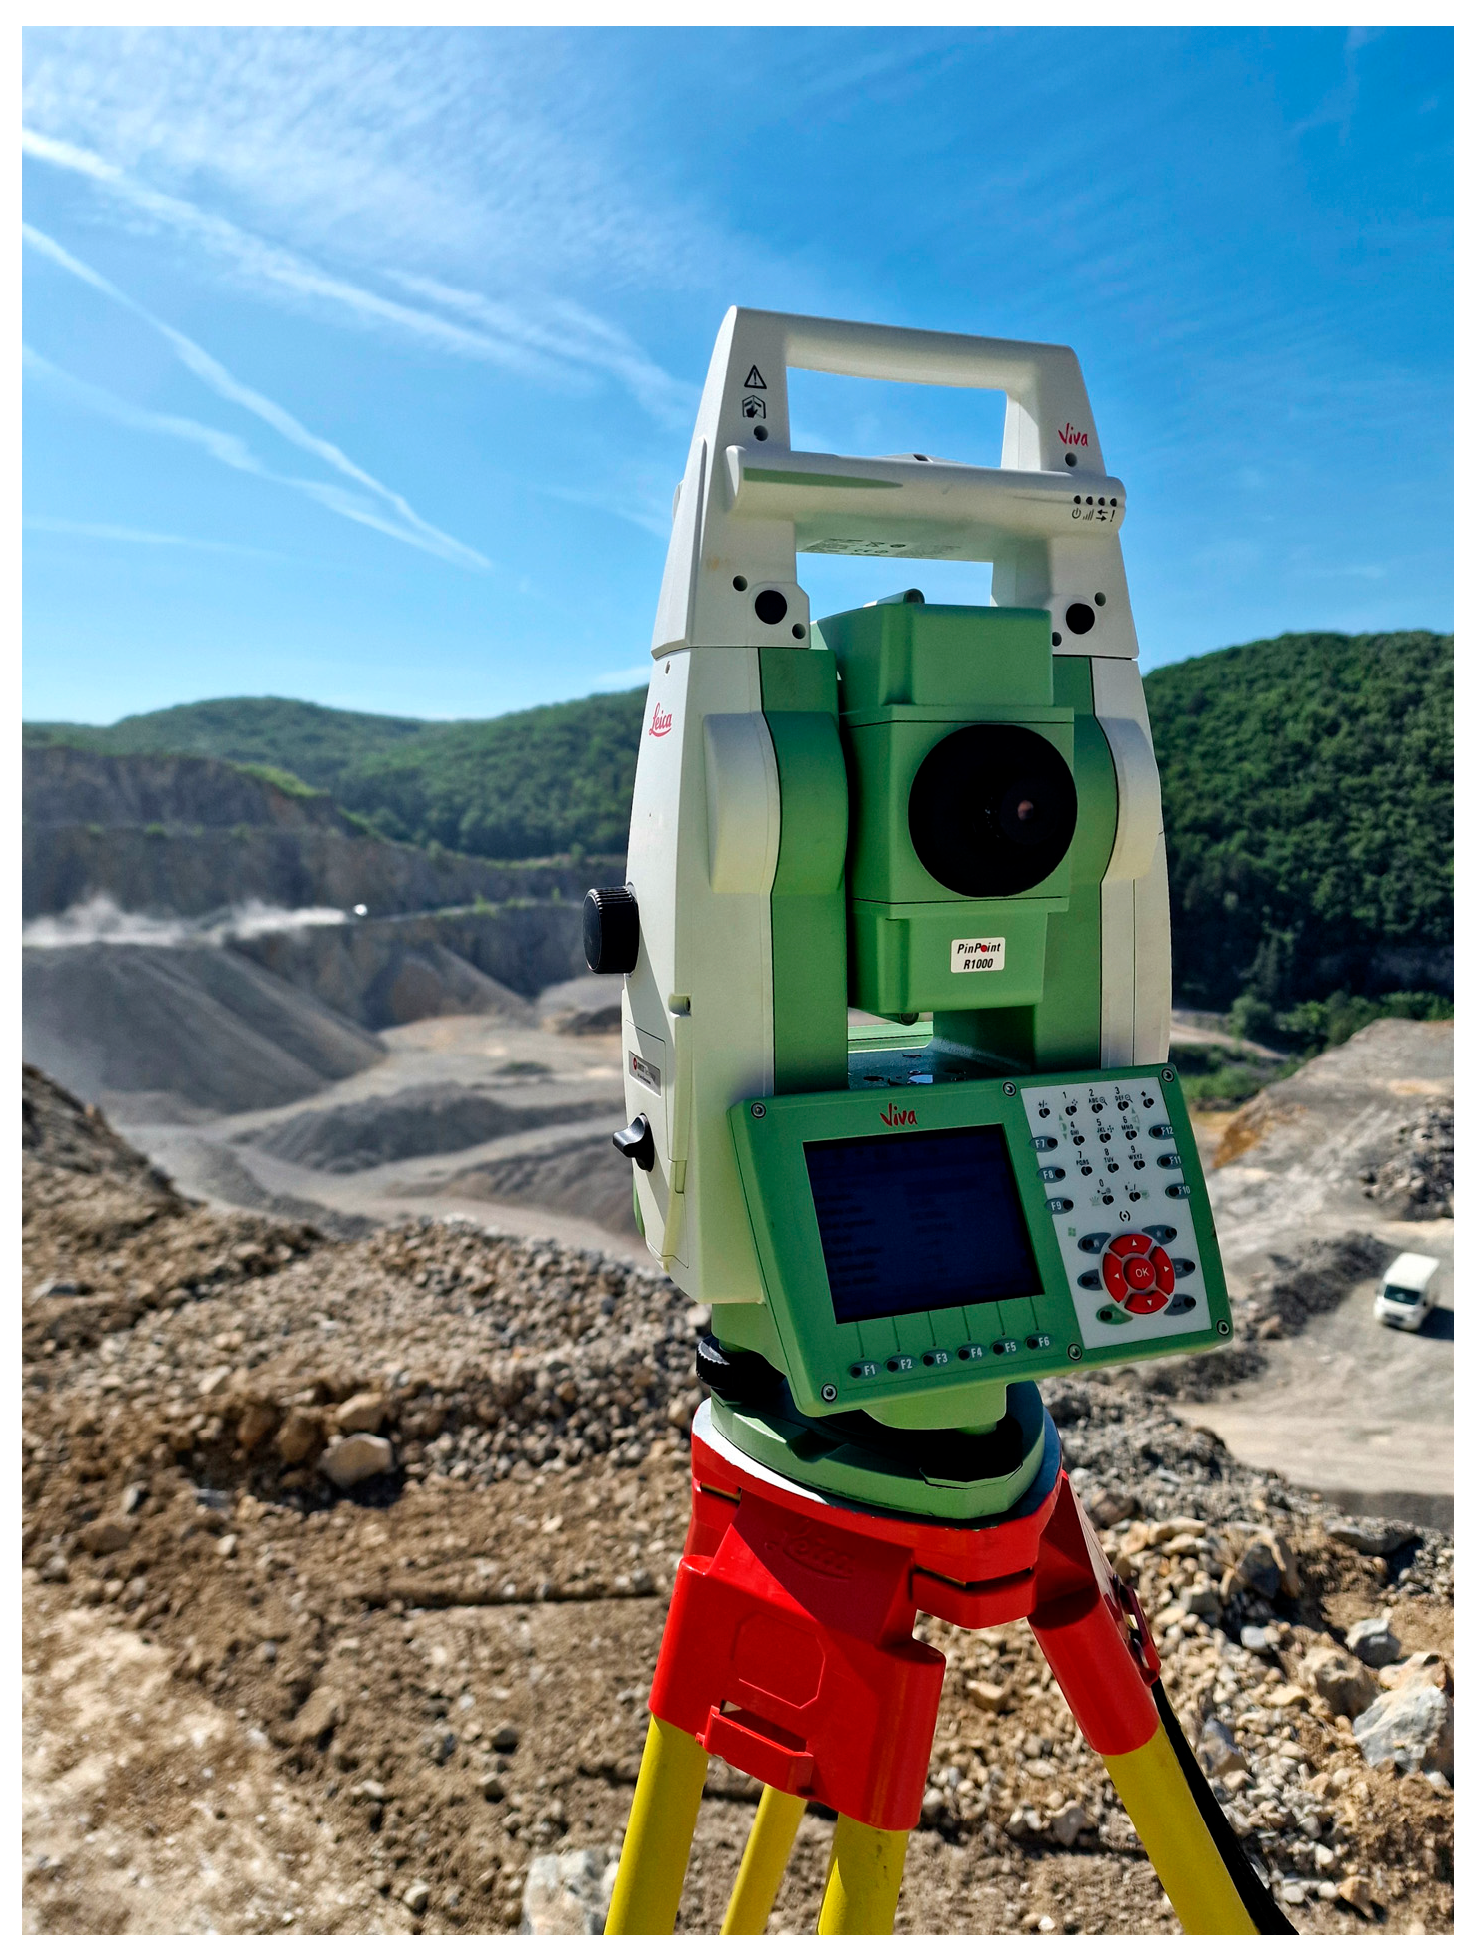
The Leica Viva TS 15 I total station (Figure 2), with an angular accuracy of 1″ (0.3 mgon) and a distance accuracy of 1 mm + 1.5 ppm [35,36], was used to determine coordinates of GCPs for TLS and MLS. A Leica GMP101 mini reflector prism was placed on each GCP. Measurements were made on two faces of the telescope with three repetitions to increase the measurement accuracy. For precise georeferencing, we used an adjusted geodetic network. Its accuracy is characterized by horizontal and vertical RMSEs of up to 1 mm. The RMSEs of the GCPs and CPs are then within 2 mm.
Figure 2.
Leica Viva TS 15 I total station.
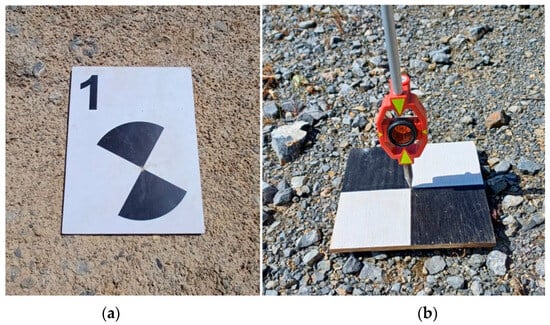
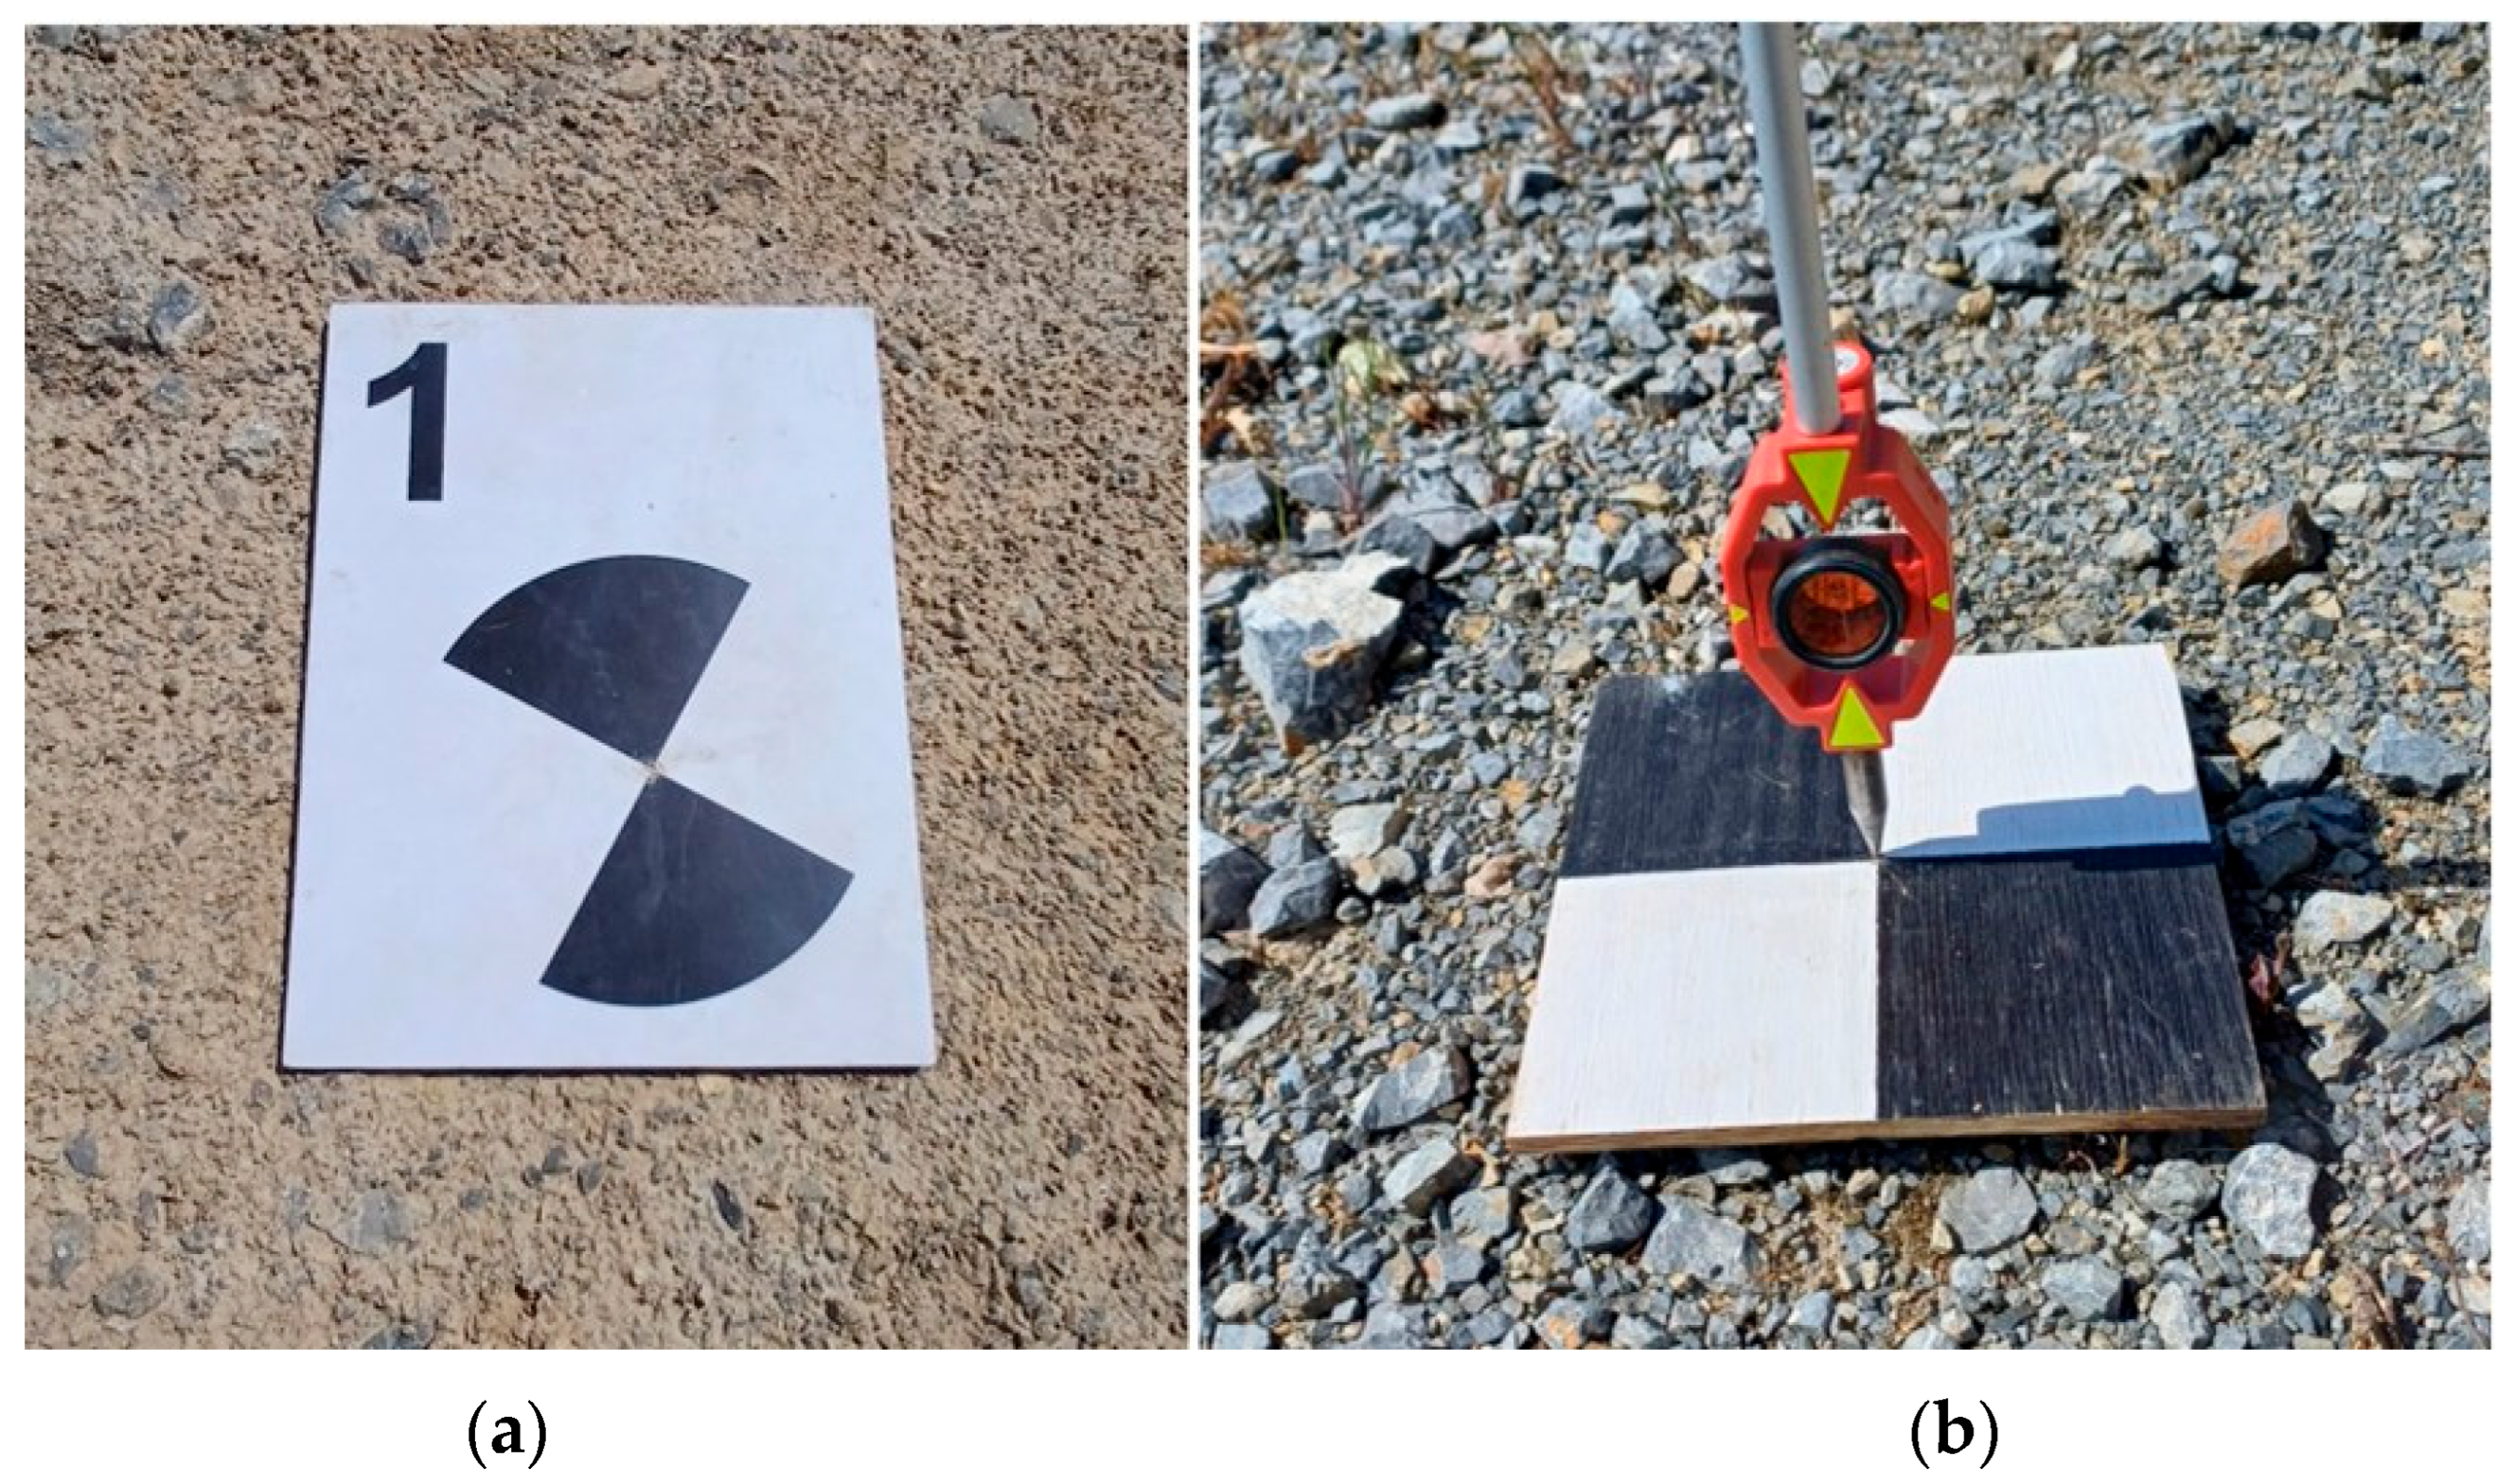
The GCPs for the TLS survey determined using the Leica RTC360 were temporarily stabilized by black-and-white circular scanning targets (Figure 3a). To prevent displacement, these targets were weighed down with stones. At every second station, three GCPs were placed around the scanner and then scanned and used to link the TLS survey to a common coordinate system or as check points (CPs). In total, 24 scanning targets were used.
Figure 3.
GCP (CP) realization for TLS (a) and MLS with Leica GMP101 mini reflector prism (b).
For the MLS method, 11 black-and-white targets (Figure 3b) with dimensions of 0.2 × 0.2 m were used. These targets were temporarily stabilized and evenly distributed in our study area.
3.3. Measurement by TLS and MLS Methods
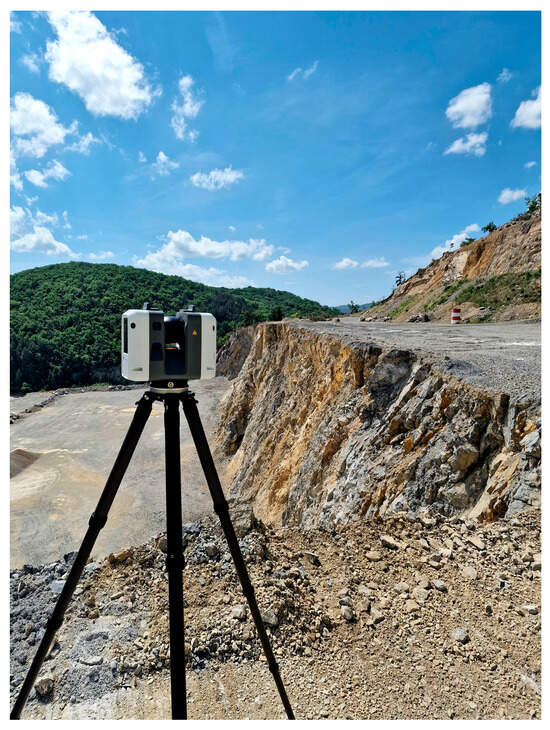
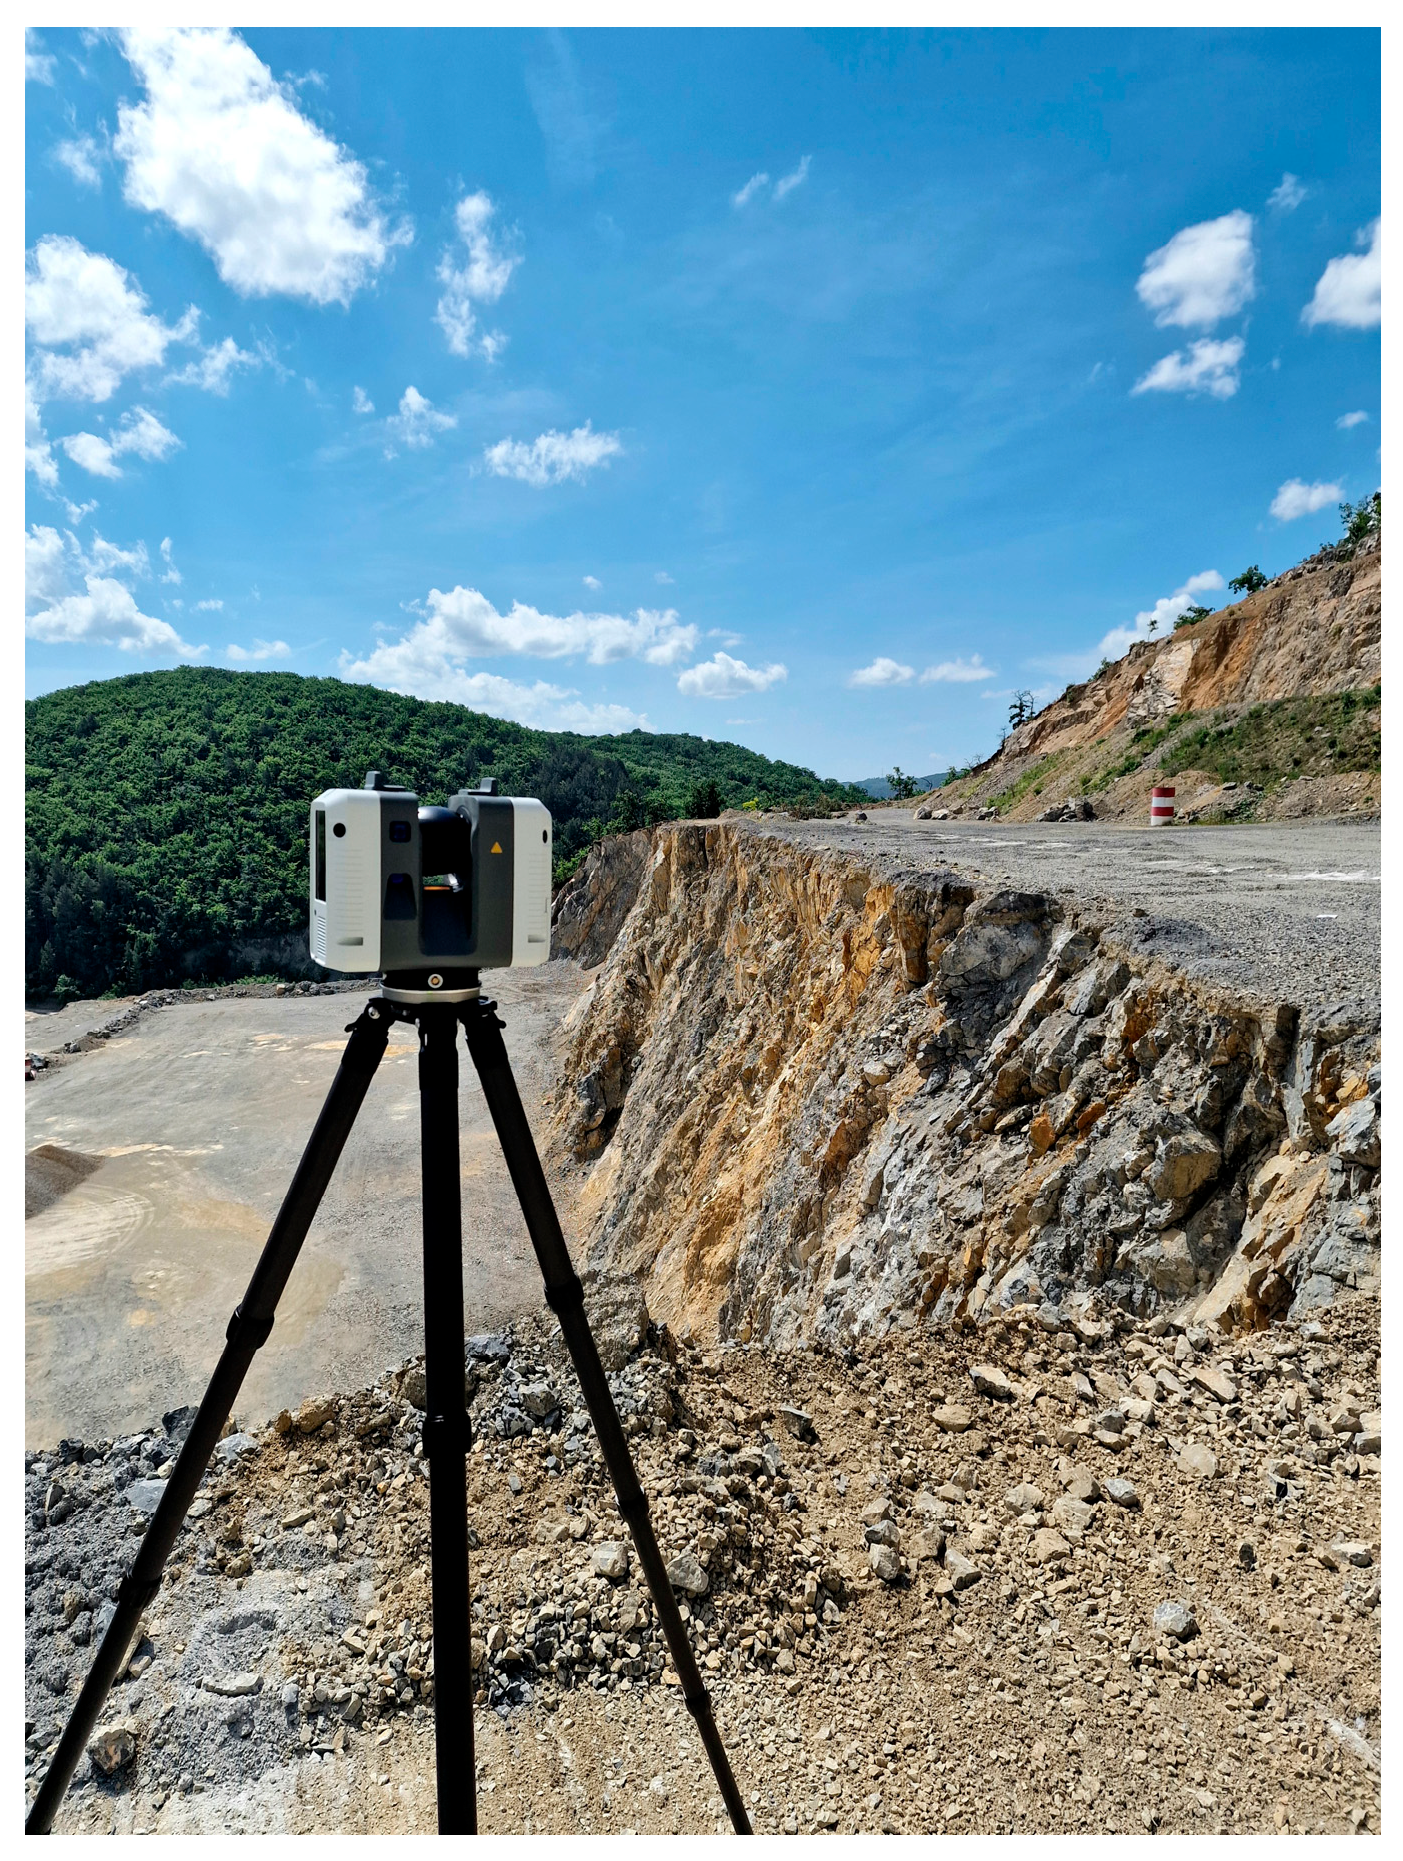
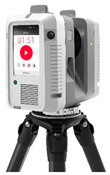
The TLS measurement in the quarry was carried out using the Leica RTC360 terrestrial laser scanner (Figure 4). The Leica RTC360 laser scanner is a time-of-flight (ToF) 3D laser scanner enhanced by Waveform (WFD) technology with a range of up to 130 m. A significant advancement in this technology is the automatic registration of point clouds in the field using VIS technology, which reduces processing time, as well as the dual-scan feature that automatically removes moving objects. Essential technical parameters are shown in Table 2.
Figure 4.
TLS Leica RTC360.
Table 2.
Technical parameters of the Leica RTC360 and FARO Orbis devices [37,38,39,40].
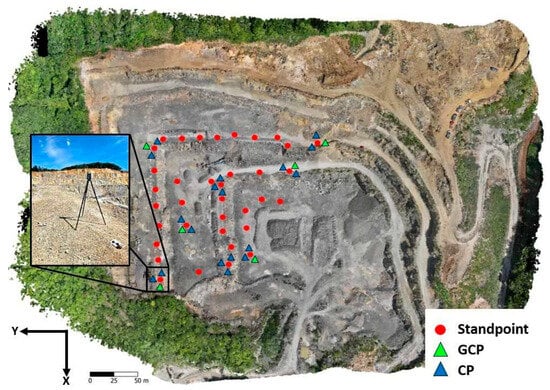
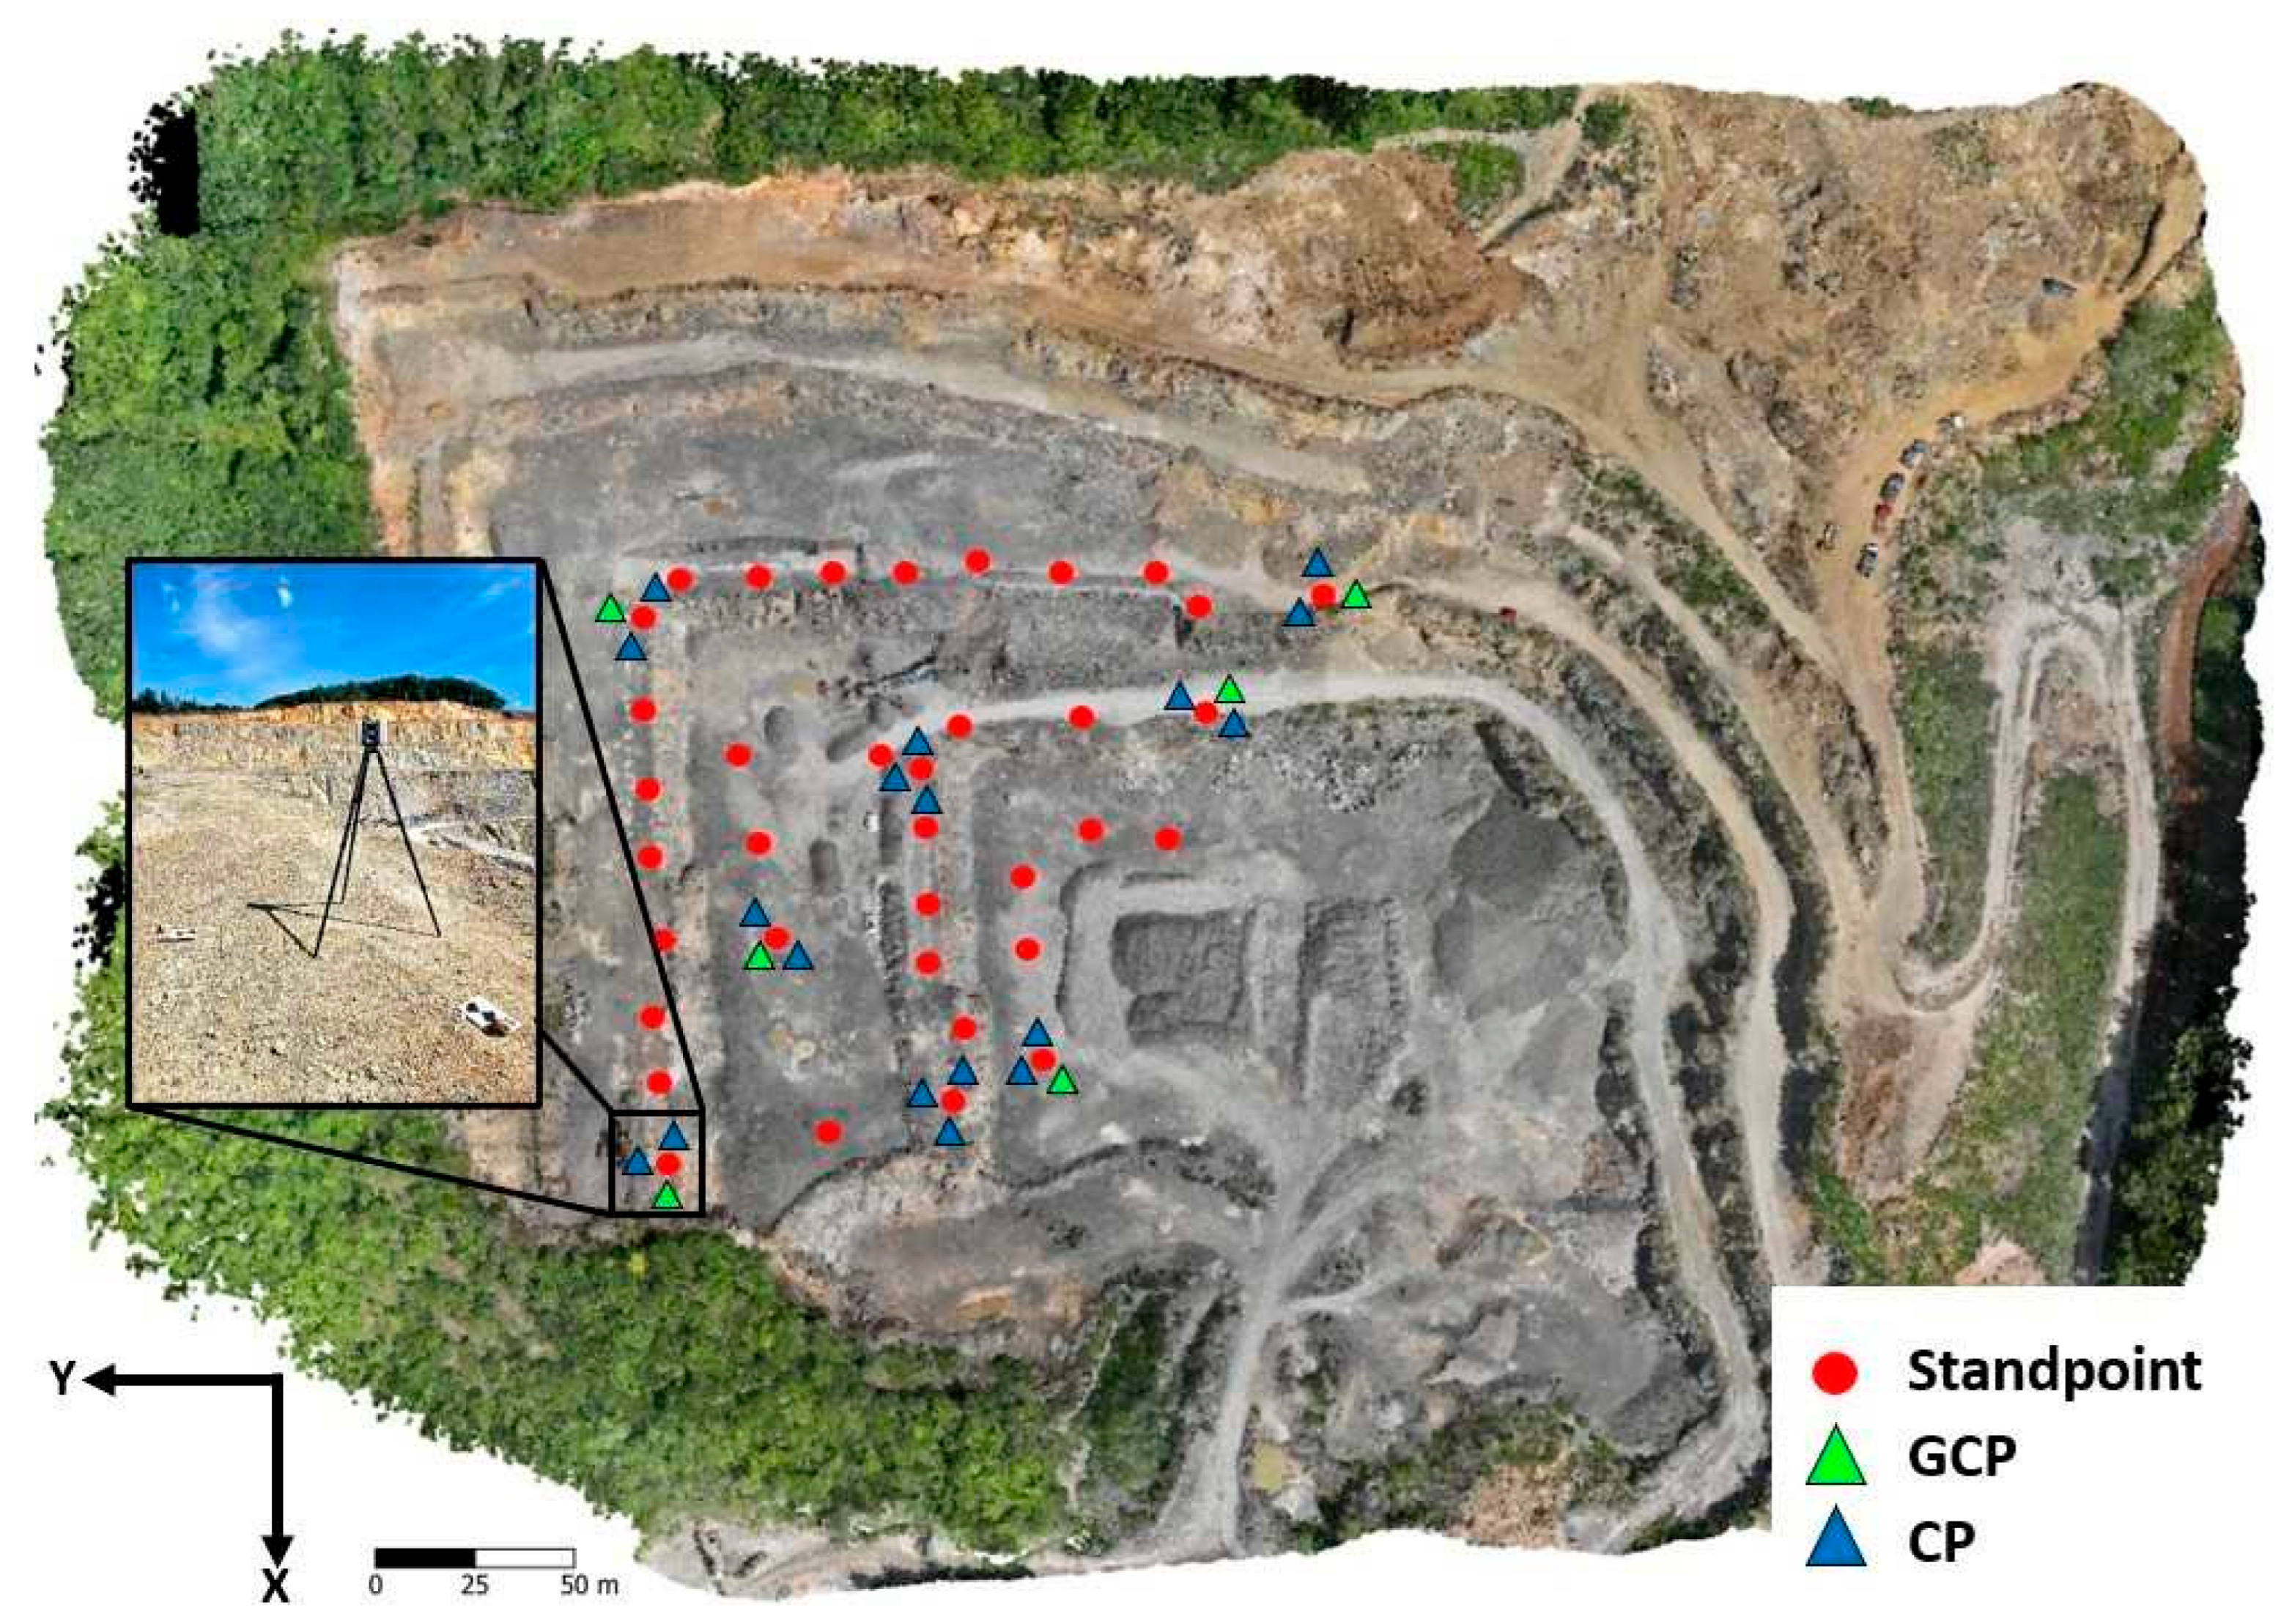
The quarry was captured from 36 stations (Figure 5) at a scanning resolution of 6 mm/10 m with a range of 130 m. For mutual registration of single scans, it is important to maintain sufficient overlap of scans. The measurement using this method took approximately 4 h. We consider the effective methodology for distributing targets for GCPs and CPs in TLS to be a contribution. This methodology involves measuring three temporarily stabilized targets (Figure 3) around the instrument at selected stations. Some of them serve as GCPs and others as CPs. The configuration is clearly shown in Figure 5. This approach can be applied in any measurement environment.
Figure 5.
Distribution of standpoints and GCPs/CPs in surveying by TLS method.
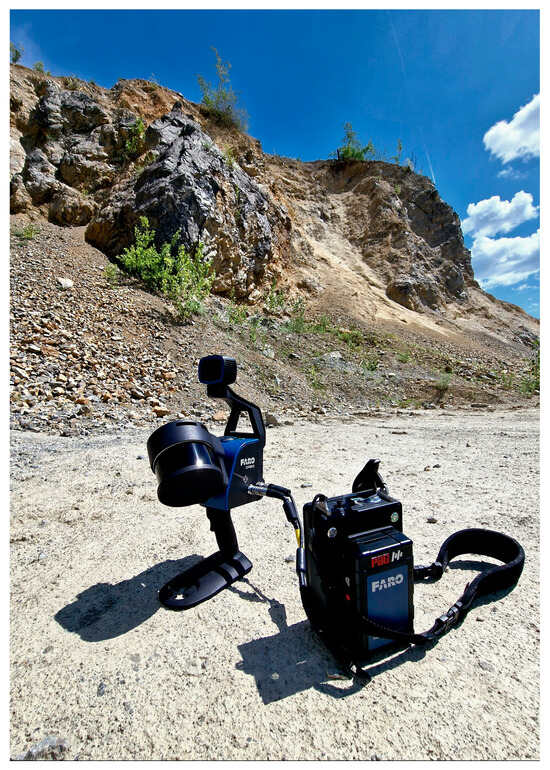
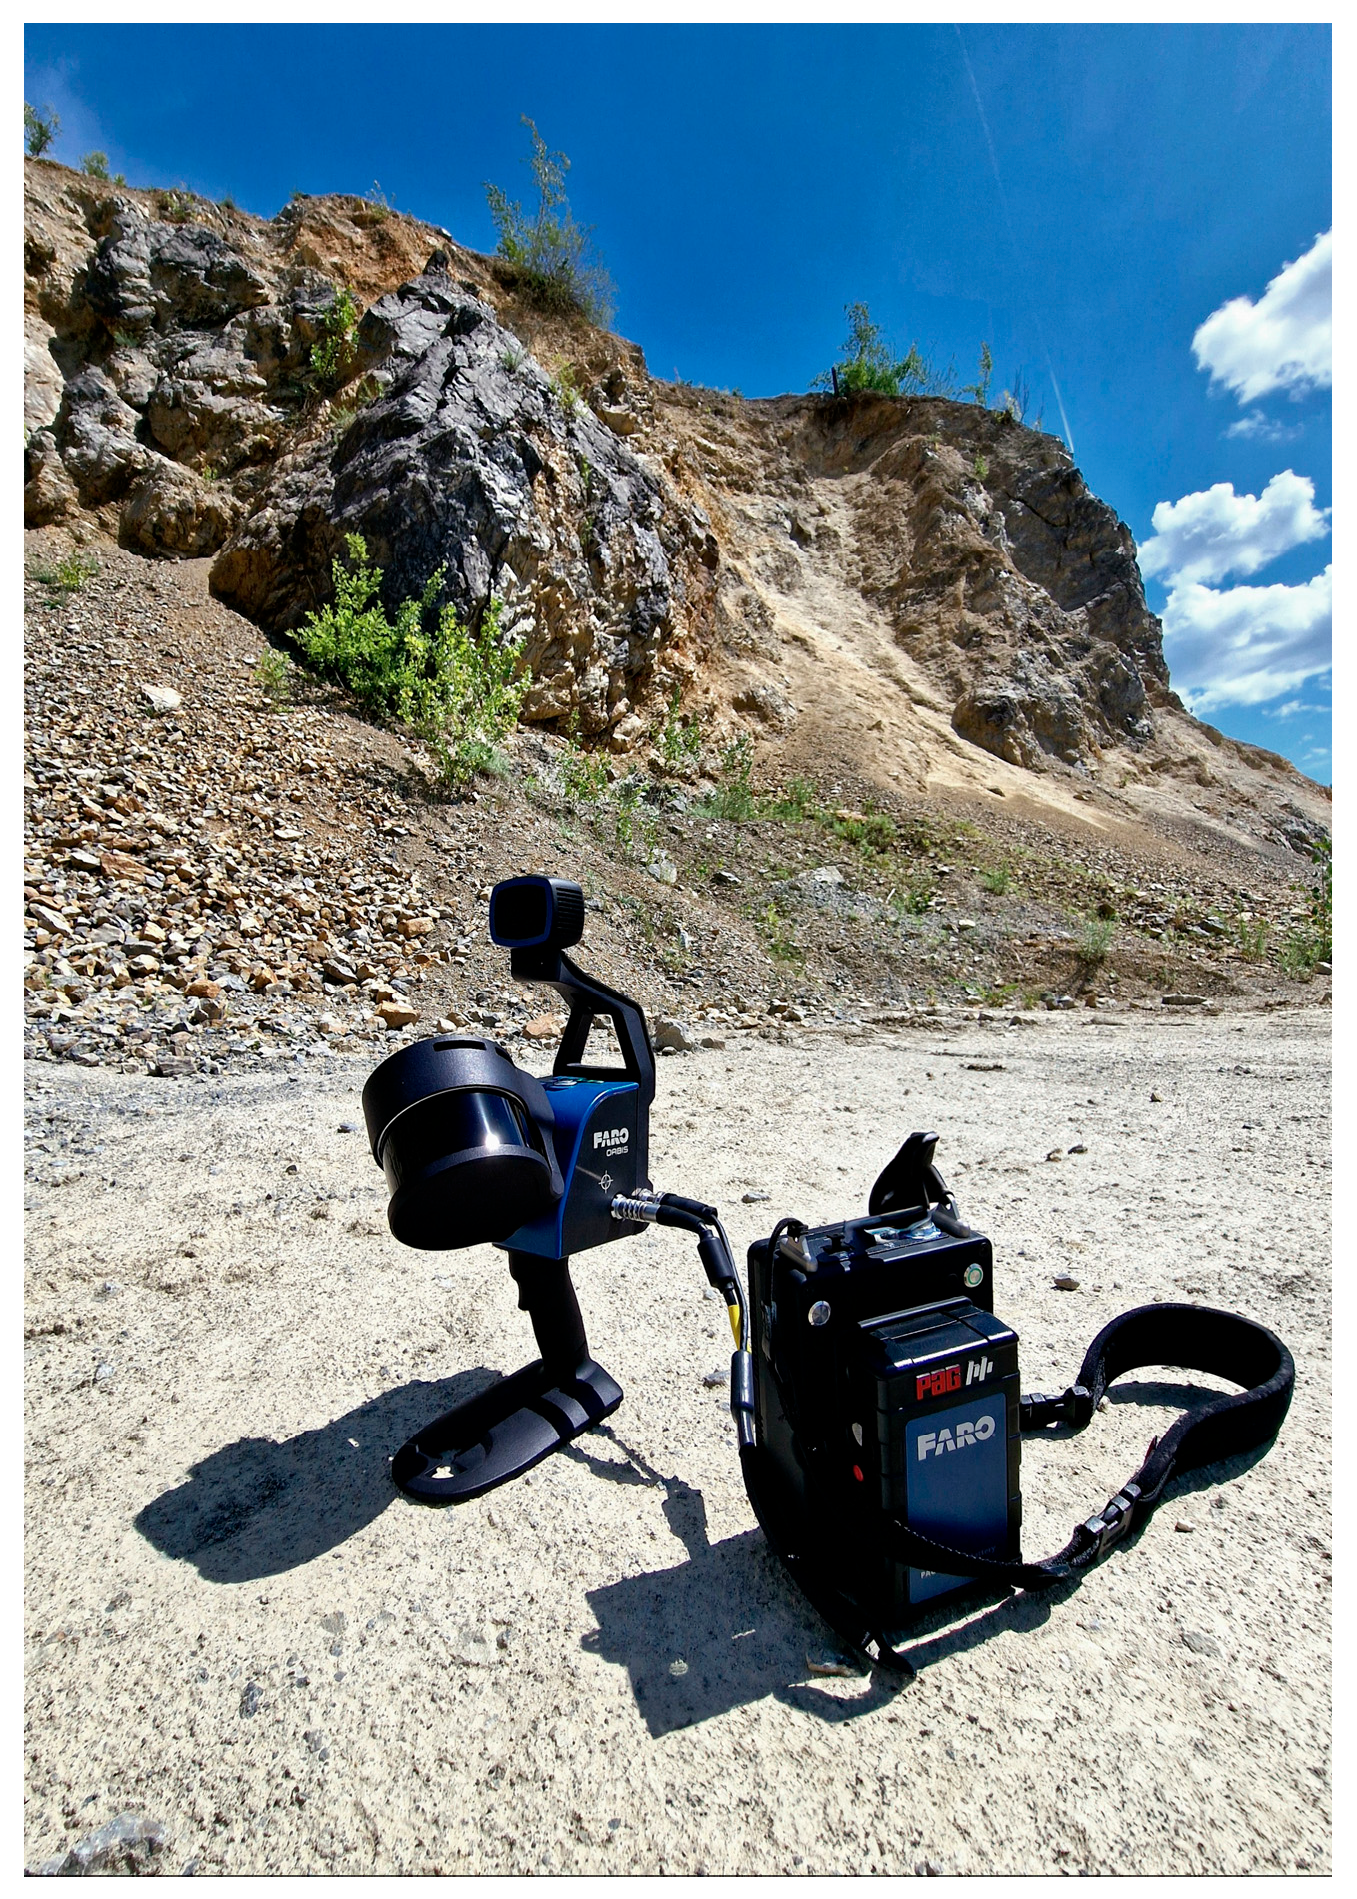
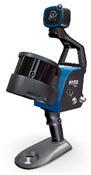
The quarry was also surveyed using the FARO Orbis mobile laser scanner (Figure 6). Technical parameters of the device are listed in Table 2. The scanner was placed on a stable surface for initial calibration. The scanning itself was performed using the FARO Stream application, with the scanner held by the operator, who moved across the study area on foot.
Figure 6.
MLS FARO Orbis mobile laser scanner.
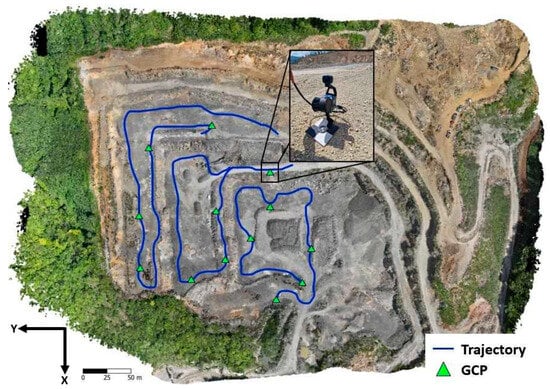
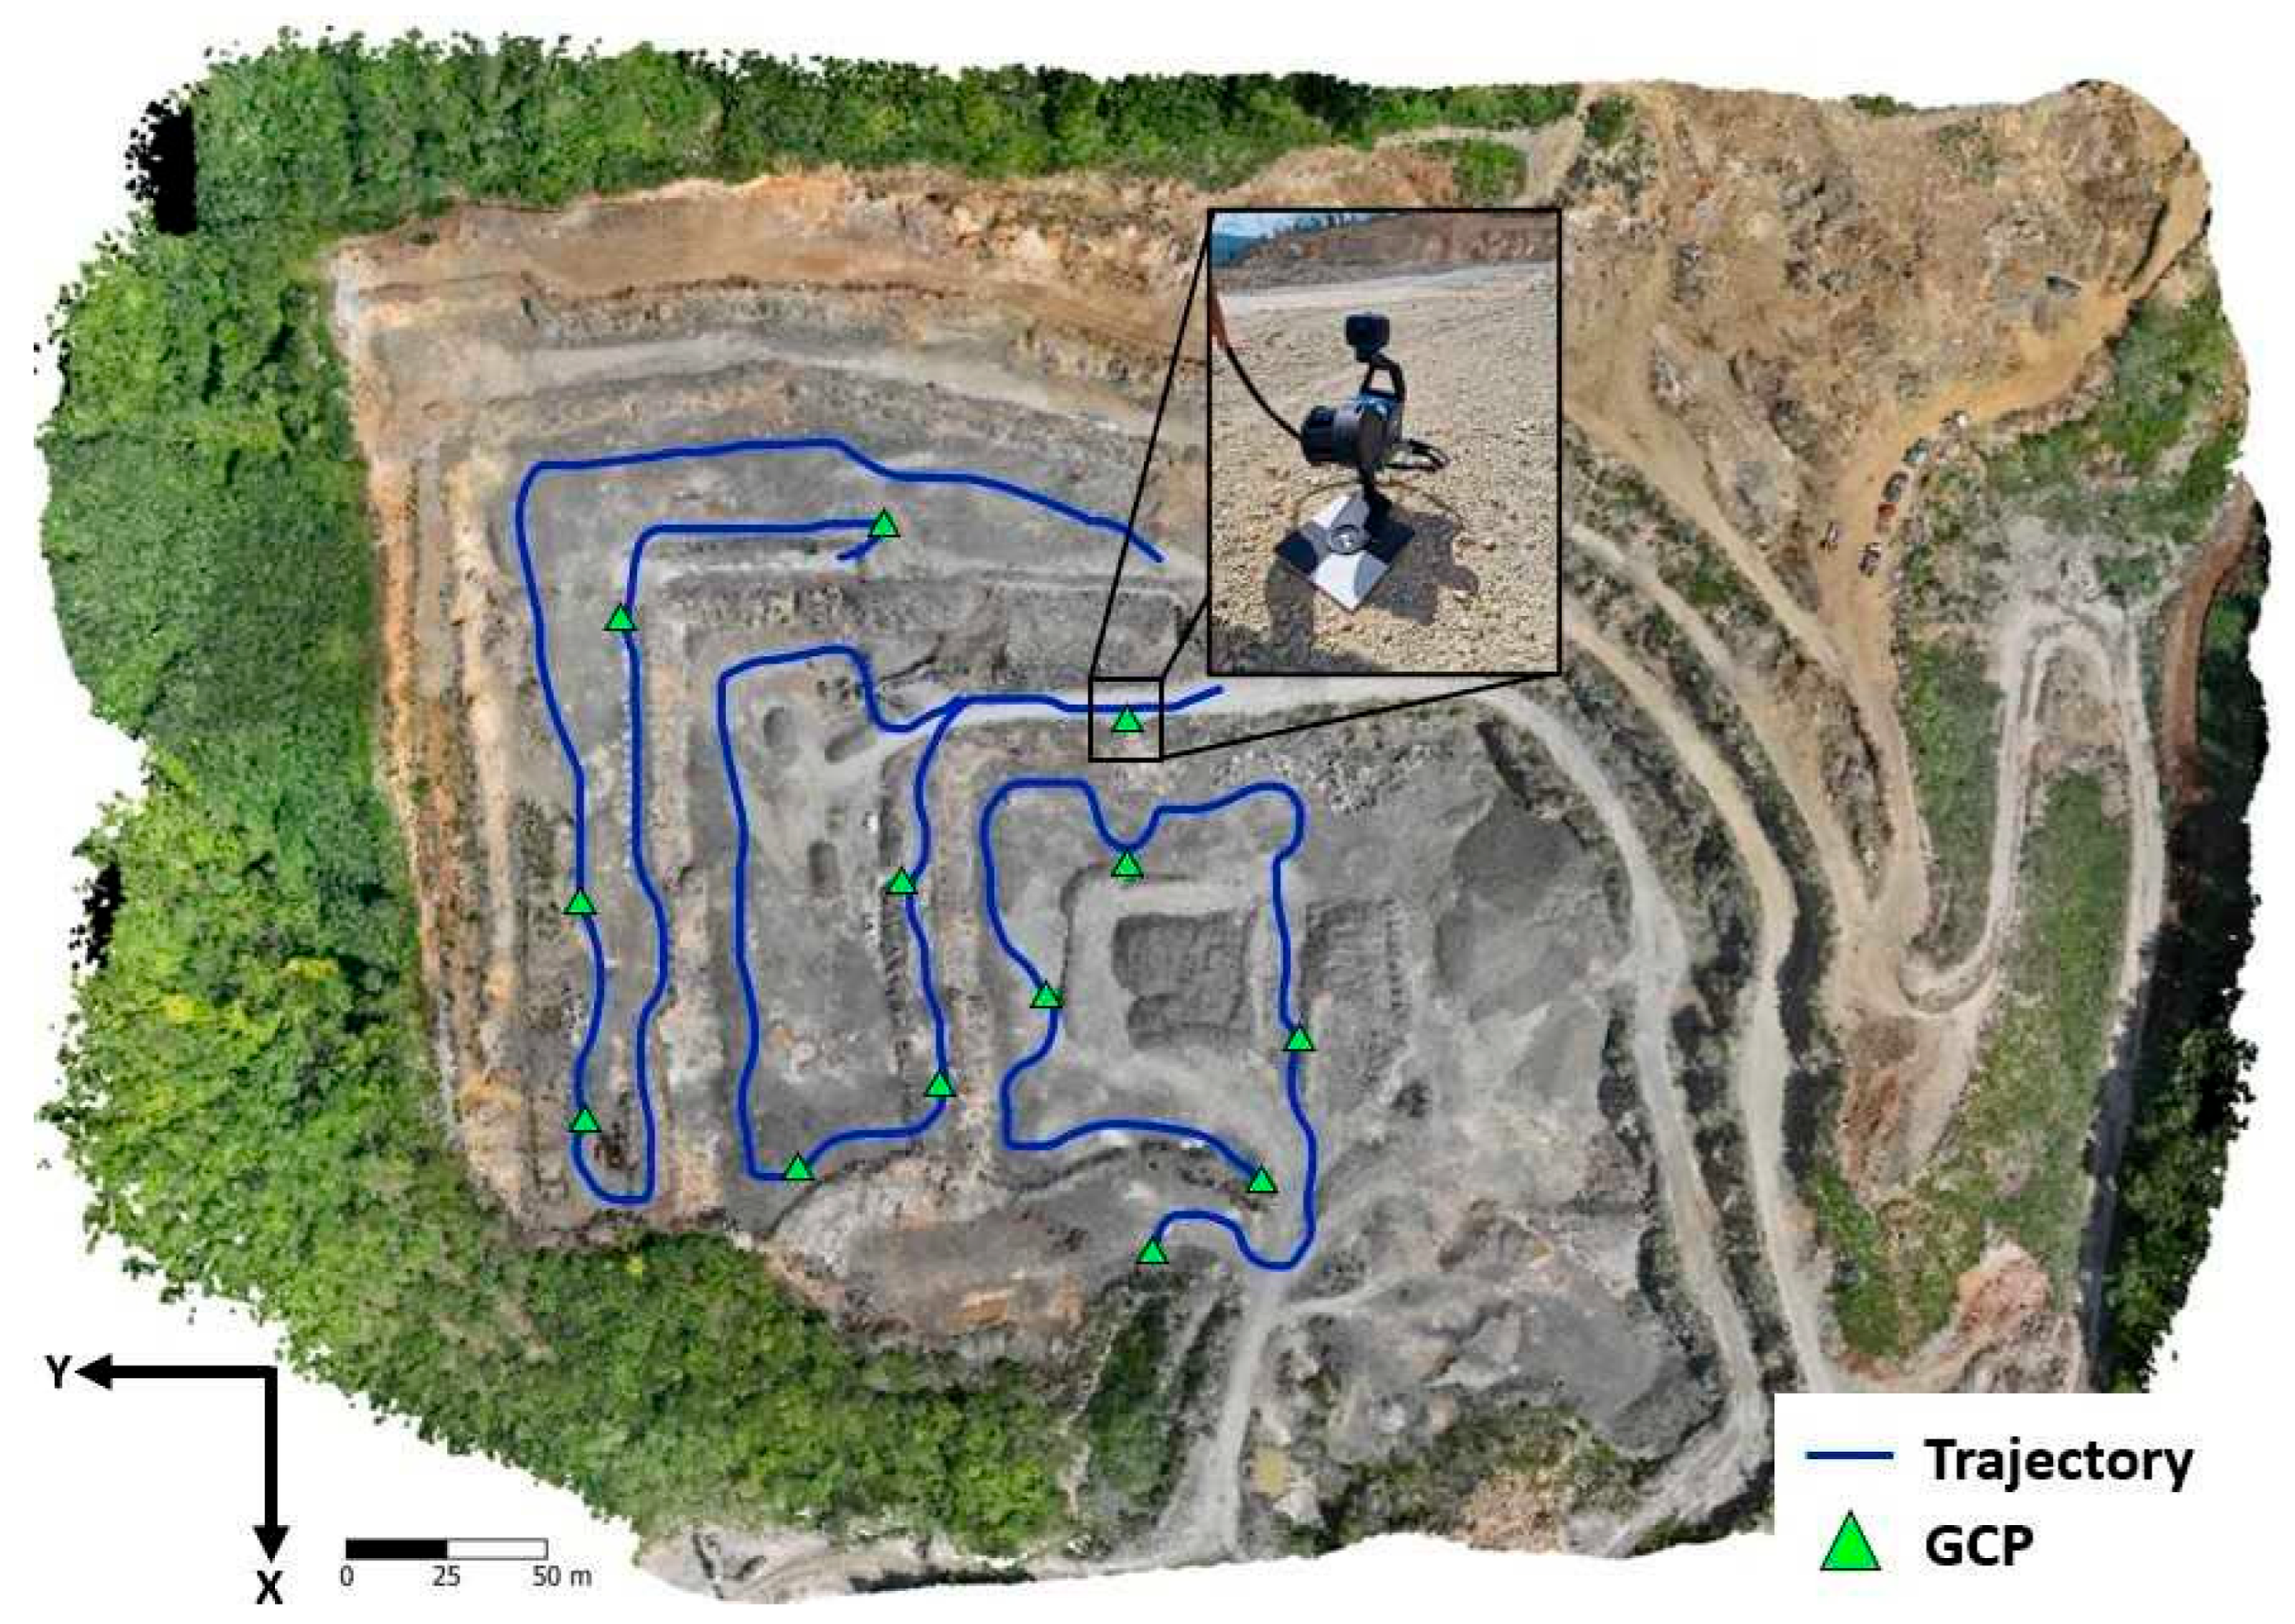
During scanning, all GCPs were captured by placing the scanner directly in the middle of the target. The whole study area was covered by three separate scans, which together took approximately one hour. The duration of a single scan can be up to 20 min. During the first scan, which lasted 19 min, 4 GCPs were used. The second scan, lasting 17 min, also captured 4 GCPs, while the third scan lasted 18 min and used 5 GCPs. The trajectory of the measurement is shown in Figure 7.
Figure 7.
Measurement trajectory using FARO Orbis mobile laser scanner.
4. Data Processing
The raw data obtained through TLS were processed in Leica Cyclone Register 360 software. For the FARO Orbis mobile laser scanner, the software FARO Connect v. 2025.2.1 and FARO Scene v. 2025.2.1 were used for raw data processing.
4.1. TLS Data Processing
Using the Leica RTC360 laser scanner, the quarry was scanned from 36 stations. Data were processed in Leica Cyclone Register 360 v. 2025.0.0 desktop software. Single scans were mutually registered and georeferenced based on 6 GCPs and checked with 18 CPs. The resulting dense point cloud comprised 630,541,680 points. The average RMSE (Root Mean Square Error) of GCPs achieved an accuracy of 0.007 m, the Bundle error was 0.007 m, and the Cloud-to-Cloud value was 0.007 m. The total point cloud overlap reached 62%, and the strength value of the resulting point cloud was 75%. Data classification was carried out in Trimble Realworks 12.2 and Leica Cyclone 3DR. Parameters of the dense point cloud obtained using the TLS method with the Leica RTC360 are also presented in Table 3.
Table 3.
Parameters of the resulting point cloud for the TLS method.
4.2. MLS Data Processing
Data obtained using the FARO Orbis mobile laser scanner were processed in the FARO Connect software. In this software, the measurement trajectory, GCPs with a final RMSE of 0.028 m, point cloud registration, texture, and colorization were processed. Since the point cloud was processed based on GCPs, the resulting point cloud is connected to the same reference system as TLS measurements. The first scan consisted of 29,169,797 points, the second scan contained 36,880,509 points, and the third scan consisted of 29,164,891 points. The resulting point cloud comprised 95,215,197 points. Quality control of the data and global accuracy of the resulting point cloud was conducted in FARO Scene software. Additional parameters of the dense point cloud obtained using the MLS method with the FARO Orbis mobile laser scanner are presented in Table 4.
Table 4.
Parameters of the resulting point cloud for MLS method.
5. Results
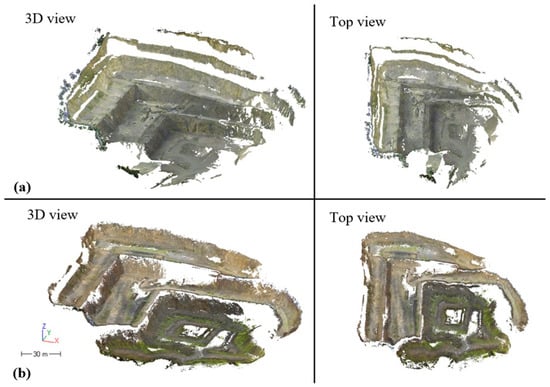
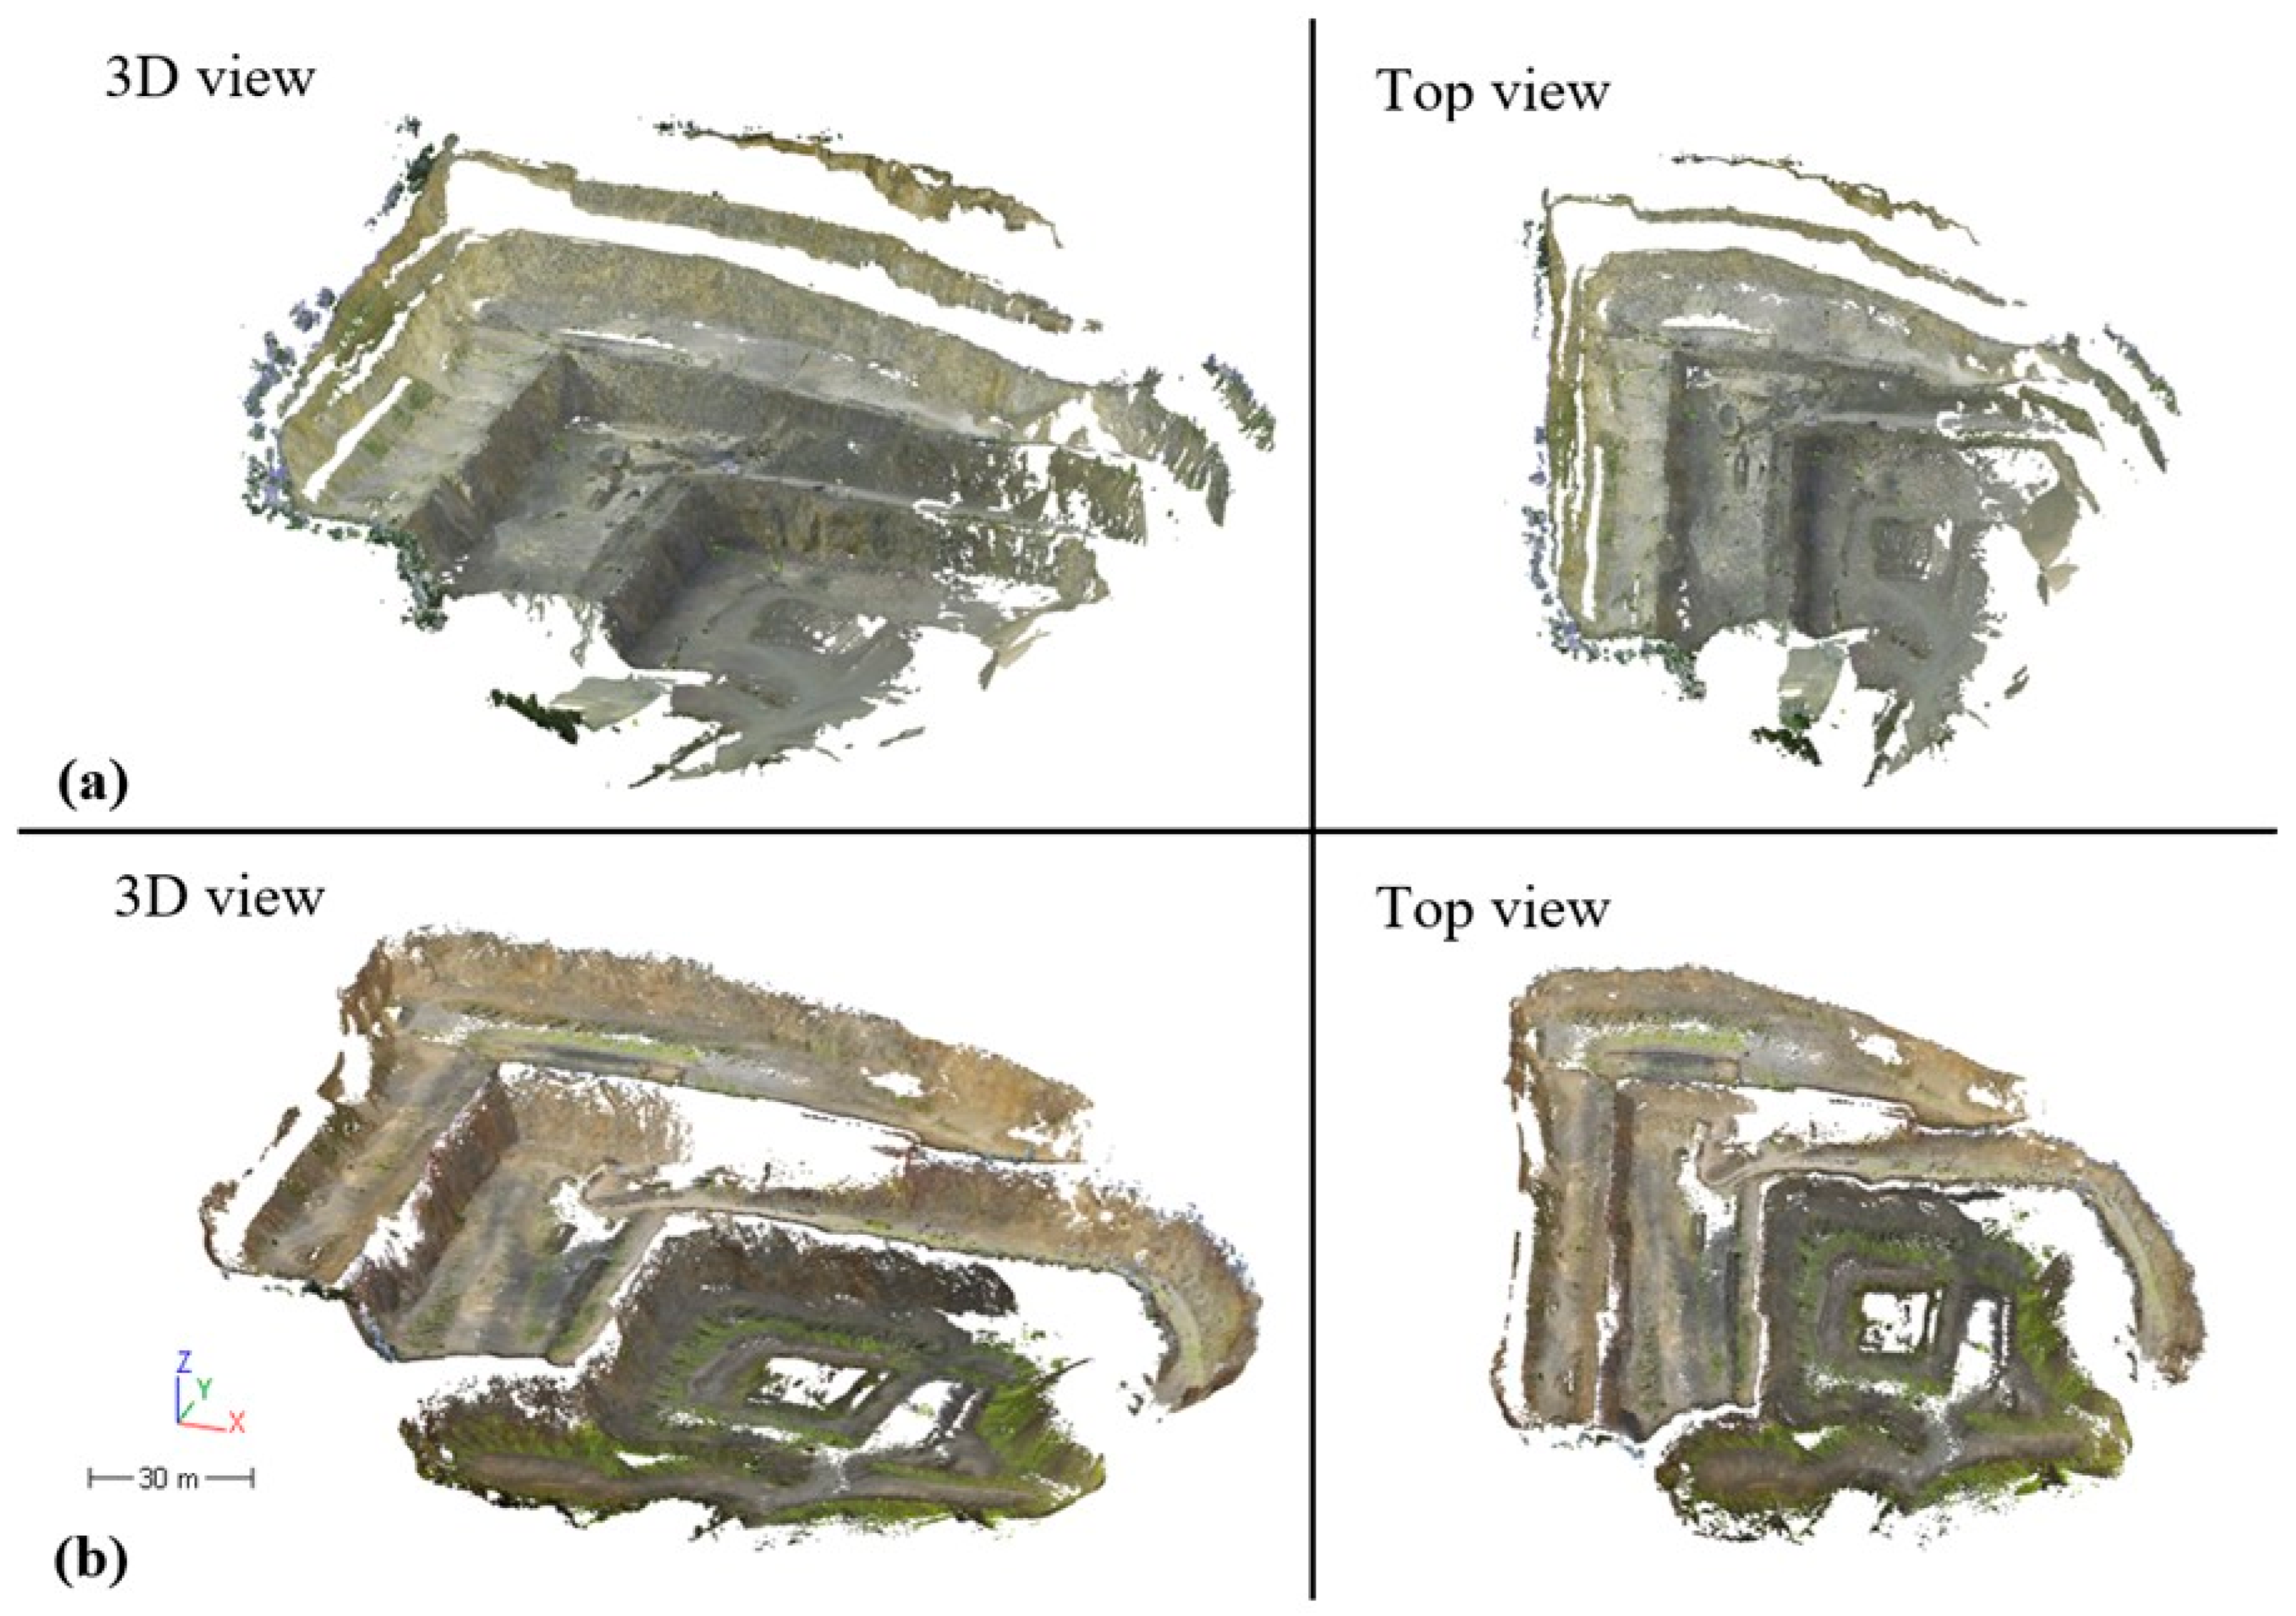
Data obtained using TLS and MLS allowed for analyses comparing point clouds based on noise levels and mutual differences between point clouds in selected test areas. Before the comparison, the data was pre-processed to remove unwanted and redundant points from each point cloud. Segmentation of TLS and MLS point clouds was performed using Trimble Realworks 12.2, while processing, filtering, visualization, and comparison were carried out using Leica Cyclone 3DR [41], Trimble Realworks 12.2, and CloudCompare 2.13 [42]. For TLS, the resulting dense point cloud (Figure 8a) was generated using the Leica Cyclone Register 360 software [43] and contained 630,541,680 points. In the case of the FARO Orbis mobile laser scanner, the resulting point cloud consisted of 95,215,197 points (Figure 8b), with an overall accuracy of 2.8 cm in terms of RMSE of GCPs.
Figure 8.
Point clouds obtained by TLS (a) and MLS (b) methods.
While TLS generally features higher accuracy and data density, MLS offers faster coverage of larger areas, albeit with lower spatial resolution. Table 5 compares the results of the two laser scanning methods in terms of the amount of acquired data, covered area, and point density. TLS provided very dense, continuous, and detailed coverage of the entire area (116,202 m2), demonstrating the high resolution of the scanning devices and the precise placement of the scanner near the object. MLS shows sparser coverage (95,924 m2), with higher noise levels and areas with missing data, which is due to the faster data collection rate and the dynamic movement of the sensor during measurement. The TLS method achieved a density of 5426 points/m2, providing highly uniform coverage across most of the area. This result demonstrates its ability to capture even fine morphological details of the quarry wall. The MLS method yielded a density of 993 points/m2.
Table 5.
Comparison of TLS and MLS in terms of the amount of acquired data, covered area, and point density.
5.1. Analysis of Mutual Differences Between Point Clouds in Selected Test Areas
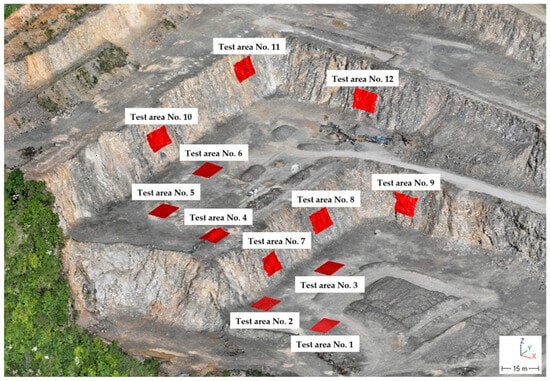
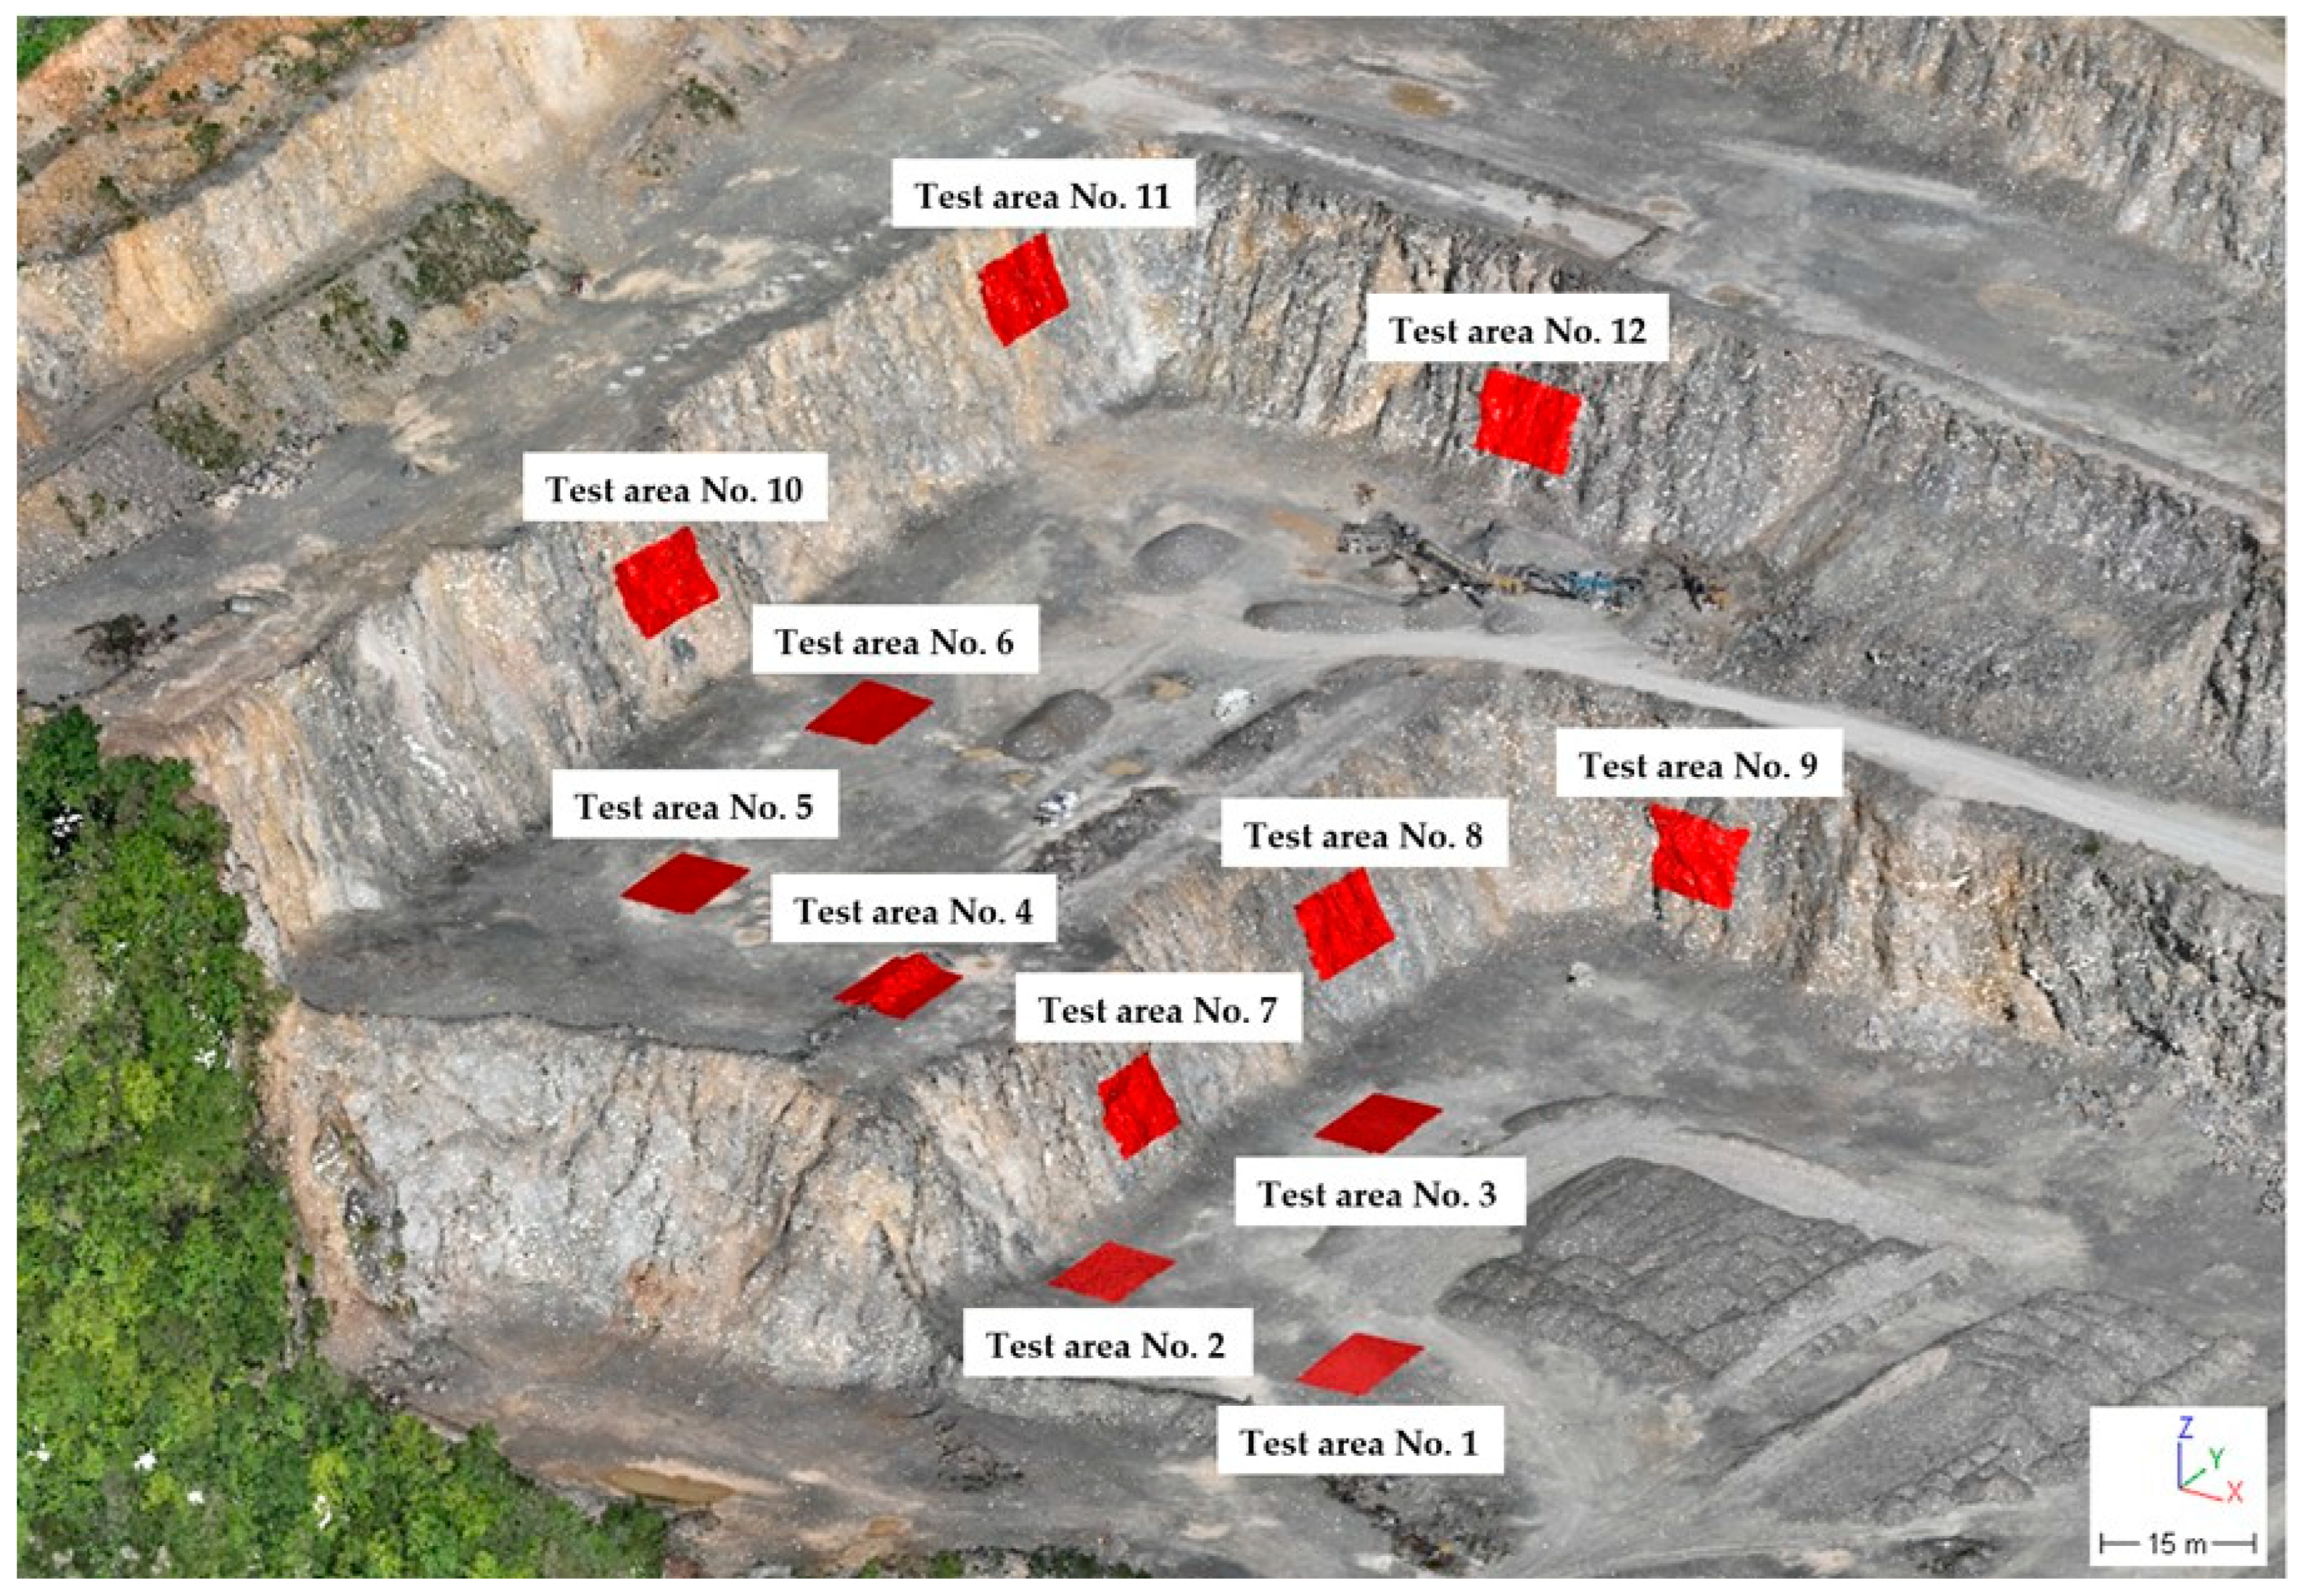
The comparison of distances between obtained point clouds currently represents a detailed spatial data analysis that highlights the reliability, accuracy, and usability of these methods. This section provides an in-depth examination of the achieved results, which demonstrate the reliability, suitability, and limitations of the selected techniques. Testing was conducted in twelve test areas (Figure 9). The first six test areas were located at the 0. and 1. levels in a horizontal position, while the remaining six selected areas were situated on the mining walls of the 1. and 2. levels. These mining walls also represent active quarry faces and are directly involved in the ongoing extraction of raw materials. When selecting them, we considered the configuration of the stations and the measurement trajectory, assuming varying distances from the instrument during measurement and, in particular, different angles of incidence of the laser beam impacting our results. We also consider horizontal and approximately vertical inclinations as typical surfaces in the quarry, yielding the most representative results. Six horizontal and six vertical areas were selected, with full coverage by both methods, for verification and statistical evaluation of the study results.
Figure 9.
Situation of the tested areas.
Statistical analysis of distances characterizes the numerical results of the differences between the reference point cloud obtained by the TLS method (Leica RTC360) and the point cloud acquired using MLS technology (FARO Orbis). For each test area, the values of average distance, distance interval with the highest number of points, maximum distance, and RMSD are provided. Additionally, each test area includes the number of points and surface area. These parameters enable a quantitative comparison of the quality and accuracy of each technology relative to the reference TLS method. The calculation of the mentioned indicators was carried out according to the defined algorithm in the CloudCompare environment, following a prescribed sequence of steps. The function Tools → Other → Compute Geometric Features was used for this purpose. During the analysis, the local neighborhood radius was set, and the third eigenvalue was selected as the main parameter, representing the variability in points in the direction perpendicular to the best-fitting plane. After computation, the values were transformed using the square root operation, and the Distribution Fitting—Gaussian function was applied. The mean value obtained from the fitted distribution was interpreted as the Root Mean Square Deviation (RMSD), expressing the degree of point dispersion around the ideal surface. The RMSD parameter thus describes the average deviation of points depending on the quality of alignment and the intensity of surface noise. The RMSD was determined according to the following relation:
where di is the distance between the reference and tested point clouds.
In this detailed analysis, the TLS method is considered the reference method in all cases. Table 6 presents a statistical comparison of distances on selected test areas located on the zeroth and first mining levels in a horizontal position.
Table 6.
Statistical comparison of distances between point clouds on horizontal test areas.
In the first six selected areas, the number of points obtained using the MLS method varied significantly between individual areas. The highest number of points was recorded on test area no. 4, likely due to the favorable geometry and better accessibility of this area for the MLS technology. In contrast, the lowest point count was found on test area no. 3, which may be attributed to the more complex shape or reduced terrain visibility. The average distances between point clouds obtained using the MLS method and the reference TLS method ranged from 0.017 m on test area no. 6 to 0.064 m on test area no. 2. The overall RMSD value was 0.034 m, indicating good, albeit occasionally fluctuating, measurement accuracy of the MLS method. The distance intervals with the highest number of points mostly ranged between 0.000 m and 0.070 m. Test areas with narrower intervals, such as test area no. 5 and test area no. 6, show better agreement with the reference data, as the majority of points exhibited smaller deviations. The maximum distance between MLS and TLS points reached the highest value on test area no. 4 (0.452 m), which may indicate the presence of outlier points, for example, due to edge effects or reflections from less suitable surfaces. In several areas, the maximum distances were around 0.221 m. On the mining walls (Table 7), the results are more scattered due to surface irregularities.
Table 7.
Statistical comparison of distances between point clouds on vertical test areas.
The number of points recorded using the MLS method on mining walls ranged from 339,669 on test area no. 8 to 604,388 points on test area no. 7. Compared to TLS, these values were generally slightly lower, indicating potential limitations of MLS technology when scanning vertical or hard-to-reach areas. The average distances of points tto the reference TLS point cloud ranged between 0.036 m (on test areas no. 10 and 12) and 0.051 m (on test area no. 8). The best results were achieved on areas with better scanning accessibility, whereas test area no. 8 showed the highest deviation, likely due to limited visibility or challenging surface geometry. The distance intervals with the highest number of points most frequently fell within the range of 0.000–0.070 m, which is acceptable considering the terrain complexity. The widest interval was recorded on test area no. 8, corresponding to its larger average distance. Maximum deviations ranged from 0.316 m (on test area no. 10) to 0.573 m (on test area no. 7). These values indicate the presence of significant local differences, potentially caused by reflections, shadows, or insufficient coverage of certain wall segments.
Based on the results obtained from the test areas, it is possible to assess the accuracy and reliability of the MLS method compared to the reference TLS method. The RMSD values, representing a comprehensive indicator of accuracy, allow for objective evaluation across all tested areas. The FARO Orbis MLS system achieved an overall RMSD of 0.034 m on horizontally oriented areas and 0.041 m on the mining walls. This technology demonstrated good performance under various conditions, although the slightly lower accuracy on vertical surfaces suggests some limitations when capturing more complex geometries.
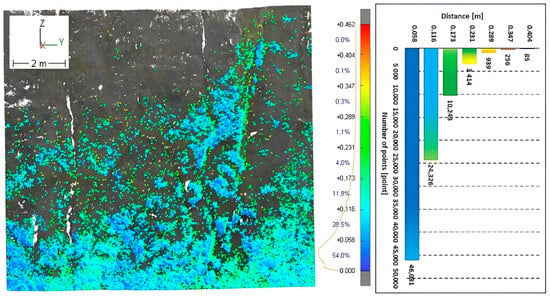
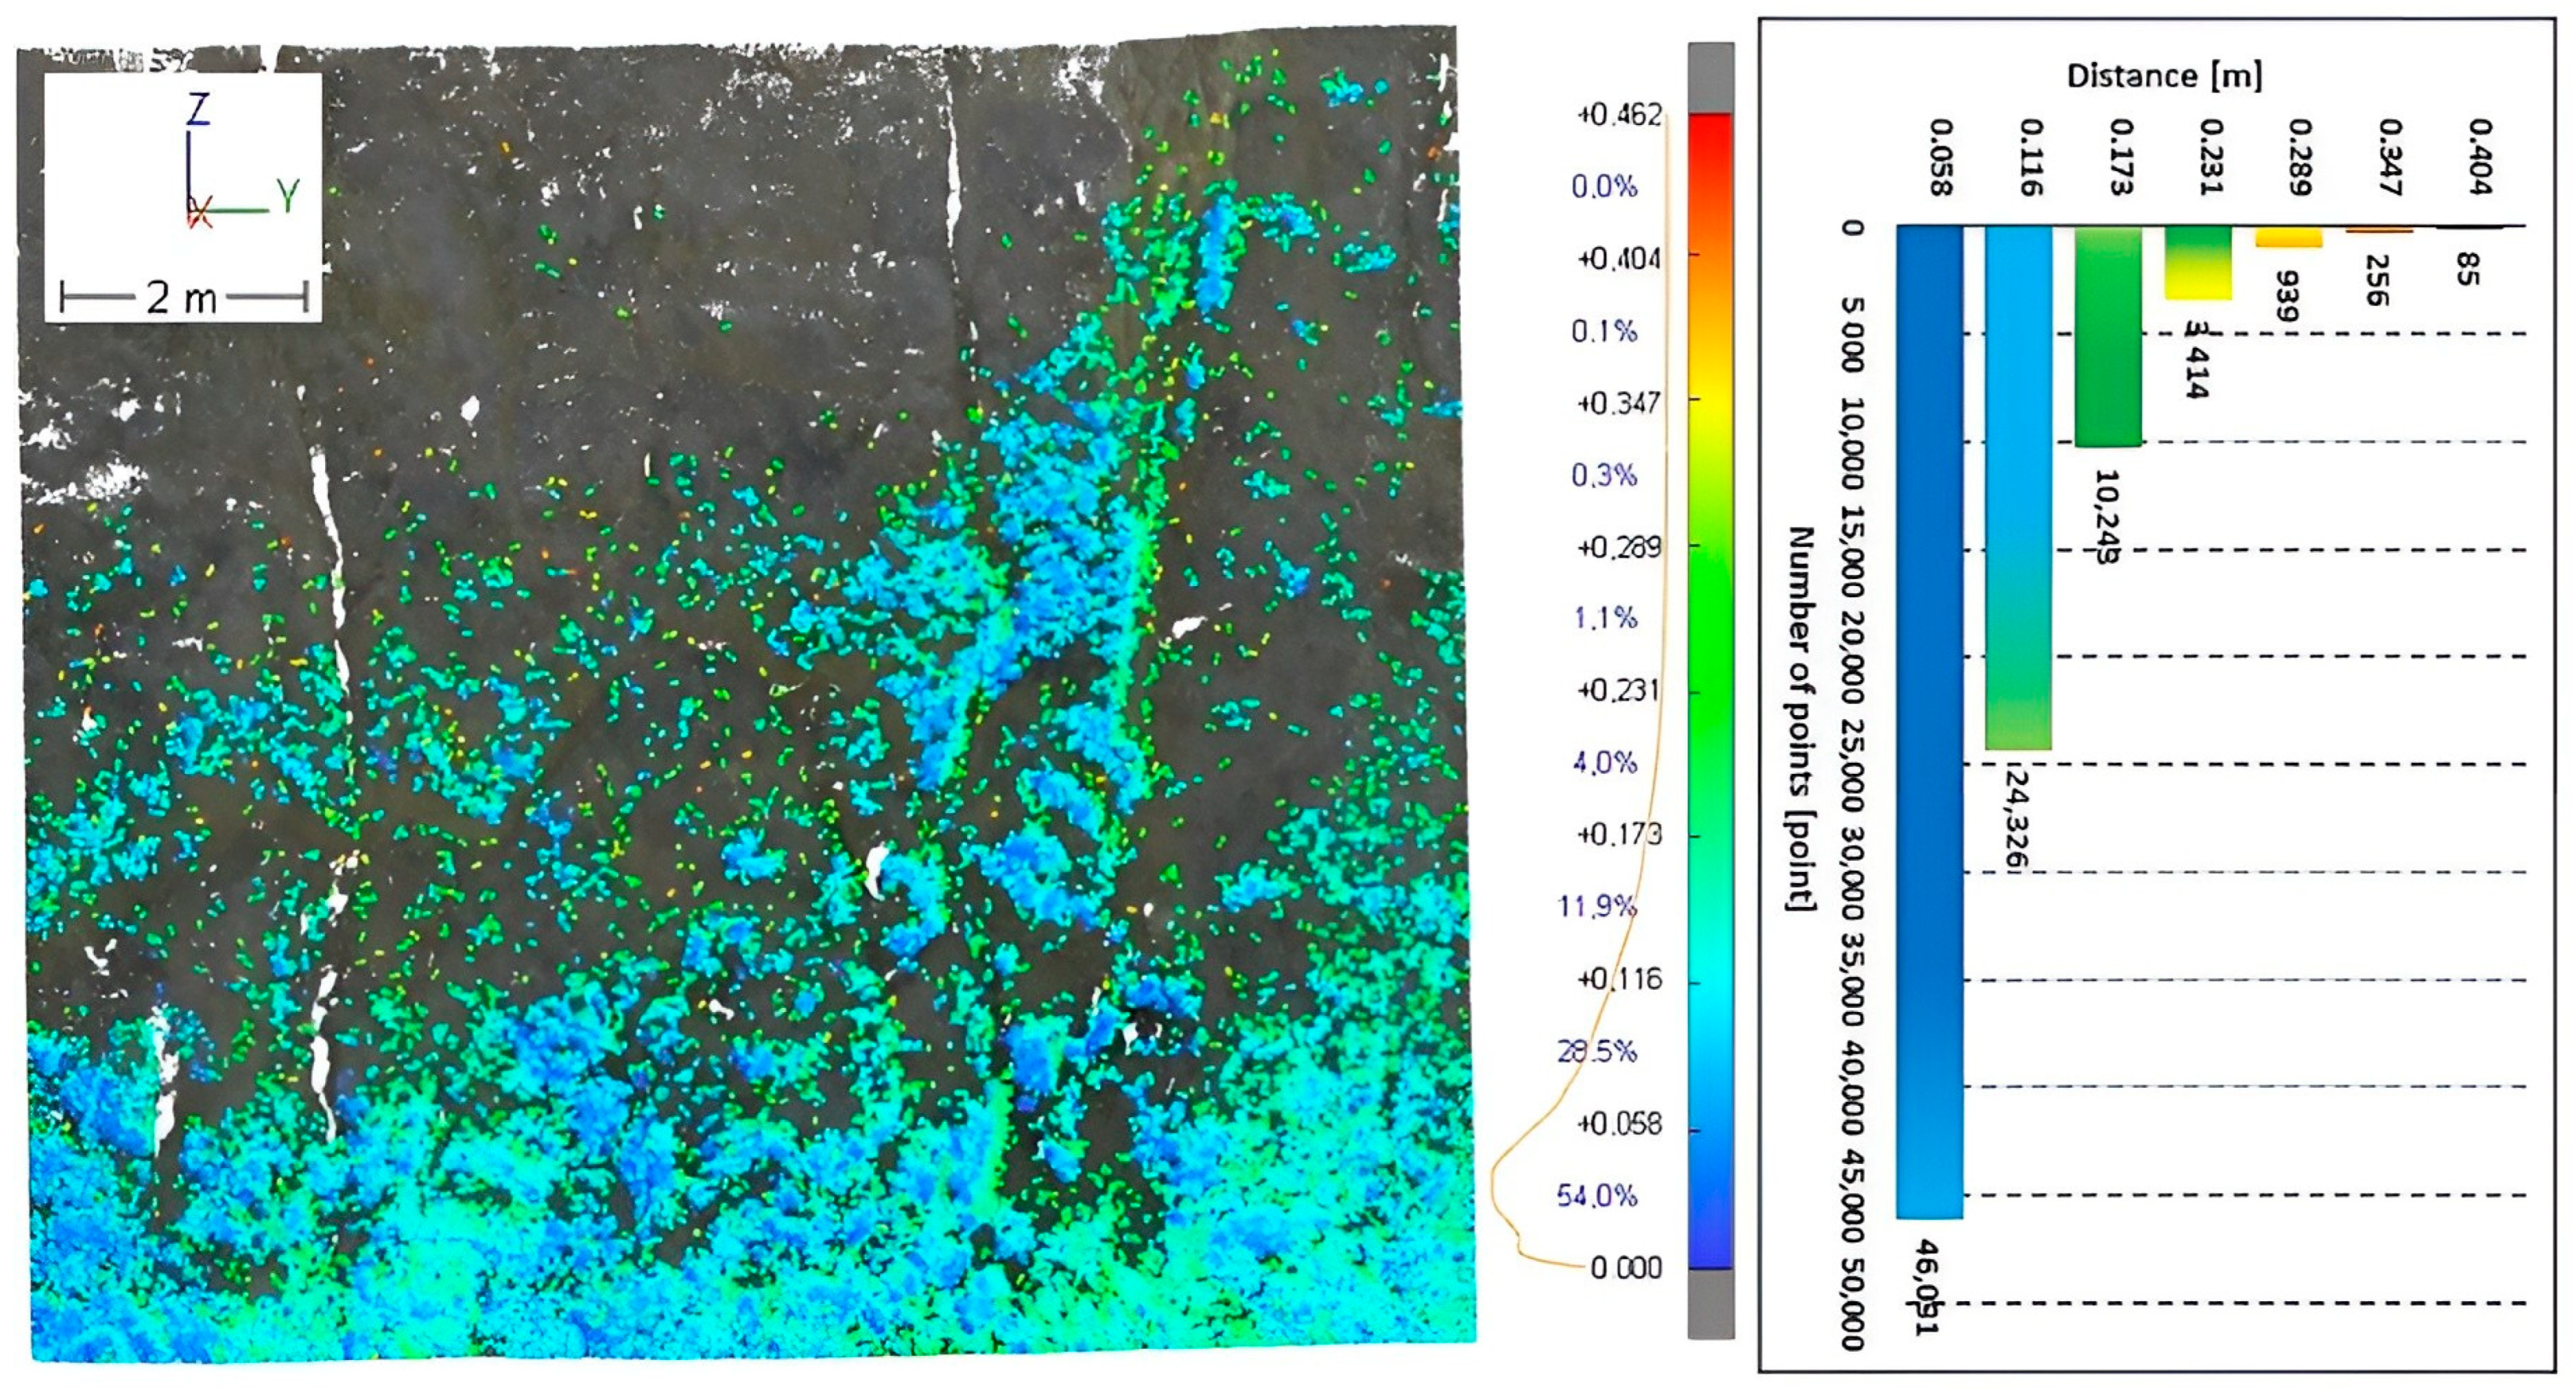
To objectively assess the quality and usability of the data obtained using TLS and MLS methods, a representative area of the mining wall was selected. The analyzed area is located on the quarry’s mining wall at the first mining level, with dimensions of 21.14 × 19.68 m and a total area of 514 m2. This area represents a technologically significant zone with a rugged terrain and prominent morphological features, making it suitable for a detailed comparison of the accuracy and resolution capabilities of both scanning methods. The comparison focused primarily on analyzing distances between point clouds—key parameters that influence the quality of the resulting models and their practical applicability. This analysis (Figure 10) provides a better understanding of the differences between the two technologies under specific quarry conditions and helps evaluate their suitability for application in mining mapping and documentation. Gray color represents the reference point cloud from TLS measurements, white areas indicate places not covered by points from any method, and the colored differential model shows the comparison between TLS and MLS.
Figure 10.
Analysis of the methods used on the selected area of the mining wall.
This analysis illustrates the results of a comparison between the two laser scanning methods applied to the same mining wall area. The colors from blue to green represent areas with differences ranging from 0 m to 0.2 m, with blue areas having the smallest difference. The graph shows that the most significant proportion of points is in the class with differences of up to 5 cm, which is acceptable for many technical applications. Only a minimal number of points show differences greater than 10 cm, indicating overall good data correlation despite density differences. This result also complies with the accuracy regulations for maintaining mine surveying documentation according to the “Ordinance of the Ministry of Economy of the Slovak Republic on Mining Surveying Documentation” [44], and it reflects appropriate adherence to the technical standard STN 013410 for the creation and maintenance of large-scale maps [45]. In practical surveying activities, point clouds are filtered, with outliers being removed. In addition, a combination of both methods may be beneficial for obtaining comprehensive results from the survey.
5.2. Noise Analysis of Individual Methods
The accuracy and quality of 3D scanning are significantly influenced by the level of noise generated during data acquisition using different methods. Noise in point clouds can affect not only visual interpretation but also subsequent analytical and engineering data processing, such as object modeling, change detection, or volume calculations. This section focuses on analyzing noise in data obtained using two different scanning technologies—the Leica RTC360 terrestrial laser scanner and the FARO Orbis mobile laser scanner. The terrestrial laser scanner is known for its high accuracy and measurement stability, whereas the mobile laser scanner provides flexibility and rapid data collection in dynamic environments. Noise in the Lidar-based point cloud can have various causes, ranging from the type and precision of the device and its sensors to conditions during measurement, such as beam incidence angle or distance to object. The main goal of this analysis is to quantify and compare the level of noise in different scanning systems under varying conditions. The evaluation focuses on the dispersion of values in point clouds, systematic deviations, RMSD, and factors that may influence the accuracy of the final model. For this analysis, we selected the same 12 test areas (Figure 7). This approach allows us to compare noise between different methods in controlled conditions and determine which technology provides the most accurate results. The results of this analysis (Table 8) will provide important insights into the suitability of individual methods for different applications and assist in selecting the optimal technology for specific purposes. Standard deviation s was calculated as follows:
where
and di are observed values of differences.
Table 8.
Results of the noise analysis on the test areas.
Based on the provided data, we can analyze the noise results for each device used during the measurements. The point cloud noise analysis on two test areas demonstrated that the TLS method exhibits significantly lower levels of noise compared to the MLS method. The average value for TLS reached a level of 0.011 m, while for MLS a value of 0.029 m was recorded. These results are also confirmed by the RMSD values, which reached 0.013 m for TLS and 0.030 m for MLS, indicating the presence of higher noise in the measurements. This noise can be attributed to the dynamic nature of the MLS method, which may affect point accuracy under varying conditions. The Leica RTC360 terrestrial laser scanner provides better results than the FARO Orbis. The lower noise levels observed in TLS may result from the stability of the static device and scanning from a fixed position. This difference did not appear in the standard deviation, where both methods showed a value of 0.006 m. These factors allow us to assess the precision of each device and the quality of the measurements in the context of noise. Another important indicator of point cloud quality is the interval of the highest point density. For TLS, this interval range was narrow, indicating high precision and consistency in the measurements. In contrast, MLS showed a wider point density range with higher values, suggesting a lower capability of this technology to capture detailed geometric features of the surface. The Leica RTC360 terrestrial laser scanner provides significantly more precise data with less noise, whereas the FARO Orbis mobile laser scanner has higher noise and a broader range in the point density interval, likely due to the scanning methodology. This result suggests that the Leica RTC360 is more suitable for applications requiring higher accuracy, while the FARO Orbis may be better suited for faster, less precise scanning in dynamic environments.
5.3. Comparison of Cross-Sections from TLS and MLS Measurements and Creation of the Base Mining Map
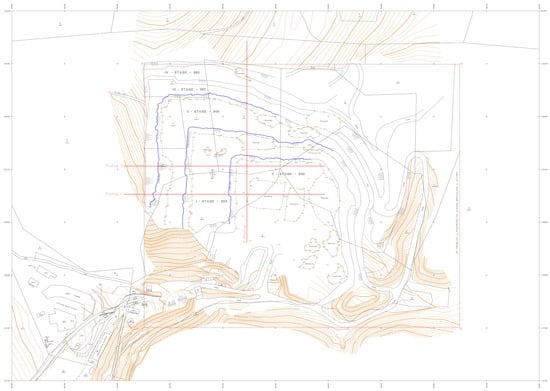
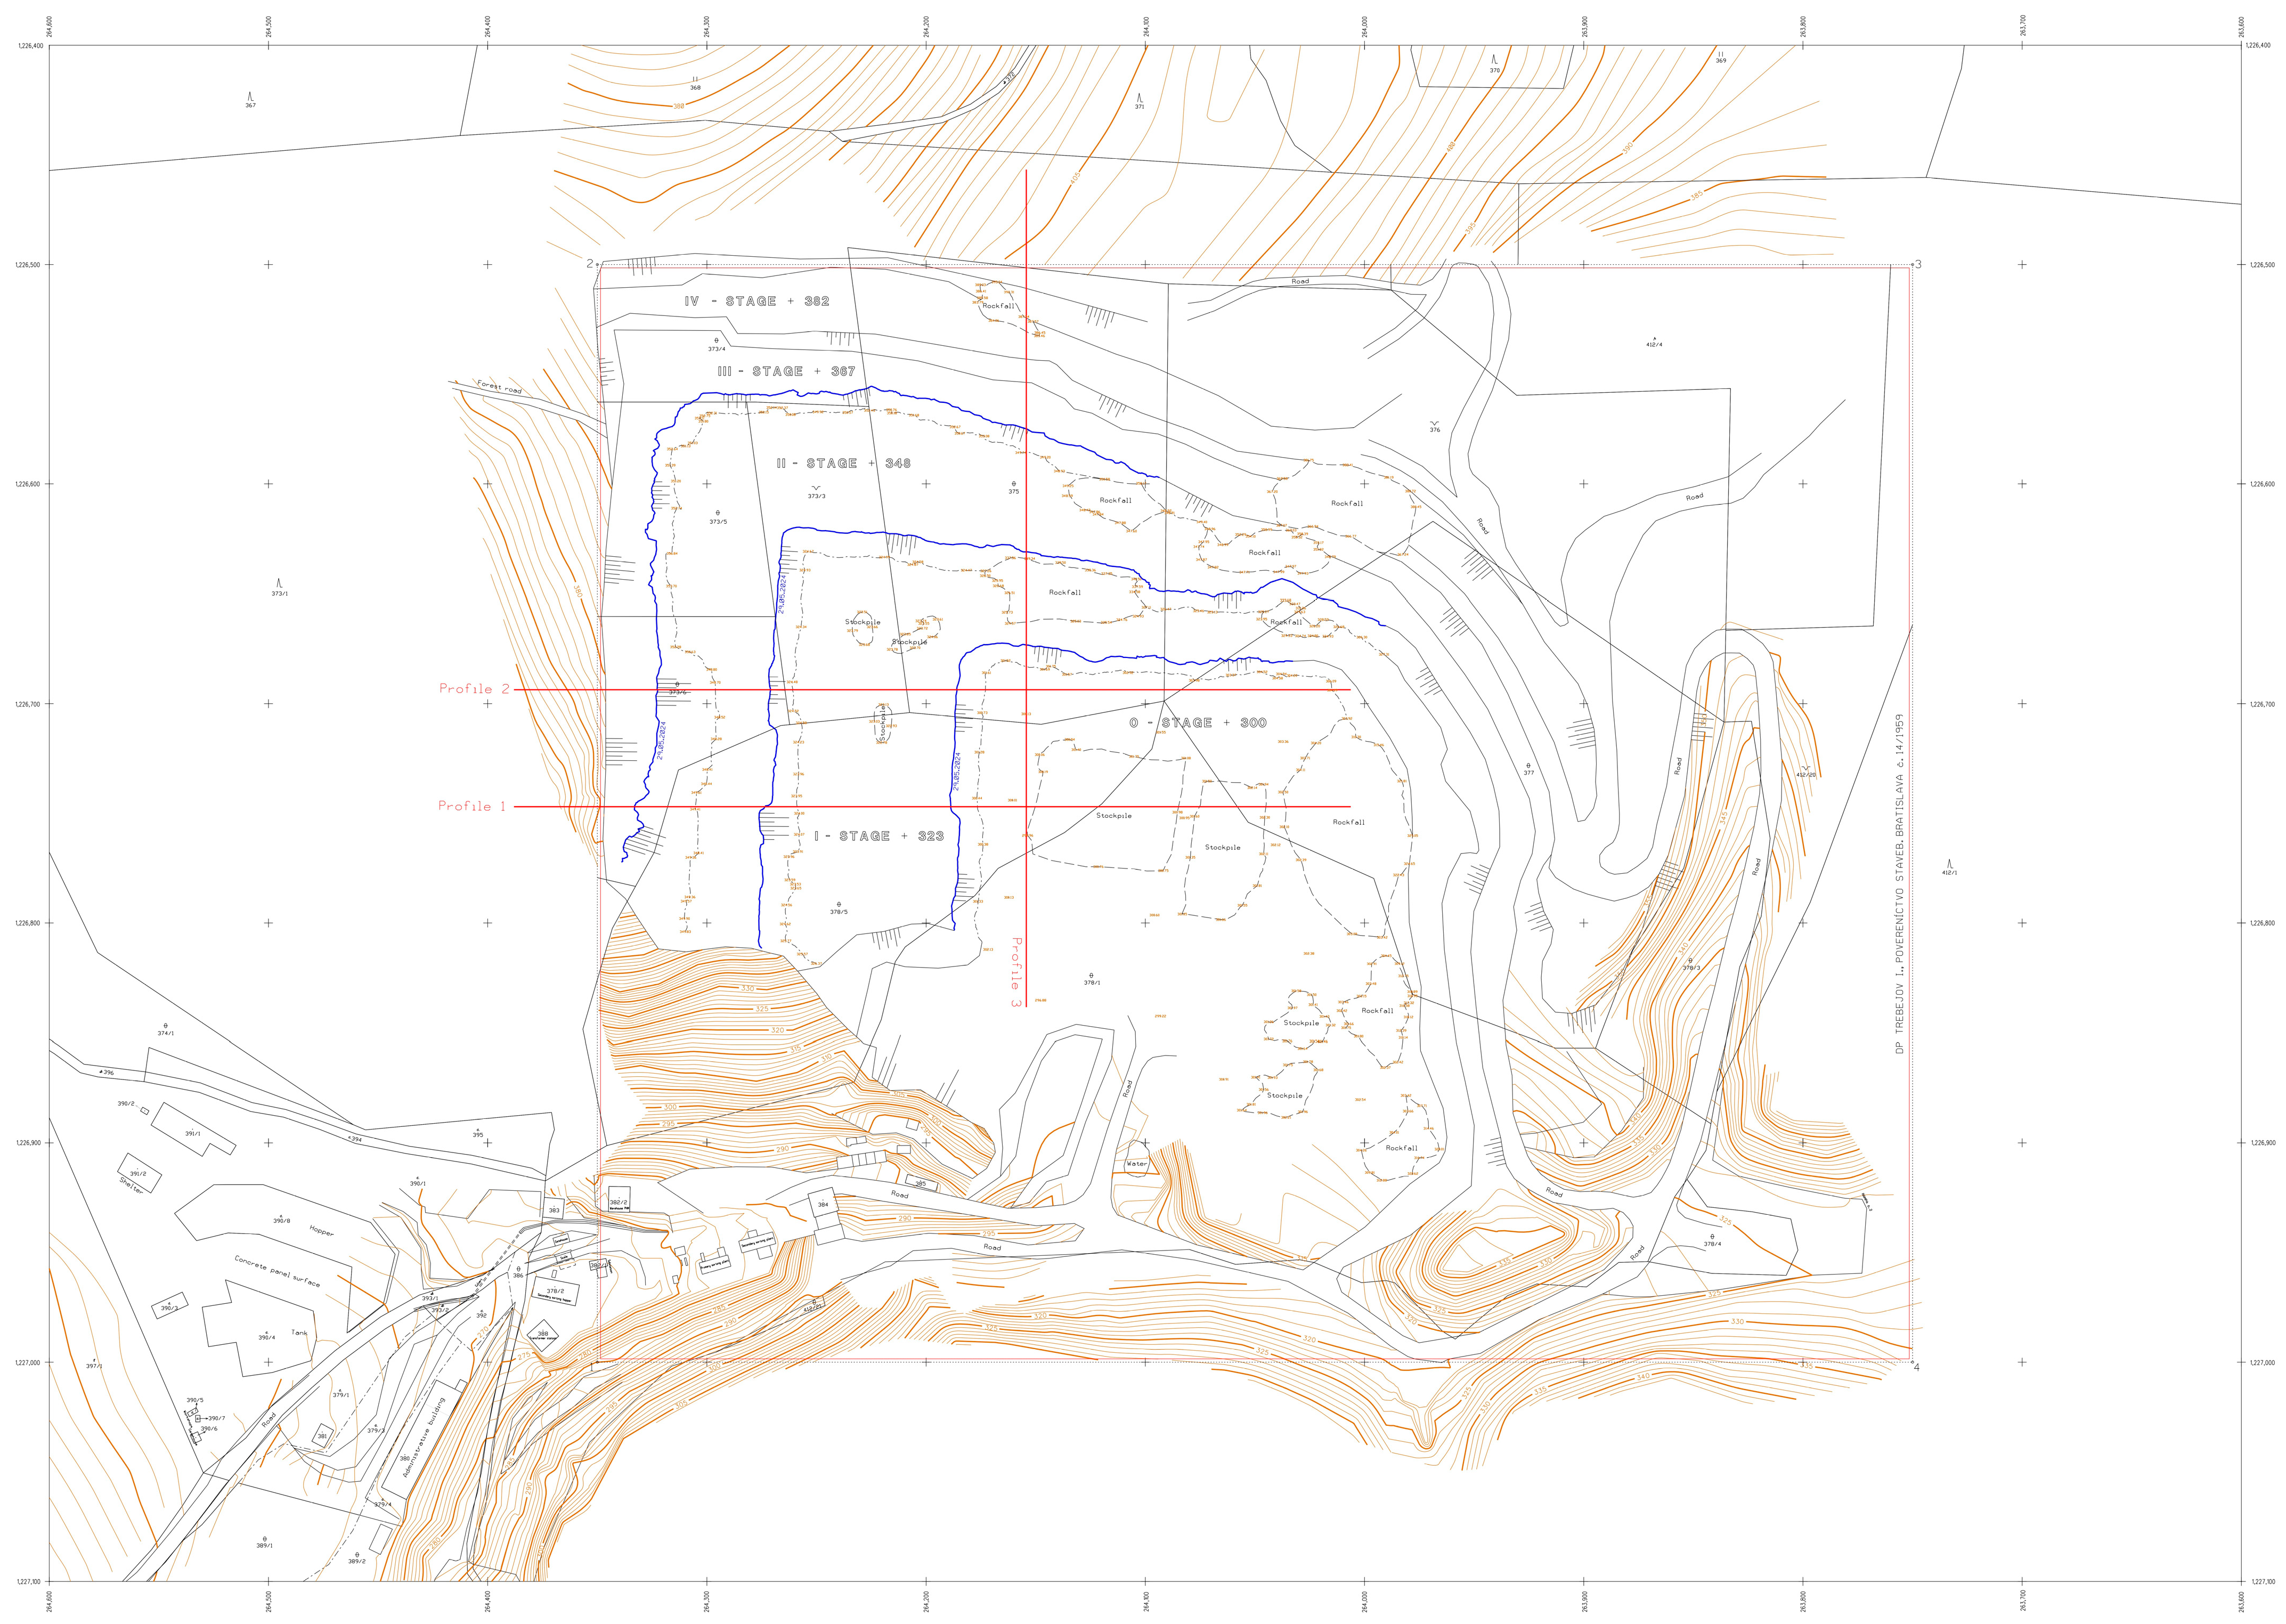
As a practical application of modern surveying methods, a base map of the quarry was produced. The base mining map (Figure 11) represents one of the most important tools for documenting and planning mining activities. It serves to accurately depict the spatial arrangement of mining works, geological structures, technical equipment, and other relevant elements both underground and on the surface. It is essential for ensuring effective mine management, occupational safety, and compliance with legislative requirements. Given the complexity of the mining environment, its creation must be accurate, up to date, and in accordance with technical standards and regulations. This section focuses on the fundamental principles of creating a mining map and its structure, content, and significance in the context of mining operations.
Figure 11.
The base mining map of a quarry. Blue line are mining edges and red lines represent cross-section.
The displayed base mining map documents the spatial layout of the mining area of a quarry located in eastern Slovakia. The map is mandatorily processed in the S-JTSK coordinate system and Bpv height system. The base mining map also contains a layer of the cadastral map. A survey for updating spatial data was carried out using the TLS method, which is considered the reference method for quarry documentation. The resulting map thus represents an accurate and reliable tool for further planning and documenting mining activities.
The base mining map shows individual mining levels, extraction walls, road infrastructure, and other facilities related to mining operations. Contour lines depict the terrain morphology, allowing for a detailed analysis of the relief and elevation differences within the mining area. From a practical perspective, this base mining map serves as a key resource for planning mining operations, monitoring the development of extraction, and ensuring compliance with geological and environmental regulations. It is an integral part of mining documentation records, in accordance with the legislation of the Slovak Republic.
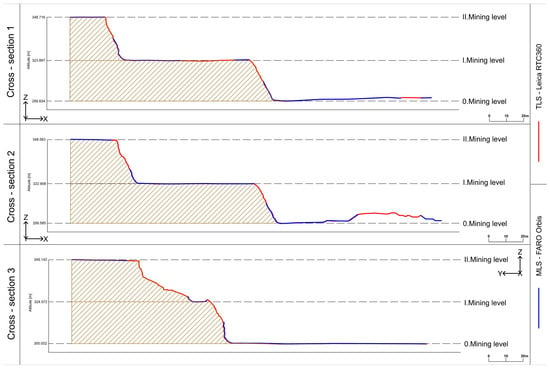
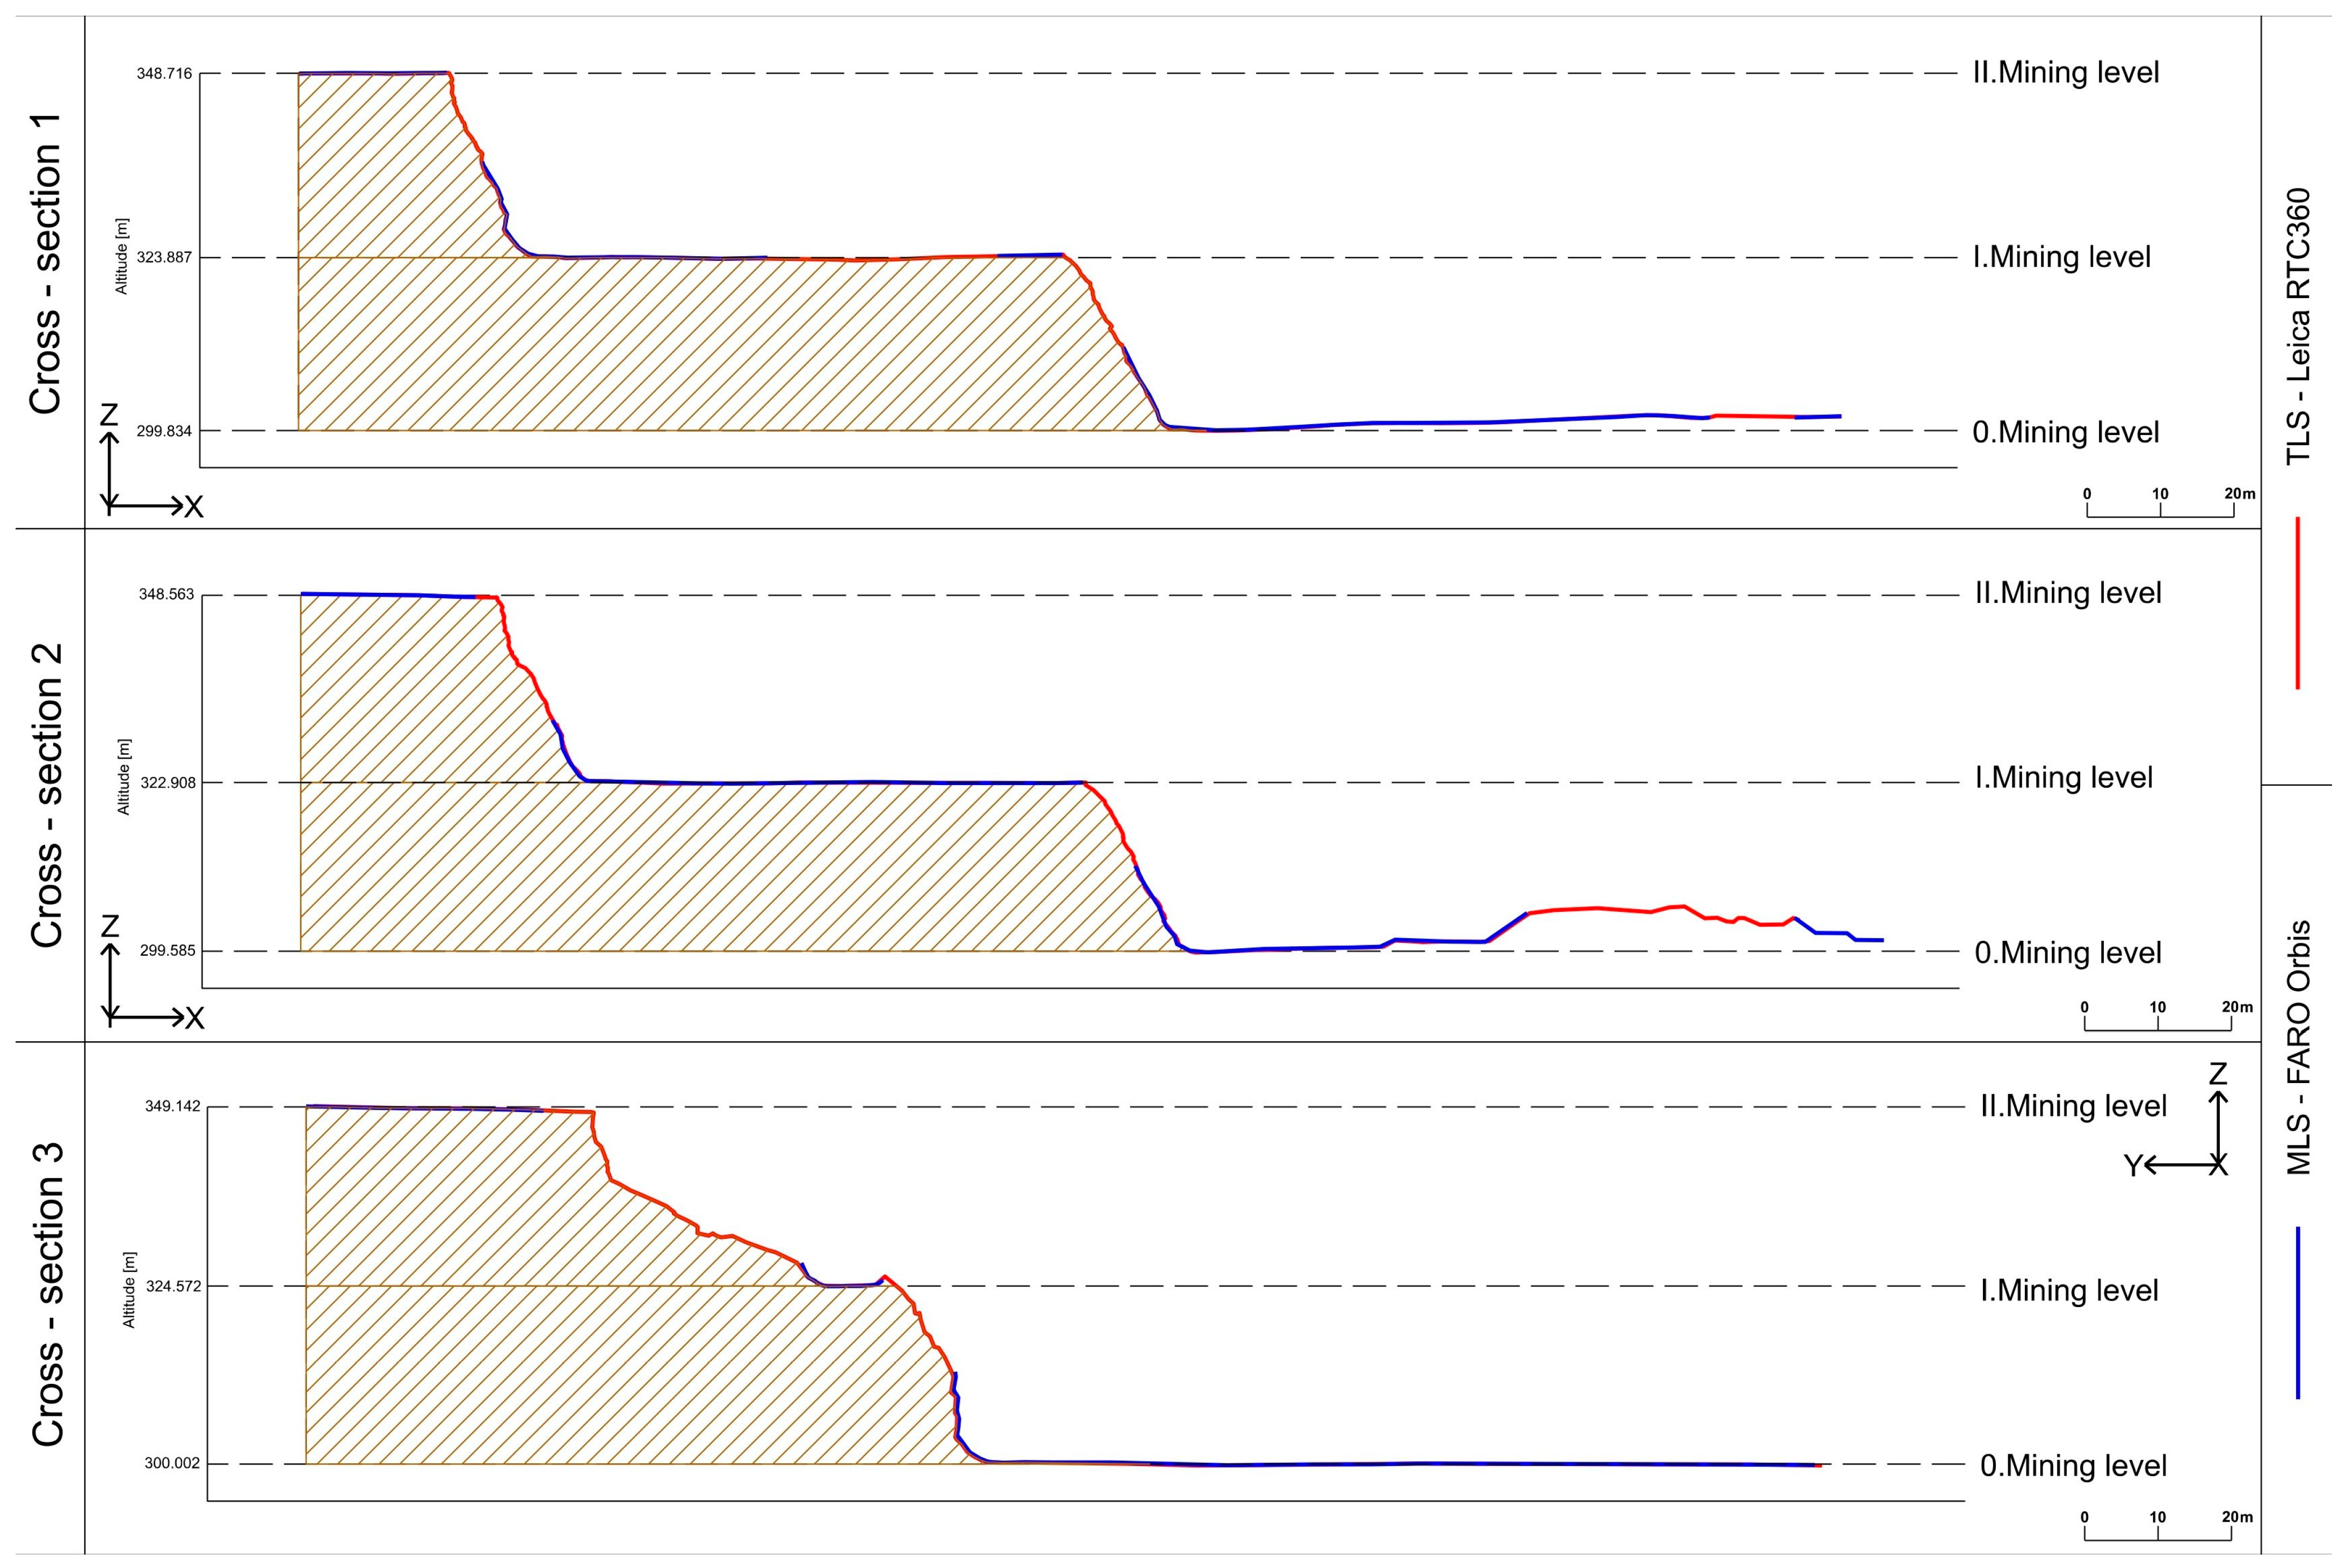
As part of the processing of the base mining map, three cross-sections were created (Figure 12), which provide a detailed representation of the vertical structure and shape of the individual quarry levels. Each profile passes through three mining levels, allowing for a comprehensive assessment of its morphology. The individual cross-sections were processed based on data obtained using the TLS and MLS methods.
Figure 12.
The three cross-sections in the quarry.
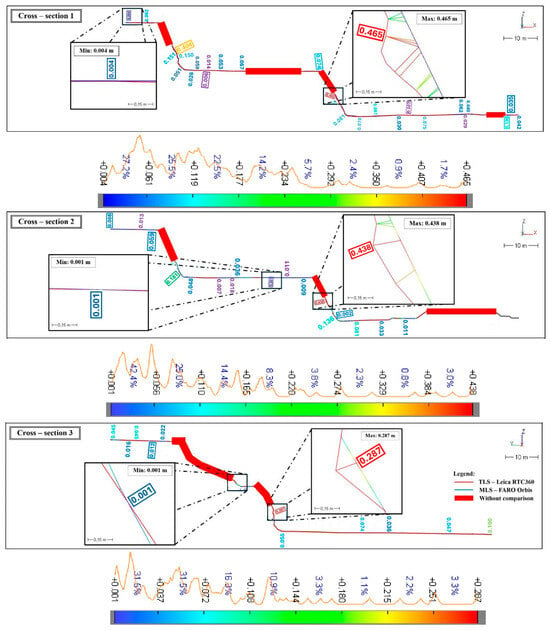
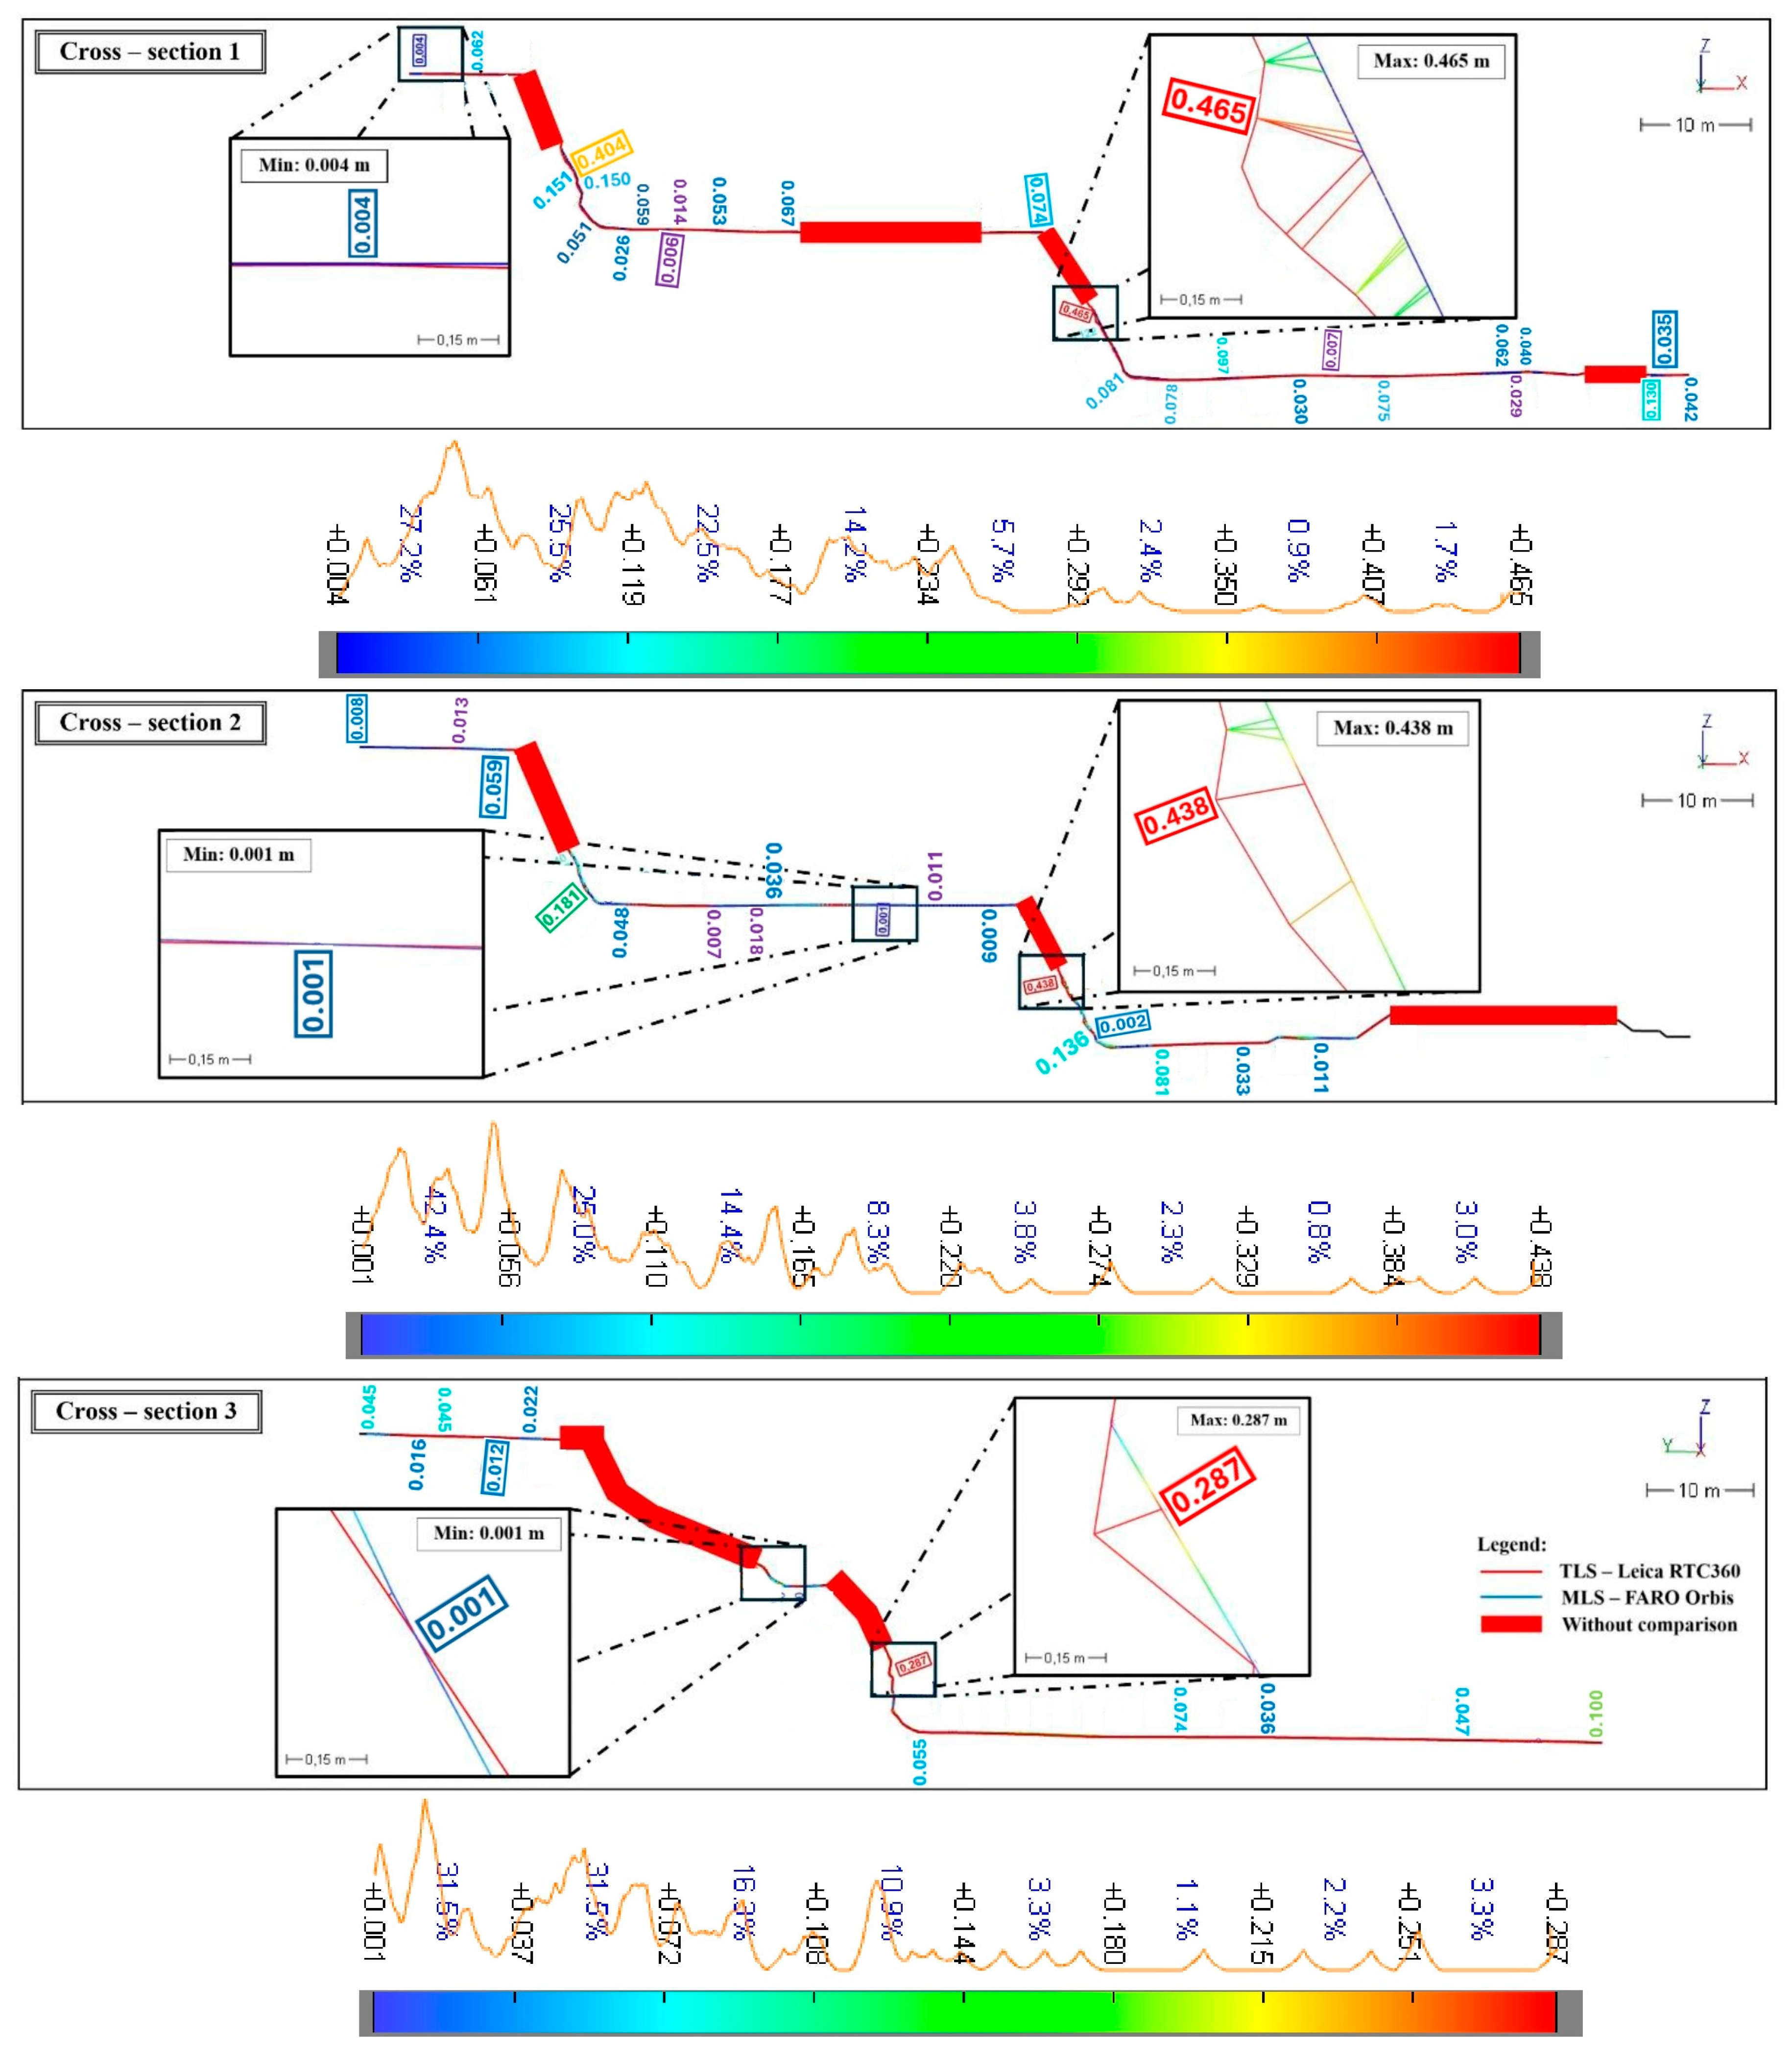
The subsequent analysis aimed to identify differences in surface capture, the accuracy of bench shape determination, and data continuity along individual cross-sections (Figure 13). Each cross-section presents a comparison of data acquired using the TLS and MLS methods. The comparison of the cross-sections revealed that the TLS method provides highly accurate and detailed representations of surface structures, particularly in areas with rugged terrain or limited accessibility. Due to its higher point density, TLS allows for precise identification of edges, small irregularities, and quarry walls. Conversely, the MLS method enables quick coverage of larger quarry areas; however, in some parts of sections, gaps and voids were observed, caused by shadowing, greater scanning distance from the surface, or occlusion of certain areas during data acquisition. These gaps and voids generated by the MLS method are shown in red, and direct comparison in these sections was not possible. Based on the comparison of the three cross-sections, minimum and maximum differences between the TLS and MLS datasets were identified.
Figure 13.
Cross-sections based on differences between the TLS and MLS methods. The values shown in the figure represent amplified distances between TLS and MLS point clouds with selected values highlighted. The colors correspond to the color scale below the figure. The scale indicates the frequency of values distributed across the intervals.
Cross-sections were generated by slicing in the Leica 3DR environment using the Extract → Planar Section function, which enables precise extraction of cross-sections from the point clouds acquired by TLS and MLS. After their creation, the cross-sections were subjected to analysis to identify spatial differences. This analysis was performed using the Analysis → Section function, allowing quantification of geometric parameters and determination of values of differences. TLS data were chosen as the reference.
Table 9 provides statistical values of the differences for the three cross-sections, aiming to compare the accuracy of each cross-section and identify possible extreme values of differences. In cross-section 1, the smallest difference is 0.004 m, while the maximum difference reaches 0.465 m. The most significant differences occur mainly in the area of the vertical quarry wall, where the MLS method has a limited range and loses detail due to changes in the beam incidence angle or areas hidden from the surveyor’s view. In contrast, on flat and even sections, the values are highly consistent, indicating good agreement between the two methods. The mean error for cross-section 1 is 0.061 m. In cross-section 2, the minimum difference is 0.001 m and the maximum difference is 0.438 m. Cross-section 3 exhibits a similar trend—the minimum difference is 0.001 m, while the maximum difference is 0.287 m. The differences are smaller compared to the first two cross-sections, indicating more favorable scanning conditions and better visibility of the levels for MLS. Overall, it can be concluded that the minimum differences, ranging from 1 to 4 mm, demonstrate the high precision of both technologies in capturing terrain details. The maximum differences (0.287–0.465 m) are localized in areas with steep slope changes or where MLS data contain voids. The average difference values show that cross-section 2 has the highest average value of 0.135 m, cross-section 1 reaches 0.099 m, and cross-section 3 has the lowest average value at 0.089 m. The mean error is relatively similar across all cross-sections, ranging from 0.054 m to 0.070 m, with cross-section 2 having the highest value and cross-section 3 the lowest. Based on these data, cross-section 3 is the most accurate and consistent section, as it exhibits the lowest maximum difference, the lowest average value, and the lowest mean error.
Table 9.
Statistical values of differences for the three cross-sections.
6. Discussion
In modern mapping and spatial data analysis, various data collection methods play key roles, each differing in terms of accuracy, efficiency, and application potential. This section focuses on comparing the advantages and disadvantages of two selected technologies: TLS and MLS. Each of these methods has its own specific characteristics that make it suitable for different applications in surveying, urban planning, forestry, or environmental analysis. The aim of this section is to provide a comprehensive overview that considers factors such as accuracy, data acquisition speed, costs, environmental limitations, and potential for use in various types of projects, designed for the creation of a Digital Twin of a mine in smart mining. This comparison offers insights for selecting the optimal technology based on specific requirements and conditions.
In environments such as quarries, different data collection methods offer specific advantages and disadvantages depending on the required accuracy, data acquisition range, and terrain conditions. TLS, performed using the Leica RTC360, is the most accurate method for detailed mapping of structures such as rock walls, fractures, or geological mapping. Its advantages include independence of light conditions and a high point density, which enables detailed analyses of rock stability. However, it is time-consuming when covering large areas and challenging to relocate scanners in rugged terrain. MLS, using the FARO Orbis, is ideal for quick mapping of accessible roads, platforms, or loading zones within the quarry. It offers flexibility and fast data acquisition, but its ability to capture small details of complex structures is limited. Although the accuracy of MLS is slightly lower compared to that of TLS, this method has proven to be a very efficient tool for large-area mapping in open quarry environments, where high-resolution detail is not always necessary. In combination with TLS, MLS provides a valuable compromise between speed and measurement accuracy. Each method has its own specific characteristics, and the choice of suitable technology depends on the project requirements and the nature of the surveyed environment.
The authors of [46] dealt with 3D mapping of an open-pit quarry with the aim of creating a 3D model using a combination of TLS and UAV photogrammetry technologies, and subsequently proposed a procedure for rapid documentation using MLS–SLAM. A Gexcel Heron mobile scanner was used. The authors report that the system ensures a local accuracy of ±2 cm and that differences greater than 3–4 cm can be reliably identified. This statement is consistent with our results.
In environments with complex morphology, such as the studied quarry, combining TLS and MLS technologies has proven to be highly effective. TLS enables detailed and highly accurate surface geometry recordings with a high point density, while MLS facilitates efficient data collection over larger areas and allows for capturing of zones that are difficult or impossible to access using TLS.
In [47], results show a maximum SLAM MLS data difference of 0.035 m compared to the TLS reference cloud in any direction. Mean errors for both clouds were below 0.015 m and, after applying the Iterative Closest Point Algorithm (ICP), below 0.01 m. The object of the study was a concrete bridge structure with a smooth structure and flat surfaces; therefore, the RMSD values are approximately twice as good as those in this study.
Integration of both methods represents an efficient approach to data acquisition in complex quarry environments, leading to the creation of a geometrically consistent and comprehensive 3D model. To ensure the required georeferencing accuracy and minimize systematic errors, this process should be supported by determining GCPs through precise geodetic techniques such as GNSS measurements and total station surveying.
The creation of a base mining map in a quarry environment requires accurate, up-to-date, and spatially consistent data on terrain configuration, mining objects, and infrastructure. Given the extent of the mining area, rugged terrain, and safety risks associated with direct surveying, TLS and MLS methods appear to be the most suitable. Through their appropriate combination, it is possible to efficiently cover the entire process of creating a base mining map—from data collection to final processing. TLS is mainly used where a high level of detail is required or where it is difficult or dangerous to perform measurements using traditional methods. MLS serves as a complementary method that enables rapid data acquisition over large open areas. The resulting base mining map thus meets legislative requirements as well as the practical needs of the mining organization, such as updating mining stages, recording technological elements, and evaluating changes in the terrain.
Accurate volume determination represents one of the key tasks in the documentation and monitoring of mining and quarrying sites. Volume calculation enables the assessment of extraction progress, control of the quantity of excavated material, and evaluation of the stability of individual stages. In this analysis, the quarry volume was determined using two different approaches—from the stage edges and from the point cloud (Table 10). In both approaches, a mesh model was generated. TLS data were chosen as the reference. The first approach, based on the stage edges, represents a more traditional method of volume calculation, where polygonal lines delineating the boundaries of individual mining levels are used. The second approach utilizes point clouds obtained through TLS and MLS methods. This model allows for a more accurate representation of the actual terrain shape, including its irregularities, breaks, and roughness. By comparing the two calculation methods, it is possible to evaluate the differences between the idealized and real surface forms, as well as to determine the influence of point density and scanning accuracy on the resulting volume.
Table 10.
Volume calculation from stage edges and point clouds using TLS and MLS methods.
When calculating the volume from stage edges, TLS achieved a value of 22,677 m3, while MLS reached 20,716 m3, representing a relatively small difference of 1961 m3. This indicates that both scanning methods can accurately capture object edges, with TLS providing slightly higher values. This difference is mainly due to the higher accuracy of TLS, which captures the boundaries and shapes of the object in greater detail. When calculating the volume directly from the point cloud, the difference between the methods is smaller. In this case, TLS shows a volume of 22,398 m3, while MLS records 21,599 m3, resulting in a difference of only 799 m3. This smaller difference reflects the higher point density and detail, which allows for a more accurate representation of surface variations.
The authors of [29] obtained results with accuracy levels (the distance between the SLAM point cloud and MLS-delivered mesh model is at a level of 5 cm) sufficient to calculate volumes in open-pit mines of similar scale and to update their 3D models, since the geometry changes associated with the periodically monitored advances of the mining operation would usually be on the order of meters. We consider this result valid under conditions of high point cloud completeness without gaps.
7. Conclusions and Outlook
Mining surveying in a quarry using modern geodetic methods, such as TLS and MLS, has provided comprehensive insights into the capabilities and limitations of these technologies. The conducted analysis of differences between point clouds on selected test areas provided comprehensive insight into the accuracy and reliability of the applied methods under varying conditions. Comparison with the reference TLS method revealed not only distinctions between the employed techniques but also the impact of surface inclination and character on output quality. The MLS method demonstrated solid performance in various environments; however, slightly lower accuracy on vertical walls suggests a specific limitation in capturing more complex geometries. An analysis of the selected mining wall area was conducted based on distance, highlighting the importance of combining technologies to achieve greater accuracy and efficiency when mapping complex natural environments like quarries. Noise analysis revealed that TLS, using the Leica RTC360 device, delivers a lower level of noise than the MLS method, thanks to a better interval of highest point density, lower standard deviation, and a resulting smaller value of RMSD across all test areas. The practical output of this process was the creation of a base mining map of a quarry, which is the basic digital input for the creation of a Digital Twin of the modern quarry in smart mining. In the process of creating the base mining map, a cadastral map was used, combined with TLS data, which provided a detailed and reliable 3D model of the mining area. The use of TLS significantly enhanced measurement accuracy and safety under demanding quarry conditions. The results demonstrate that modern laser scanning methods are effective and reliable tools for monitoring mining activities and producing technical documentation in quarry conditions. The created digital model meets the input quality requirements for creating or updating a Digital Twin in smart mining. The results of the cross-section analysis demonstrated the high accuracy and level of detail achieved by both applied methods—TLS and MLS. TLS more precisely captured quarry walls and level edges, while MLS enabled more efficient coverage of larger areas. The analysis of the cross-sections revealed localized differences between the two methods. Despite these variations, the results of both techniques show a high degree of suitability for the documentation and monitoring of quarries. The calculation of volumes from mesh models generated from level edges and point clouds is common practice. The preferred method of volume determination is based on complete coverage of the quarry, ideally based on a point cloud. However, in our practice, we often encounter reverse volume determination from existing—for example, digitized—maps, where the basic framework of the quarry terrain is defined by level edges. Our study confirmed that the use of 3D models allows for a more detailed and accurate determination of the actual shape and volume of the quarry.
The combination of TLS and MLS, which provides an outlook for further research, proves to be an effective tool for comprehensive analysis of volumetric changes and morphological characteristics of the quarry, providing a reliable basis for further geodetic assessments. The findings of this study contribute to the development of effective methodologies for quarry surveys and provide a solid foundation for research in spatial monitoring of DEM changes, big data processing, and creation of Digital Twins of quarries in smart mining.
Author Contributions
Conceptualization: Ľ.K., B.T., P.P., P.B. and O.T.; methodology: Ľ.K., B.T., P.P. and P.B.; software: Ľ.K., B.T. and P.P.; validation: Ľ.K., B.T., P.P., P.B. and O.T.; formal analysis: Ľ.K., B.T., P.P., P.B. and O.T.; investigation: Ľ.K.; resources: B.T. and P.P.; data curation: Ľ.K., B.T. and P.P.; writing—original draft preparation: Ľ.K., B.T. and P.P.; writing—review and editing: Ľ.K., B.T., P.P., P.B. and O.T.; visualization: Ľ.K., B.T. and P.P.; supervision: Ľ.K. All authors have read and agreed to the published version of the manuscript.
Funding
This research was supported by the Slovak Research and Development Agency under contract KEGA grant no. 003TUKE-4/2023, 011TUKE-4/2024, grant no. APVV-18-0351.
Institutional Review Board Statement
Not applicable.
Informed Consent Statement
Not applicable.
Data Availability Statement
The raw data supporting the conclusions of this article will be made available by the authors on request.
Conflicts of Interest
The authors declare no conflicts of interest.
References
- Xu, Z.; Xu, E.; Wu, L.; Liu, S.; Mao, Y. Registration of Terrestrial Laser Scanning Surveys Using Terrain-Invariant Regions for Measuring Exploitative Volumes over Open-Pit Mines. Remote Sens. 2019, 11, 606. [Google Scholar] [CrossRef] [Scilit]
- Bazarnik, M. Slope stability monitoring in open pit mines using 3D terrestrial laser scanning. EDP Sci. 2018, 66, 01020. [Google Scholar] [CrossRef] [Scilit]
- Labant, S.; Bindzarova Gergelova, M.; Kuzevicova, Z.; Kuzevic, S.; Fedorko, G.; Molnar, V. Utilization of Geodetic Methods Results in Small Open-Pit Mine Conditions: A Case Study from Slovakia. Minerals 2020, 10, 489. [Google Scholar] [CrossRef] [Scilit]
- Kekeç, B.; Bilim, N.; Karakaya, E.; Ghiloufi, D. Applications of Terrestrial Laser Scanning (TLS) in Mining: A Review. Türkiye Lidar. Dergisi. 2021, 3, 31–38. [Google Scholar] [CrossRef] [Scilit]
- Pukanská, K.; Bartoš, K.; Bella, P.; Gašinec, J.; Blistan, P.; Kovanič, Ľ. Surveying and High-Resolution Topography of the Ochtiná Aragonite Cave Based on TLS and Digital Photogrammetry. Appl. Sci. 2020, 10, 4633. [Google Scholar] [CrossRef] [Scilit]
- Bella, P.; Bosák, P.; Pruner, P.; Hercman, H.; Pukanská, K.; Bartoš, K.; Gaál, Ľ.; Haviarová, D.; Tomčík, P.; Kdýr, Š. Speleogenesis in a lens of metamorphosed limestone and ankerite: Ochtiná Aragonite Cave, Slovakia. Int. J. Speleol. 2022, 51, 13–28. [Google Scholar] [CrossRef] [Scilit]
- Gawronek, P.; Kwinta, A.; Sajdak, K.; Koczwara, P. TLS in Sustainable Mining Engineering: 3D Convergence and Surface Changes in Chamber Excavation in CH Salt Mine “Wieliczka”. Mining 2025, 5, 15. [Google Scholar] [CrossRef] [Scilit]
- Keawaram, B.; Dumrongchai, P. Comparisons of Surveying with Terrestrial Laser Scanner and Total Station for Volume Determination of Overburden and Coal Excavations in Large Open-Pit Mine. Int. J. Geol. Environ. Eng. 2017, 11, 1031–1039. [Google Scholar]
- Liu, W.; Zang, Y.; Xiong, Z.; Bian, X.; Wen, C.; Lu, X.; Li, J. 3D building model generation from MLS point cloud and 3D mesh using multi-source data fusion. Int. J. Appl. Earth Obs. Geoinf. 2023, 116, 103171. [Google Scholar] [CrossRef] [Scilit]
- Zlot, R.; Bosse, M.; Greenop, K.; Jarzab, Z.; Juckes, E.; Robert, J. Efficiently capturing of large, complex Cultural Heritage sites with a handheld 3D mobile laser mapping system. J. Cult. Herit. 2014, 15, 670–678. [Google Scholar] [CrossRef] [Scilit]
- Farella, E. 3D mapping of underground environments with hand-held laser scanner. In Proceedings of the SIFET Congress, Lecce, Italy, 7–9 September 2016. [Google Scholar]
- Chen, Z.; Li, Q.; Li, J.; Zhang, D.; Yu, J.; Yin, Y.; Lv, S.; Liang, A. IMU-Aided Registration of MLS Point Clouds Using Inertial Trajectory Error Model and Least Squares Optimization. Remote Sens. 2022, 14, 1365. [Google Scholar] [CrossRef] [Scilit]
- Luo, J.; Ye, Q.; Zhang, S.; Yang, Z. Indoor mapping using low-cost MLS point clouds and architectural skeleton constraints. Autom. Constr. 2023, 150, 104837. [Google Scholar] [CrossRef] [Scilit]
- Hosseinyalamdary, S.; Balazadegan, Y.; Toth, C. Tracking 3D Moving Objects Based on GPS/IMU Navigation Solution, Laser Scanner Point Cloud and GIS Data. ISPRS Int. J. Geo-Inf. 2015, 4, 1301–1316. [Google Scholar] [CrossRef] [Scilit]
- Macario Barros, A.; Michel, M.; Moline, Y.; Corre, G.; Carrel, F. A Comprehensive Survey of Visual SLAM Algorithms. Robotics 2022, 11, 24. [Google Scholar] [CrossRef] [Scilit]
- Szrek, A.; Romańczukiewicz, K.; Kujawa, P.; Trybała, P. Comparison of TLS and SLAM Technologies for 3D Reconstruction of Objects with Different Geometries; IOP Publishing: Bristol, UK, 2024; Volume 1295, p. 012012. [Google Scholar] [CrossRef] [Scilit]
- Weiss, T.; Dietmayer, K. Automatic Detection of Traffic Infrastructure Objects for the Rapid Generation of Detailed Digital Maps using Laser Scanners. In Proceedings of the 2007 IEEE Intelligent Vehicles Symposium, Istanbul, Turkey, 13–15 June 2007; pp. 1271–1277. [Google Scholar] [CrossRef] [Scilit]
- Zlot, R.; Bosse, M. Efficient Large-scale Three-dimensional Mobile Mapping for Underground Mines. J. Field Robot. 2014, 31, 758–779. [Google Scholar] [CrossRef] [Scilit]
- Lehtomäki, M.; Jaakkola, A.; Hyyppä, J.; Kukko, A.; Kaartinen, H. Detection of Vertical Pole-Like Objects in a Road Environment Using Vehicle-Based Laser Scanning Data. Remote Sens. 2010, 2, 641–664. [Google Scholar] [CrossRef] [Scilit]
- Ma, L.; Zuo, C.; Qiu, H.; Ma, H.; Yang, M.; Zhou, C.; Qian, J. A multilevel classification strategy for the identification of discontinuities from 3D point clouds of complicated rock surfaces. Rock Mech. Rock Eng. 2024, 57, 10611–10630. [Google Scholar] [CrossRef] [Scilit]
- Wężyk, P.; Szostak, M.; Krzaklewski, W.; Pająk, M.; Pierzchalski, M.; Szwed, P.; Ratajczak, M. Landscape monitoring of post-industrial areas using LiDAR and GIS technology. Geod. Cartogr. 2015, 64, 125–137. [Google Scholar] [CrossRef] [Scilit]
- Kütimets, K.; Ellmann, A.; Väli, E.; Kanter, S. Underground oil shale mine surveying using handheld mobile laser scanners. Oil Shale 2021, 38, 42–64. [Google Scholar] [CrossRef] [Scilit]
- Patra, D.; Ranasinghe, P.; Banerjee, B.; Raval, S. A Deep Learning Approach to Identify Rock Bolts in Complex 3D Point Clouds of Underground Mines Captured Using Mobile Laser Scanners. Remote Sens. 2025, 17, 2701. [Google Scholar] [CrossRef] [Scilit]
- Lato, M.; Kemeny, J.; Harrap, R.M.; Bevan, G. Rock bench: Establishing a common repository and standards for assessing rockmass characteristics using LiDAR and photogrammetry. Comput. Geosci. 2013, 50, 106–114. [Google Scholar] [CrossRef] [Scilit]
- Daneshmand, M.; Helmi, A.; Avots, E.; Noroozi, F.; Alisinanoglu, F.; Arslan, H.S.; Anbarjafari, G. 3d scanning: A comprehensive survey. arXiv 2018, arXiv:1801.08863. [Google Scholar] [CrossRef] [Scilit]
- Štroner, M.; Urban, R.; Křemen, T.; Braun, J.; Michal, O.; Jiřikovský, T. Scanning the underground: Comparison of the accuracies of SLAM and static laser scanners in a mine tunnel. Measurement 2025, 242 Pt A, 115875. [Google Scholar] [CrossRef] [Scilit]
- Vanneschi, C.; Salvini, R.; Massa, G.; Riccucci, S.; Borsani, A. Geological 3D modeling for excavation activity in an underground marble quarry in the Apuan Alps (Italy). Comput. Geosci. 2014, 69, 41–54. [Google Scholar] [CrossRef] [Scilit]
- Tong, X.; Liu, X.; Chen, P.; Liu, S.; Luan, K.; Li, L.; Liu, S.; Liu, X.; Xie, H.; Jin, Y.; et al. Integration of UAV-Based Photogrammetry and Terrestrial Laser Scanning for the Three-Dimensional Mapping and Monitoring of Open-Pit Mine Areas. Remote Sens. 2015, 7, 6635–6662. [Google Scholar] [CrossRef] [Scilit]
- Wajs, J.; Trybała, P.; Górniak-Zimroz, J.; Krupa-Kurzynowska, J.; Kasza, D. Modern Solution for Fast and Accurate Inventorization of Open-Pit Mines by the Active Remote Sensing Technique—Case Study of Mikoszów Granite Mine (Lower Silesia, SW Poland). Energies 2021, 14, 6853. [Google Scholar] [CrossRef] [Scilit]
- Gigli, G.; Lombardi, L.; Carlà, T.; Beni, T.; Casagli, N. A method for full three-dimensional kinematic analysis of steep rock walls based on high-resolution point cloud data. Int. J. Rock Mech. Min. Sci. 2022, 157, 105178. [Google Scholar] [CrossRef] [Scilit]
- Ismail, A.; Safuan, A.R.A.; Sa’ari, R.; Rasib, A.W.; Mustaffar, M.; Abdullah, R.A.; Kassim, A.; Yusof, N.M.; Rahaman, N.A.; Kalatehjari, R. Application of combined terrestrial laser scanning and unmanned aerial vehicle digital photogrammetry method in high rock slope stability analysis: A case study. Measurement 2022, 195, 111161. [Google Scholar] [CrossRef] [Scilit]
- Available online: https://www.enviroportal.sk/eia/detail/lom-trebejov:-tazba-dolomitu (accessed on 15 January 2025).
- Available online: https://www.geotech.sk/Produkty/GPS-GNSS/Leica-GS07.html (accessed on 1 February 2025).
- Available online: https://www.geotech.sk/downloads/GPS/GS07/Leica%20GS07%20prospekt%20SK.pdf (accessed on 1 February 2025).
- Available online: https://www.geotech.sk/Produkty/Totalne-stanice/Geodeticke/Leica-TS15.html (accessed on 1 February 2025).
- Available online: https://www.geotech.sk/downloads/Totalne-stanice/TS11-15/VivaTS15-prospekt-SK.pdf (accessed on 1 February 2025).
- Available online: https://www.geotech.sk/Produkty/Laserove-skenery-HDS/Leica-RTC360.html (accessed on 10 February 2025).
- Available online: https://www.geotech.sk/downloads/Laserove-skenery-HDS/Leica_RTC360_sk2.pdf (accessed on 10 February 2025).
- Available online: https://sk.3gon.eu/produkt/faro-orbis (accessed on 10 February 2025).
- Available online: https://media.faro.com/-/media/Project/FARO/FARO/FARO/Resources/1_BROCHURE/2023/Orbis/CMO5126_Brochure_Orbis-Connect_AECO_LT_ENG_Digital.pdf?rev=af1d1642e46d4b9685f04953a972202f (accessed on 10 February 2025).
- Available online: https://leica-geosystems.com/products/laser-scanners/software/leica-cyclone/leica-cyclone-3dr (accessed on 3 November 2025).
- Available online: https://www.danielgm.net/cc/ (accessed on 3 November 2025).
- Available online: https://leica-geosystems.com/products/laser-scanners/software/leica-cyclone/leica-cyclone-register-360 (accessed on 3 November 2025).
- Available online: https://www.hbu.sk/files/documents/zoznamy/specialnepredpisy/vynos-mh-sr-c-1-1993-o-banskomeracskej-dokumentacii.rtf (accessed on 3 November 2025).
- STN 013410; Large Scales Maps. Thematic Maps. Map Drawing and Symbols. Available online: https://normy.normoff.gov.sk/norma/130898/ (accessed on 3 November 2025).
- Vassena, G.; Clerici, A. Open Pit Mine 3D Mapping by TLS and Digital Photogrammetry: 3D Model Update Thanks to a Slam Based Approach, Int. Arch. Photogramm. Remote Sens. Spat. Inf. Sci. 2018, XLII-2, 1145–1148. [Google Scholar] [CrossRef] [Scilit]
- Urban, R.; Štroner, M.; Braun, J.; Suk, T.; Kovanič, Ľ.; Blistan, P. Determination of Accuracy and Usability of a SLAM Scanner GeoSLAM Zeb Horizon: A Bridge Structure Case Study. Appl. Sci. 2024, 14, 5258. [Google Scholar] [CrossRef] [Scilit]

Disclaimer/Publisher’s Note: The statements, opinions and data contained in all publications are solely those of the individual author(s) and contributor(s) and not of MDPI and/or the editor(s). MDPI and/or the editor(s) disclaim responsibility for any injury to people or property resulting from any ideas, methods, instructions or products referred to in the content. |
© 2025 by the authors. Licensee MDPI, Basel, Switzerland. This article is an open access article distributed under the terms and conditions of the Creative Commons Attribution (CC BY) license (https://creativecommons.org/licenses/by/4.0/).