


Abstract
Electricity prices have been exceptionally volatile in recent years. In 2022, we witnessed a sharp increase in electricity prices in many countries. Several factors contributed to this, including reduced electricity production by hydropower plants due to climatic conditions and geopolitical situations around the world, amongst other factors. The research presented in this paper aims to analyze electricity price data and determine the parameters CPS (Capacity Payment Scheme) and CRS (Capacity Remuneration Scheme). These parameters are calculated from hourly data on a monthly basis from 2018 to the present. Determining these parameters provides a clearer understanding of the efficiency of utilizing photovoltaic power plants. However, the results indicate that identical CRS values can signify different situations in the electricity market. Given the current support for projects utilizing photovoltaic energy, the research findings may offer insights into the future direction of photovoltaic energy utilization. If CRS and CPS show positive trends (e.g., increasing values), this may suggest that current political measures (subsidies, supports, etc.) are effective. Policymakers could then strengthen or expand these measures. The research outcomes could shape the geopolitical situation in individual states. The research results show how differences in electricity prices in 2022 compared to pre-2022 affected CSP and CRS parameters. The findings also indicate that electricity prices vary across different countries, which naturally impacts the calculation of CPS and CRS. In 2024, a significant decline in CRS was observed across all analyzed countries, which may indicate issues with integrating solar energy into the market, market saturation, or changes in market dynamics.
1. Introduction
Geopolitical situations, such as the war in Ukraine, have had a significant impact on global energy prices. Michelet (2022) and Rudolph and Damien (2023) point out that sanctions against Russia and restrictions on gas and oil supplies have caused a sharp increase in electricity prices in Europe. Additionally, climate extremes such as heatwaves and droughts have affected renewable energy production, further contributing to price volatility [1,2].
The production of electricity from renewable sources, especially by photovoltaic (PV) power plants, has experienced significant growth over the past decades. This trend is driven by global efforts to reduce greenhouse gas emissions, decrease dependency on fossil fuels, and ensure energy security. PV technologies have become an integral part of the energy mixes of many countries, with their share in total electricity production continuously increasing [1].
In addition to technological advancements, political and economic factors also play a crucial role. Many governments worldwide have implemented supportive policies and incentives to promote the installation of PV systems. These measures include subsidies, tax credits, guaranteed purchase prices for electricity generated from renewable sources (known as feed-in tariffs), and various forms of support for research and development in the field of renewable energy.
In recent years, a significant number of hours with negative electricity prices have been recorded, which has had a considerable impact on the profitability and economic efficiency of electricity sources. In [3], it was reported that in Australia, 6886 instances of negative electricity prices were observed from 2016 to 2020, primarily due to the penetration of PV and wind power plants [4]. However, numerous publications highlight the impact of various types of electricity sources on electricity prices. In [5,6,7,8,9], the authors point out that not only renewable energy sources increase the volatility and price of electricity in the market; for example, the construction of small hydropower plants can also reduce the price of electricity. Many publications address the issue of creating different models for predicting electricity prices. The article [10] examines the use of Gradient Boosting Machine (GBM) models for predicting electricity prices in the Irish market. It shows that GBM models, specifically XGBM and LGBM, can predict electricity prices with better accuracy, thereby extending forecast horizons. In [11], the authors investigated the use of linear regression for predicting electricity price trends, albeit with not very high accuracy. The most commonly used methods for predicting electricity prices are stochastic time series, causal models, machine learning, and artificial intelligence-based models [12,13,14,15,16,17,18,19].
Producers and buyers meet on the exchange, where prices are determined for each hour a day in advance. It is possible to predict the price of electricity with a certain probability, but prediction is still not entirely accurate. However, what we do know is that once the price is set on the exchange, sellers know how much they will earn for each MWh produced. Given that a single price is set for each hour, not every producer has the same profit per MWh produced. This is due to different operating costs. PV and wind energy sources have the lowest operating costs. Additionally, the generated electricity must be delivered to the grid. Given that electricity prices have been highly volatile in recent years, it is not possible to predict in advance the profit that a power plant will generate. However, there are indicators that can give us a clear idea of this—CPS and CRS. These indicators are relevant for several reasons:
- The cost of a project is significantly influenced by its procurement price, as this determines its financial value through its ability to generate revenue.
- Capture Price defines the value of specific technologies within a particular geographical location.
- Predicting Capture Price is one of the most important elements in conducting financial modeling analysis for investment decisions.
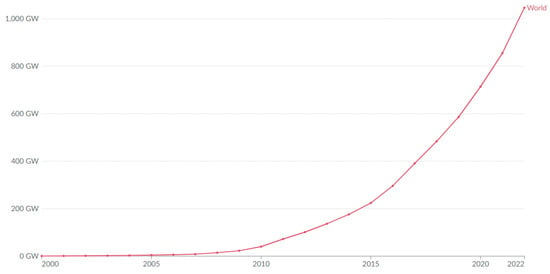
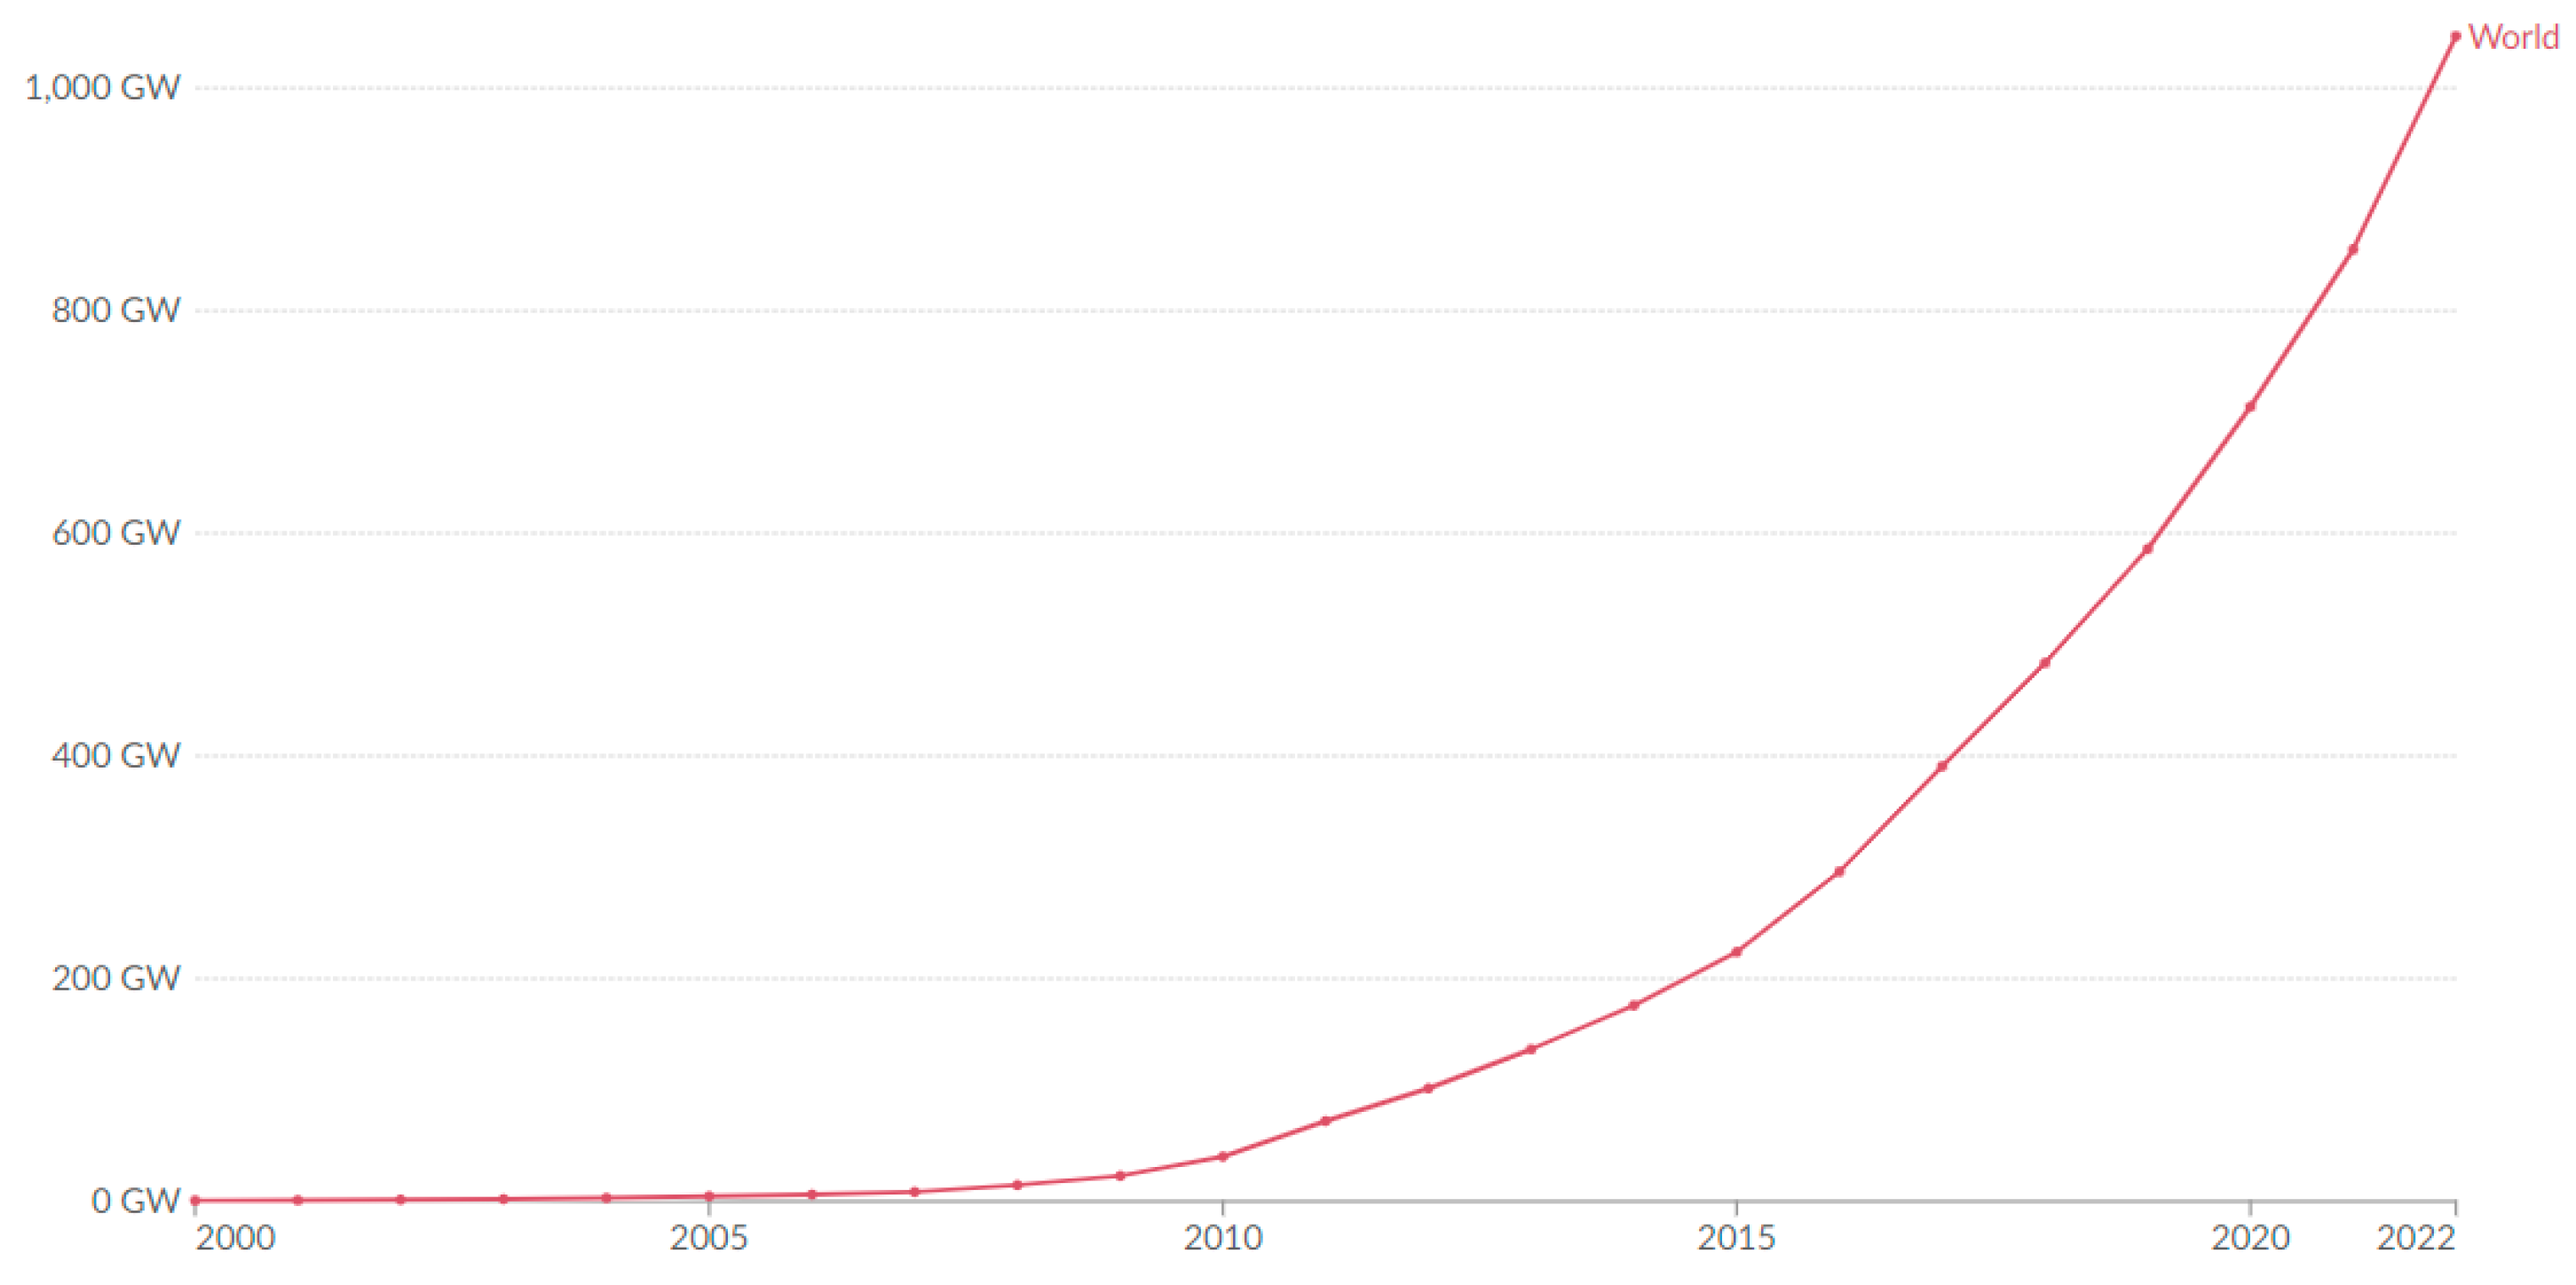
From the above, it follows that investment costs are essential information. This information is necessary to start considering future projects. In the case of PV power plants, which this contribution focuses on, the situation has changed in recent years. One of the reasons is the fact that the prices of photovoltaic systems have decreased and thus become more affordable. In Figure 1, the trend of installed PV capacity from the year 2000 to 2022 is shown. For comparison, Table 1 provides the installed photovoltaic capacity for individual years across the world. The largest increases in installed PV capacity occurred in the years 2008, 2010, and 2011; these years recorded a year-on-year increase of more than 170 percent. From Table 1 and Figure 1, it can be seen that from the year 2000 to 2022, there was a significant increase each year. Not a single year in the period from 2000 to 2020 recorded a decrease in the installed capacity of PV power plants worldwide [20].
Figure 1.
Cumulative capacity of solar panels (photovoltaics) in gigawatts (GW) across the world. [20].
Table 1.
Installed PV capacity across the world from 2000 to 2022 [20].
2. Analysis of Electricity Price Trends
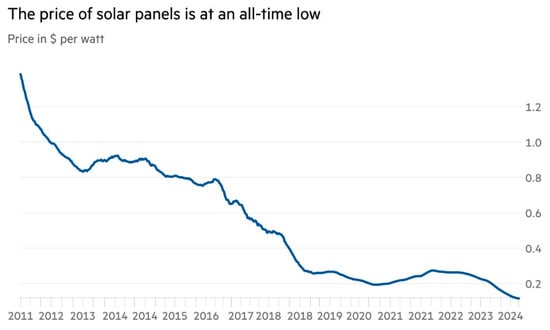
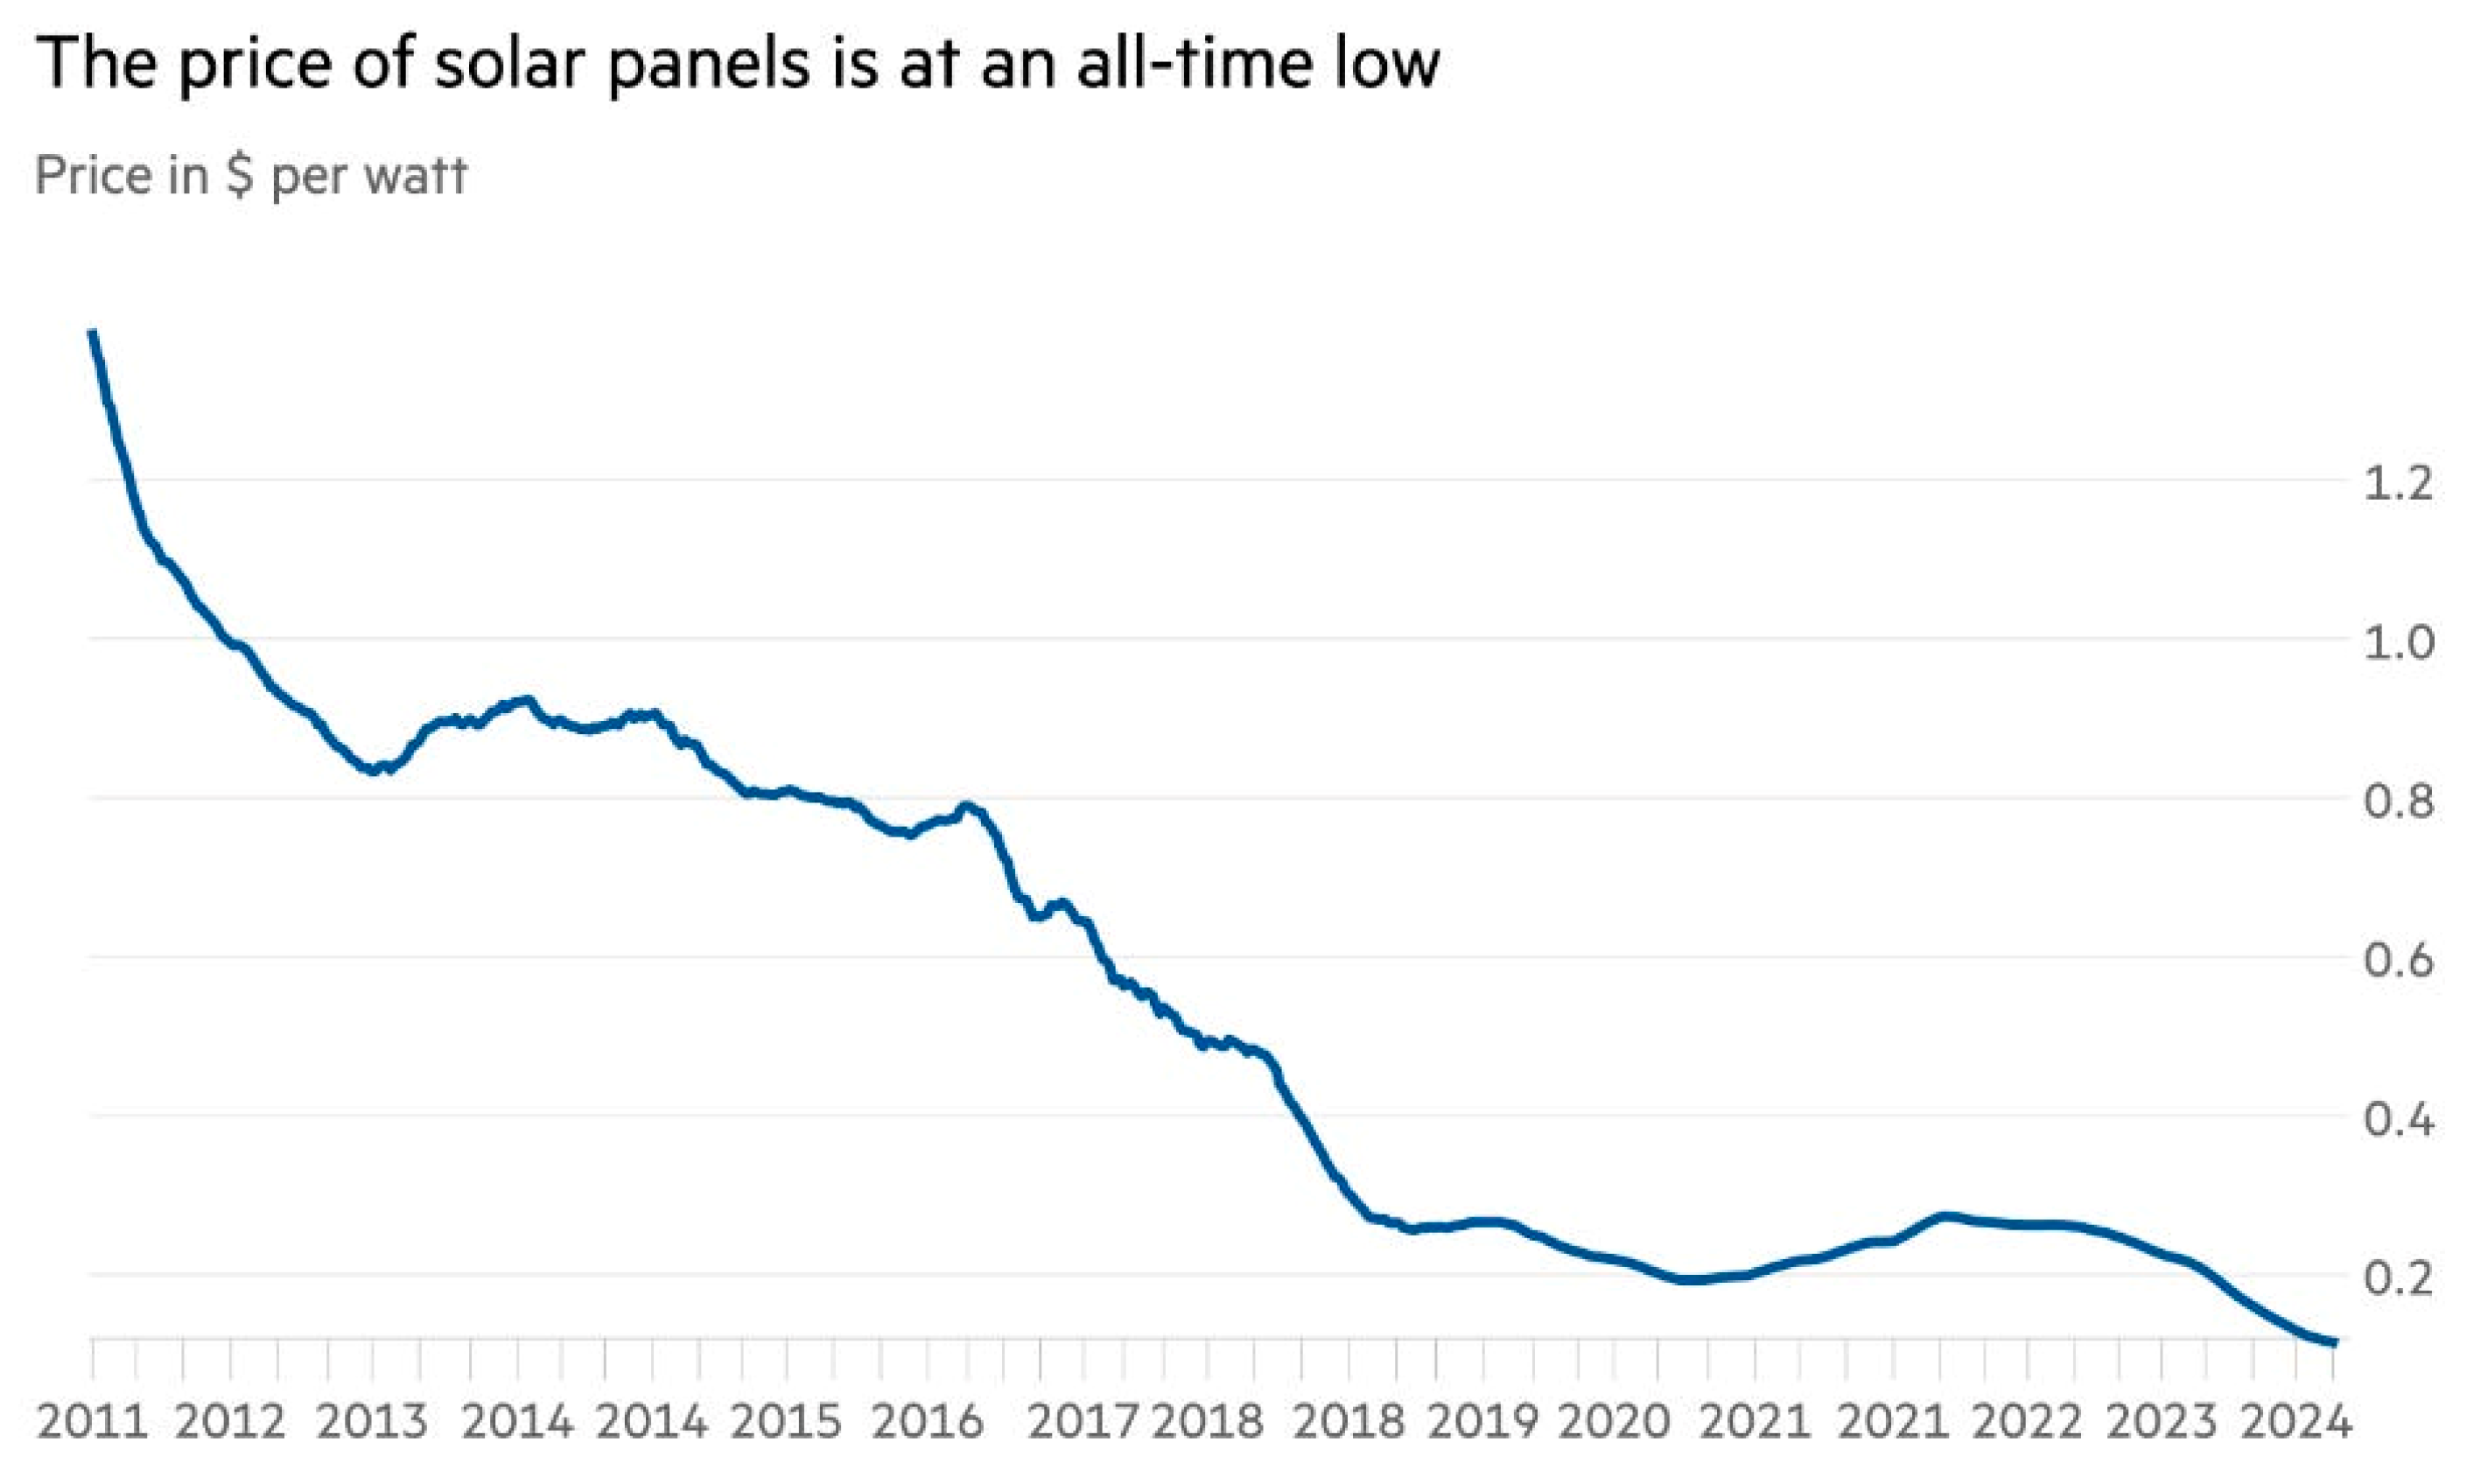
The massive expansion of PV in Europe is motivating component suppliers to expand their manufacturing capacities for PV modules, which are primarily concentrated in China. While previous years have seen a supply shortage due to various factors, the current situation is the opposite. Chinese manufacturers are producing so many PV panels that they are causing a global surplus. Up to 80 percent of global PV production is based in China. The sheer volume of panels produced, coupled with weaker demand, has led to a sharp decline in their prices. Presently, these panels have flooded the market and become so inexpensive that some people in the Netherlands and Germany are using them to clad fences. The improved availability and low cost of panels are also motivating households to install small solar power plants on their rooftops. Overall, PVs have become a more accessible and attractive option for households, leading to increased interest in their installation. The price of PV panels has significantly decreased in recent years. According to [21], the price per 1 Wp dropped from 1.4 USD/W in 2011 to less than 0.2 USD/W (see Figure 2). The boom in solar energy did not start by chance. During times of energy crises, many households began looking for options to reduce their expensive energy bills, with installing solar panels being one of the primary choices [21,22,23,24].
Figure 2.
The price of solar panels from 2011 to 2024 [21].
Electricity prices in 2022 reached significant peaks due to a combination of multiple factors. These factors included geopolitical events, increased energy demand, supply chain disruptions, and climatic conditions. A detailed analysis of electricity price trends in 2022 reveals that one of the most significant factors influencing electricity prices was the war in Ukraine. This crisis led to substantial disruptions in the supply of natural gas and oil from Russia—a major energy supplier for Europe. Sanctions imposed on Russia and restrictions on gas supplies caused a sharp increase in energy prices on global markets. Since natural gas is often used for electricity generation, the rise in its price directly impacted the costs of electricity production.
Following the lifting of pandemic restrictions in 2021, there was a significant revival in economic activity, which increased energy demand. Industrial sectors sought to make up for lost time and ramped up production, leading to higher electricity demand. This increased demand contributed to higher prices, as supply could not keep pace with the growing needs. The COVID-19 pandemic caused significant disruptions to global supply chains, resulting in shortages of critical components and materials necessary for the production and distribution of electricity. The shortage of components, such as semiconductors and other technologies, affected the manufacturing and maintenance of energy infrastructure, subsequently impacting the stability and reliability of electricity supplies.
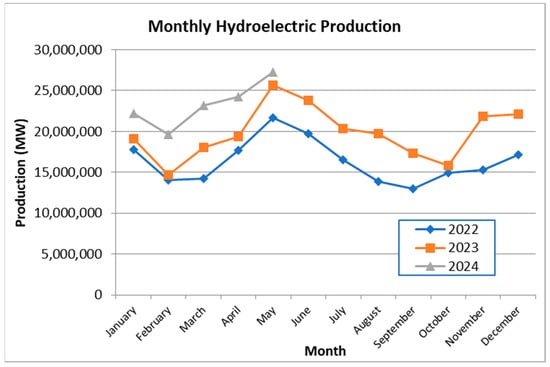
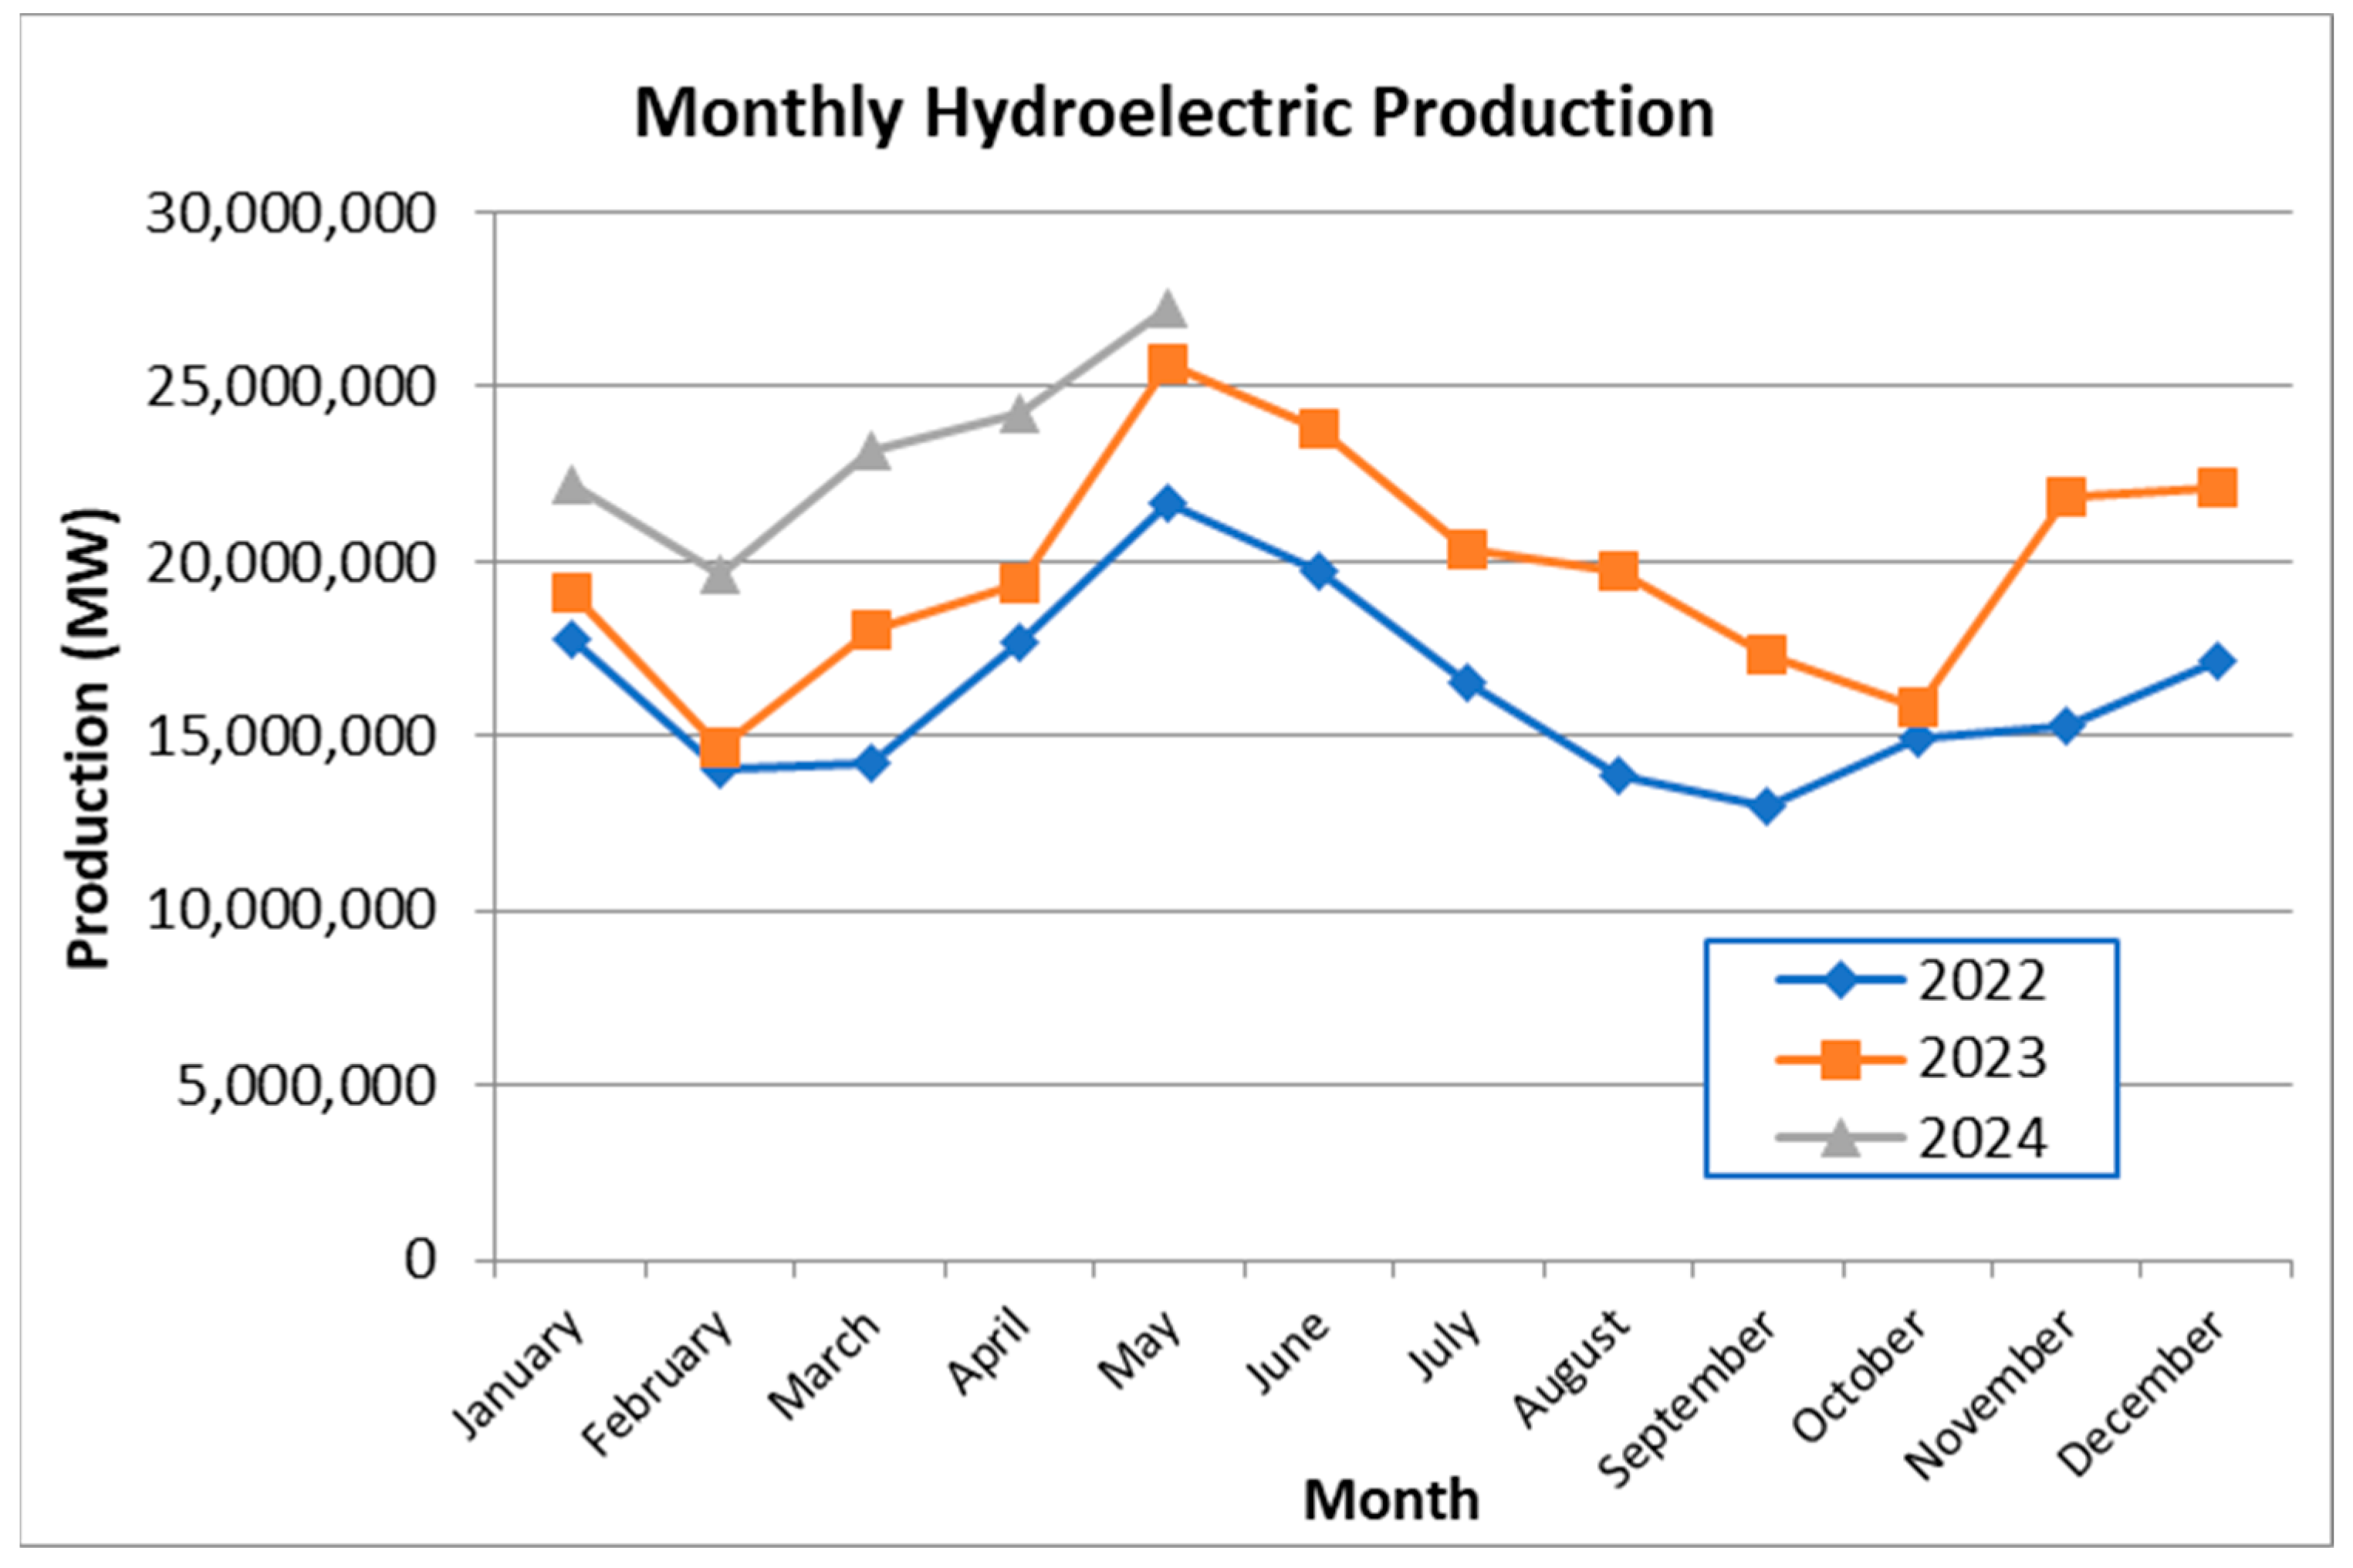
Extreme weather conditions also contributed to elevated electricity prices. In 2022, several extreme heatwaves and droughts were recorded, affecting the production of electricity from renewable sources, such as hydroelectric power plants. Figure 3 shows the electricity generation trends from hydropower plants in Europe for the years 2022, 2023, and 2024. The data confirm the aforementioned statement about 2022. The year 2024 currently records the highest levels of electricity generated by hydropower plants.
Figure 3.
Monthly hydroelectric production from 2022 to 2024.
Reduced production from renewable sources increased dependence on fossil fuels, whose prices were already high due to supply disruptions. Within the European Union Emissions Trading System (EU ETS), there was an increase in the price of emission allowances in 2022. This system is designed to incentivize the reduction of greenhouse gas emissions, but the rise in allowance prices increased the cost of electricity production from fossil fuels. This contributed to the overall increase in electricity prices on the market.
The rise in electricity prices has spurred a significant increase in investments in solar panels and energy storage technologies. This trend is particularly evident in countries where electricity prices reach high levels, making the installation of solar panels more economically advantageous. Households and businesses are seeking ways to reduce their energy costs, and one of the most effective solutions is investing in renewable energy sources.
Nguyen et al. (2023) emphasize that battery systems are key elements of these investments. Battery systems allow for the storage of excess energy produced by solar panels during periods when production exceeds consumption, such as on sunny days. This stored energy can then be used or sold back to the grid during times of higher electricity demand, achieving higher market prices [25].
This approach has several significant advantages. First, it allows for the maximization of the use of produced solar energy and minimizes losses. Second, it increases the profitability of solar projects by enabling the sale of electricity at higher prices during peak demand times. Third, it reduces dependence on fluctuating electricity prices in the market, providing greater stability and predictability of income for solar power plant owners [25].
Investments in energy storage technologies are therefore essential for the effective use of renewable energy sources. They provide flexibility and adaptability to market conditions, enhancing the overall economic efficiency of solar projects. These technologies also contribute to the stability of the power grid and help reduce the load on traditional energy sources during peak demand periods [25].
In summary, investments in battery systems represent a strategic step towards improving the sustainability and economic viability of solar energy. As research by Nguyen et al. (2023) shows, properly implemented energy storage technologies can significantly contribute to the development and success of solar projects in a dynamically changing energy market [25].
The rise in energy prices also motivated many European households to install solar panels on their rooftops, enabling them to save on bills and sell green electricity back to the grid. The high interest among Europeans in owning small solar power plants spurred an expansion in manufacturing capacities. This gradually led to a decrease in the prices of components, especially PV panels. The massive demand for panels eventually subsided, but manufacturers continued their increased production. The higher supply and lower demand meant that prices fell. Consequently, inexpensive solar panels gradually flooded the market. According to estimates by the International Energy Agency, the global supply of solar panels is expected to reach 1100 gigawatts by the end of the year, which is three times the current demand forecast.
3. The Scientific Basis for the Further Analyses
In the context of the transition to renewable energy sources, understanding the economic factors that influence electricity prices is crucial. One important concept is CPS, which measures the rate at which solar power plants can sell their produced electricity on the market. The economic efficiency of PV power plants is often evaluated through the parameters CPS and CRS. Zhang et al. [24] state that these parameters are crucial for assessing the profitability of solar projects. CPS is the average price at which solar power plants sell their products, while CRS determines how much of the market a solar power plant can “capture” compared to the average market price of electricity [22].
CPS is the average price at which solar power plants sell electricity on the market. CPS values can be calculated as follows [22,26,27,28]:
where Total Revenue from Solar Electricity is the income earned from selling electricity generated by solar power plants and Total Amount of Solar Electricity Produced is the quantity of electricity generated by solar power plants that is sold on the market.
This price can differ from the average market price of electricity because it depends on various factors, such as the timing of electricity production, demand and supply, and specific conditions in the electricity market. Thus, the Capture Price serves as an indicator that measures the economic value of solar energy in real time. CPS is a critical parameter for solar power plant operators and investors, as it directly impacts their revenues and the economic viability of projects.
If the Capture Price is high, this means that PV power plants can sell their electricity at more favorable prices, enhancing their profitability and encouraging further investment in solar energy. Conversely, a low Capture Price can signal market issues, such as an oversupply of solar energy during certain times of the day, leading to price reductions. This is particularly relevant in regions with a high share of PV power plants, where prices may drop during peak solar production periods [25,27,28,29].
A high Capture Price indicates that solar energy is being sold at higher prices, which can contribute to increased wholesale electricity prices. This can positively impact the profitability of solar projects but may also raise costs for end consumers. On the other hand, a low Capture Price suggests a lower market value for solar energy, potentially reducing overall wholesale electricity prices. This effect can benefit consumers, who pay less for electricity, but can be detrimental to solar power plant operators, who face reduced revenues.
One of the key factors affecting the Capture Price is the variability of solar energy. During sunny days, the supply of solar energy can be high, which drives prices down. Therefore, investing in energy storage technologies, such as batteries, is important, as they allow the storage of excess energy and its sale during times of higher demand and higher prices.
CRS is a critical indicator for assessing the economic efficiency of energy sources, in this case, PV power plants. A high Capture Rate value means that a PV power plant can sell electricity at a higher price, which increases its profitability and shortens the return on investment. A low Capture Rate value may indicate the need for technology improvement, better grid integration, or better timing of electricity production and sales from PV power plants. CRS is often compared with the Capture Rate of other energy sources, such as wind, nuclear, or fossil fuel power plants. This comparison helps determine the competitiveness of PV power plants in the market. It is expressed as a percentage that shows the extent to which PV power plants can “capture” value in the electricity market compared to the average market price. The relationship (2) expresses the calculation of CRS [22,29,30,31,32]:
where Capture Price for Solar (CPS) is the average price at which solar electricity is sold on the market and Average Market Price of Electricity is the average price of all electricity on the market over a given period.
If the CRS is higher than 100%, this means that solar power plants are selling their electricity at a higher price than the average market price. Conversely, if the CRS is lower than 100%, solar power plants are selling their electricity at a lower price than the average market price. CRS provides important information about the economic viability of solar power plants. High Capture Rate values indicate that solar power plants are efficient and profitable, while low values may signal the need for improved efficiency or support in terms of market conditions or policy measures.
In the following section, we will describe research focused on analyzing CPS and CRS for the Czech Republic, Poland, Hungary, and Slovakia. The analysis utilized data on electricity prices in these countries and the amount of electricity generated from PV power plants in each country. The next step was to determine the average market price of electricity. The analysis focused on monthly data, with input data on electricity prices provided on an hourly basis. Using Microsoft VBA, the average market price of electricity was calculated. Subsequently, the CPS was computed according to Equation (1). In this calculation, it was necessary to determine the total revenue from solar electricity. This value was obtained by multiplying the electricity price in a given time period (e.g., hourly) by the amount of electricity produced by PV sources, these being the focus of our study. These calculations were repeated hourly using Microsoft VBA, and the CPS was calculated for each month from 2018 to 2024. This method was used to compute the CPS and subsequently the CRS. The analysis of the results and the results themselves are presented in the subsequent section of the manuscript.
4. Analysis of Capture Price for Solar (CPS)
During the research, freely available data from energy-charts.info were used. The timeframe used was hourly, and the following values were calculated from these data.
- (a)
- Day-Ahead Price (DAP)
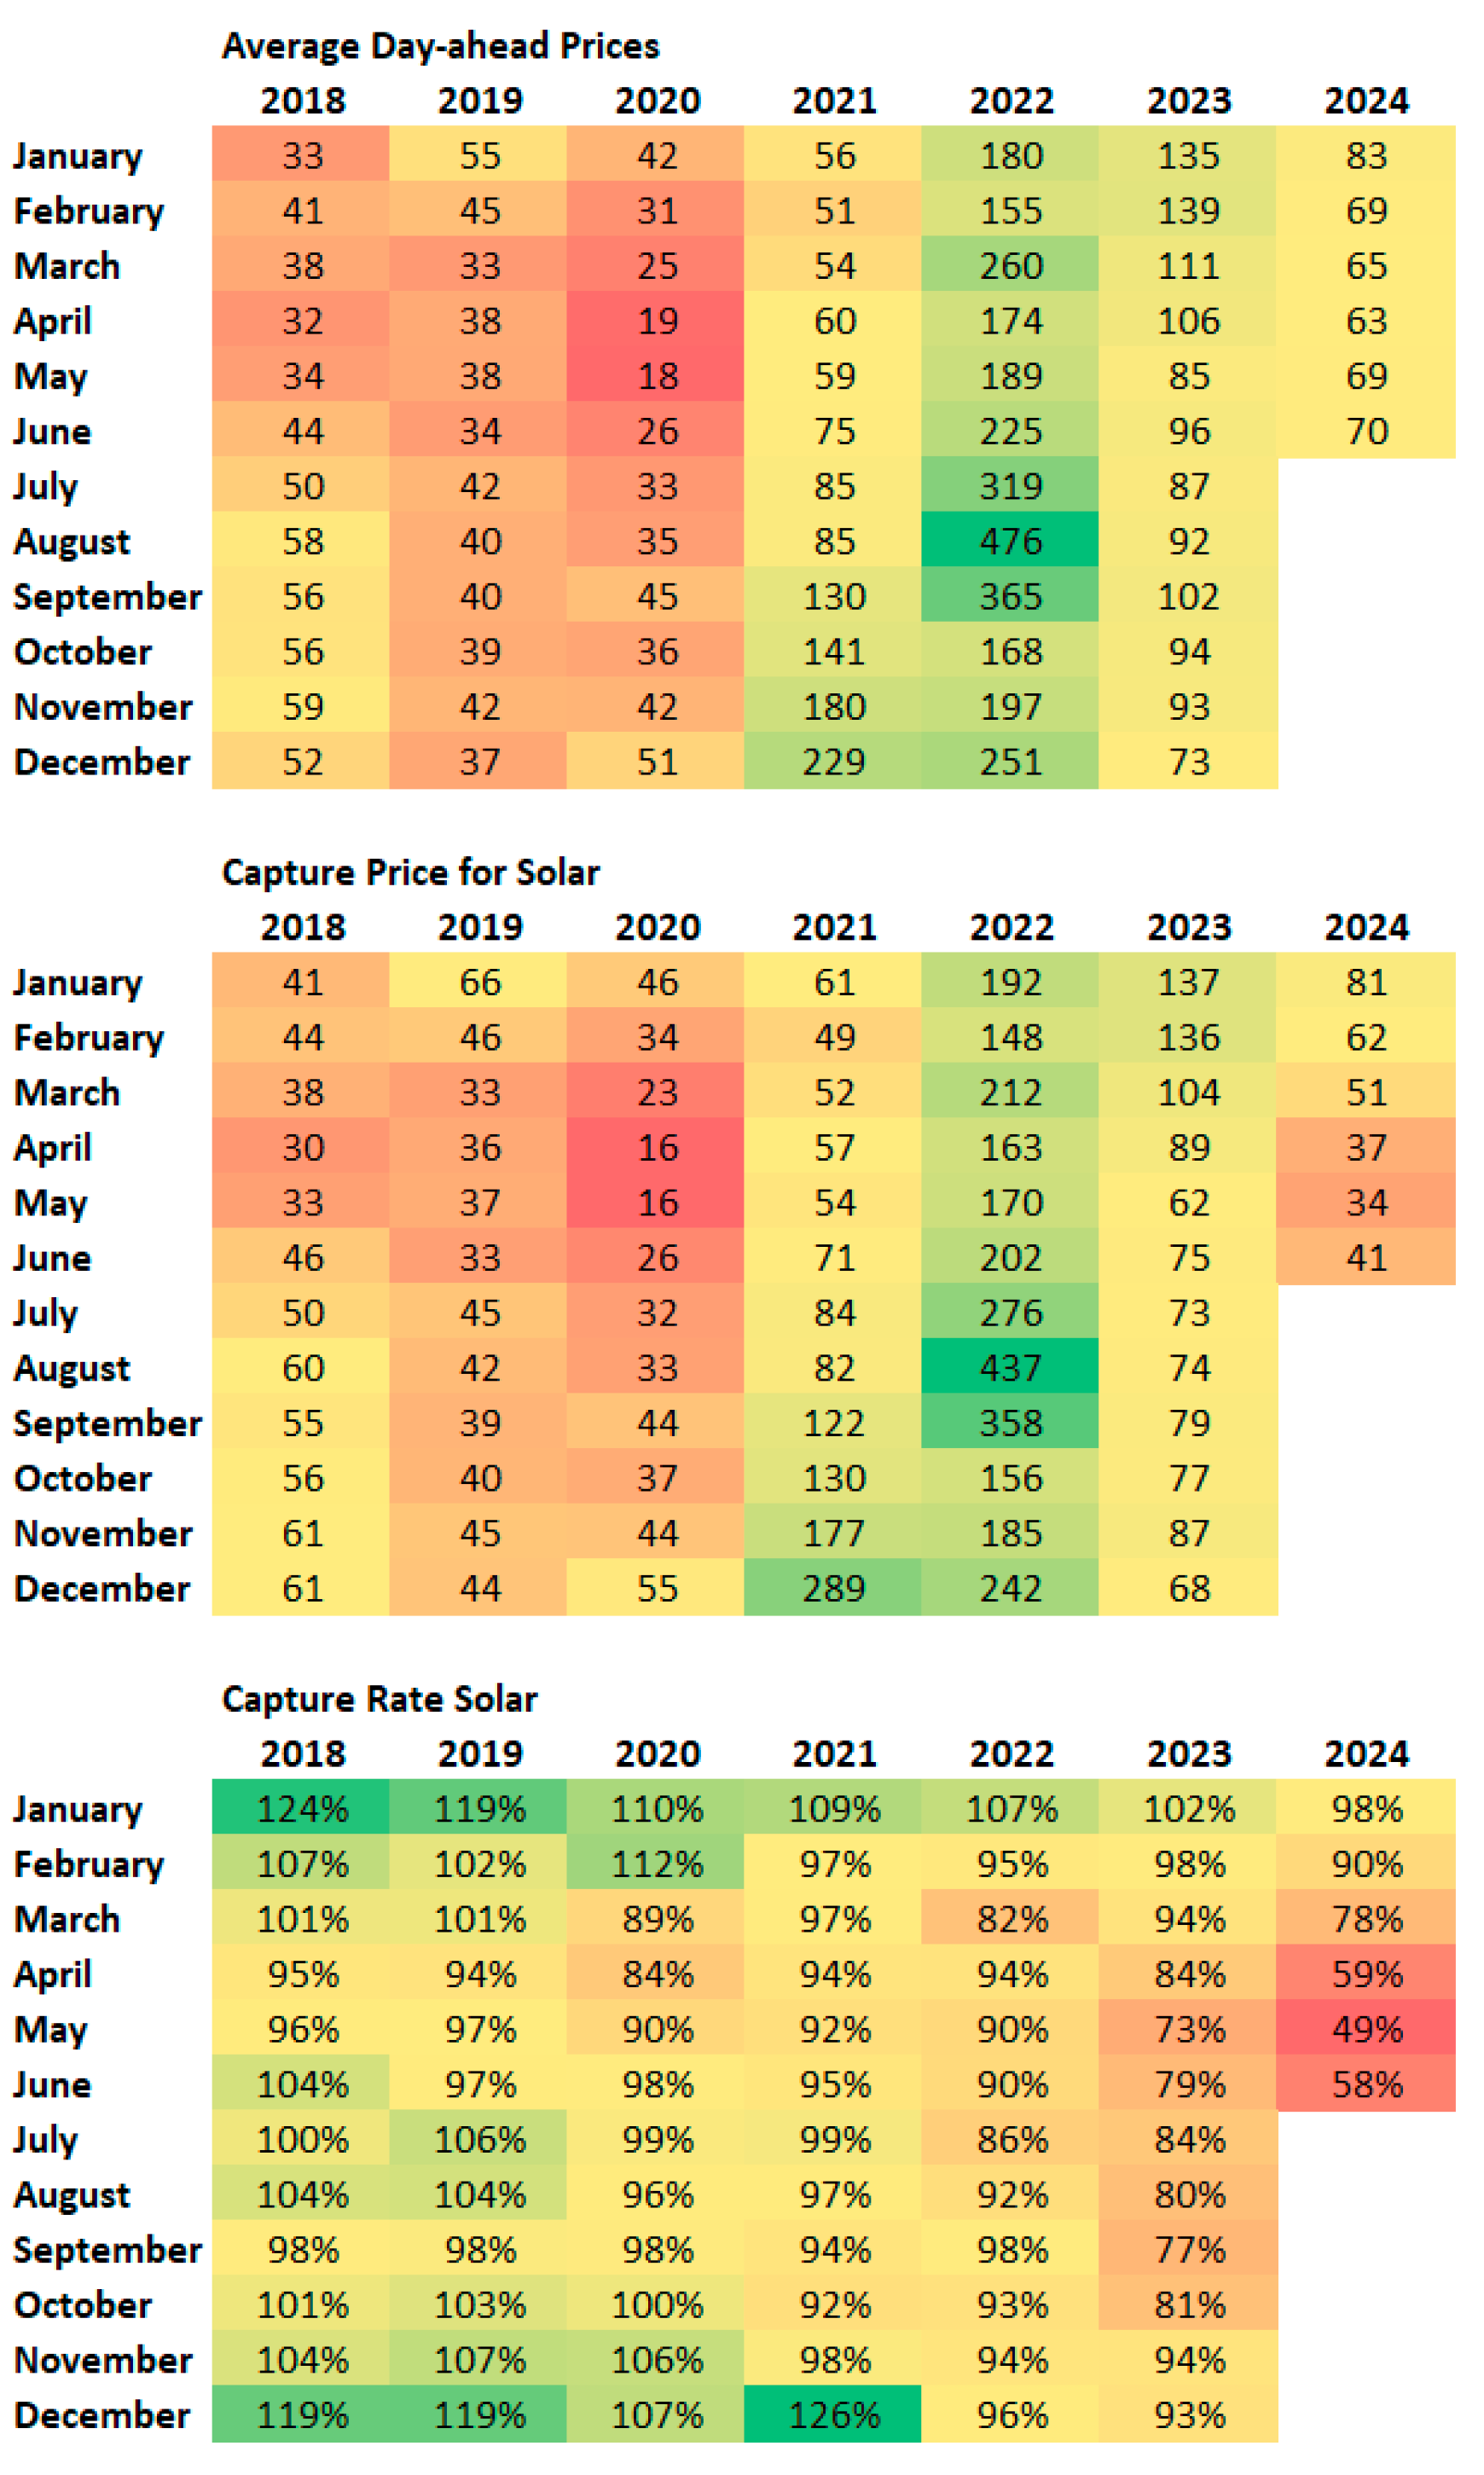
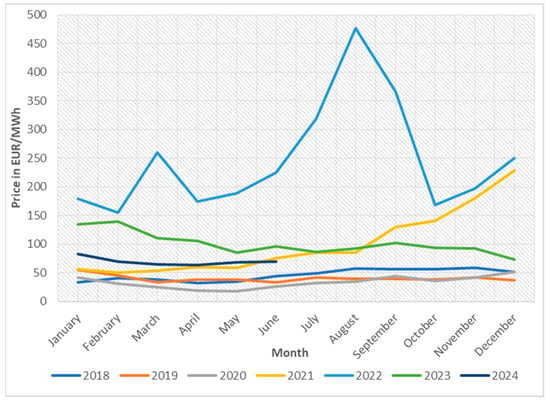
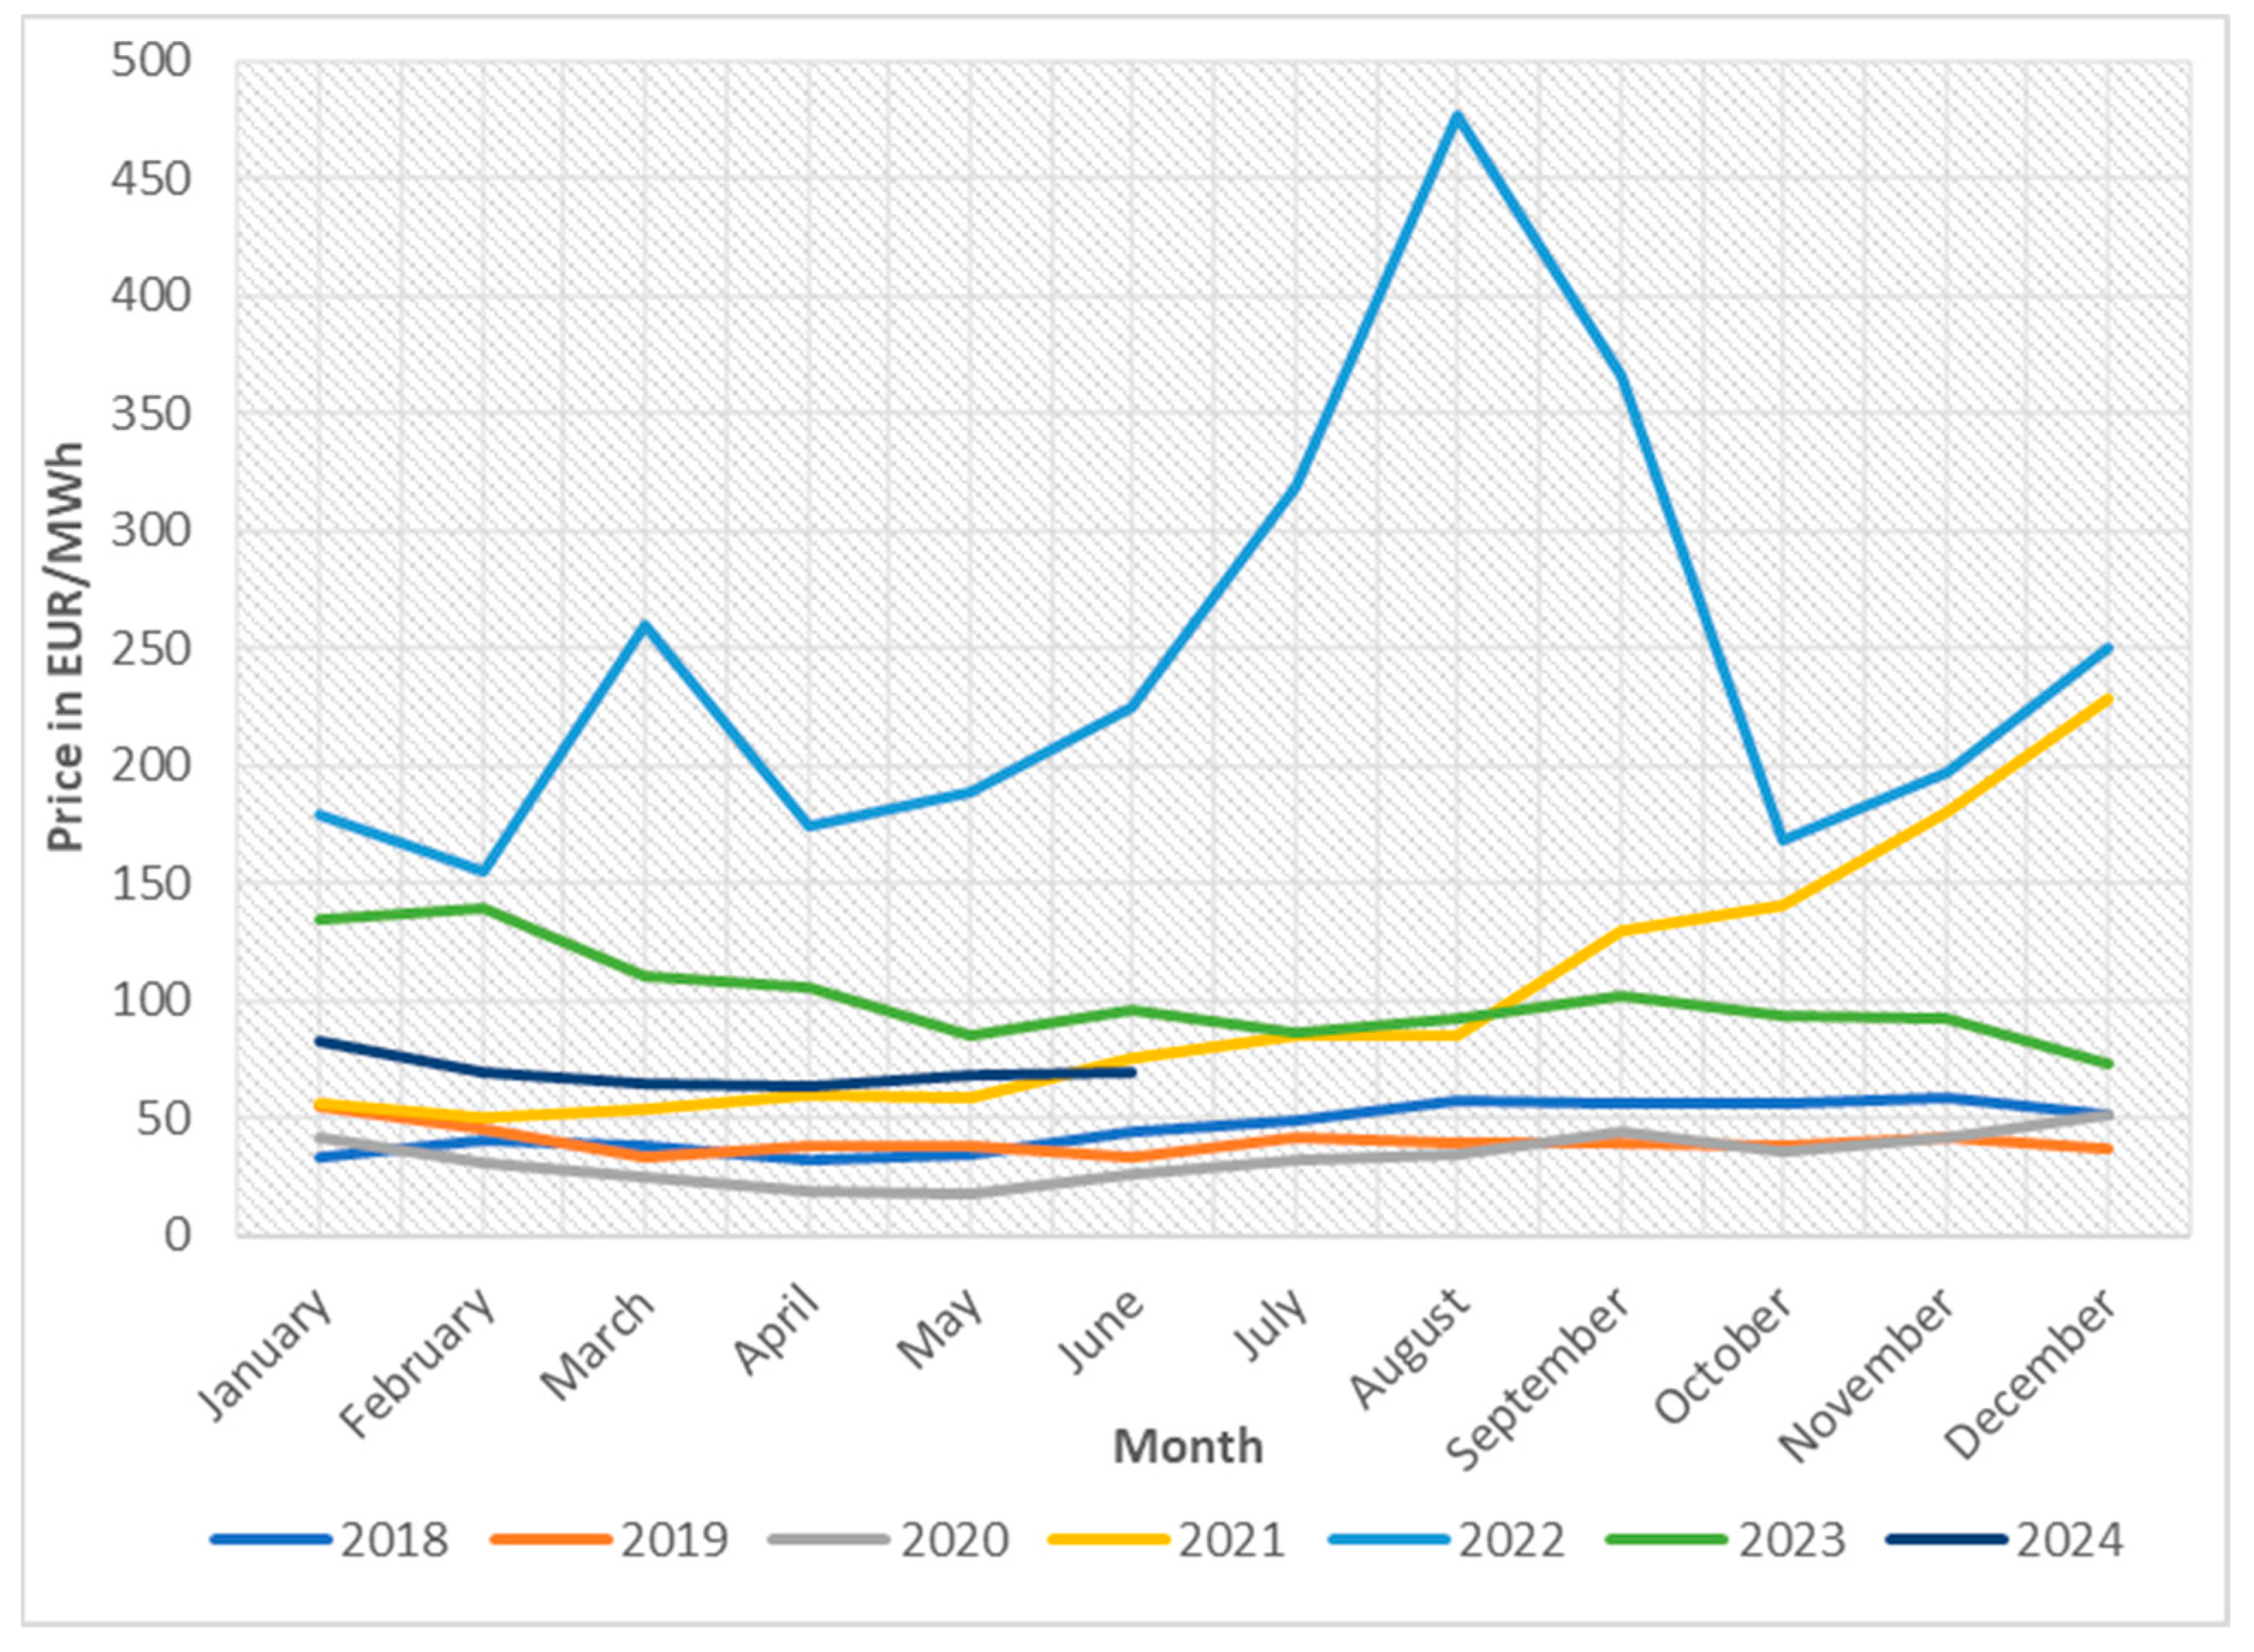
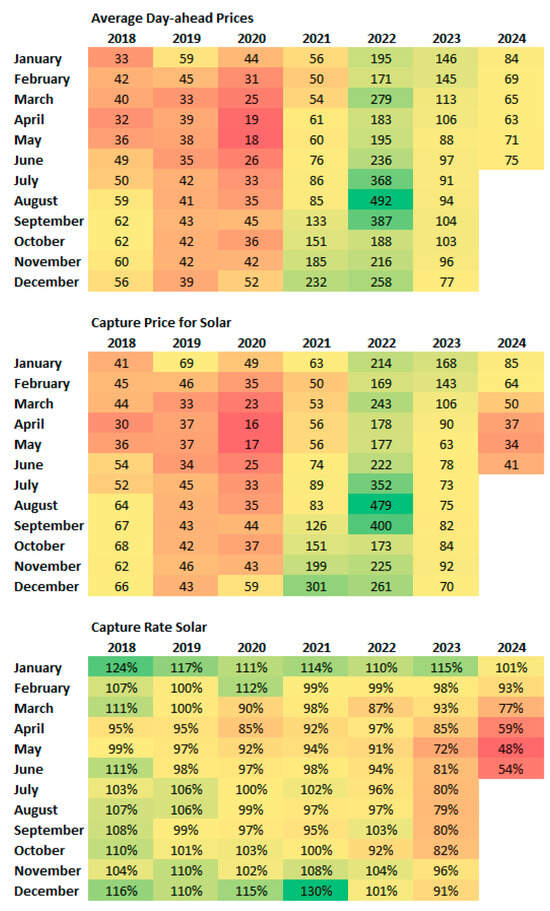
Average DAPs exhibit significant fluctuations between different months and years. In the case of the Czech Republic (Figure 4 and Table 2), prices peaked in 2022, particularly in August and September, with values reaching up to 476 EUR/MWh. In contrast, prices were significantly lower in earlier years (2018–2020), with the lowest values observed in April and May 2020 (16 EUR/MWh). The trend of DAPs from 2018 to 2024 is illustrated in Figure 5, showing that prices were highest throughout 2022 within the observed period. This price increase was noticeable as early as the end of 2021, during the months of October to December.
Figure 4.
Average DAPs, Capture Price for Solar, and Capture Rate for Solar for the Czech Republic.
Table 2.
Electricity prices in August 2022.
Figure 5.
Average DAPs for the Czech Republic.
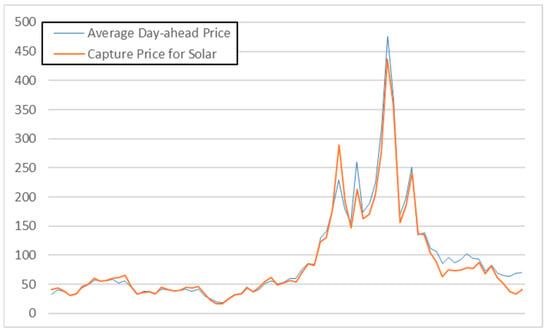
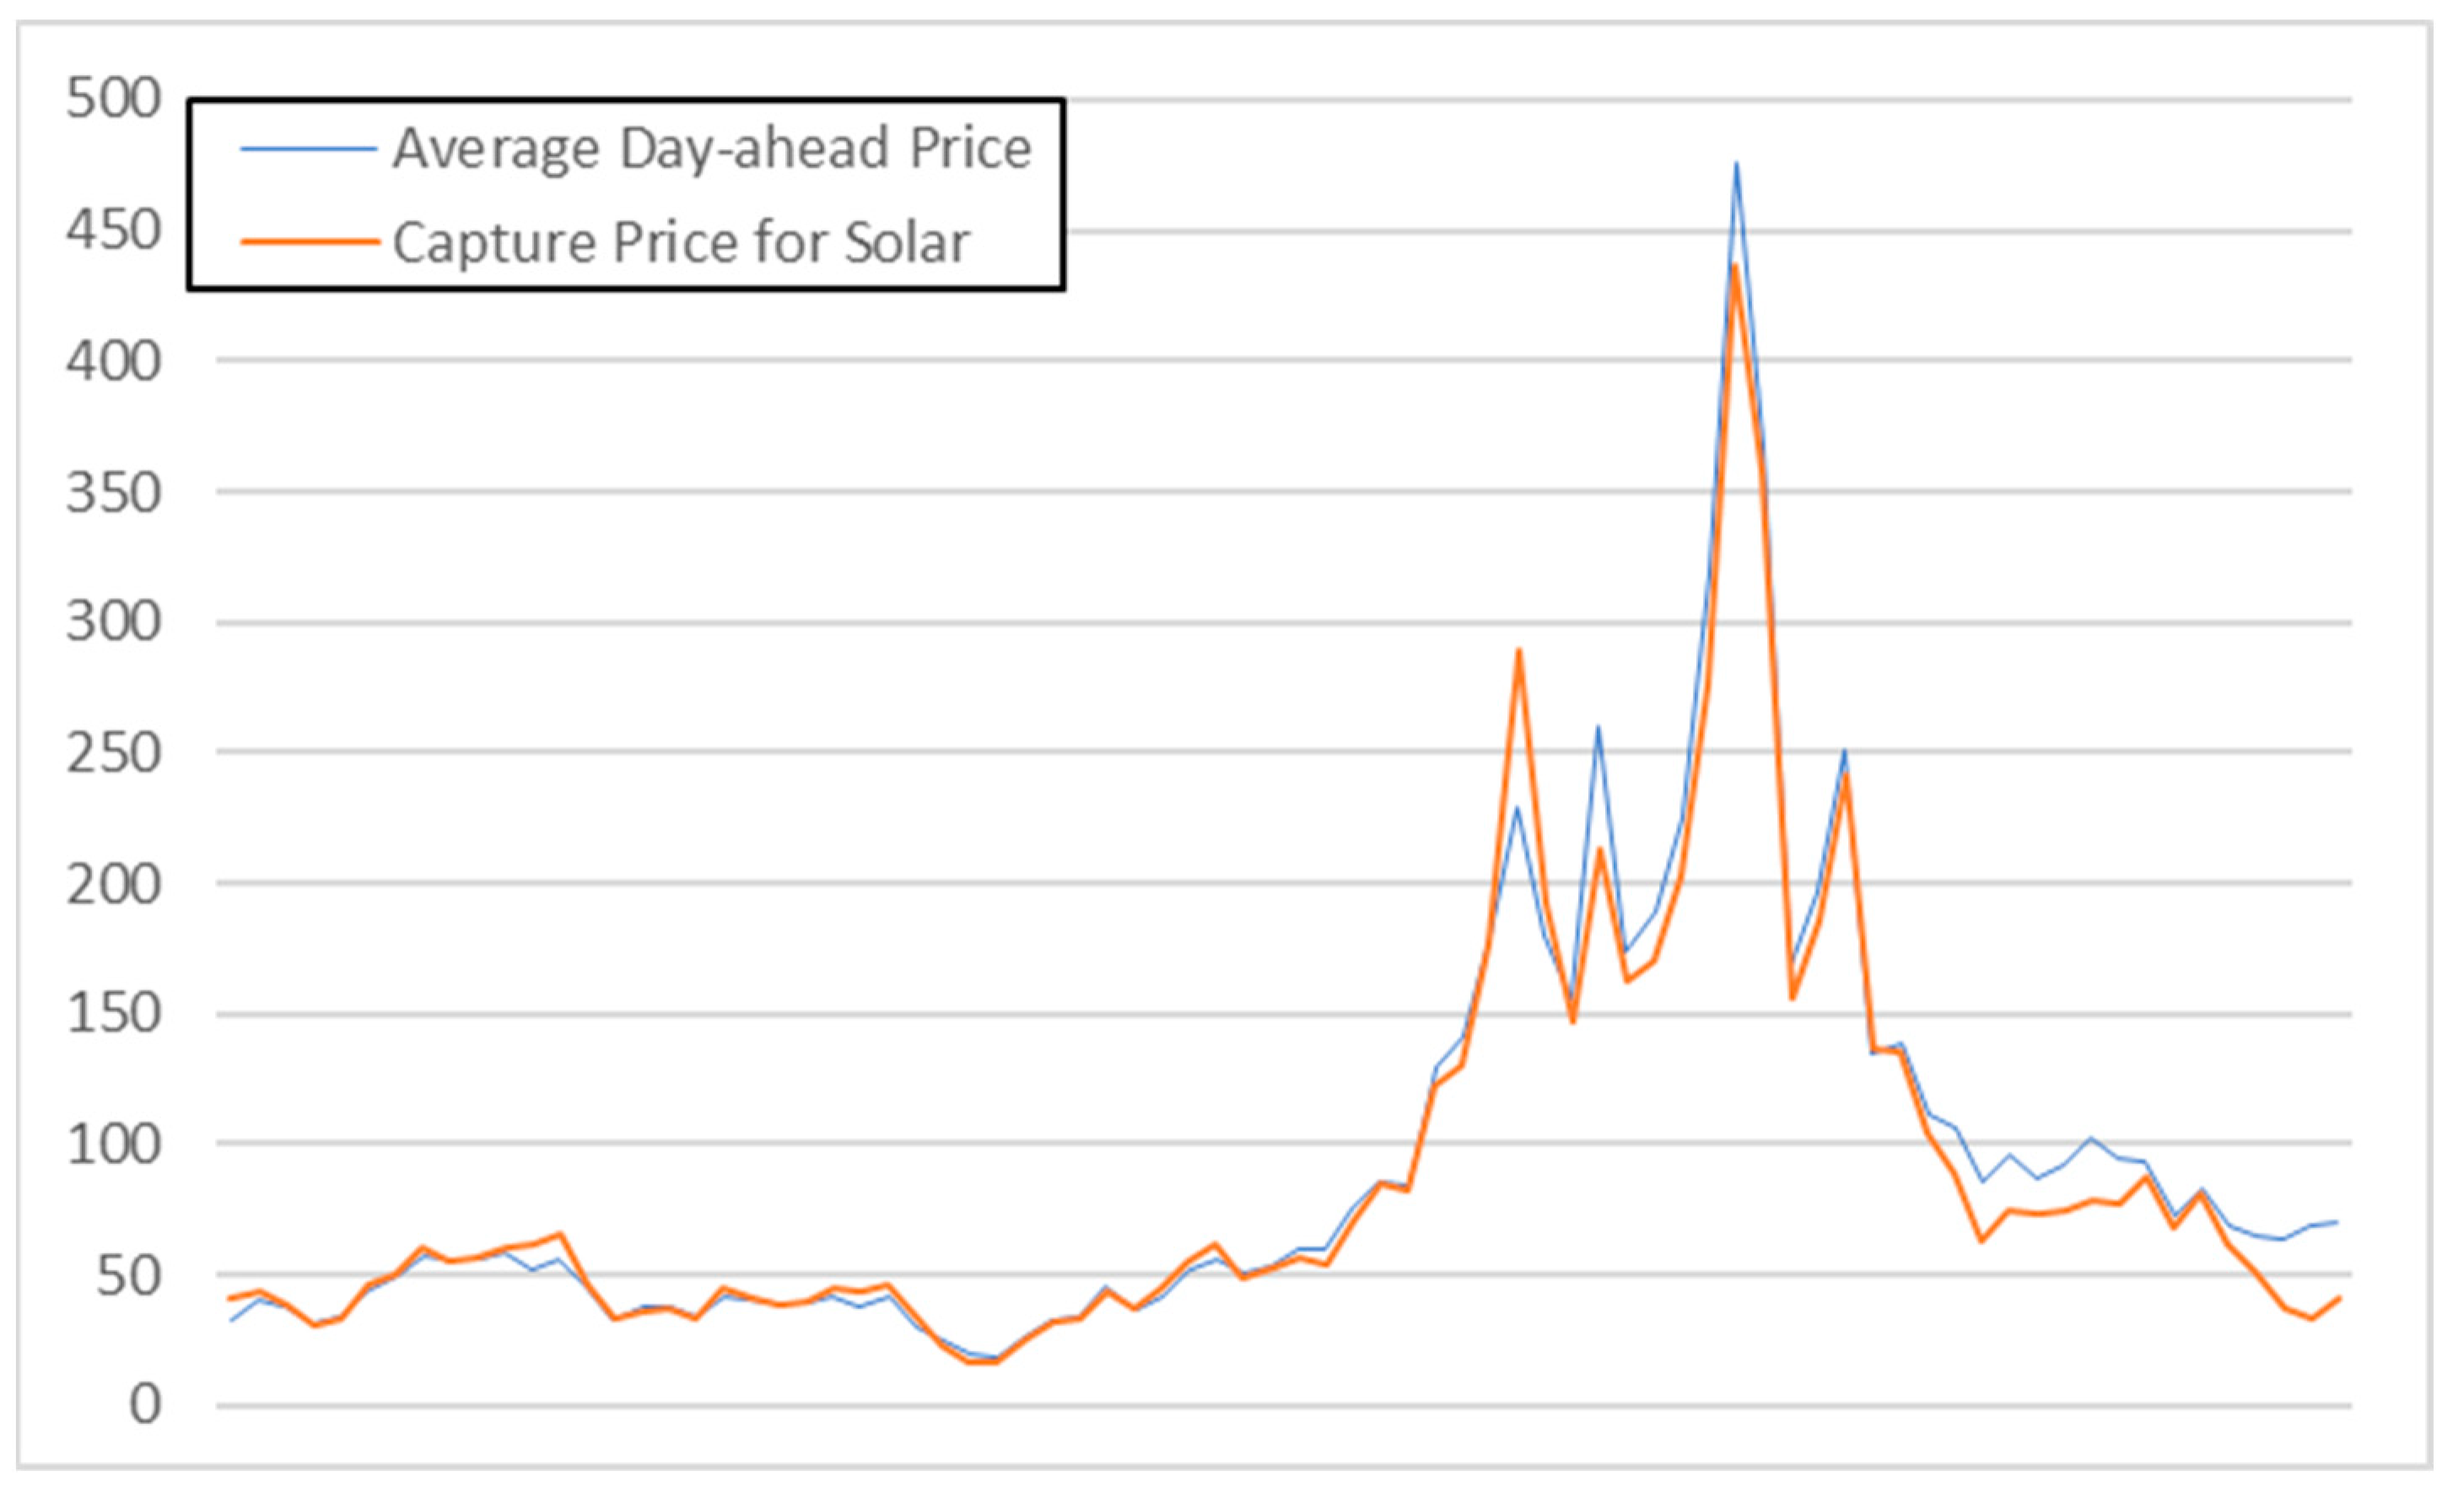
As previously mentioned, if the DAP is higher than the CPS, this indicates that PV power plants are selling electricity at a profit. The trends of DAP and CPS from 2018 to the present for the Czech Republic can be seen in Figure 6. The deviations between the curves illustrate the significant differences between the DAP and the CPS. Out of 78 values, there are 26 months where the DAP is higher than the CPS. It is important to note that this research deals with average monthly values. For daily values, the situation might be slightly different.
Figure 6.
Development of average DAP and CPS for the Czech Republic.
In the case of electricity price trends in Slovakia (Figure 7), the development is similar to that in the Czech Republic. In 2022, prices in Slovakia were highest, with a rapid increase starting around September 2021 and continuing until April 2023, during which period prices consistently remained above 100 EUR/MWh. In 2023, the months of September and October also saw prices rising above 100 EUR/MWh. The price trend in 2024 is similar to that in the Czech Republic, with prices ranging from 63 to 84 EUR/MWh.
Figure 7.
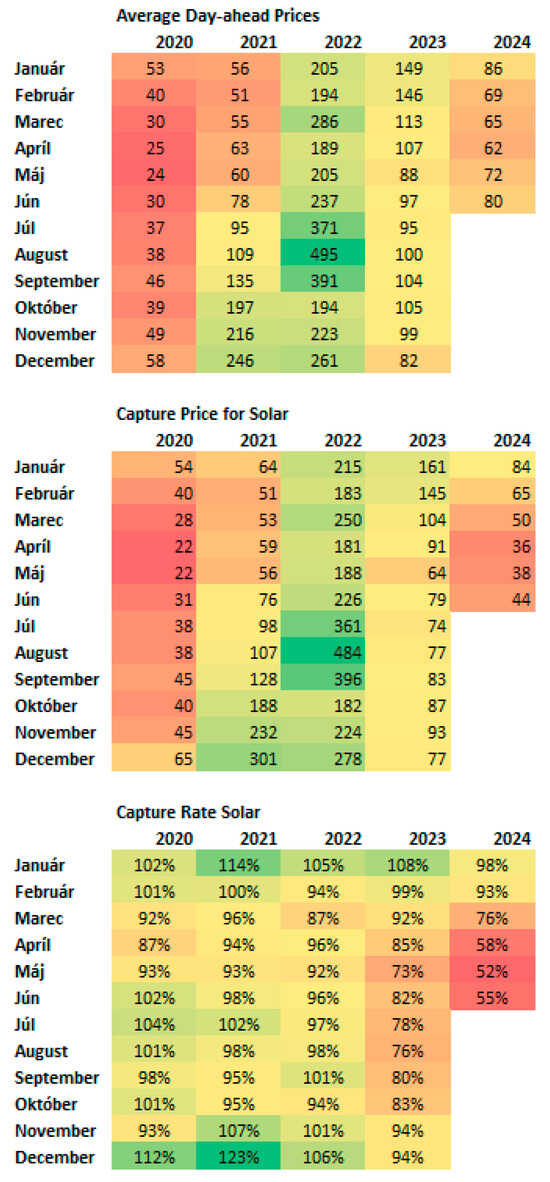
Average DAPs, Capture Price for Solar, and Capture Rate for Solar for Slovakia.
In Hungary, the situation is also similar. The highest prices were recorded in Hungary in 2022 (Figure 8). However, prices above 100 EUR/MWh were observed as early as August 2021 and lasted until October 2023 (except for May, June, and July 2023). In 2024, prices are currently ranging from 62 to 86 EUR/MWh, which is similar to the levels seen in the Czech Republic and Slovakia.
Figure 8.
Average DAPs, Capture Price for Solar, and Capture Rate for Solar for Hungary.
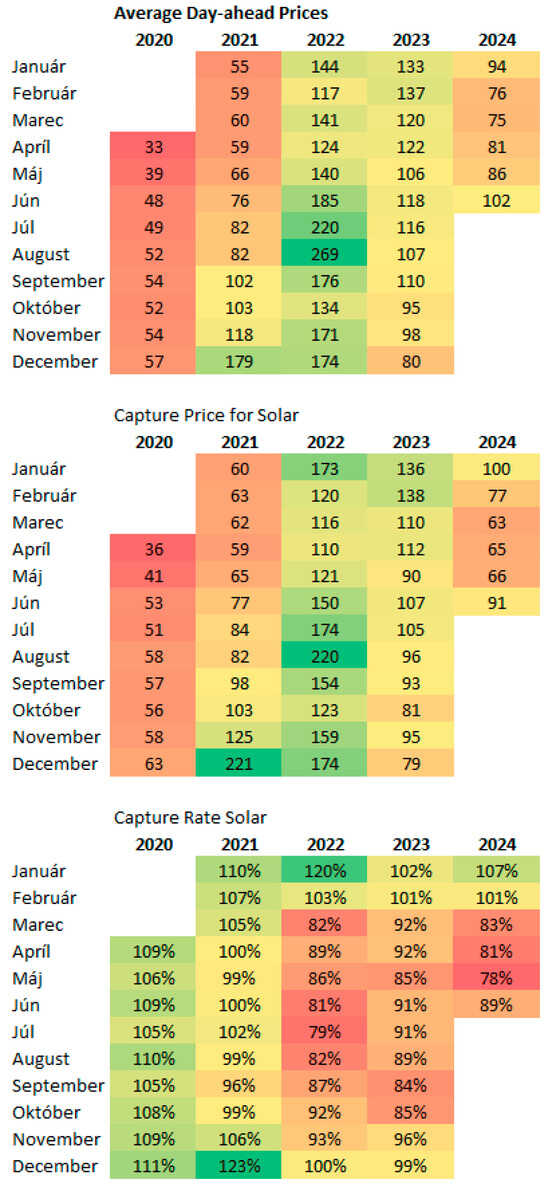
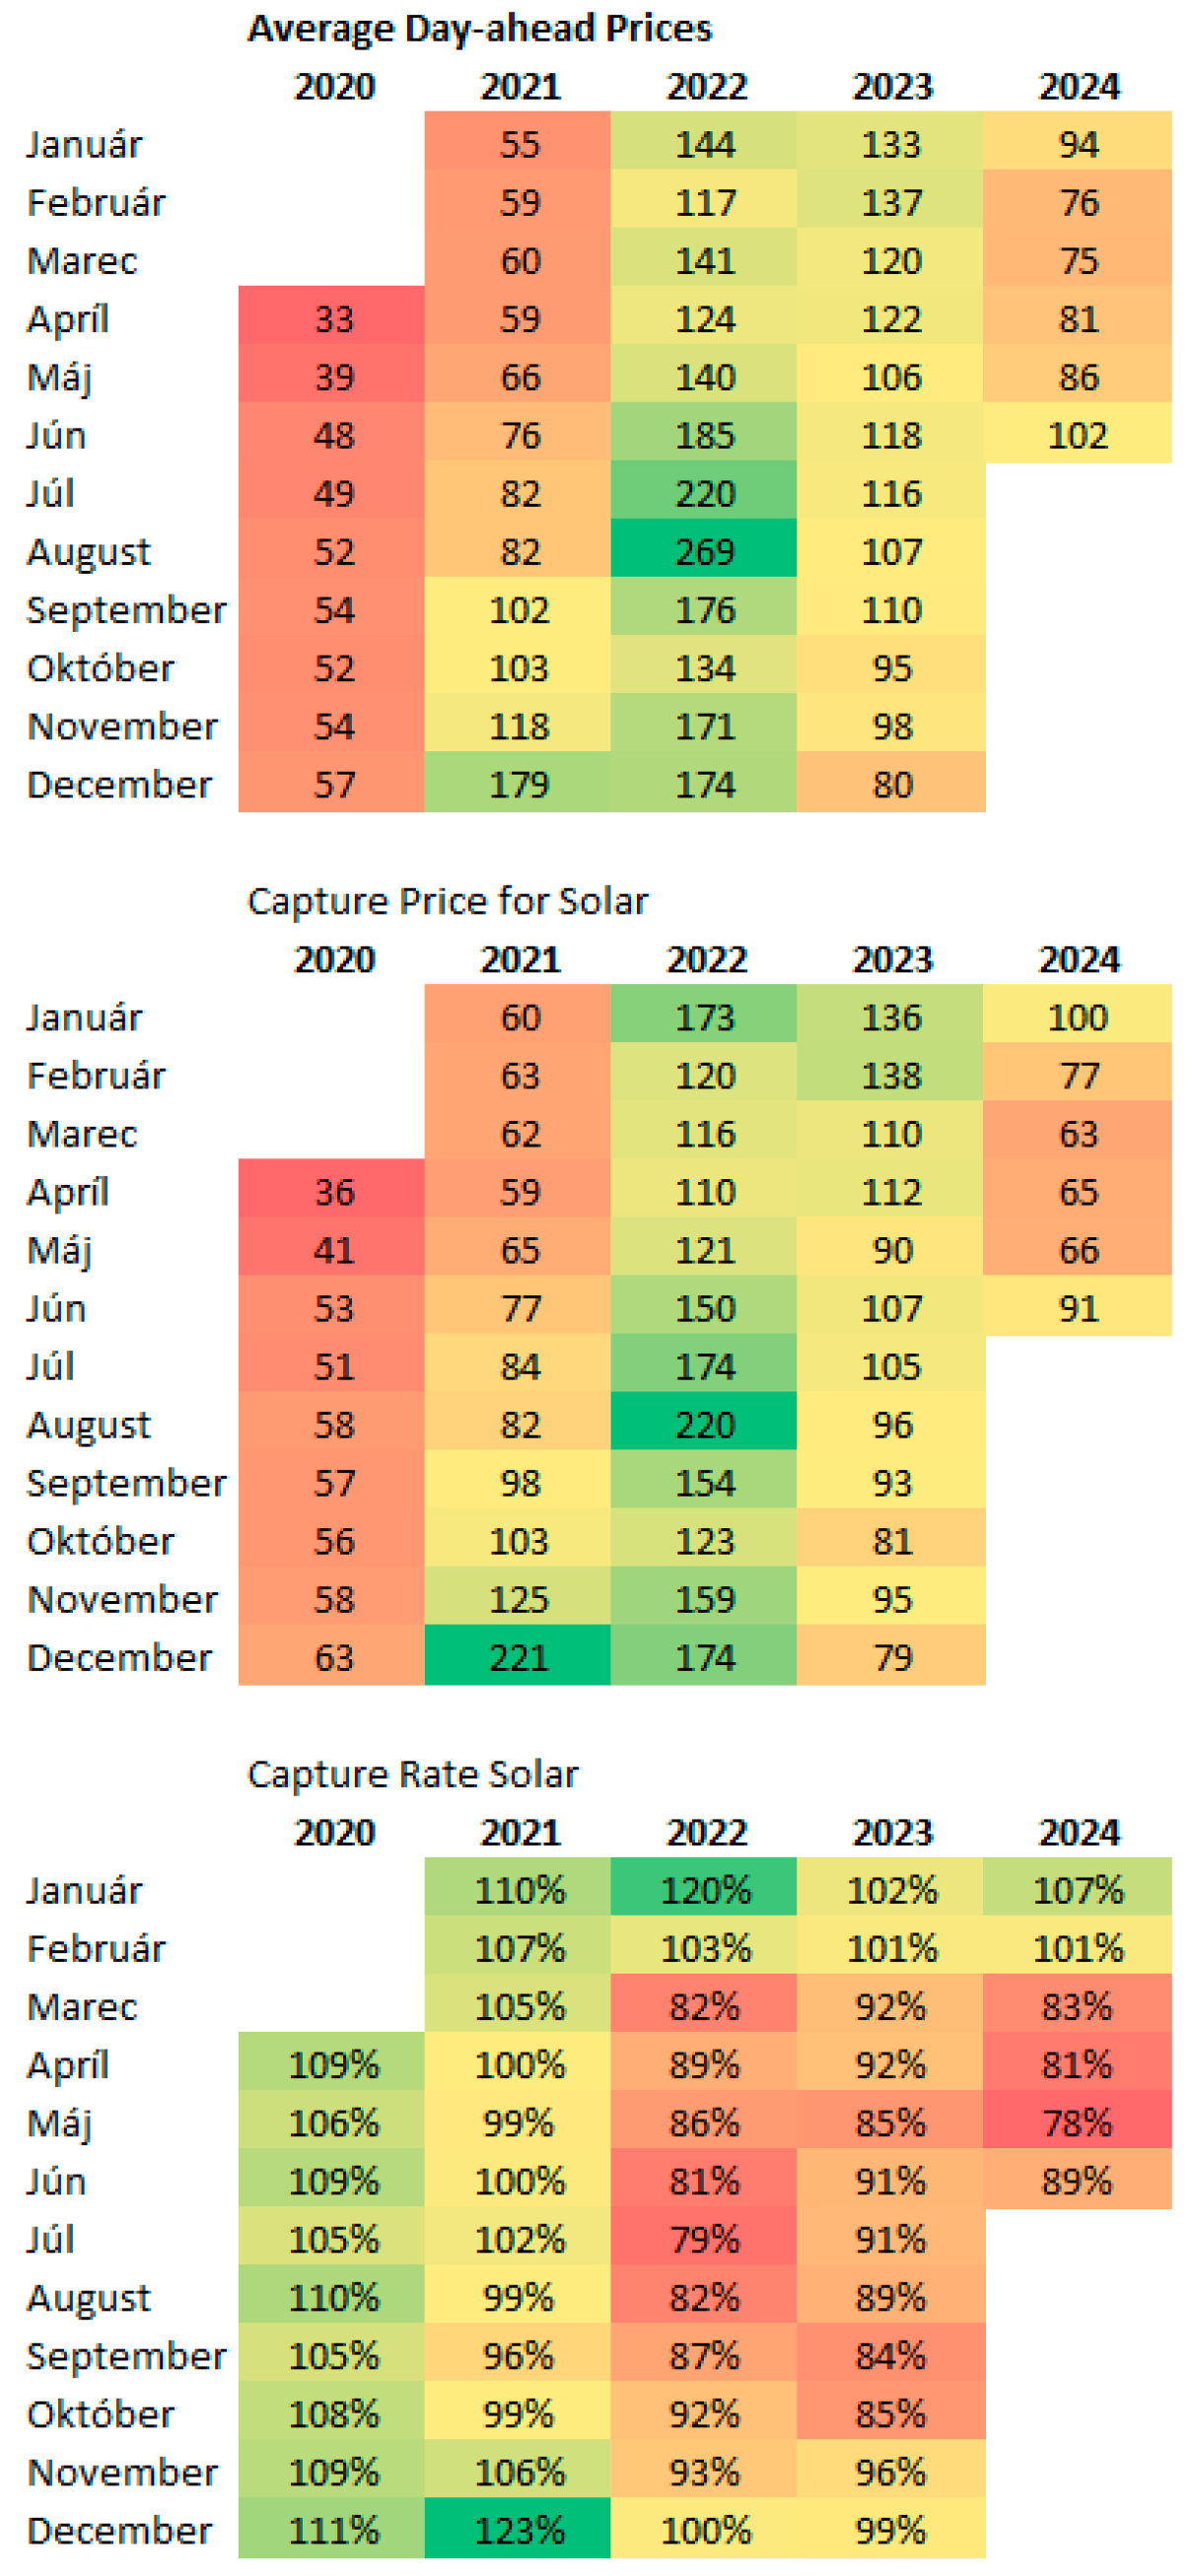
In Poland (Figure 9), the situation is slightly different than in Slovakia, the Czech Republic, and Hungary. While the highest prices in Poland were also recorded in 2022, a comparison of the maximum prices (Table 1) shows differences among the Czech Republic, Slovakia, Hungary, and Poland. In Poland, the price in August 2022 was 269 EUR/MWh, whereas in Slovakia it was 492 EUR/MWh—a difference of 223 EUR/MWh. On the other hand, in Poland, a price above 100 EUR/MWh was recorded in June. Given that these are averaged data, the price might decrease or increase by the end of the month. Currently, in 2024, prices in Poland range from 75 to 102 EUR/MWh.
Figure 9.
Average DAPs, Capture Price for Solar, and Capture Rate for Solar for Poland.
- (b) Capture Price for Solar (CPS)
CPS follows a similar trend to the average DAPs, indicating market conditions for photovoltaics. In the Czech Republic (Figure 4), the highest prices were observed in August 2022 (437 EUR/MWh), with consistently lower prices in earlier years. The lowest values were recorded in April 2020 (16 EUR/MWh). In Slovakia (Figure 7), price peaks were seen in August 2022 (479 EUR/MWh). Earlier years showed lower prices, with April 2020 having the lowest value (16 EUR/MWh). In Hungary (Figure 8), the highest price was in August 2022 (484 EUR/MWh). Earlier years reflect significantly lower prices, with April and May 2020 again showing the lowest (22 EUR/MWh). In Poland (Figure 9), prices peaked in August 2022 (220 EUR/MWh). Poland also had a high value in December 2021 (221 EUR/MWh). The values in April 2020 were the lowest (36 EUR/MWh).
- (c) Capture Rate for Solar (CRS)
The Capture Rate for Solar (CRS) determines the percentage ratio between the average price at which PV power plants sell their electricity and the average market price of electricity during a given period. In the Czech Republic (Figure 4), high values were observed in the early months of 2018–2020, with January 2018 reaching 126%. In later years, there was a recorded decline, especially in 2024 (49% in May). In Slovakia (Figure 7), high values were seen at the beginning, with December 2021 reaching 130%. A significant drop occurred in 2024, particularly in May (48%). In Hungary (Figure 8), high values were observed in December 2021, with a value of 123%, and a sharp decline was observed in 2024, particularly in May (52%). In Poland (Figure 9), similar trends were seen, with the highest value in December 2021 at 123% and the lowest value at 78% in May.
Annual trends show a clear peak in average DAPs and CPS in 2022 across all countries. This price peak was likely caused by external factors such as increased demand, geopolitical situations, and similar influences. Monthly changes in electricity prices indicate that April consistently showed the lowest values for CRS in all countries and nearly all years. This can be attributed to seasonal factors affecting solar energy production and market demand. However, this year, CRS values were the lowest since 2018 across all four countries. This trend also obtained for Hungary and Poland, for which data are available from 2020. The reduction in CRS values suggests potential issues with further development of PV systems and investment in this technology.
In Table 3, the production of electric energy from 2018 to the present is shown for the countries of the Czech, Poland, Hungary, and Slovakia in TWh. In Poland, from 2018 to the present, very few hours with negative prices were observed. Although Poland has seen an increase in the production of electric energy from renewable energy sources, it is a negligible amount from the perspective of the energy mix. In 2018, the production of electric energy from renewable energy sources accounted for 10.4%, and this percentage gradually increased in the following years: 2019 (11.8%), 2020 (13.7%), 2021 (12.2%), 2022 (14.4%), 2023 (19%), and 2024 (20.6%). Negative electricity prices began to appear in Poland in 2023, which also saw an increase in production from renewable energy sources—this represents a doubling of the share from the perspective of the energy mix. A similar situation can be observed in Hungary. In 2018, renewable energy sources accounted for 6.4% of production, and this percentage gradually increased in the following years: 2019 (7.3%), 2020 (11.9%), 2021 (14.1%), 2022 (16.3%), 2023 (19.7%), and 2024 (24.9%). Negative electricity prices also began to appear in Hungary in 2023, which saw the largest increase in the share of electric energy production from renewable sources—mainly from PV power plants.
Table 3.
Production of electricity from 2018 to 2024 in the Czech Republic, Poland, Hungary, and Slovakia.
When considering investments in PV systems, the return on investment is often calculated based on the anticipated amount of electricity generated and current prices [33,34]. However, the analysis of results indicates that the profitability of a PV power plant varies even when electricity production remains constant. The reason is simple—the electricity price fluctuates. Electricity prices change every hour, and therefore the research results in this manuscript provide a clear understanding of the economic aspects of PV sources over the years 2018 to 2024. Such an analysis could also be conducted on an hourly basis, which would further refine the determination of economic returns. If, for instance, a program like PV-Sol were used to determine the amount of PV production, it would not account for changes in electricity prices. As shown in the results, CRS values vary significantly. Comparing CRS values in all four countries in July 2023, it was 91% in Poland, 78% in Hungary, 80% in Slovakia, and 84% in the Czech Republic. The PV production may be the same in each country, yet the CRS values differ, affecting the return on investment for solar projects. For example, in Poland, the CRS varied from a low of 78% in May 2024 to a high of 123% in December 2021. However, standard return calculations do not consider these values. Therefore, the research results described in this manuscript significantly contribute to understanding and better analyzing the development of returns on investment in solar projects.
5. Discussion and Conclusions
This article discusses the development of electricity prices in the Czech Republic, Slovakia, Hungary, and Poland. Based on the price trends, research was conducted that analyzed electricity prices from 2018 to 2024.
Significant findings indicate that electricity prices peaked markedly in 2022 due to a combination of several events. These included reduced production from hydropower plants, increased energy demand, supply chain disruptions, and extreme weather conditions. These factors had a substantial impact on the DAP and CPS in countries such as the Czech Republic, Slovakia, Hungary, and Poland. The results also highlight seasonal variations, with the lowest prices and CPS values recorded in April, likely due to seasonal factors affecting solar energy production and market demand. In 2024, a significant decline in CRS was observed across all analyzed countries, which may indicate issues with integrating solar energy into the market, market saturation, or changes in market dynamics.
Based on CPS and CRS values, it is possible to deduce several important pieces of information related to the economic performance and efficiency of photovoltaic power plants:
- (a)
- Economic performance of solar power plants: From the CPS value, we can determine how profitable photovoltaic power plants are in a given time period. Higher values indicate higher revenues, while lower values indicate lower revenues.
- (b)
- Competitive position of photovoltaic energy in the market: CRS shows how competitively capable photovoltaic power plants are compared to other energy sources. High values suggest that solar power plants are able to compete and sell their energy at favorable prices.
- (c)
- Market trends and demand for renewable energy: From both values, we can deduce market trends and the demand for solar energy. For example, if both values are rising, this may indicate a growing demand for renewable energy and favorable market conditions for photovoltaic power plants.
- (d)
- Regulatory and political influences: These values can also be affected by regulatory and political measures, such as subsidies, tariffs, and climate policies, that either support or limit the development of photovoltaic energy.
Given the findings, there is a need for further research and analysis to identify the causes of the identified anomalies. Future research directions should include a more detailed study of seasonal changes in solar energy production and prices and their impact on market prices and the profitability of solar power plants. Research should also examine the impact of different political measures and regulations on electricity market prices and the economic viability of solar projects. Additionally, the effectiveness of energy storage technologies and their economic impact in the context of solar energy should be evaluated. Another crucial aspect is to develop long-term models and predictions of market prices and the profitability of solar power plants considering various geopolitical and climatic scenarios. Expanding the analysis to additional regions and countries will provide a global perspective on solar market dynamics and allow for the identification of regional differences and specifics.
The development of solar energy utilization currently depends on political decisions. The results summarized in the paper lead to the following conclusion: In the Czech Republic, from 2015 to the present, there were 25 months with a CRS value higher than 100% out of a total of 78 months. In Slovakia, there were 31 months, in Hungary 16 months, and in Poland 21 months. At first glance, it may seem that there were few months with a CRS value above 100%. However, it is important to realize that the calculation consists of two main parameters—the price of electricity and the amount of electricity produced. In Table 4, a brief comparison of two situations is shown. In the first, the production of electricity changes gradually, taking the following values: 25 MWh, 23 MWh, 20 MWh, 10 MWh, and 25 MWh. In the second situation, the production of electricity takes the following values: 20 MWh, 23 MWh, 20 MWh, 10 MWh, and 25 MWh. In these situations, despite the differences in electricity production and the price of electricity, the CRS parameter comes out the same. However, the CPS parameter is different. Therefore, it is necessary to consider both parameters and not just the CRS.
Table 4.
Comparison of two situations with different electricity production values and electricity prices.
Based on the conducted research, the next step is to investigate similar impacts of other energy sources in different countries; for example, in Germany, analysis could focus on wind energy, whereas in Slovakia it might concentrate on hydro energy or other energy sources. The research described in this paper should be applicable to any energy source. By comparing the results, the study highlights the specific impacts of various sources of electrical energy in individual countries. Consequently, it is possible to focus on the production from these energy sources when predicting electricity prices in a given country.
Author Contributions
Conceptualization, M.P.; methodology, M.B.; software, M.P.; validation, M.P. and M.B.; formal analysis, M.P. and M.B.; investigation, M.P. and F.K.; resources, M.B.; data curation, M.P. and M.B.; writing, M.P., M.B. and F.K.; visualization, M.B.; supervision, M.P.; project administration, M.P.; funding acquisition, M.P. All authors have read and agreed to the published version of the manuscript.
Funding
This work was supported by the Slovak Research and Development Agency under the contract no. APVV-19-0576 and the Ministry of Education, Science, Research and Sport of the Slovak Republic and the Slovak Academy of Sciences under the contract no. VEGA 1/0757/21.
Institutional Review Board Statement
Not applicable.
Informed Consent Statement
Not applicable.
Data Availability Statement
The data presented in this study are available on request from the corresponding author. The data in this paper are publicly unavailable due to privacy restrictions.
Acknowledgments
All support for this paper is covered by the author contribution or funding sections.
Conflicts of Interest
The authors declare no conflicts of interest. The funders had no role in the design of the study; in the collection, analyses, or interpretation of data; in the writing of the manuscript; or in the decision to publish the results.
References
- Michelet, F. The impact of the coal-gas relative price on the CO2 marginal abatement effect of renewable electricity in the US. In Proceedings of the 2022 18th International Conference on the European Energy Market (EEM), Ljubljana, Slovenia, 13–15 September 2022; pp. 1–5. [Google Scholar] [CrossRef] [Scilit]
- Rudolph, M.; Damien, P. The Impact of Renewable Energy Tax Incentives on Electricity Pricing in Texas. Appl. Sci. 2023, 13, 8532. [Google Scholar] [CrossRef] [Scilit]
- Chen, W.; Gath, B.; Kinross-Smith, E.; Toole, H.; Yusofi, E.; Hasan, K.N. Analysis of Negative Electricity Price to Identify Demand Management Opportunity for Consumers in Renewable-rich Power Systems. In Proceedings of the 2021 IEEE PES Innovative Smart Grid Technologies—Asia (ISGT Asia), Brisbane, Australia, 5–8 December 2021; pp. 1–5. [Google Scholar] [CrossRef] [Scilit]
- Shiri, A.; Afshar, M.; Rahimi-Kian, A.; Maham, B. Electricity price forecasting using Support Vector Machines by considering oil and natural gas price impacts. In Proceedings of the 2015 IEEE International Conference on Smart Energy Grid Engineering (SEGE), Oshawa, ON, Canada, 17–19 August 2015; pp. 1–5. [Google Scholar] [CrossRef] [Scilit]
- Adom, P.K.; Minlah, M.K.; Adams, S. Impact of renewable energy (hydro) on electricity prices in Ghana: A tale of the short- and long-run. Energy Strategy Rev. 2018, 20, 163–178. [Google Scholar] [CrossRef] [Scilit]
- Adom, P.K. The long-run price sensitivity dynamics of industrial and residential electricity demand: The impact of deregulating electricity prices. Energy Econ. 2017, 62, 43–60. [Google Scholar] [CrossRef] [Scilit]
- Hameed, M.A.; Kaaya, I.; Al-Jbori, M.; Matti, Q.; Scheer, R.; Gottschalg, R. Analysis and Prediction of the Performance and Reliability of PV Modules installed in harsh climates: Case study Iraq. Renew. Energy 2024, 228, 120577. [Google Scholar] [CrossRef] [Scilit]
- Lynch, C.; O’Leary, C.; Sundareshan, P.G.K.; Akin, Y. Experimental Analysis of GBM to Expand the Time Horizon of Irish Electricity Price Forecasts. Energies 2021, 14, 7587. [Google Scholar] [CrossRef] [Scilit]
- O’Leary, C.; Lynch, C.; Bain, R.; Smith, G.; Grimes, D. A Comparison of Deep Learning vs Traditional Machine Learning for Electricity Price Forecasting. In Proceedings of the 2021 4th International Conference on Information and Computer Technologies (ICICT), Kahului, HI, USA, 11–14 March 2021; pp. 6–12. [Google Scholar] [CrossRef] [Scilit]
- Croonenbroeck, C.; Hüttel, S. Quantifying the economic efficiency impact of inaccurate renewable energy price forecasts. Energy 2017, 134, 767–774. [Google Scholar] [CrossRef] [Scilit]
- Lucas, A.; Pegios, K.; Kotsakis, E.; Clarke, D. Price Forecasting for the Balancing Energy Market Using Machine-Learning Regression. Energies 2020, 13, 5420. [Google Scholar] [CrossRef] [Scilit]
- Aggarwal, S.K.; Saini, L.M.; Kumar, A. Electricity price forecasting in deregulated markets: A review and evaluation. Int. J. Electr. Power Energy Syst. 2009, 31, 13–22. [Google Scholar] [CrossRef] [Scilit]
- Akash, S. Optimized Fractional Overhead Power Term Polynomial Grey Model (OFOPGM) for market clearing price prediction. Electr. Power Syst. Res. 2023, 214, 108800. [Google Scholar] [CrossRef] [Scilit]
- Wang, Y.; Liu, C. A New Fractional-Order Grey Prediction Model without a Parameter Estimation Process. Fractal Fract. 2024. [Google Scholar] [CrossRef] [Scilit]
- Duan, H.; Liu, Y.; Wang, G. A novel dynamic time-delay grey model of energy prices and its application in crude oil price forecasting. Energy 2022, 251, 123968. [Google Scholar] [CrossRef] [Scilit]
- Moon, J. A Multi-Step-Ahead Photovoltaic Power Forecasting Approach Using One-Dimensional Convolutional Neural Networks and Transformer. Electronics 2024, 13, 2007. [Google Scholar] [CrossRef] [Scilit]
- Mohammad Reza, M.; Hossein, A.; Akram, M. Wholesale electricity price forecasting by Quantile Regression and Kalman Filter method. Energy 2024, 290, 129925. [Google Scholar] [CrossRef] [Scilit]
- Nitin, S.; Mohanty, S.R.; Rishabh, D.S. Short term electricity price forecast based on environmentally adapted generalized neuron. Energy 2017, 125, 127–139. [Google Scholar] [CrossRef] [Scilit]
- De Marcos, R.A.; Bello, A.; Reneses, J. Short-Term Electricity Price Forecasting with a Composite Fundamental-Econometric Hybrid Methodology. Energies 2019, 12, 1067. [Google Scholar] [CrossRef] [Scilit]
- Solar Photovoltaic Capacity. Available online: https://ourworldindata.org/grapher/solar-pv-cumulative-capacity?time=earliest.2002 (accessed on 19 July 2024).
- Jomaux, J. The Rise of Vertical Solar. Available online: https://gemenergyanalytics.substack.com/p/the-rise-of-vertical-solar (accessed on 19 July 2024).
- Capros, P.; Zampara, M.; Tasios, N.; Papadopoulos, D.; Kost, C.; Hartmann, N.; Senkpiel, C.; Schlegl, T. Model based analysis of the EU power system based on RES—A case study for Greece and Germany. In Proceedings of the 2015 12th International Conference on the European Energy Market (EEM), Lisbon, Portugal, 19–22 May 2015; pp. 1–5. [Google Scholar] [CrossRef] [Scilit]
- Pavlík, M.; Beňa, L.; Medved’, D.; Čonka, Z.; Kolcun, M. Analysis and Evaluation of Photovoltaic Cell Defects and Their Impact on Electricity Generation. Energies 2023, 16, 2576. [Google Scholar] [CrossRef] [Scilit]
- Zhang, K.; Zhou, B.; Chung, C.Y.; Bu, S.; Wang, Q.; Voropai, N. A Coordinated Multi-Energy Trading Framework for Strategic Hydrogen Provider in Electricity and Hydrogen Markets. IEEE Trans. Smart Grid 2023, 14, 1403–1417. [Google Scholar] [CrossRef] [Scilit]
- Nguyen, T.T.; Nguyen, H.D.; Duong, M.Q. Optimal Power Flow Solutions for Power System Considering Electric Market and Renewable Energy. Appl. Sci. 2023, 13, 3330. [Google Scholar] [CrossRef] [Scilit]
- Kuterbekov, K.A.; Kabyshev, A.M.; Bekmyrza, K.Z.; Kubenova, M.M.; Ayalew, A.T. How can solar panels collectors enhance energy efficiency? Utilization of the novel optimization techniques. Int. J. Low-Carbon Technol. 2024, 19, 1049–1059. [Google Scholar] [CrossRef] [Scilit]
- AL-Zoubi, O.H.; Al-Tahaineh, H.; Damseh, R.H.; AL-Zubi, A.H.; Odat, A.-S.H.; Shboul, B. Evaluating the real-world performance of vertically installed bifacial photovoltaic panels in residential settings: Empirical findings and implications. Int. J. Low-Carbon Technol. 2024, 19, 386–442. [Google Scholar] [CrossRef] [Scilit]
- Traber, T.; Hegner, F.S.; Fell, H.-J. An Economically Viable 100% Renewable Energy System for All Energy Sectors of Germany in 2030. Energies 2021, 14, 5230. [Google Scholar] [CrossRef] [Scilit]
- Andriopoulos, N.; Plakas, K.; Mountzouris, C.; Gialelis, J.; Birbas, A.; Karatzas, S. Papalexopoulos. Local Energy Market-Consumer Digital Twin Coordination for Optimal Energy Price Discovery under Thermal Comfort Constraints. Appl. Sci. 2023, 13, 1798. [Google Scholar] [CrossRef] [Scilit]
- Chen, T.; Pourbabak, H.; Su, W. Electricity market reform. In The Energy Internet; Elsevier: Amsterdam, The Netherlands, 2019; pp. 97–121. [Google Scholar]
- Qingyang, J.; Jichun, Y.; Yanying, Z.; Huide, F. Energy and exergy analyses of PV, solar thermal and photovoltaic/thermal systems: A comparison study. Int. J. Low-Carbon Technol. 2021, 16, 604–611. [Google Scholar] [CrossRef] [Scilit]
- Simpson, J.; Loth, E.; Dykes, K. Cost of Valued Energy for design of renewable energy systems. Renew. Energy 2020, 153, 290–300. [Google Scholar] [CrossRef] [Scilit]
- Wiser, R.; Jenni, K.; Seel, J.; Baker, E.; Hand, M.; Lantz, E.; Smith, A. Forecasting Wind Energy Costs and Cost Drivers: The Views of the World’s Leading Experts. 2016. Available online: https://eta-publications.lbl.gov/sites/default/files/lbnl-1005717.pdf (accessed on 19 July 2024).
- Myhr, A.; Bjerkseter, C.; Ågotnes, A.; Nygaard, T.A. Levelised cost of energy for offshore floating wind turbines in a life cycle perspective. Renew. Energy 2014, 66, 714–728. [Google Scholar] [CrossRef] [Scilit]

Disclaimer/Publisher’s Note: The statements, opinions and data contained in all publications are solely those of the individual author(s) and contributor(s) and not of MDPI and/or the editor(s). MDPI and/or the editor(s) disclaim responsibility for any injury to people or property resulting from any ideas, methods, instructions or products referred to in the content. |
© 2024 by the authors. Licensee MDPI, Basel, Switzerland. This article is an open access article distributed under the terms and conditions of the Creative Commons Attribution (CC BY) license (https://creativecommons.org/licenses/by/4.0/).