


Abstract
The development of artificial intelligence technology has made it possible to realize automatic evaluation systems for singing, and relevant research has been able to achieve accurate evaluations with respect to pitch and rhythm, but research on singing-voice timbre evaluation has remained at the level of theoretical analysis. Timbre is closely related to expression performance, breath control, emotional rendering, and other aspects of singing skills, and it has a crucial impact on the evaluation of song interpretation. The purpose of this research is to investigate the automatic evaluation method of singing-voice timbre. At the present stage, timbre research generally has problems such as a paucity of datasets, a single evaluation index, easy overfitting or a model’s failure to converge. Compared with the singing voice, the research on musical instruments is more mature, with more available data and richer evaluation dimensions. We constructed a deep network based on the CRNN model to perform timbre evaluation, and the test results showed that cross-media learning of timbre evaluation is feasible, which also indicates that humans have a consistent timbre perception with respect to musical instruments and vocals.
1. Introduction
Singing is one of the most common forms of artistic performance that can be achieved by vibrations of the vocal cords, without the use of any external apparatus. This artistic expression is internalized in various aspects, such as melody, pitch, rhythm, and timbre, and it can be said that singing evaluation is a complex multidimensional task.
In the context of the quantitative evaluation and analysis of singing by human experts, which is often expensive and is low in terms of the availability of resources, tools for automatic evaluation of singing are of great use. Professional singers can pursue higher levels of progress based on feedback, singing enthusiasts can aid their daily learning to help progress based on feedback evaluations, and in the education industry, these tools can be used in aiding teaching.
Singing analysis, as a complex task, consists of various small tasks. Currently, well-developed systems contain automatic evaluation systems for pitch, articulation, and other dimensions. Some evaluation tasks have clear definitions and objective indicators, such as pitch, that are easier to quantify and analyze. Meanwhile, for timbre and other abstract and subjective evaluation dimensions, it is more difficult to quantify, and an automatic evaluation system is not easy to achieve.
In 2008, Chuan Cao et al. [1] concluded from their experiments that among many musical criteria, the first is pitch accuracy, the second is rhythmic consistency, and the third is tonal brightness, ranked according to their importance. Singing timbre is not only a person’s own voice but includes the person’s singing style and breath control, and singing timbre has a crucial influence on whether a song is performed properly. Therefore, the research of timbre evaluation is important for improving singing evaluations.
Timbre is a misleadingly, simple, and vague word encompassing a very complex set of auditory attributes, in addition to a plethora of psychological and musical issues [2]. There are numerous versions of the definition of timbre in the currently available literature. Timbre is the attribute of auditory sensation with respect to which a listener can judge two sounds that are similarly presented and possessing the same loudness and pitch as dissimilar [3]. This definition by the Acoustical Society of America is also an intuitive idea when one sees the term timbre, and it clarifies that timbre is strongly distinctive and highly recognizable; however, it is an oversimplified description of timbre. The definition of timbre in the Columbia Encyclopedia is as follows: Sound Quality is determined by the overtones, the distinctive timbre of any instrument being the result of the number and relative prominence of the overtones it produces. This definition more clearly shows what timbre specifically is, but with some errors. Timbre is not only related to frequency in the frequency domain, but it is also related to the amplitude envelope in the temporal direction, and different envelope curves can affect the audience’s perception; for example, piano timbre is difficult to identify when played backward. Although the literary formulation is controversial, the point of consensus is that timbre is influenced by different frequencies that make up the sound, and the quality of timbre is mainly determined by overtones.
Although overtones are clearly documented with numerical values and distribution statistics on spectrograms, representing them in a uniform and orderly sequence, similarly to pitch, is difficult. It is also difficult to describe timbre in terms of a single dimension, as multiple words are often used with respect to different dimensions. For example, a trumpet has a bright and sharp timbre, while a cello has a thick and low timbre. Timbre as a multidimensional musical attribute has many evaluation terms, such as rich and barren, cold and warm, sharp and staccato, etc. Breaking down the timbre into smaller dimensions and finally aggregating the overall score makes the task of evaluation timbre significantly less difficult, and this is the method used in this research study.
In recent years, the rapid development of neural networks has led to further research on more abstract musical dimensions. Despite the increasing number of tasks in timbre, such as instrument timbre synthesis and timbre space modeling, there are still few tasks related to timbre evaluation, and even fewer tasks related to singing timbre evaluation. On the one hand, the automatic evaluation of vocal timbres is inherently difficult. On the other hand, available databases are limited. The publicly available databases in music analysis fields often have a clear scope of applicability with respect to the task, such as the Million Song Database (MSD) [4], which contains a variety of features such as pitch, loudness, musical genre, musician genre, etc., that are suitable for music information retrieval tasks; MUSDB18 [5]—a database for the design of source separation algorithms and evaluation reference database; EMOPIA database [6]—mainly used for research on music mood analysis, emotion classification, etc. Most datasets have files from instrument recordings, among which pianos are the most common. Singing-voice-type datasets number a few and few are related to timbre analyses.
There is one dataset, CCMusic database [7], that is suitable for multiple types of music information retrieval tasks, and it contains various types of feature annotations, among which the singing dry-voice evaluation database contains singing-voice timbre scores, which meets the requirements of this experimental task. However, this dataset has problems such as a small volume and single dimension with respect to timbre evaluation, which makes direct machine learning more difficult for the complex task of automatic timbre evaluation. Another dataset in the database, Chinese Traditional Instrument Sound database, has a larger volume of data and includes more diverse evaluation dimensions with respect to timbre. Thus, the experiment was based on both of them using transfer learning to study the automatic evaluation of singing-voice timbre.
This research explores the association between instrument timbre and singing-voice timbre from the perspective of experimental analysis, and we hope to provide research inspiration for future timbre studies and related auditory-type tasks.
The purpose of this research is to develop an evaluation system for singing-voice timbre, which is a new direction of research in timbre. Currently, no research work related to singing-voice timbre evaluation has been conducted, and there are many problems such as a small collective amount of data and single evaluation index. This research constructed a deep learning network for transfer learning with respect to timbre evaluation with cross-entropy used as the evaluation metric, and the average loss cross-entropy predicted by the trained network was 1.013, with a high overlap between the predicted score regions and true score regions. Since there is no previous work for comparison, we designed a contrast model to prove the experiment’s conclusions. Our research differs from previous work in terms of model structure, loss function, and evaluation metrics.
The remainder of the research is organized as follows. Section 2 discusses the related work. Section 3 describes the materials and methods used in this experiment. Section 4 explains the transfer learning model and describes the contrast model used to validate the experimental conclusions. Section 5 reports the results of the experiments. Section 6 provides a discussion of the results of our work.
2. Related Work
2.1. Research on Timbre Analysis
In 2017, Jordi Pons et al. [8] investigated the timbre feature extraction approach based on CNN filter designs and conducted experiments on different tasks related to timbre (singing phoneme classification, instrument recognition, and music auto-tagging) in three datasets. The experimental results reveal that the filter’s shape has an important impact on timbre feature extraction. Different filter shapes have different perceptual fields and different focuses during convolution, which play an important role in defining the convolution kernel size of the network. We designed a convolution kernel size by referring to this result. In 2019, Jiang wei et al. [9] analyzed and modeled the timbre perception features of musical sounds. A timbral material library containing 74 samples was constructed, and an objective acoustic parameter set containing 76 parameters was constructed. Then, for each timbre evaluation term, subjective evaluation experiments were conducted using a continuous category approach to obtain the experimental data of timbre’s perceptual features. Finally, a mathematical model of timbre perception was established by support vector regression. In 2020, Yiliang Jiang et al. [10] published a paper on timbre analysis of ethnic musical instruments, “Timbre analysis of ethnic musical instruments based on objective features”, in which experiments further divided 16 timbre descriptors into four timbre categories. Then, a classification model for the timbre of ethnic musical instruments was constructed based on the premise that instruments of the same type have similar timbre, and the support vector machine model worked best among several tested models. The database used in their experiments is also the CCMusic database. Their experiment comprises a musical instrument classification task, focusing on the modeling of timbre-feature descriptors. This research is a regression analysis task that focuses on the analysis of the timbre itself. Considering that a direct comparison was not appropriate, we redesigned regression experiments for timbre analysis with reference to the classical model they used to compare with the method of transfer learning. In 2020, Etienne Thoret [11] published a paper on the study of brightness perception of musical instrument sounds, in which brightness perception was related to timbre differences and vibration source categories. The experiment’s results showed that brightness perception was mainly caused by acoustics rather than being related to vibration sources. This gives us an inspiration—if different musical instruments can produce similar timbre auditory effects, perhaps it is more reliable to establish timbre evaluation standards from an acoustic perspective.
2.2. Research on Automatic Evaluation System for Singing Voice
De Poli [12] proposed a modeling and methodology for musical song performance in 2004. The model was built based on rules. Due to the technical conditions at that time, they did not use deep learning, so the experiment had great limitations from today’s perspective. In 2008, Chuan Cao et al. [1] published a paper on “Research on Evaluation Criteria for Singing Performance of Untrained Singers”, using SVM regression method to find out the importance of the evaluation criteria and utilized Spearman’s rank correlation coefficient (SRCC) as an evaluation index. They concluded that it is meaningless to study the absolute scores of singing evaluations, and research should focus on vectorial consistency. The evaluation criteria derived from the experiments introduce possible research directions for future prospects, among which is the mention of timbre brightness as the third most important of the evaluation criteria.
Most evaluation systems for singing voices are related to pitch and rhythm. For example, in 2017, Chitralekha Gupta [13] proposed various perceptually relevant features to evaluate singing quality based on the concept of the PESQ (perceptual evaluation of speech quality) rating index. They adopt the audio quality perception theory in singing quality assessments by giving high weightage to localised distortions, and they termed the novel score as the Perceptual Evaluation of Singing Quality (PESnQ) score. Moreover, the correlation between the predicted PESnQ scores of the final designed system and human ratings was 0.59. In the experiments, the distance between singing timbres (called the sub-tone range) was calculated by computing the DTW distance between MFCC vectors. There are some examples of application aspects of timbre analysis. Juheon Lee et al. [14] proposed a multi-singer singing synthesis system, which can independently select singers’ timbres and singing styles for modeling and synthesizing the target song.
Current timbre analysis revolves around modeling and classification, although there have been discussions about scoring criteria, none of them have actually constructed a scoring model. There is still a gap in timbre scoring, which is an important aspect of timbre analysis. This research conducted a preliminary exploration in this regard.
3. Materials and Data Preprocessing
The dataset of our experiment was obtained from the Chinese Traditional Instrument Sound Database (CTIS) and Singing Dry Voice evaluation database in the CCMusic database [7].
3.1. Chinese Traditional Instrument Sound Database
This experiment used a subjective evaluation database of ethnic instruments in the CCMusic database. The database contains 78 samples of ethnic instruments, including string, percussion, and wind instruments. Each instrument contains multi-scale play fragments and several complete renditions, with a sampling rate of 44,100 hz and a sampling bit depth of 16 bits. The dataset selected 16 timbre evaluation terms from 329 timbre evaluation terms, which were described as slim, bright, dim, sharp, thick, thin, solid, clear, dry, plump, rough, pure, hoarse, harmonize, soft, and turbid. The dataset was scored by 14 judges with professional music backgrounds, with a score range of 0–10. Table 1 shows the statistical information of the database.
Table 1.
Statistical information on the Chinese Traditional Instrument Sound Database.
3.2. Singing Dry Voice Evaluation Database
The Singing Dry Voice evaluation Database is a sub-database of the multifunctional music database used for MIR research in the CCMusic database, containing 6 classic Mandarin songs covered by 22 singers. Each cover contains one main song and one sub-song. Four professional judges evaluated and scored the songs on nine aspects, including pitch, rhythm, breath control, and overall performance, etc. This research only used timbre score.
3.3. Data Preprocessing
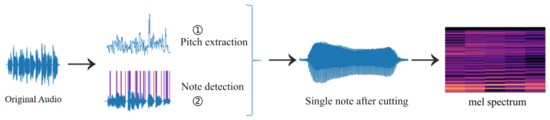
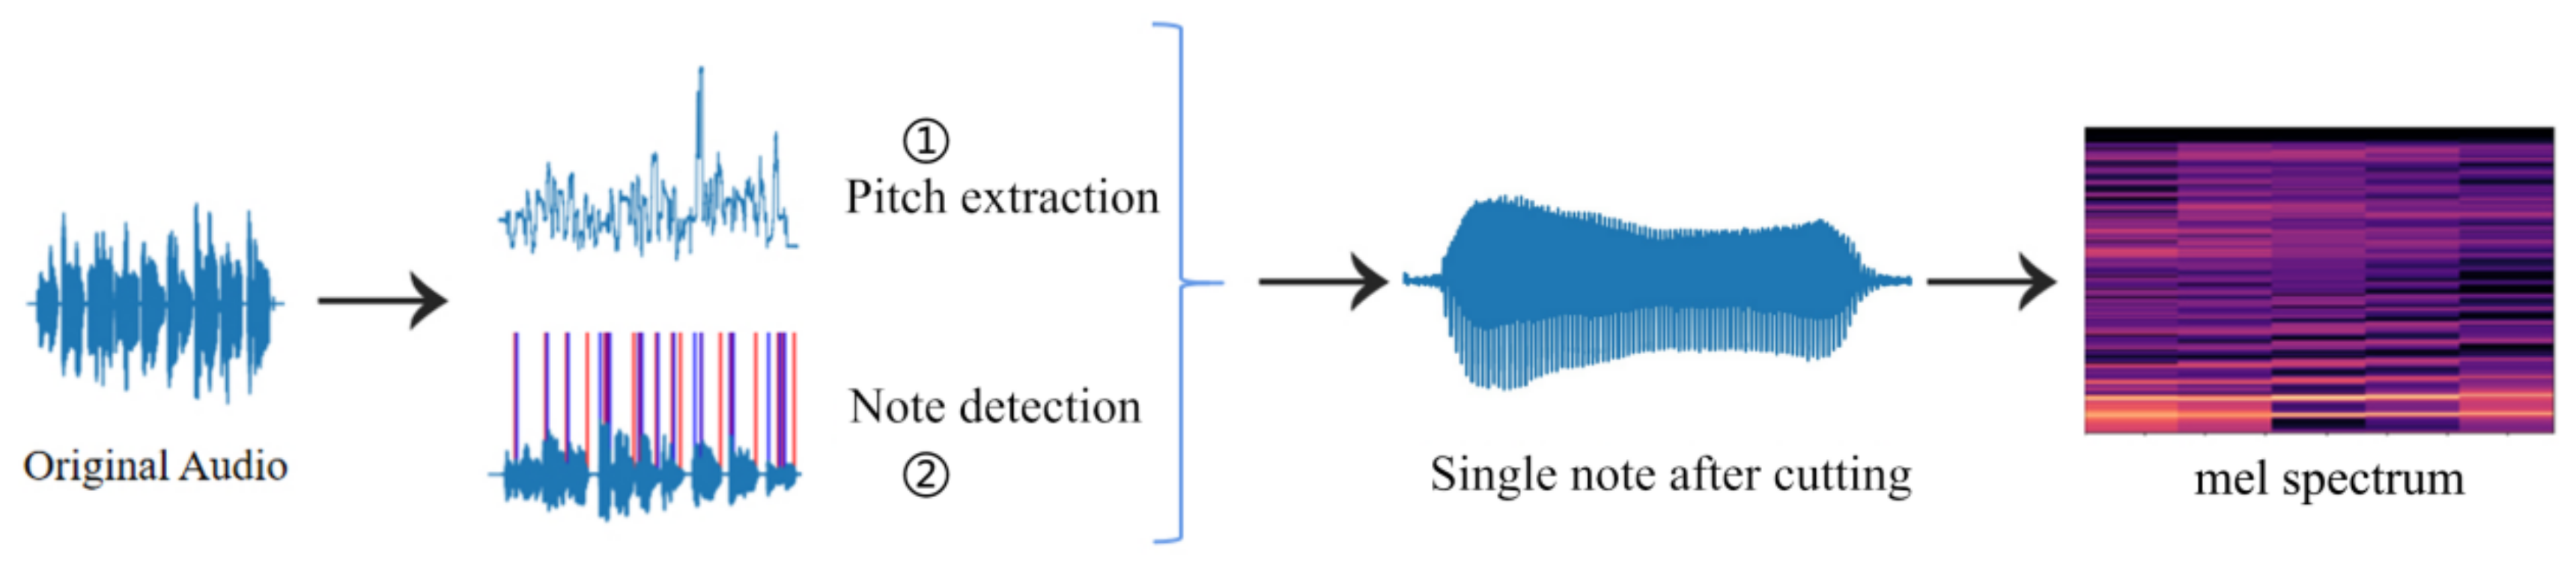
This section describes the data processing used for the experiments. The methodology is shown in Figure 1. After two steps of pitch extraction and note detection, each single note of the audio is obtained. Then, short-time Fourier transforms are performed on these note segments to obtain the mel spectrum.
Figure 1.
Methodology of data preprocessing.
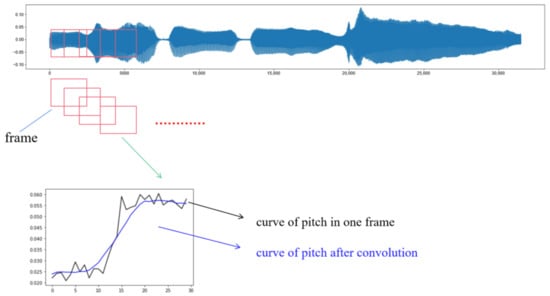
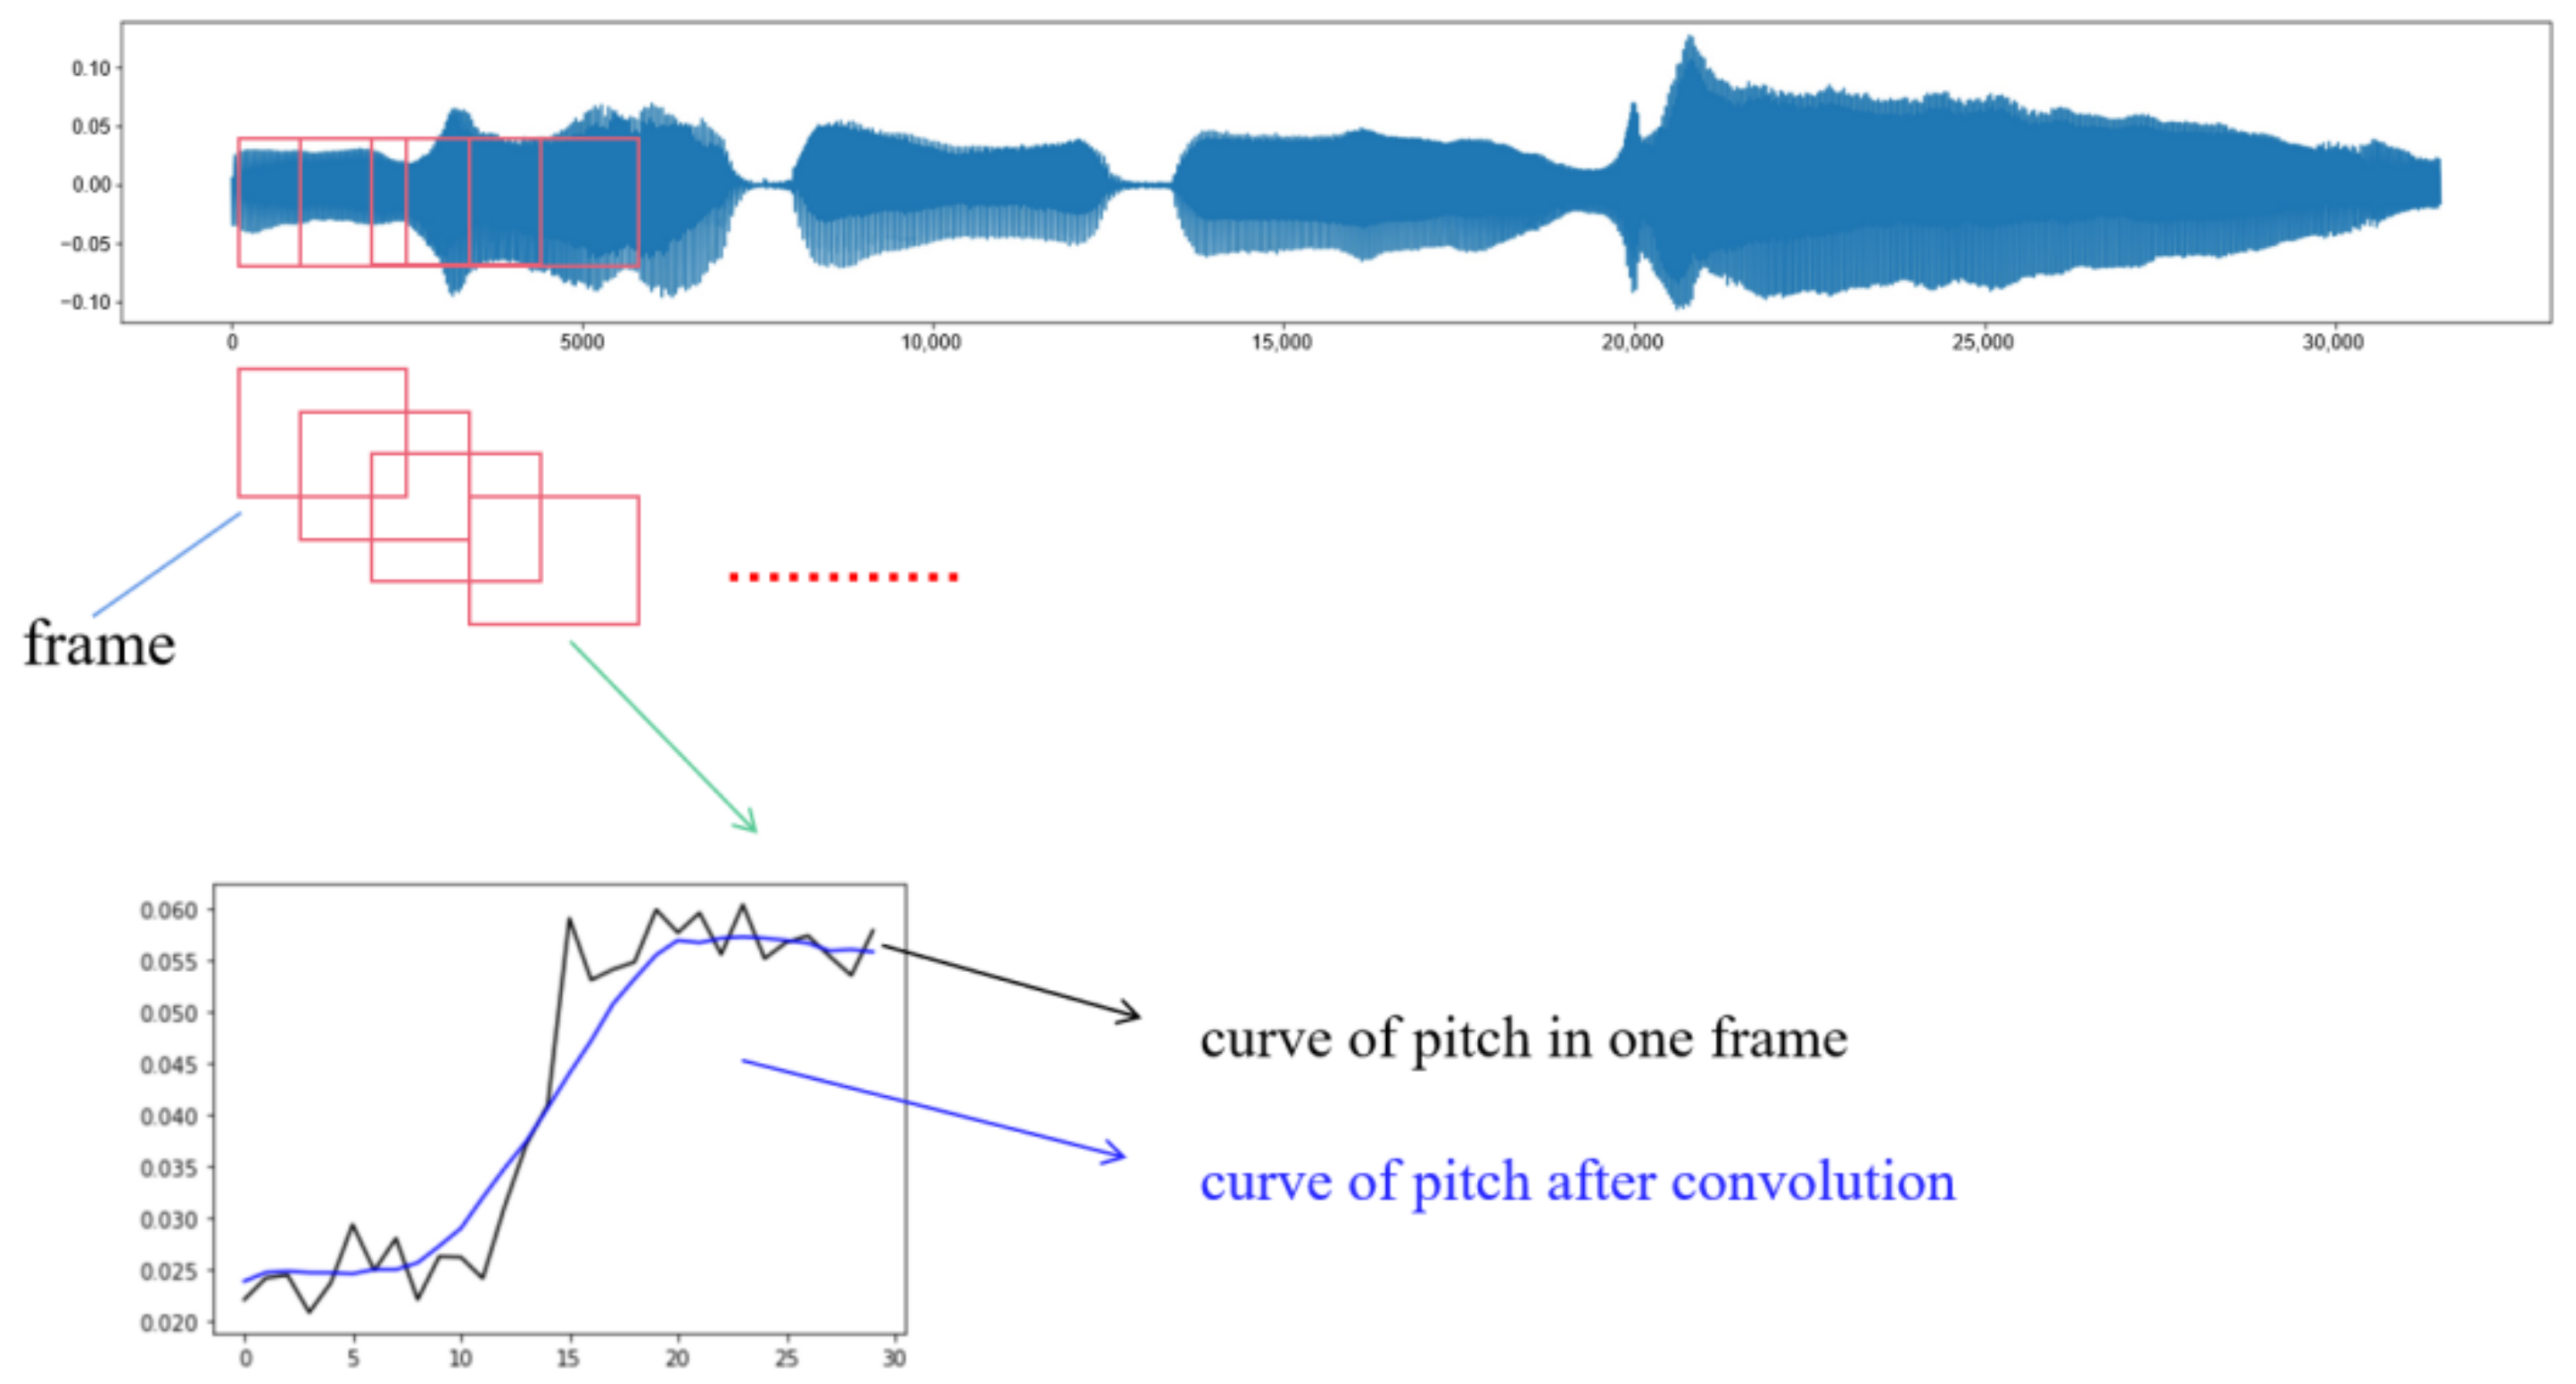
First, we extract the pitch from the audio. We used torchcrepe [15] to extract the pitch. Then, the derivation of the pitch change curve is obtained. During processing, since the human voice cannot play a very stable pitch and usually has large volatilities, the smoothing process was performed using convolution. The window size selected is 20 samples for the audio file with a sampling rate of 8000. Then, the derivation of pitches is obtained, and note cutting can be achieved by finding the part of the audio fragment with drastic pitch changes. This avoids the selection of unstable parts of the head and tail of the tone when picking features. The process is shown in Figure 2.
Figure 2.
The architecture of the contrast model.
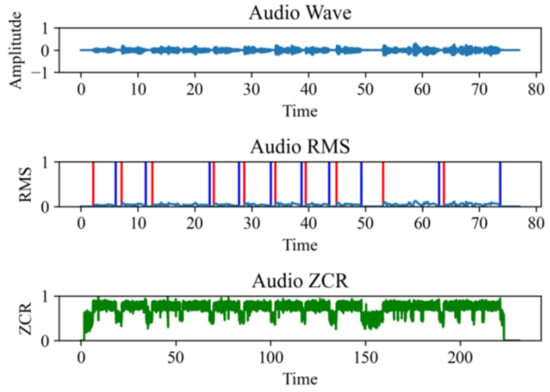
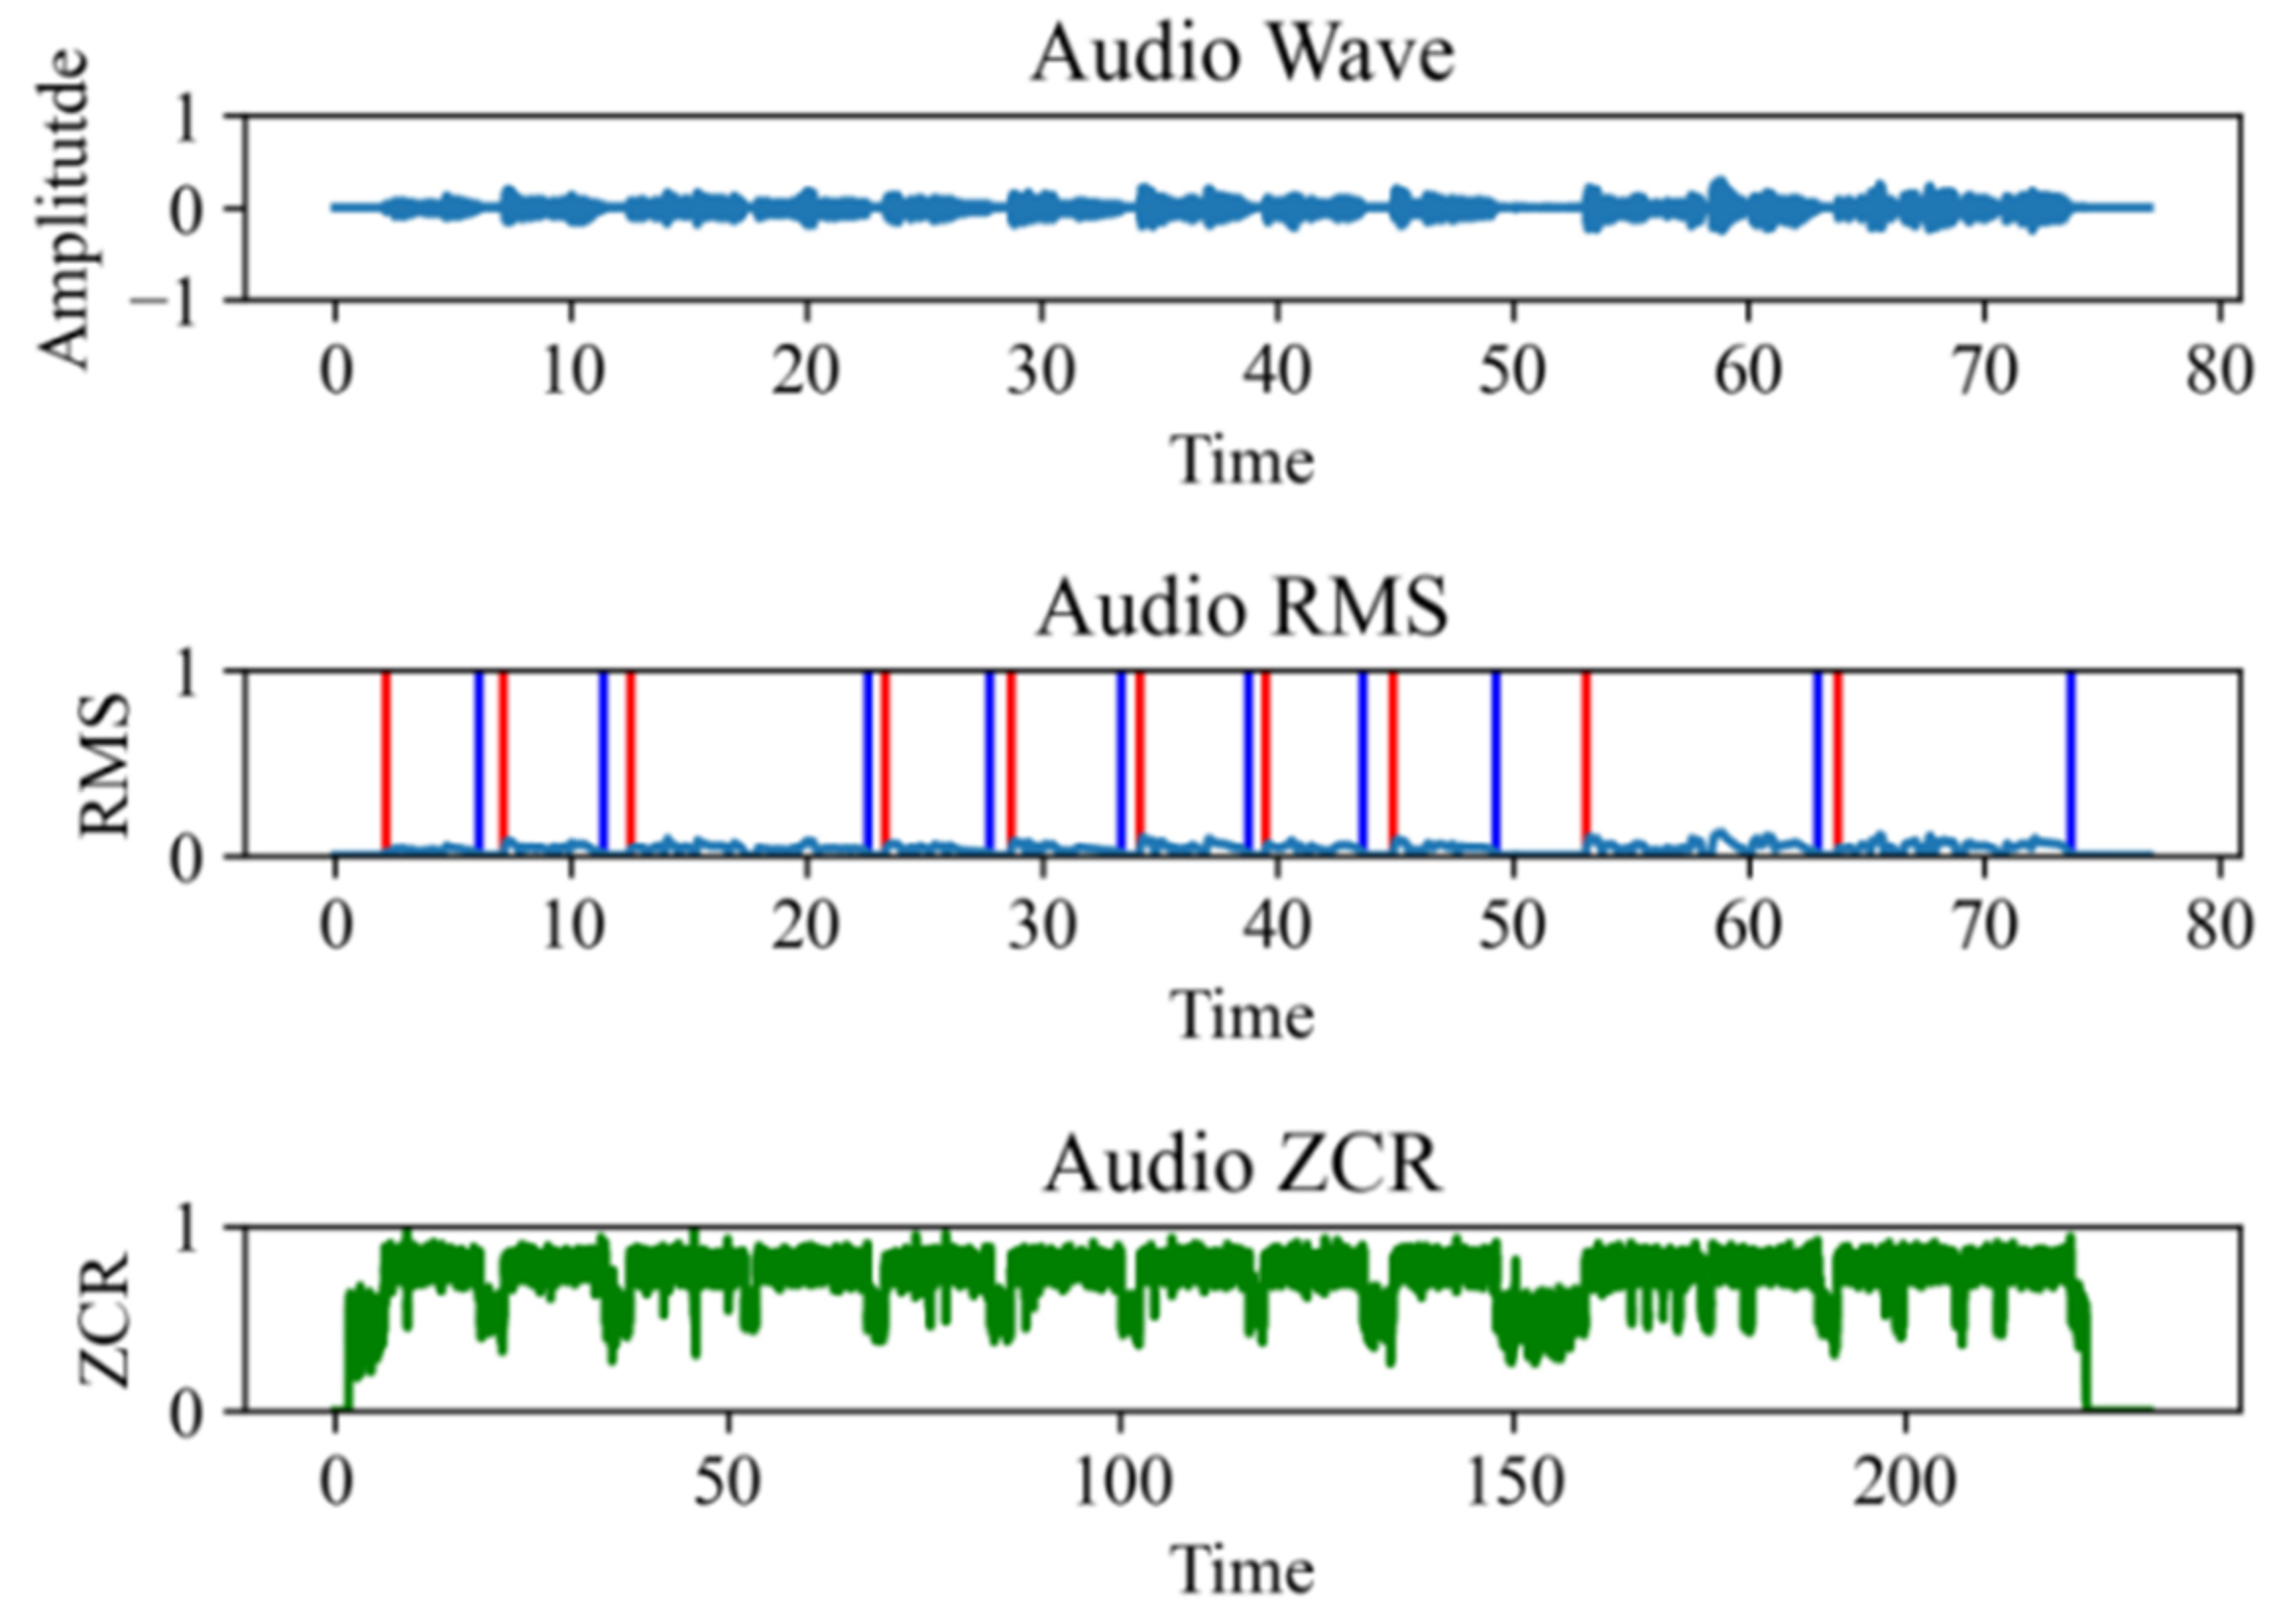
Second, we cut non-silent note fragments with pitch and energy values. Unclear notes and suspected noise such as a change of air are filtered. The method used in this research is the double-threshold method, which uses short-time average energies and short-time average zero-passing rates to cut the notes. The waveforms, root mean square curve, and zero crossing-rate curve of the notes are shown in Figure 3.
Figure 3.
The architecture of the contrast model.
Combining the above two steps, we can obtain stable segments with respect to singing audio. Short-time Fourier transforms are performed on these note segments to obtain the spectrum. The sound spectrum obtained in this manner has little fluctuations in the vertical direction, which is conducive for extracting stable timbre characteristics.
4. Transfer Learning Model for Timbre Evaluation
The overall model is divided into two parts: One is trained to learn instrument timbre evaluation and the other aims to evaluate singing-voice timbre after preloading the first model. Inspired by the CRNN architecture [16], we built the instrument timbre-evaluation model. This research performed regression analysis on each of the sixteen timbre evaluation dimensions. These sixteen timbre features are as follows: slim, bright, dim, sharp, thick, thin, solid, clear, dry, plump, rough, pure, hoarse, harmonize, soft, and turbid. These sixteen timbre features are timbral descriptors filtered by experimental analysis by Jiang wei et al. [9]. These 16 feature evaluation models have the same structure and same input and output formats. Different feature evaluation models are optimized by adjusting the learning rate. Then, the instrument’s timbre-evaluation model migrated to vocal timbre evaluations.
Considering that there are some differences in timbre evaluations in the dataset, this research redefined the loss function to adjust the network so that it can handle subjective ratings. To further validate experimental results, this research designed a contrast model that directly fits the final scores by regression analysis without using instrument timbre-evaluation models. The final experimental results show that the transfer learning model has a 34.89% lower cross-entropy loss than the contrast model.
4.1. Deep Regression for Contrast Experiment
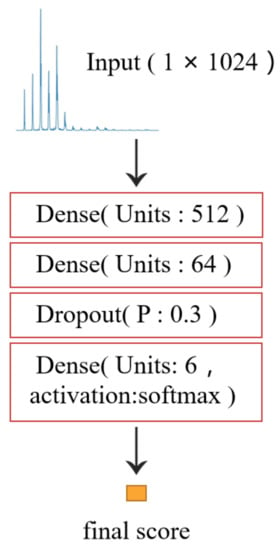
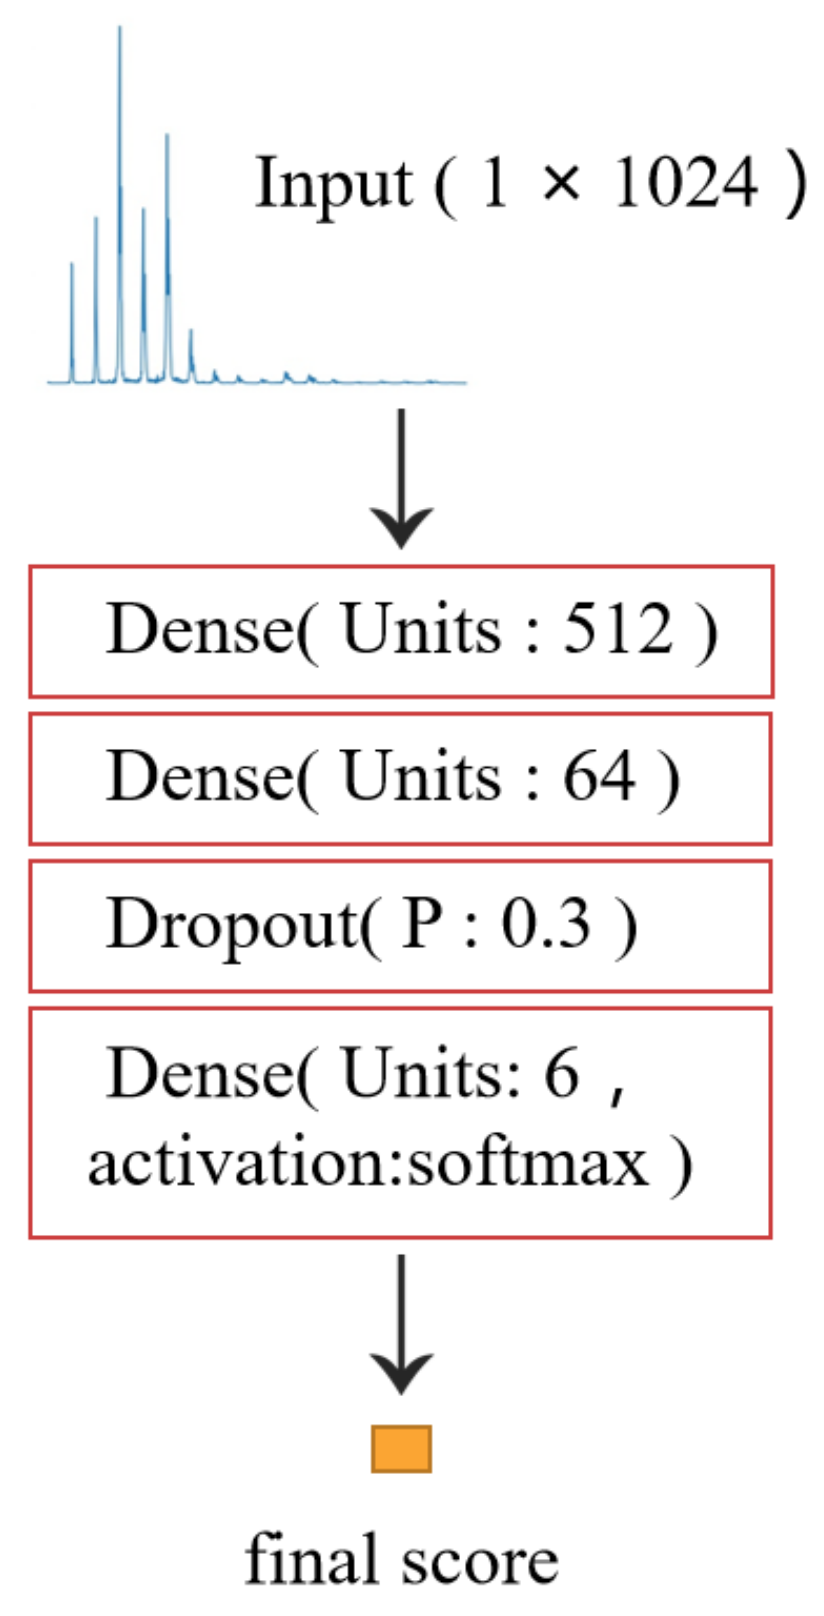
Due to the small amount of data, there are many problems in training when using spectrum images. If the model is too complex, it will lead to overfitting. If the model is too simple, learning useful information from images is difficult. Therefore, this research study reduces the input from two-dimensional to one-dimensional by using the instantaneous frequency information of one frame in the spectrogram as the input. This research chooses the dense layer to train the input and then uses the softmax layer for regression analysis. At the same time, a dropout layer is added after the dense layer to solve the problem of model overfitting. The specific network structure and parameter settings are shown in Figure 4.
Figure 4.
The architecture of the contrast model.
The average cross-entropy of the control model under 10-fold cross-validation is 1.556. The design of the loss function will be described in Section 4 of this research. The model is able to predict a rough range of scores, but it still suffers from overfitting. With limited data, it is difficult to achieve good results either by using a simple network structure or optimizing the input and output, which is why this research uses transfer learning to explore singing-voice timbre evaluations.
4.2. Transfer Learning Model
4.2.1. Musical Instruments Timbre-Evaluation Network
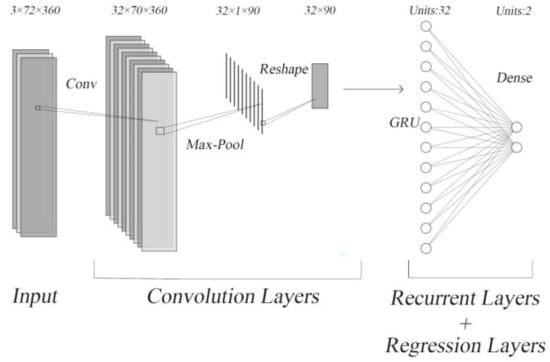
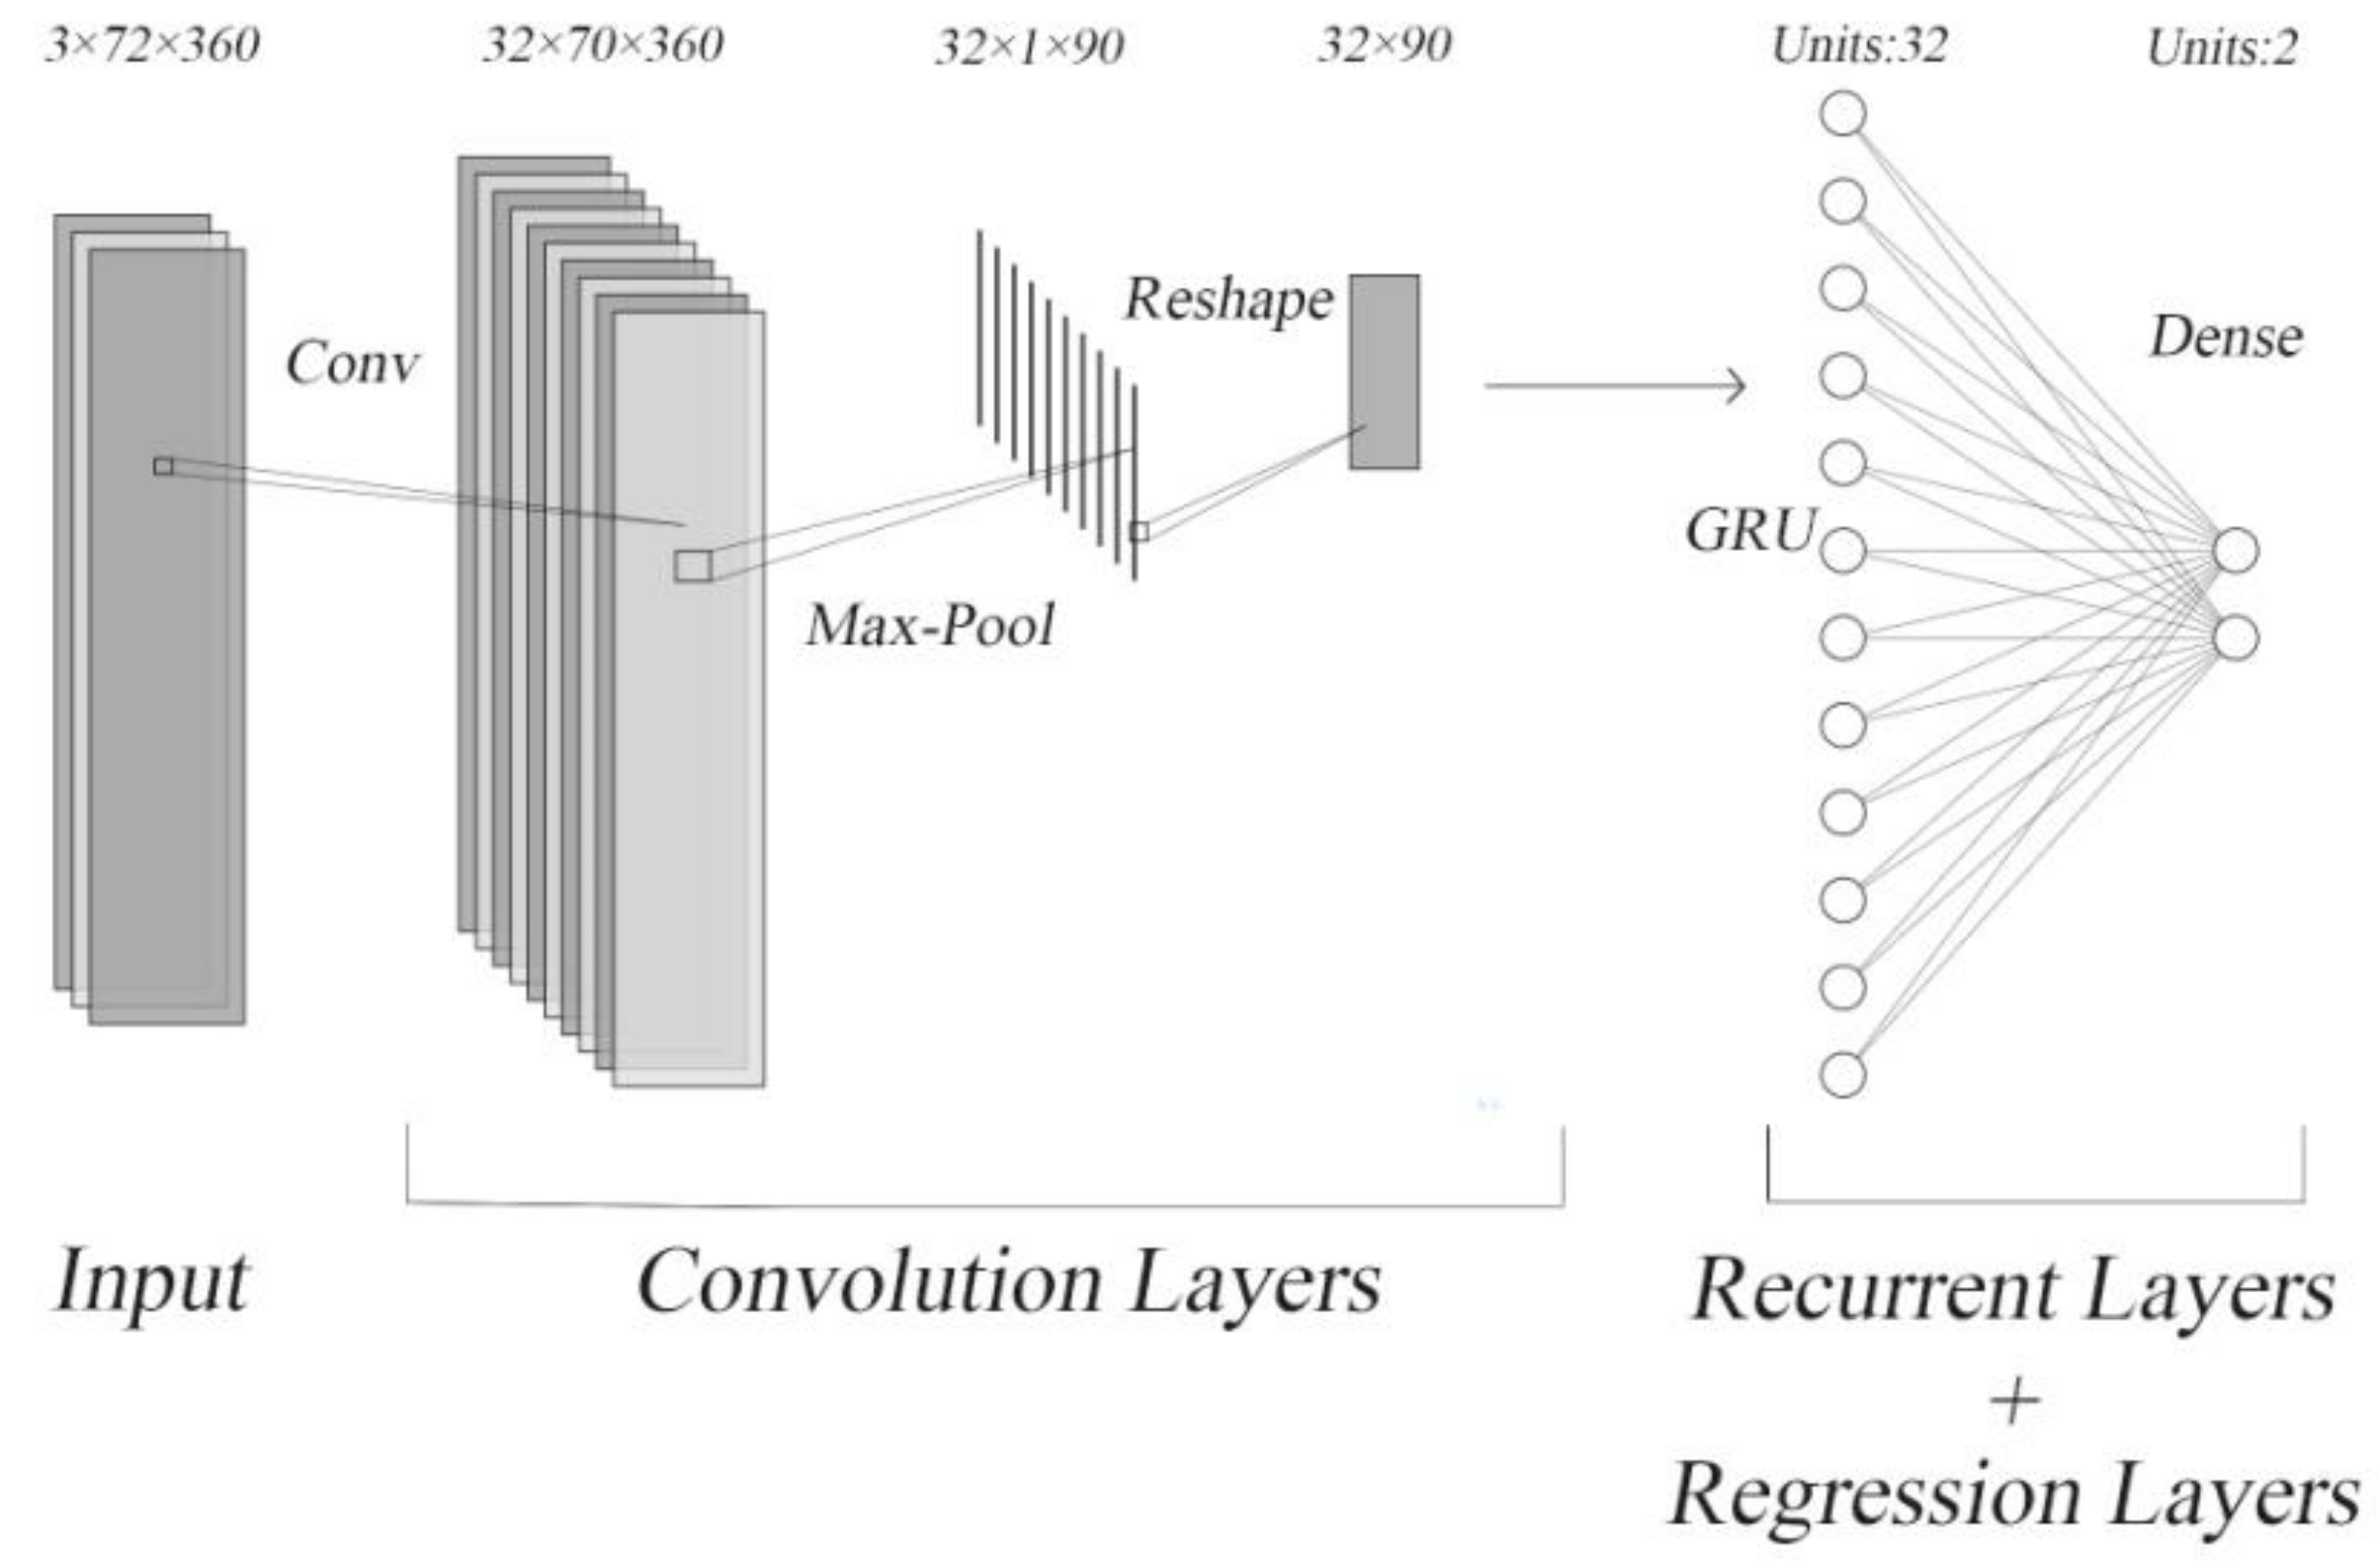
This research develops a model based on the CRNN model architecture proposed by shi B et al. [16]. The model in this research consists of three parts, retaining the first two parts of the original model—convolutional layer and recurrent layer. The third part is changed from a coding layer to regression layer. After the convolutional layer is used to filter the mel spectrogram in order to extract complex features, the recurrent layer is used to analyze the features; finally, the regression layer is used to calculate the scores. The network structure is shown in Figure 5.
Figure 5.
The architecture of the musical-instrument timbre-evaluation model.
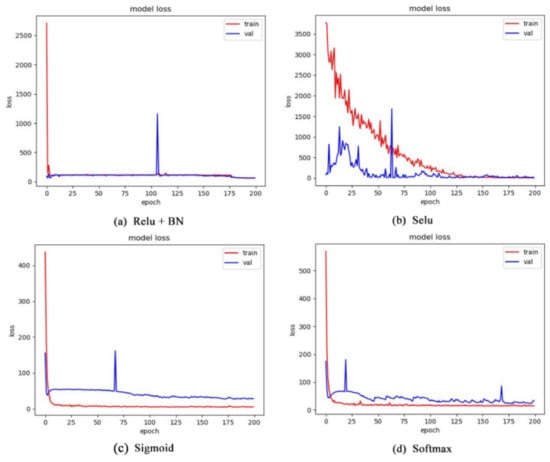
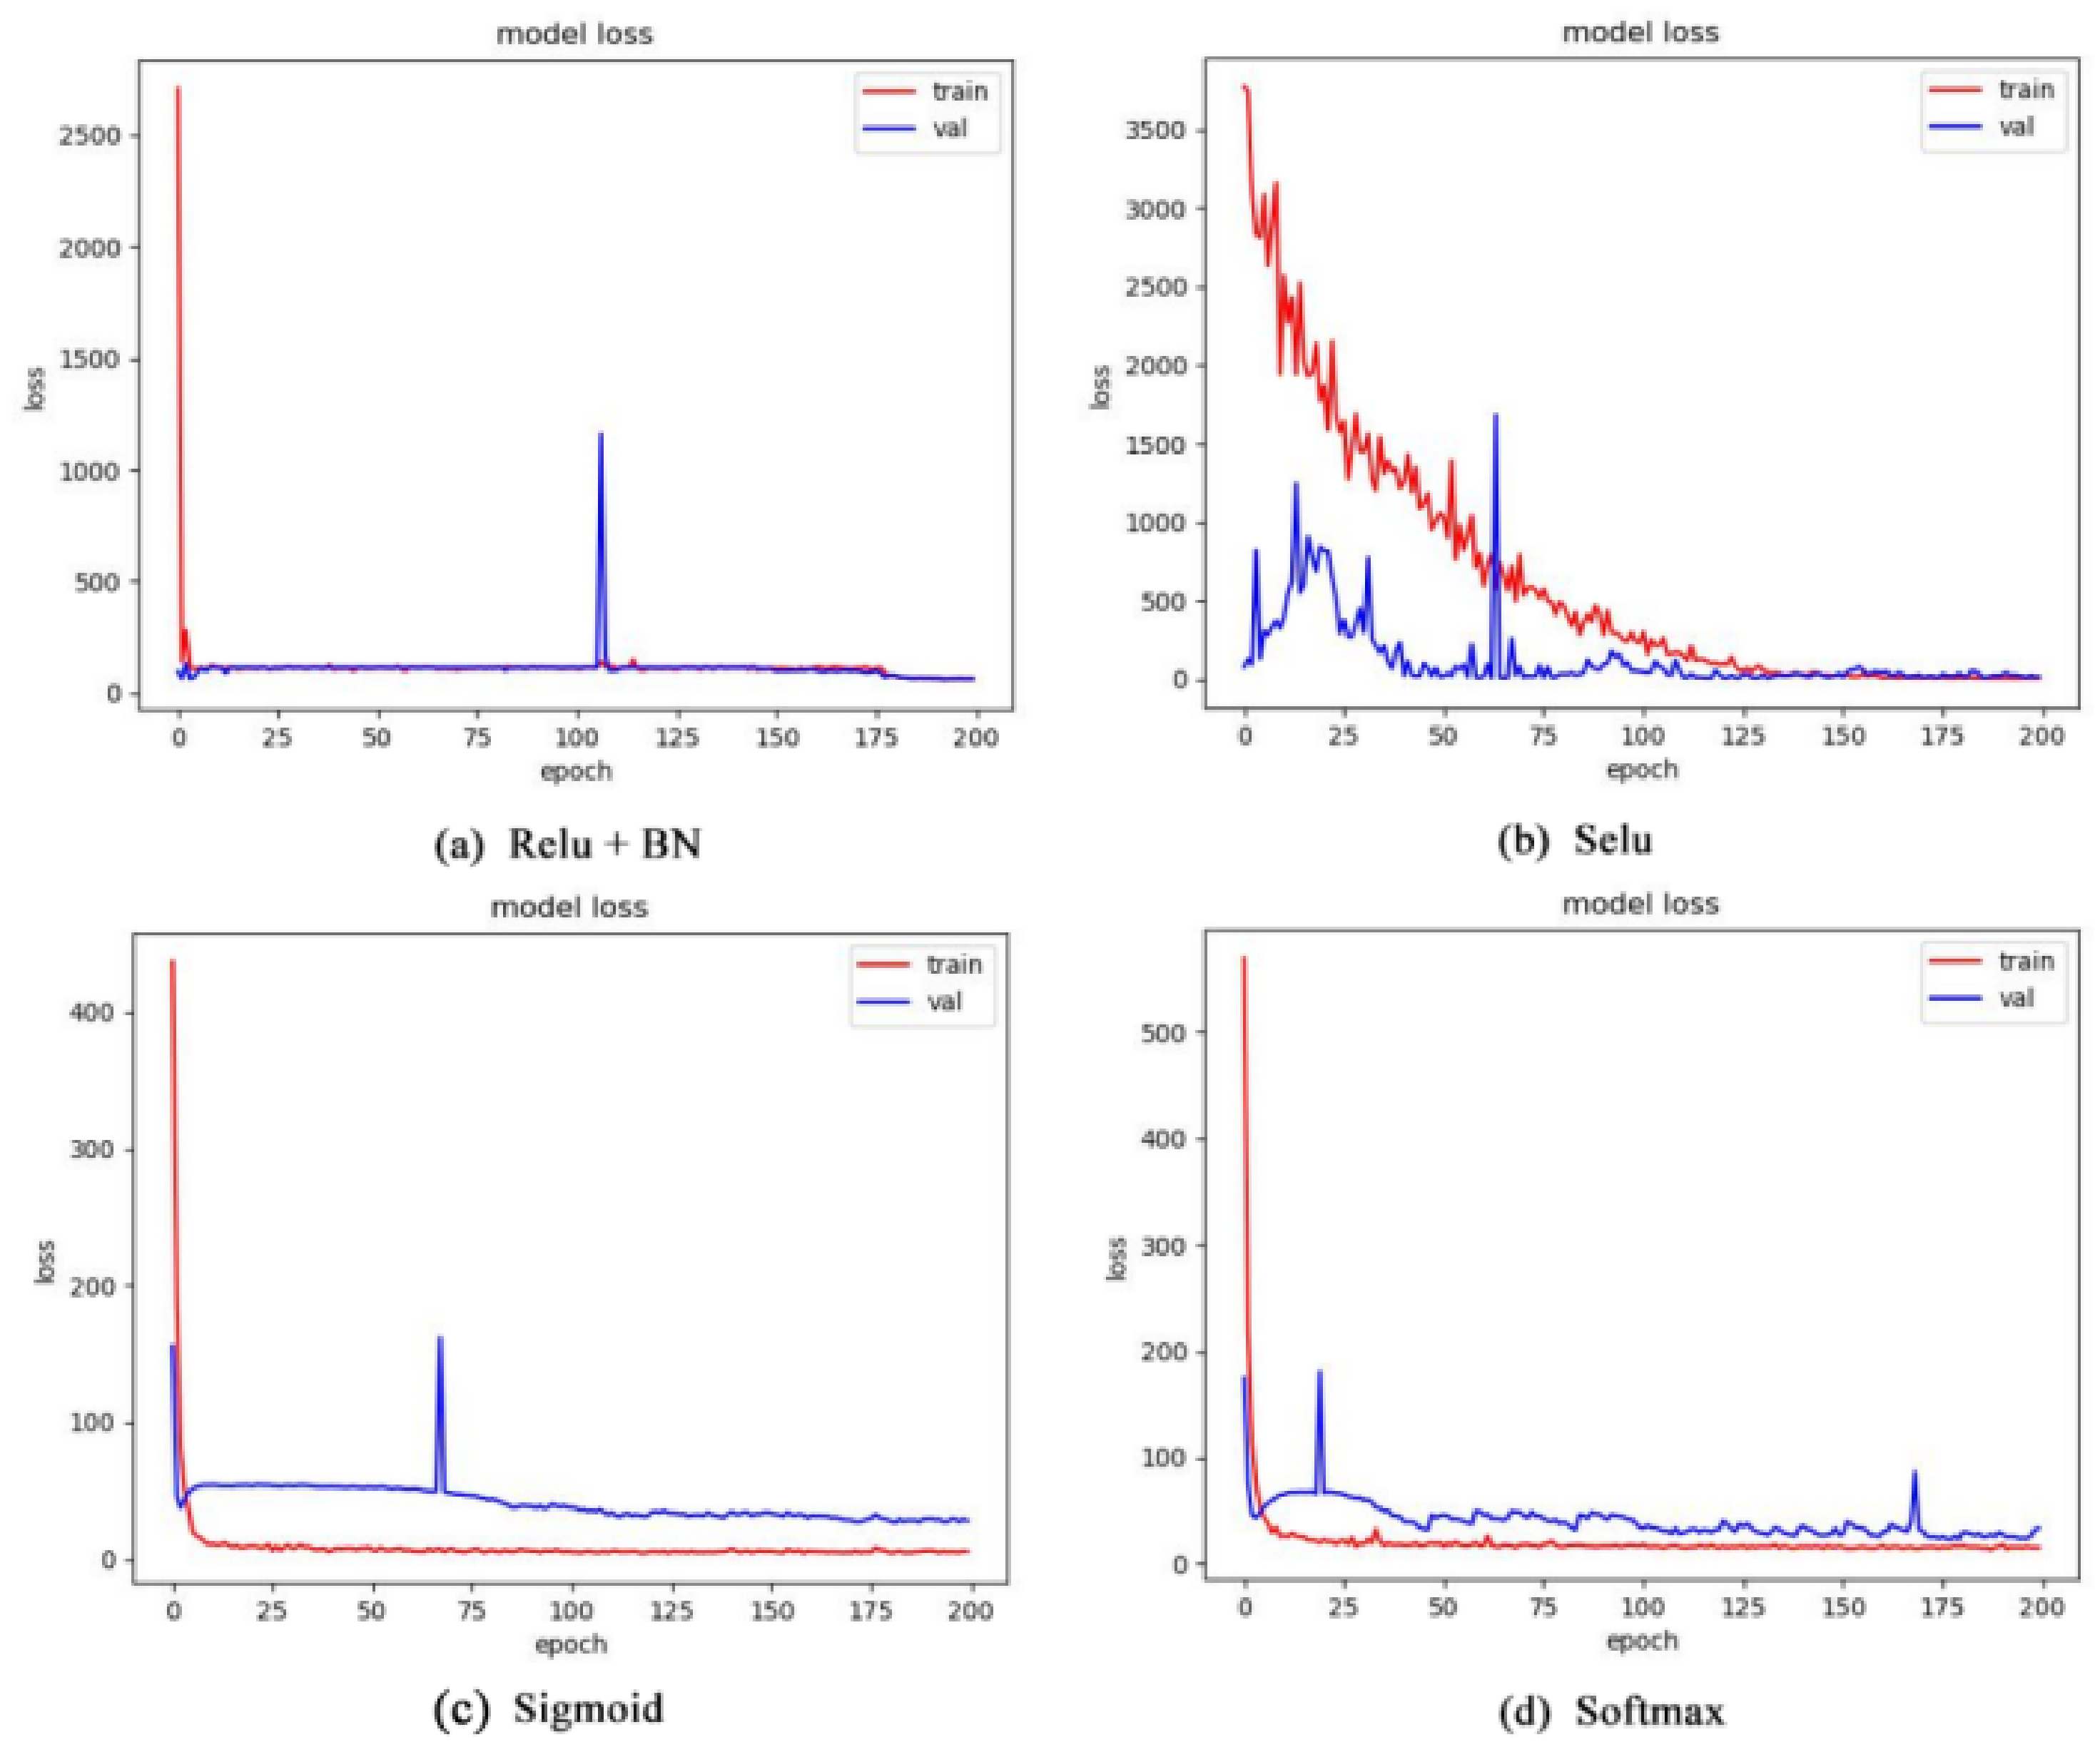
The parameters of each network layer are redesigned, inspired by the filter shape design raised by Jordi Pons et al. [8]. The convolutional kernel size is 3 × 1, and the number of filters is 64. Pooling layers are added after the convolutional layer to extract features, and the window size is designed as a rectangle with small widths, lengths, and heights in order to retain more information about the vertical direction. Unlike general networks, this research designs only one convolutional layer, and its main purpose is to adapt to a small dataset. Moreover, the input image is a transient frequency feature, which is easier to learn than an entire spectrogram image. The recurrent layer is a single GRU layer, which can effectively handle the sequential input. A dropout layer is added after the GRU layer to avoid model overfitting. Finally, the regression layer is used to predict timbre scores. The activation function is the commonly used softmax, which also requires mapping the score labels to the range of 0 to 1 when processing data. This research tested four different activation functions, and the results proved that softmax was the most suitable for the task. The loss results for the test set are shown in Table 2. Among them, relu and selu converged poorly. Relu completely overfit, and its output is all one value. Sigmoid is prone to overfitting, and its loss-of-training set outperforms softmax but the validation and test sets are not as good as softmax. Figure 6 shows an example of the one-feature model.
Table 2.
Average absolute error loss of the test set for different activation functions.
Figure 6.
Loss of the slim model: (a) model loss when the activation function is relu and batch normalization, (b) model loss when the activation function is selu, (c) model loss when the activation function is sigmoid, and (d) model loss when the activation function is softmax.
Considering the slightly discrete distribution of the scores in the dataset and the situation that one sample corresponds to multiple score labels, we defined the loss function as Equation (1). The coefficient of the mean absolute error is multiplied by the standard deviation so that the penalty is large for samples with concentrated ratings and small for samples with scattered ratings. In the loss function, y_pred is the predicted score, y_true is the average of the actual scores, alpha is the standard deviation, and k is a constant. After testing, this research selected k to be 100.
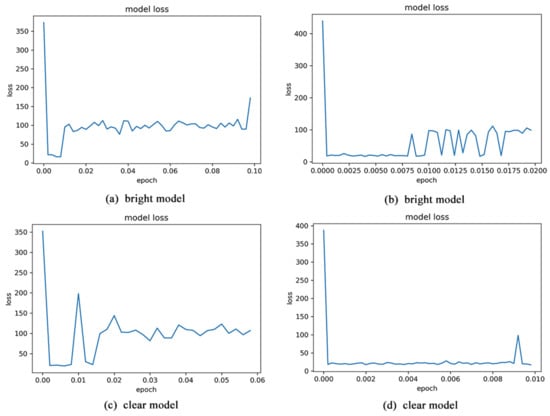
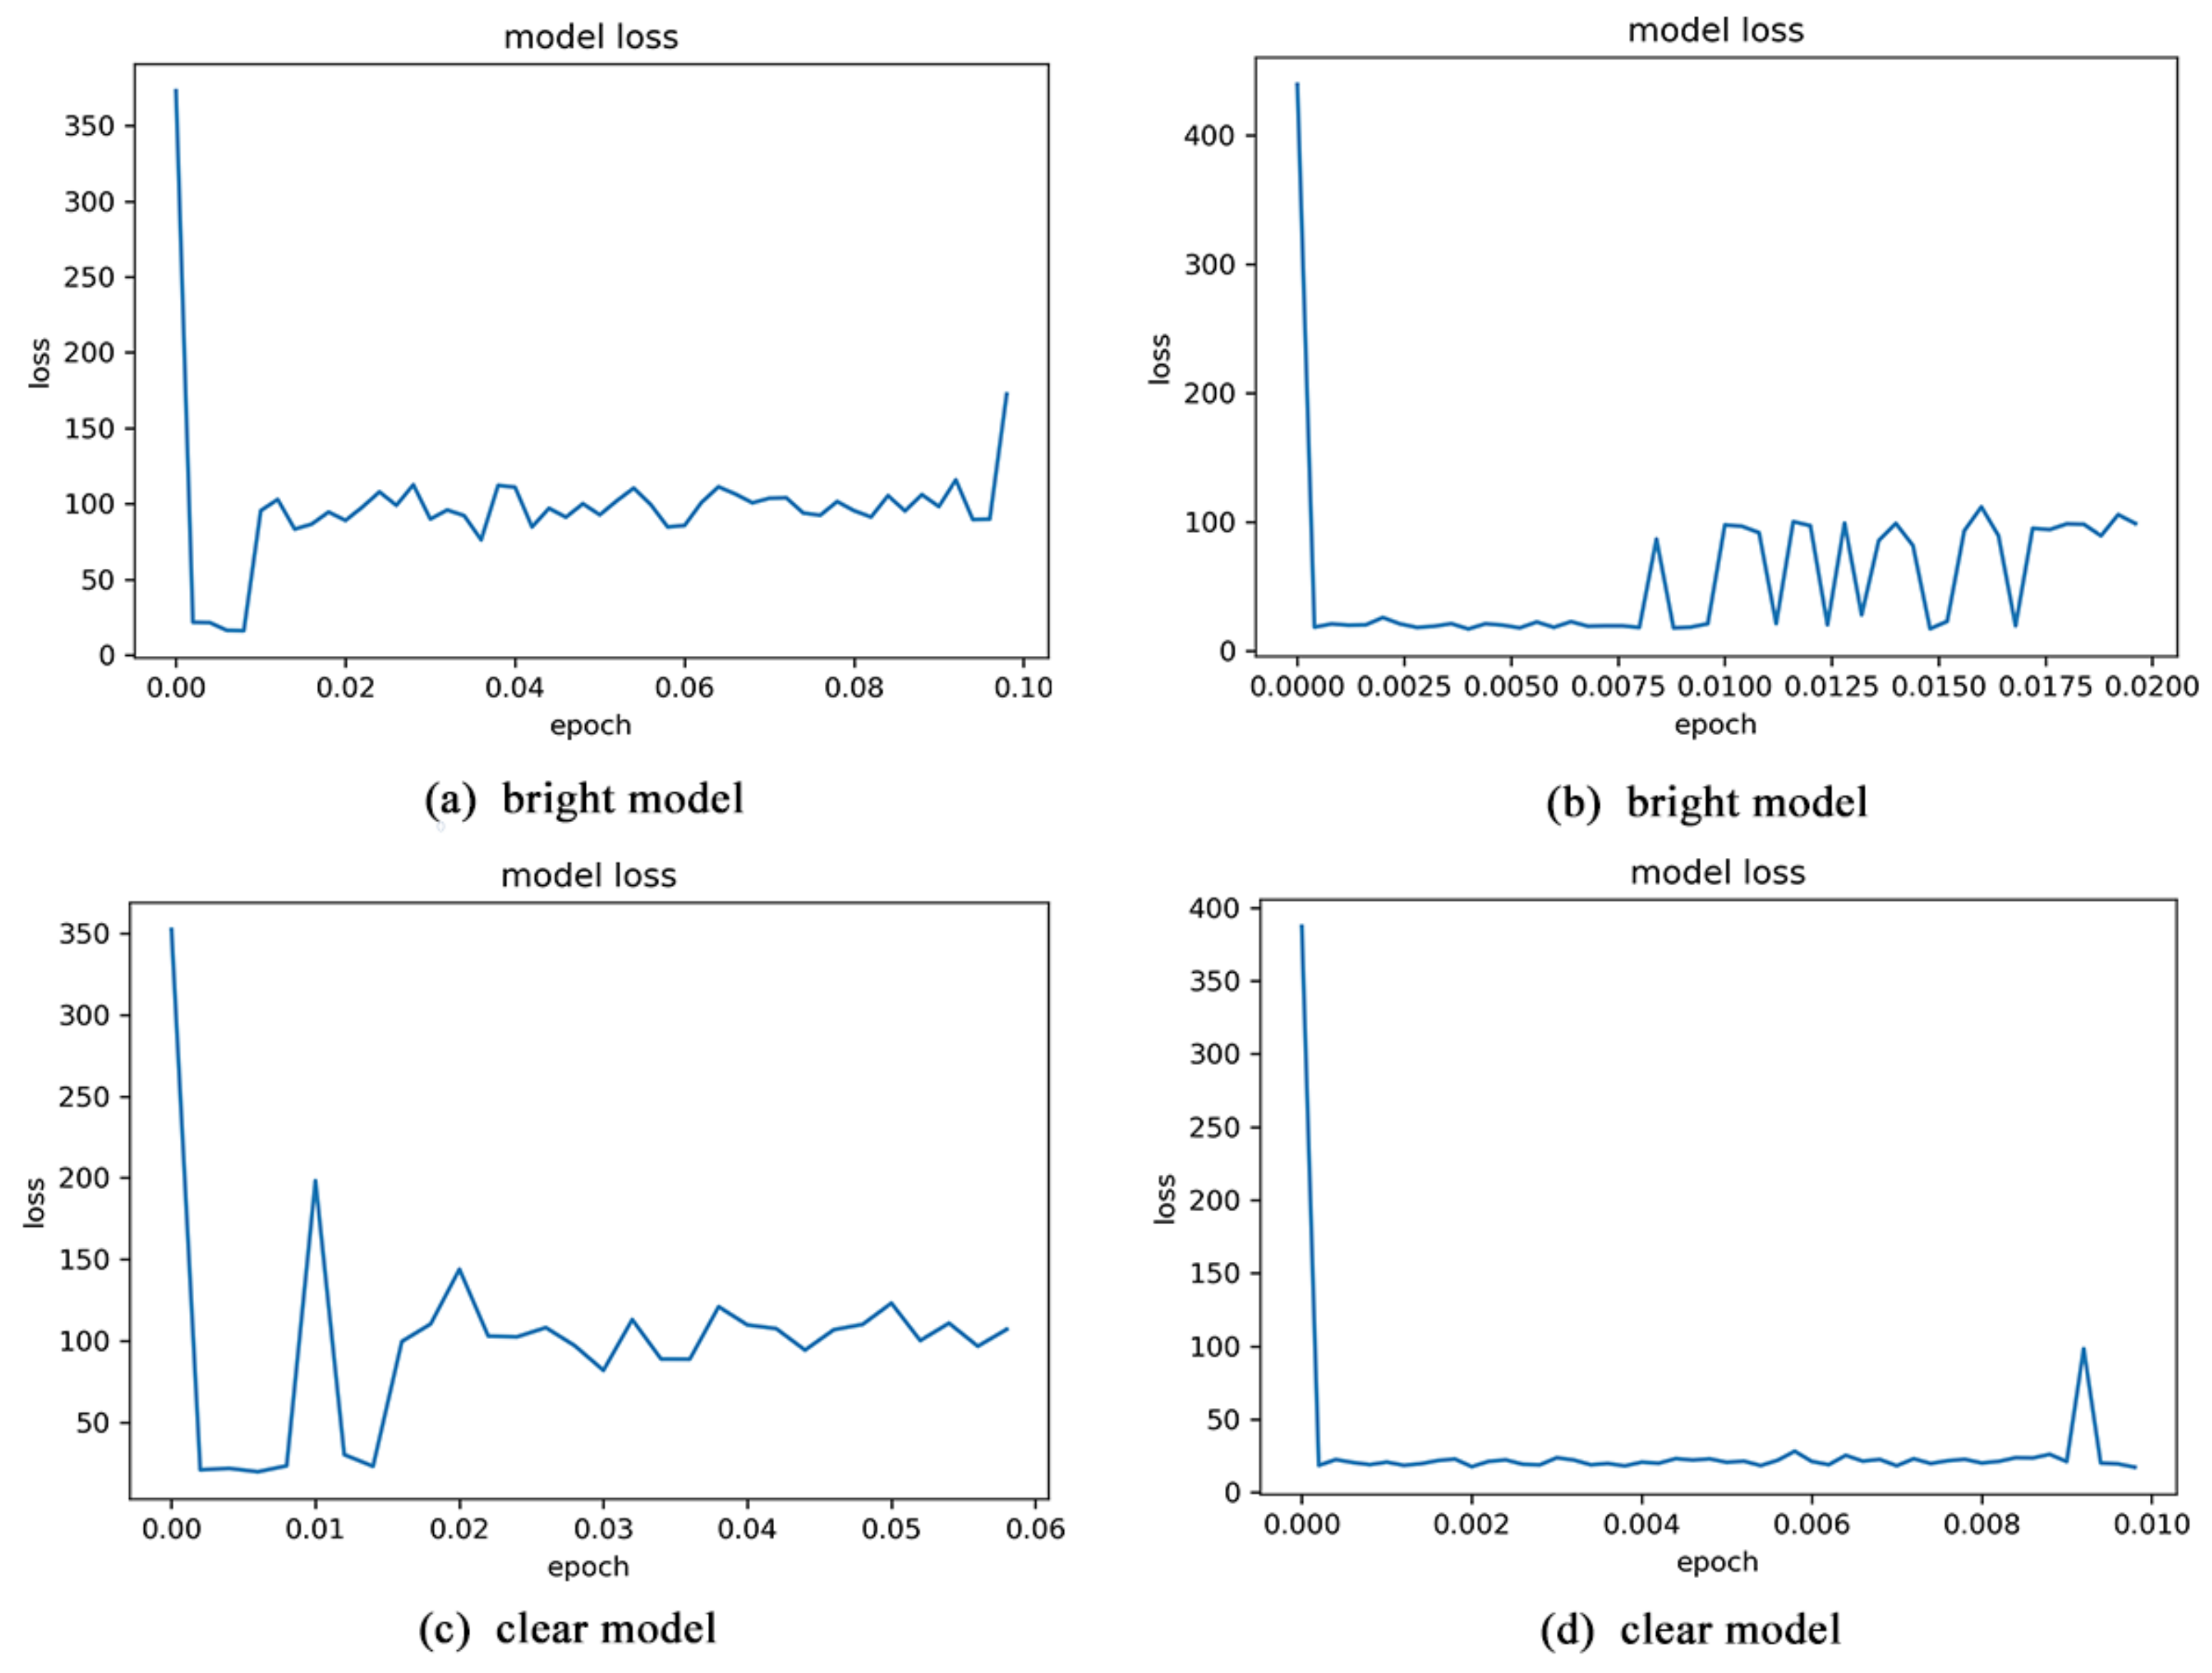
The dataset was divided into a ratio of 80% training set, 10% test set, and 10% validation set. Since different features have different concerns, we construct 16 models to learn the scores for 16 feature distributions. The accuracy of evaluation is improved by adjusting the learning rate of each model to adapt to different features. Some of the model loss variation curves with learning rates as variables are shown in Figure 7. The learning rates of the different feature models used are shown in Table 3. Using the mean absolute error as the evaluation criterion, the loss for the 16 features floats between 0.9 and 1.8.
Figure 7.
Loss of the instrument timbre-evaluation model: (a) bright model loss when the learning rate varies from 0 to 0.1, (b) bright model loss when the learning rate varies from 0 to 0.02, (c) clear model loss when the learning rate varies from 0 to 0.06, and (d) clear model loss when the learning rate varies from 0 to 0.01.
Table 3.
Learning rate of each instrument timbre-evaluation model.
4.2.2. Singing-Voice Timbre-Evaluation Network
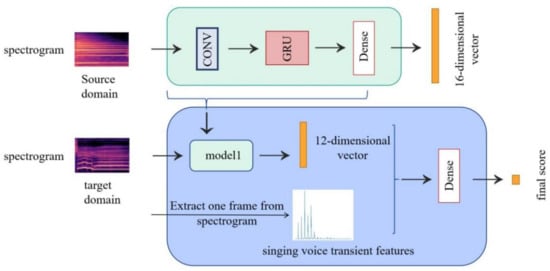
A sixteen-dimensional rating vector for timbre can be learned from the musical-instrument timbre-evaluation network. Each dimension in the vector represents a different aspect of the timbre’s evaluation index, such as thin, bright, dark, sharp, etc. These indexes are closely related to the final score of the singing voice. For example, if timbre is too sharp, the auditory perception will be harsh and the final score will be low; if timbre is very rich, it will give the impression of a hierarchy and the final score may be higher. Transforming the original task from learning a rating from a mel diagram to learning the final score based on evaluation vectors can reduce the difficulty. The design of this transfer learning articulation can also verify whether the features of instrument timbre scores have commonality with singing-voice tones. If the perception of the human ear is similar for both types of audio, then machine learning rules that apply to instrument timbre also apply to singing-voice timbre.
A twelve-dimensional vector is selected as the input to the model by eliminating error-prone vectors from sixteen-dimensional vectors. Since a twelve-dimensional vector has been learned, the training dimensionality is not too high, so the evaluation layer of the singing-voice timbre-evaluation model only has one dense layer. Using one dense layer for training can prevent overfitting more effectively.
Among the four judges’ scores for 132 songs, there were only a few cases in which the four judges scored exactly the same. More than half of the ranges are at two points or more, and there were even cases where the range reached four points. There is little point in using machine learning for subjective evaluations if true labels are chosen inappropriately. If the score label of the four judges is replaced by the average label commonly used in traditional models, it is a bit sloppy, especially in the case of small data, and it may lead to overfitting. If each score is entered into the model as an independent label, model training will be more difficult. Based on this consideration, the evaluation’s probability distribution is used as the training target, with labels being 11-dimensional vectors representing the probability of evaluation at 0–10. For example, if a song Is scored as two 5 s and two 6 s, then its label will be [0., 0., 0., 0., 0., 0., 0.5, 0.5, 0., 0., 0., 0.]. In the actual experiment, due to the uneven distribution of samples, the regions are redivided—with 0, 1, and 2 being the same interval and 6, 7, 8, and 9 being the same interval. For example, if a song is scored with two 6 s and two 8 s, its label should be [0., 0., 0., 0., 0., 1.0, 0.0].
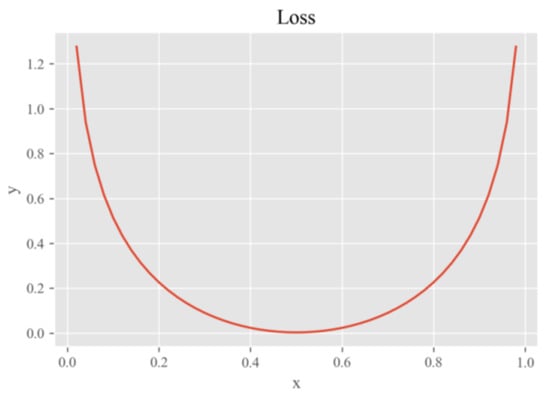
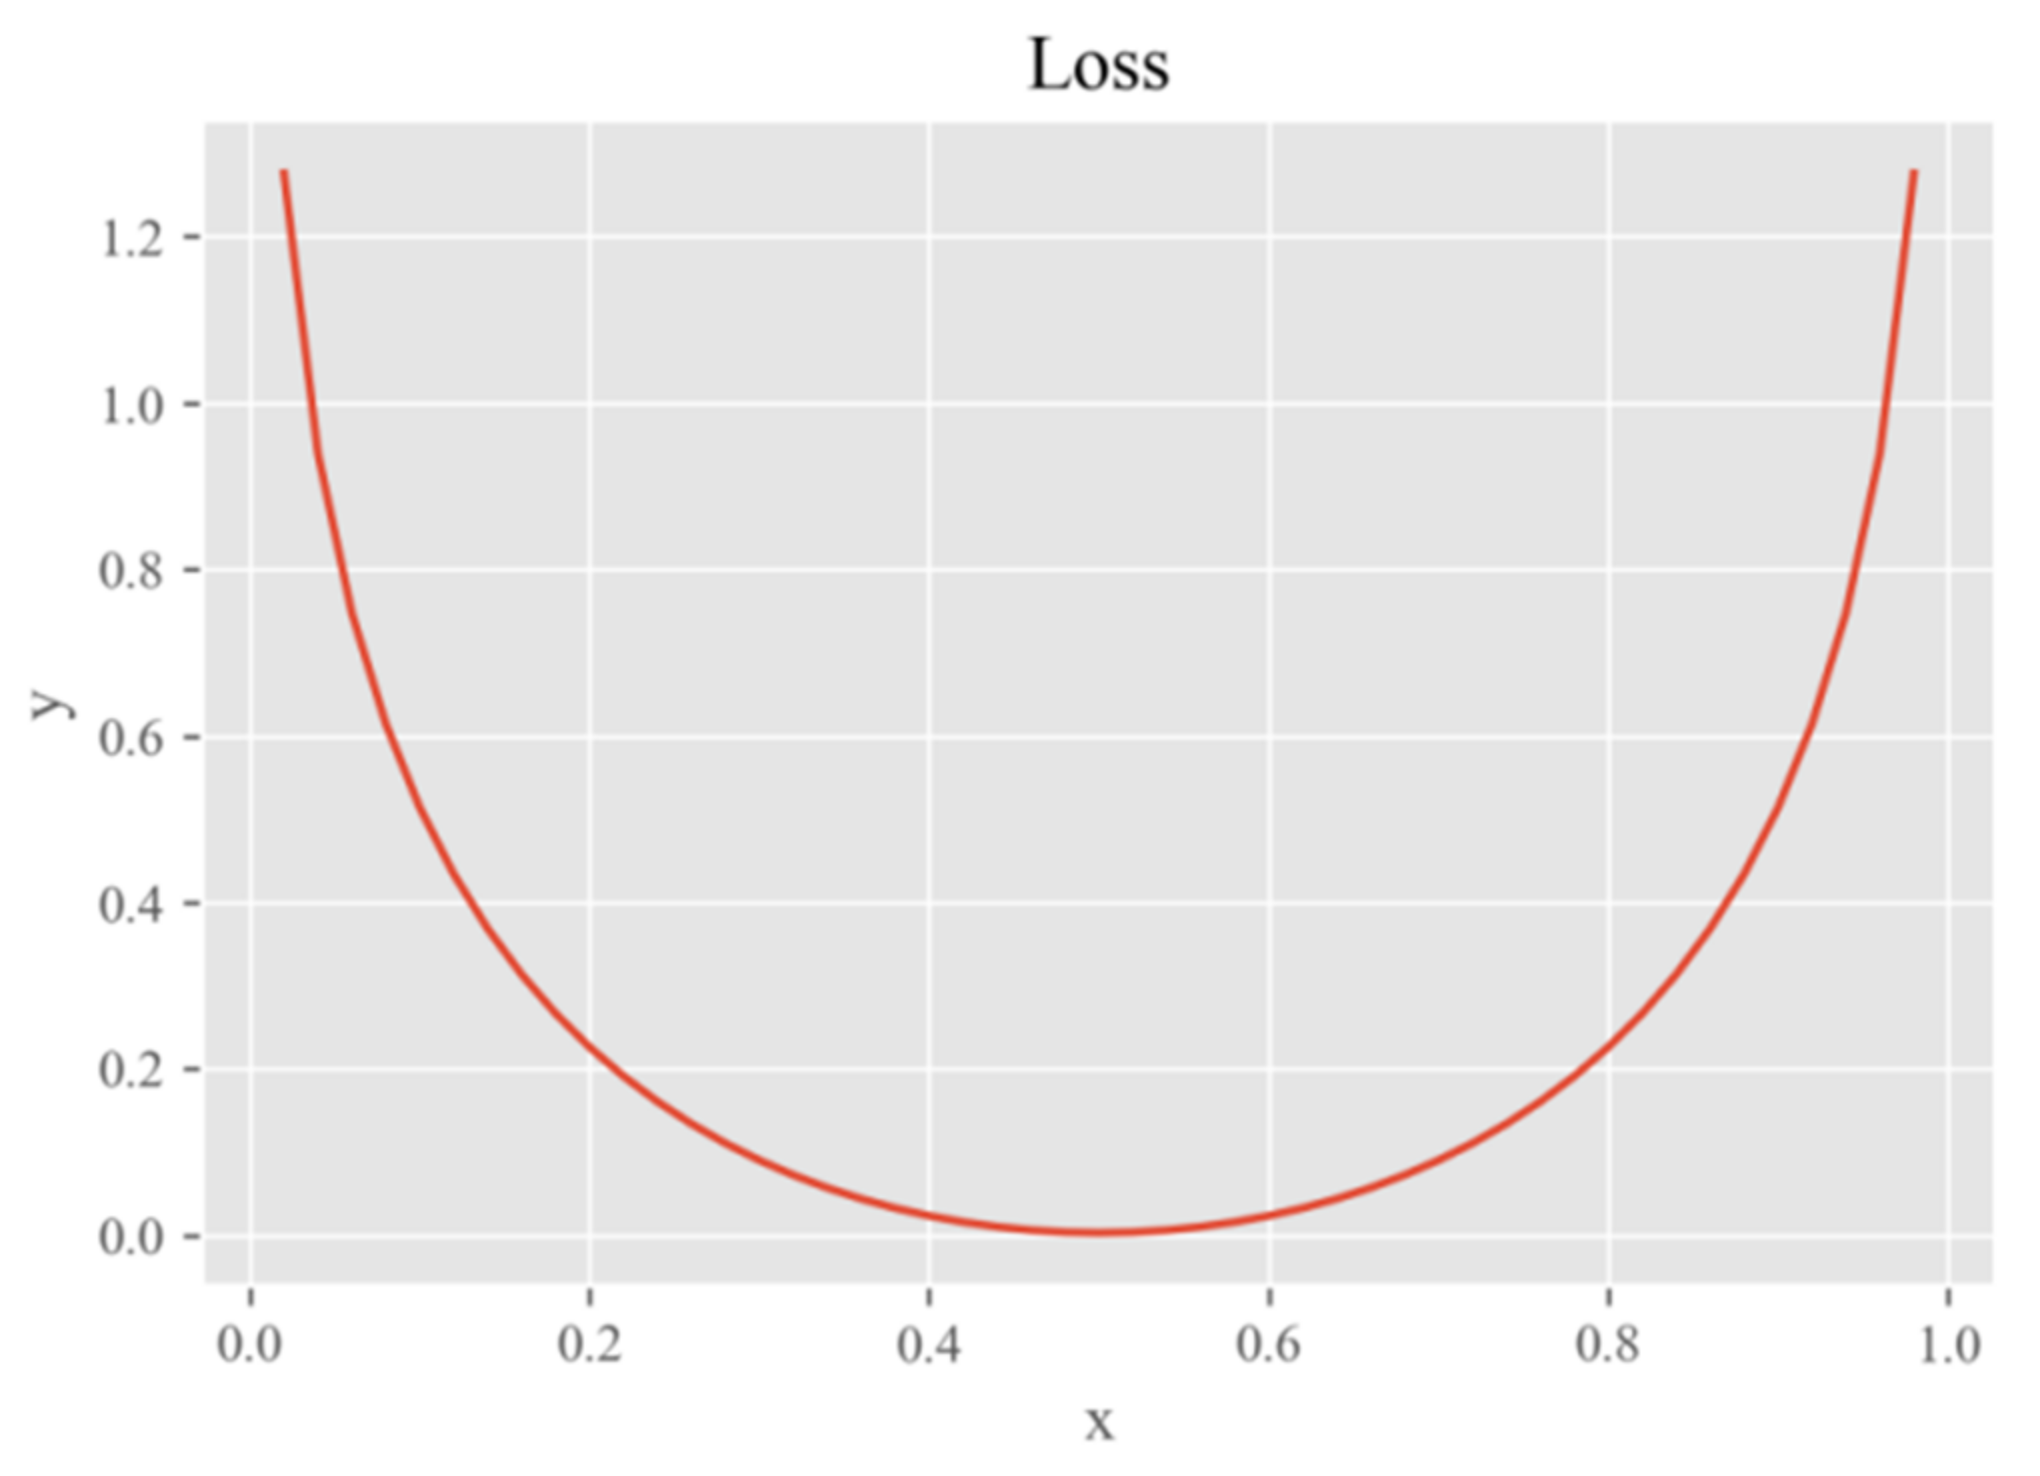
Cross entropy can focus on both the probability gap between the predicted and true values and the scatter of the predicted distribution. We define the loss function as the relative entropy of the predicted value to the true value minus the relative entropy of the true value itself. For different prediction cases, the custom loss function reflects the desired fitting ability. Taking the two-dimensional case as an example. Assuming that the true value of the probability distribution is [0.5, 0.5], the loss function is shown in Equation (2) as follows.
When y varies between 0 and 1, the loss curve changes, as shown in Figure 8. As shown in the figure, the loss function is a convex function that takes the extreme minimum value zero when y equals to 0.5. When the predicted value is the same as the true value, the loss will be zero. The greater the deviation of the predicted value from the true value, the greater the loss.
Figure 8.
Curve of loss function. The true value of the probability distribution is [0.5, 0.5].
The dataset was divided into a ratio of 80% training set, 10% test set, and 10% validation set. The average cross-entropy of the control model under a 10-fold cross-validation is 1.126.
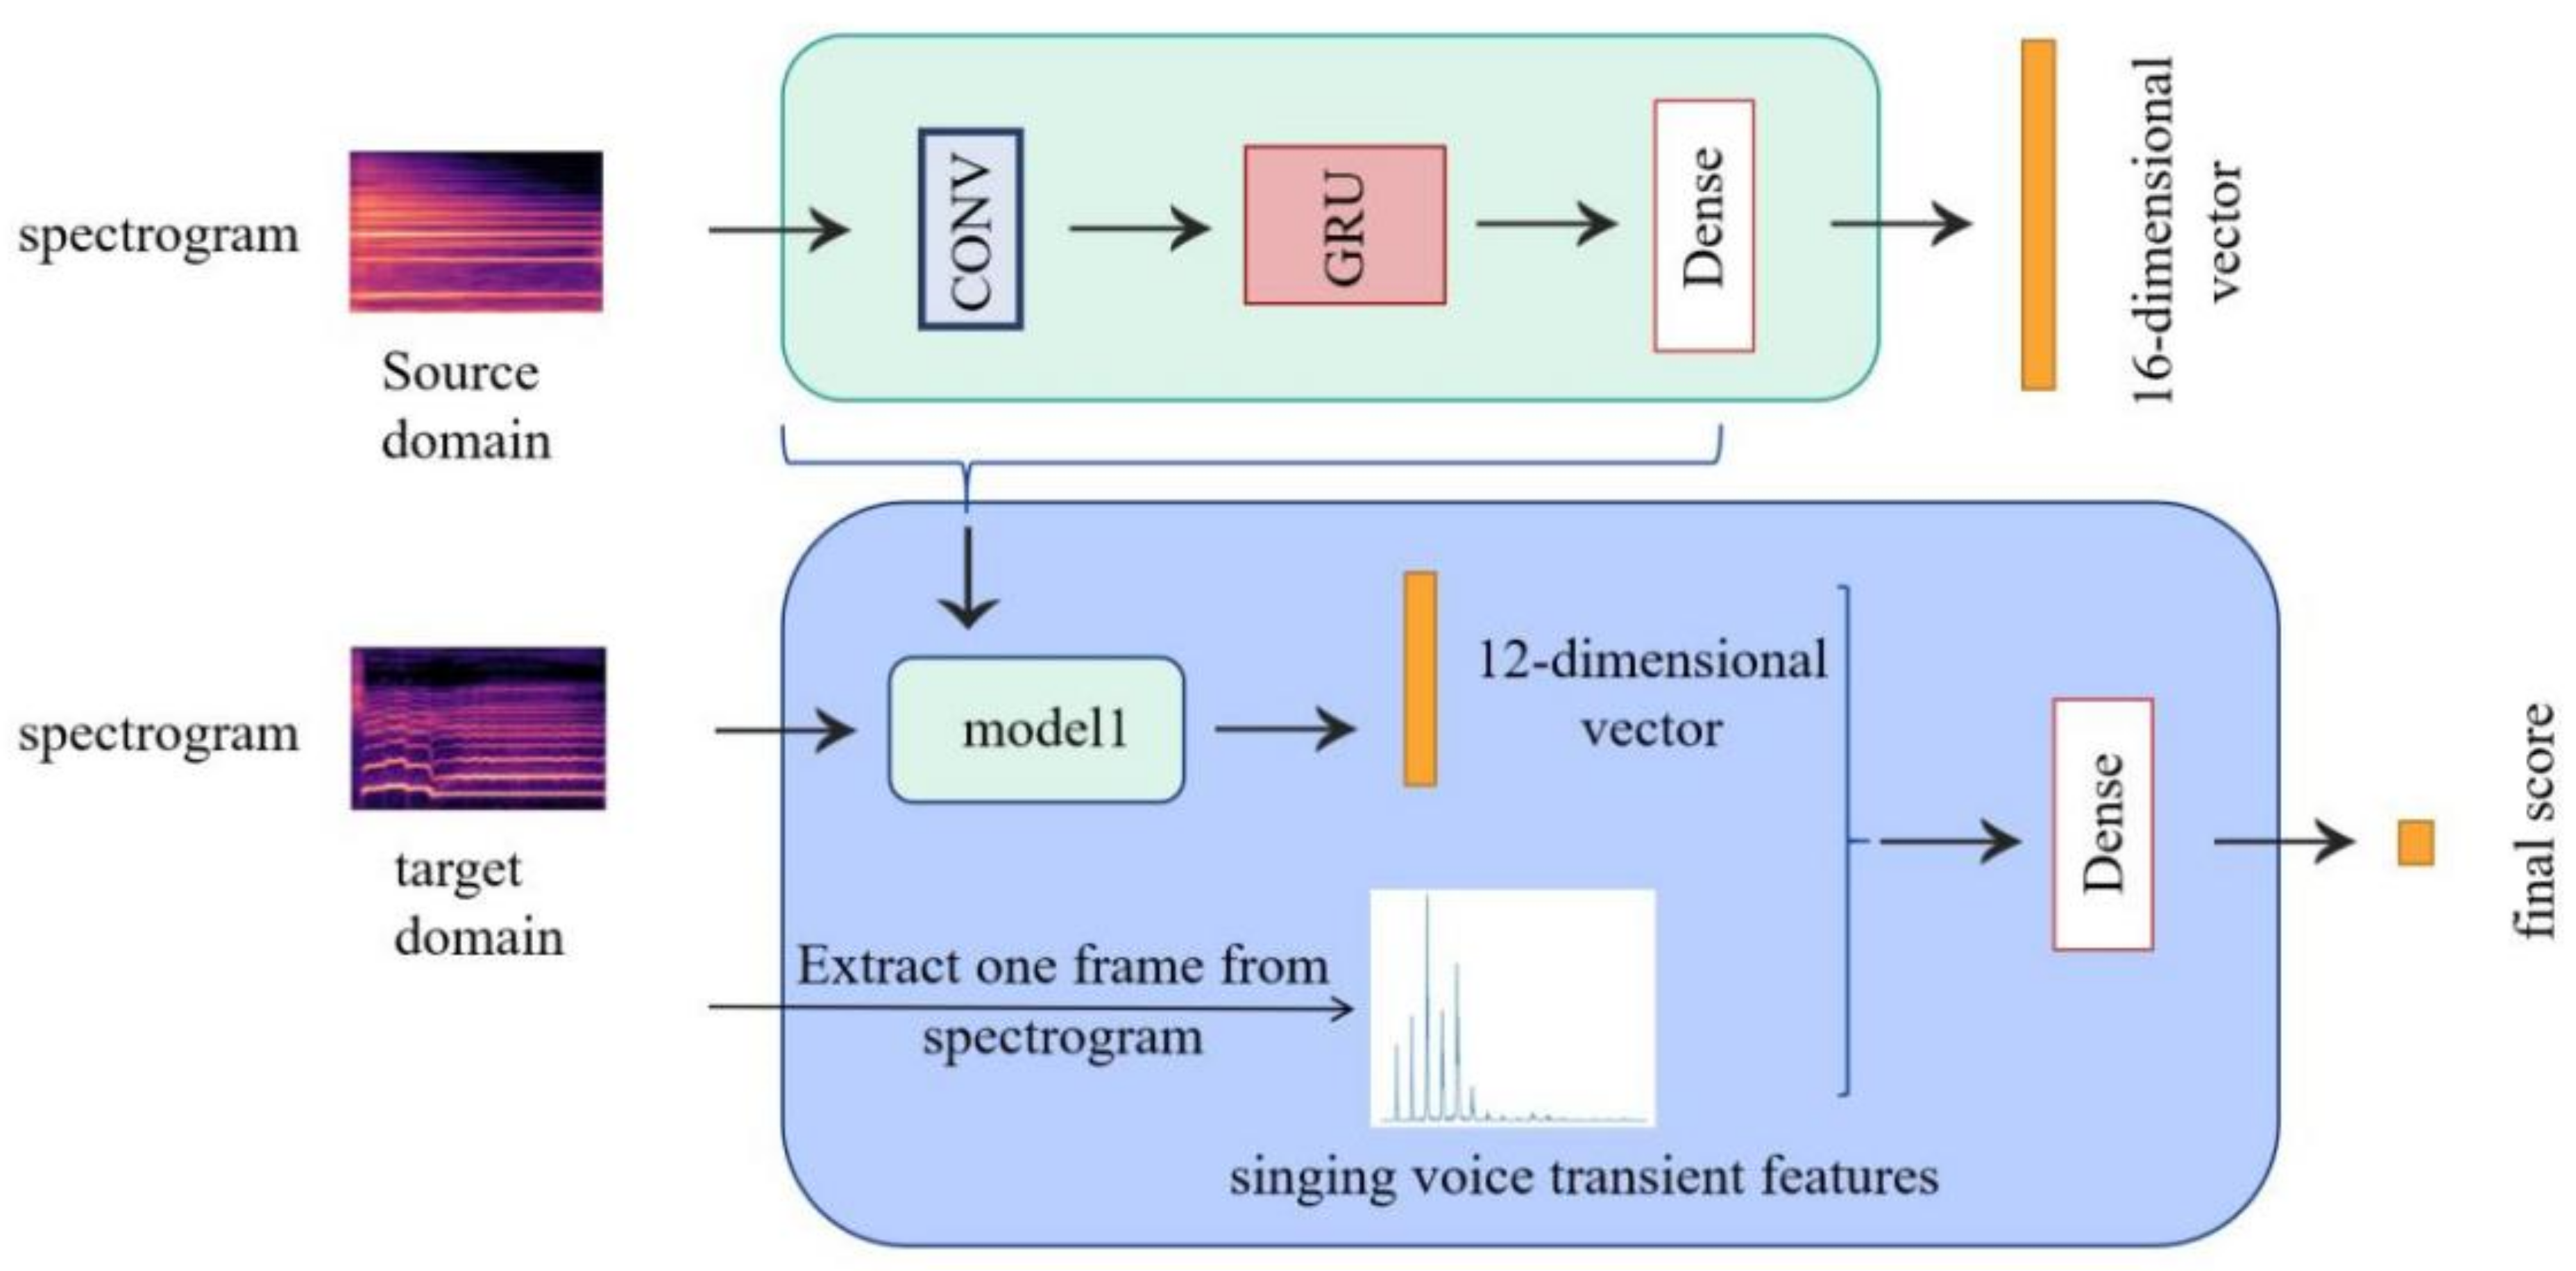
The model significantly improved compared with the contrast model, but this research found that the model has the problem of overfitting from individual sample prediction results. After several experiments, we solved the overfitting problem by modifying the singing-voice timbre-evaluation network into a multi-input network. The final model architecture is shown in Figure 9. When passing twelve-dimensional feature vectors, the singing voice transient features are also added as inputs, which can alleviate the loss due to the existence of the feature vectors and improve the accuracy of singing-voice timbre evaluations. The average cross-entropy loss of the adjusted model is 1.013, which is 34.89% lower than the cross-entropy loss of the contrast model.
Figure 9.
The architecture of the transfer learning model.
5. Results
5.1. Results of Instrument Timbre-Evaluation Model
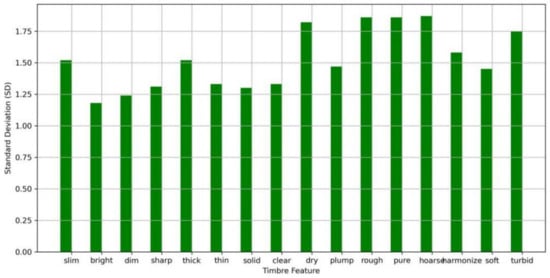
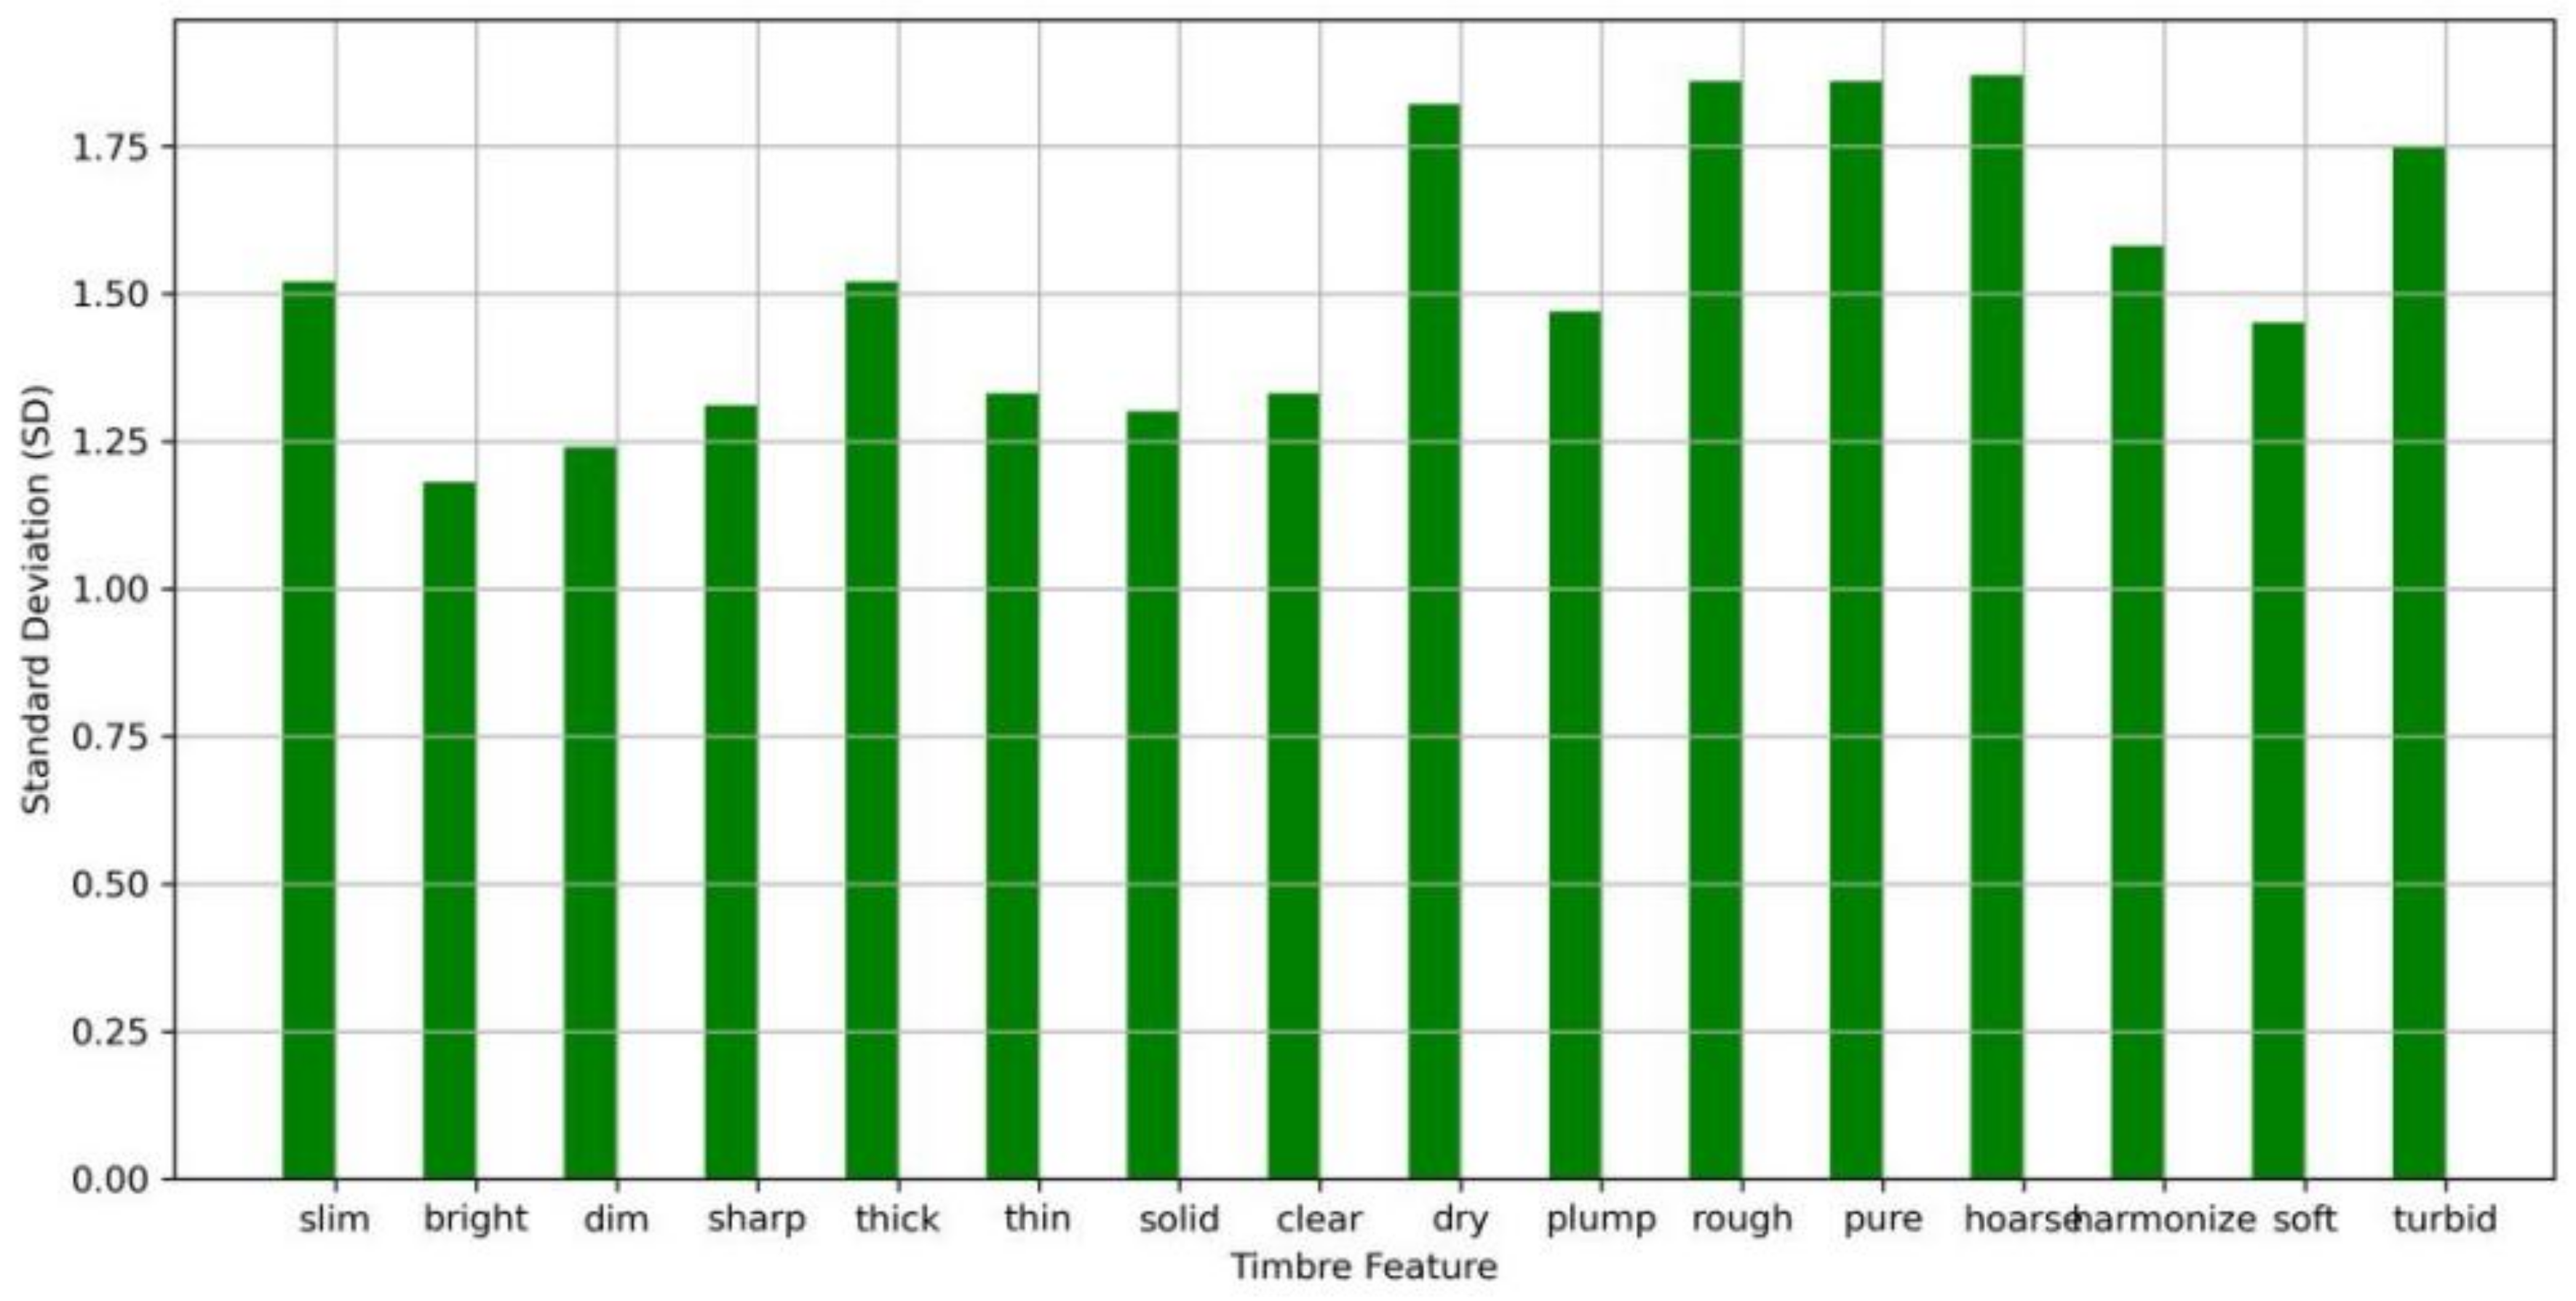
The consistency of judges’ perceptions of terms in the instrument timbre database is shown in Figure 10. There are some variations in the perception of instrument timbre descriptors among judges, which is reflected in the standard deviation, with the standard deviation of timbre evaluation above 1 for all 16 dimensions. Although a standard deviation of 1–2 points is within an acceptable range when analyzed from the perspective of subjective evaluation, it adds difficulty to the experiment when using machine learning.
Figure 10.
The standard deviation of each timbre feature in the dataset.
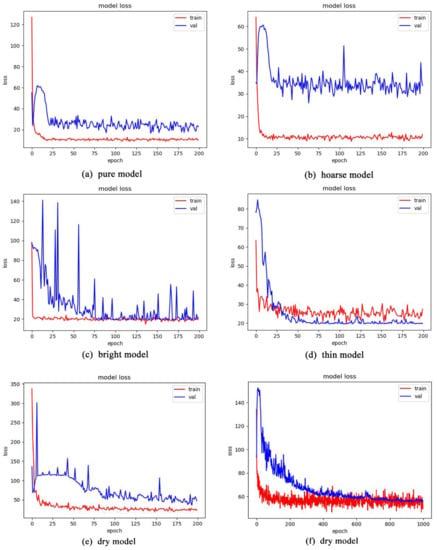
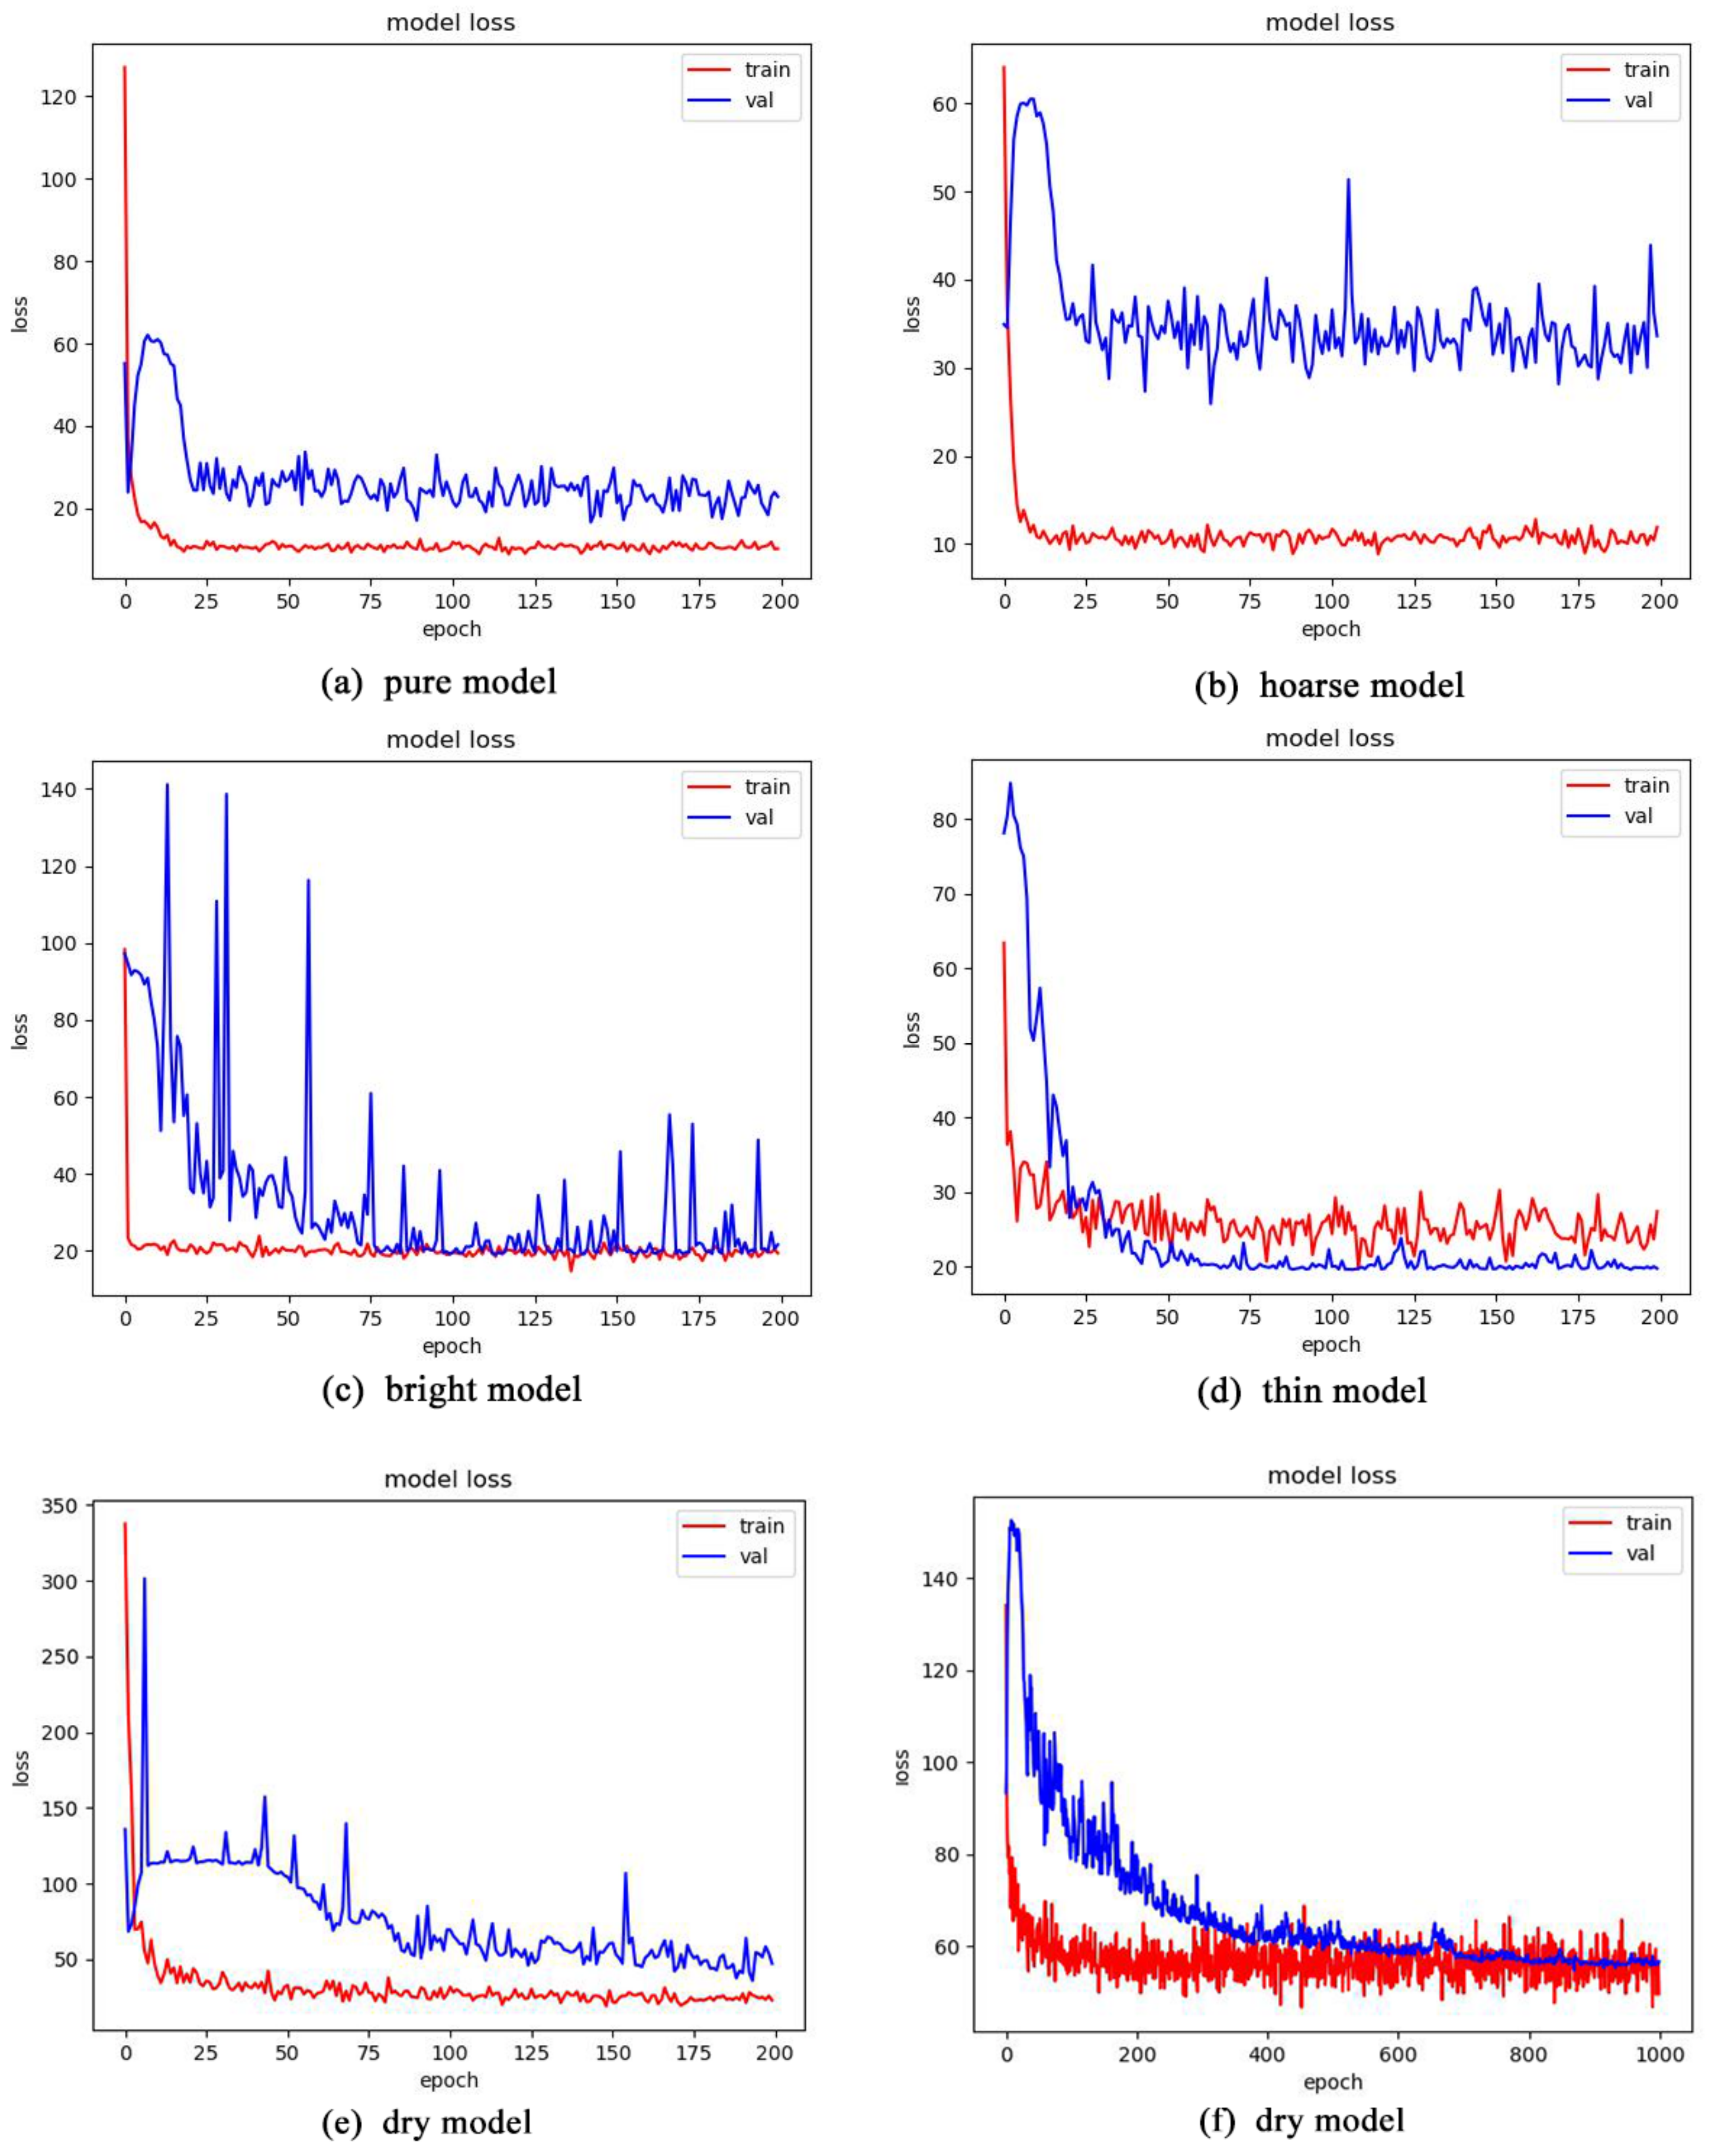
The training set, validation set, and test set were divided according to a ratio of 8:1:1, and 200 epochs were trained with a training time of about 30 min each time. The experiment’s results show that it is appropriate to train each model at 200 epochs. If trained at more epochs, the model does not substantially change and tends to cause overfitting, and if trained with a lower number of epochs, the model will underfit. The 16-dimensional scores of tone evaluation were regressed and analyzed separately. Figure 11 shows the loss of some models.
Figure 11.
Training and validation loss of the instrument timbre-evaluation model: (a) the model of the pure feature, (b) the model of the hoarse feature, (c) the model of the bright feature, (d) the model of thin features, (e) the model of the dry model for 200 epochs, and (f) the model of the dry model for 1000 epochs.
As observed from the figure, the model converges quickly at the beginning of training, and the gap between the loss of the training set and the validation set is large. After stabilization, the loss of the validation set still fluctuates to a certain extent, and this situation may be due to the small amount of data in the validation set and the existence of fortuity.
Multiple training is used to select the optimal parameters for model preservation. This research study chose the average absolute error as the evaluation criterion. The results are shown in Table 4.
Table 4.
Average absolute error loss of each instrument’s timbre-evaluation model.
The results show that the average absolute error of the predicted values fluctuates between 0.9 and 1.8, indicating that the model performs well.
5.2. Results of Singing-Voice Timbre-Evaluation Model
5.2.1. Transfer Learning Model
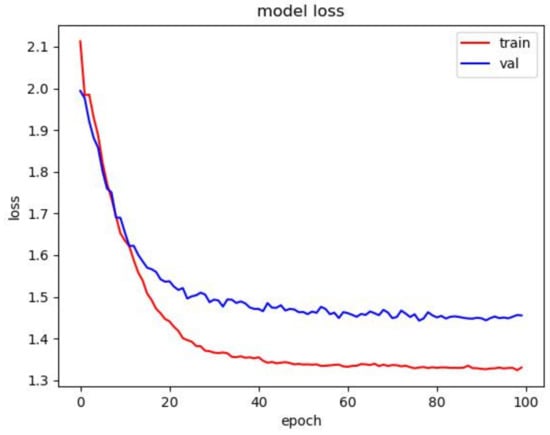
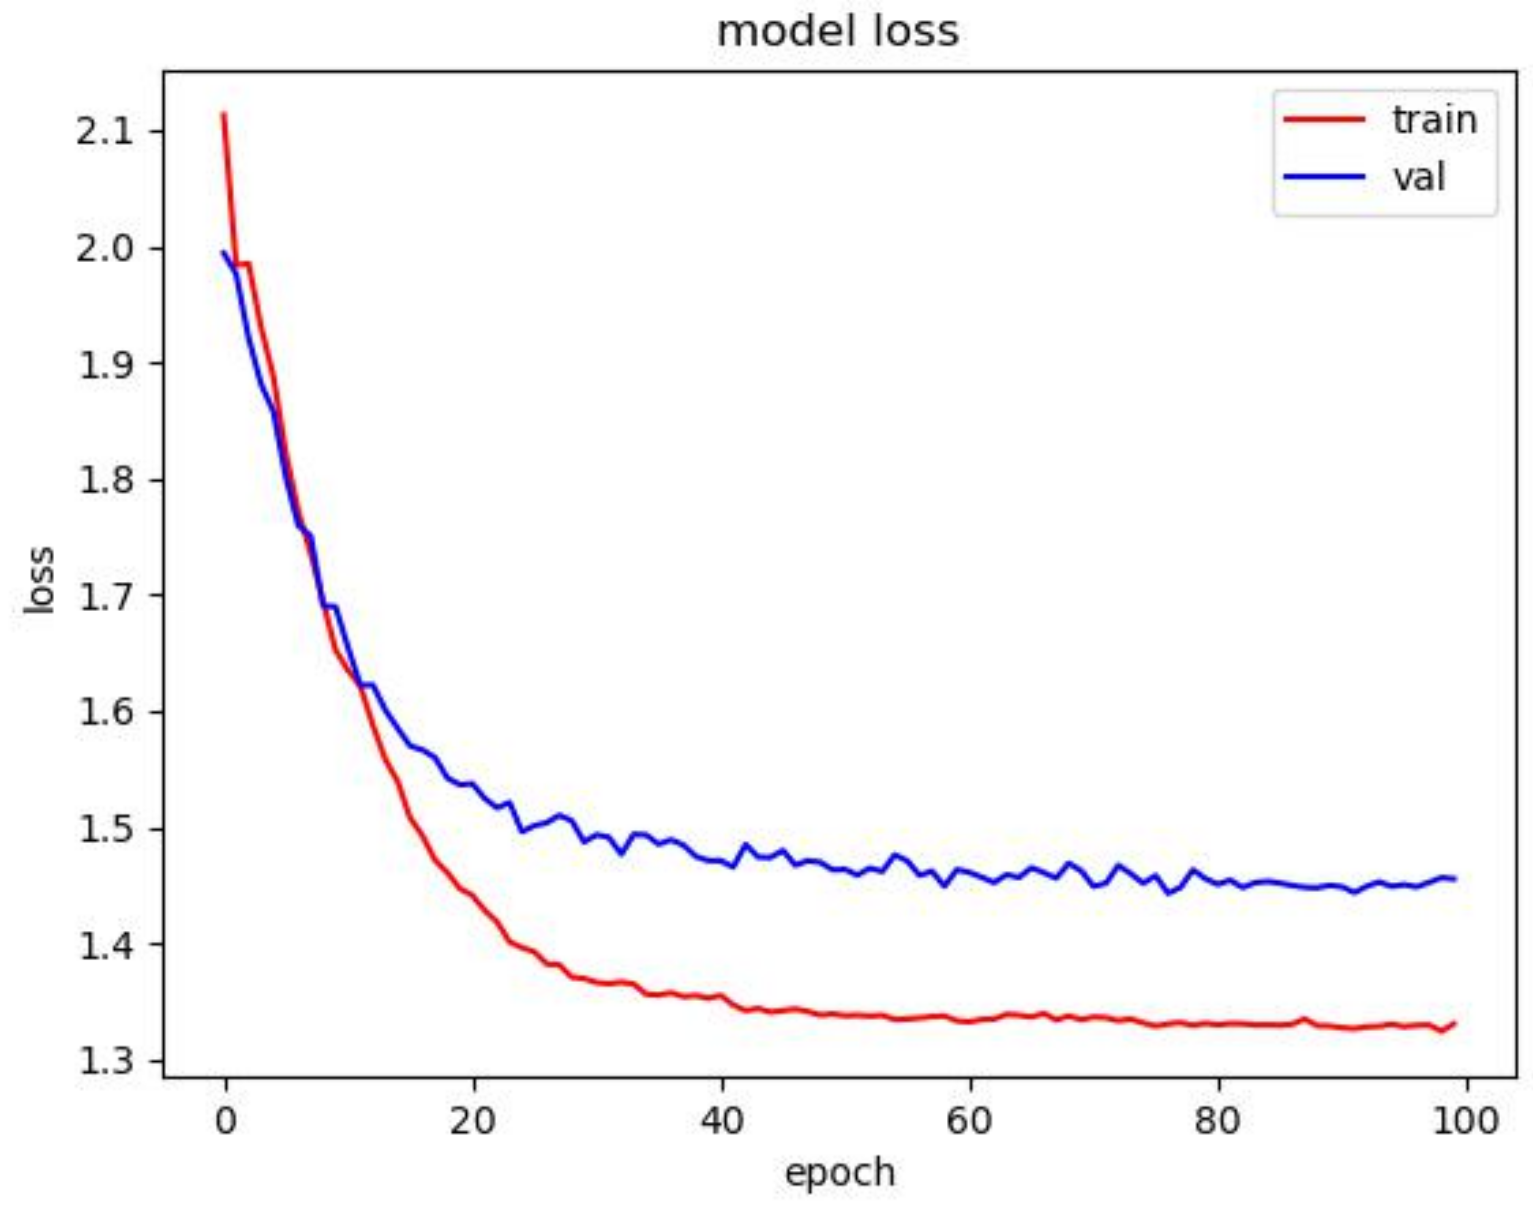
The ratio of the training set to the test set is 9:1, 100 epochs are trained, and the duration of each training is at about 60 min. Figure 12 shows the loss of the model.
Figure 12.
Training and validation loss of the transfer learning model.
Training results converge well, and the prediction results are accurate, which indicates that the network parameters learned based on the instrument timbre-evaluation model have high applicability in singing-voice timbre evaluation. To further verify the experiment’s conclusions, we designed a contrast model.
5.2.2. Contrast Model
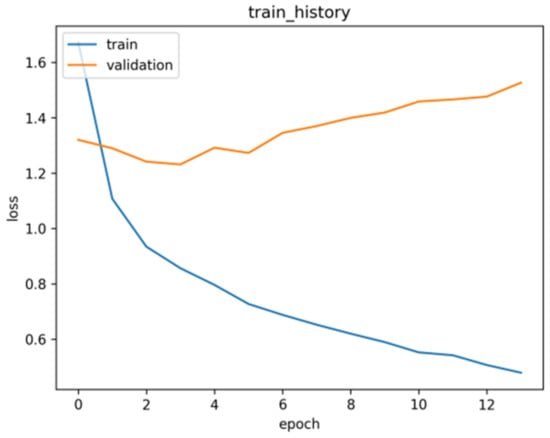
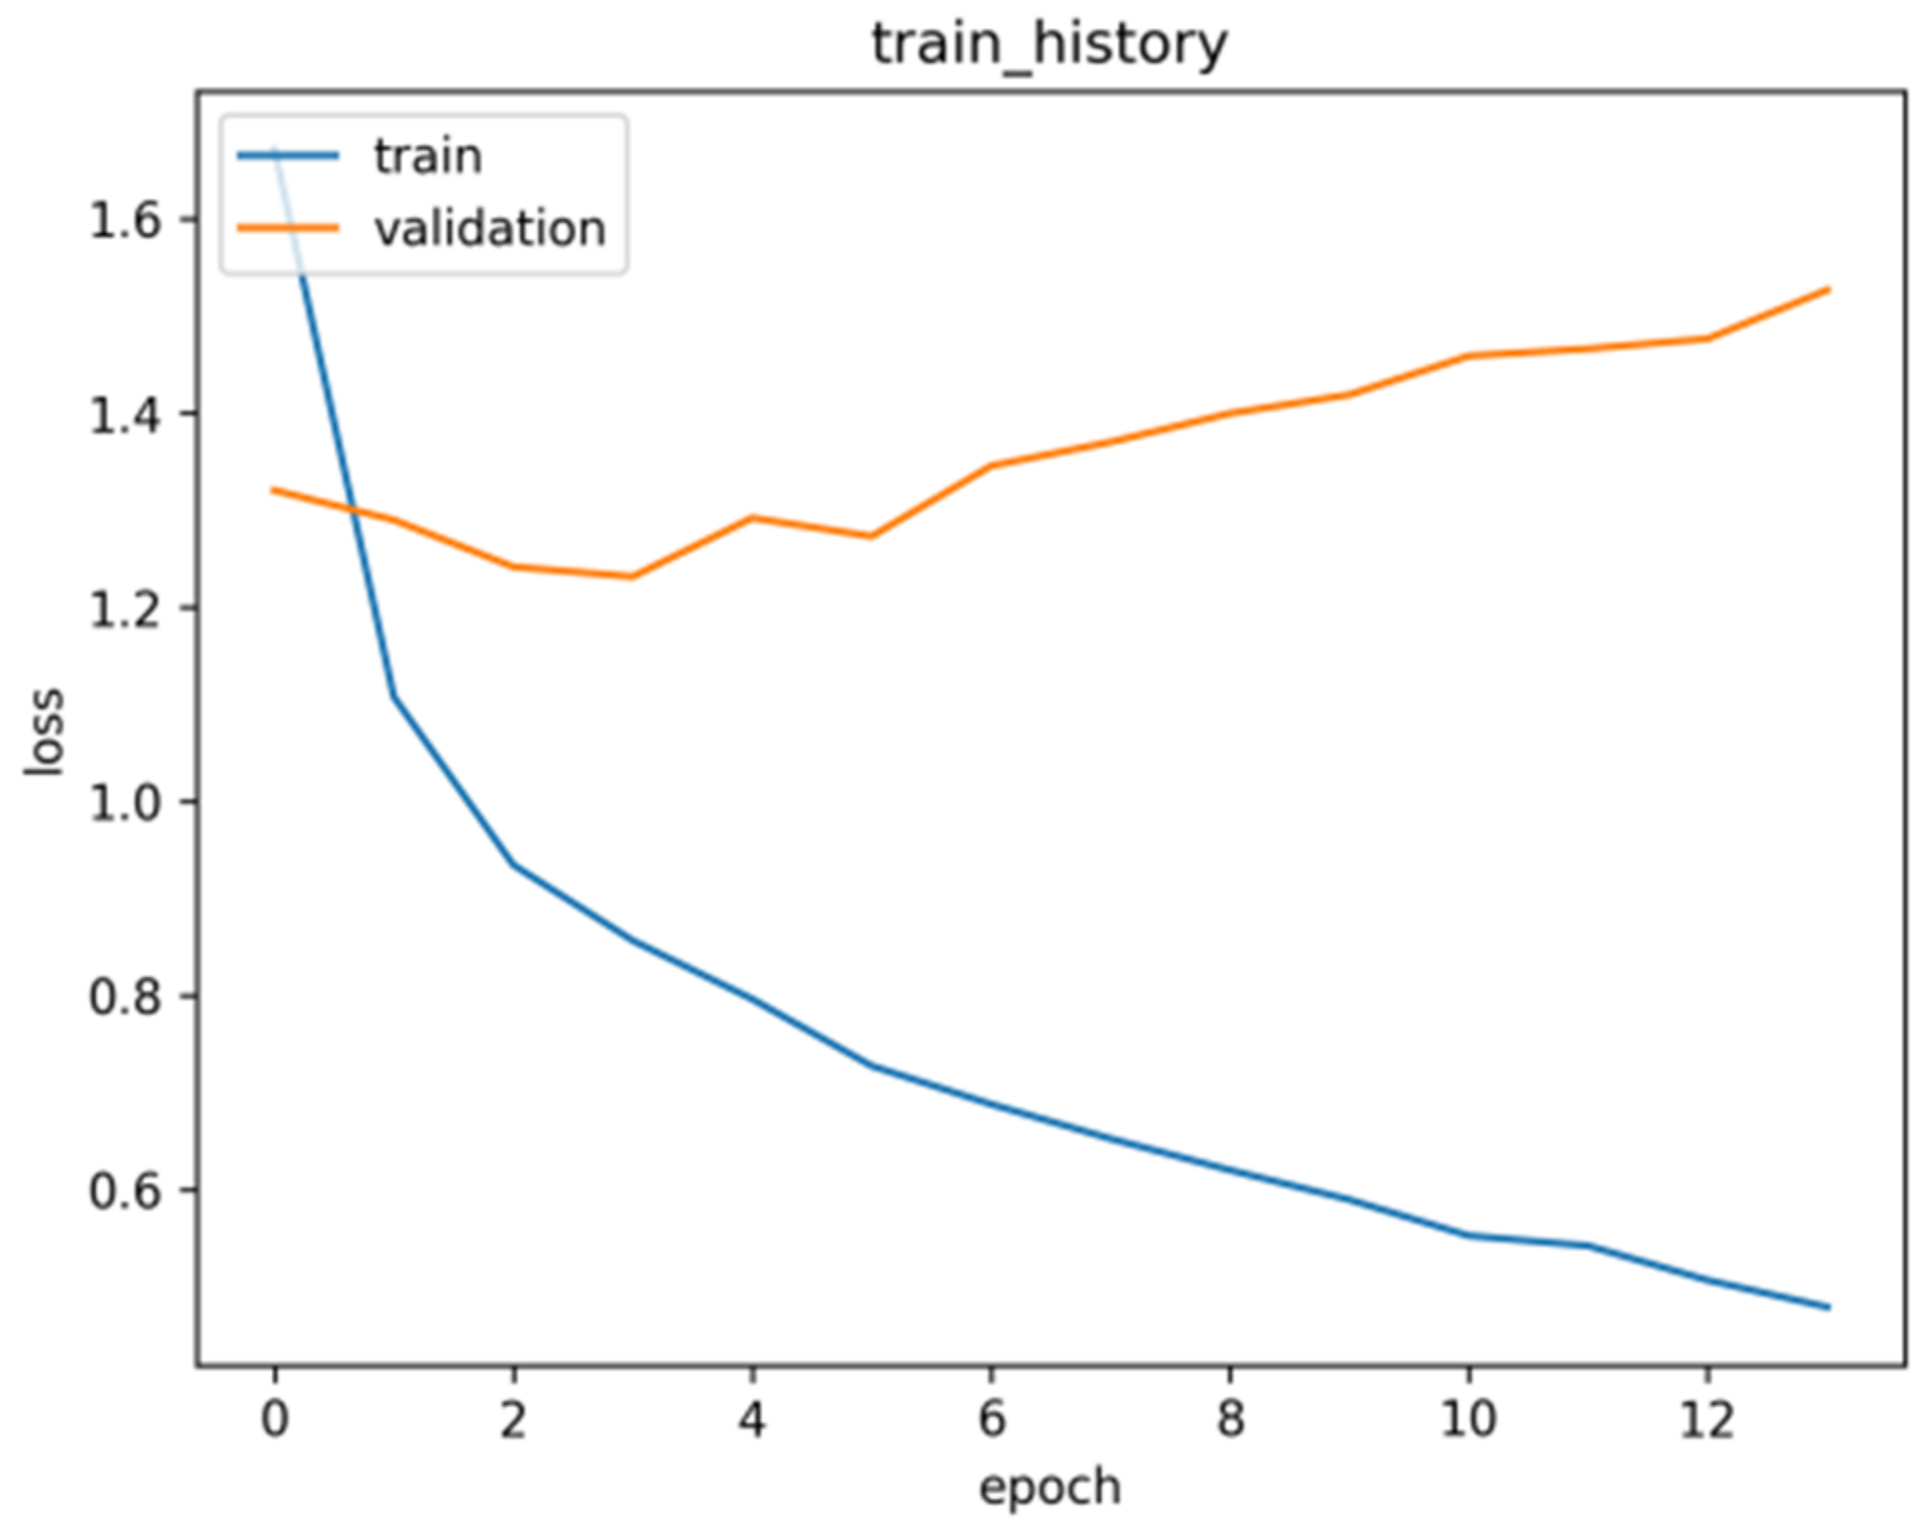
The ratio of the training set to validation set and test set is 8:1:1, 50 epochs are trained, and early stopping is added to prevent overfitting. The duration of each training was at about 5 min. Figure 13 shows the loss of the contrast model.
Figure 13.
Training and validation loss of the contrast model.
It can be seen from the figure that although the model converged quickly, the loss fluctuated widely and overfitting resulted, which can be caused by the following possible reason. The frequency distribution of a moment selected when extracting features has a fortuity. A song is more than 60 s long, and the timbre score of this song is a comprehensive overall score; in contrast, when extracting features, the selected sample can only represent the timbre features of one frame. Although stable audio clips have been filtered, there is instability in the singer’s performance, and this error cannot be eliminated. When a sample that does not match the rating appears in the model, it can significantly affect the training effect of the model.
5.3. Comparison of Results
The distributions were subjected to ten-fold cross-validations to test the model’s effects. The results of the experiments are shown in Table 5.
Table 5.
Comparison of 10-fold cross-validation results between the transfer learning model and contrast model.
The average cross-entropy of the transfer-learning-based model is 1.013, while the average cross-entropy of the contrast model is 1.556. Theoretically, the evaluation dimensions of timbre are similar, so perhaps the instrument timbre evaluation rules are also similar to singing-voice timbre. This project verifies this conclusion by conducting a contrast experiment and proves the feasibility of studying the automatic evaluation of singing-voice timbre based on transfer learning.
6. Discussion
In this research, we explore the method using automatic evaluations of singing-voice timbre and analyze the connection between instrument timbre and singing-voice timbre. This research built a multidimensional instrument timbre-evaluation model and applied knowledge on instrument timbre evaluation to singing-voice timbre evaluation by means of transfer learning. This approach is very effective for solving machine learning problems with small datasets. However, the model has strict restrictions on the type of input and requires procedures with respect to processing and filtering music before it can be scored. However, we believe that the correct rate of evaluation can be improved if more data can be used for the experiment.
In this research, we use two loss functions for the error analysis of multiple evaluation labels. The average weighted loss function is suitable for the case of inconsistent data distributions but not interval concentration. The cross-entropy loss function is better adapted for the case with more outliers. These two functions are also generalizable for other evaluation tasks.
The research focuses on Chinese folk music and songs with Chinese lyrics. In the near future, we intend to improve our experiments with more types of music in order to observe the generalization of our method in a broader context. We plan to study the automatic evaluation of timbre in combination with more features of the temporal envelope curve and plan to study a comprehensive analysis of the timbre performance of an entire piece of music. The experimental results imply that there may be a correlation between the human ear’s perception of instrument timbre and singing-voice timbre, which provides inspiration for future research on timbre studies and related auditory-type tasks.
Author Contributions
Methodology, R.L. and M.Z.; formal analysis, R.L. and M.Z.; investigation, R.L. and M.Z.; writing—original draft preparation, R.L. and M.Z. All authors have read and agreed to the published version of the manuscript.
Funding
This research received no external funding.
Institutional Review Board Statement
Not applicable.
Informed Consent Statement
Not applicable.
Data Availability Statement
Data were obtained from CCMUSIC DATASET and are available at https://ccmusic-database.github.io/overview.html with the permission of CCMUSIC (accessed on 12 November 2021).
Conflicts of Interest
The authors declare no conflict of interest.
References
- Cao, C.; Li, M.; Liu, J.; Yan, Y. A study on singing performance evaluation criteria for untrained singers. In Proceedings of the IEEE 2008 9th International Conference on Signal Processing, Beijing, China, 26–29 October 2008; pp. 1475–1478. [Google Scholar]
- McAdams, S.; Giordano, B.L. The perception of musical timbre. In The Oxford Handbook of Music Psychology; Oxford University Press: Oxford, UK, 2009; pp. 72–80. [Google Scholar]
- Jianmin, L. On the timbre of music in vocal singing. J. Henan Univ. Soc. Sci. Ed. 2009, 49, 143–147. [Google Scholar]
- Bertin-Mahieux, T.; Ellis, D.P.; Whitman, B.; Lamere, P. The Million Song Dataset. In Proceedings of the 12th International Society for Music Information Retrieval Conference (ISMIR 2011), Miami, FL, USA, 24–28 October 2011. [Google Scholar]
- Rafii, Z.; Liutkus, A.; Stöter, F.R.; Mimilakis, S.I.; Bittner, R. MUSDB18—A Corpus for Music Separation (1.0.0) [Data Set]; Zenodo: Montpellier, French, 2017. [Google Scholar]
- Hung, H.-T.; Ching, J.; Doh, S.; Kim, N.; Nam, J.; Yang, Y.-H. EMOPIA: A Multi-Modal Pop Piano Dataset For Emotion Recognition and Emotion-based Music Generation. In Proceedings of the 22nd International Society for Music Information Retrieval Conference, Online, 7–12 November 2021; pp. 318–325. [Google Scholar]
- Liu, Z.; Li, Z. Music Data Sharing Platform for Computational Musicology Research (CCMUSIC DATASET); Zenodo: Beijing, China, 2021. [Google Scholar]
- Pons, J.; Slizovskaia, O.; Gong, R.; Gómez, E.; Serra, X. Timbre analysis of music audio signals with convolutional neural networks. In Proceedings of the IEEE 2017 25th European Signal Processing Conference (EUSIPCO), Kos, Greece, 28 August–2 September 2017; pp. 2744–2748. [Google Scholar]
- Jiang, W.; Liu, J.; Li, Z.; Zhu, J.; Zhang, X.; Wang, S. Analysis and modeling of timbre perception features of chinese musical instruments. In Proceedings of the 2019 IEEE/ACIS 18th International Conference on Computer and Information Science (ICIS), Beijing, China, 17–19 June 2019; pp. 191–195. [Google Scholar]
- Yiliang, J.; Qiuheng, S.; Xiaojing, L.; Zijin, L.; Wei, L. Color Analysis of National Musical Instruments based on objective characteristics. J. Fudan Univ. 2020, 59, 346–353. [Google Scholar]
- Saitis, C.; Siedenburg, K. Brightness perception for musical instrument sounds: Relation to timbre dissimilarity and source-cause categories. J. Acoust. Soc. Am. 2020, 148, 2256–2266. [Google Scholar] [CrossRef] [Scilit] [PubMed]
- Poli, G.D. Methodologies for expressiveness modelling of and for music performance. J. New Music Res. 2004, 33, 189–202. [Google Scholar] [CrossRef] [Scilit]
- Gupta, C.; Li, H.; Wang, Y. Perceptual evaluation of singing quality. In Proceedings of the IEEE 2017 Asia-Pacific Signal and Information Processing Association Annual Summit and Conference (APSIPA ASC), Kuala Lumpur, Malaysia, 12–15 December 2017; pp. 577–586. [Google Scholar]
- Lee, J.; Choi, H.S.; Koo, J.; Lee, K. Disentangling timbre and singing style with multi-singer singing synthesis system. In Proceedings of the ICASSP 2020—2020 IEEE International Conference on Acoustics, Speech and Signal Processing (ICASSP), Barcelona, Spain, 4–8 May 2020; pp. 7224–7228. [Google Scholar]
- Kim, J.W.; Salamon, J.; Li, P.; Bello, J.P. Crepe: A Convolutional Representation for Pitch Estimation. In Proceedings of the 2018 IEEE International Conference on Acoustics, Speech and Signal Processing (ICASSP), Calgary, AB, Canada, 15–20 April 2018; pp. 161–165. [Google Scholar] [CrossRef] [Scilit]
- Shi, B.; Bai, X.; Yao, C. An end-to-end trainable neural network for image-based sequence recognition and its application to scene text recognition. IEEE Trans. Pattern Anal. Mach. Intell. 2016, 39, 2298–2304. [Google Scholar] [CrossRef] [Scilit] [PubMed]

Publisher’s Note: MDPI stays neutral with regard to jurisdictional claims in published maps and institutional affiliations. |
© 2022 by the authors. Licensee MDPI, Basel, Switzerland. This article is an open access article distributed under the terms and conditions of the Creative Commons Attribution (CC BY) license (https://creativecommons.org/licenses/by/4.0/).