

Dynamic Response and Geogrid Strain Analysis of GRS Retaining Wall


Abstract
1. Introduction
2. Model Tests
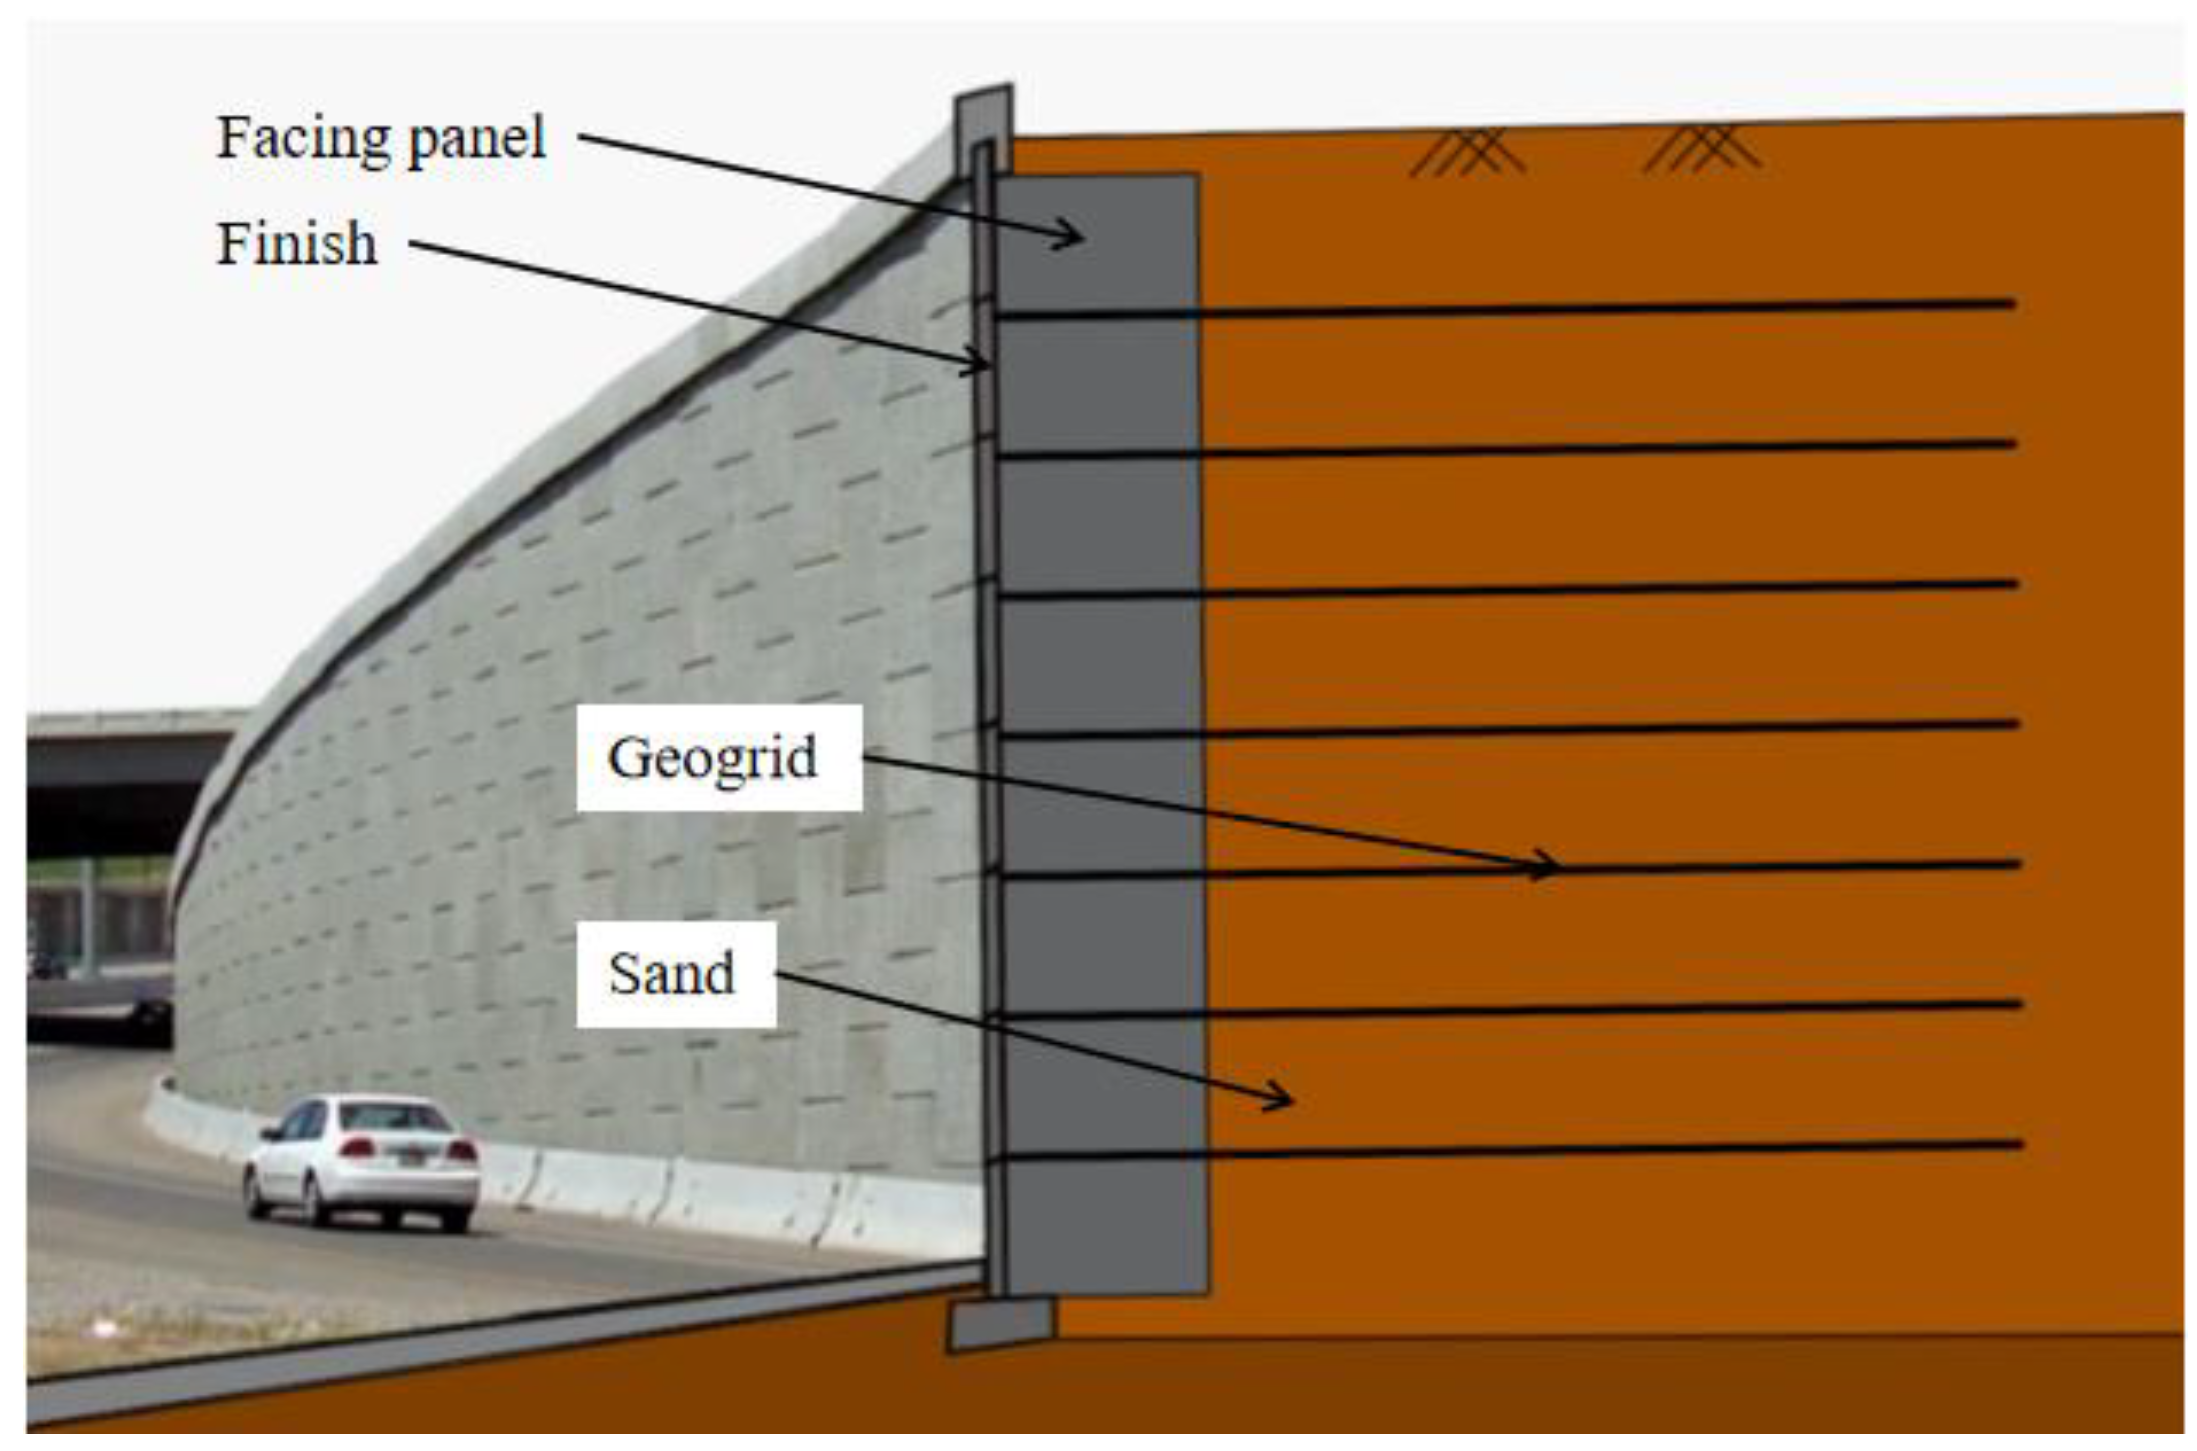
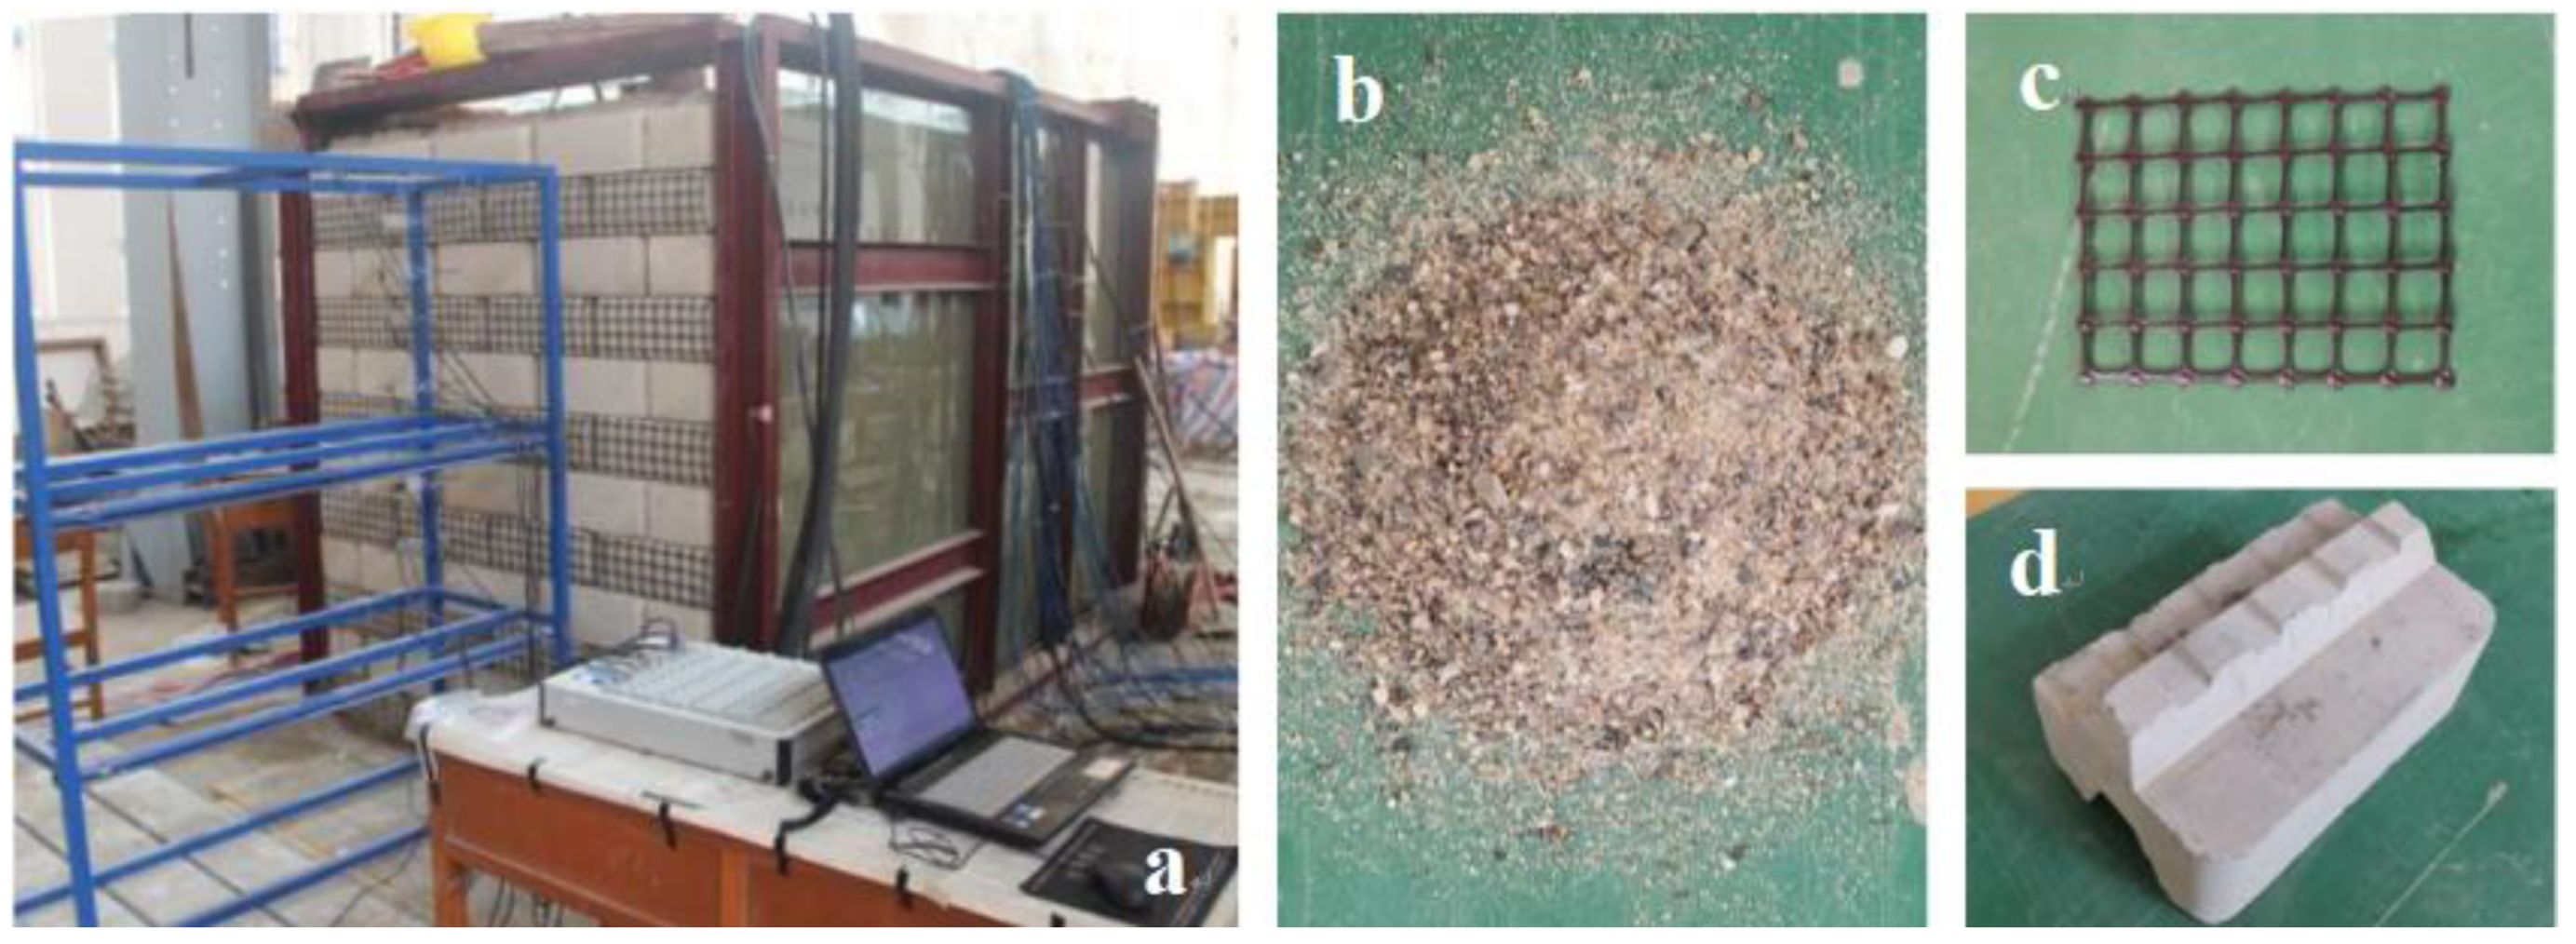
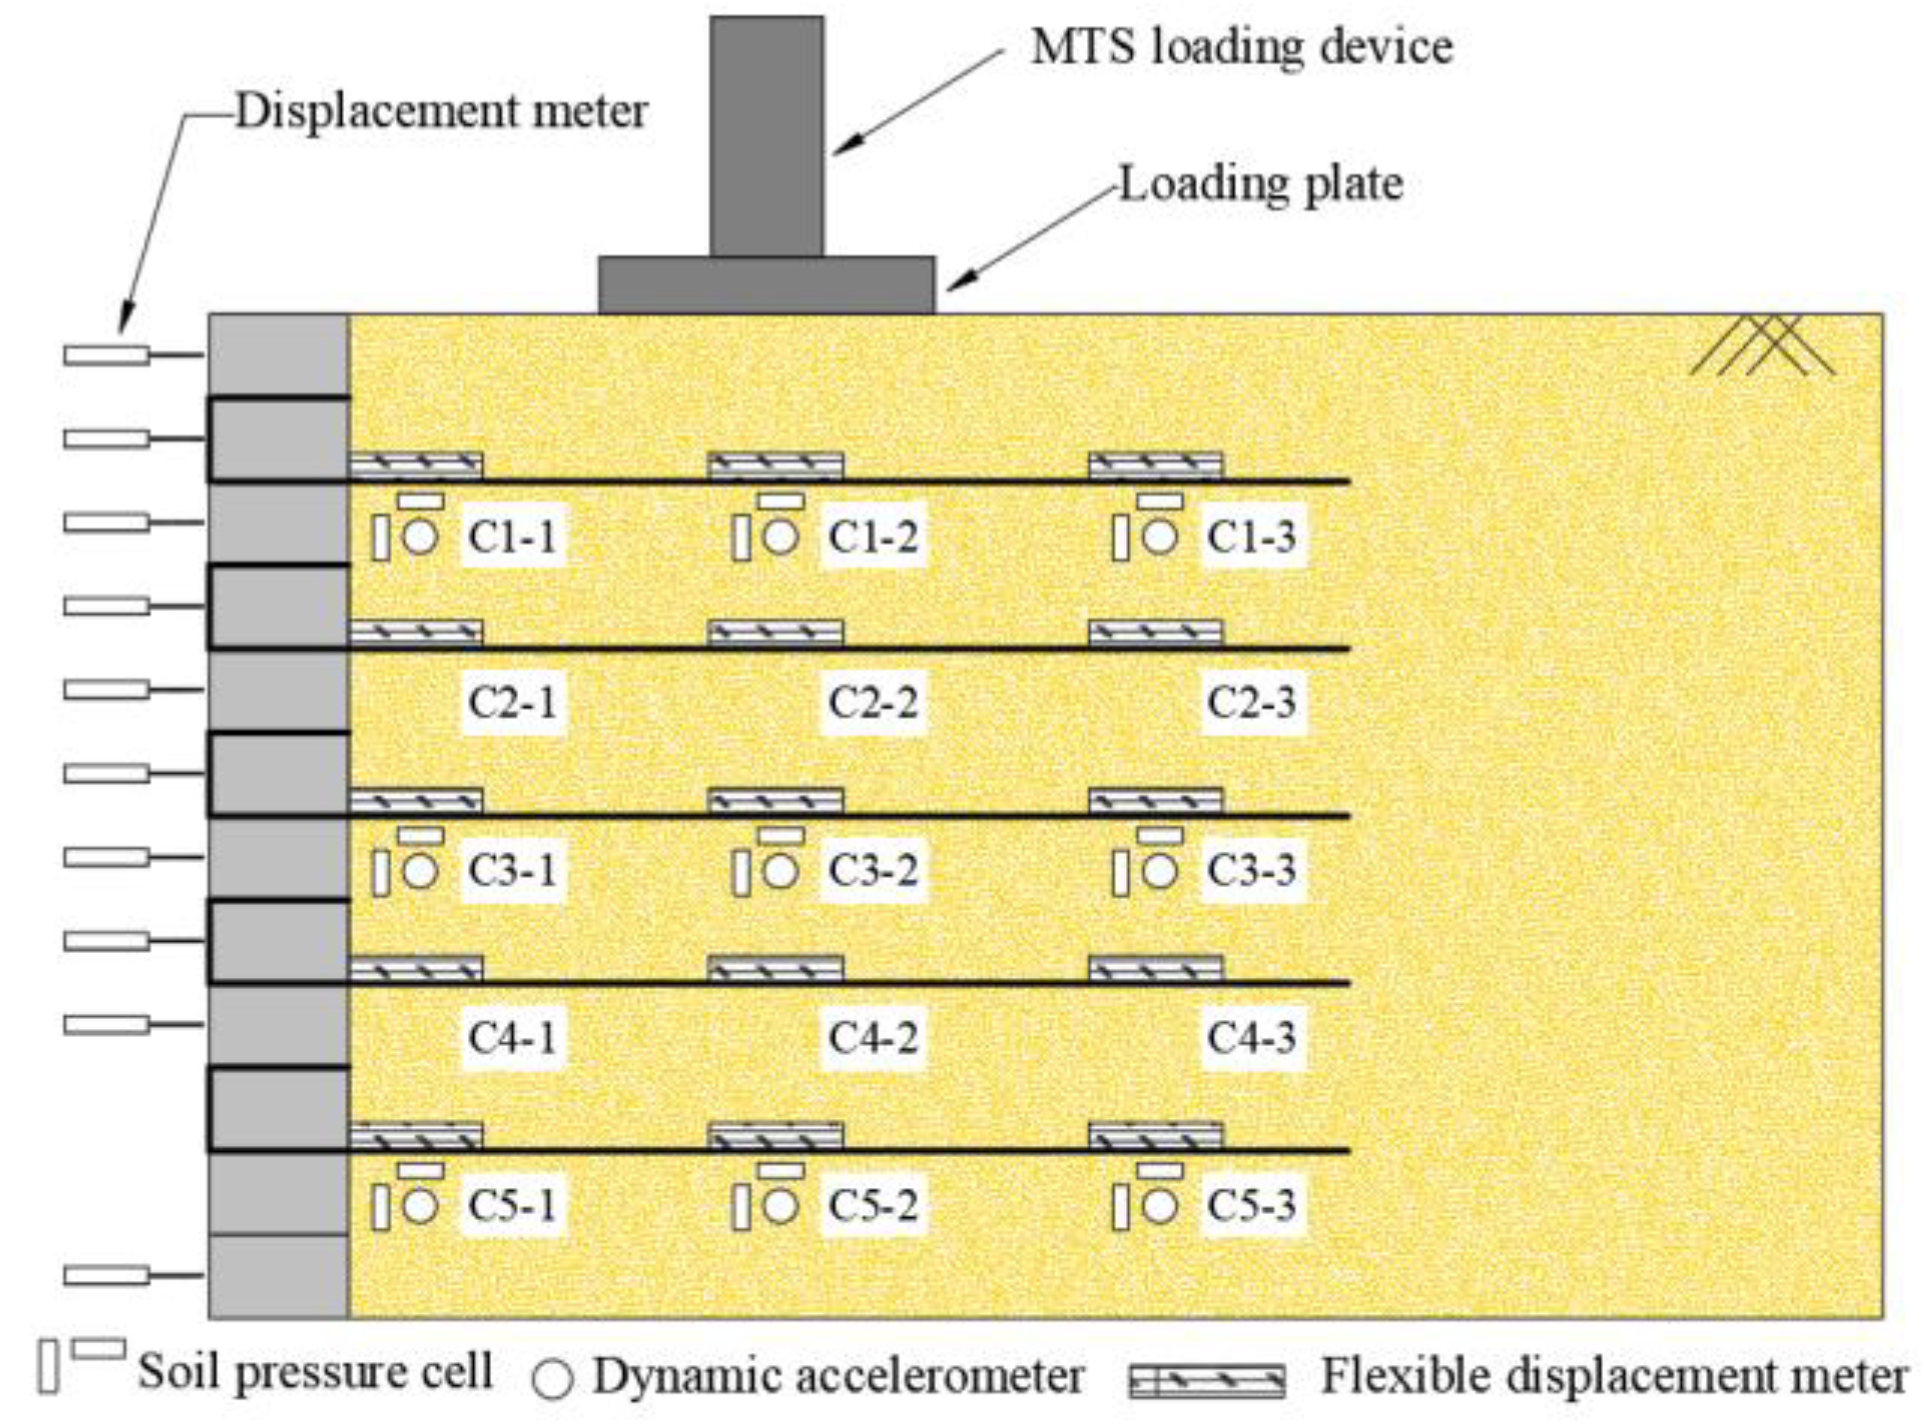
2.1. Test Model
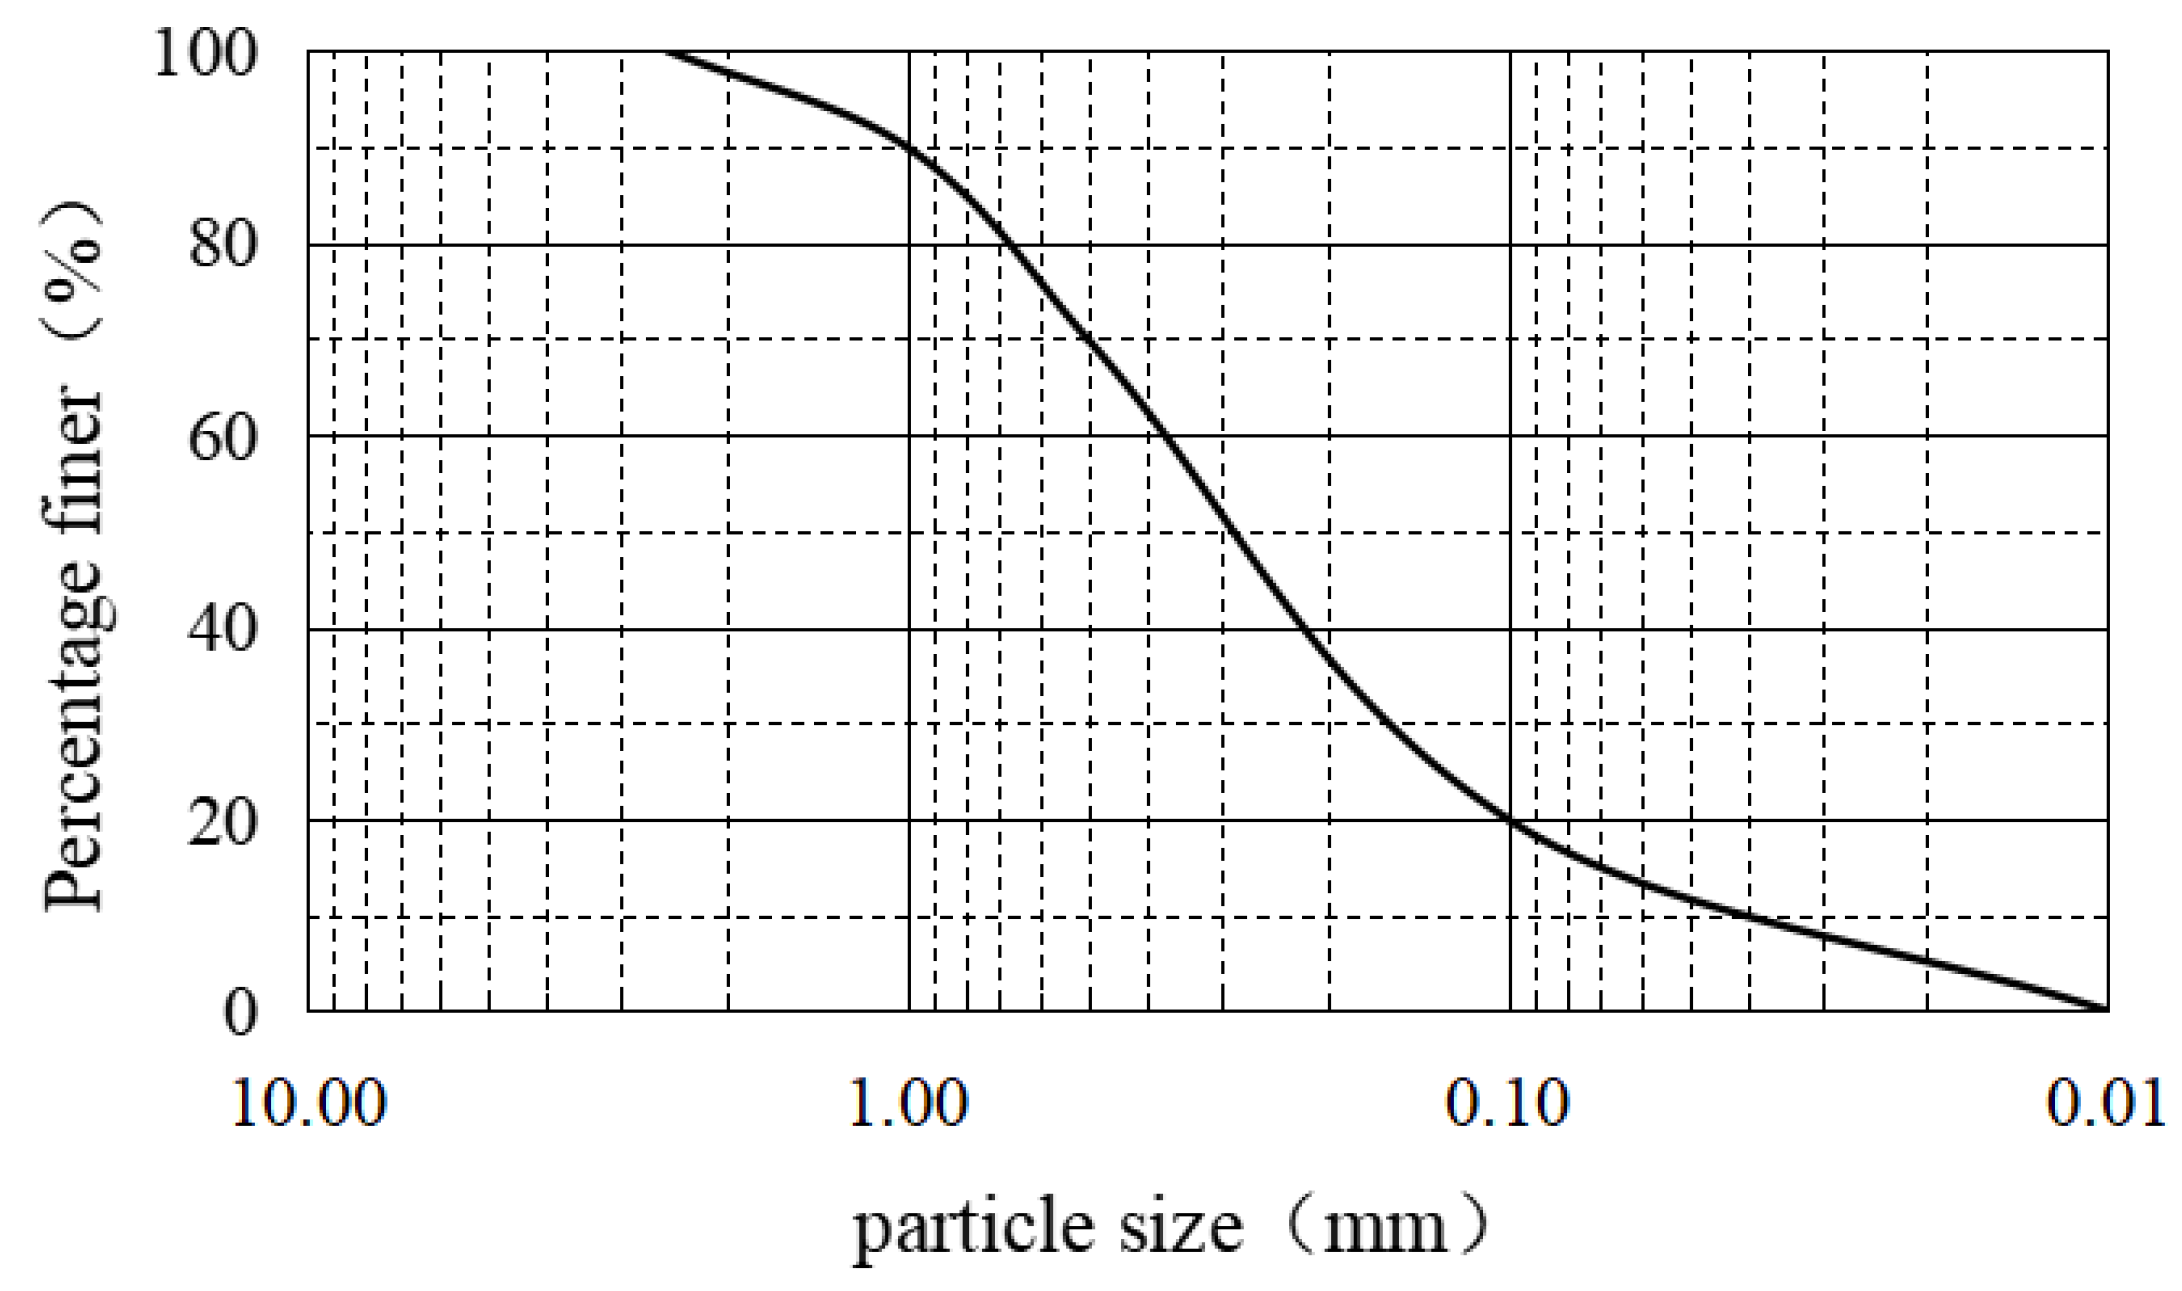
2.2. Test Materials
2.3. Test Scheme
3. Test Results and Analysis
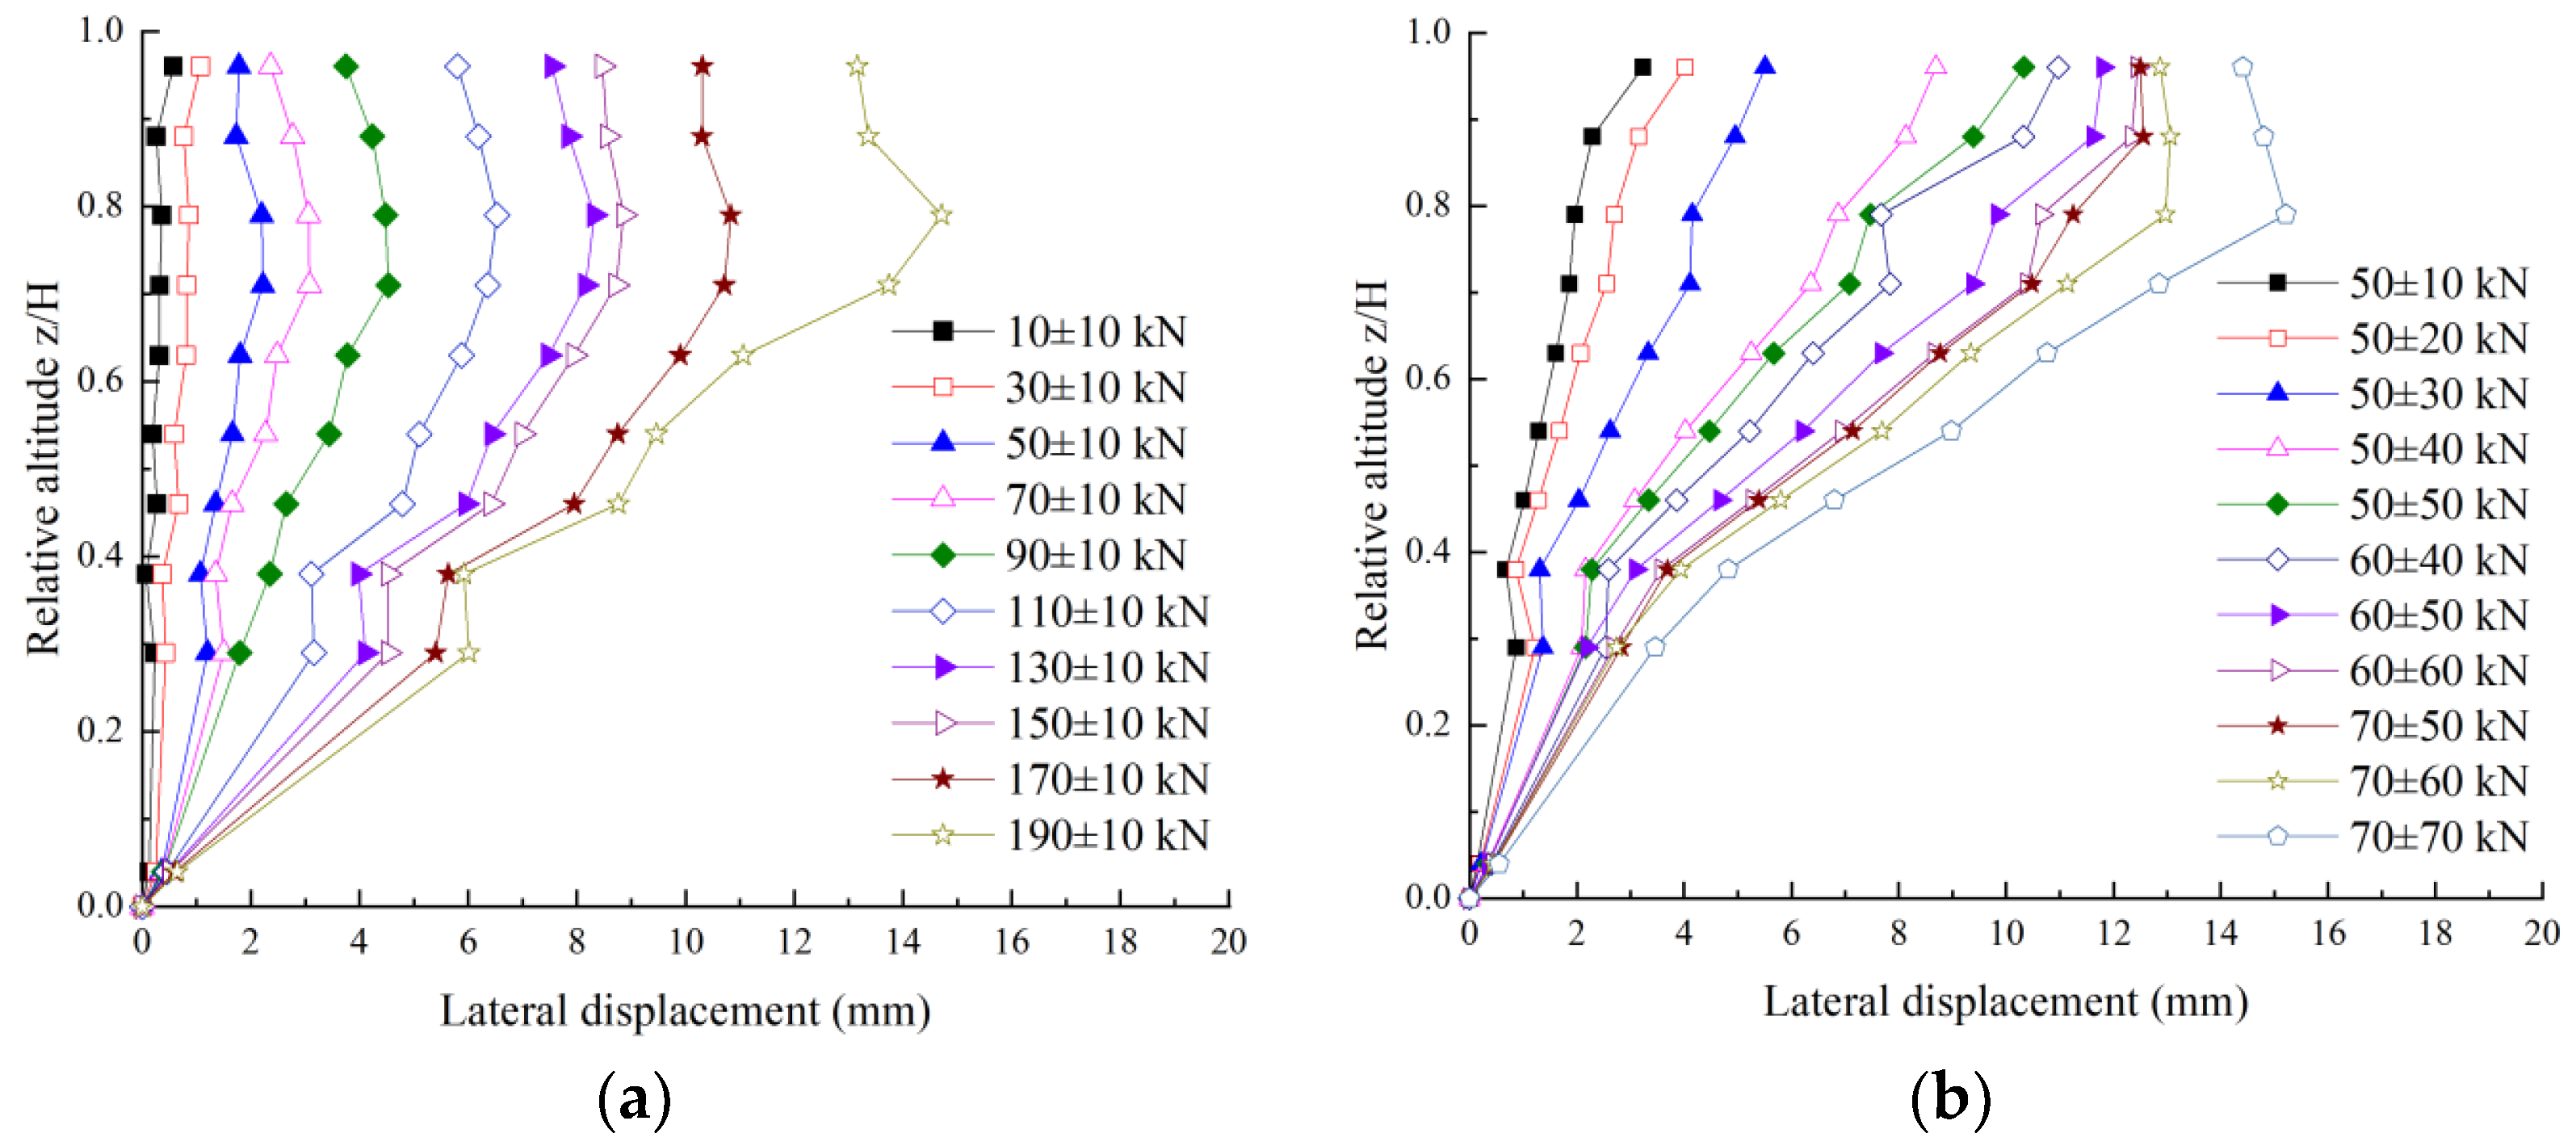
3.1. Lateral Deformation of Wall Facing
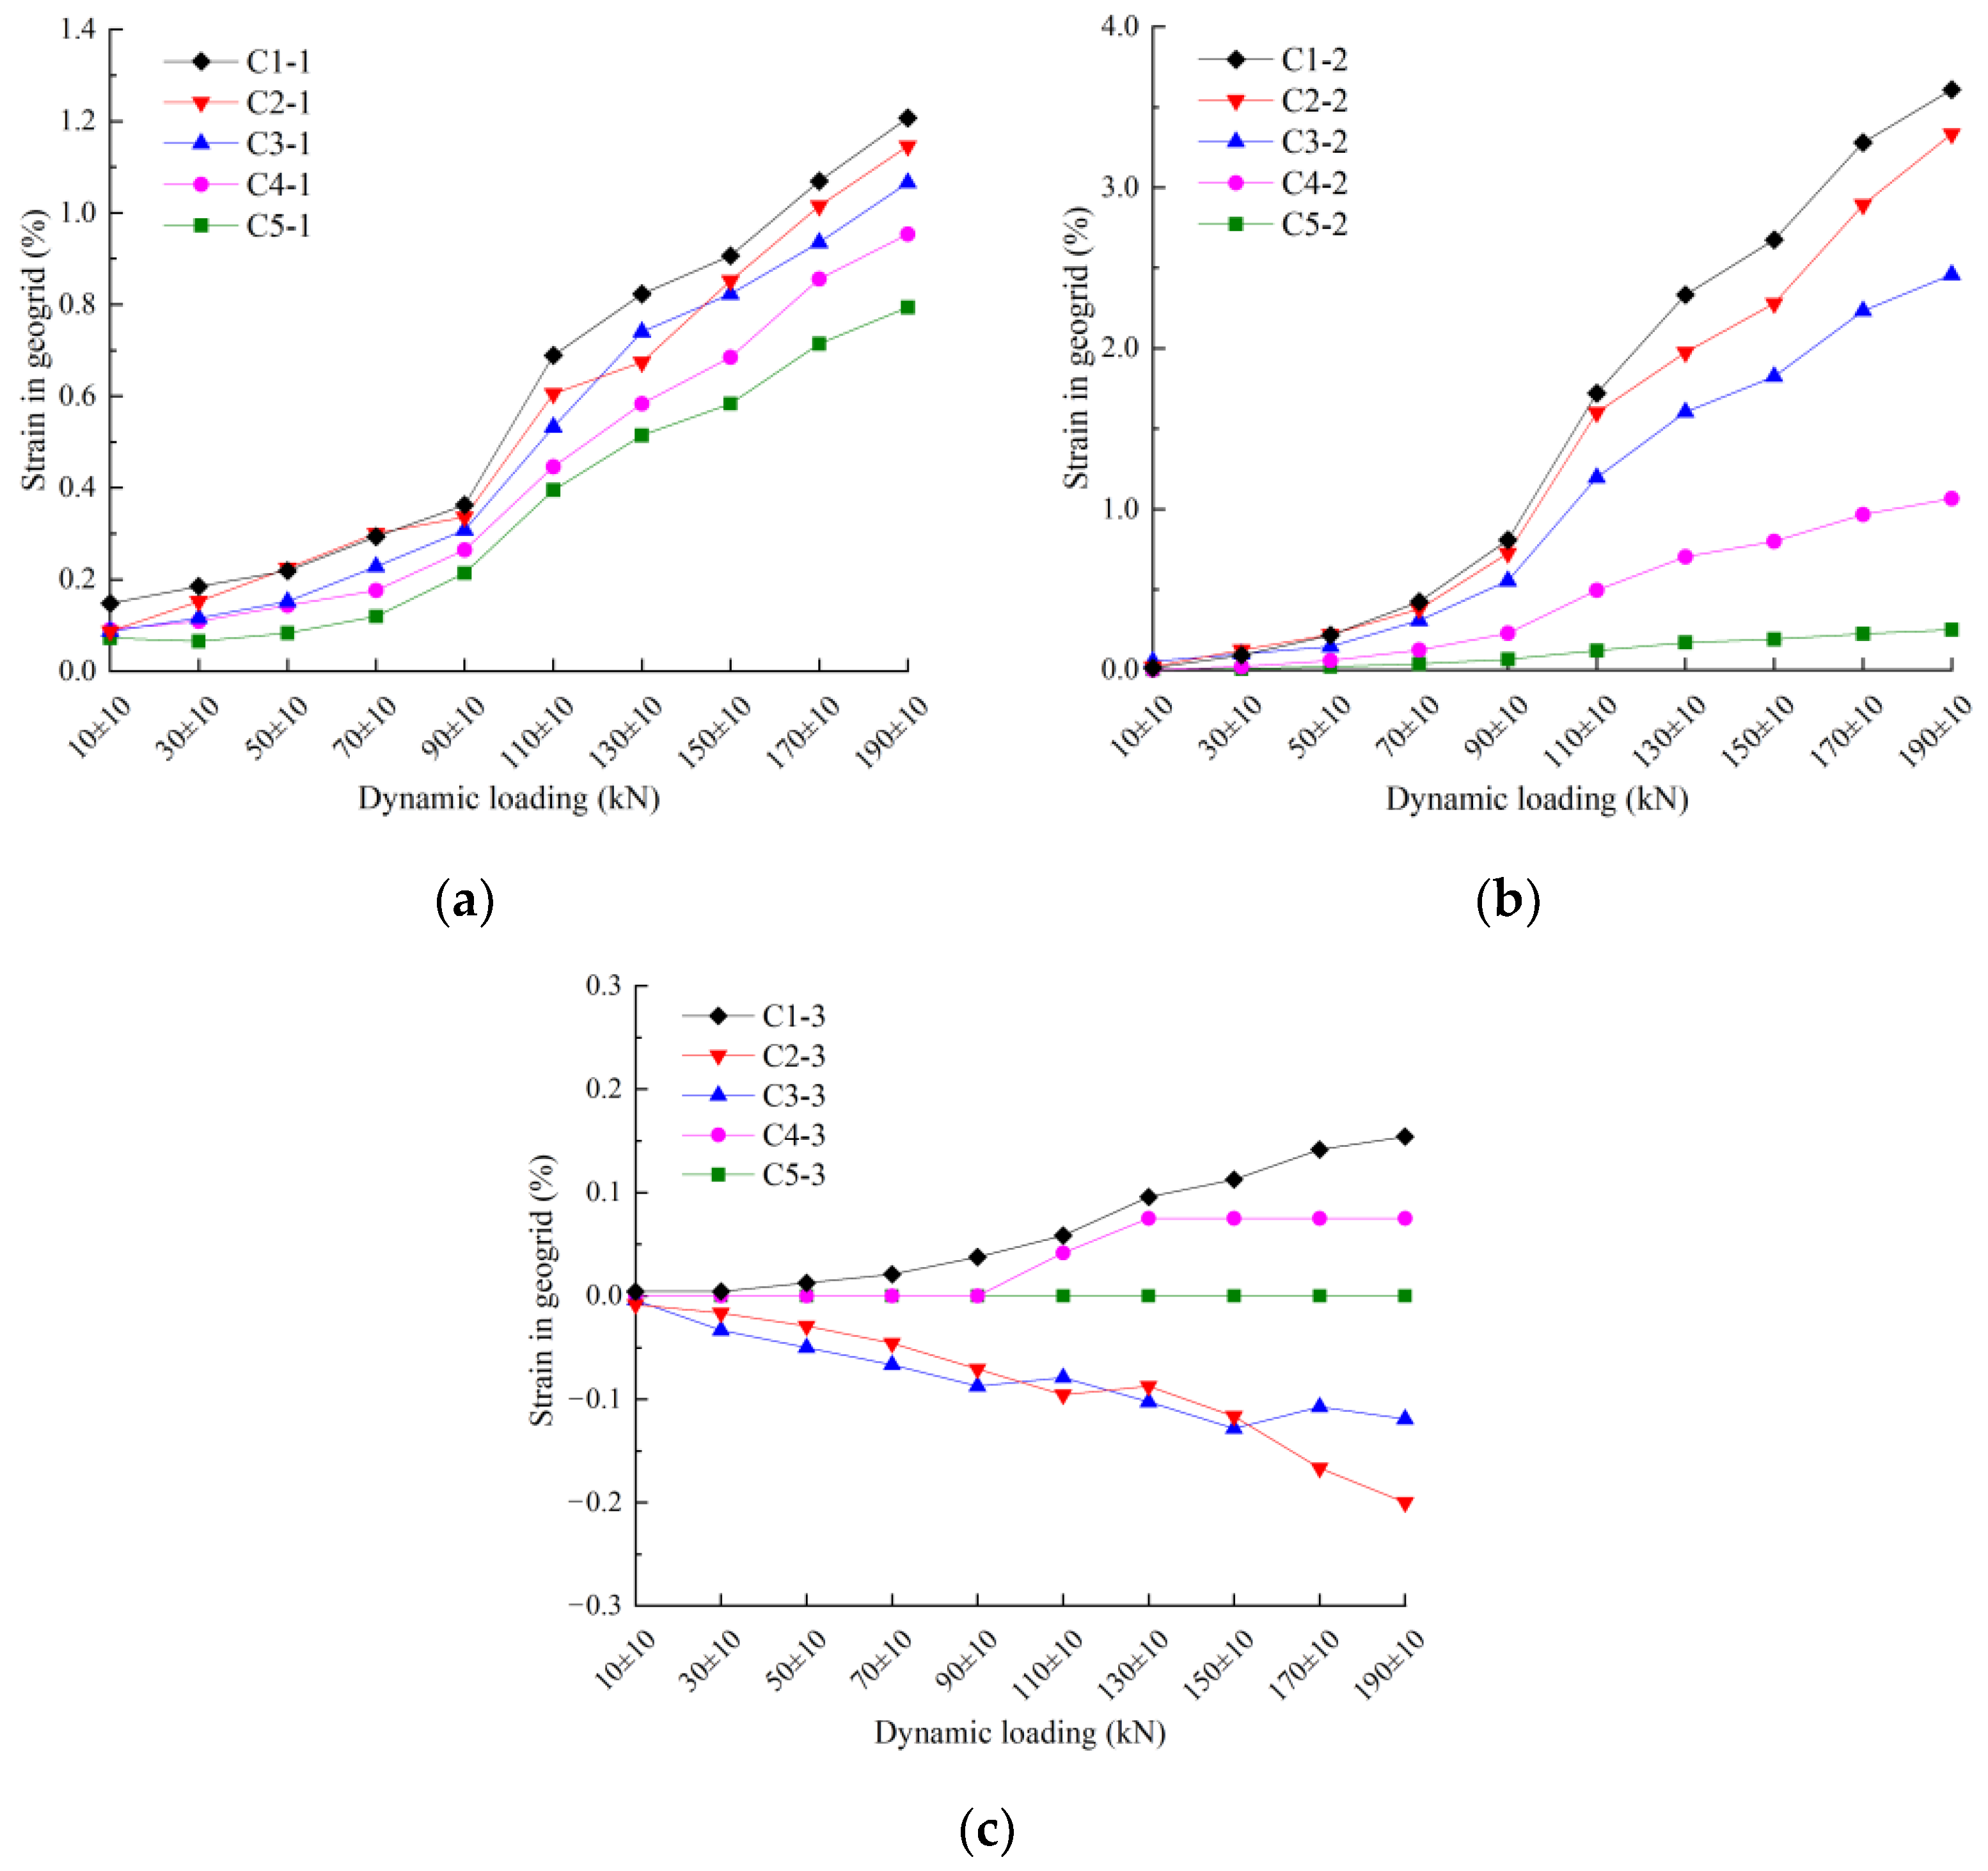
3.2. Geogrid Strain
3.3. Acceleration Response
4. Geogrid Strain Calculation Method
4.1. Basic Assumptions
- (1)
- geogrids are laid horizontally and remain horizontal under the action of soil self-weight;
- (2)
- the additional stress acting on the pressurized zone of the geogrid distributes uniformly along the horizontal direction;
- (3)
- the tension caused by compaction of the geogrid during filling is ignored;
- (4)
- under the action of self-weight and external load, the deformation of the geogrid is mainly elastic deformation, and the plastic deformation is small and can be ignored.
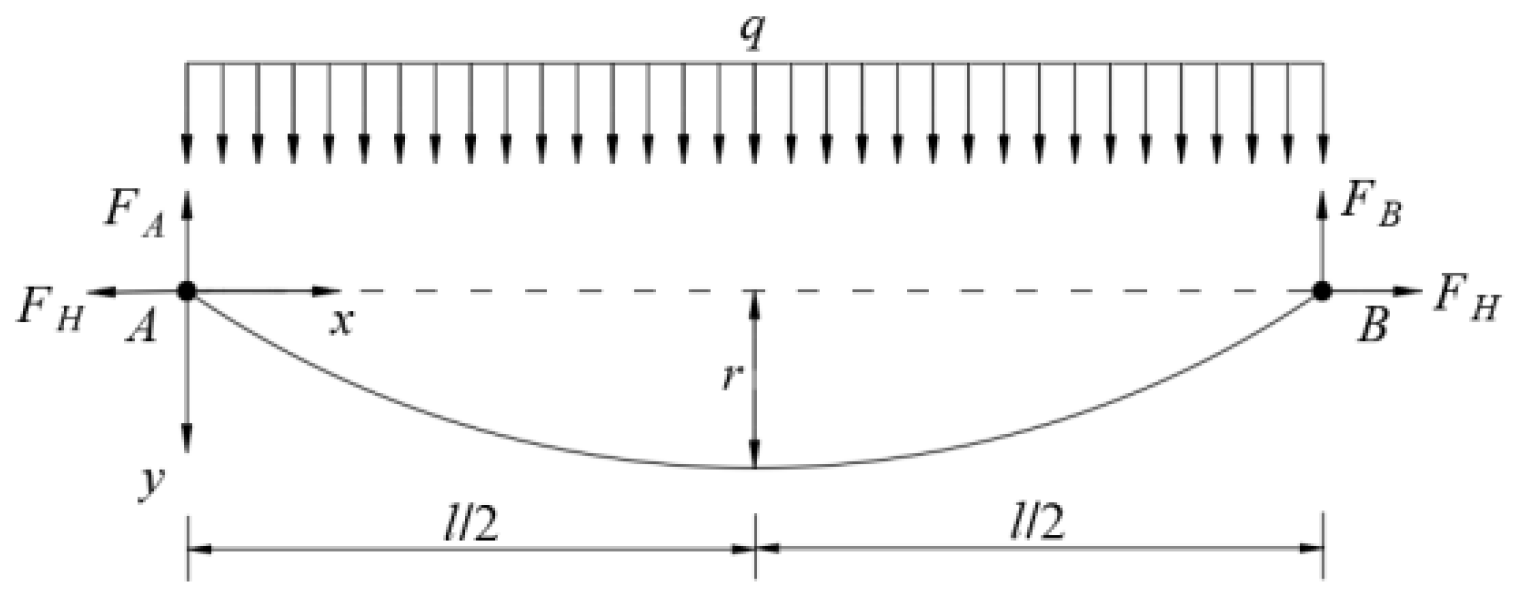
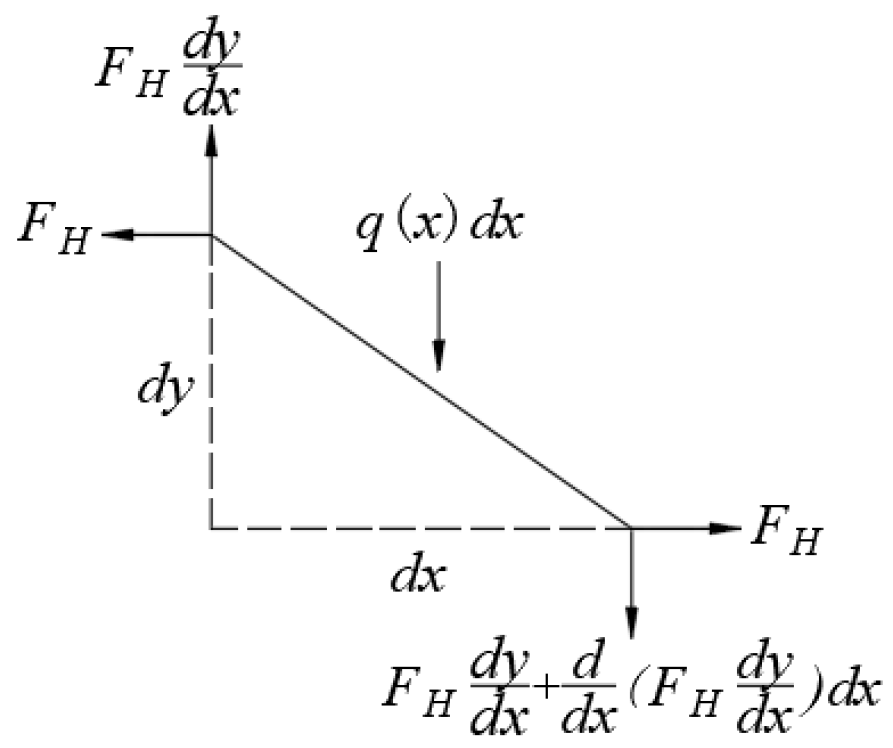
4.2. Derivation of Calculation Formula
4.3. Test Verification
5. Conclusions
- (1)
- In dynamic loading, the peak load is the most significant in the mechanical response of all load factors, followed by the amplitude and average value and finally the frequency. The peak load directly affects the additional stress in the soil, which deforms the retaining wall facing panels and the geogrid; the load magnitude and average value both change the deformation characteristics of the wall by changing the effect between the geogrid and the soil particles, and then change the deformation characteristics of the wall facing; the load frequency changes the acceleration in the soil, but the soil particles consume it through frictional collision, so the degree of action is very small.
- (2)
- The dynamic load of lower amplitude makes the reinforced soil structure more compact through vibration, and the additional stress in the soil is mainly concentrated in the middle of the retaining wall, the bearing capacity of GRS retaining wall is increased and the deformation trend of the wall facing is “wall facing outward curved”; high-amplitude dynamic loads weaken the embedded locking effect between the geogrid and the soil, and the deformation of the wall surface is mainly concentrated in the middle and upper part, which shows “wall facing outward tilt”, and the bearing capacity of GRS retaining wall is reduced.
- (3)
- The strain of the geogrid is mainly affected by the peak load, and its strain gradually becomes larger along the depth direction, and increases and then decreases along the horizontal direction. The geogrid nearest to the loading plate takes the main role in controlling the settlement, and plays an important role in the foundation bearing capacity and overall stability of the retaining wall.
- (4)
- Based on the basic theory of elastic mechanics and the deformation principle of geogrid reinforced earth retaining walls, a set of geogrid strain calculation methods under external load is established, and it provides a new method for calculating the design value of geogrid tension in the design calculation of GRS retaining walls.
Author Contributions
Funding
Institutional Review Board Statement
Informed Consent Statement
Data Availability Statement
Conflicts of Interest
References
- Lee, K.; Jones, C.J.; Sullivan, W.A.; Trollinger, W. Failure and deformation of four reinforced soil walls in eastern Tennessee. Geotechnique 1994, 44, 397–426. [Google Scholar] [CrossRef]
- Collin, J.G. Lessons learned from a segmental retaining wall failure. Geotext. Geomembr. 2001, 19, 445–454. [Google Scholar] [CrossRef]
- Koerner, R.M.; Koerner, G.R. An extended data base and recommendations regarding 320 failed geosynthetic reinforced mechanically stabilized earth (MSE) walls. Geotext. Geomembr. 2018, 46, 904–912. [Google Scholar] [CrossRef]
- Barani, O.R.; Bahrami, M.; Sadrnejad, S.A. A new finite element for back analysis of a geogrid reinforced soil retaining wall failure. Int. J. Civ. Eng. 2017, 16, 435–441. [Google Scholar] [CrossRef]
- Berg, R.B.; Collin, J.G.; Taylor, T.P.; Watts, C.F. Case history on failure of a 67 m tall reinforced soil slope. Geotext. Geomembr. 2020, 48, 802–811. [Google Scholar] [CrossRef]
- Collin, J.G.; Stark, T.D.; Lucarelli, A.; Taylor, T.R.; Berg, R.R. Stability and stress-deformation analyses of reinforced slope failure at Yeager Airport. J. Geotech. Geoenviron. Eng. 2021, 147, 04020179. [Google Scholar] [CrossRef]
- Xiao, C.Z.; Gao, S.; Liu, H.B.; Du, Y.Q. Case history on failure of geosynthetics-reinforced soil bridge approach retaining walls. Geotext. Geomembr. 2021, 49, 1585–1599. [Google Scholar] [CrossRef]
- Berg, R.R.; Christopher, B.R.; Samtani, N.C. Design and Construction of Mechanically Stabilized Earth Walls and Reinforced Soil Slopes; Federal Highway Administration: Washington, DC, USA, 2009. [Google Scholar]
- British Standard BS8006-1; Code of Practice for Strengthened/Reinforeced Soils and Other Fills. British Standards Institution: London, UK, 2010.
- NCMA. Design Manual for Segmental Retaining Walls, 3rd ed.; National Concrete Masonry Association: Washington, DC, USA, 2010. [Google Scholar]
- Bathurst, R.J.; Naftchalib, M.F. Geosynthetic reinforcement stiffness for analytical and numerical modelling of reinforced soil structures. Geotext. Geomembr. 2021, 49, 921–940. [Google Scholar] [CrossRef]
- Leshchinsky, D.; Han, J. Geosynthetic reinforced multi-tiered walls. J. Geotech. Geoenviron. Eng. 2004, 130, 1225–1235. [Google Scholar] [CrossRef]
- Bathurst, R.J.; Allen, T.M.; Walters, D. Reinforcement loads in geosynthetics walls and the case for a new working stress design method. Geotext. Geomembr. 2005, 23, 287–322. [Google Scholar] [CrossRef]
- Yang, G.Q.; Liu, H.B.; Zhou, Y.T.; Xiong, B.L. Post-construction performance of a two-tiered geogrid reinforced soil wall backfilled with soil-rock mixture. Geotext. Geomembr. 2014, 42, 91–97. [Google Scholar] [CrossRef]
- Allen, T.M.; Bathurst, R.J. Improved simplified method for prediction of loads in reinforced soil walls. J. Geotech. Geoenviron. Eng. 2015, 141, 04015049. [Google Scholar] [CrossRef]
- Jacobs, F.; Ruiken, A.; Ziegler, M. Investigation of kinematic behavior and earth pressure development of geogrid reinforced soil walls. Transp. Geotech. 2016, 8, 57–68. [Google Scholar] [CrossRef]
- Li, L.H.; Yu, C.D.; Xiao, H.L.; Feng, W.Q.; Ma, Q.; Yin, J.H. Experimental study on the reinforced fly ash and sand retaining wall under static load. Constr. Build. Mater. 2020, 248, 118678. [Google Scholar] [CrossRef]
- Skinner, G.D.; Rowe, R.K. Design and behaviour of a geosynthetic reinforced retaining wall and bridge abutment on a yielding foundation. Geotext. Geomembr. 2005, 23, 234–260. [Google Scholar] [CrossRef]
- Wang, H.; Yang, G.; Wang, Z.; Liu, W. Static structural behavior of geogrid reinforced soil retaining walls with a deformation buffer zone. Geotext. Geomembr. 2020, 48, 374–379. [Google Scholar] [CrossRef]
- Riccio, M.; Ehrlich, M.; Dias, D. Field monitoring and analyses of the response of a block-faced geogrid wall using fine-grained tropical soils. Geotext. Geomembr. 2014, 42, 127–138. [Google Scholar] [CrossRef]
- Liu, F.Y.; Zhu, C.; Yuan, G.H.; Wang, J. Behaviour evaluation of a gravelly soil geogrid interface under normal cyclic loading. Geosynth. Int. 2021, 28, 508–520. [Google Scholar] [CrossRef]
- Hatami, K.; Bathurst, R.J. Numerical model for reinforced soil segmental walls under surcharge loading. J. Geotech. Geoenviron. Eng. 2006, 132, 673–684. [Google Scholar] [CrossRef]
- Mirmoradi, S.H.; Ehrlich, M.; Magalhaes, L.F.O. Numerical evaluation of the effect of foundation on the behaviour of reinforced soil walls. Geotext. Geomembr. 2021, 49, 619–628. [Google Scholar] [CrossRef]
- Karpurapu, R.; Bathurst, R.J. Behaviour of geosynthetic reinforced soil retaining walls using the finite element method. Comput. Geotech. 1995, 17, 279–299. [Google Scholar] [CrossRef]
- Chen, J.F.; Liu, J.X.; Shi, Z.M. Numerical simulation and stability discussion of a reinforced soil retaining wall on soft soil foundation. Chin. J. Rock Mech. Eng. 2012, 31, 1928–1935. [Google Scholar]
- Xiao, C.Z.; Han, J.; Zhang, Z. Experimental study on performance of geosynthetic-reinforced soil model walls on rigid foundations subjected to static footing loading. Geotext. Geomembr. 2016, 44, 81–94. [Google Scholar] [CrossRef]
- Xiao, C.Z.; Chen, Q.J.; Han, J. Experimental study of performance of geogrid-reinforced retaining wall subjected to load from strip foundation at the top surface of wall. Rock Soil Mech. 2013, 34, 1586–1592. (In Chinese) [Google Scholar]
- Udomchai, A.; Horpibulsuk, S.; Suksiripattanapong, C.; Mavong, N.; Rachan, R.; Arulrajah, A. Performance of the bearing reinforcement earth wall as a retaining structure in the Mae Moh mine. Geotext. Geomembr. 2017, 45, 350–360. [Google Scholar] [CrossRef]
- Kazimierowicz-Frankowska, K.; Kulczykowski, M. Deformation of model reinforced soil structures: Comparison of theoretical and experimental results. Geotext. Geomembr. 2021, 49, 1176–1191. [Google Scholar] [CrossRef]
- Desai, C.S.; El-Hoseiny, K.E. Prediction of field behavior of reinforced soil wall using advanced constitutive model. J. Geotech. Geoenviron. Eng. 2005, 131, 729–739. [Google Scholar] [CrossRef]
- Wang, X.; Cui, J.; Shen, J.H.; Wang, X.Z.; Zhu, C.Q. Particle breakage behaviors of a foundation filling material on island-reefs in the South China Sea under impact loading. Bull. Eng. Geol. Environ. 2022, 81, 1–24. [Google Scholar] [CrossRef]
- Wang, J.Q.; Xu, L.J.; Xue, J.F.; Tang, Y. Laboratory study on geogrid reinforced soil wall with modular facing under cyclic strip loading. Arab. J. Geosci. 2020, 13, 398. [Google Scholar] [CrossRef]
- Ehrlich, M.; Mirmoradi, S.H.; Saramago, R.P. Evaluation of the effect of compaction on the behavior of geosynthetic-reinforced soil walls. Geotext. Geomembr. 2012, 34, 108–115. [Google Scholar] [CrossRef]
- Hore, R.; Chakraborty, S.; Shuvon, A.M.; Bari, M.; Ansary, M.A. Dynamic response of reinforced soil retaining wall resting on soft clay. Transp. Infrastruct. Geotechnol. 2021, 8, 607–628. [Google Scholar] [CrossRef]
- Liu, Z.; He, F.; Huang, T.Q.; Jiang, M.D. Additional earth pressure of retaining wall caused by vehicle load. J. Highw. Transp. Res. Dev. 2019, 13, 16–23. [Google Scholar] [CrossRef]
- The Professional Standards Compilation Group of People’s Republic of China. Technical Specification for Construction of Highway Subgrades; China Communications Press: Beijing, China, 2006; pp. 12–13. (In Chinese) [Google Scholar]
- ASTM D2487-17; Standard Practice for Classification of Soils for Engineering Purposes (Unified Soil Classification System). ASTM International: West Conshohocken, PA, USA, 2017.
- Ministry of Transport of the People’s Republic of China. Test Method for Geosynthetics for Highway Engineering; China Communications Press: Beijing, China, 2006; pp. 32–36. (In Chinese) [Google Scholar]
- Wang, J.Q.; Zhang, L.L.; Tang, Y.; Huang, S.B. Influence of reinforcement-arrangements on dynamic response of geogrid-reinforced foundation under repeated loading. Constr. Build. Mater. 2021, 274, 122093. [Google Scholar] [CrossRef]
- Huang, B.; Ding, H.; Chen, Y.M. Simulation of high-speed train load by dynamic triaxial tests. Chin. J. Geotech. Eng. 2011, 33, 195–202. (In Chinese) [Google Scholar]
- Tafreshi, S.M.; Dawson, A.R. Behaviour of footings on reinforced sand subjected to repeated loading-Comparing use of 3D and planar geotextile. Geotext. Geomembr. 2010, 28, 434–447. [Google Scholar] [CrossRef]
- Gebremariam, F.; Tanyu, B.F.; Guler, E.; Urgessa, G.S.; Shen, P. Numerical investigation of reinforced soil structures with GRS-IBS design features. Geosynth. Int. 2021, 28, 95–112. [Google Scholar] [CrossRef]
- Duan, J.; Yang, G.L.; Lin, Y.L.; Cheng, X.T.; Dai, Z.H. Experimental investigation of a reinforced soil retaining wall with a flexible geogrid-wrapped ecological bag facing. Geotext. Geomembr. 2021, 49, 19–31. [Google Scholar] [CrossRef]
- Saghebfar, M.; Abu-Farsakh, M.; Ardah, A.; Chen, Q.; Fernandez, B.A. Performance monitoring of Geosynthetic Reinforced Soil Integrated Bridge System (GRS-IBS) in Louisiana. Geotext. Geomembr. 2017, 45, 34–47. [Google Scholar] [CrossRef]
- Lee, K.Z.; Wu, J.T. A synthesis of case histories on GRS bridge-supporting structures with flexible facing. Geotext. Geomembr. 2004, 22, 181–204. [Google Scholar] [CrossRef]
- Keskin, M.S.; Laman, M. Experimental and numerical studies of strip footing on geogrid-reinforced sand slope. Arab. J. Sci. Eng. 2014, 39, 1607–1619. [Google Scholar] [CrossRef]
- Liang, L.; Ma, S.; Wang, Z.J.; Zhang, Y. Experimental study of the performance of geosynthetics-reinforced soil walls under differential settlements. Geotext. Geomembr. 2021, 49, 97–108. [Google Scholar]
- Yang, G.Q.; Zhao, Y.F.; Wang, Z.J. Performance of back-to-back geogrid reinforced soil retaining walls for railways during service. Transp. Res. Rec. 2021, 2675, 1115–1125. [Google Scholar] [CrossRef]
- Feng, S.J.; Ai, S.G.; Chen, H.X. Membrane effect of geosynthetic reinforcement subjected to localized sinkholes. Can. Geotech. J. 2018, 55, 1334–1348. [Google Scholar] [CrossRef]
- Chen, F.Q.; Lin, Y.J.; Chen, S.X. Analytical solutions for geosynthetic-reinforced cohesive subgrade spanning trench voids. Geotext. Geomembr. 2020, 48, 854–866. [Google Scholar] [CrossRef]
- The Professional Standards Compilation Group of People’s Republic of China. Code for Design on Retaining Structures of Railway Subgrade; China Railway Publishing House: Beijing, China, 2019; pp. 46–51. (In Chinese) [Google Scholar]


| Item | Value |
|---|---|
| Longitudinal ultimate tensile strength (kN/m) | 31.4 |
| Transverse ultimate tensile strength (kN/m) | 32.5 |
| Longitudinal yield elongation (%) | 13.4 |
| Transverse yield elongation (%) | 13.6 |
| Tensile strength at 2% elongation in the longitudinal direction (kN/m) | 13.7 |
| Tensile strength at 2% elongation in the transverse direction (kN/m) | 14.0 |
| Tensile strength at 5% elongation in the longitudinal direction (kN/m) | 24.3 |
| Tensile strength at 5% elongation in the transverse direction (kN/m) | 24.7 |
| Aperture size (mm × mm) | 36 × 40 |
Publisher’s Note: MDPI stays neutral with regard to jurisdictional claims in published maps and institutional affiliations. |
© 2022 by the authors. Licensee MDPI, Basel, Switzerland. This article is an open access article distributed under the terms and conditions of the Creative Commons Attribution (CC BY) license (https://creativecommons.org/licenses/by/4.0/).
Share and Cite
Wang, J.; Zhong, W.; Lin, Z.; Tang, Y. Dynamic Response and Geogrid Strain Analysis of GRS Retaining Wall. Appl. Sci. 2022, 12, 9930. https://doi.org/10.3390/app12199930
Wang J, Zhong W, Lin Z, Tang Y. Dynamic Response and Geogrid Strain Analysis of GRS Retaining Wall. Applied Sciences. 2022; 12(19):9930. https://doi.org/10.3390/app12199930
Chicago/Turabian StyleWang, Jiaquan, Wentao Zhong, Zhinan Lin, and Yi Tang. 2022. "Dynamic Response and Geogrid Strain Analysis of GRS Retaining Wall" Applied Sciences 12, no. 19: 9930. https://doi.org/10.3390/app12199930
APA StyleWang, J., Zhong, W., Lin, Z., & Tang, Y. (2022). Dynamic Response and Geogrid Strain Analysis of GRS Retaining Wall. Applied Sciences, 12(19), 9930. https://doi.org/10.3390/app12199930