


Abstract
Organisational cultural change driven by demographic shifts is affecting employee perceptions of leadership roles within the Australian Public Service (APS). Despite longstanding diversity challenges, the APS has implemented policies to increase female employees’ representation in senior roles. This study examines the demographic composition and perceptions of Senior Executive Service (SES) leaders in the APS from 2018 to 2024, using APS census data (N = 127,262) and ordinary least squares (OLS) regression to analyse relationships among age, gender, and perceived leadership effectiveness. Our findings show a statistically significant increase in women in SES positions concurrent with the implementation of APS gender-equity strategies, alongside declining millennial (under 40) representation. Regression analysis indicates that female employees and younger staff report significantly more positive perceptions of SES leadership, while older employees view leadership effectiveness more negatively. While gender diversity has improved, generational gaps persist in leadership perceptions. The study highlights the need for cross-culturally responsive leadership addressing demographic diversity, generational differences, and digital transformation in public sector organisations. Aligning with cross-cultural management themes, the research shows how representative leadership must evolve to navigate cultural change, AI adoption, and remote work demands in increasingly diverse globalised workplaces.
1. Introduction
Organisational cultural change is widespread across industries, driven in large part by demographic shifts in the workforce and the Australian Public Service (APS) is no exception. This change emerges from a duality of internal and external forces that reshapes how leaders are perceived. Internally, this can be observed through shifts in company culture, structure, systems, and technology (Klag et al., 2015). External forces such as remote work, adaptable work schedules, and the growing integration of Artificial Intelligence (AI) require leaders to navigate these cultural changes with urgency. A recent example of organisational change is working from home. Traditionally, organisations remained reluctant to depart from established norms (Gneezy et al., 2014), requiring staff to be on site at all times. External market shifts have since disrupted this position and remote work is now increasingly considered as a viable option for businesses and their employees (Chatterjee et al., 2022; Allen et al., 2012; Belaid et al., 2025).
The recent disruption from generative artificial intelligence offers another example of how external factors can challenge organisational culture. Alshwayat (2023) notes that, robust leadership combined with specific expertise is required within organisations to overcome these challenges. For instance, AI is viewed as both an opportunity and a threat for most organisations today. Similarly, managing through organisational changes brought about by shifting workforce demographics remains necessary to successfully manage diversity and transition to productive employment (Vito & Sethi, 2020; Hewins-Maroney & Williams, 2013; Harb, 2026). This raises an important question: what type of leader do organisations need to manage these emerging changes?
This research examines diversity and organisational culture and change within the Australian Public Service. The aim of this study is to examine how demographic shifts in age and gender composition under APS leaders shape employee perceptions of leadership and their ability to manage organisations during challenging times. The research objectives for this paper are as follows:
- To examine the age and gender composition of APS workgroups and leadership teams, as well as variation across role levels (e.g., SES vs. non-SES).
- To test relationships between demographic composition and perceptions by examining how leaders’ and employees’ age and gender diversity relate to employees’ perceptions of leadership and perceived leadership of organisational change.
- To synthesise findings and present recommendations for APS diversity and leadership development strategies.
This study adopts a complementary, multi-level theoretical perspective to provide a more complete account than any one theory alone, while maintaining clear distinctions between individual, organisational, and national levels of analysis.
The theoretical foundation for this research draws on Bornman’s (2019) transformational leadership model which is used to explain generational demographic’s impact on culture within the APS. This is relevant as public-sector leadership shifts from one generation to the next, shaping perceptions of those entering these roles. The competing values framework (CVF) (Cameron & Quinn, 2011) assists organisations to understand, assess, and transform their cultures which holds implications for APS and their journey of cultural transformation. Further, we acknowledge the foundations laid by the Hofstede cultural dimensions framework.(Iancu & Badea, 2020). The Hofstede framework is particularly relevant as it provides a lens for understanding how values and changes in the workplace are influenced by organisational culture.
The two research questions guiding this study are as follows:
- RQ1: “What is the connection between the age group of millennials and gender in Senior Executive Service positions within the APS from 2018 to 2024?”
- RQ2: “Is there a relationship between the millennial generation age group, gender, and these employees’ perception of senior executive’s ability to lead change within the APS organisation between 2018 to 2024?”
The gaps highlighted include the lack of millennial leadership in the Australian public sector, literature which attends to the effects of age and gender in isolation but not together in relation to leadership perceptions, and lastly, perceptions of senior executives’ capacity to lead change (Yudiatmaja et al., 2023, Thrasher et al., 2023; Thompson, 2017).
In addressing these gaps, this study integrates three complementary theoretical frameworks: first, Bornman’s (2019) transformational leadership model for millennials, which centres on empathy and collaborative decision-making as an important factor in organisational change. Second, Hofstede’s cultural dimensions theory (Hofstede, 2011), which is used to examine gender (masculinity/femininity/MAS) and age (power distance index/PDI) dynamics. Lastly, Cameron and Quinn’s (2011) competing values framework, which captures the age differences in the perceptions of senior executives within the APS.
The continued occurrence of demographic shifts means that millennials are currently the dominant generation, making up a large portion of middle-to-senior-level leadership roles across most industries globally (Huyler et al., 2025). The APS is faced with millennials increasingly occupying middle- and senior-level leadership roles. Consideration of generational workforce change in its longer-term workforce, leadership-development, and succession-planning strategies is advantageous. Such planning may help address the workforce needs for a future-ready public service. Ultimately, this can ensure that leadership pathways, development opportunities, and organisational practices remain responsive to the evolving composition of the APS workforce.
Luu and Rubio (2023) point out that by the end of 2025, 75% of the workforce will be composed of millennials. There is a growing trend towards this occurring in the APS. However, rather than assuming that millennials will constitute a specified proportion of the workforce, this study examines age composition empirically using APS census categories. In June 2024, employees aged 25–44 accounted for 48.8% of the APS workforce, highlighting the importance of age diversity when examining leadership perceptions and organisational change (Australian Public Service Commission, 2024).
As a result, the study focuses on millennials (born between 1981 and 1997) employed in the APS. The data further allow for a comparison of middle-to-senior leadership in the APS with global trends as reported by Gabrielova and Buchko (2021). To achieve this, this research uses a quantitative approach to assess the changing extent of millennial women occupying senior executive positions within the Australian Public Service (APS) between 2018 and 2024.
The research posits that age and gender will likely influence perceptions of senior executive leaders due to workplace demographic changes in the APS. The following section synthesises the existing research on these topics to justify our hypotheses.
2. Theoretical Framework
Leading scholars in leadership studies maintain that core to leadership is the empowerment of team members by promoting innovation and personal growth (Bornman, 2019). The transformational leadership theory (TLT) presents four dimensions including idealised influence, inspirational motivation, intellectual stimulation, and individualised consideration. We adopt this framework in this study to determine whether specific leader behaviours are associated with employee or organisational outcomes, and to identify under what conditions those outcomes occur.
A limiting factor in TLT is guidance on how the age and gender composition of senior leadership teams, and generational differences among followers, respond to situations of organisational change. TLT alone cannot explicate when and for whom transformational leadership is most effective in demographically diverse, multigenerational organisations (El Achi et al., 2025). To address this limitation, the study integrates TLT with the competing values framework (CVF) and Hofstede’s cultural dimensions theory as contextual moderators.
The CVF specifies the organisational culture types (clan, adhocracy, market, hierarchy) within which transformational behaviours are enacted and captures age and gender differences in cultural perceptions (Cameron & Quinn, 2011). It focuses on transforming organisations through evaluating and understanding their cultures (Grabowski et al., 2014). In this study, the CVF is used as an interpretive lens to contextualise the findings only. Primarily, we use the CVF to explore how organisational culture influences leadership styles, values alignment, organisational strategies, and decision-making in the context of the Australian Public Service.
Hofstede’s dimensions add a societal-level perspective, showing how cultural values such as the power distance index and masculinity/femininity (Komisarof & Akaliyski, 2025) can moderate the relationship between transformational behaviours and outcomes, via views of gender differences. Hofstede’s PDI and MAS indices are interpreted in this study as indicators of national cultural context rather than as measures of individual employees’ values. Collectively, the CVF and Hofstede frameworks extend TLT by modelling how age, gender, and cultural context impact the efficacy of transformational leadership during periods of organisational change.
2.1. Female Representation in Leadership Roles—An APS Perspective
Setting the standard for expectations within an organisation starts at the top. Haidar and Hossain (2024) explain that female representation in leadership is a necessity for company boards today—especially if the expectation for this top-down approach is to permeate throughout management ranks.
Diversification in leadership ranks allows greater expertise and skills in decision-making within businesses. Dacheva and Gonzalez-Roma (2022) point out a strong relationship between enhanced company performance and a balanced proportion of female leaders. However, this position is contested (Okajima et al., 2025; Pletzer et al., 2015) and it has been argued that women’s leadership is not a simple positive or negative driver of performance. Effects are argued to be dependent on bias, resources, organisational conditions, strategic roles, and whether diverse leaders’ expertise is substantively integrated into decision-making.
Evidence of this is seen within the APS, which has explicitly implemented a gender-balanced leadership requirement in its organisational structure. Effectively, its policy focuses on balanced leadership as a strategic lever for a better-functioning APS.
The APS, as a group of agencies in the Australian Federal Government, strictly adheres to the Australian Government’s Workplace Gender Equality Agency (WGEA). The WGEA was established in 2012 due to the government’s concern relating to gender gaps in pay, career progression, and leadership. The APS holds itself and its agencies accountable to the charter requirements of the WGEA. In 2024, the WGEA issued its “Australia’s Gender Equality Scorecard” (WGEA, 2024). The scorecard report indicates that across Australia, 68% of companies and government agencies now have targets to increase the number of women in leadership positions.
2.2. Millennial Readiness for Executive Level Leadership
Millennials are those who were primarily born between 1981 and 1997. A lack of uniformity among authors on the definition of generational year ranges exists; however, for the most part, the differences are within a year or two. The APS census was used as the main data source; it utilises the term ‘under 40’ to categorise the younger workforce. While this represents a moving age band, it serves as an effective proxy for the millennial cohort in this study. Because millennials comprise the vast majority of the ‘under 40’ demographic within the APS, this category provides a consistent basis for analysing generational changes in leadership perception across the seven-year period. In developed countries, millennials are the most prevalent generation in the workforce (Gursoy et al., 2013). This is a natural expectation given that this age group entered the workforce in larger numbers during the early 2000s and beyond.
In 2025, they are beginning to enter senior leadership roles. With regard to entry-level leadership roles in businesses, Easton and Steyn (2025) identified that the number of people under 40 years is growing. Organisations are also beginning to see the “late millennials” and Generation Z cohort, one generation younger than the millennials, progress into frontline management.
Critical to advancing millennial inclusion in senior leadership is understanding how organisational development (OD) practices, such as mentorship, leadership training, and transparent promotion criteria, facilitate this transition. For example, Bornman (2019) finds that millennials respond best to leadership styles characterised by mentorship and ‘meaningful engagement’; yet the APS census data offer only limited insight into whether current development programs for millennial employees address these needs.
This study addresses this gap by examining not only who is in senior roles but also how leadership development practices can enable or hinder millennials, particularly women, in their progression to SES positions. Millennial career progression should not simply focus on the creation of different tailored leadership development programmes for future readiness. Attention needs to be given to understanding how age–period–cohort (APC) relationships are relevant to millennial advancement opportunities into executive level leadership.
Recent scholarly work (Luo & Hodges, 2022; Huyler et al., 2025; Rudolph et al., 2018) explains how age, period, and cohort effects can change leadership and behaviour over time. In the context of the APS, age–period–cohort thinking can help make sense of how much of what we see in millennial leaders is due to where they are in their careers, how much is unique to their generation, and how much reflects the historical moment they are leading in. This may be valuable to the APS to assist in guiding their decision-making for future executive leadership.
The millennial generation has a robust understanding of today’s technology due to growing up in the digital age (Widyawati et al., 2023). They have had greater exposure to this—compared to older generations—in their daily lives and to digitisation, which gives millennials deeper insight into the challenges and changes facing organisations today (e.g., artificial intelligence). Larson and DeChurch (2020) explain how digital technologies are changing the nature of teamwork and that this has significant implications for leadership. In the context of the APS and this study, understanding the value of millennial knowledge and expertise in workplace changes such as those influenced by AI and digital technology is crucial.
2.3. Perceptions of Senior Executives and Leadership Styles
The perceptions of the effectiveness of senior leaders are determined by many factors such as their visibility, ethical behaviour, the recognition they provide, and how they handle crises and pressure. Employees’ expectations of senior leaders’ ability to steer organisations through periods of change will vary depending on an employee’s role, gender, and age group (Duprez & Euwema, 2017).
This position, however, has not gone unchallenged. Zellman et al. (2026) suggest that the relationships between the variables of age, gender, and role on expectations of staff are not universal or deterministic. Employee feedback is also shaped by organisational context, proximity to leadership, and general bias.
This variation may also originate from perceptions of organisational ethics: Fieger and Rice (2018) found that in the APS, employees who felt culturally or professionally marginalised were significantly less likely to report wrongdoing, which suggests that leadership effectiveness may also be perceived through the lens of psychological safety and institutional trust. In the APS context, where SES leaders are evaluated on items such as strategic communication and team cohesion, perceptions may increase or decrease depending on whether employees feel they are fairly recognised and rewarded. For example, even if a female millennial in the SES communicates change effectively, her perceived leadership may be undermined if employees believe promotion processes are unfair or not consistently distributed (Rice et al., 2017). In other cases, frontline staff may require more structure and processes from senior leaders. Meanwhile, management may seek trust, empowerment, and less micromanagement. Therefore, a leader’s ability to adapt their leadership style to the situation is paramount.
The leadership approach applied to younger employees in the workplace plays an influential role in unlocking their full potential. For example, Bornman (2019) explains that the transformational leadership style resonates most with millennials and Generation Z employees due to its emphasis on sensitivity. A senior leader who cannot embrace this style of leadership may be perceived as ineffective. Studies such as that by Akaskal and Ulucan (2024) have examined the characteristics that a leader needs to exhibit from a Generation Z perspective. Their findings indicated that members of Generation Z perceive a good leader as someone who has foresight, is caring, is fair, can act as a teammate, has emotional intelligence, and possesses good digital skills. In the context of the APS, similar notions will be investigated to uncover employee perceptions of APS senior leadership and their ability to lead through emerging organisational change.
2.4. Leading Organisational Change
Successful organisational change is difficult, representing one of the more complex processes that organisations must confront (Hay et al., 2020). The company that adapts best to change will be the one that succeeds in the future world of emerging workplace changes. Organisational change requires a leader with knowledge and expertise in the current and emerging business challenges (Santos de Souza & Chimenti, 2024). This means that leaders who have experience managing change may not have encountered such challenges.
Technological advancements, uncertainty in global relations between nations, and generational differences in the workplace are just a few examples. Sadaric and Skerlavaj (2023) found that “change agents”, people who champion change and are respected by their peers, are best positioned to lead organisational change. Alshwayat (2023) posits that employees expect their leaders to be equipped to guide them and the organisation through any change. To maintain high levels of employee confidence, they often need evidence of this capability to ensure trust remains strong.
To manage emerging organisational changes, companies will need senior leaders with the expertise and skills to handle problems and challenges. Demircioglu and Van Der Wal (2021) emphasise the senior leadership’s role in fostering innovation, trust, and adaptability, particularly amid the digital technology-driven nature of current organisational changes.
An opposing view is that of Tsiavos and Kitsios (2026) who found that top-management teams matter, but successful transformation also depends on organisational structure, digital capabilities, strategic ecosystem engagement, and the organisation’s ability to orchestrate resources. Senior-leader expertise alone cannot deliver change.
This study investigates whether an increase in female representation within senior leadership aligns with the relational and empathetic attributes that are often associated with effective change management in modern workplaces. Based on the integration of Bornman’s transformational leadership theory, Hofstede’s cultural dimensions, and the competing values framework, we propose the following hypotheses:
H1.
A greater female representation in Senior Executive Service (SES) roles is associated with organisational cultures that place relatively greater emphasis on values commonly described as “feminine” (e.g., care, collaboration, quality of life) rather than “masculine” (e.g., assertiveness, competition, achievement) in the cross-cultural management literature.
H2.
Millennial employees (under 40) will report more positive perceptions of SES leadership effectiveness than employees in older age cohorts.
H3.
Female employees will report more positive perceptions of SES leadership effectiveness than male employees.
3. Materials and Methods
3.1. Data and Participants
The APS employee census collects data on APS workers’ views and experiences within their department or agency and assists departments and agencies in identifying priorities for improving the functioning of these organisations. There are three primary role-classification categories that participants belong to within the APS structure: Frontline Staff, Executive Leader (EL), and Senior Executive Service (SES) roles.
To better understand the demographic composition of senior leadership and how employee perceptions vary by age and gender, a quantitative methodology was chosen. This approach allows for the analysis of associations between workforce demographics (specifically, female representation and millennial presence) and self-reported perceptions of leadership effectiveness within the APS. Secondary data were sourced from the publicly available APS annual employee census, spanning the period from 2018 to 2024 (Australian Public Service Commission, 2018–2024). The census data are available from the Australian Government’s data.gov.au website. The total number of participants engaging in the survey in 2018 (n = 103,000) was less than that in 2024 (n = 135,446). Approximately 4% of respondents identified as non-binary or did not disclose gender; these n = 5782 cases were excluded to maintain statistical stability.
The census has a very high degree of participation, yielding an average response rate of over 80% as of 2024. The census has been conducted every year since 2012. The omitted census years (2012 to 2017), which were not analysed in this study, had inconsistencies in their questions that caused validity challenges; therefore, they were excluded. Knekta et al. (2019) infer that validity must be considered each time an instrument (e.g., a survey) is used.
In the APS census data, participants who identified as non-binary or did not disclose their gender represented a very small percentage of the total sample. Because the primary objective of this study was to examine the leadership perceptions through the lens of the male/female dichotomy and because the sample size for non-binary and undisclosed responses was statistically insufficient to allow for meaningful statistical analysis without creating unstable coefficients (high standard errors), these cases were excluded from the final analysis.
The study employs statistical techniques (chi-square, regression, principal component analysis) to test hypotheses derived from the competing value’s framework, Hofstede’s cultural dimensions theory, and transformational leadership theory. To facilitate this, a correlational research design was used in the investigation.
3.2. Procedure and Theoretical Grounding of Methods
Transformational leadership theory was the guiding model applied to this study. It informed the choice of methods used in the testing process, as it explains how leadership behaviours influence employees during organisational change. The research questions required testing for an association between variables (chi-square test) and predictions/relationships (regression analysis). The methods used to address each research question are described below.
The first research question examines whether the number of millennial women occupying senior executive positions within the APS increased from 2018 to 2024. To ensure the validity and reliability of the data across this seven-year period, a mapping exercise was conducted that involved searching for identical questions in each dataset on variables of age, gender, and role classification.
In assessing this question, we used chi-square tests to examine the relationships between age, gender, and SES roles, building on Hofstede’s (2011) MAS index (gendered leadership preferences) and PDI (age-related hierarchy tolerance). The variables must be tested statistically in order to determine significance. Connelly (2019) explains that a non-parametric statistical test is most suited for determining significance among nominal or ordinal variables. For this reason, a chi-square test was selected because it examines whether differences between observed and expected results are due to chance (Turhan, 2020).
The age and gender variables of the APS employee census participants were categorised into three age ranges: “under 40 years” (serving as the proxy for the millennial cohort), “40–54 years”, and “55 years or older.” The use of these standardised categories ensures longitudinal consistency across the seven-year data wave, allowing for a stable comparison of how different demographic segments perceive leadership. These age groups were cross-tabulated with the three role classifications: “Frontline Staff”, “Executive Leaders”, and “Senior Executive Service.” The analysis produced percentages showing the breakdown of each age range within each role classification. A chi-square test yielded a statistically significant result for age and gender.
Some scholars maintain that statistical significance is reported via a smaller probability value, meaning there is stronger evidence to reject the null hypothesis and accept the alternative hypothesis (Imbens, 2021). In line with this argument, this study applied a probability value of less than 5% (p < 0.05) as the measure to determine statistical significance.
The second research question examines the relationship between age and gender of employees within the APS and their perceptions of senior leadership’s ability to manage change from 2018 to 2024. Ordinary least squares (OLS) regression was used to analyse how age, gender, and role type predicted perception scores, with the inclusion of control variables for agency size and satisfaction.
Principal component analysis (PCA) first combined four survey items into a new single variable called “leadership perception” (Cronbach’s α = 0.85) to operationalise Bornman’s (2019) focus on empathy and collaboration. Gewers et al. (2021) describe PCA as a technique that reduces the number of variables in a dataset while retaining most of its original information. In total, there were four census questions that were combined to create one “perception” variable that formed the view of the Senior Executive Service. The four questions combined were as follows:
- My SES manager communicates effectively
- My SES manager ensures that work effort contributes to the strategic direction of the agency and the APS
- My SES manager clearly articulates the direction and priorities for our area
- In my agency, the SES work as a team
These four questions illustrate the various types of traits that shape people’s perceptions, capturing traits and qualities used to construct the perception variable. Garrido et al. (2018) explains that warmth and competence are what people primarily look for when forming impressions of others. The newly created variable was then tested against the existing age, gender, and satisfaction variables across the large dataset.
The most appropriate test was the ordinary least squares (OLS) linear regression model which, as Huang (2018) explained, is a statistical approach suited to estimate the relationships between the dependent variable and the independent variables under study. The regression model incorporated control variables, such as agency size and overall satisfaction, to account for potential confounding effects. Overall satisfaction was included because it informs perceptions of leadership suitability independently of generational traits. Age group and gender were added to isolate the effects of gender and age on senior leadership perceptions and to test Cameron and Quinn’s (2011) theoretical predictions. The final regression sample (N = 127,262) reflects listwise deletion of records with missing data on leadership perception items or control variables from the total 2024 census population (N = 135,446).
Once the linear regression analysis was conducted, we estimated the predicted margins. This process involved taking the results of the linear regression and estimating the average predicted outcomes across the different variables as a group rather than individually. The chi-square test was chosen to examine the association between gender (as per Hofstede’s MAS index) and SES roles, while regression analysis was used to assess how age groups (linked to PDI) influence leadership perceptions. Principal component analysis (PCA) was applied to construct a “leadership perception” variable grounded in transformational leadership theory.
4. Results
4.1. Employee Age
The initial testing of the data involved comparing each age group with the type of role within the APS organisation. The three age-group ranges were “under 40 years”, “40–54 years”, and “55 years or older”. The three role classification groups were “Frontline Staff” (which include graduates and trainees), “Executive Leaders” (middle management), and the “Senior Executive Service” (senior leaders).
Over the seven-year period, age group representation in Frontline roles showed consistent trends year over year. For example, in 2018, Frontline roles were primarily represented by the under-40 group (43.5%), followed by the 40–54 group (39.6%), and lastly the 55 years or older group (16.9%). By 2024, data indicated that the trend remained consistent: the under-40 group (47.2%) is followed by the 40–54 group (36.7%), and lastly the 55 years or older group (16.1%) to represent the makeup of Frontline employees.
However, a divergent trend was observed in Executive Leader roles. The age group that holds the highest representation among Executive Leaders is the 40–54-year-old group. This trend is evident across the seven-year wave of data. In 2018, the 40–54-year-old group was most represented (52.4%). The under-40 group followed (32.1%), and the 55 years or older group came in third (15.5%). The pattern remains consistent in 2024, with the 40–54-year-old group at 54.5%, the under-40 group at 32.3%, and the 55 years or older group at 15.2%.
The Senior Executive Service role (the highest level) is similar to the Executive Leader level, where the 40–54-year-old group is most represented. However, the next group is 55 years old or older, with the under-40-year-old age group being the least represented in the Senior Executive Service. In 2018, the 40–54-year-old group was most represented (64.8%). The 54-year-or-older group followed (23.5%), with the under-40-year-old group at 11.7%. The pattern remained consistent in 2024, with the 40–54-year-old group at 72.3%, the 54-year-or-older group at 18.9%, and the under-40-year-old group at 8.8%.
4.2. Variable of Age vs. Variable of Senior Executive Service
In Figure 1, the age group variable is paired with the Senior Executive Service role variable to identify the representation of each age group within the Senior Executive Service. The 40–54-year-old group (Generation X) has increased in representation at the Senior Executive Service level over the seven-year data wave.
Figure 1.
Age groups—APS Senior Executive Service employees.
The 55—and—older age group has seen a decrease in representation at the senior leadership level (2018: 24%; 2024: 19%). Similarly, the under—40 age group’s representation decreased at the Senior Executive Service level as well (2018: 12%; 2024: 9%). The decline in millennial representation at the SES level may reflect higher PDI values among older generations, who value hierarchical structures over collaborative leadership. This corresponds to the competing values framework which measures tolerance for hierarchical control: older employees’ lower perception scores (β = −0.088, p < 0.001), as shown in the OLS regression, suggest they favour traditional top-down leadership, whereas millennials favour more collaborative styles (Bornman, 2019). The dominance of older generations in SES roles may explain why younger employees report higher satisfaction with leadership.
This paper posits that an increase in the number of millennials has occurred in senior executive-level positions within the APS. However, this is not the case: Importantly, these findings should be considered in light of the level of statistical significance and the gender-variable component of Research Question 1. This trend, millennials dominating Frontline roles but being underrepresented in SES, sets the stage for analysing how age and gender crosscut leadership perceptions, which we test next using regression analysis.
4.3. Employee Gender
The gender variable in the census data was examined after the age variable had been analysed. The gender analysis compared male and female sex categories across the types of roles within the APS organisation. Upon analysing Frontline roles, the results indicate that women have higher representation. Across the seven-year wave of data, women comprised an average of 64% of the Frontline workforce while men made up 36%. At the executive leadership level (middle management), a similar pattern emerged over the same period, with females having higher representation. In 2018, females comprised 52% of this group (men 48%), and in 2024, women made up 57% of the workforce (men 43%).
The notable difference is that female representation at the executive leadership level has grown over time. The Senior Executive Service roles, the highest level in the APS, showed an interesting change over the seven-year period. In 2018, female representation in senior leadership stood at 45% (male 55%). By 2024, females made up 55% of senior leadership and male representation had fallen to 45%. The increase in female representation in SES roles (55% in 2024) occurs alongside a trend where younger employees report more positive perceptions of leadership. This may suggest a perceived alignment between evolving leadership demographics and the relational preferences often attributed to millennial and Generation Z cohorts.
This shift directly corresponds with Hofstede’s (2011) MAS dimension, distinguishing task-oriented “masculine” leadership from relationship-oriented “feminine” leadership; traits such as empathy and collaboration are linked in the regression analysis to higher employee perception scores among females (β = 0.052, p < 0.001). As Bornman (2019) has noted, millennials value relational leadership, making this gender transition in SES roles strategically aligned with the APS’s need to lead organisational change.
4.4. Variable of Gender vs. Variable of Senior Executive Service
In Figure 2, the gender variable (female, male) is paired with the Senior Executive Service role variable to identify the representation of each gender group in senior executive roles. This study posits that an increase in female representation has occurred in senior executive-level positions within the APS. The results indicate that H1 is supported; there was a statistically significant increase in female representation within SES roles.
Figure 2.
Gender groups—APS Senior Executive Service employees.
4.5. Research Question 1
When considered as isolated variables, the test results indicated an increase in female representation in senior-level roles but no increase among millennial-aged employees. Over the seven-year period, the total number of employees who participated in the census (and were identified within an age range) increased. By reporting both the significance level and the effect size (Cramer’s V), we ensure that the influence of the large sample size on p-values is accounted for, providing a more rigorous assessment of the demographic changes within the SES.
The results of these associations are now shown in Table 1, including the chi-square statistic, degrees of freedom, p-values, and Cramer’s V to indicate effect size. While the p-values are highly significant (p < 0.001) across all years, the Cramer’s V values provide a measure of the strength of these associations and show weak to moderate associations for gender and age group. This suggests that while the demographic shifts, especially the increase in female representation and the decline in millennial presence in SES roles, are statistically robust and not due to random chance, they represent gradual transitions rather than abrupt structural changes.
Table 1.
Chi-square analysis of millennial age, gender, and senior executive status.
The p-value results are <0.001 for each year from 2018 to 2024 for both age and gender variables. The age and gender variables indicate a statistically significant association when tested against the Senior Executive Service (SES) level. The tests show that there is less than a 5% chance that the results occurred by random chance. Millennial-aged employees (both male and female) have declined in representation at the SES level. From a gender perspective, female employees have increased in representation considerably at the SES level, while males have decreased considerably.
4.6. Research Question 2
Principal Component Analysis
As described earlier, a new variable using PCA was constructed that related to perceptions of senior leadership. The creation of the senior-leadership perception construct in this analysis required combining the following variables:
- My SES manager communicates effectively
- My SES manager ensures that work effort contributes to the strategic direction of the agency and the APS
- My SES manager clearly articulates the direction and priorities for our area
- In my agency, the SES work as a team
These four questions are all related to managerial communication and teamwork, primarily because these items were consistently present in the datasets analysed from 2018 to 2024. Employee perceptions of their leaders are also often determined by how effectively managers communicate and work together as a unit (Newman et al., 2019). The feasibility of this was investigated via exploratory principal component analysis for all years covered by this analysis (2018–2024).
For the year 2024, 135,446 observations contained data for all four variables. The results of this analysis are shown in Table 2. Analysis for all other years was performed analogously and is available upon request.
Table 2.
Principal component analysis—SES leadership perceptions.
Eigenvalues greater than 1 from a principal component analysis demonstrate that more of the original data’s variance was captured during the reduction of multiple variables (Frost, 2022). The 2024 analysis revealed a single emergent factor with an eigenvalue of 2.94, accounting for 74% of the variance among the four senior-leadership perception variables. No other eigenvalue exceeds 1, indicating satisfactory variable reduction into this single factor.
Subsequently, factor scores representing the ‘leadership perception’ construct were estimated using the method suggested by Bartlett (1937). The variables included in the leadership scale were analysed with respect to the inter-item correlation. A Cronbach’s alpha score of 0.85 was calculated, indicating high reliability for the produced scale, well exceeding Hair et al.’s (2012) guidance of 0.70 and indicating strong reliability of the leadership perception construct.
4.7. Regression Analysis of Perceptions of Senior Leadership
The next step in the analysis was to estimate an ordinary least squares regression model, with the newly created senior leadership construct as the dependent variable. Gender, age group, and APS employment level were used as independent variables. Agency size and overall employee satisfaction were utilised as control variables to account for variability across the APS population. The results of the 2024 regression can be seen in Table 3 (featuring results with and without satisfaction as a control variable).
Table 3.
Regression—SES leadership perceptions with and without satisfaction as control.
A total of 127,262 APS employees had complete data for this analysis. The overall model displayed a highly statistically significant predictive capability and accounted for about 25% of the variability in senior leadership perception. The regression analysis does not confirm H2 (younger age groups, b = −0.088, p < 0.001); however, it does confirm H3 (female employees, b = 0.052, p < 0.001). The results suggest, however, that the APS is becoming more gender-diverse, and employees (particularly women and younger staff) perceive leadership favourably.
The positive coefficient for females (b = 0.052) indicates that women perceive leadership more positively at the APS. The negative coefficients for older age groups (b = −0.088) can be seen as validating these theories: millennials and women who favour relational leadership perceive SES effectiveness more strongly than older employees who were socialised in a more hierarchical environment. The regression model was tested for variance inflation (VIF), yielding a test value of 1.7, well within the acceptable range postulated by Marcoulides and Raykov (2018), who posited that VIF values smaller than 10 signal stable estimates.
The female coefficient (0.052) indicates that females in the APS have higher senior leadership perceptions than males, and this difference is statistically significant. This finding aligns with and extends those of Rice et al. (2025), as female employees were significantly more likely to report corruption when they perceived a strong developmental culture, suggesting that gender differences in leadership perceptions may not reflect a bias but, instead, a different sensitivity to cultural cues.
In our model, the positive perception of SES leaders by females may be amplified in APS agencies where innovation and transparency are hallmarks of a developmental culture. By contrast, negative perceptions among older employees may be associated with a more hierarchical culture that Rice et al. (2025) suggested is less conducive to ethical behaviour.
Using the under-40 age category as the reference group yielded coefficients of −0.027 for the 40–54-year-old age group and −0.088 for the 55+ age group. Both of these age groups are statistically significant, indicating that older employees perceive senior leaders as less effective at adapting leadership styles to Millennial workforce needs—a key driver of leadership effectiveness in change contexts (Bornman, 2019).
Older employees are more likely to hold senior-level roles. The control variables described in the research design section of this paper—agency size and overall satisfaction—are shown in Table 3. Statistically significant p-values are evident in the regression results. Regarding agency size, APS employees in large organisations have a higher perception of senior leadership, although the p-value of 0.074 indicates this is only marginally significant. To address heteroskedasticity detected after the initial regression, robust standard errors were employed in the regression specification, yielding consistent coefficient estimates and valid inferences despite variable residual variance.
Analysis of the employment level (Executive Leader and Senior Executive Service) variable shows that a higher employment level is more strongly associated with other roles at the APS. Similarly, the overall satisfaction category highlights statistically significant results. The “Strongly Agree” response is used as the reference group category. Moving down to “Strongly Disagree”, we see the coefficients become increasingly negative and remain significant. The greater an employee’s dissatisfaction, the worse the outcome. This indicates that the pattern is unlikely to be due to chance.
Men and older employees have a lower perception of senior leadership than women and younger employees. Executive Leaders have a higher perception of senior leadership than general APS employees (front-line). Perhaps not surprisingly, senior executive leaders have a substantially better perception of senior leadership than everyone else.
To address possible common-method variance stemming from measuring both leadership perception and overall job satisfaction on the same instrument, we re-estimated the OLS model excluding the satisfaction variable (Table 3). While removing this control reduced the model’s explanatory power substantially (R2 dropped from 0.25 to 0.013), as would be expected given the theoretical link between general satisfaction and leadership evaluations, the main demographic effects remained robust.
Female respondents continued to report significantly higher leadership perception scores (b = 0.087, p < 0.001), and both older age cohorts retained negative coefficients relative to the under-40 reference group (40–54: b = −0.036; 55+: b = −0.082; both p < 0.001). Given that these coefficients remained stable across both specifications indicates that the observed age and gender gradients are not simply capturing overlapping variance in attitudes but show consistent demographic patterns in leadership perception within the APS. We note that while the demographic coefficients are statistically significant, their magnitude is small (β = 0.052 for gender; β = −0.088 for age). This suggests that while demographics play a role, they are modest predictors of leadership perception compared to other factors such as overall job satisfaction (β > 1.5).
Principal component analysis, regression analysis, and estimation of margins of the main model containing employee satisfaction were replicated for each successive year from 2018 to 2024. The estimated margins in Table 4 show the adjusted predicted leadership perception scores with no significant change in the data.
Table 4.
SES leadership perceptions by age, gender, and role.
Figure 3a–c visualise the exalted perception that senior leadership has of itself. Figure 3 also indicates how leadership perceptions have changed over the period of analysis. Notably, there is a slightly improving trend in males’ perception of senior leadership over time, along with improvements in the middle-aged cohort (40–54 years) and a slight improvement among APS employees.
Figure 3.
(a) Perception of SES leadership effectiveness by gender. (b) Perception of SES leadership effectiveness by age. (c) Perception of SES leadership effectiveness by role classification.
5. Discussion
The first research question in this study asks: “What is the connection between the age group of millennials and gender in Senior Executive Service positions within the APS from 2018 to 2024?”. The hypothesis (H1) stated that there would be an increase in millennial-aged females working in Senior Executive Service (SES) roles within the APS. The claim was substantiated for females, but not by age alone. This aligns with Gursoy et al. (2013), who found that millennials dominate non-management roles globally; however, the APS reverses this trend in SES, where older generations (40–55 years) hold 72% of positions (2024 data). Hofstede’s cultural dimensions provided a national-level context for interpreting female increases in SES roles based on cultural tendencies which may be compatible with increasing opportunities and aspirations for women.
At the APS, while millennials are prevalent in Frontline roles, they were least represented in SES roles between 2018 and 2024. One possible explanation for these findings is the ‘experience trap.’ This represents a paradox within the Australian Public Service where Senior Executive Service (SES) roles require policy experience, yet younger workers are often not able to obtain this experience because those roles often remain occupied by older cohorts. This creates a circular barrier, e.g., an unintended glass ceiling where tenure is treated as a requirement for the very opportunities required to gain that tenure. This phenomenon can be linked to Hofstede’s power distance index (PDI) and the hierarchy quadrant of the competing values framework (CVF).
In an environment with high perceived power distance, leadership may subconsciously see seniority and years of service as the main proxies for competence. When an organisation’s culture values stability and control above all else, it naturally rewards those who have mastered established protocols over decades. This emphasis on tradition reinforces an “experience trap” while undervaluing the agile, digital skills that millennials bring. This reveals a fundamental contradiction within the APS: while leadership pathways remain heavily reliant on tenure, there is an immediate requirement for digital literacy and AI integration, competencies more prevalent among millennial staff. In this sense, the ‘experience trap’ extends beyond individual career stagnation; it may also act as an organisational bottleneck and limit the agency’s ability to modernise its leadership in a period of technological change. Our results extend Hofstede’s PDI by demonstrating that in the APS, power distance is not just a static cultural value but a dynamic ‘experience trap’ where tenure-based hierarchy conflicts with the agile leadership expectations of younger cohorts.
In an effort to ensure a smooth and efficient transition in future leadership resulting from workforce demographic changes, the APS should allow the internal policy agenda to advance younger leaders into more senior roles through internal and external skills-development programmes. The policy needs to be supported with structured actions across leadership accountability, workplace culture, recruitment, and data tracking. These actions would ensure that people who possess the qualities and characteristics that can oversee workplace changes are embedded in the leadership ranks.
The proposal of building pathways for younger generations into leadership extends Hofstede’s cultural framework by highlighting how generational shifts recalibrate expectations around power distance and long-term orientation in leadership development. It also refines Bornman’s (transformational leadership theory) conceptualisation of youth leadership by demonstrating how formal organisational pathways translate youth agency into recognised leadership roles within workplace hierarchies.
Our findings for the APS, follow the global trends where the proportion of woman in leadership positions has increased, moving from a male-dominated leadership structure (e.g., Coron (2019)). Table 3 shows the female regression coefficient increasing from β 0.052 to β 0.087 when satisfaction is removed as a control. This suggests that some of the gender difference in leadership perception may be associated with satisfaction levels. The findings suggest that as the SES becomes more gender-balanced, leadership perceptions align more closely with ‘feminine’ cultural values of inclusivity and empathy.
Conversely, older employees’ negative perceptions may reflect higher PDI values, where hierarchical structures dominate. In Table 3, we see a stronger negative association for the 40–54-year age group when the satisfaction control is removed and a slight coefficient change for the 55-plus age group. Older employees’ negative perceptions of leadership may indicate they feel hierarchy culture values (structure, efficiency quadrant of the competing values framework) are being undermined during the ongoing period of change and transformation for the APS.
However, the APS saw a dramatic shift around 2020–2021, when females overtook males as the most represented gender in the SES and have continued to increase through 2024. The literature review highlighted the introduction of the APS Gender Equality Strategy, which was initiated in 2021 and directly correlated with the timing of increases in female representation at the SES level.
The second research question in this study asks: “Is there a relationship between the millennial generation age group, gender, and these employees’ perception of senior executive’s ability to lead change within the APS organisation between 2018 to 2024?”. The hypotheses (H2 and H3) proposed that millennials and females would have a more positive perception of the SES within the APS. Mixed views of the SES exist among employees, based on age, gender, and role classification levels. Starting with age, the under-40s (millennials) have a positive perception of the SES. This is not surprising and is consistent with the literature.
Detert and Trevino (2010) argued that younger generations are more receptive to speaking up and giving feedback, whereas older workers are more conditioned to accept direction without question and rarely seek feedback. The competing values framework (CVF) was used here as an organisational-level interpretive lens to help explain why younger employees may respond favourably to leadership that feels collaborative, inclusive, developmental, and open to employee voice. The positive perceptions held by millennials suggest that the current trajectory of leadership demographics in the APS may be meeting the expectations of younger employees, who typically value transformational and collaborative leadership styles. The APS may benefit from deeper insight into the positive effects of their strategy to increase female leader representation.
Interestingly, older employees hold a poor view of leadership at the APS even though they occupy the majority of senior leadership roles there. The regression analysis results support this, indicating that older age groups have lower regression outcomes—statistically significant and not due to random chance. This can be explained through the lens of conservation of resources theory: when senior leaders fail to demonstrate interpersonal justice, such as respectful communication, inclusiveness, or acknowledgment of employee contributions, they may trigger resource depletion among their team members (Abas et al., 2024).
Older SES leaders, often socialised in more hierarchical environments, may unintentionally perpetuate behaviours that are perceived as dismissive or uncivil, leading to a lower perception of leadership effectiveness. Therefore, the negative perception of older leaders by younger employees (Table 1) is not only a generational mismatch but may reflect a systemic deficit in perceived fairness, which Abas et al. (2024) show to be a stronger predictor of leadership acceptance than either age or gender.
Employee perceptions of the Senior Executive Service (SES) differ by gender. Females view the SES favourably, whereas male employees hold a different perspective. Data over time suggest that male employees are generally not supportive of the SES, except in the 2024 census, which shows a slightly more favourable result. From a role-category perspective, testing concluded that the SES had the best and highest self-perception; basically, they exhibited a substantial positive self-perception bias. SES employees report the highest perceptions of leadership effectiveness, a finding that may reflect unvalidated feedback loops.
Employee satisfaction (β = 0.621, p < 0.001) was strongly linked to leadership perception, consistent with transformational leadership theory, which emphasises the importance of fair treatment and emotional intelligence. Further studies should investigate how APS evaluates leadership suitability from the data received in the annual census.
Limitations and Further Research
The APS annual census has limitations: self-reported data may introduce response bias or subjective viewpoints. This aligns with Castorena et al. (2025), who indicate that self-reporting increases the potential for bias. The high response rate substantially minimises non-response bias, as the sample closely represents the target population without significant self-selection effects. Residual response bias cannot be ruled out, though its impact is likely limited by the high participation.
The study’s theoretical frameworks (e.g., Cameron & Quinn, Hofstede, Bornman) may not fully account for the unique cultural context of the APS, which could influence leadership perceptions. To strengthen this research, a comparative analysis between public-sector and private-sector data would be necessary. A more robust approach would also include data from different regions—for example, Western and Eastern countries.
The study’s reliance on self-reported data limits its ability to fully align with Hofstede’s cultural dimensions, as subjective responses may not reflect objective cultural values. The chi-square test for age showed that the chi-square value increased year-on-year in line with the total number of employees at the APS. It remained unclear whether the strong association between age and SES was simply an artifact of the larger dataset. However, the result remained significant as the p-value stayed below 0.001.
In the context of the APS, accounting for demographic heterogeneity—particularly age and generational cohort—is worth factoring in for future SES composition decisions.
This empirical pattern of significance in the chi-square results supports a theoretical extension of Hofstede’s framework through the explicit inclusion of an age- or generation-related dimension. By explicitly modelling age or generation, researchers can update the framework to better reflect contemporary, multi-generational workforces in which demographic and cultural dynamics interact to shape work-related attitudes and outcomes.
As both the leadership perception outcome and overall job satisfaction were drawn from the same self-report census instrument, common-method variance could potentially exaggerate relationships between attitudinal variables. To mitigate this concern, we conducted a robustness check by estimating the regression model without the satisfaction variable. This showed that the age and gender coefficients remained statistically significant and retained the same direction (see Table 2), which suggests that demographic effects are not driven solely by the shared measurement source. Nevertheless, as with all cross-sectional self-report data, some residual common-method bias cannot be ruled out completely. Future research employing multi-source or longitudinal designs would further disentangle attitudinal overlap from genuine perceptual differences.
The treatment of the under-40 age category as representative of the Millennial cohort across the 7-year wave of data is a limitation of this research paper due to it being a moving age band. If available in the dataset, mixing of age and cohort effects can be addressed by measuring millennials by birth year rather than current age.
Another area that would benefit from future research is gaining a deeper understanding of how gender influences perceptions of the SES. The findings of this paper revealed that male employees perceive the SES as being significantly poorer than female employees do. Why might this be? Is it because females are the dominant gender in the APS workforce (and in leadership roles)? Does the higher number of female employees inflate the results with more positive views of the SES? Or is there some other explanation?
6. Conclusions
This study highlighted the challenges of managing organisational changes during times of workforce demographic changes and generational shifts. The paper’s approach was framed within the context of the APS’s annual census survey data. An increase in females at the SES level was evidenced by a chi-square test that produced statistically significant results (p < 0.05), but the millennial age group was not substantiated.
While our study identifies positive perceptions associated with demographic changes, further research utilising more direct measures of leader capability is needed to determine if specific traits of millennial female leaders are the main drivers of these perceptions. Age and gender variables, in fact, influence employee perceptions of the SES level. Ordinary least squares regression techniques demonstrated the relationship between the independent and dependent variables.
Our findings may help the APS determine whether employees’ poor perceptions of SES leaders hinder their ability to drive organisational culture and change. The Australian Government’s gender-equality strategy (Australian Public Service Commission, 2021), which mandates agency-specific diversity targets, coincides with the 10% increase in female leadership representation (2018–2024) that we have observed in this study. It may partly be responsible for the rise in women working in the APS and in leadership positions.
However, there is an opportunity for the APS to take action to tackle the age issue within its leadership structure. We recommend that the APS review its promotion policies to alleviate the effects of the ‘experience trap’, which acts as a systemic barrier where requirements based on service length block the progression of competent younger leaders. By moving from a model of seniority-based progression to one more focused on competency and digital skills, the APS can facilitate a more sustainable transition in leadership roles. It should encourage a pathway to leadership for promising employees with the required skills and characteristics from a diversity of backgrounds to lead organisational change within an era of disruption. In turn, this would build a pipeline of the right type of leaders needed to face the challenges of organisational change at the APS.
Author Contributions
Conceptualisation, S.S. and P.F.; methodology, S.S., P.F., D.D. and S.P.; software, P.F. and S.S.; validation, P.F. and S.S.; formal analysis, S.S.; investigation, S.S. and P.F.; resources, S.S., P.F., D.D. and S.P.; data curation, S.S. and P.F.; writing—original draft preparation, S.S.; writing—review and editing, P.F., D.D. and S.P.; visualisation, D.D. and S.P.; supervision, P.F.; project administration, S.S. and P.F. All authors have read and agreed to the published version of the manuscript.
Funding
This research received no external funding.
Institutional Review Board Statement
Not applicable.
Informed Consent Statement
Original informed consent was obtained from all participants during the initial data collection phase by the Australian Public Service Commission government agency, prior to the compilation of the dataset available for public use.
Data Availability Statement
Dataset available on request from the authors. The raw data supporting the conclusions of this article will be made available by the authors on request.
Conflicts of Interest
The authors declare no conflicts of interest.
References
- Abas, B., Bukhari, S., Farrukh, M., & Iqbal, S. (2024). Examining the socio-psychological dynamics of interpersonal and organizational deviances: The moderating influence of interpersonal justice and perceived organizational support. Leadership & Organization Development Journal, 45(6), 935–953. [Google Scholar] [CrossRef] [Scilit]
- Akaskal, N. Y., & Ulucan, E. (2024). Revealing the leadership characteristics of the modern age: Generation-Z perspective. International Journal of Organisational Leadership, 13, 22–38. [Google Scholar] [CrossRef] [Scilit]
- Allen, T. D., Johnson, R. C., Kiburz, K. M., & Shockley, K. M. (2012). Work-family conflict and flexible work arrangements: Deconstructing flexibility. Personnel Psychology, 66, 345–376. [Google Scholar] [CrossRef] [Scilit]
- Alshwayat, D. (2023). Innovation and change from a multi-level paradoxical perspective in a highly formalized organisation. Journal of Change Management, 23(3), 294–322. [Google Scholar] [CrossRef] [Scilit]
- Australian Public Service Commission. (2018–2024). APS employee census. Australian Public Service Commission—Organizations. Available online: https://data.gov.au (accessed on 19 September 2024).
- Australian Public Service Commission. (2021). Australian Public Service gender equality strategy 2021–2026. Available online: https://www.apsc.gov.au/publication/australian-public-service-gender-equality-strategy-2021-26 (accessed on 17 August 2025).
- Australian Public Service Commission. (2024). APS at a glance: State of the service report 2023–24. Australian Government. Available online: https://www.apsc.gov.au/initiatives-and-programs/workforce-information/research-analysis-and-publications/state-service/state-service-report-2023-24/aps-profile/aps-glance (accessed on 8 September 2026).
- Bartlett, M. S. (1937). The statistical conception of mental factors. British Journal of Psychology, 28, 97–104. [Google Scholar] [CrossRef] [Scilit]
- Belaid, S., Guedria, N. B., & Ballouk, H. (2025). Remote work and job satisfaction: A decade of insights through a bibliometric lens. Administrative Sciences, 15(11), 439. [Google Scholar] [CrossRef] [Scilit]
- Bornman, D. A. J. (2019). Gender-based leadership perceptions and preferences of Generation Z as future business leaders in South Africa. Acta Commercii: Independent Research. Journal in the Management Sciences, 19(1), 1–11. [Google Scholar] [CrossRef] [Scilit]
- Cameron, K. S., & Quinn, R. E. (2011). Diagnosing changing organizational culture based on the competing values framework. John Wiley & Sons. [Google Scholar]
- Castorena, O. H., Lopez-Torres, G. C., & Sandoval, A. R. C. (2025). Strategic innovation in operations management to enhance SME performance. Measuring Business Excellence, 30(2), 395–411. [Google Scholar] [CrossRef] [Scilit]
- Chatterjee, S., Chaudhuri, R., & Vrontis, D. (2022). Does remote work flexibility enhance organization performance? Moderating role of organization policy and top management support. Journal of Business Research, 139, 1501–1512. [Google Scholar] [CrossRef] [Scilit]
- Connelly, L. (2019). Chi-Square Test. Understanding Research, 28(2), 127–128. [Google Scholar]
- Coron, C. (2019). What does “gender equality” mean? Social representations of gender equality in the workplace among French workers. Equality, Diversity and Inclusion: An International Journal, 39(8), 825–847. [Google Scholar] [CrossRef] [Scilit]
- Dacheva, M., & Gonzalez-Roma, V. (2022). Proportion of women in work teams and team performance: A moderated mediation model. Current Psychology, 42, 25028–25041. [Google Scholar] [CrossRef] [Scilit]
- Demircioglu, M. A., & Van Der Wal, Z. (2021). Leadership and innovation: What’s the story? The relationship between leadership support level and innovation target. Public Management Review, 24(8), 1280–1311. [Google Scholar] [CrossRef] [Scilit]
- Detert, J. R., & Trevino, L. K. (2010). Speaking up to higher ups: How supervisors and skip-level leaders influence employee voice. Organisational Science, 21(1), 249–270. [Google Scholar] [CrossRef] [Scilit]
- Duprez, J., & Euwema, M. (2017). You can’t always get what you want? Leadership expectations of intrapreneurs. Journal of Managerial Psychology, 32(6), 430–444. [Google Scholar] [CrossRef] [Scilit]
- Easton, C., & Steyn, R. (2025). Millennial leaders’ preferences for leadership development: A qualitative analysis. Administrative Sciences, 15(4), 1–22. [Google Scholar] [CrossRef] [Scilit]
- El Achi, S., Jabbour Al Maalouf, N., Barakat, H., & Mawad, J. L. (2025). The impact of transformational leadership and work enronment on teachers’ performance in crisis-affected educational settings. Administrative Sciences, 15(7), 256. [Google Scholar] [CrossRef] [Scilit]
- Fieger, P., & Rice, B. S. (2018). Whistle-blowing in the Australian Public Service: The role of employee ethnicity and occupational affiliation. Personnel Review, 47(3), 613–629. [Google Scholar] [CrossRef] [Scilit]
- Frost, H. R. (2022). Eigenvectors from eigenvalues sparse principal component analysis. Journal of Computational and Graphical Statistics, 31(2), 486–501. [Google Scholar] [CrossRef] [Scilit] [PubMed]
- Gabrielova, K., & Buchko, A. A. (2021). Here comes Generation Z: Millennials as managers. Business Horizons, 64, 489–499. [Google Scholar] [CrossRef] [Scilit]
- Garrido, M. V., Godinho, S., & Semin, G. R. (2018). The “ins” and “outs” of person perception: The influence of consonant wanderings in judgements of warmth and competence. Journal of Experimental Social Psychology, 82, 1–5. [Google Scholar] [CrossRef] [Scilit]
- Gewers, F. L., Ferreira, G. R., De Arruda, H. F., Silva, F. N., Comin, C. H., Amanico, D. R., & Costa, L. D. (2021). Principal component analysis: A natural approach to data exploration. ACM Computing Surveys, 54(4), 1–33. [Google Scholar] [CrossRef] [Scilit]
- Gneezy, U., Leibbrandt, A., & List, J. A. (2014). Ode to the sea: Workplace organisations and norms of cooperation. The Economic Journal, 126, 1856–1883. [Google Scholar] [CrossRef] [Scilit]
- Grabowski, L., Neher, C., Crim, T., & Mathiassen, L. (2014). Competing values framework application to organizational effectiveness in voluntary organizations: A case study. Nonprofit and Voluntary Sector Quarterly, 44(5), 908–923. [Google Scholar] [CrossRef] [Scilit]
- Gursoy, D., Chi, G. C., & Karadag, E. (2013). Generational differences in work values and attitudes among frontline and service contact employees. International Journal of Hospitality Management, 32, 40–48. [Google Scholar] [CrossRef] [Scilit]
- Haidar, M. I., & Hossain, S. I. (2024). Board gender diversity and workplace safety: Evidence from quasi-natural experiments. Corporate Governance: An International Review, 33, 578–603. [Google Scholar] [CrossRef] [Scilit]
- Hair, J. F., Hult, G. T. M., Ringle, C. M., & Sarstedt, M. (2012). The use of partial least squares structural equation modeling in strategic management research: A review of past practices and recommendations for future applications. Science Direct, 45(5–6), 320–340. [Google Scholar] [CrossRef] [Scilit]
- Harb, B. (2026). Navigating multiple crises: An analysis of digital transformation in lebanese public administration. Administrative Sciences, 16(2), 69. [Google Scholar] [CrossRef] [Scilit]
- Hay, G. J., Parker, S. K., & Luksyte, A. (2020). Making sense of organisational change failure: An identity lens. Human Relations, 74(2), 180–207. [Google Scholar] [CrossRef] [Scilit]
- Hewins-Maroney, B., & Williams, E. (2013). The role of public administrators in responding to changing workforce demographics: Global challenges to preparing a diverse workforce. Public Administration Quarterly, 37(3), 456–490. [Google Scholar]
- Hofstede, G. (2011). Dimensionalizing cultures: The hofstede model in context. Online Readings in Psychology and Culture, 2(1), 8. [Google Scholar] [CrossRef] [Scilit]
- Huang, F. L. (2018). Multilevel modelling and ordinary least squares regression: How comparable are they? The Journal of Experimental Education, 86(2), 265–281. [Google Scholar] [CrossRef] [Scilit]
- Huyler, D., Gomez, L., Rocco, T. S., & Plathotnik, M. S. (2025). Leading different generational cohorts in the workplace: Focus on situational and inclusive leadership. New Horizons in Adult Education and Human Resource Development, 37(1), 6–19. [Google Scholar] [CrossRef] [Scilit]
- Iancu, D., & Badea, D. (2020). Empirical analysis of the influence of culture in managerial processes based on the Hofstede model. International Conference Knowledge-Based Organisation, 26(1), 205–210. [Google Scholar] [CrossRef] [Scilit]
- Imbens, G. W. (2021). Statistical significance, p-values, and the reporting of uncertainty. Journal of Economic Perspectives, 35(3), 157–174. [Google Scholar] [CrossRef] [Scilit]
- Klag, M., Jansen, K. J., & Lee, M. D. (2015). Contemplating workplace change: Evolving individual thought processes and emergent story lines. The Journal of Applied Behavioural Science, 51(1), 36–70. [Google Scholar] [CrossRef] [Scilit]
- Knekta, E., Runyon, C., & Eddy, S. (2019). One size doesn’t fit all: Using factor analysis to gather validity evidence when using surveys in your research. CBE Life Sciences Education, 18(1), 1–17. [Google Scholar] [CrossRef] [Scilit] [PubMed]
- Komisarof, A., & Akaliyski, P. (2025). New developments in Hofstede’s Individualism-Collectivism: A guide for scholars, educators, trainers and other practitioners. International Journal of Intercultural Relations, 107, 1–14. [Google Scholar] [CrossRef] [Scilit]
- Larson, L., & DeChurch, L. (2020). Leading teams in the digital age: Four perspectives on technology and what they mean for leading teams. Leadership Quarterly, 31(1), 101377. [Google Scholar] [CrossRef] [Scilit] [PubMed]
- Luo, L., & Hodges, J. S. (2022). The age–period–cohort–interaction model for describing and investigating inter-cohort deviation and intra-cohort life-course dynamics. Sociological Methods & Research, 51(3), 1164–1210. [Google Scholar] [CrossRef] [Scilit] [PubMed]
- Luu, E., & Rubio, S. (2023). Millennial managers. Corporate Governance: An International Review, 32, 732–755. [Google Scholar] [CrossRef] [Scilit]
- Marcoulides, K. M., & Raykov, T. (2018). Evaluation of variance inflation factors in regression models using latent variable modeling methods. Education and Psychological Measurement, 79(5), 874–882. [Google Scholar] [CrossRef] [Scilit] [PubMed]
- Newman, S. A., Ford, R. C., & Marshall, G. W. (2019). Virtual team leader communication: Employee perception and organisational reality. International Journal of Business Communication, 57(4), 452–473. [Google Scholar] [CrossRef] [Scilit]
- Okajima, H., Okajima, S., Ito, T., & Morimoto, A. (2025). Gender diversity and firm performance: A multi-level analysis of Japanese firms. Asian Economic Journal, 39(4), 498–528. [Google Scholar] [CrossRef] [Scilit]
- Pletzer, J. L., Nikolova, R., Kedzior, K. K., & Voelpel, S. C. (2015). Does gender matter? Female representation on corporate boards and firm financial performance—A meta-analysis. PLoS ONE, 10(6), e0130005. [Google Scholar] [CrossRef] [Scilit] [PubMed]
- Rice, B., Fieger, P., Martin, N., Raziq, M. M., & Rice, J. (2025). Exploring the nexus of organizational culture and corruption reporting: Evidence from the australian public service. Business Ethics, the Environment & Responsibility, 35(4). [Google Scholar] [CrossRef] [Scilit]
- Rice, B., Fieger, P., Rice, J., Martin, N., & Knox, K. (2017). The impact of employees’ values on role engagement: Assessing the moderating effects of distributive justice. Leadership & Organization Development Journal, 38(8), 1095–1109. [Google Scholar] [CrossRef] [Scilit]
- Rudolph, C. W., Rauvola, R. S., & Zacher, H. (2018). Leadership and generations at work: A critical review. The Leadership Quarterly, 29, 44–57. [Google Scholar] [CrossRef] [Scilit]
- Sadaric, A., & Skerlavaj, M. (2023). Leader idea championing for follower readiness to change or not? A moderated mediation perspective of prosocial sense giving. Journal of Change Management, 23(2), 200–227. [Google Scholar] [CrossRef] [Scilit]
- Santos de Souza, F. O., & Chimenti, P. (2024). Emotions in Organisational Change: An Integrative Review. Journal of Change Management, 24(2), 137–176. [Google Scholar] [CrossRef] [Scilit]
- Thompson, C. A. (2017). Leading a multigenerational workforce in the public sector [Doctoral dissertation, Walden University]. Walden Dissertations and Doctoral Studies. Available online: https://scholarworks.waldenu.edu/dissertations/3923 (accessed on 15 August 2025).
- Thrasher, G. R., Rudolph, C. W., & Hammond, M. M. (2023). The intersectional role-(in)congruity effects of age and gender on leadership evaluations. Group & Organization Management, 48(6), 721–757. [Google Scholar] [CrossRef] [Scilit]
- Tsiavos, V., & Kitsios, F. (2026). From stimuli to strategy: Decoding the complexities of modern digital transformation. Journal of the Knowledge Economy, 17, 9429–9467. [Google Scholar] [CrossRef] [Scilit]
- Turhan, N. S. (2020). Karl Pearson’s chi-square tests. Educational Research and Reviews, 15(9), 575–580. [Google Scholar] [CrossRef] [Scilit]
- Vito, R., & Sethi, B. (2020). Managing change: Role of leadership and diversity management. Journal of Organisational Change Management, 33(7), 1471–1483. [Google Scholar] [CrossRef] [Scilit]
- Widyawati, S. R., Ribek, P. K., Landra, N., & Widnyana, I. W. (2023). Mystery of the use of digital technology by millennials (study of employee performance). Quality Access to Success, 26(206), 186–193. [Google Scholar] [CrossRef] [Scilit]
- Workplace Gender Equality Agency. (2024). Workplace gender equality agency scorecard 2024. Available online: https://www.wgea.gov.au/publications/australias-gender-equality-scorecard (accessed on 15 August 2025).
- Yudiatmaja, W. E., Salomo, R. V., & Prasojo, E. (2023). Fostering innovative behaviour of millennial public employee through leadership styles and organizational trust. SAGE Open, 13(2), 21582440231178545. [Google Scholar] [CrossRef] [Scilit]
- Zellman, E., Andrei, D., & Parker, S. K. (2026). Leadership, follower age, and age-diversity: A systematic review and future directions. Work, Aging and Retirement, 12(3), 222–247. [Google Scholar] [CrossRef]
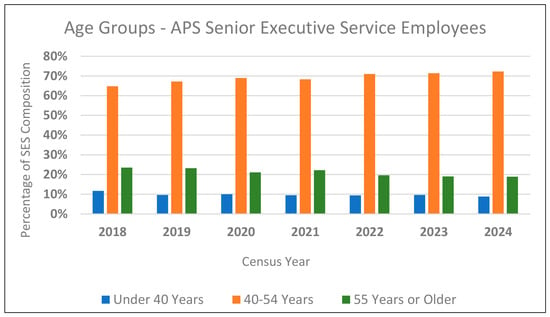
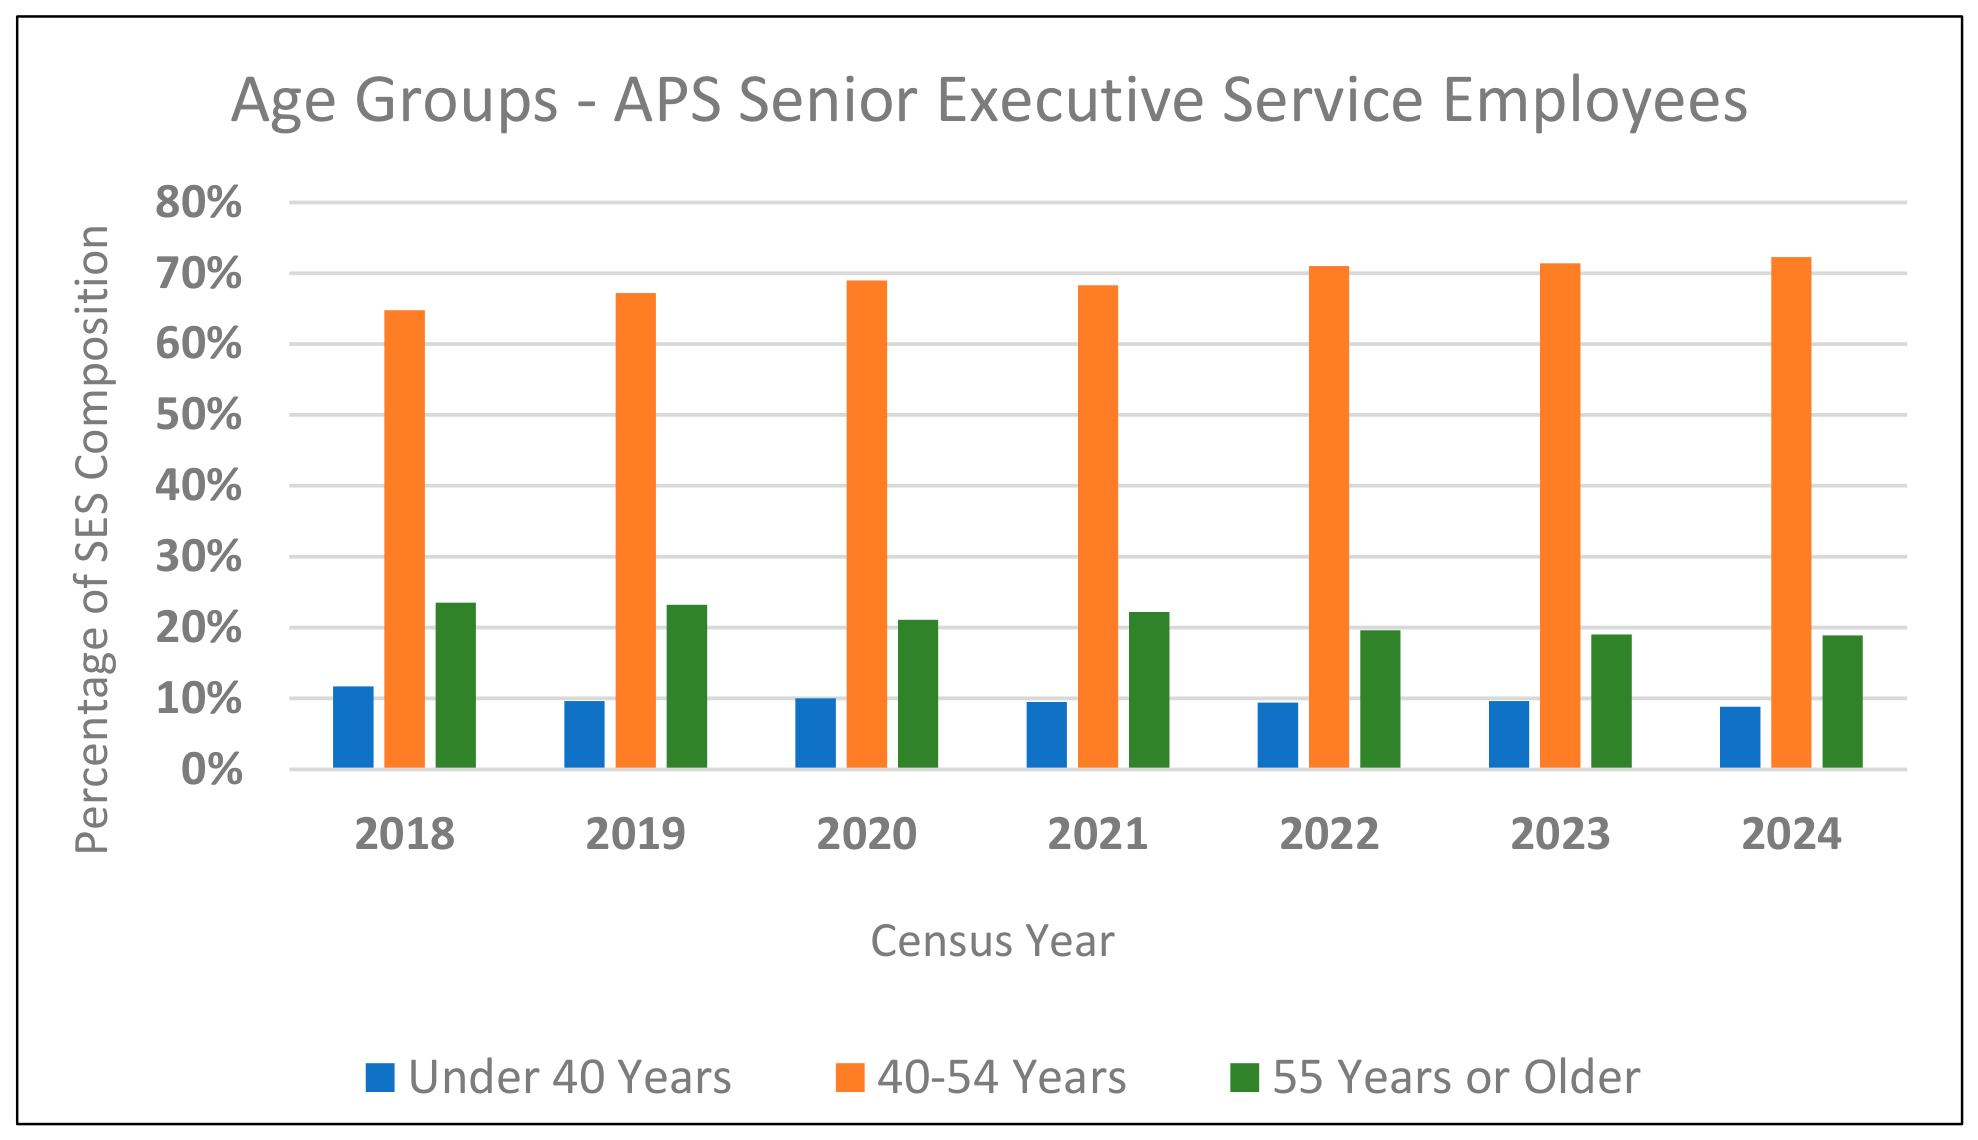
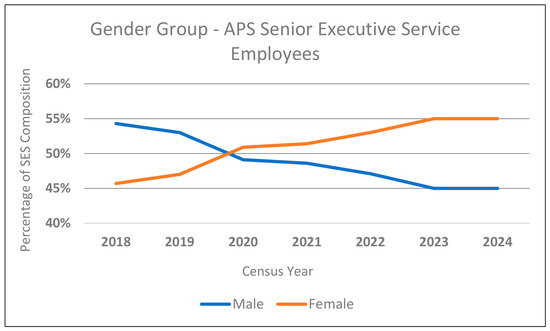
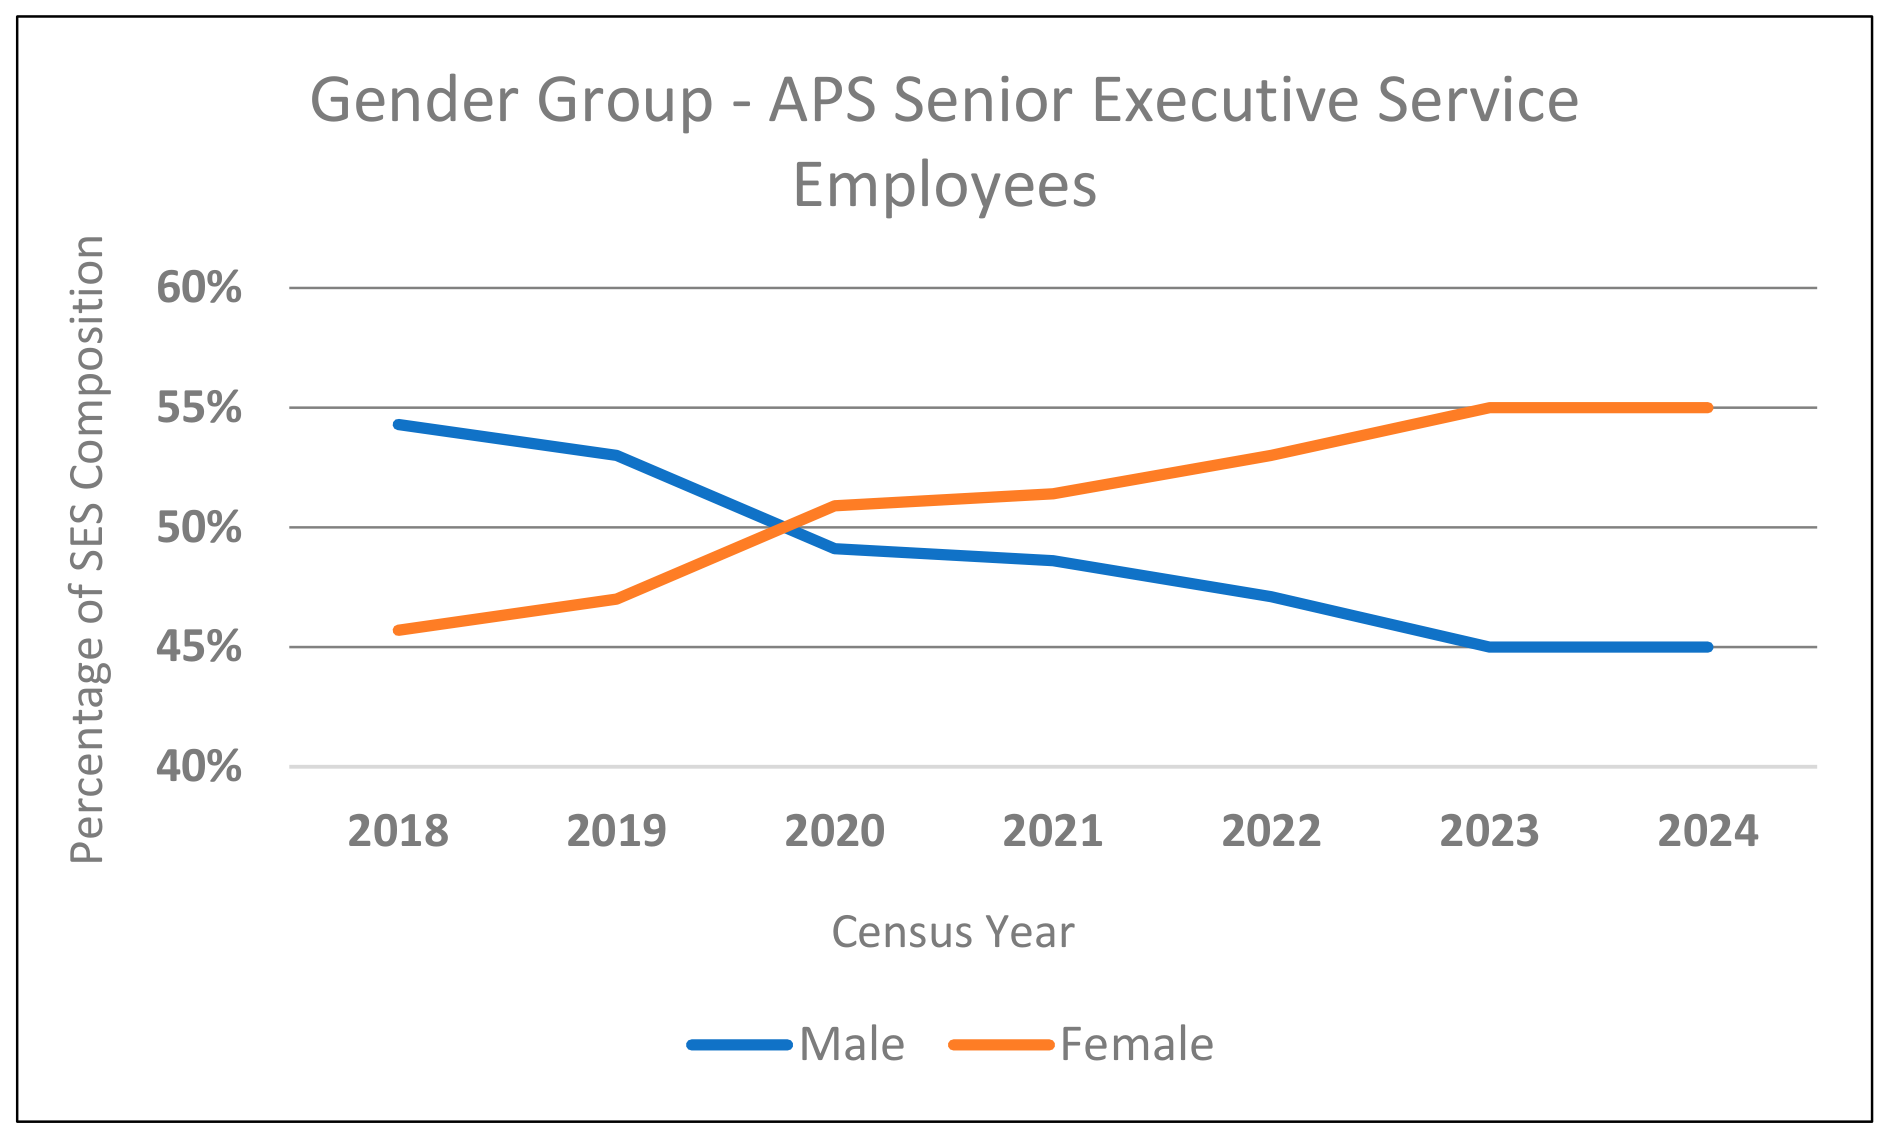
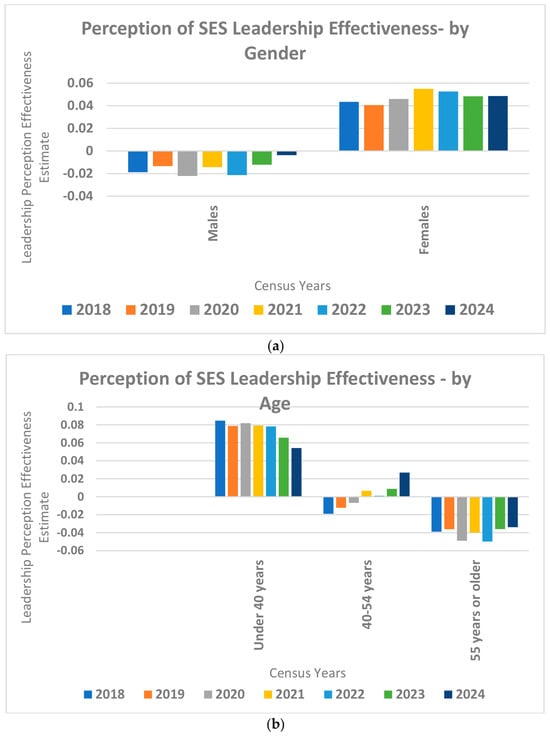
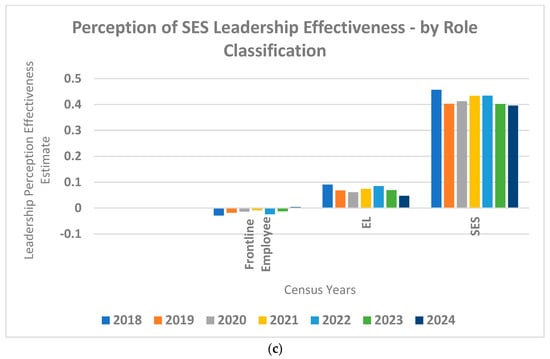
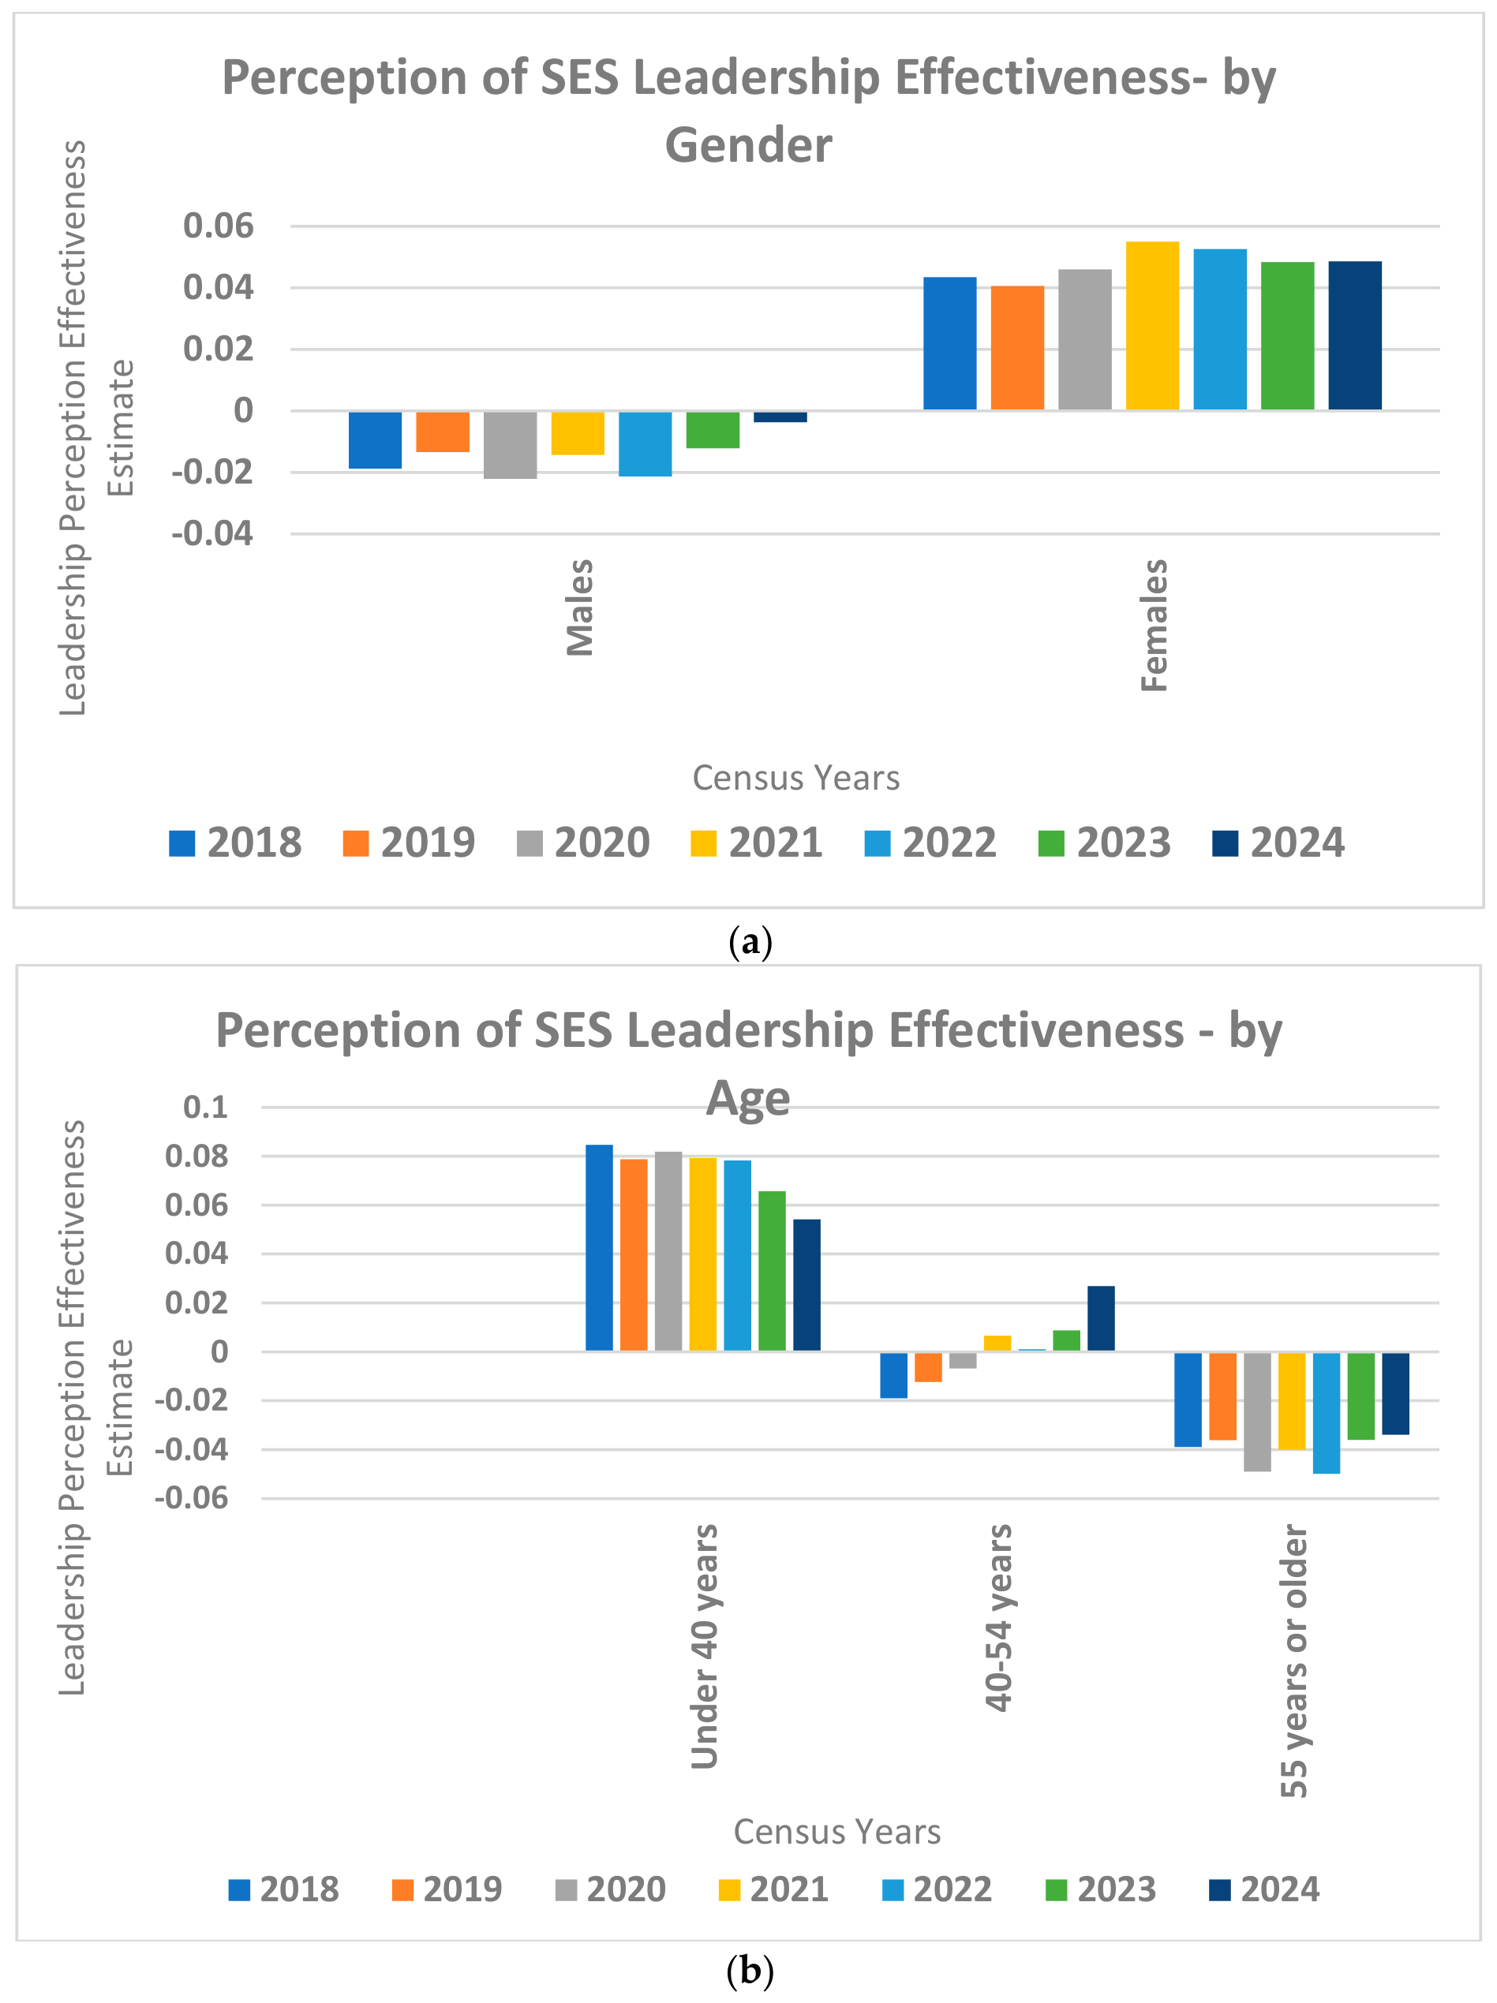
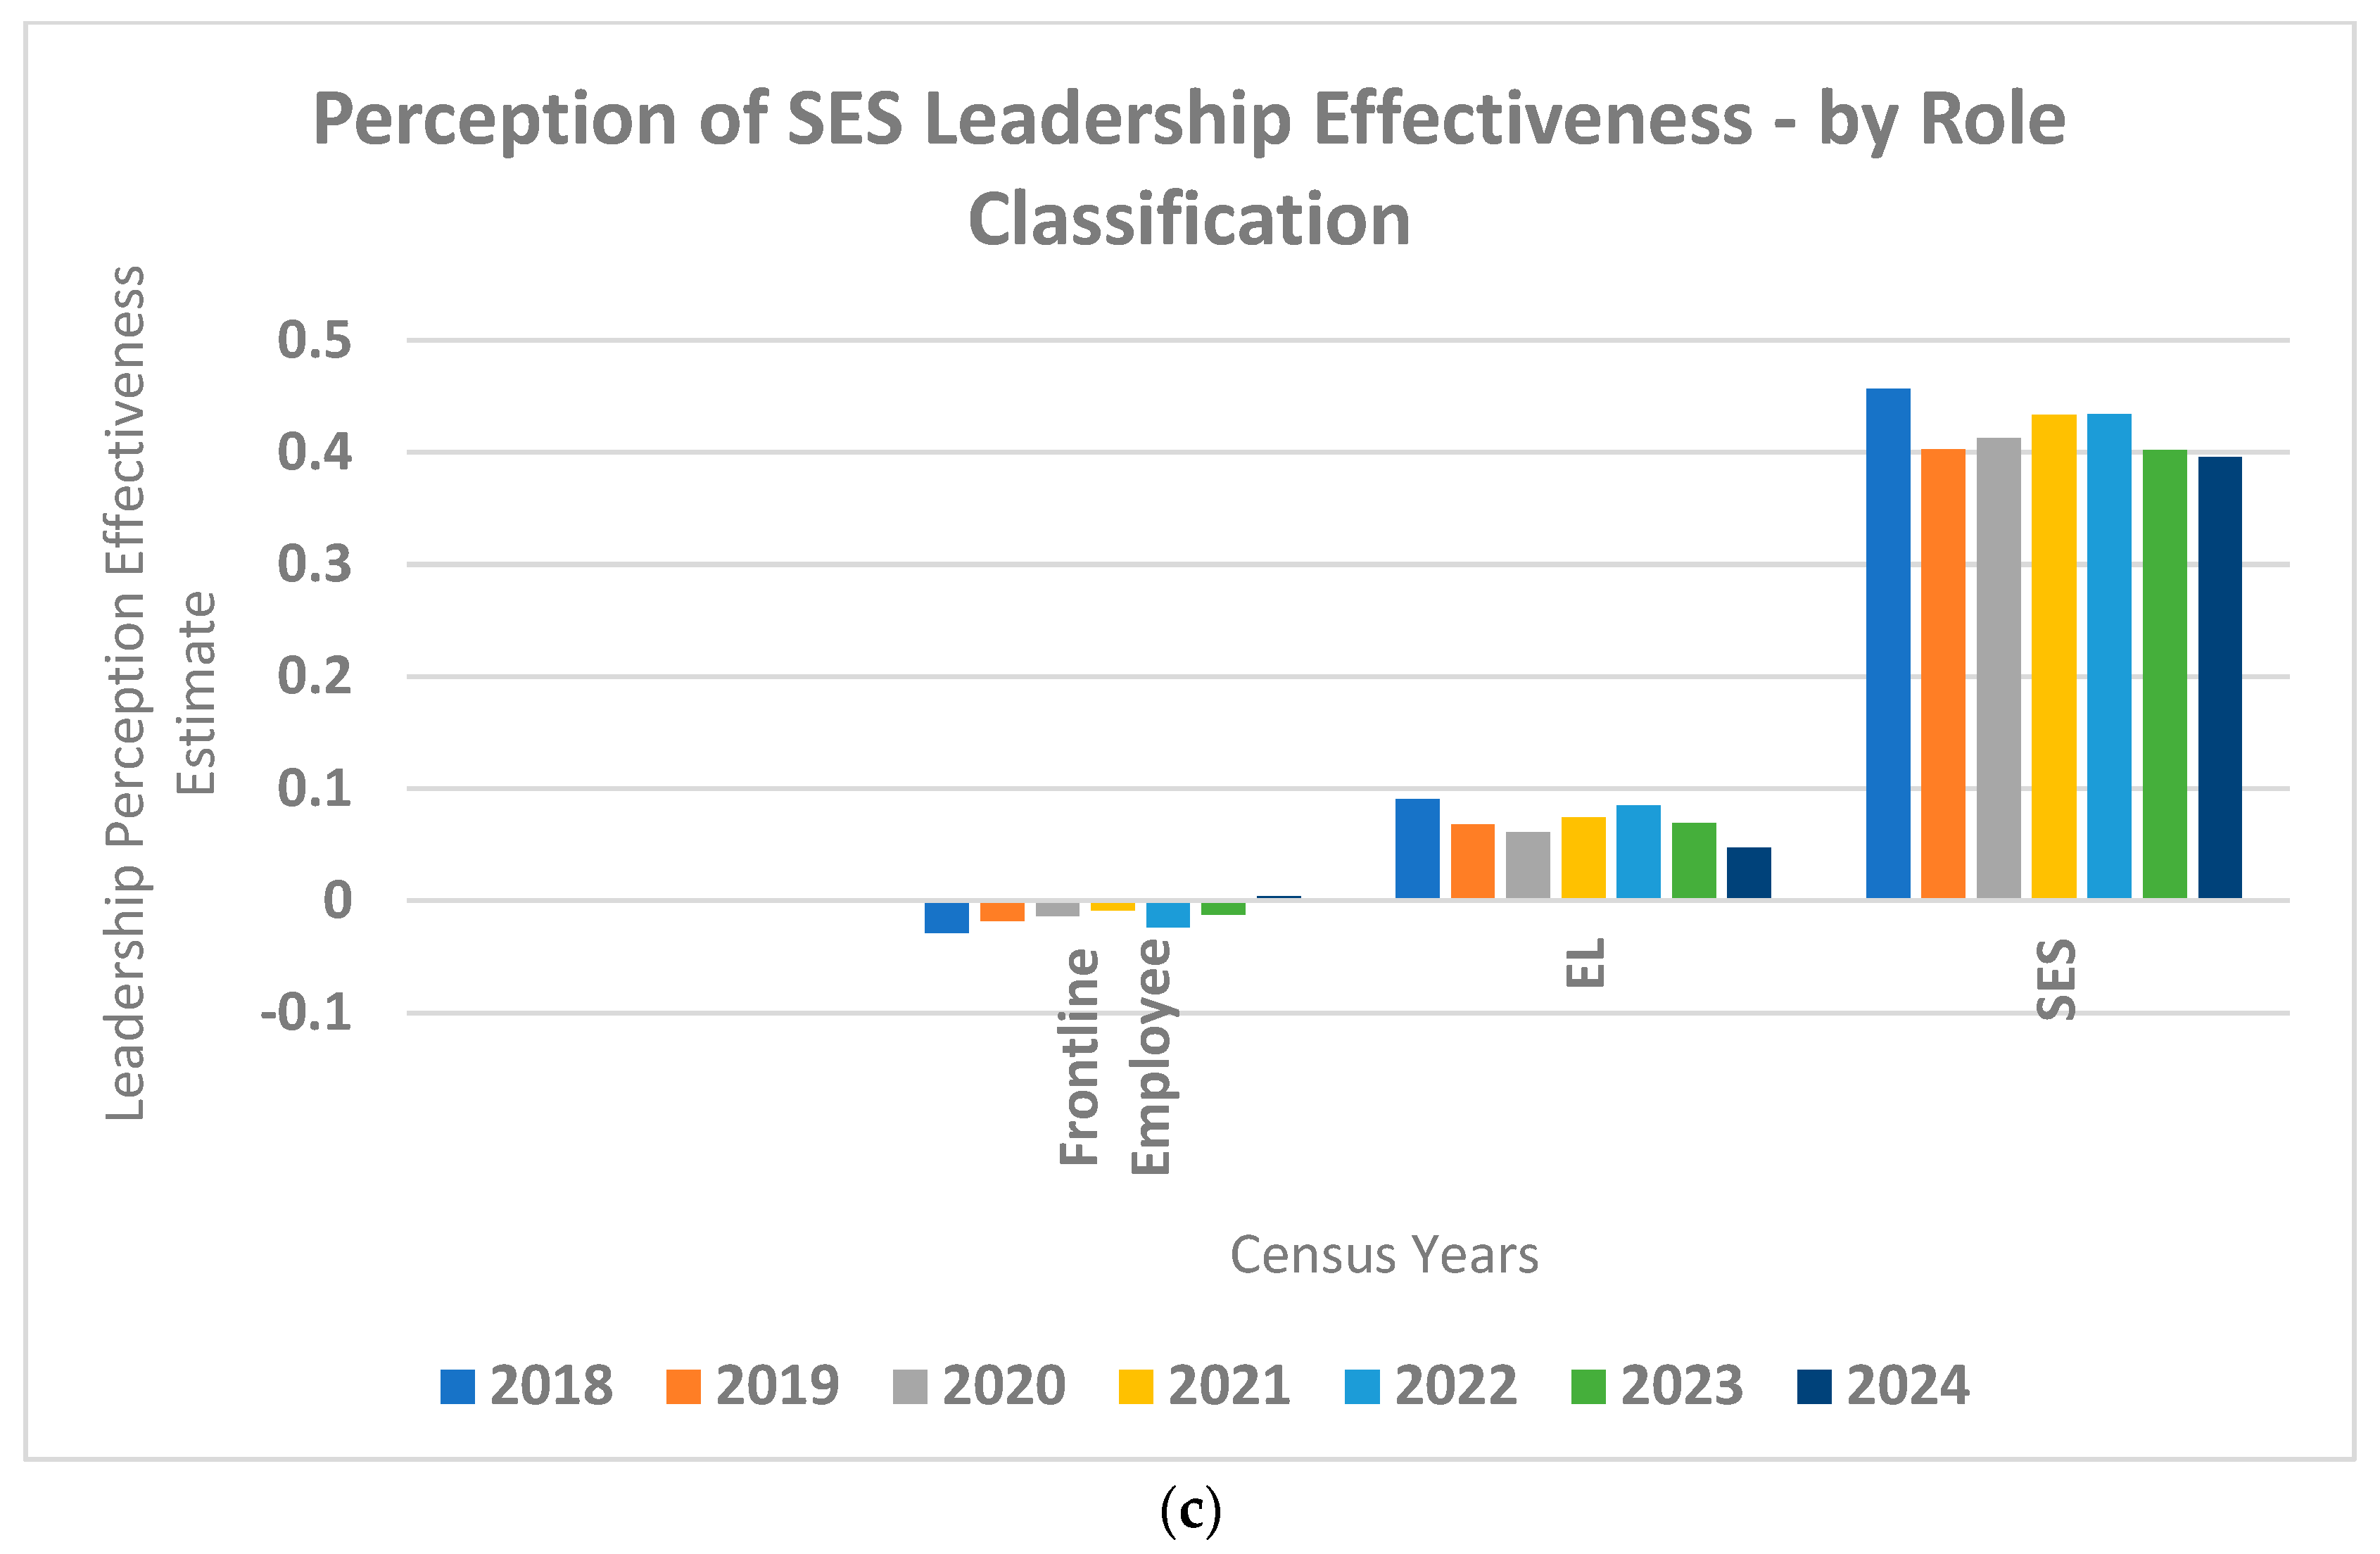

Disclaimer/Publisher’s Note: The statements, opinions and data contained in all publications are solely those of the individual author(s) and contributor(s) and not of MDPI and/or the editor(s). MDPI and/or the editor(s) disclaim responsibility for any injury to people or property resulting from any ideas, methods, instructions or products referred to in the content. |
© 2026 by the authors. Licensee MDPI, Basel, Switzerland. This article is an open access article distributed under the terms and conditions of the Creative Commons Attribution (CC BY) license.