


Abstract
Artificial intelligence (AI) recommender systems operationalize personalized marketing by transforming behavioral data into individualized choice architectures, yet greater model complexity or personalization granularity need not improve every service objective. This study compares population-level item-neighborhood recommendation, behaviorally segmented neighborhood recommendation, and neural collaborative filtering (NCF) across 776,741 deduplicated 1–5 ratings from 646,576 anonymized users and 541 Coursera courses. The primary warm-start evaluation is restricted to 10,296 users (1.59% of the user population) with sufficient interaction history; the remaining sparse-history users contribute to fitting but not to the within-user confirmatory estimand. Configurations are selected only on three validation seeds and then frozen before guarded final evaluation across ten deterministic user-aware seeds. No rank-capable model dominates across objectives: KNN provides the strongest RMSE and personalized-neighborhood coverage profile, ClusteredKNN achieves the strongest observed Top-K retrieval with lower neighborhood support, and a metadata-rich NCF variant achieves the lowest MAE at substantially greater fitting cost. The rating-only UserMean baseline further shows that low numerical prediction error need not imply useful item ranking. Overall, the findings support a contingency view of AI personalization: greater segmentation granularity or model complexity does not inherently create greater value; model choice should instead reflect the service objective, available behavioral evidence, coverage tolerance, operating cadence, and governance requirements.
1. Introduction
Digital platforms increasingly compete through their ability to convert behavioral data into relevant, timely, and individualized service experiences. In marketing, AI expands this capability by supporting prediction, targeting, personalization, and automated decision making at scales that are difficult to achieve through manual analysis (Davenport et al., 2020; Huang & Rust, 2021; Verhoef et al., 2021; Wedel & Kannan, 2016). The strategic significance of AI therefore lies not only in technical prediction, but in how organizations configure data, algorithms, operating processes, and customer-facing decisions.
Recent integrative work likewise positions AI-enabled personalization as part of strategic marketing and customer-experience design rather than as a purely technical capability (Sahut & Laroche, 2025).
Personalization is a particularly visible expression of AI-enabled marketing. It extends the logic of segmentation and targeting from broad customer groups toward increasingly fine-grained treatment and, in the limit, one-to-one decision making (Arora et al., 2008). Recommender systems operationalize this logic by estimating which products, services, or content should be surfaced to a user at the point of choice (Gorgoglione et al., 2019; Ricci et al., 2022). Yet the marketing value of a recommender cannot be inferred from a single offline accuracy metric. A system that predicts historical ratings well may rank unseen alternatives poorly; a model that retrieves relevant items may offer personalized predictions to fewer cases; and a marginal predictive gain may require materially greater training or serving resources (Jannach & Jugovac, 2019; Stalidis et al., 2023).
These tensions are central to current debates on AI in marketing administration. Marketing scholarship has emphasized that AI adoption changes not only analytical capability but also customer experience, organizational routines, transparency, responsibility, and managerial control (De Bruyn et al., 2020). Recent qualitative evidence from European marketing professionals similarly highlights the need to combine personalization with infrastructure, responsibility, and governance rather than treating AI adoption as a purely technical optimization (Komodromos, 2026). The empirical challenge is therefore to evaluate AI personalization as a multi-objective administrative decision.
Digital learning platforms provide a useful setting for this problem. They operate as service marketplaces in which learners search across heterogeneous course catalogs, while course relevance depends on topic, difficulty, prior knowledge, workload, and longer-term goals (da Silva et al., 2023; Tarus et al., 2018; Urdaneta-Ponte et al., 2021). Recommendation can reduce search costs and improve discovery, but a seemingly attractive course may still be unsuitable for a learner. This makes digital learning a domain in which marketing personalization, service quality, and responsible algorithmic design intersect.
Recent digital learning recommender research also combines technical evaluation with learner-facing outcomes: one MOOC system reports ranking quality alongside satisfaction, click-through, dwell time, and completion, while a generative-AI recommender links personalized support to self-regulated learning and academic performance (Luo et al., 2026; Mrayhi et al., 2026).
This study examines three architectures that represent different ways of organizing personalization evidence. Item-based k-nearest neighbors (KNN) learns a shared item-similarity structure from the population and personalizes predictions using each user’s history (Desrosiers & Karypis, 2011). ClusteredKNN first partitions users by rating behavior and then restricts neighborhood evidence to the target user’s cluster, operationalizing behavioral micro-segmentation (Salminen et al., 2023; Sculley, 2010). Neural collaborative filtering (NCF) instead learns user and course embeddings and nonlinear interactions at the individual level (He et al., 2017). These architectures should not be interpreted as a simple ladder from primitive to advanced. Each changes the balance among accuracy, support, interpretability, computational cost, and governance.
The study makes four contributions. First, it conceptualizes population-level neighborhood recommendation, behaviorally segmented neighborhood recommendation, and neural personalization as alternative personalization architectures, framing model choice as a marketing-administration decision rather than only as an algorithm contest. Second, it evaluates recommender value as a multi-objective performance profile, separating rating error, full-catalog ranking and Top-K retrieval, personalized prediction support, and computational cost so that managerial trade-offs remain visible. Third, it evaluates multiple leakage-safe NCF metadata representations without assuming that feature richness creates universal incremental value. Fourth, it uses a guarded validation-to-test protocol: configurations are selected on validation data only, frozen, and then evaluated over ten fixed seeds. This separation limits post-test tuning and makes model governance part of the empirical design (Bergstra & Bengio, 2012; Cawley & Talbot, 2010).
The central theoretical novelty is therefore not a new recommender algorithm or an extension of standard accuracy benchmarking. It is the contingency framing of personalization granularity as a marketing-administration choice: population-level similarity, behavioral micro-segmentation, and individual neural representation can create different value profiles depending on the service objective, evidence density, coverage requirement, operating cadence, and governance constraint.
The resulting research questions are: RQ1: How do population-level neighborhood, behaviorally segmented neighborhood, and neural personalization compare across rating error, full-catalog ranking diagnostics, Top-K retrieval, and computational cost? RQ2: How does increasing user-cluster granularity affect rating error, personalized-neighborhood coverage, usable-neighbor support, and cluster balance? RQ3: How do validation-selected NCF variants using different leakage-safe metadata representations compare across predictive, ranking, and operational outcomes? RQ4: How sensitive are model-selection decisions to the validation criterion, and what governance implications follow from freezing the criterion and configuration before final testing?
The four questions follow directly from the theoretical framework: RQ1 operationalizes the multi-objective view of recommender value; RQ2 tests the proposed boundary condition that finer behavioral segmentation can fragment usable evidence; RQ3 examines whether richer leakage-safe representations create objective-specific rather than universal gains; and RQ4 applies model-governance theory to the choice and freezing of the validation criterion.
2. Theoretical Background
2.1. AI Personalization as a Marketing Capability
AI is increasingly understood as a strategic marketing capability because it can transform large-scale customer data into prediction, recommendation, automation, and adaptive interaction (Davenport et al., 2020; Huang & Rust, 2021). In data-rich environments, such capability can support more granular market sensing and more responsive customer treatment (Verhoef et al., 2021; Wedel & Kannan, 2016). However, the organizational payoff depends on the fit between analytic outputs and the marketing decision being made. The same model may be attractive for one objective and unattractive for another.
Personalization also has an experiential dimension. Automated classification and targeting affect how consumers encounter choice, relevance, control, and transparency (De Bruyn et al., 2020; Puntoni et al., 2021). Consequently, a recommender should be treated as part of a customer-facing service system rather than only as a statistical estimator. This perspective motivates the separation of predictive accuracy from retrieval, availability, and operational considerations.
Recent empirical work further indicates that consumer responses to AI personalization depend on trust, privacy-related perceptions, perceived usefulness, and identity-related concerns, reinforcing the need to evaluate personalization as both a customer-experience and governance problem (Markou et al., 2025; Teepapal, 2025).
2.2. Personalization Granularity: Shared Similarity, Micro-Segmentation, and Individual Representation
Classic one-to-one marketing distinguishes broad segmentation from progressively individualized treatment (Arora et al., 2008). Recommender systems provide an algorithmic implementation of this continuum, but personalization can occur at several levels. A neighborhood model can use a shared population-level representation while producing user-specific scores. A clustered neighborhood model can localize the evidence to a behaviorally similar segment. A neural model can learn user-specific latent representations and nonlinear interaction functions.
This distinction matters because finer segmentation can fragment the evidence needed for reliable estimation. Algorithmic customer-segmentation research emphasizes the potential of data-driven grouping, but also the importance of segment validity and managerial usefulness (Salminen et al., 2023). For neighborhood recommendation, small or imbalanced clusters may reduce co-rating support and increase fallback. Therefore, greater granularity has no theoretical guarantee of monotonic improvement.
Recommender-system research likewise suggests that the value of a recommendation strategy depends on the application context and objective rather than on a universally superior design (Gorgoglione et al., 2019). Applied to AI personalization, this implies that architecture value should depend on alignment with the service objective, available behavioral evidence, coverage requirements, operating cadence, and governance constraints. The study therefore treats personalization granularity as a fit problem: greater segmentation or model complexity should not be expected to improve every outcome monotonically.
2.3. Multi-Objective Evaluation of Recommender Value
Recommender evaluation distinguishes rating prediction from ranked retrieval (Cremonesi et al., 2010; Steck, 2013). RMSE penalizes large numerical misses more heavily, while MAE represents typical absolute deviation. Precision@K and Recall@K ask whether relevant unseen courses enter the top of the catalog ranking. Full-catalog per-user Spearman provides a complementary catalog-ordering diagnostic under the sparse relevance proxy defined below. These metrics answer different questions and should not be collapsed into a single claim of “best model”.
Operational measures add another layer. KNN coverage records the share of held-out predictions that are supported by personalized neighbors rather than fallback. Runtime separates fitting from full-catalog ranking and therefore relates to different operating cadences: a platform may retrain models periodically but regenerate recommendation lists much more frequently. Business value consequently depends on the joint profile of model quality, coverage, and operating requirements (Jannach & Jugovac, 2019).
2.4. Governance of AI Model Selection
Model governance begins before deployment. When a configuration is chosen after repeatedly inspecting final-test results, the nominal test set becomes part of model development and the resulting performance estimate becomes optimistic (Cawley & Talbot, 2010). Hyperparameter search creates the same risk when many candidate configurations are compared without a strict separation between selection and confirmation (Bergstra & Bengio, 2012).
For customer-facing AI, this statistical issue becomes an administrative issue. Managers may prefer whichever final metric appears most attractive—accuracy, Recall, coverage, or cost—but changing the decision rule after seeing final outcomes amounts to post-test tuning. A defensible process therefore requires an explicit validation criterion, a frozen configuration, and a final test that evaluates the decision already made. This study embeds that governance principle in the experimental protocol.
Recent marketing research similarly frames personalization as a test-and-learn problem in which experimentation, causal inference, policy evaluation, and ethical considerations are central to optimization (Lemmens et al., 2026).
3. Materials and Methods
3.1. Dataset and Privacy-Preserving Construction
The study uses the finalized Coursera 2026A snapshot. After cleaning and deterministic user–course de-duplication, the rating matrix contains 776,741 explicit ratings on a 1–5 scale from 646,576 anonymized userKey identities across 541 rated courses. Every rated course has an active metadata record. Displayed reviewer names are not used as user identities. Dynamic popularity or target-adjacent fields—including aggregateRating, ratingCount, and historicalEnrollment—are excluded from model features to reduce leakage risk. Stable content, taxonomy, level, provider, language, workload, access, instructor, and hashed text representations are available for the metadata variants.
For metadata representations, categorical, list, and text fields use stable feature hashing and feature groups are normalized per course; missing metadata values remain zero rather than receiving catalog-wide imputation. Dynamic popularity and target-adjacent aggregates are excluded from predictors. User clustering is fitted from the rating rows available in the fitted partition for that seed, so the clustering representation is not constructed from held-out test ratings.
The matrix is extremely sparse. Density is 0.222%, the median user contributes one rating, 87.47% of users contribute exactly one rating, and 98.41% contribute at most three. Only 10,296 users (1.59%) have at least four ratings and can therefore support the within-user train/validation/test protocol. The remaining sparse users are retained in fitting data but do not contribute to the primary warm-start evaluation. Ratings are also strongly positive: 80.25% are equal to 5. These properties motivate separate evaluation of numerical rating error and full-catalog retrieval. The dataset characteristics are summarized in Table 1.
Table 1.
Coursera 2026A dataset characteristics.
The strong concentration at rating 5 also affects interpretation of the error metrics. When a user’s observed ratings are predominantly high, a user-specific constant such as UserMean can remain numerically close to a held-out rating even though it contains no item-specific information for ranking unseen courses. The skew therefore helps explain the UserMean result and reinforces the separation of rating prediction from recommendation value. We did not rebalance the observed rating distribution, because such reweighting would change the empirical target population; the positive-rating skew is treated as a boundary condition of the present snapshot rather than removed from it.
3.2. Seed-Specific Partitions and Guarded Confirmation
For each seed, users with at least four unique interactions are deterministically shuffled and partitioned approximately 70%/10%/20% into train, validation, and test, with at least two fitted training interactions and at least one validation and one test interaction whenever feasible. Users with one to three ratings remain training-only. The same seed-specific partition is applied to every model, reducing split-induced confounding.
Hyperparameter and checkpoint selection uses only Seeds 1–3. The selected configuration is then frozen before guarded final evaluation across Seeds 1–10. Final jobs refit the selected configuration on the seed-specific fitted partition (train plus validation) and evaluate it once on the held-out test subset. No final-test metric is permitted to change a hyperparameter, checkpoint, feature representation, or selection rule.
The ten indexed seeds are repeated user-aware holdouts of the same underlying interaction dataset, not ten independent replications or a fully isolated external confirmation sample. Within each seed, train, validation, and test subsets are disjoint and the test subset is not consulted during configuration or checkpoint selection; across seeds, however, a given interaction can occupy different roles. “Guarded” therefore refers to the procedural safeguard that the selection rule, hyperparameters, feature representation, and chosen configuration are frozen before final evaluation and are not revised in response to final-test outcomes.
3.3. Compared Methods
Three rating-only or nonpersonalized references are retained for context. GlobalMean predicts the fitted global average; UserMean predicts a user-specific constant for all unseen courses; and ItemMean predicts a course-specific mean and is therefore rank-capable. UserMean is especially important analytically: it can achieve low numerical error while providing no learned item discrimination within a user’s unseen catalog.
The primary rank-capable recommender families are: (1) ItemKNN, which predicts from previously rated courses using shrinkage-weighted item similarities and a baseline adjustment (Desrosiers & Karypis, 2011); (2) ClusteredKNN, which first clusters users from their rating profiles and restricts co-rating evidence to the target user’s cluster (Sculley, 2010); and (3) NCF, an explicit-rating multilayer perceptron with learned user/item embeddings, biases, and optional course metadata (He et al., 2017). The NCF variants use none, level, skills, taxonomy, context (level, provider, language, workload and access), content (content combines skills, taxonomy and text) or all-safe metadata (all-safe concatenates every listed leakage-safe group). Hashed high-dimensional representations use stable feature hashing (Weinberger et al., 2009), and neural models are implemented in PyTorch (Paszke et al., 2019).
For reproducibility, the implementation details relevant to the comparison are clarified as follows. ClusteredKNN constructs user profiles from the fitted user–course rating rows for the relevant partition; candidate configurations may apply SVD and row-wise L2 preprocessing before clustering, after which co-rating evidence and usable neighbors are restricted to the target user’s fitted cluster. If KNN has no supported similarity or usable user-rated neighbor for a prediction, it returns the fitted item-mean fallback and records that case as fallback rather than personalized-neighborhood coverage. NCF is trained as an explicit-rating regressor by minimizing mean squared error with Adam; the validation grid varies embedding size, hidden architecture, learning rate, weight decay, and gradient clipping, while the declared metadata representations use only leakage-safe fields.
3.4. Validation Search and Selection Rule
The validation sweep evaluates 6 KNN configurations (18 observations: 6 configurations × 3 seeds), 252 ClusteredKNN configurations (756 observations), and 432 configurations for each NCF representation (1296 observations per NCF family). These counts describe the full search space, not the number of models in final testing. Each configuration is observed on Seeds 1–3; one configuration per method is selected and frozen.
The primary rule minimizes a balanced normalized RMSE + MAE score. Within each method family, validation RMSE and MAE are scaled relative to the best observed value for that metric and combined. For KNN families, a configuration is eligible only if personalized-neighborhood coverage is at least 0.90 in every validation seed. A separate sensitivity analysis asks what would have been selected under RMSE-only or MAE-only criteria. This sensitivity analysis does not alter the prespecified final decision. Appendix A reports the complete KNN user-cluster sensitivity distributions across the validation search. These diagnostics are reporting-only: apart from the prespecified 0.90 coverage feasibility constraint, they do not create an additional selection rule or alter the frozen configurations. Detailed validation-selected hyperparameters are reported in Appendix C (Table A2) to preserve reproducibility while keeping the main text focused on the selection logic.
More explicitly, for each method family, the combined score is the equal-weight mean of the relative validation regrets, 0.5[(RMSE/RMSEmin) − 1] + 0.5[(MAE/MAEmin) − 1], where the minima are taken within that family’s validation search. Equal weighting was chosen as a prespecified neutral compromise between sensitivity to large errors (RMSE) and typical absolute deviation (MAE), not as a claim that 50/50 weighting is universally optimal. The accompanying RMSE-only and MAE-only selections represent the two extreme weighting cases and show that criterion choice matters much more for NCF than for KNN. The 0.90 KNN coverage floor is likewise an operational feasibility constraint rather than a theoretically optimal cutoff: it prevents a low-error configuration from qualifying when a substantial share of its predictions is supplied by the non-neighborhood fallback rather than personalized neighbor evidence.
3.5. Evaluation Metrics
RMSE and MAE are the primary rating-error estimands. RMSE gives greater weight to large errors, whereas MAE reflects typical absolute deviation.
Full-catalog per-user Spearman is reported for rank-capable recommenders. For each ranking-eligible user, observed held-out ratings retain their 1–5 values and all other unseen candidates receive the assumed-nonrelevant label 0; ρ is computed within user over the unseen candidate catalog and macro-averaged across users and seeds. Because unobserved courses are not verified negatives, this is a sparse-observation retrieval diagnostic, not a fully observed catalog-rating correlation or an online acceptance probability.
For full-catalog Top-K evaluation, candidates are all fitted-catalog courses not present in the user’s fitted history. A held-out course is defined as relevant when its observed rating is at least 4. Precision@K is the number of relevant courses in the Top-K list divided by K; Recall@K is the number of relevant courses in the Top-K list divided by the user’s total number of relevant held-out courses. Metrics are macro-averaged across users with at least one relevant held-out course and then averaged equally across seeds. Unobserved courses are unknown rather than verified negatives, so these measures should not be interpreted as online acceptance probabilities (Cremonesi et al., 2010; Steck, 2013).
Precision@10 and Recall@10 are emphasized in the main text as a practical representative cutoff. User-centric recommender research shows that recommendation-list length affects attractiveness, satisfaction, and choice difficulty; in experiments comparing 5-, 10-, and 20-item recommendation sets, lists of at least 10 items appeared favorable for attractiveness and satisfaction, while longer lists also increased choice difficulty (Willemsen et al., 2016). Results at K = 5 and K = 20 are retained in Appendix B as cutoff-robustness checks. The choice of K = 10 is presentational only and did not influence model selection.
For KNN, personalized-neighborhood coverage is the share of held-out predictions supported by usable neighbors; fallback is its complement. Runtime is separated into fitting, direct rating inference, and full-catalog ranking. Timing comparisons describe the reported hardware/software environment and are not hardware-independent benchmarks.
3.6. Computing Environment
Experiments were executed in a controlled Linux CPU/GPU environment. Validation scheduled CPU KNN and GPU NCF work concurrently, whereas guarded final jobs were executed serially to improve within-environment runtime comparability. Full hardware and software specifications are provided in Appendix C.
3.7. Use of Generative AI in Manuscript Preparation
OpenAI ChatGPT 5.5 (accessed August 2026) was used during manuscript preparation to assist with manuscript organization and language revision. It was not used to modify the underlying dataset, execute the reported model training or evaluation, or alter the frozen experimental outputs. All AI-assisted text and interpretations were reviewed by the authors against the source data.
4. Results
4.1. Validation Criterion Sensitivity and Model-Selection Governance
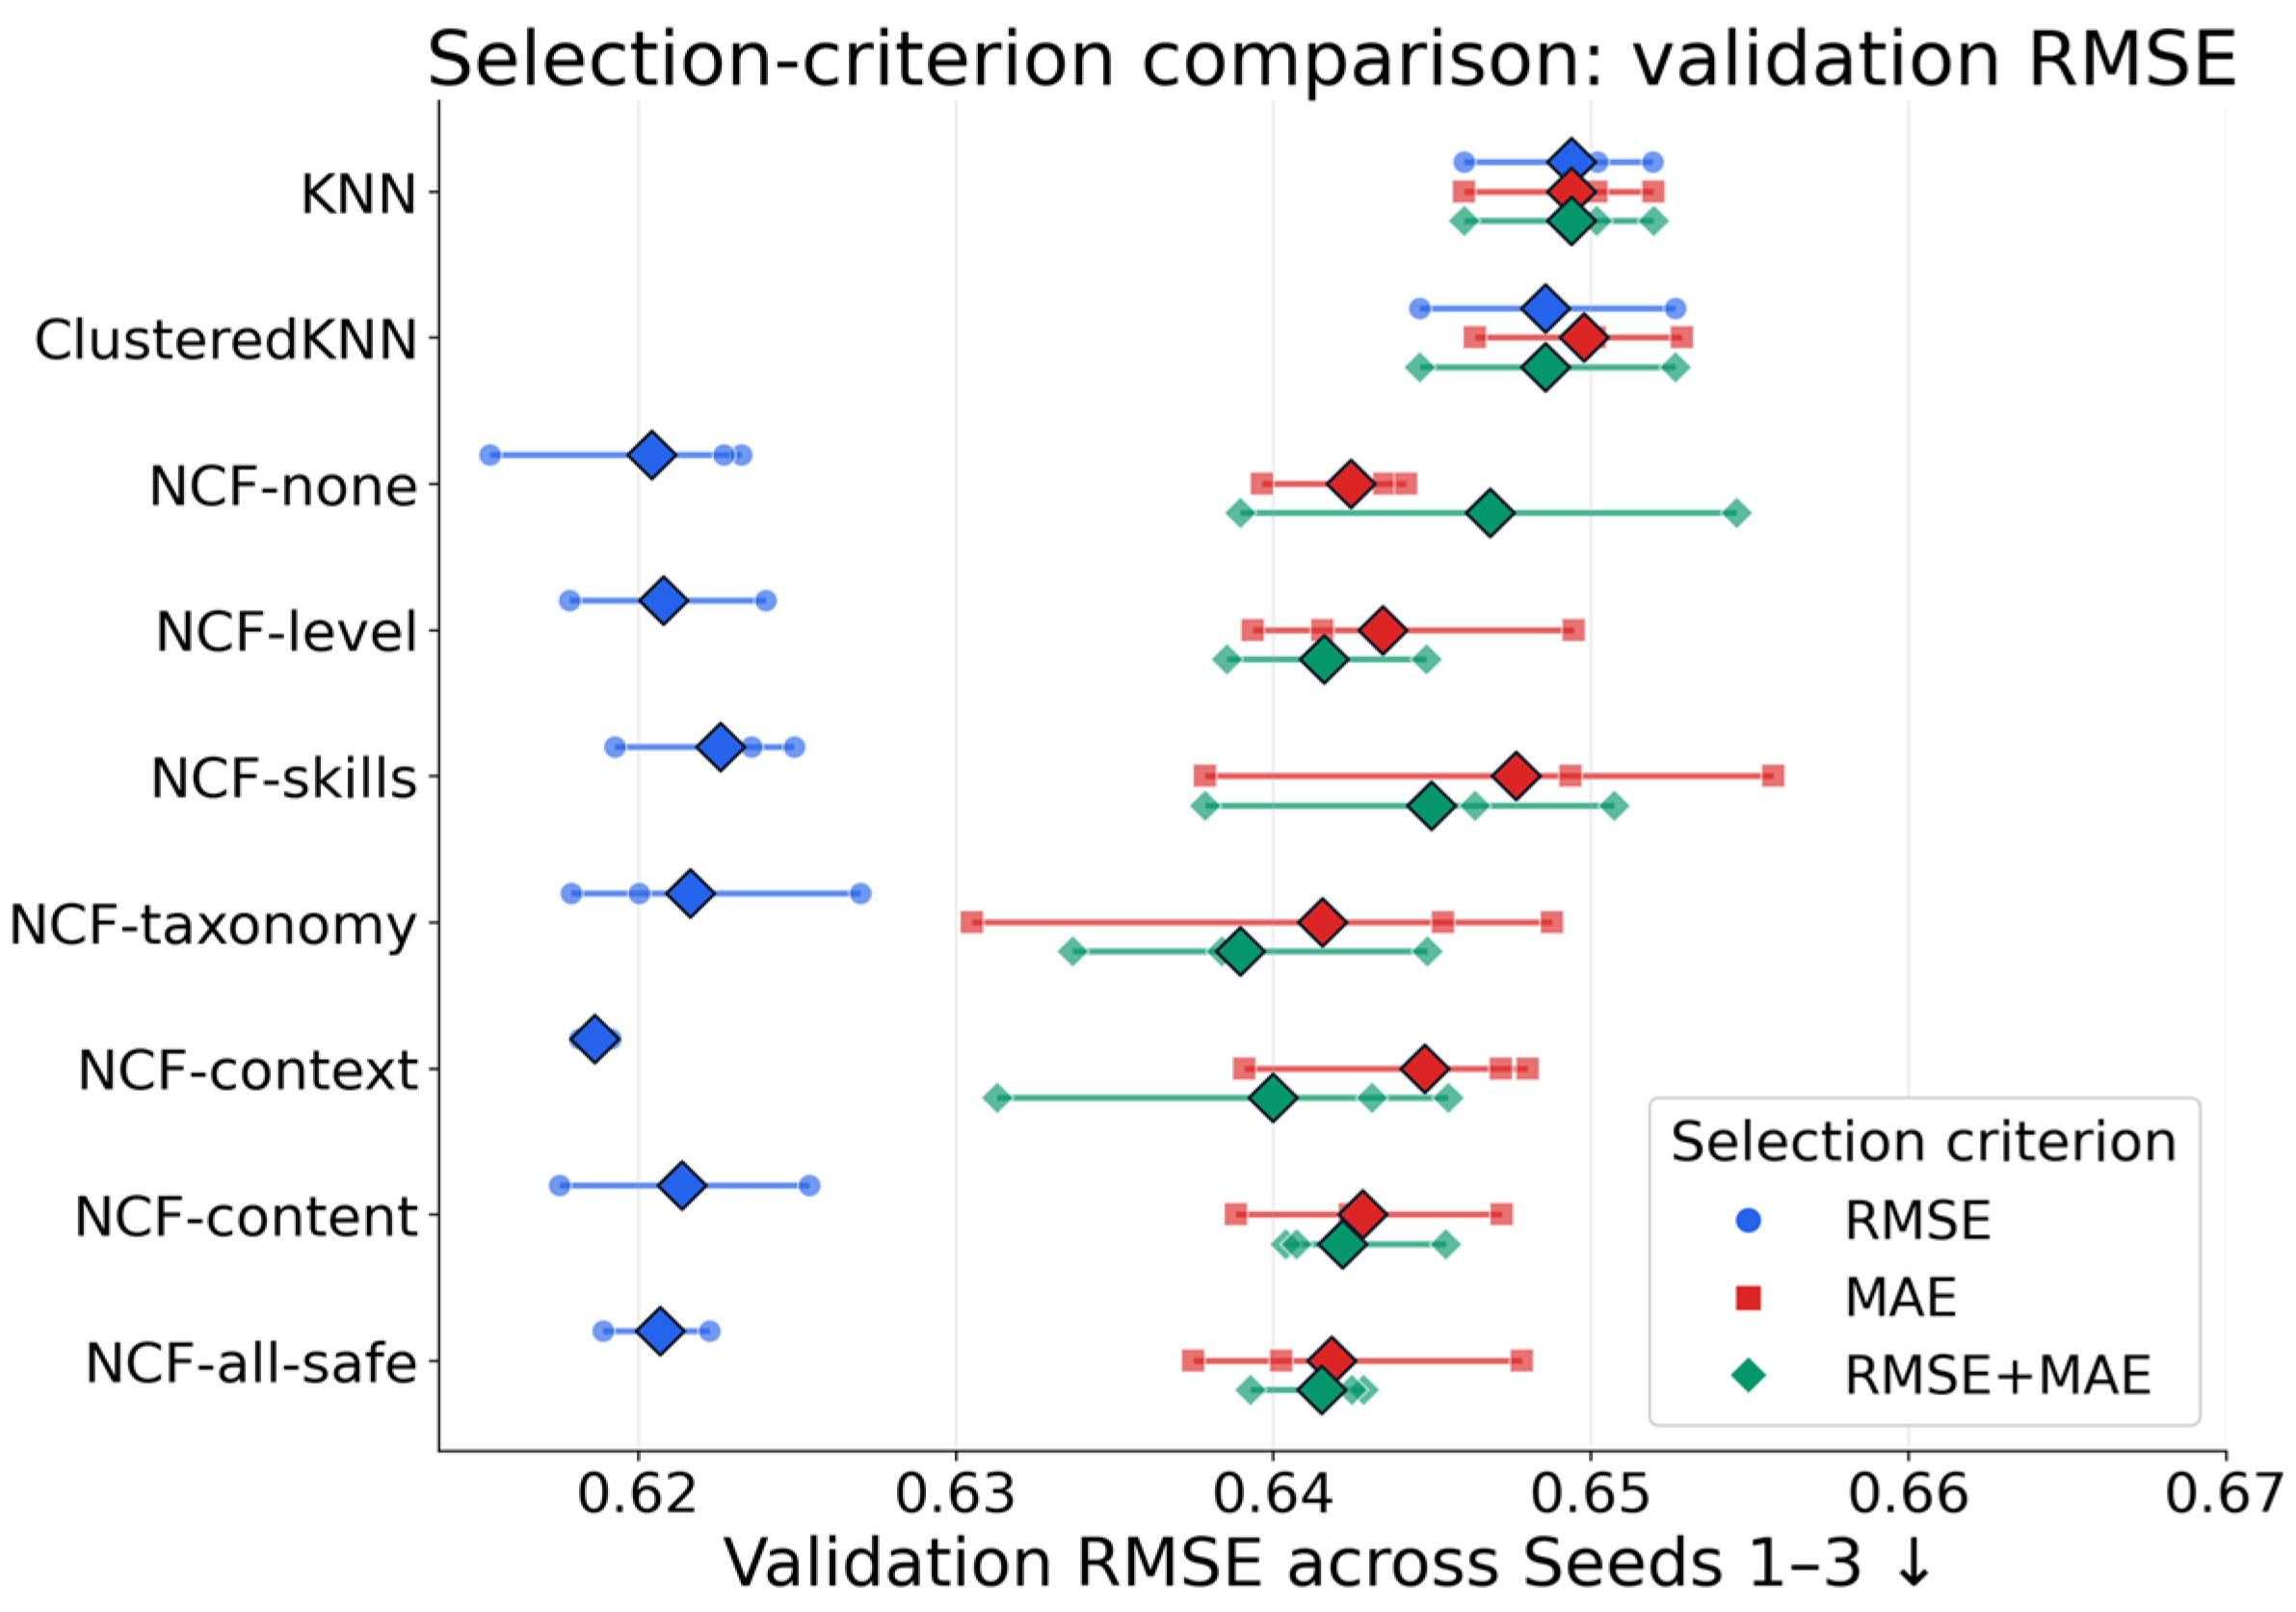
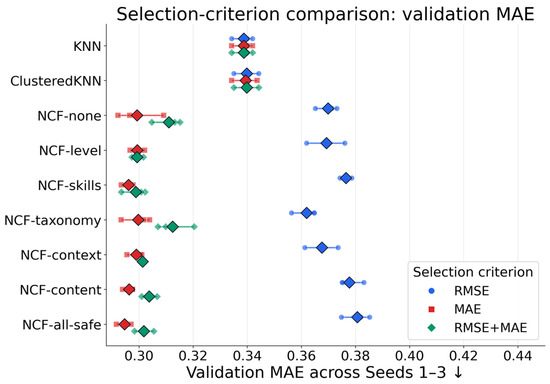
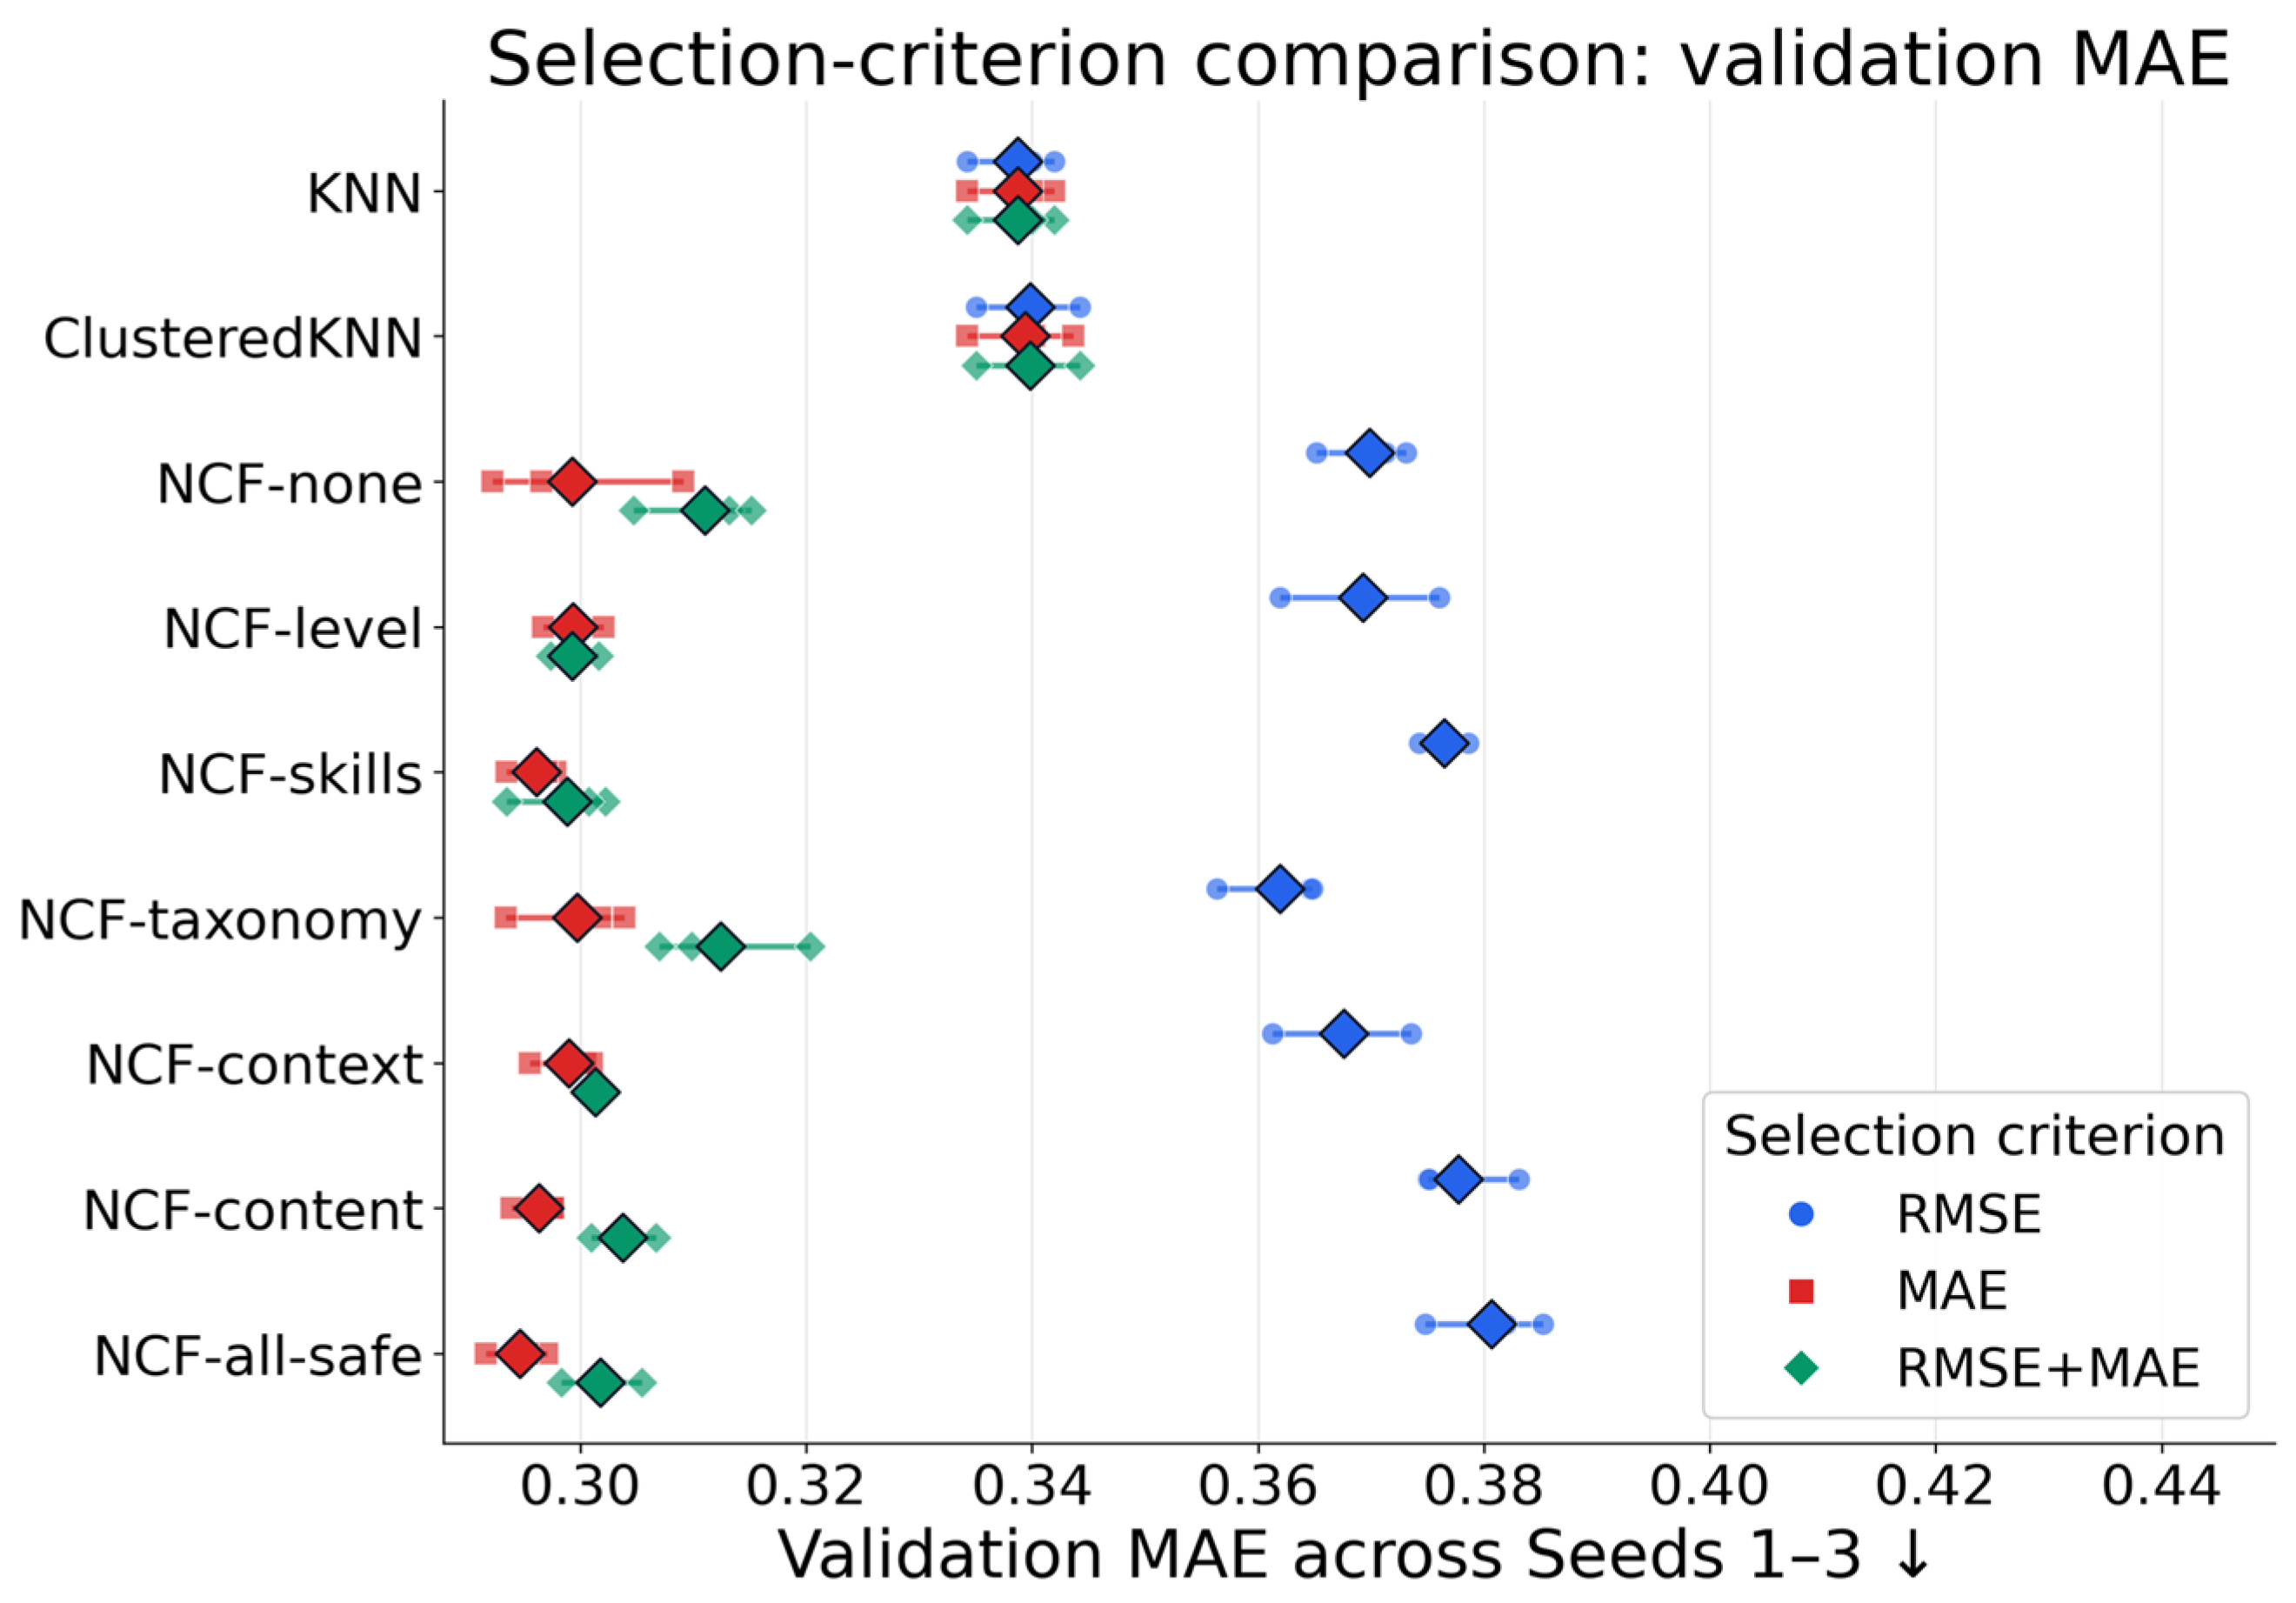
The full validation distributions show that KNN search outcomes are comparatively compact, whereas NCF outcomes vary more strongly across hyperparameters and checkpoints. The sensitivity comparison sharpens this point. For KNN and ClusteredKNN, RMSE-only and MAE-only selection produce closely aligned validation outcomes. For NCF, the configuration favored by RMSE can have materially worse MAE, and the configuration favored by MAE can sacrifice RMSE. The normalized RMSE + MAE rule therefore functions as a prespecified compromise rather than a claim that the combined score is universally optimal. The validation-error patterns are shown in Figure 1 and Figure 2.
Figure 1.
Validation RMSE of criterion-selected configurations across Seeds 1–3.
Figure 2.
Validation MAE of criterion-selected configurations across Seeds 1–3.
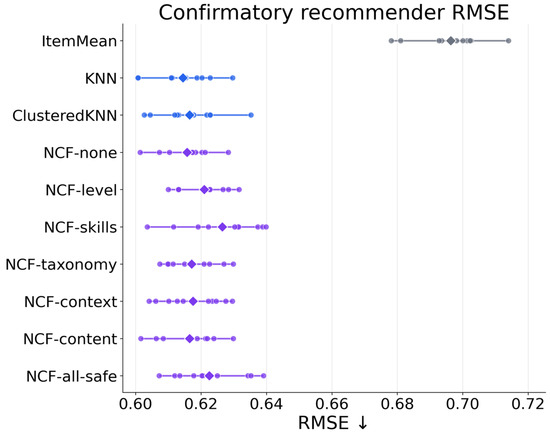
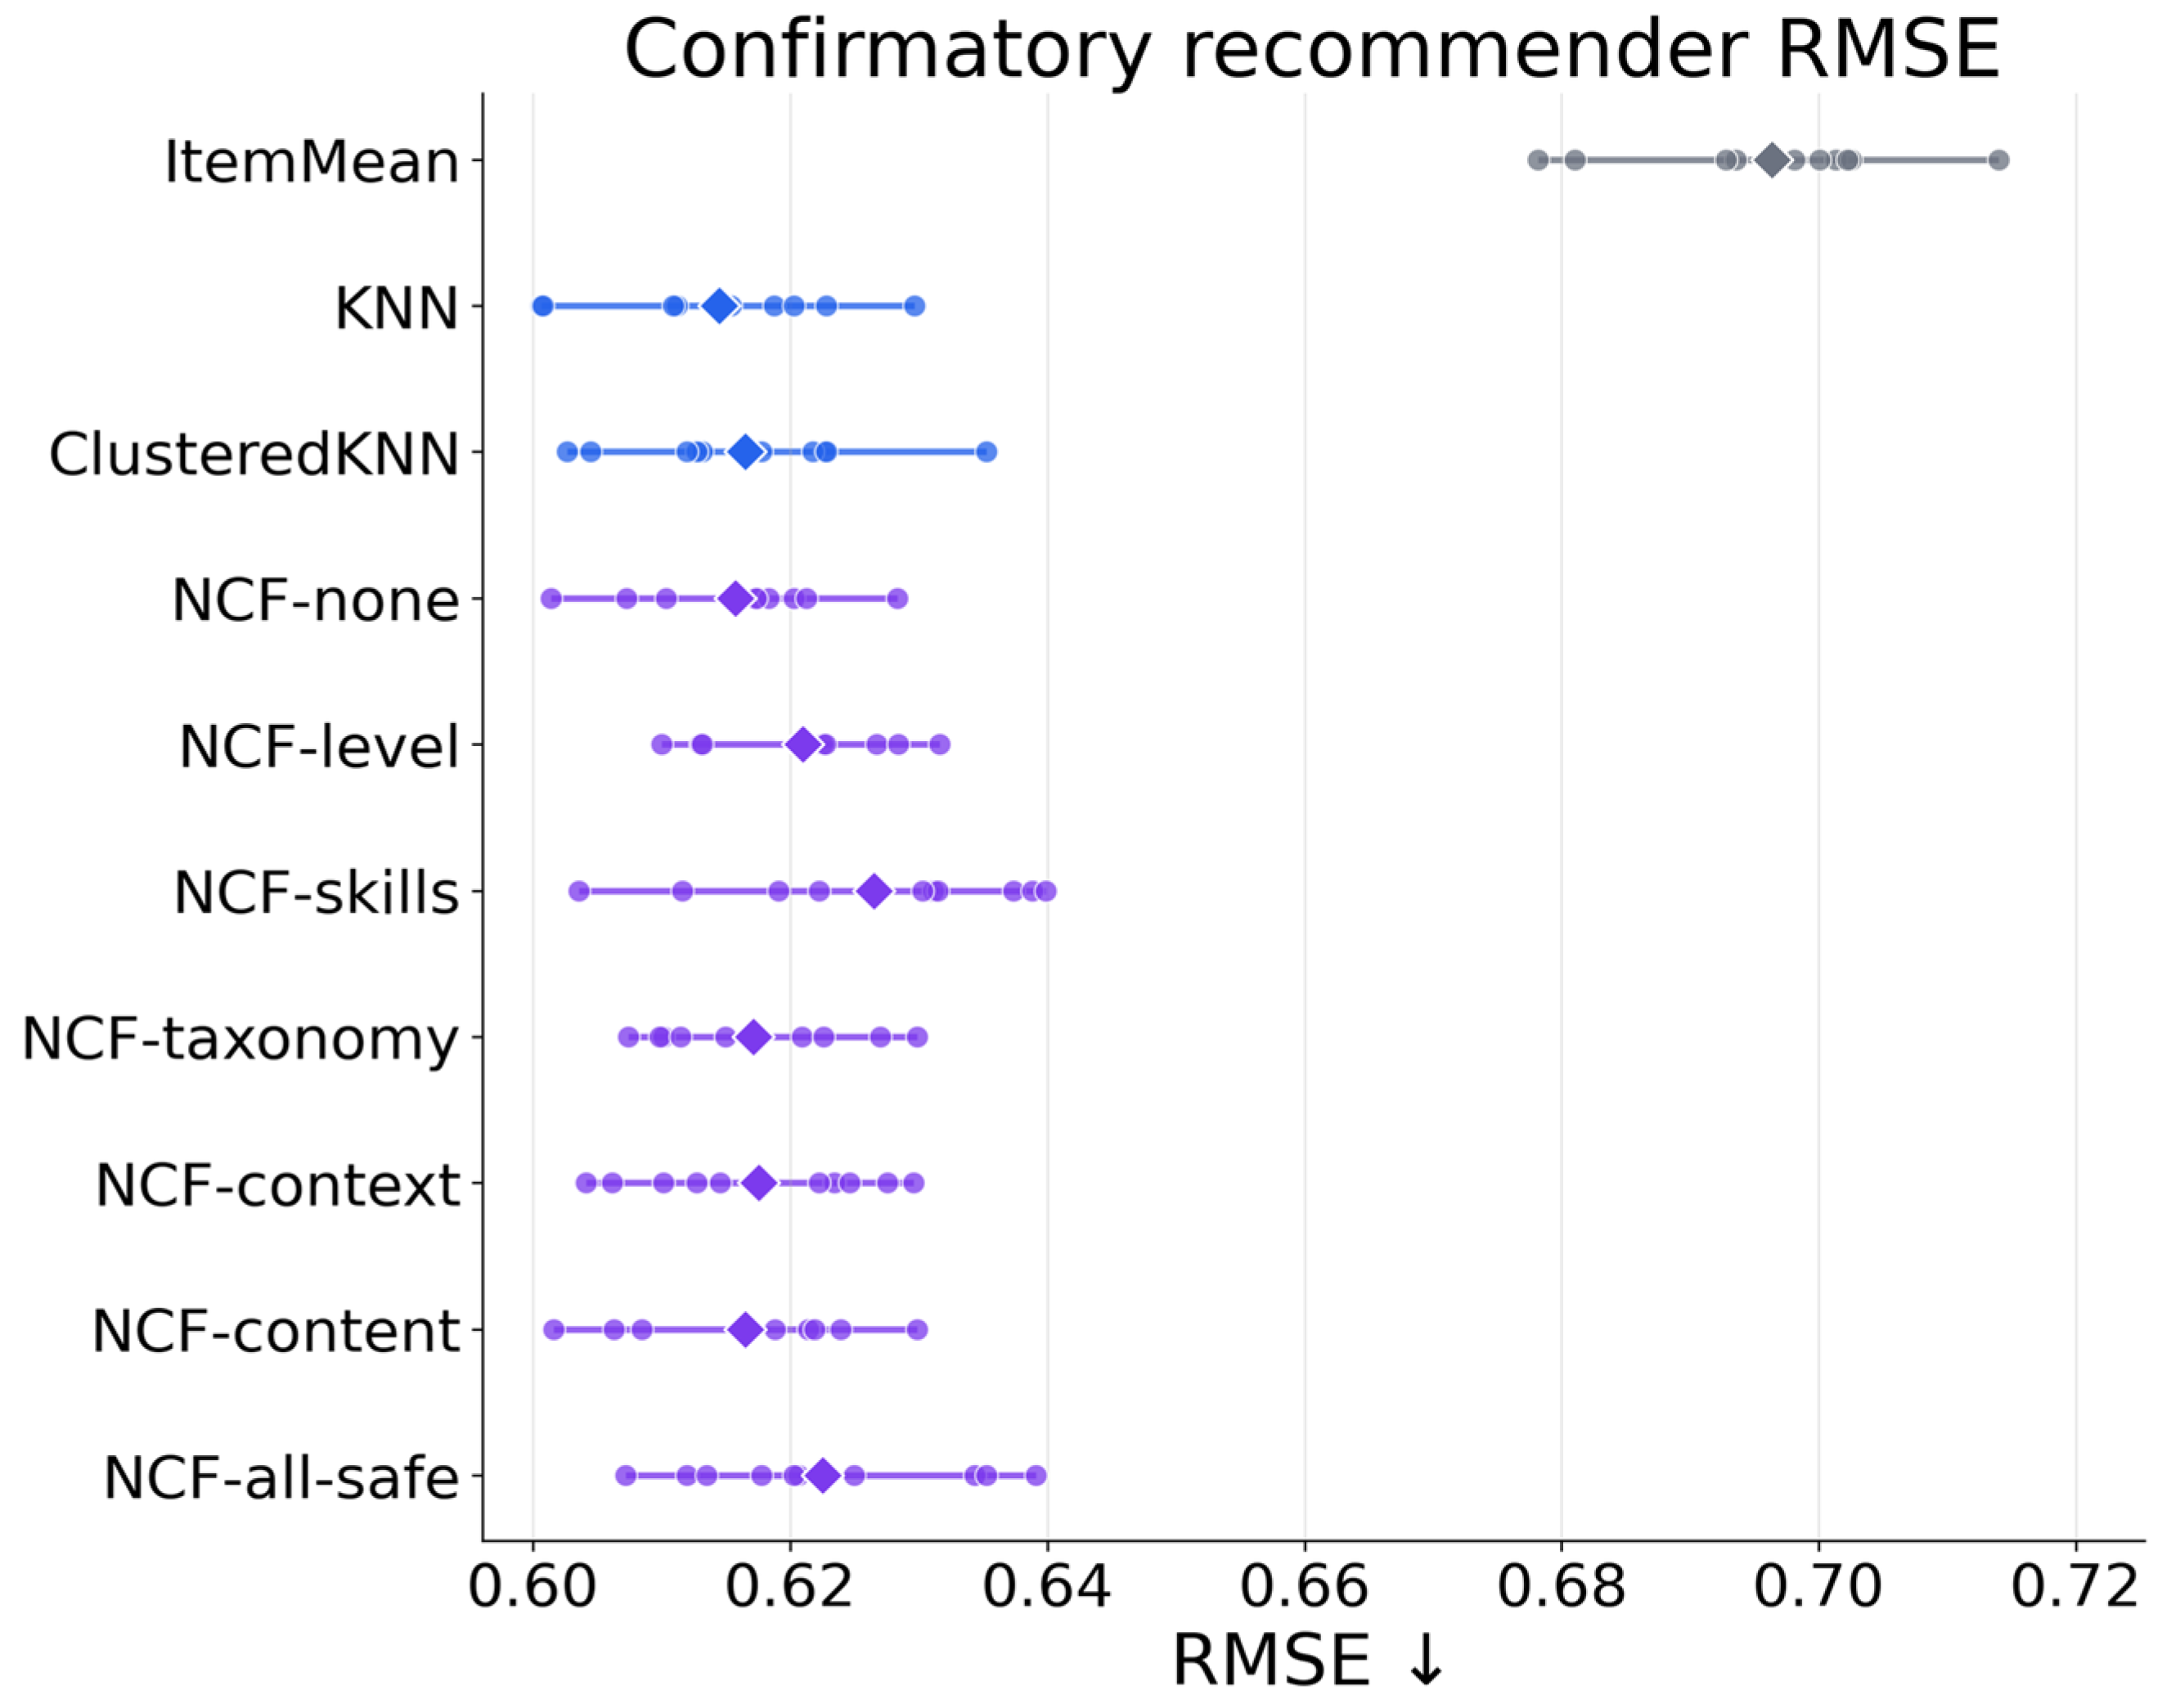
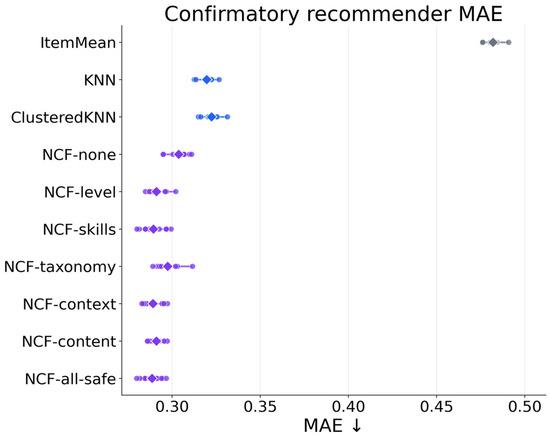
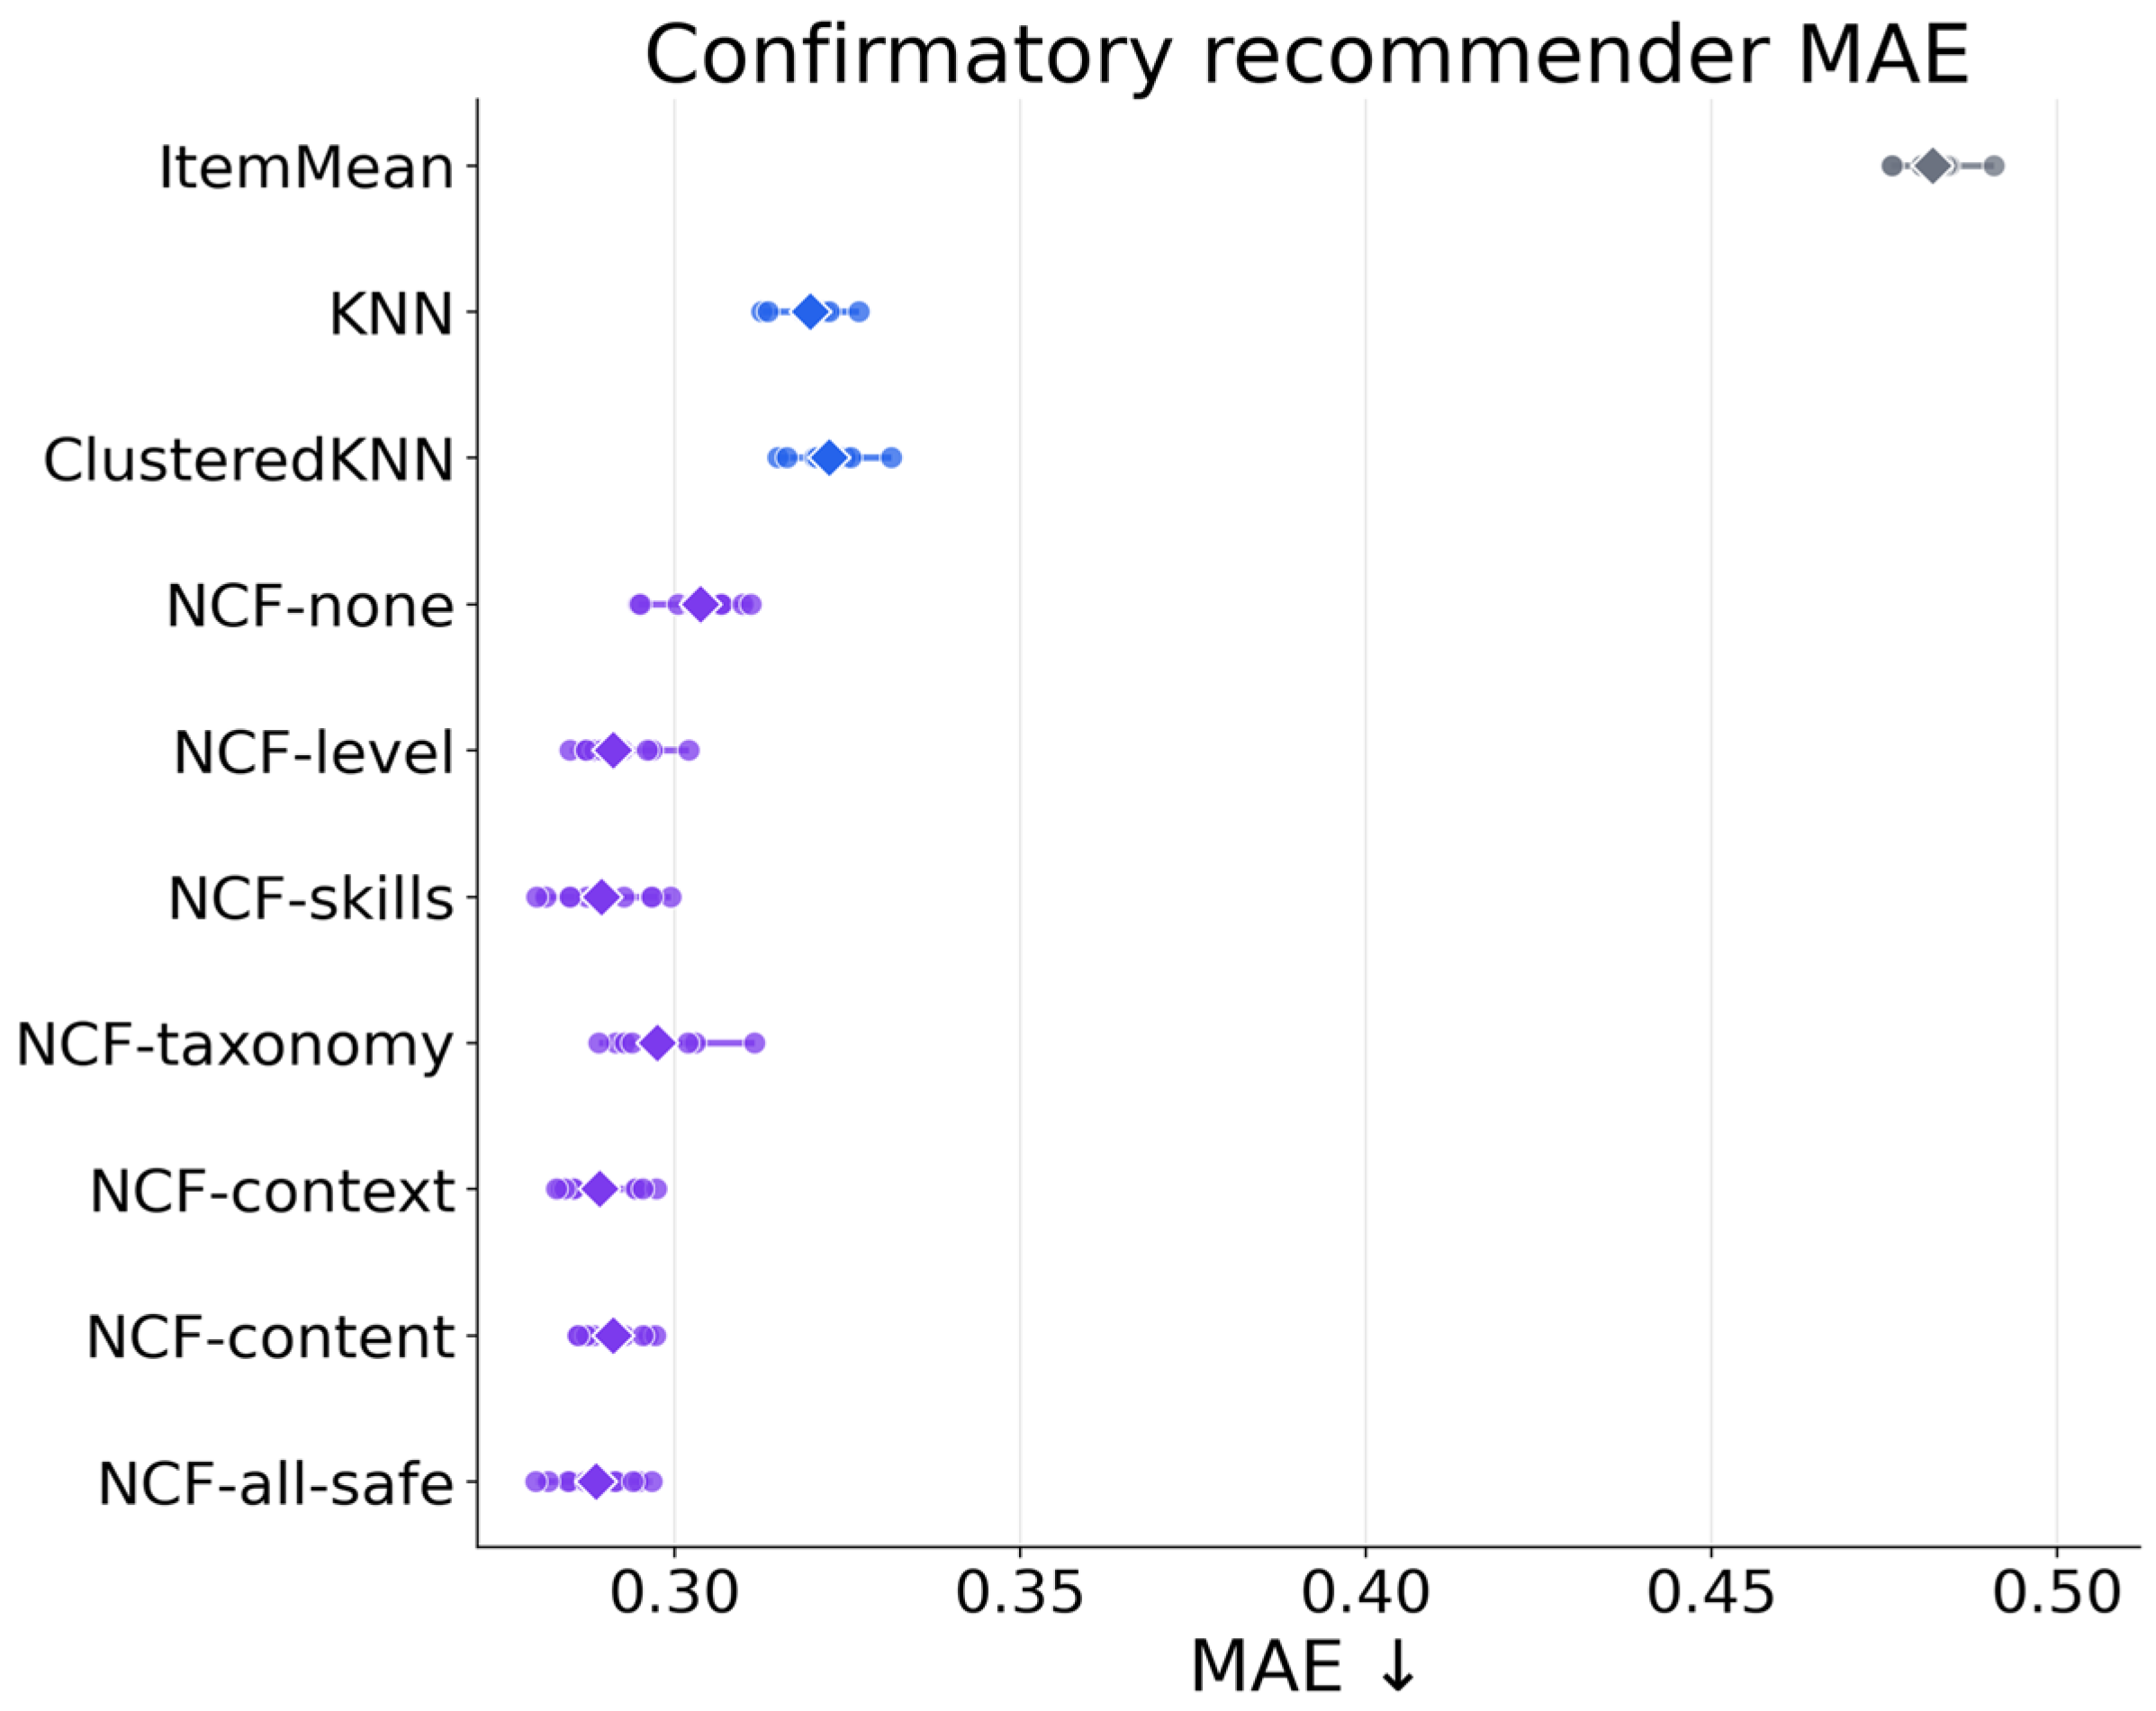
In Figure 1 and Figure 2, the horizontal segments span the three observed validation-seed values for the criterion-selected configuration. In seed-range plots, the larger diamond is the arithmetic mean across the displayed seed values; this convention is stated here rather than repeated in every legend. Throughout the figures, the directional arrow in an axis label states the preferred direction of that metric: ↓ means that lower values are preferable (for example RMSE, MAE and runtime), whereas ↑ means that higher values are preferable (for example coverage, Spearman correlation, Precision and Recall). The arrow is a visual reading aid only and does not denote a statistical test or a selection threshold. In Figure 3 and Figure 4, the analogous horizontal segments span the ten guarded final-seed values and the larger marker again denotes the arithmetic mean. These ranges are descriptive summaries of realized seed variation; they are not confidence intervals and do not imply independent replication.
Figure 3.
Ten-seed confirmatory RMSE for rank-capable recommenders.
Figure 4.
Ten-seed confirmatory MAE for rank-capable recommenders.
This result directly addresses RQ4. The criterion is consequential for neural models, which means that a manager can obtain different “best” configurations depending on which loss is emphasized. The governance safeguard is procedural: the criterion and configuration are chosen on validation data and frozen before final testing, so a favorable final metric cannot retrospectively redefine the selection objective.
4.2. Confirmatory Rating Accuracy and the UserMean Paradox
Across the ten guarded final seeds, the rating-only UserMean baseline attains the lowest numerical RMSE (0.6086) and MAE (0.2878) of all reported methods. This does not make it the best recommender: for a fixed user, UserMean assigns the same score to every unseen course and therefore cannot learn an item-specific ranking. The result is substantively useful because it demonstrates the danger of equating low rating error with recommendation value.
Among rank-capable recommenders, KNN achieves the lowest mean RMSE (0.6145), closely followed by NCF-none (0.6158) and ClusteredKNN/NCF-content (approximately 0.6165). Under MAE, the ordering changes: NCF-all-safe has the lowest mean (0.2887), followed closely by NCF-context (0.2892), NCF-skills (0.2894), NCF-level (0.2911), and NCF-content (0.2912). Thus, the model preferred for controlling large errors differs from the model preferred for minimizing typical absolute deviation. The confirmatory outcomes are summarized in Table 2. The ten-seed rating-error distributions are shown in Figure 3 and Figure 4.
Table 2.
Ten-seed confirmatory results. Rating-only references are shown separately from rank-capable recommenders.
Accordingly, terms such as “lowest,” “highest,” and “strongest observed” refer only to descriptive differences in the reported ten-seed means. They should not be read as claims of statistically established superiority, because the seed outcomes arise from overlapping repeated partitions of the same underlying dataset.
4.3. Metadata Profiles
The metadata comparison should be interpreted as a tuned-family comparison rather than a causal feature ablation. Each representation is paired with an independently validation-selected architecture and checkpoint. Accordingly, the observed differences show the performance profile of validation-selected NCF families; they do not isolate the incremental causal effect of level, skills, taxonomy, or other metadata. A matched-architecture ablation would be required for that stronger claim.
4.4. Full-Catalog Retrieval and the Recall–Coverage Trade-Off
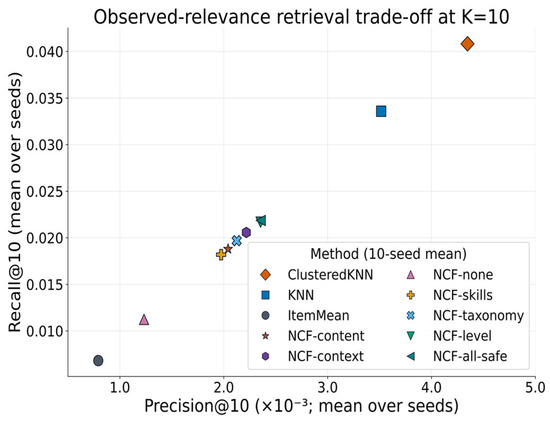
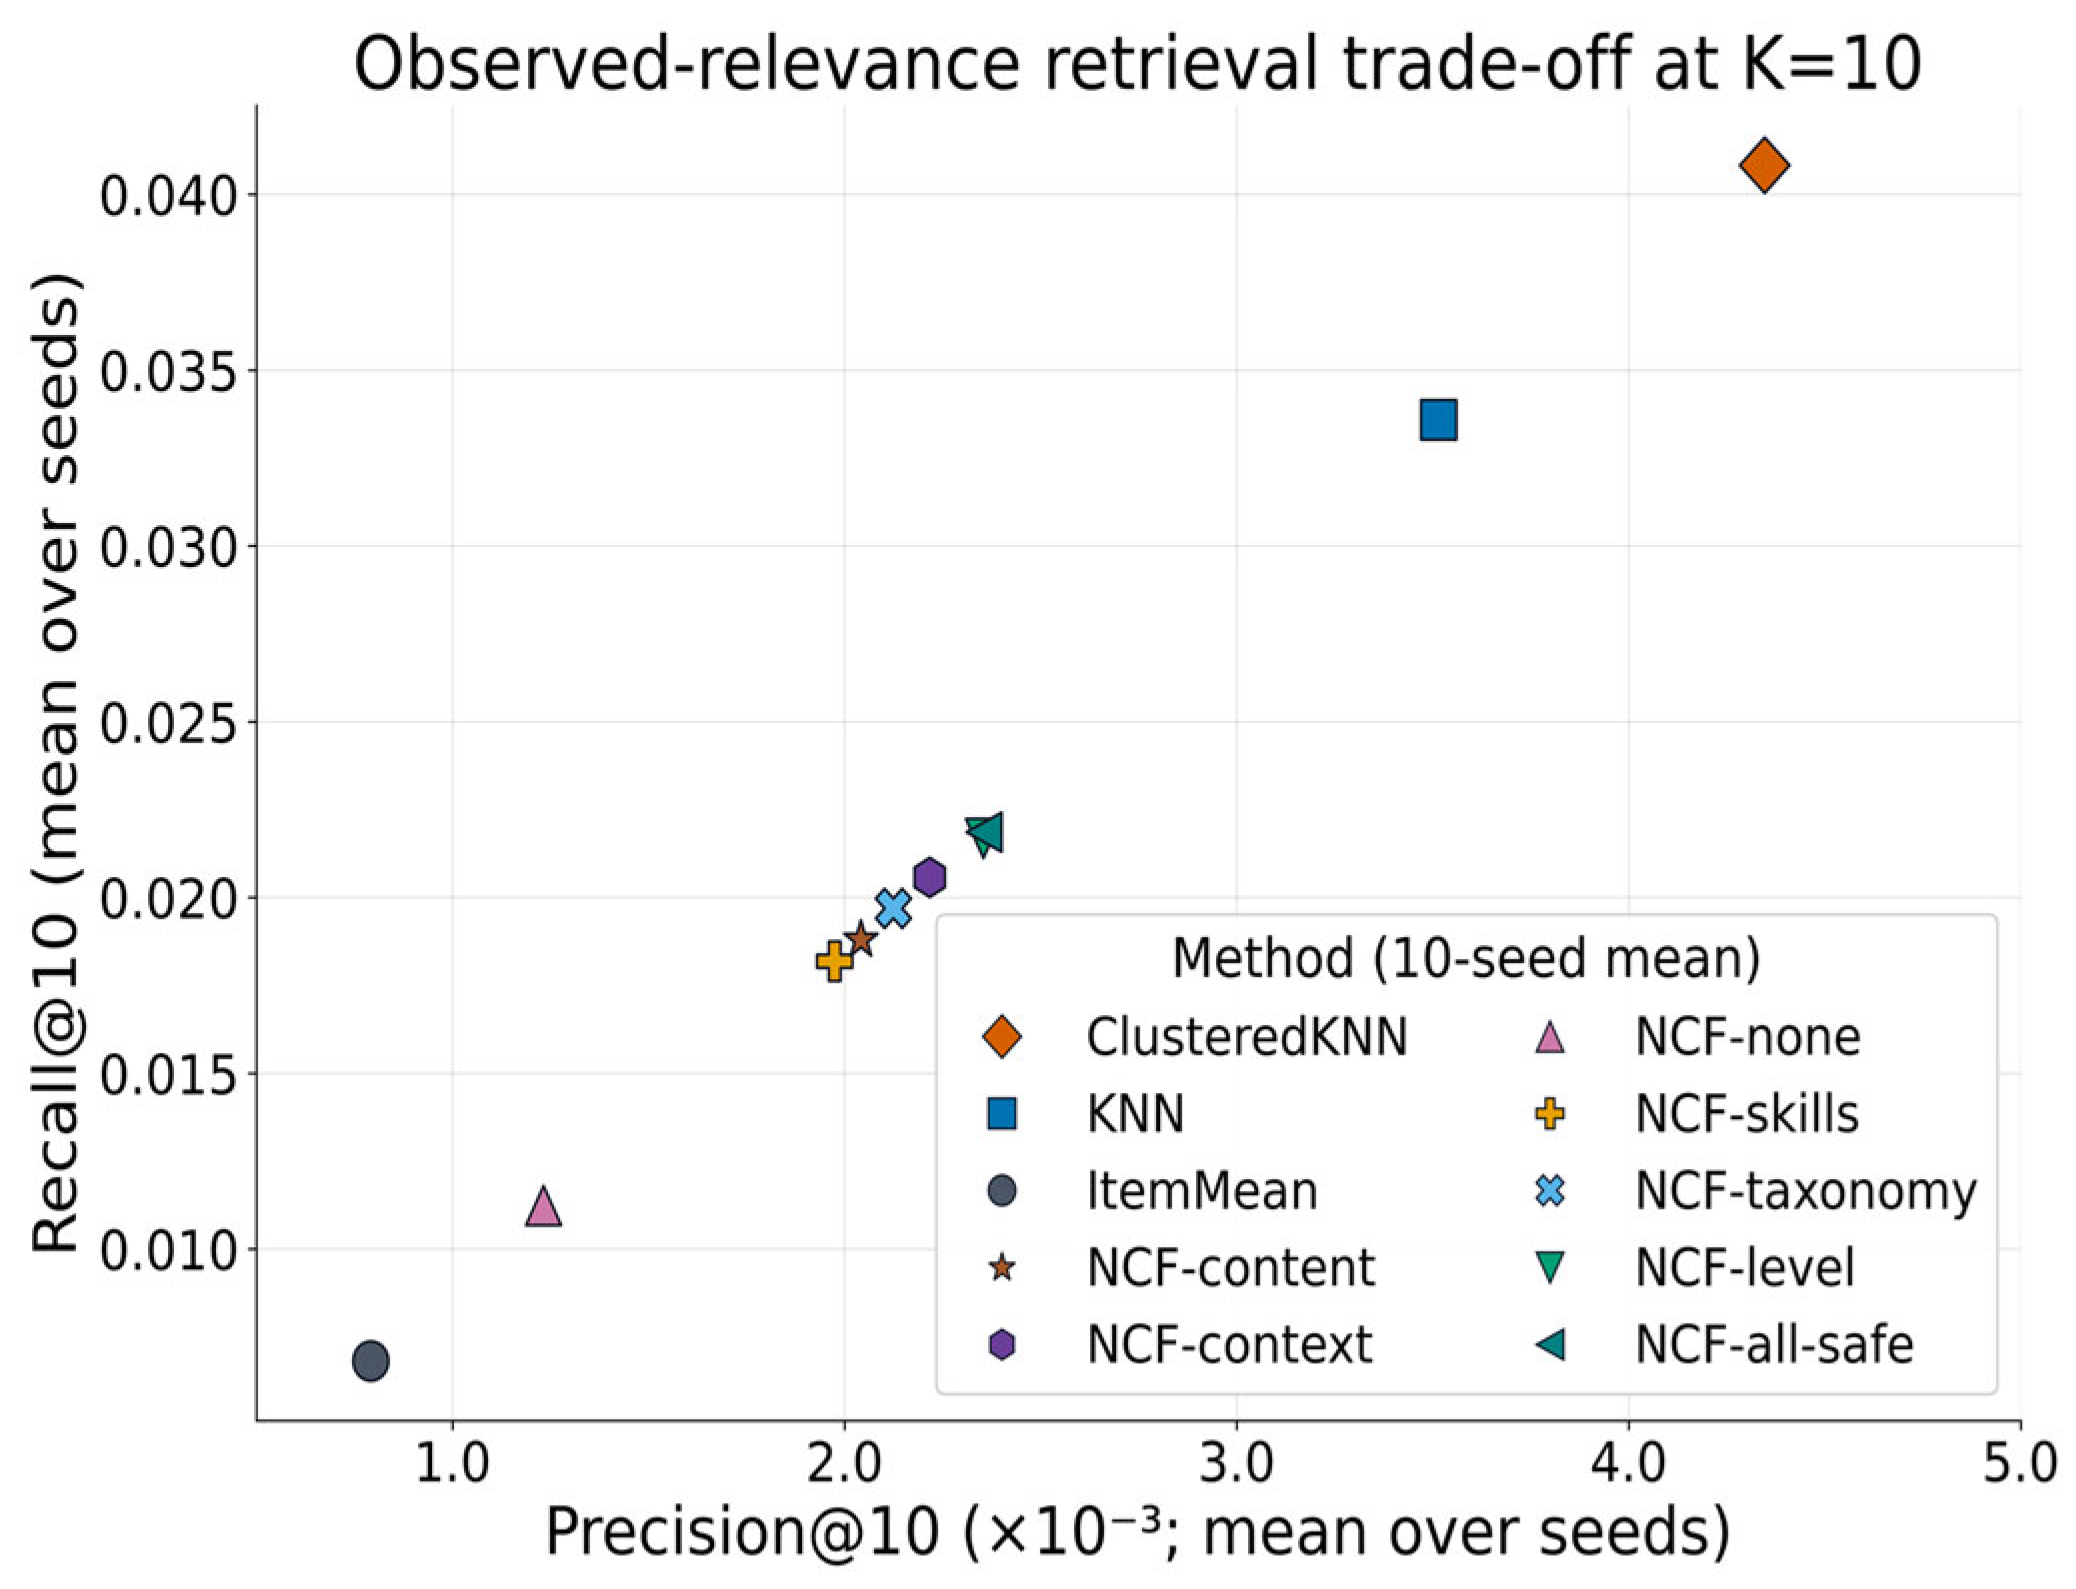
At the representative K = 10 cutoff, ClusteredKNN achieves the strongest observed retrieval results (P@10 = 0.00435; R@10 = 0.04083), followed by KNN (P@10 = 0.00352; R@10 = 0.03359). The metadata-bearing NCF variants improve substantially over NCF-none on Recall but remain below the neighborhood methods in this protocol. Appendix B shows that the same broad ordering is retained at K = 5 and K = 20, providing a cutoff-robustness check.
These values are sparse-observation retrieval diagnostics, not customer response, conversion, enrolment, or rejection rates. Their small absolute scale is expected because only a very small number of held-out courses have observed relevance labels for each eligible user, while the remaining unseen catalog is unknown rather than verified negative.
Absolute Precision values are small because each eligible user has very few observed relevant held-out courses among hundreds of candidate courses. An unobserved course is not a confirmed negative. The retrieval measures therefore quantify recovery of known relevant held-out items, not the probability that a user would reject every other recommended course. Complete Precision@5, Precision@10, Precision@20, Recall@5, Recall@10, and Recall@20 values for all rank-capable recommenders, together with two complementary uniform-random scale references, are reported in Appendix B (Table A1).
Full-catalog per-user Spearman is highest for ClusteredKNN (0.01746), followed by KNN (0.01664); NCF-taxonomy is highest among NCF variants (0.00408), while ItemMean (−0.00631) and NCF-none (−0.00141) are slightly negative. Absolute values are small because only sparse held-out ratings are observed and all other unseen candidates use label 0. The metric therefore supports the neighborhood methods’ retrieval advantage but is not a fully observed user-preference correlation.
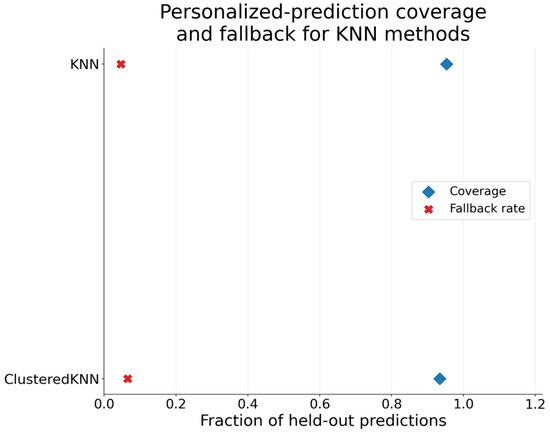
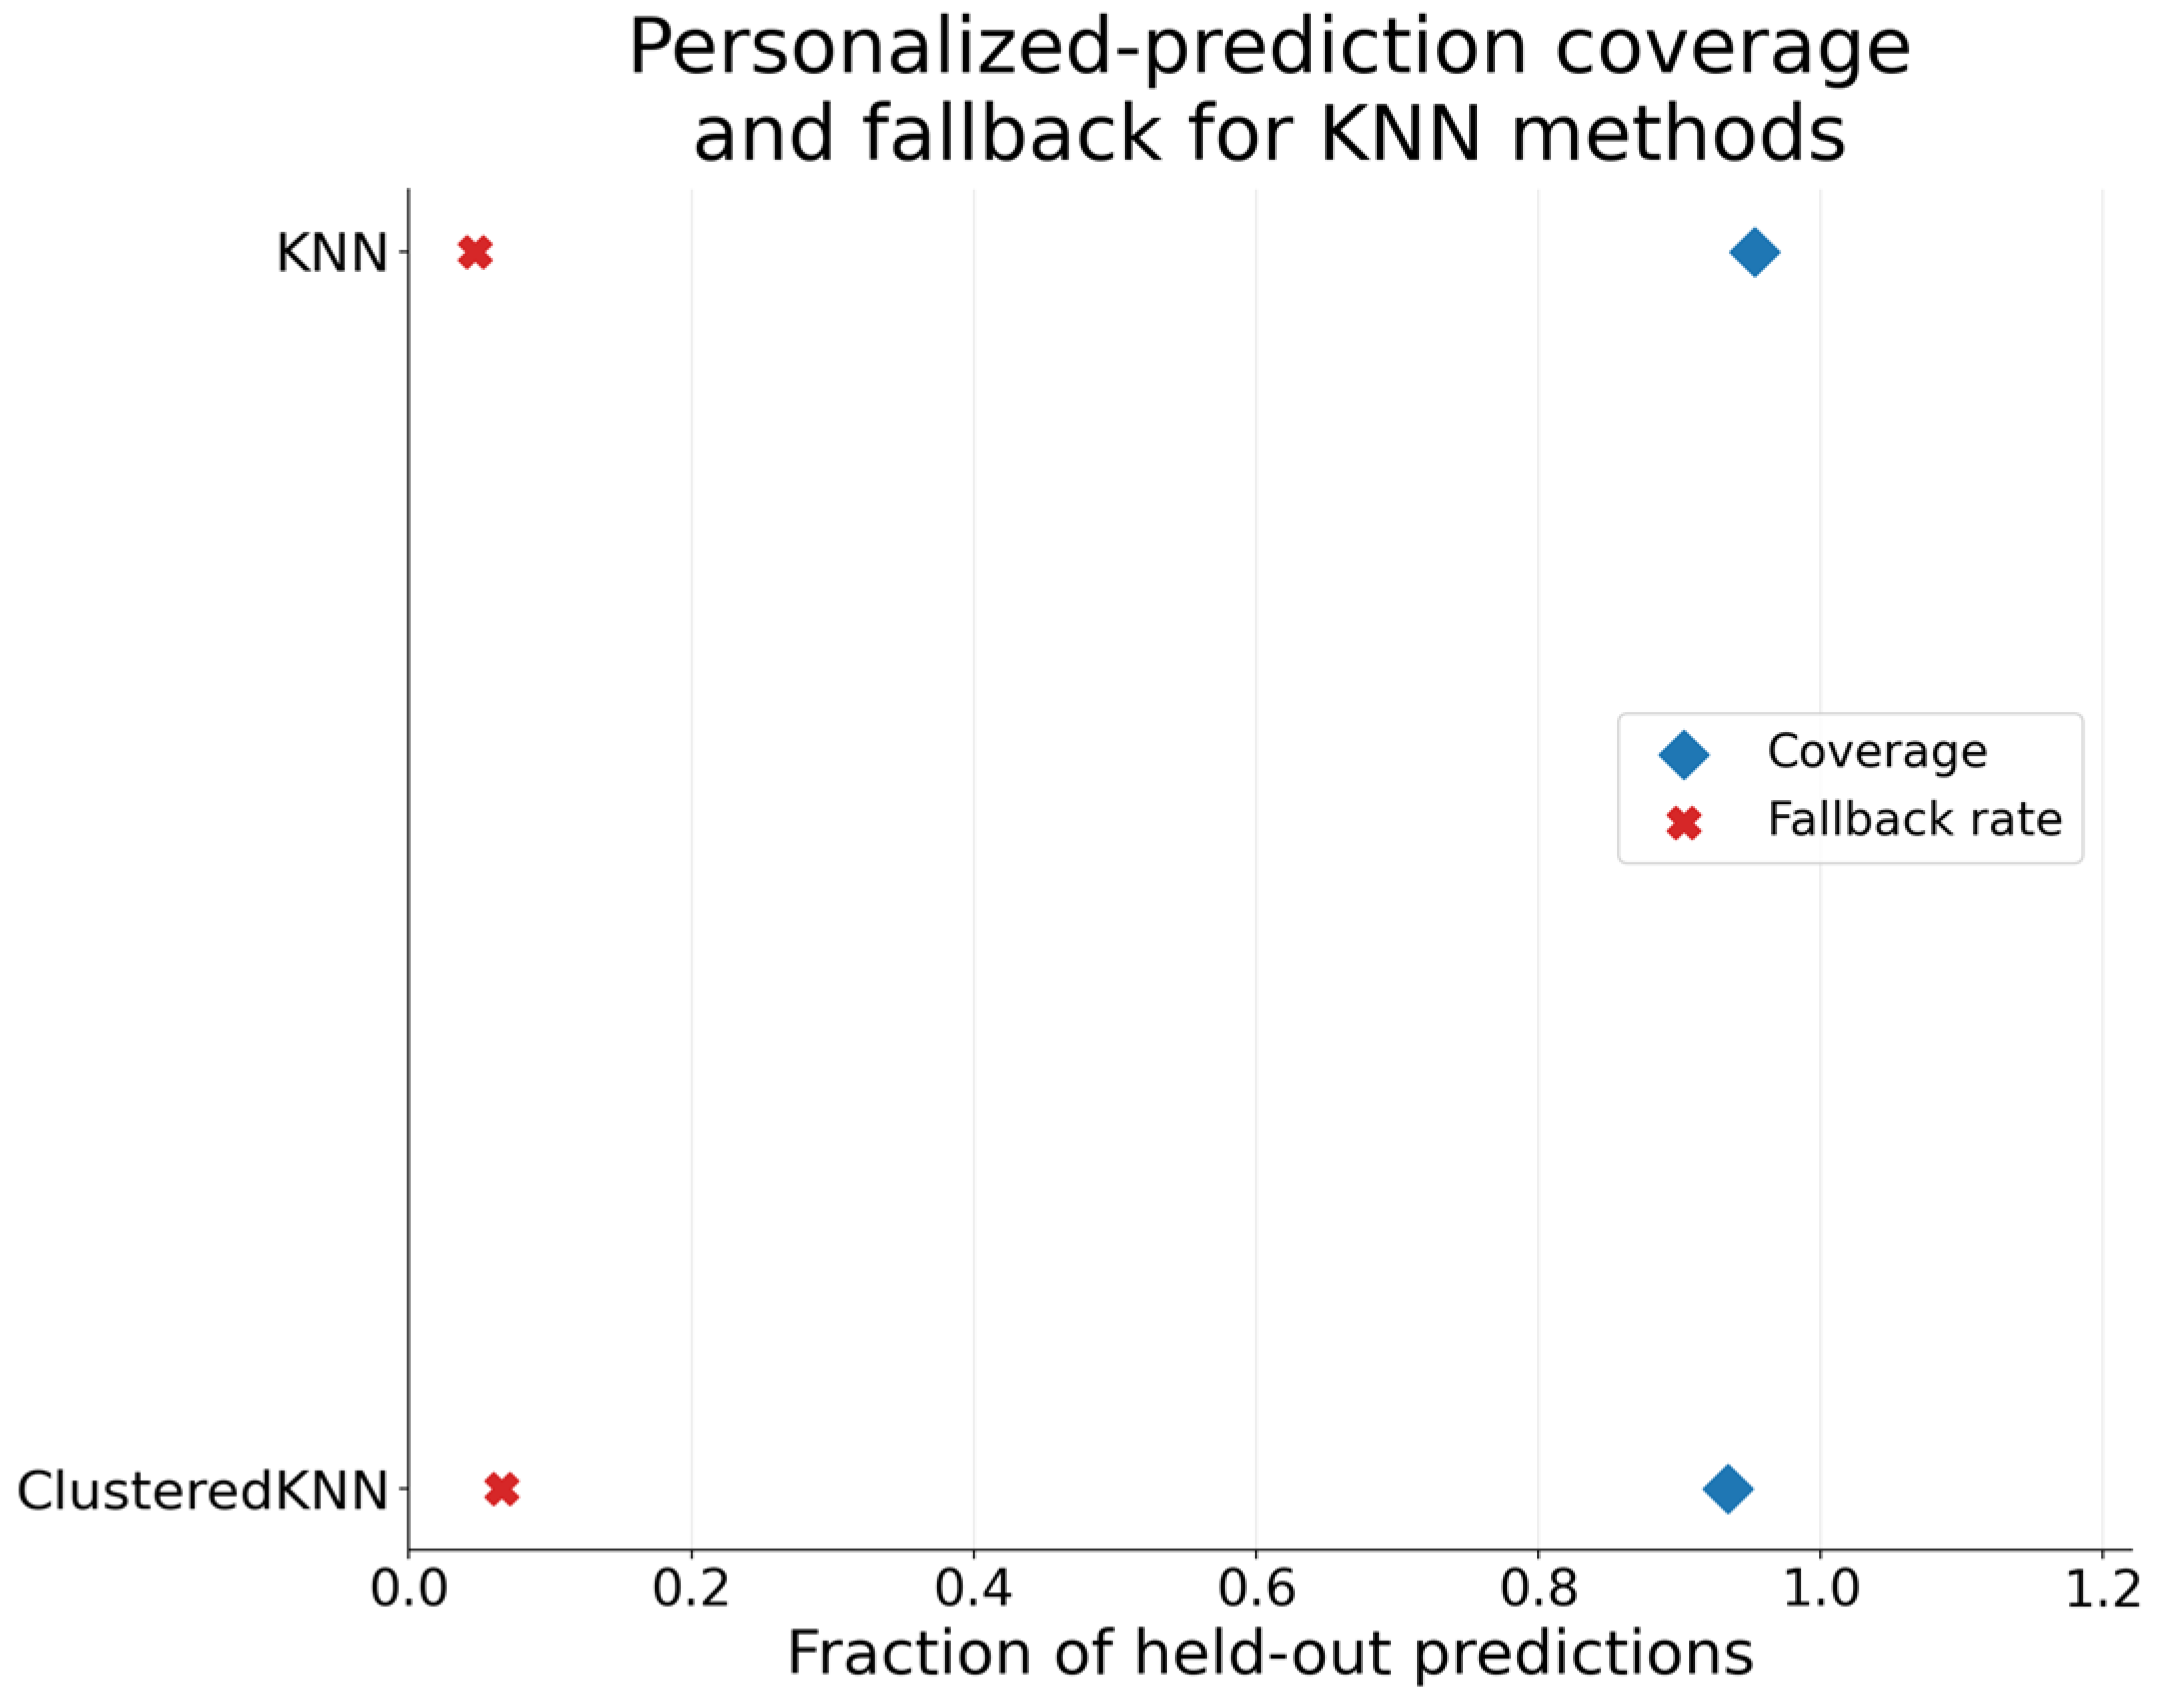
The retrieval advantage of ClusteredKNN comes with lower personalized-neighborhood support. KNN achieves mean coverage of 0.9532 (fallback 0.0468), whereas ClusteredKNN achieves 0.9341 (fallback 0.0659). Thus, behavioral micro-segmentation retrieves more observed relevant courses for evaluable ranking users but produces a usable personalized neighborhood for a smaller share of held-out interactions. The retrieval trade-off is summarized in Figure 5, while Figure 6 reports personalized-neighborhood coverage and fallback.
Figure 5.
Mean Precision@10–Recall@10 trade-off across rank-capable recommenders.
Figure 6.
Ten-seed personalized-neighborhood coverage and fallback for KNN and ClusteredKNN.
4.5. Cluster-Count Sensitivity
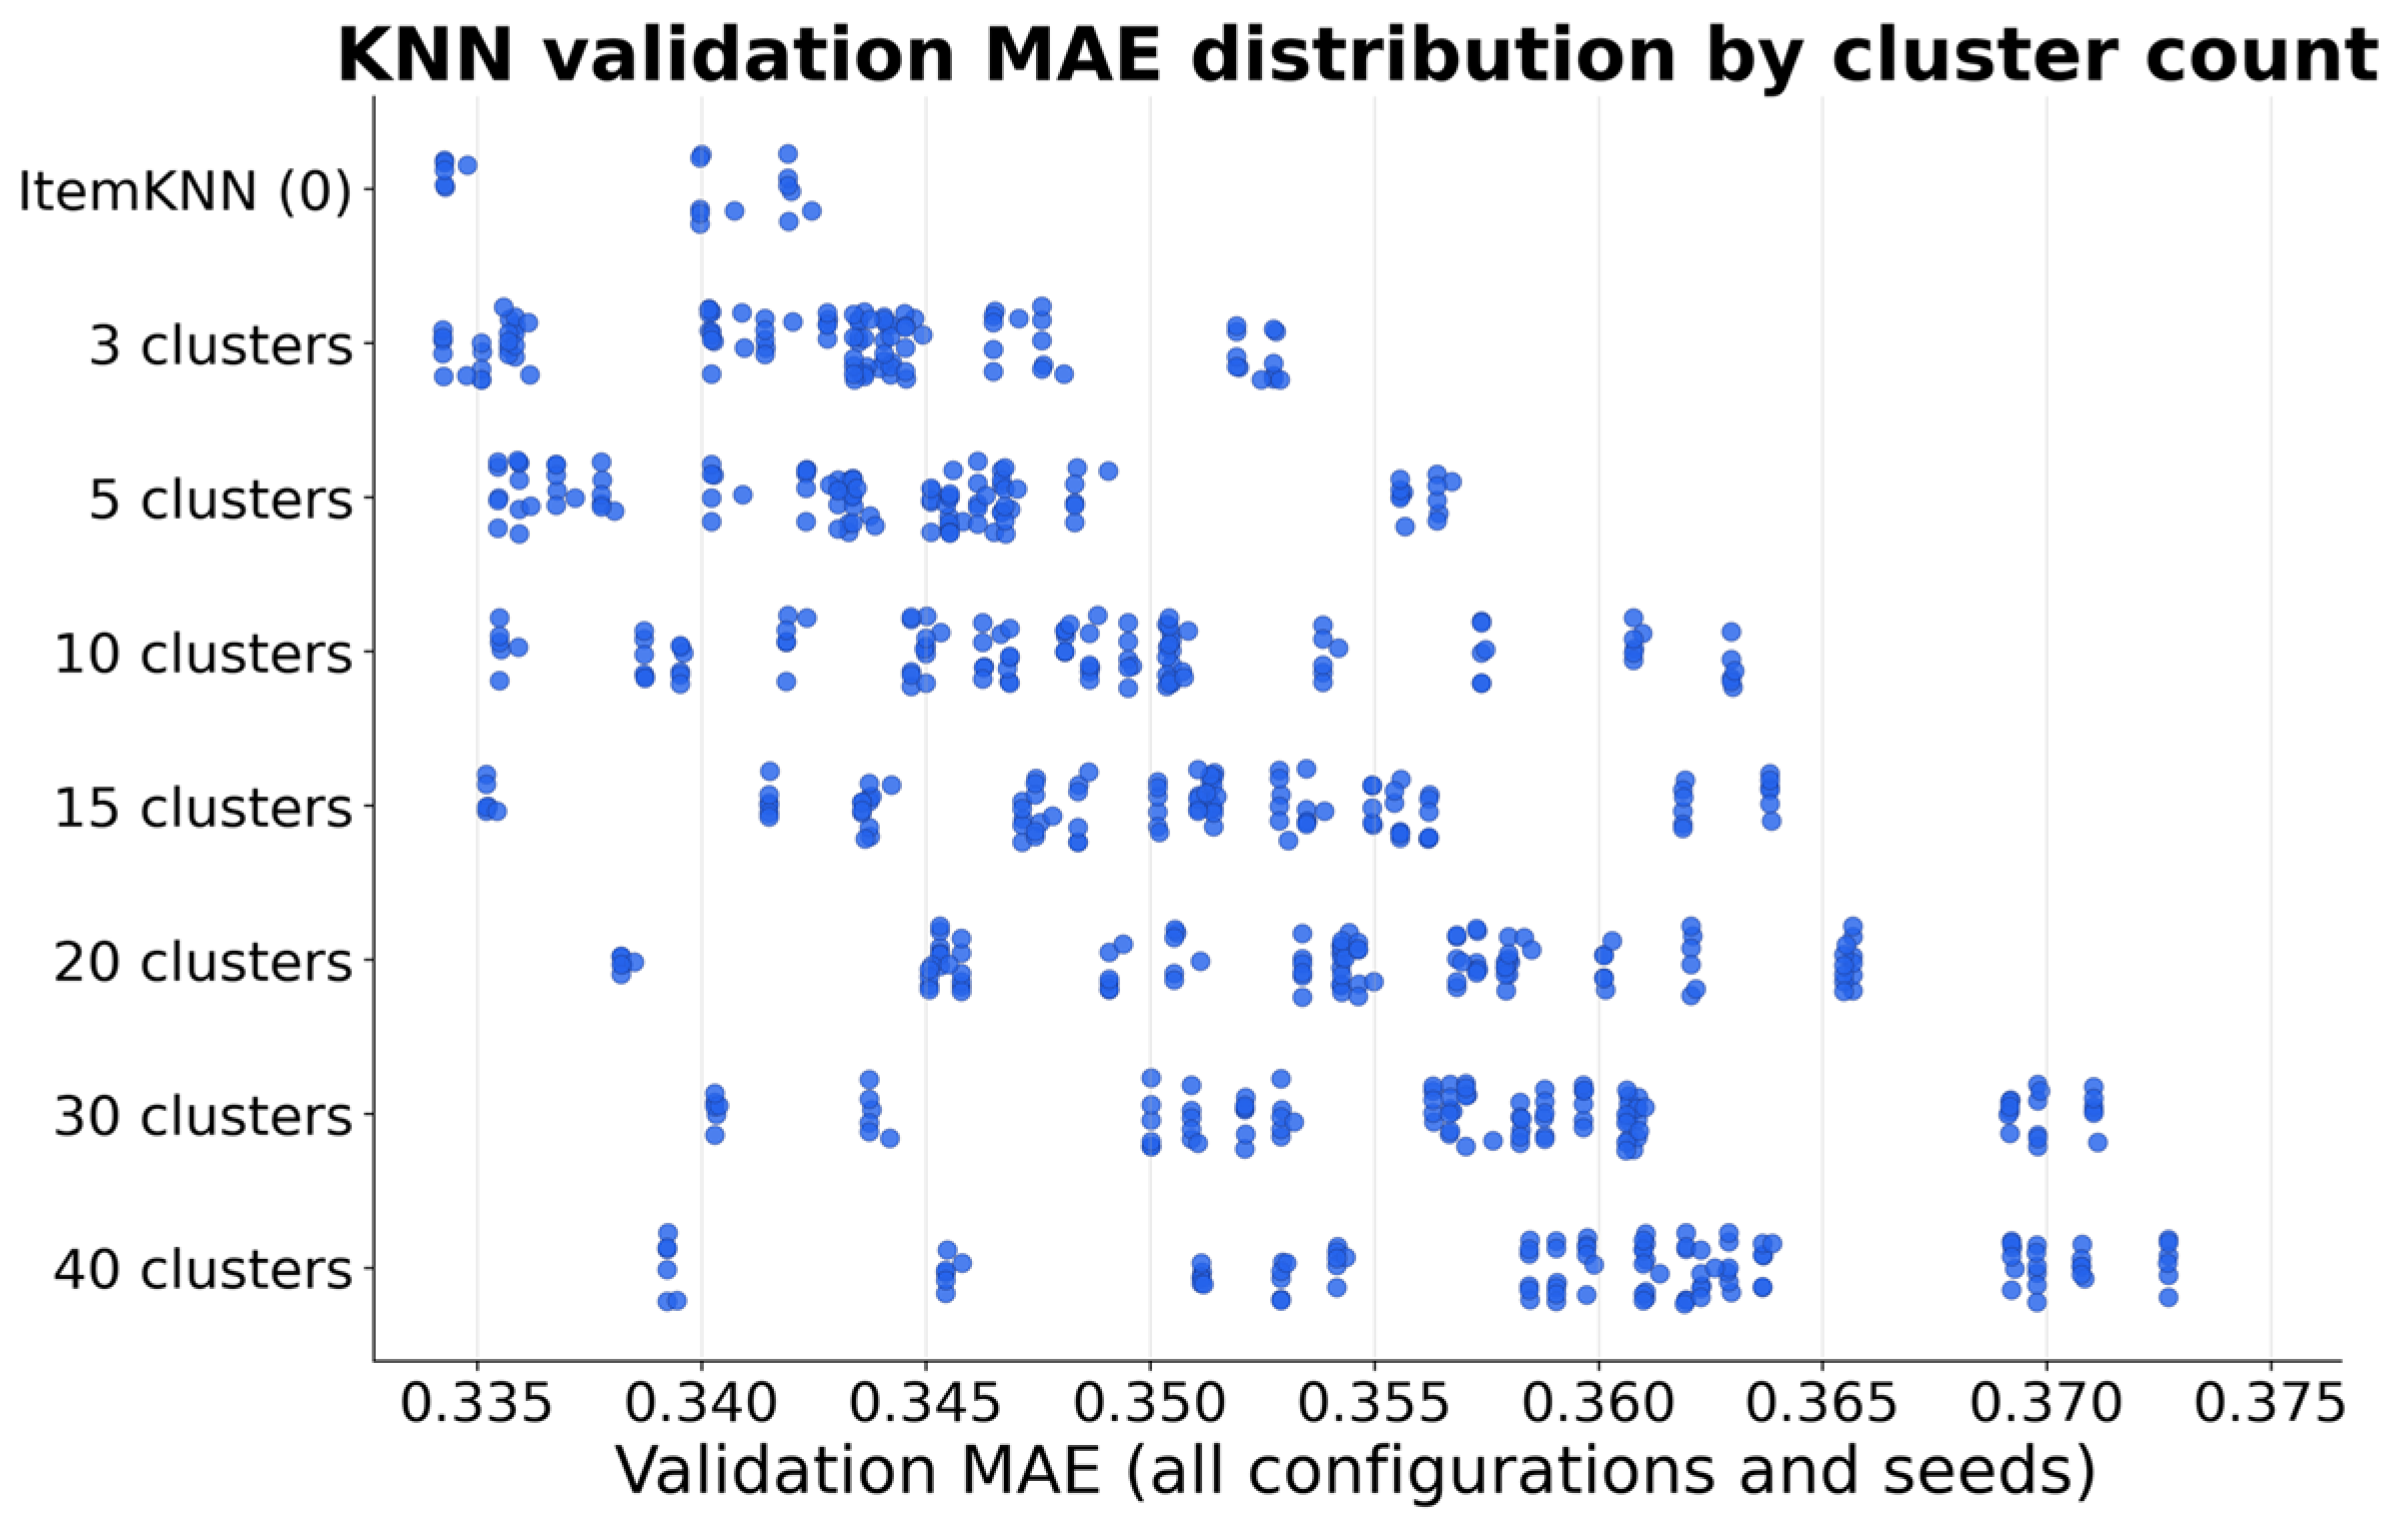
The validation diagnostics explain the mechanism behind this trade-off. Appendix A reports the complete configuration×seed distributions for validation RMSE, MAE, personalized-neighborhood coverage, usable-neighbor support, user-cluster size coefficient of variation (CV), and normalized user-cluster entropy (Figure A1, Figure A2, Figure A3, Figure A4, Figure A5 and Figure A6). Across the full validation search, increasingly fine user partitions generally weaken both error and support profiles: median validation RMSE rises from 0.6502 without clustering to 0.6584 at 40 clusters, median MAE rises from 0.3400 to 0.3610, and median usable-neighbor support falls from 2.477 to 1.452. Some 3-cluster and 5-cluster runs exceed the 0.90 coverage floor, but no validation run with 10 or more requested user clusters reaches 0.90 coverage; at 10 clusters, the maximum observed coverage is 0.8935. Cluster size imbalance also becomes more pronounced, with median CV increasing from 1.3501 at three clusters to 2.9255 at 40 clusters. The selected ClusteredKNN configuration uses three clusters, consistent with the evidence that fine segmentation is not monotonically beneficial. These appendix diagnostics are descriptive and did not influence model selection beyond the prespecified coverage feasibility constraint.
4.6. Runtime and Operating Cadence
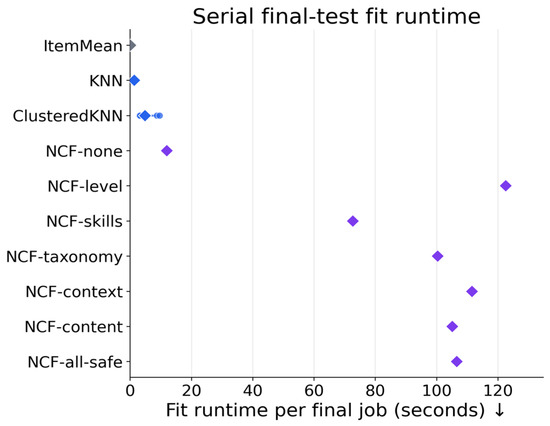
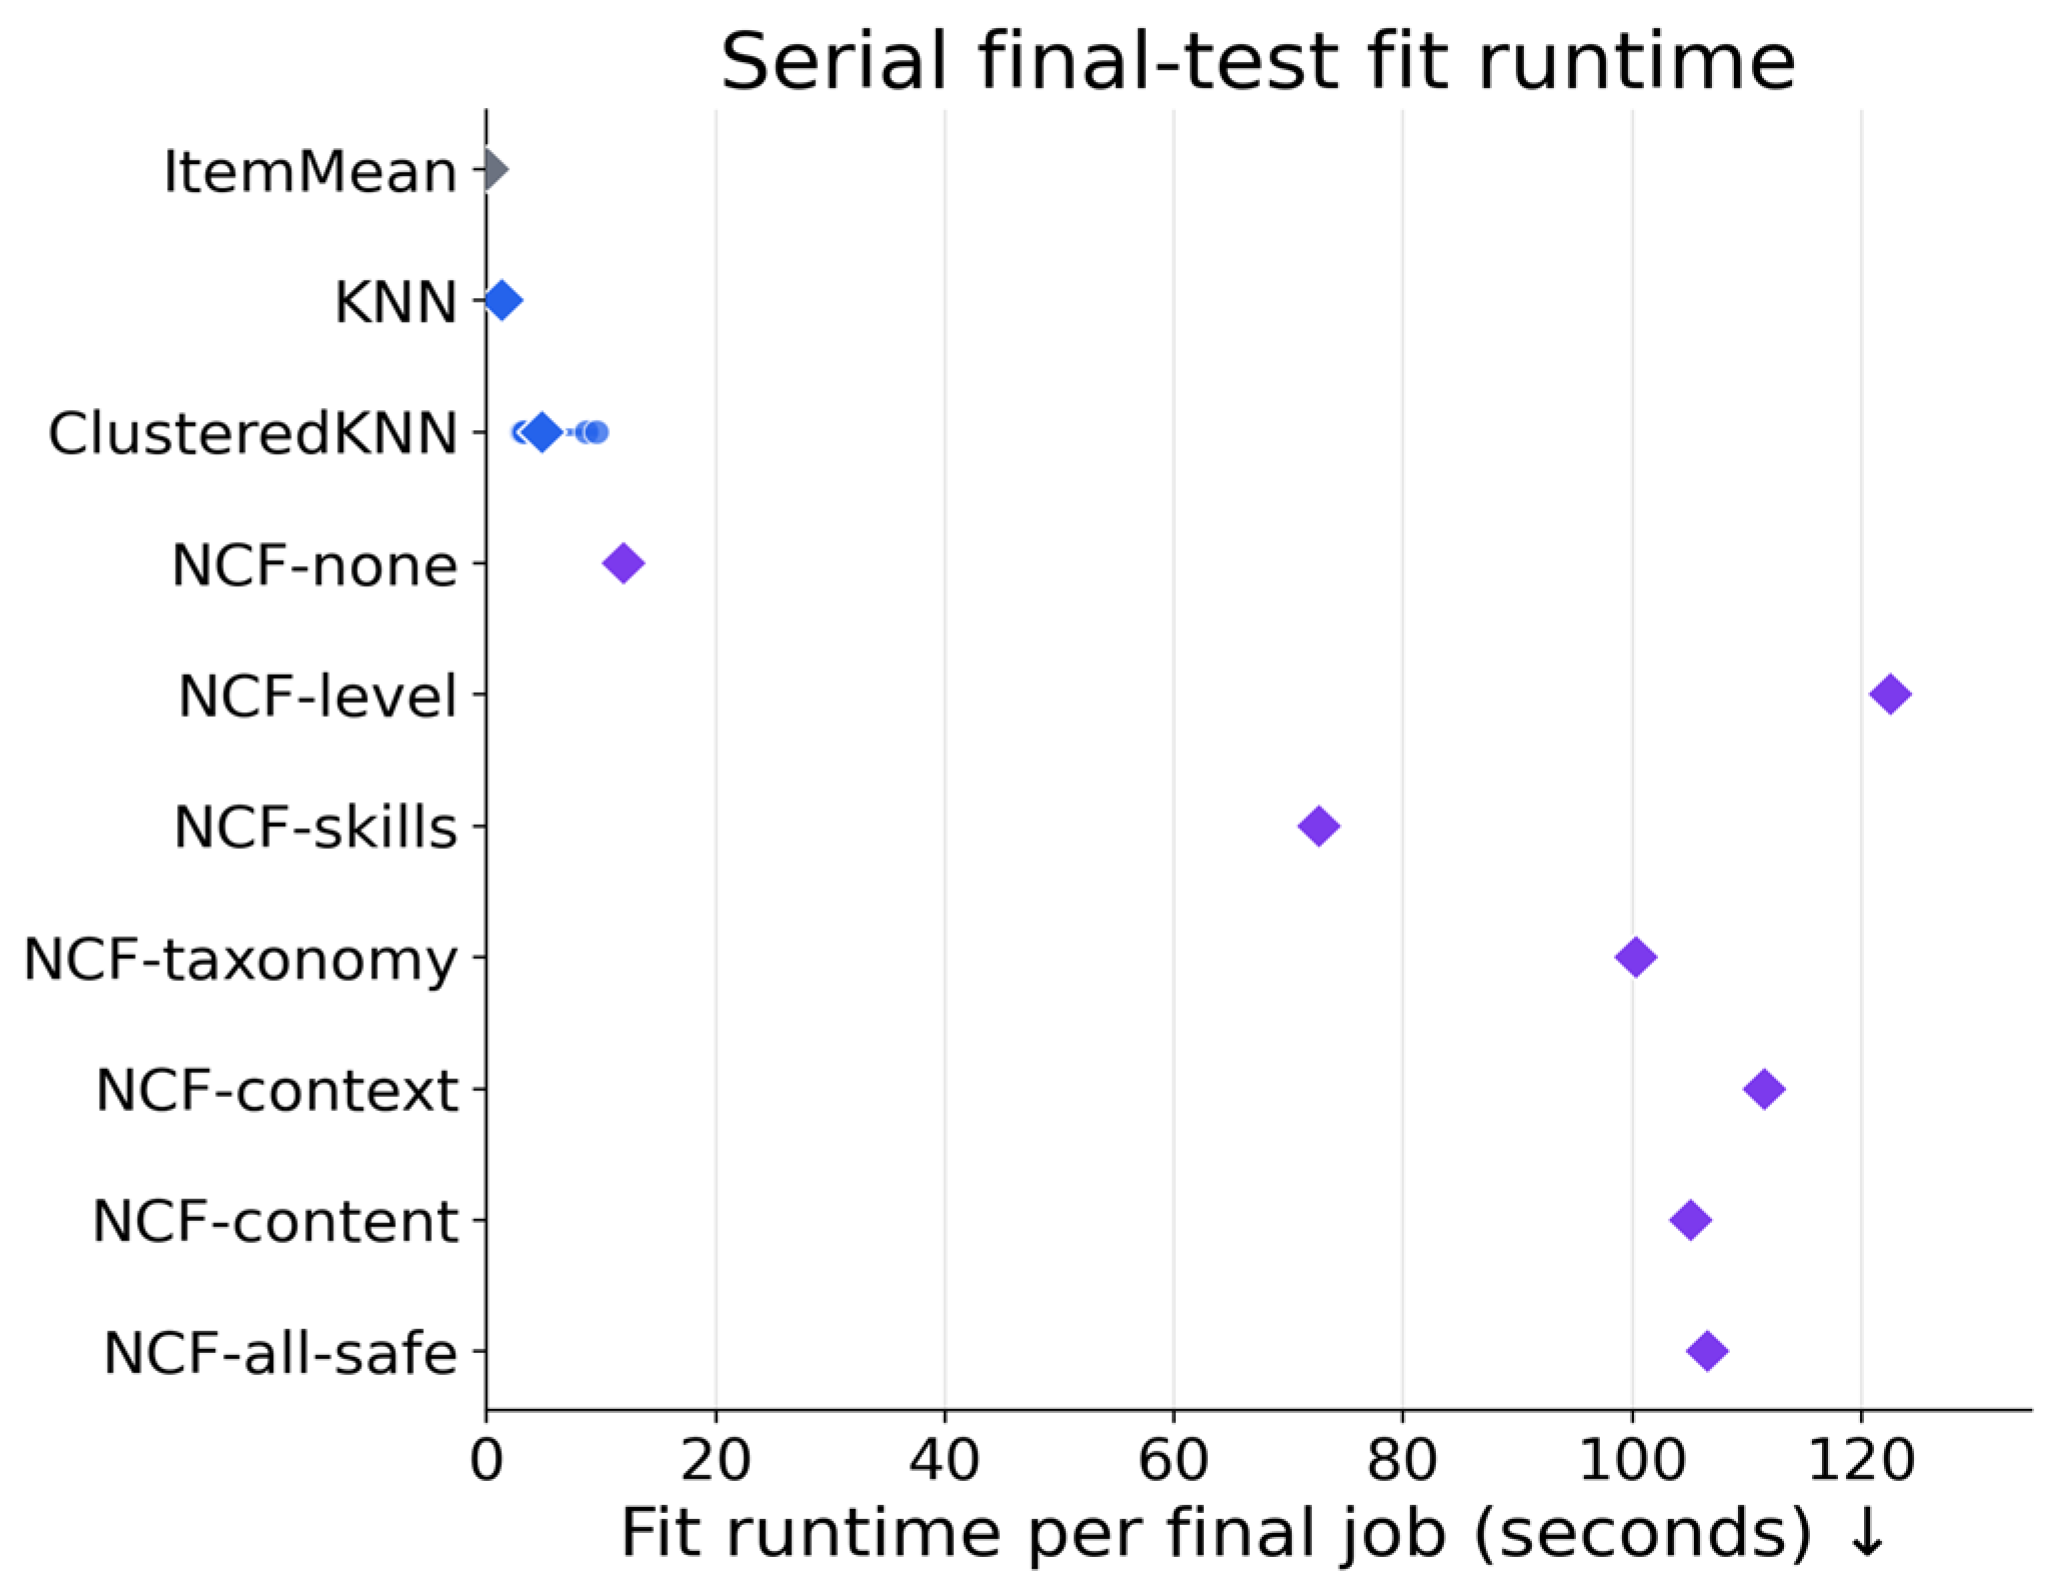
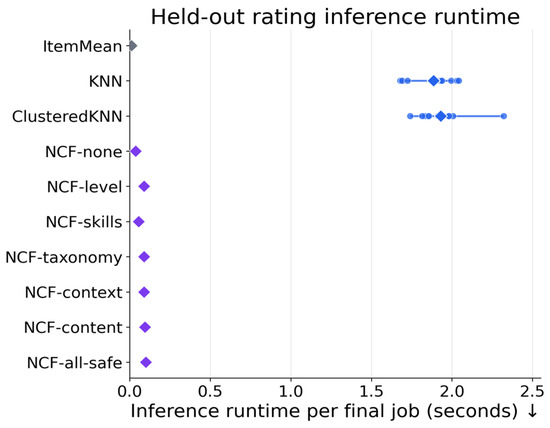
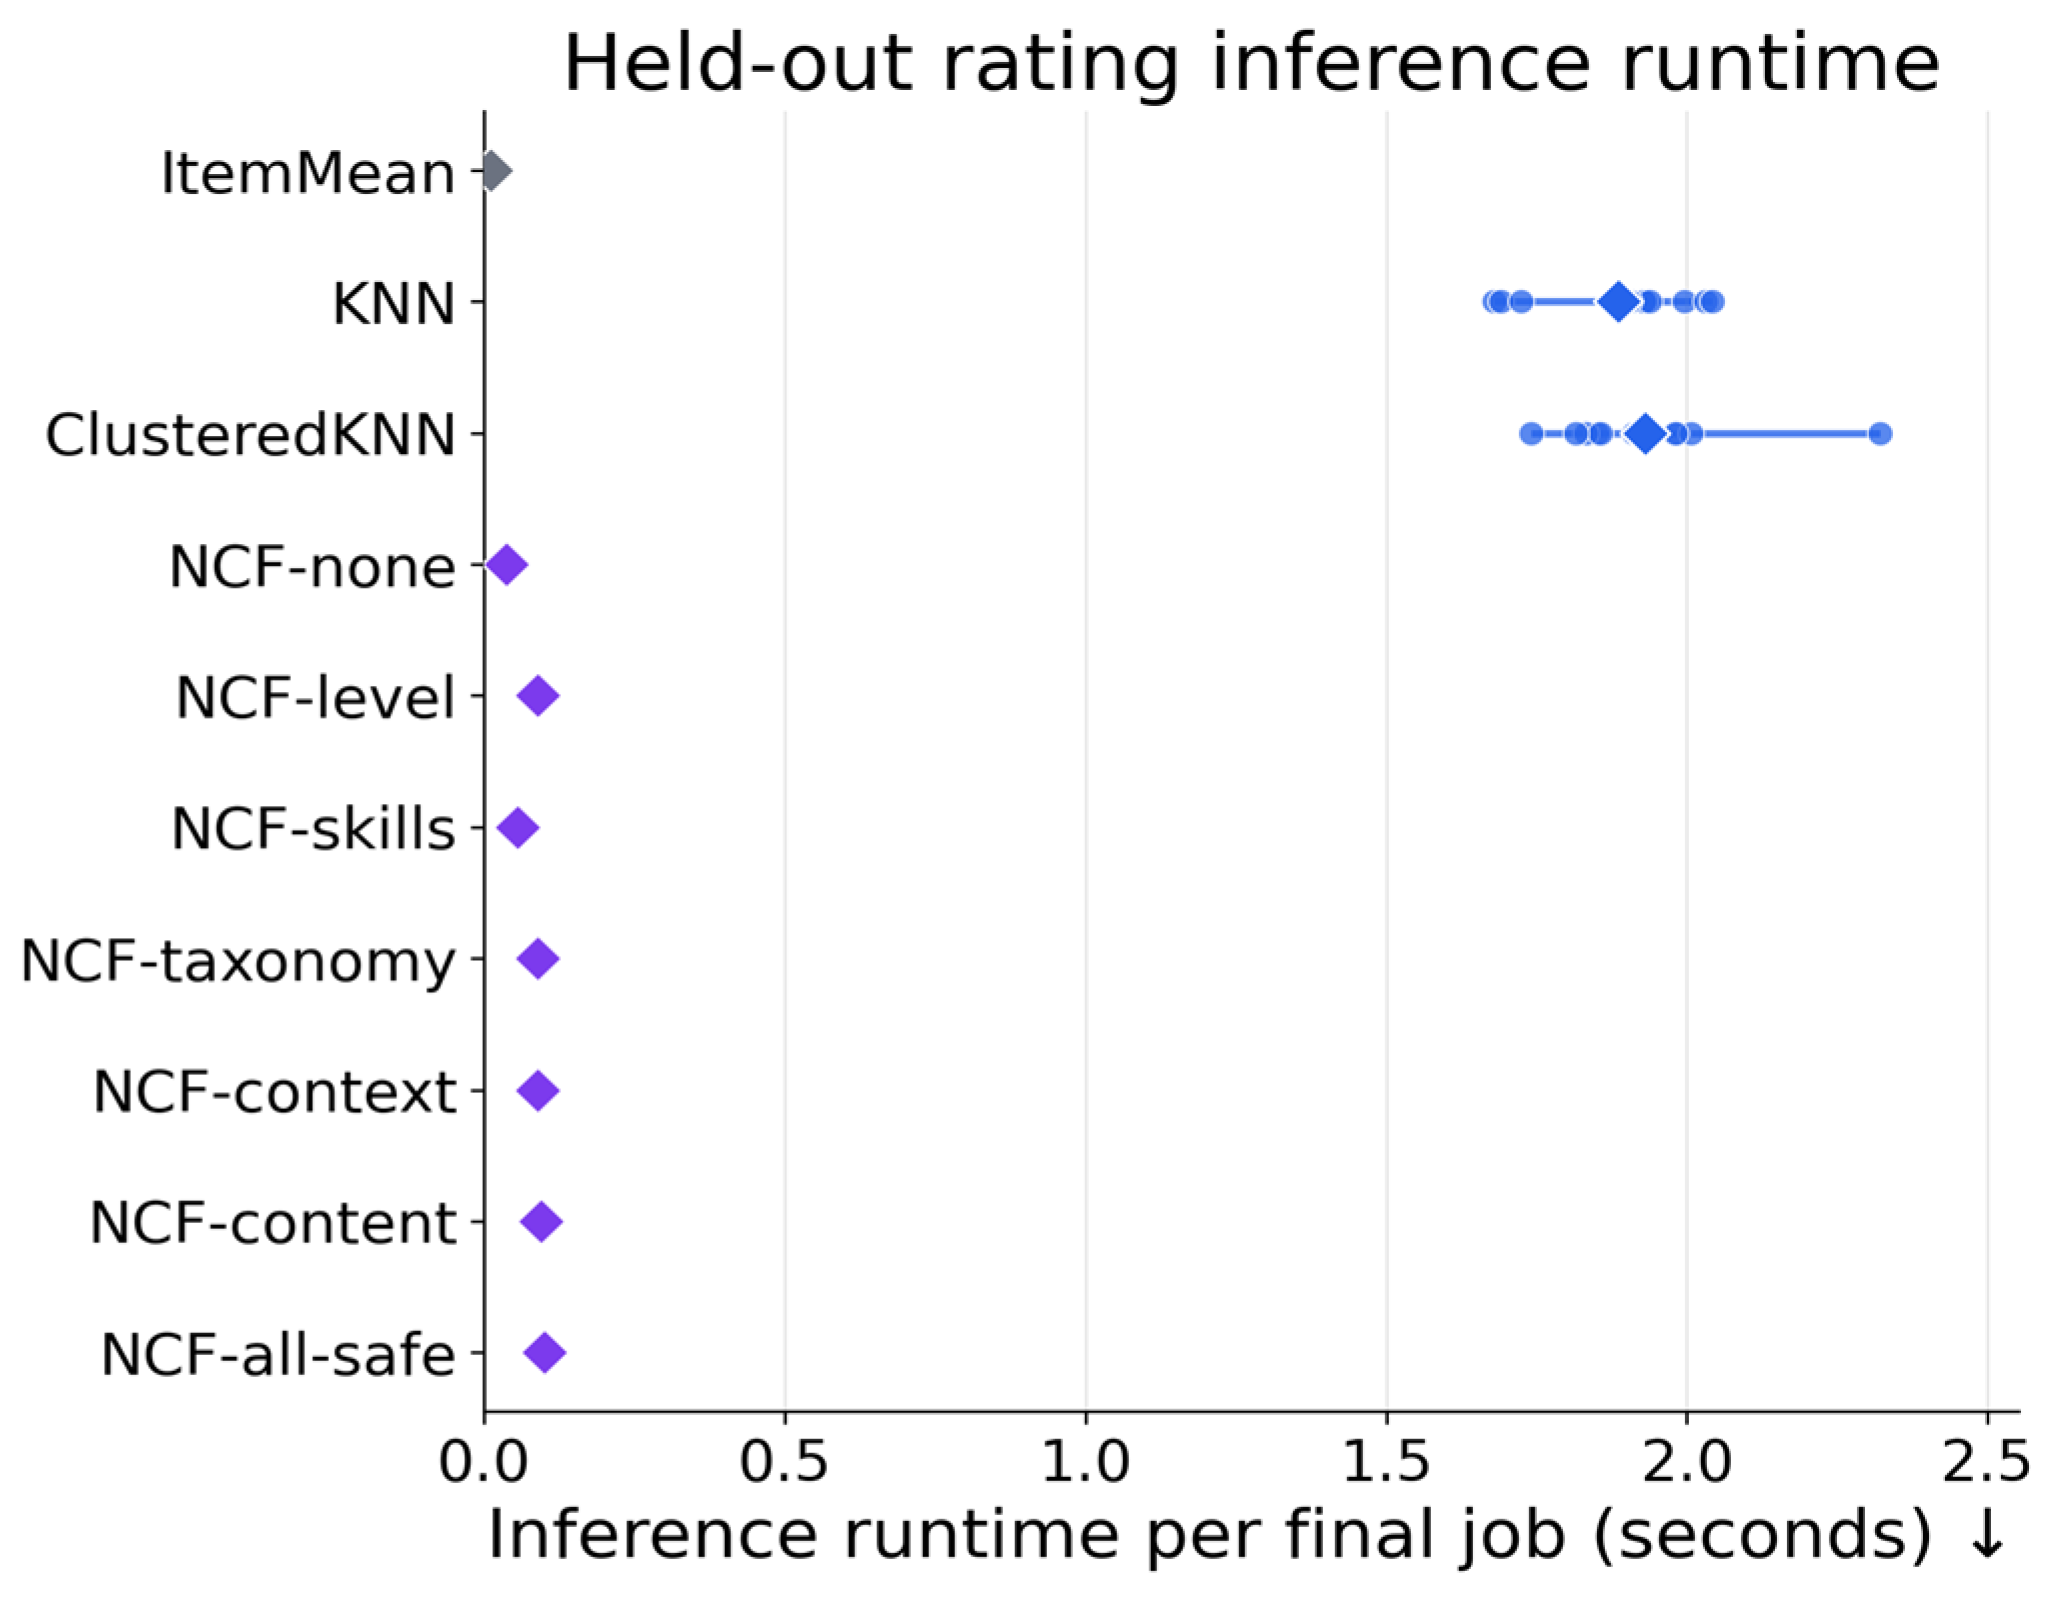
Fitting cost differs sharply across architectures. Mean KNN fit time is 1.32 s and ClusteredKNN 4.84 s. NCF-none requires 11.91 s, while metadata-bearing NCF variants require approximately 72.6–122.5 s; NCF-all-safe requires 106.6 s. Direct held-out rating inference is substantially faster for NCF: mean inference time is 1.89 s for KNN and 1.93 s for ClusteredKNN, compared with 0.036 s for NCF-none and approximately 0.056–0.101 s for the metadata-bearing NCF variants. Full-catalog ranking shows a different pattern: KNN ranking is approximately 7.50 s, whereas NCF variants range from approximately 1.39 to 2.21 s. The operational interpretation therefore depends on cadence: NCF is more expensive to refit in this environment but can score the catalog faster after fitting.
These timings should not be converted directly into deployment cost forecasts because they are specific to the implementation and hardware. They nevertheless demonstrate that computational burden is multidimensional: training cost and ranking cost can move in opposite directions. Figure 7 and Figure 8 summarize the reported model-fit and direct rating-inference runtimes, respectively.
Figure 7.
Mean model-fit runtime across ten guarded final seeds.
Figure 8.
Mean held-out rating-inference runtime across ten guarded final seeds.
4.7. User Activity and Profile Depth
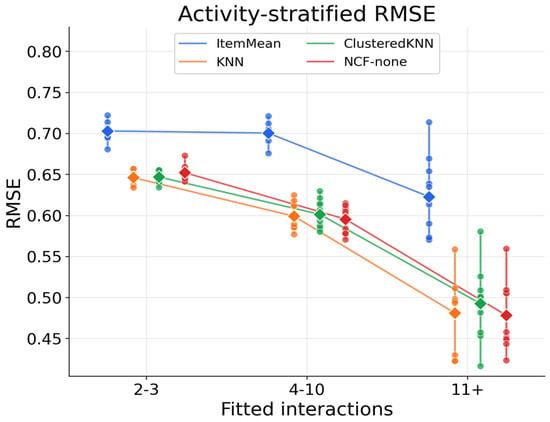
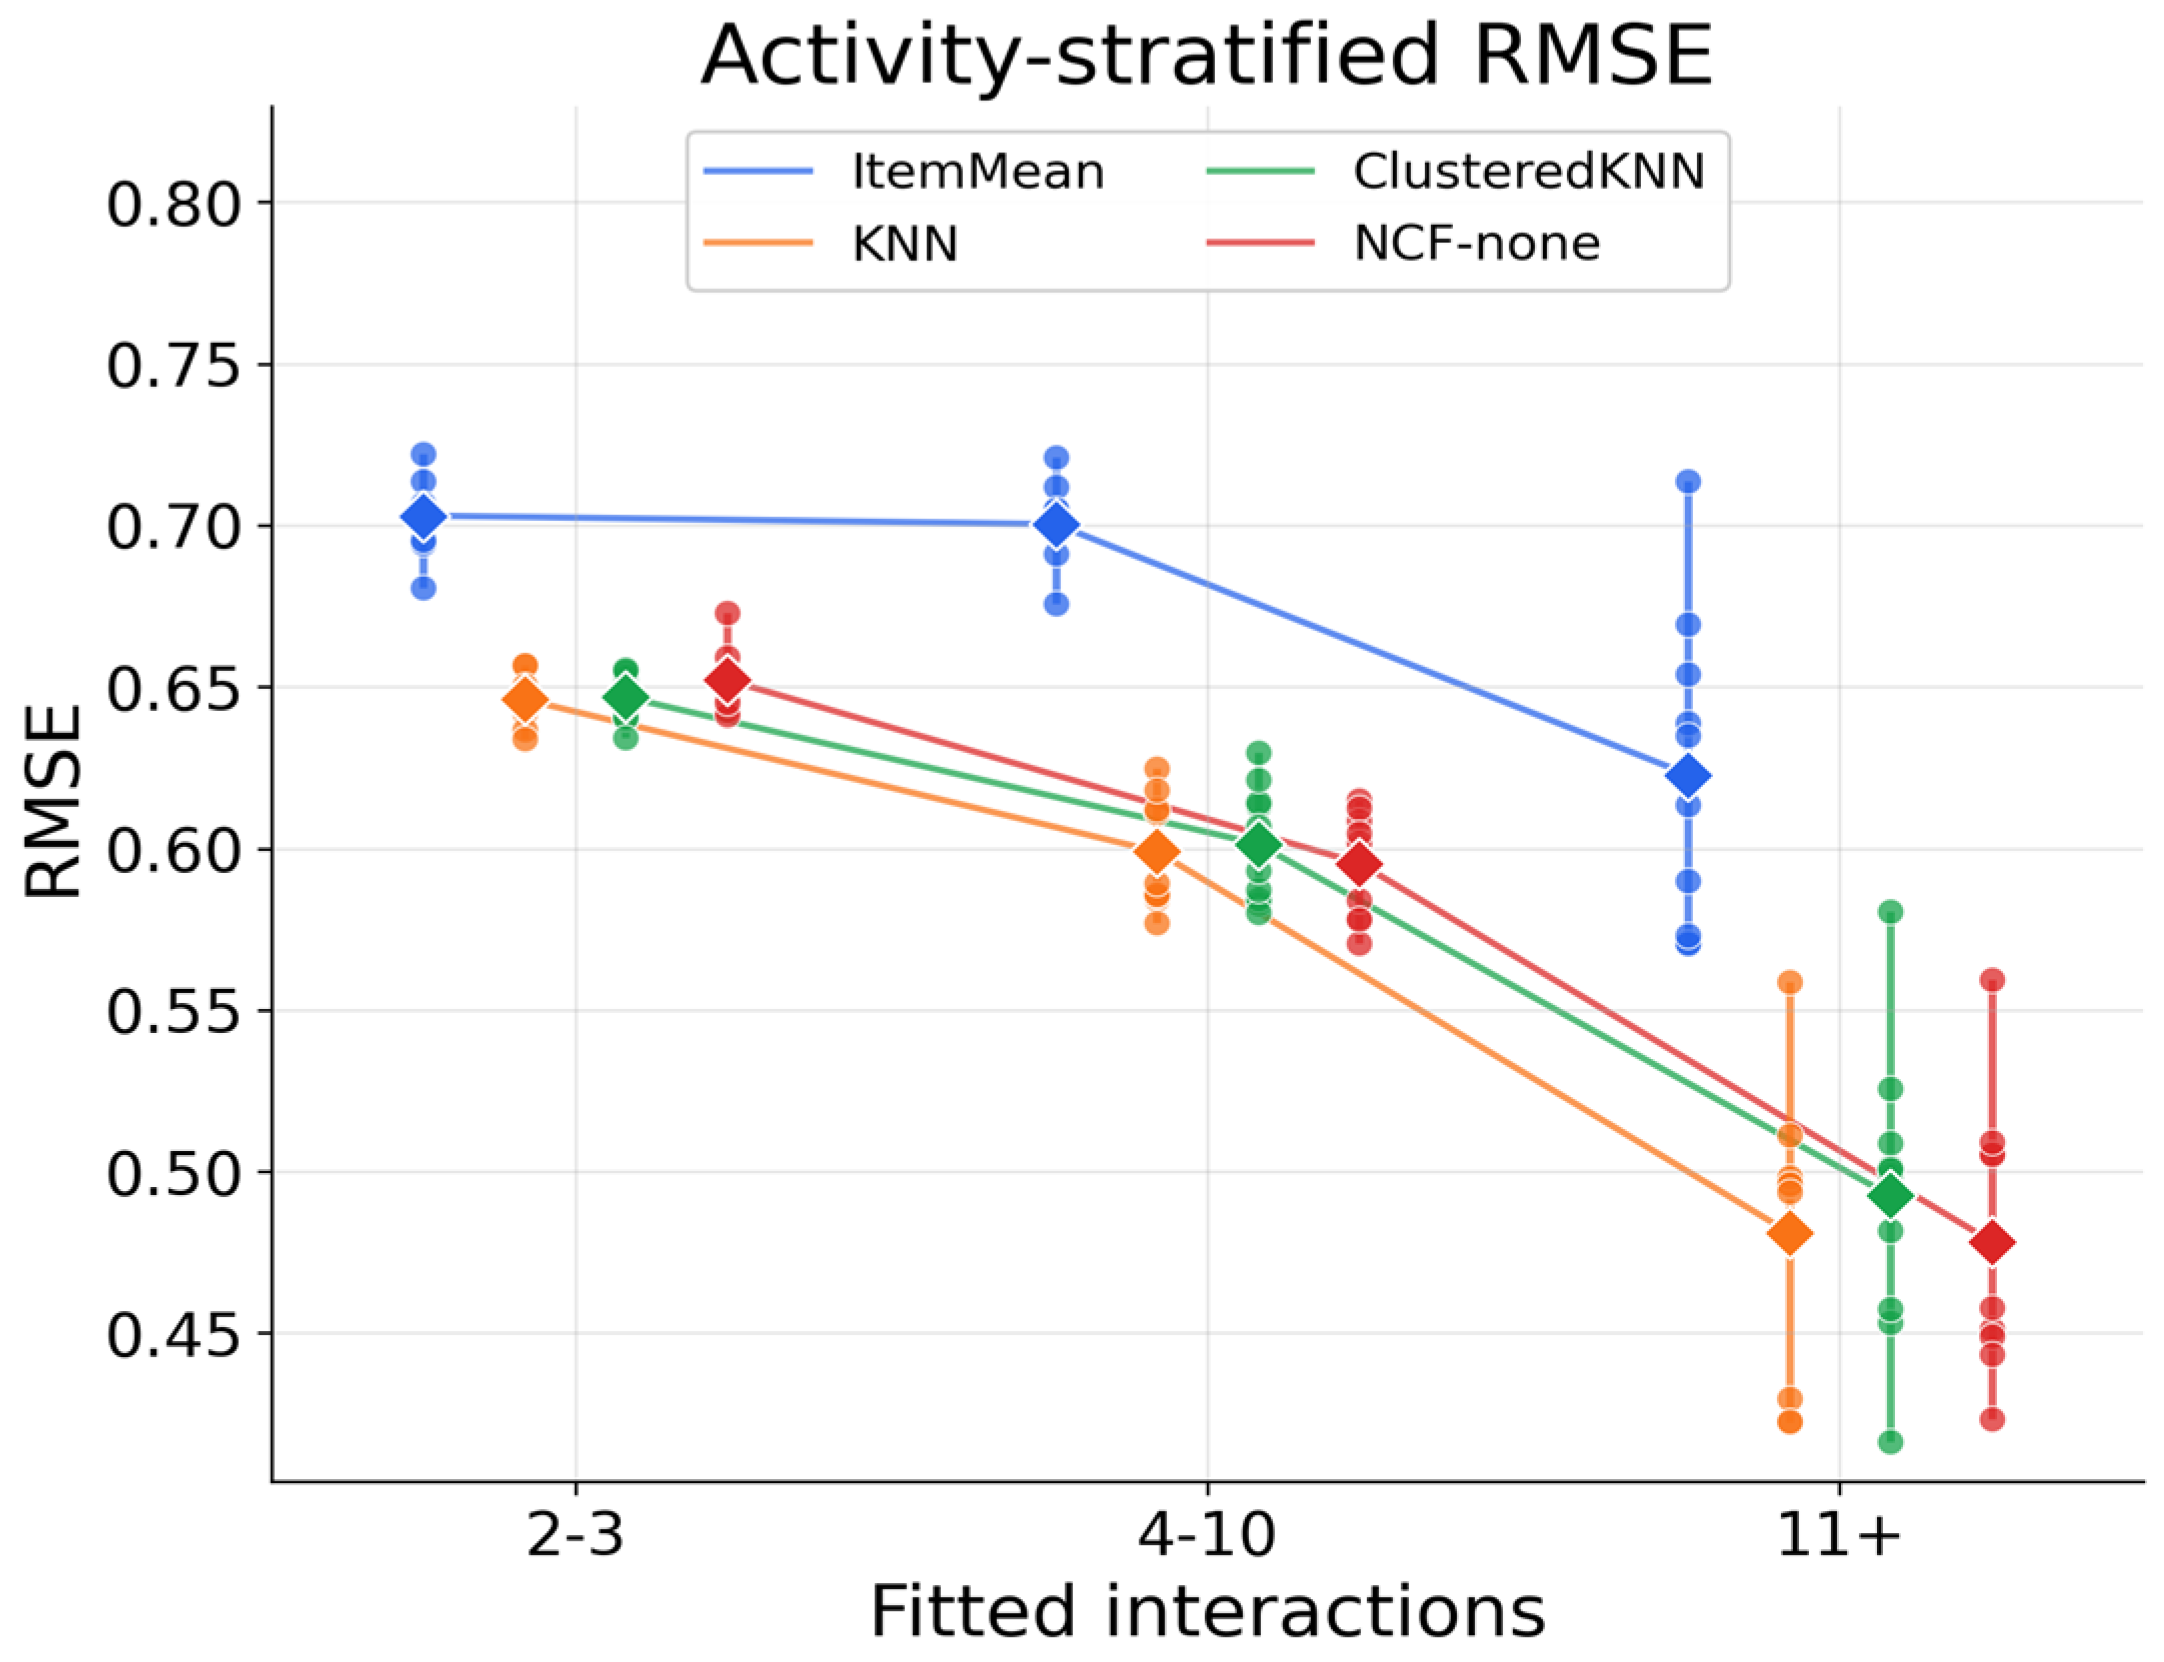
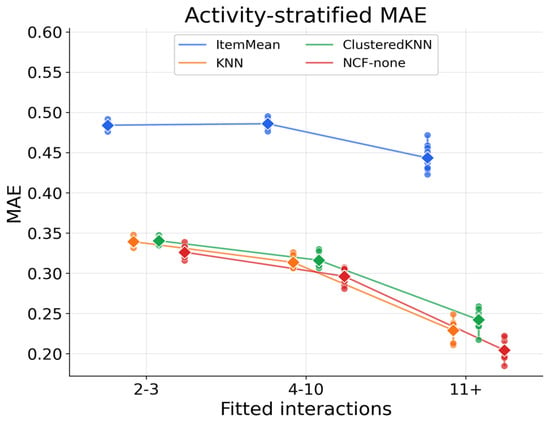
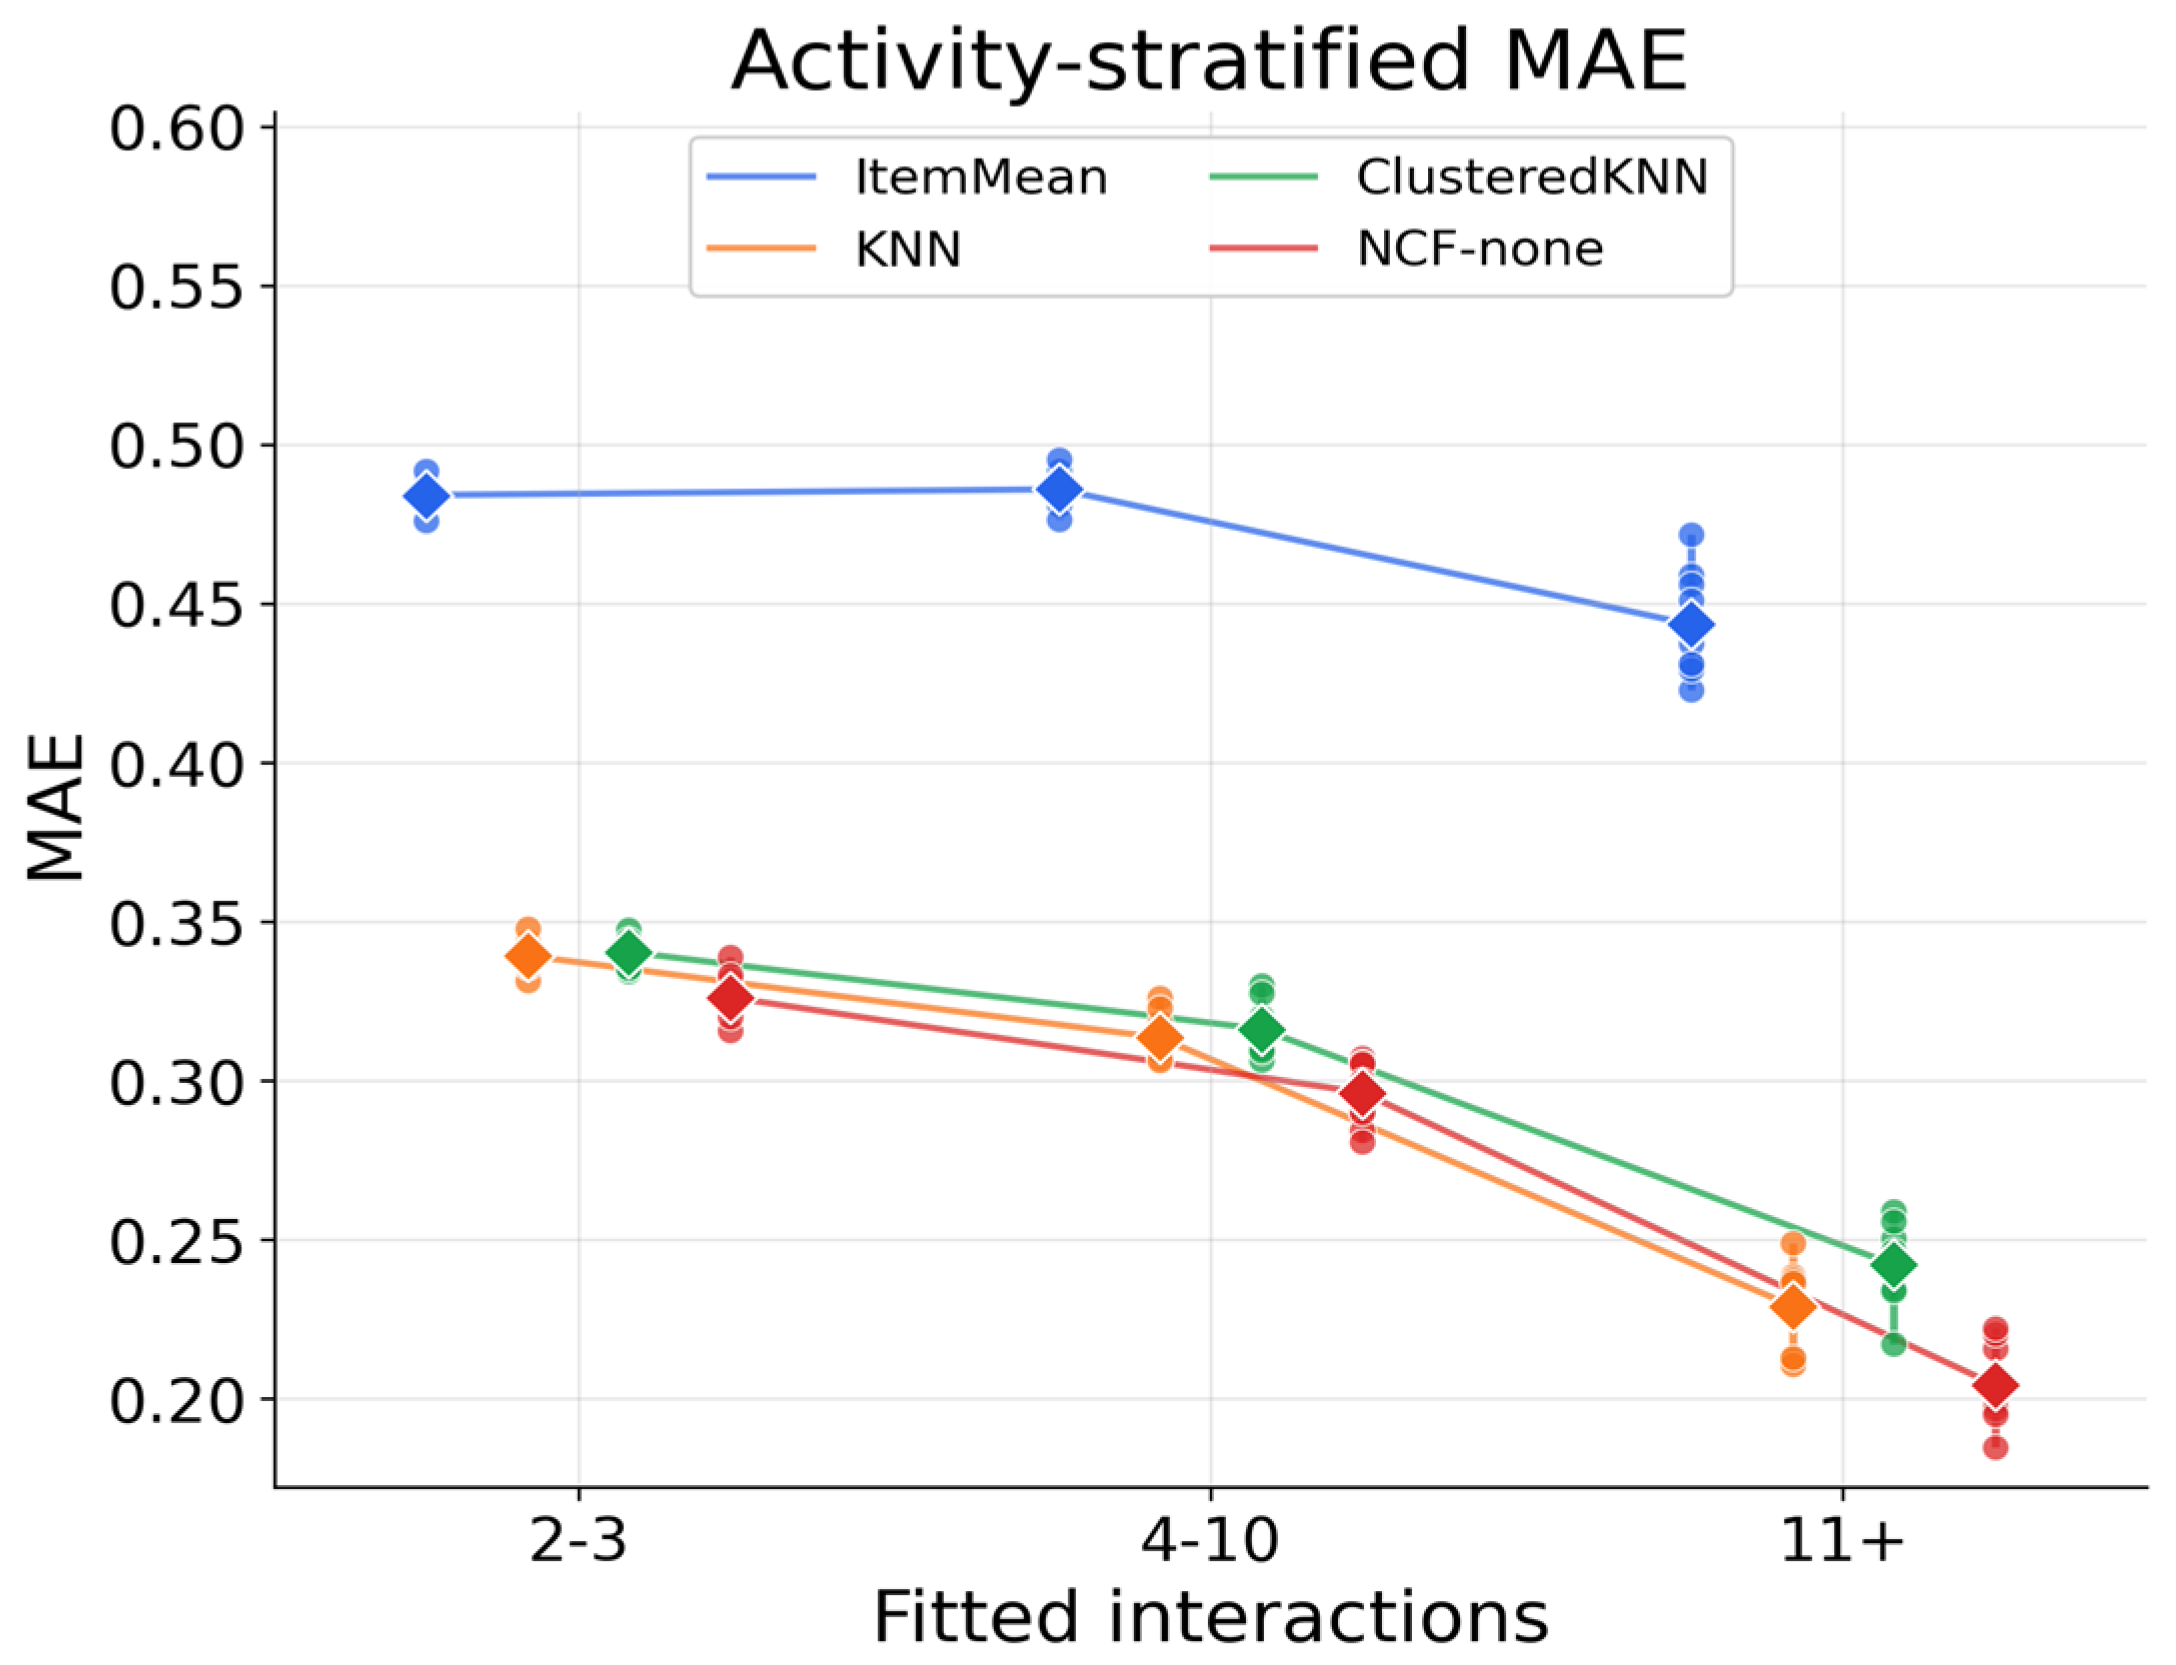
Error falls as fitted user history becomes deeper. For users with 2–3 fitted interactions, KNN and NCF-none have RMSE values of 0.6461 and 0.6521 and MAE values of 0.3393 and 0.3262, respectively. For users with 11+ fitted interactions, RMSE falls to 0.4810 for KNN and 0.4783 for NCF-none, while MAE falls to 0.2292 and 0.2044. The NCF MAE advantage is therefore more pronounced among users with richer histories. This result reinforces the importance of separating the warm-start performance of active users from the much larger sparse-history population. The activity-stratified RMSE and MAE profiles are shown in Figure 9 and Figure 10.
Figure 9.
Ten-seed RMSE by fitted-user activity.
Figure 10.
Ten-seed MAE by fitted-user activity.
5. Discussion
5.1. Theoretical Interpretation: Personalization Granularity as a Contingency Choice
The central empirical result supports the contingency perspective developed above: personalization granularity does not produce a monotonic performance hierarchy. A shared population-level item-similarity model, a behaviorally segmented neighborhood model, and individually parameterized neural models each lead on different objectives. KNN is strongest among rank-capable models on RMSE and neighborhood coverage; ClusteredKNN leads observed Top-K retrieval; and NCF-all-safe leads MAE. This pattern supports a contingency view of AI personalization rather than a technological-determinist assumption that greater complexity or finer targeting is inherently superior.
The cluster diagnostics make this result concrete. The complete validation distributions are reported in Appendix A (Figure A1, Figure A2, Figure A3, Figure A4, Figure A5 and Figure A6). Behavioral segmentation can improve retrieval, but finer partitions progressively reduce the co-rating evidence required by neighborhood recommendation. In this setting, the pattern illustrates an important boundary condition for algorithmic segmentation (Salminen et al., 2023): segmentation is not valuable merely because it is more granular. It must preserve enough behavioral support to make the downstream decision system reliable.
This finding qualifies a simple “more granular is better” interpretation of one-to-one personalization. Prior personalization theory motivates progressively finer treatment when richer customer information can be acted on, while algorithmic-segmentation research emphasizes the usefulness of increasingly data-driven groups. The present evidence adds a boundary condition: in sparse recommender settings, finer segmentation can simultaneously localize relevance and destroy the co-rating support required by the downstream prediction mechanism. Granularity should therefore be treated as a contingent design variable rather than as a monotonic proxy for customer value.
The UserMean result provides a second conceptual contribution. A user-level constant predicts the highly positive rating distribution extremely well, yet it cannot rank unseen courses. This is an unusually clear demonstration that prediction of historical preference levels and recommendation of specific alternatives are different tasks. Marketing analytics should therefore avoid treating a low error score as sufficient evidence of customer-facing recommendation quality.
5.2. Metadata Richness Does Not Imply Universal Incremental Value
The NCF variants show that richer course information changes the error profile but does not dominate every outcome. All-safe metadata produces the lowest rank-capable MAE, while NCF-none is better on RMSE and NCF-taxonomy has the highest full-catalog Spearman ρ within the NCF family. Level, context, skills, taxonomy, and content representations occupy different positions across error and retrieval metrics. The managerial implication is not that metadata is unhelpful, but that feature availability must be linked to a defined decision objective.
At the same time, the current tuned-family design does not isolate feature effects because each metadata representation is paired with an independently selected NCF configuration. Strong claims such as “course level causes the MAE improvement” would therefore be unwarranted. This distinction between a performance family comparison and a causal feature ablation is important for responsible marketing analytics, where feature collection can have privacy, maintenance, and governance costs (De Bruyn et al., 2020; Gorgoglione et al., 2019; Komodromos, 2026).
5.3. Multi-Objective AI Value and Marketing Administration
The findings extend the notion of recommender business value (Jannach & Jugovac, 2019) by showing why model selection must be multi-objective. Rating error, Top-K retrieval, prediction support, and computational cadence capture different aspects of the service. A model that improves one may worsen another. Consequently, the administrative task is to make the trade-off explicit rather than hide it in a composite “AI performance” label.
This perspective is consistent with current AI-marketing research that emphasizes infrastructure, accountability, and organizational capability alongside personalization (De Bruyn et al., 2020; Komodromos, 2026). In practice, the relevant question is not “Which algorithm is most advanced?” but “Which performance profile best supports the customer experience and operating model we intend to deliver?”
6. Managerial and Governance Implications
For marketing managers, the results imply that recommender selection should begin with the service objective. Table 3 translates the empirical profiles into decision guidance without treating any model as a universal winner.
Table 3.
Decision-oriented interpretation of the observed model profiles.
A second implication concerns experimentation governance. The sensitivity analysis shows that NCF configuration choice changes materially when RMSE or MAE is optimized in isolation. Managers should therefore decide in advance which loss function represents the business risk they wish to control. If the criterion is changed after final-test results are observed, the organization is no longer evaluating a predefined policy; it is continuing to tune on the test set. The study’s validation-only selection and frozen confirmation provide a practical governance pattern for customer-facing AI.
Third, platforms should treat data minimization and feature provenance as model-design decisions. Dynamic popularity and target-adjacent fields were excluded here because they can leak information across time or incorporate signals too close to the prediction target. In production, similar controls should document when a feature becomes available, whether it would exist at decision time, and whether its collection is proportionate to the intended personalization benefit.
Finally, offline optimization should not substitute for customer outcomes. The present Recall@K values are not conversion rates, and RMSE/MAE do not measure satisfaction, enrolment, completion, loyalty, or learning. A defensible deployment sequence would use offline evidence to narrow the model set, followed by prospective online testing with customer and business outcomes, monitoring for exclusion, fairness, diversity, novelty, and unintended effects.
7. Limitations and Future Research
First, the evidence comes from one observational Coursera snapshot and from explicit historical ratings. Ratings are strongly skewed toward 5, and the target is not enrolment, engagement, completion, retention, learning, or revenue. The study therefore estimates offline recommendation properties, not causal business or educational effects.
The single-platform design also limits external validity. Coursera’s catalog structure, explicit-review mechanism, user activity distribution, and strong positive-rating skew may differ from subscription learning services, institutional learning-management systems, or marketplaces with different exposure and feedback processes. The results should therefore be interpreted as evidence about the evaluated Coursera snapshot and service conditions, not as platform-invariant performance rankings.
Second, the confirmatory estimand is explicitly warm-start. Although sparse users contribute to fitting, within-user evaluation is possible only for the 10,296 users with at least four ratings—1.59% of the user population. This is a major boundary condition. Future work should evaluate cold-start and sparse-history strategies directly, including content-first recommendation (Lops et al., 2019; Tarus et al., 2018), onboarding elicitation, session/context signals, and hybrid fallback policies.
Third, unobserved candidate courses are unknown rather than verified negatives. Precision and Recall therefore measure retrieval of observed relevant held-out courses from a very sparse catalog label set. Future online studies should use exposure and acceptance data, while offline work should add catalog coverage, long-tail exposure, novelty, diversity, calibration, and serendipity.
A fitted-interaction popularity rule based on rating counts would also be a useful heuristic benchmark, but it lies outside the prespecified comparison set, which was designed to contrast rating-only references, a simple rank-capable item-mean baseline, and the three personalization architectures. Future benchmarking should include popularity-based ranking alongside the present baselines.
Fourth, the metadata-family comparison is not a matched causal feature ablation. Because each representation is paired with independently selected architecture and training choices, differences combine feature representation with configuration selection. A future matched-architecture ablation should hold model structure, hyperparameters, seeds, and training budget fixed while adding one feature family at a time.
Fifth, the ten seed outcomes are repeated evaluations on overlapping partitions of the same underlying dataset and should not be treated as ten independent replications. Seed ranges and descriptive variation are useful for robustness, but formal inference would require a design that accounts for dependence.
Sixth, the reported runtime values are implementation- and hardware-specific. Deployment studies should measure end-to-end latency, throughput, retraining cadence, energy use, engineering complexity, and infrastructure cost under the intended production architecture.
Finally, responsible deployment requires broader governance evaluation. Future work should examine fairness across learner groups, privacy and consent, explanation quality, user control, model drift, human oversight, and the potential for personalization to narrow rather than expand exposure. These questions are especially relevant when recommendations shape learning pathways or access to professional development opportunities.
A recent recommender-systems survey likewise identifies fairness, transparency, trust, filter bubbles, and cold-start constraints as continuing design challenges that extend beyond predictive accuracy (Ibrahim et al., 2025).
8. Conclusions
This study reframes AI recommender selection as a marketing-administration problem of matching personalization architecture to service objectives. Under a guarded ten-seed protocol, no rank-capable recommender dominates across rating error, retrieval, coverage, and runtime. KNN offers the strongest rank-capable RMSE and high personalized-neighborhood coverage; ClusteredKNN improves observed Top-K Recall at the cost of lower support; and NCF-all-safe minimizes MAE while requiring substantially more fitting time and not leading RMSE or full-catalog Spearman ρ. The rating-only UserMean baseline further shows why numerical prediction accuracy cannot stand in for recommendation quality.
The broader implication is that more granular AI personalization is not necessarily more valuable personalization. Its value depends on what the organization is trying to optimize, what data and infrastructure it can responsibly maintain, and how model choices are governed. For digital learning and other service platforms, the most defensible strategy is therefore a contingency approach: predefine the objective, select on validation data, freeze the decision before final testing, report complementary trade-offs separately, and validate offline gains against real customer outcomes before deployment.
This conclusion is conditional on the evaluated offline setting: one Coursera snapshot, a warm-start subset of users with sufficient history, sparse observed relevance labels, and the specific neighborhood and neural architectures tested here. It should therefore be read as evidence against assuming a monotonic complexity–value relationship under these service conditions, rather than as a universal claim that greater personalization cannot be beneficial elsewhere.
Author Contributions
Conceptualization, N.S. and G.S.; Methodology, N.S. and G.S.; Software, N.S.; Validation, N.S., E.P. and G.S.; Formal analysis, N.S. and E.P.; Investigation, N.S.; Resources, N.S. and K.A.; Data curation, N.S. and G.S.; Writing—original draft, N.S.; Writing—review & editing, N.S., E.P., K.A. and G.S.; Visualization, N.S.; Supervision, E.P., K.A. and G.S.; Project administration, E.P.; Funding acquisition, N.S. All authors have read and agreed to the published version of the manuscript.
Funding
This research received no external funding.
Institutional Review Board Statement
Not applicable. This study used a publicly available, privacy-minimized secondary dataset and involved no direct interaction or intervention with human participants.
Informed Consent Statement
Not applicable. The study analyzed a publicly available, privacy-minimized secondary dataset.
Data Availability Statement
The privacy-minimised Coursera Courses Metadata and Anonymized Ratings Dataset 2026 (Version 2) is publicly available through Kaggle at https://www.kaggle.com/datasets/juliasevaslidou/coursera-courses-metadata-and-reviews-dataset-2025. The release includes anonymised ratings, course metadata, documentation, integrity checksums and experimental_splits_2026.csv. This split manifest supplies the exact user–course train/validation/test membership for each of Seeds 1–10, enabling independent reproduction of the reported data partitions without publishing raw platform identifiers or review text.
Acknowledgments
During the preparation of this manuscript, the authors used OpenAI ChatGPT (GPT-5.5) for manuscript organization, drafting and language revision, bibliographic auditing, and explanation of previously computed results. The authors reviewed and edited the output and take full responsibility for the content of this publication.
Conflicts of Interest
The authors declare no conflicts of interest.
Appendix A. KNN Cluster-Count Sensitivity and Balance
This appendix presents the complete KNN validation-search diagnostics by requested user-cluster count. They explain the support and balance consequences of clustering, but are descriptive analyses rather than additional confirmation outcomes or selection criteria. Every point in Figure A1, Figure A2, Figure A3, Figure A4, Figure A5 and Figure A6 is one validation configuration×seed run.
Figure A1.
Validation RMSE distribution across KNN configurations and seeds, by user-cluster count.
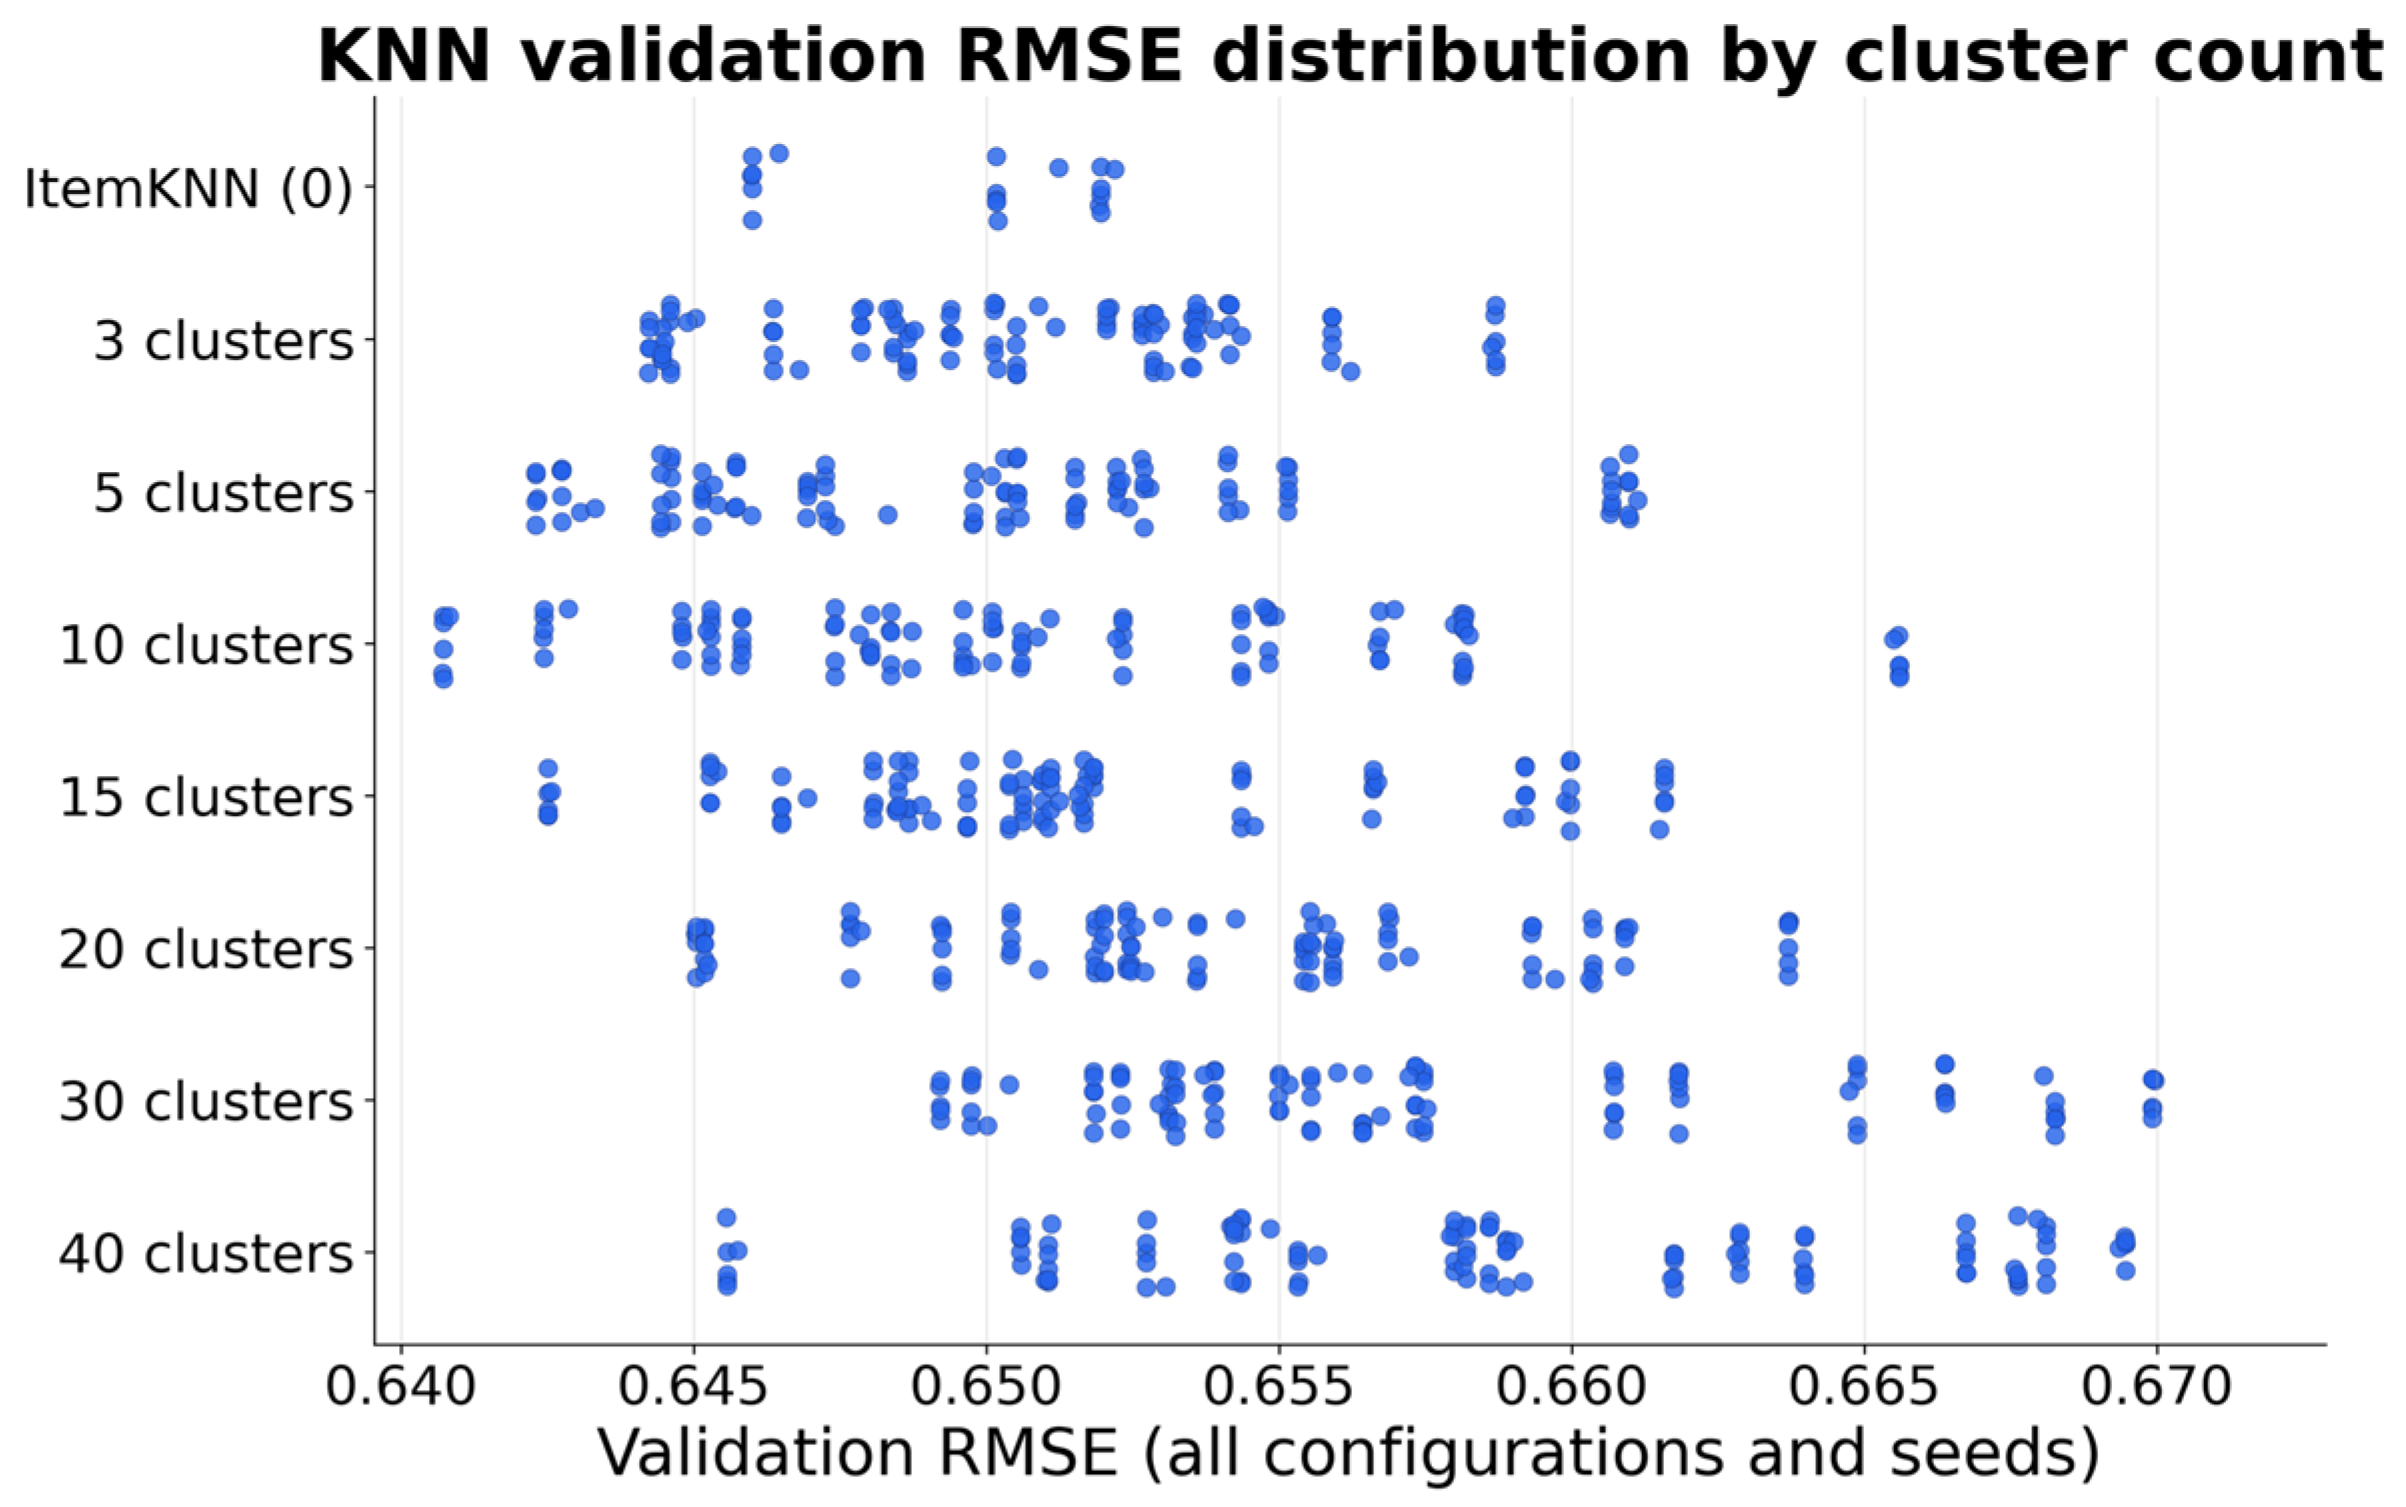
Figure A2.
Validation MAE distribution across KNN configurations and seeds, by user-cluster count.
In Figure A1, each point is one validation configuration × seed run. The low-RMSE tail of the 3–10-cluster distributions overlaps with ItemKNN, but the distributions widen and shift toward larger errors at 30–40 clusters; the median rises from 0.6502 without clustering to 0.6584 at 40 clusters. Thus, isolated favorable clustered runs do not translate into a robust distributional RMSE advantage.
Turning to Figure A2, the same all-run view for MAE shows a clearer monotonic displacement: the median increases from 0.3400 for ItemKNN to 0.3610 at 40 user clusters. The overlapping lower tails at small cluster counts explain why eligible clustered configurations can exist, but most configurations become less favorable as the user partition becomes finer.
Figure A3 shows that some three-cluster and five-cluster runs exceed the 0.90 coverage floor (48 and 18 of 108 raw runs, respectively), whereas no validation run with 10 or more requested user clusters reaches 0.90 coverage; the maximum observed coverage at 10 clusters is 0.8935. Formal eligibility is stricter still, requiring all three seed runs of one configuration to meet the threshold. The selected three-cluster configuration is one of these eligible configurations.
Figure A3.
Validation personalized-prediction coverage distribution across KNN configurations and seeds, by user-cluster count.
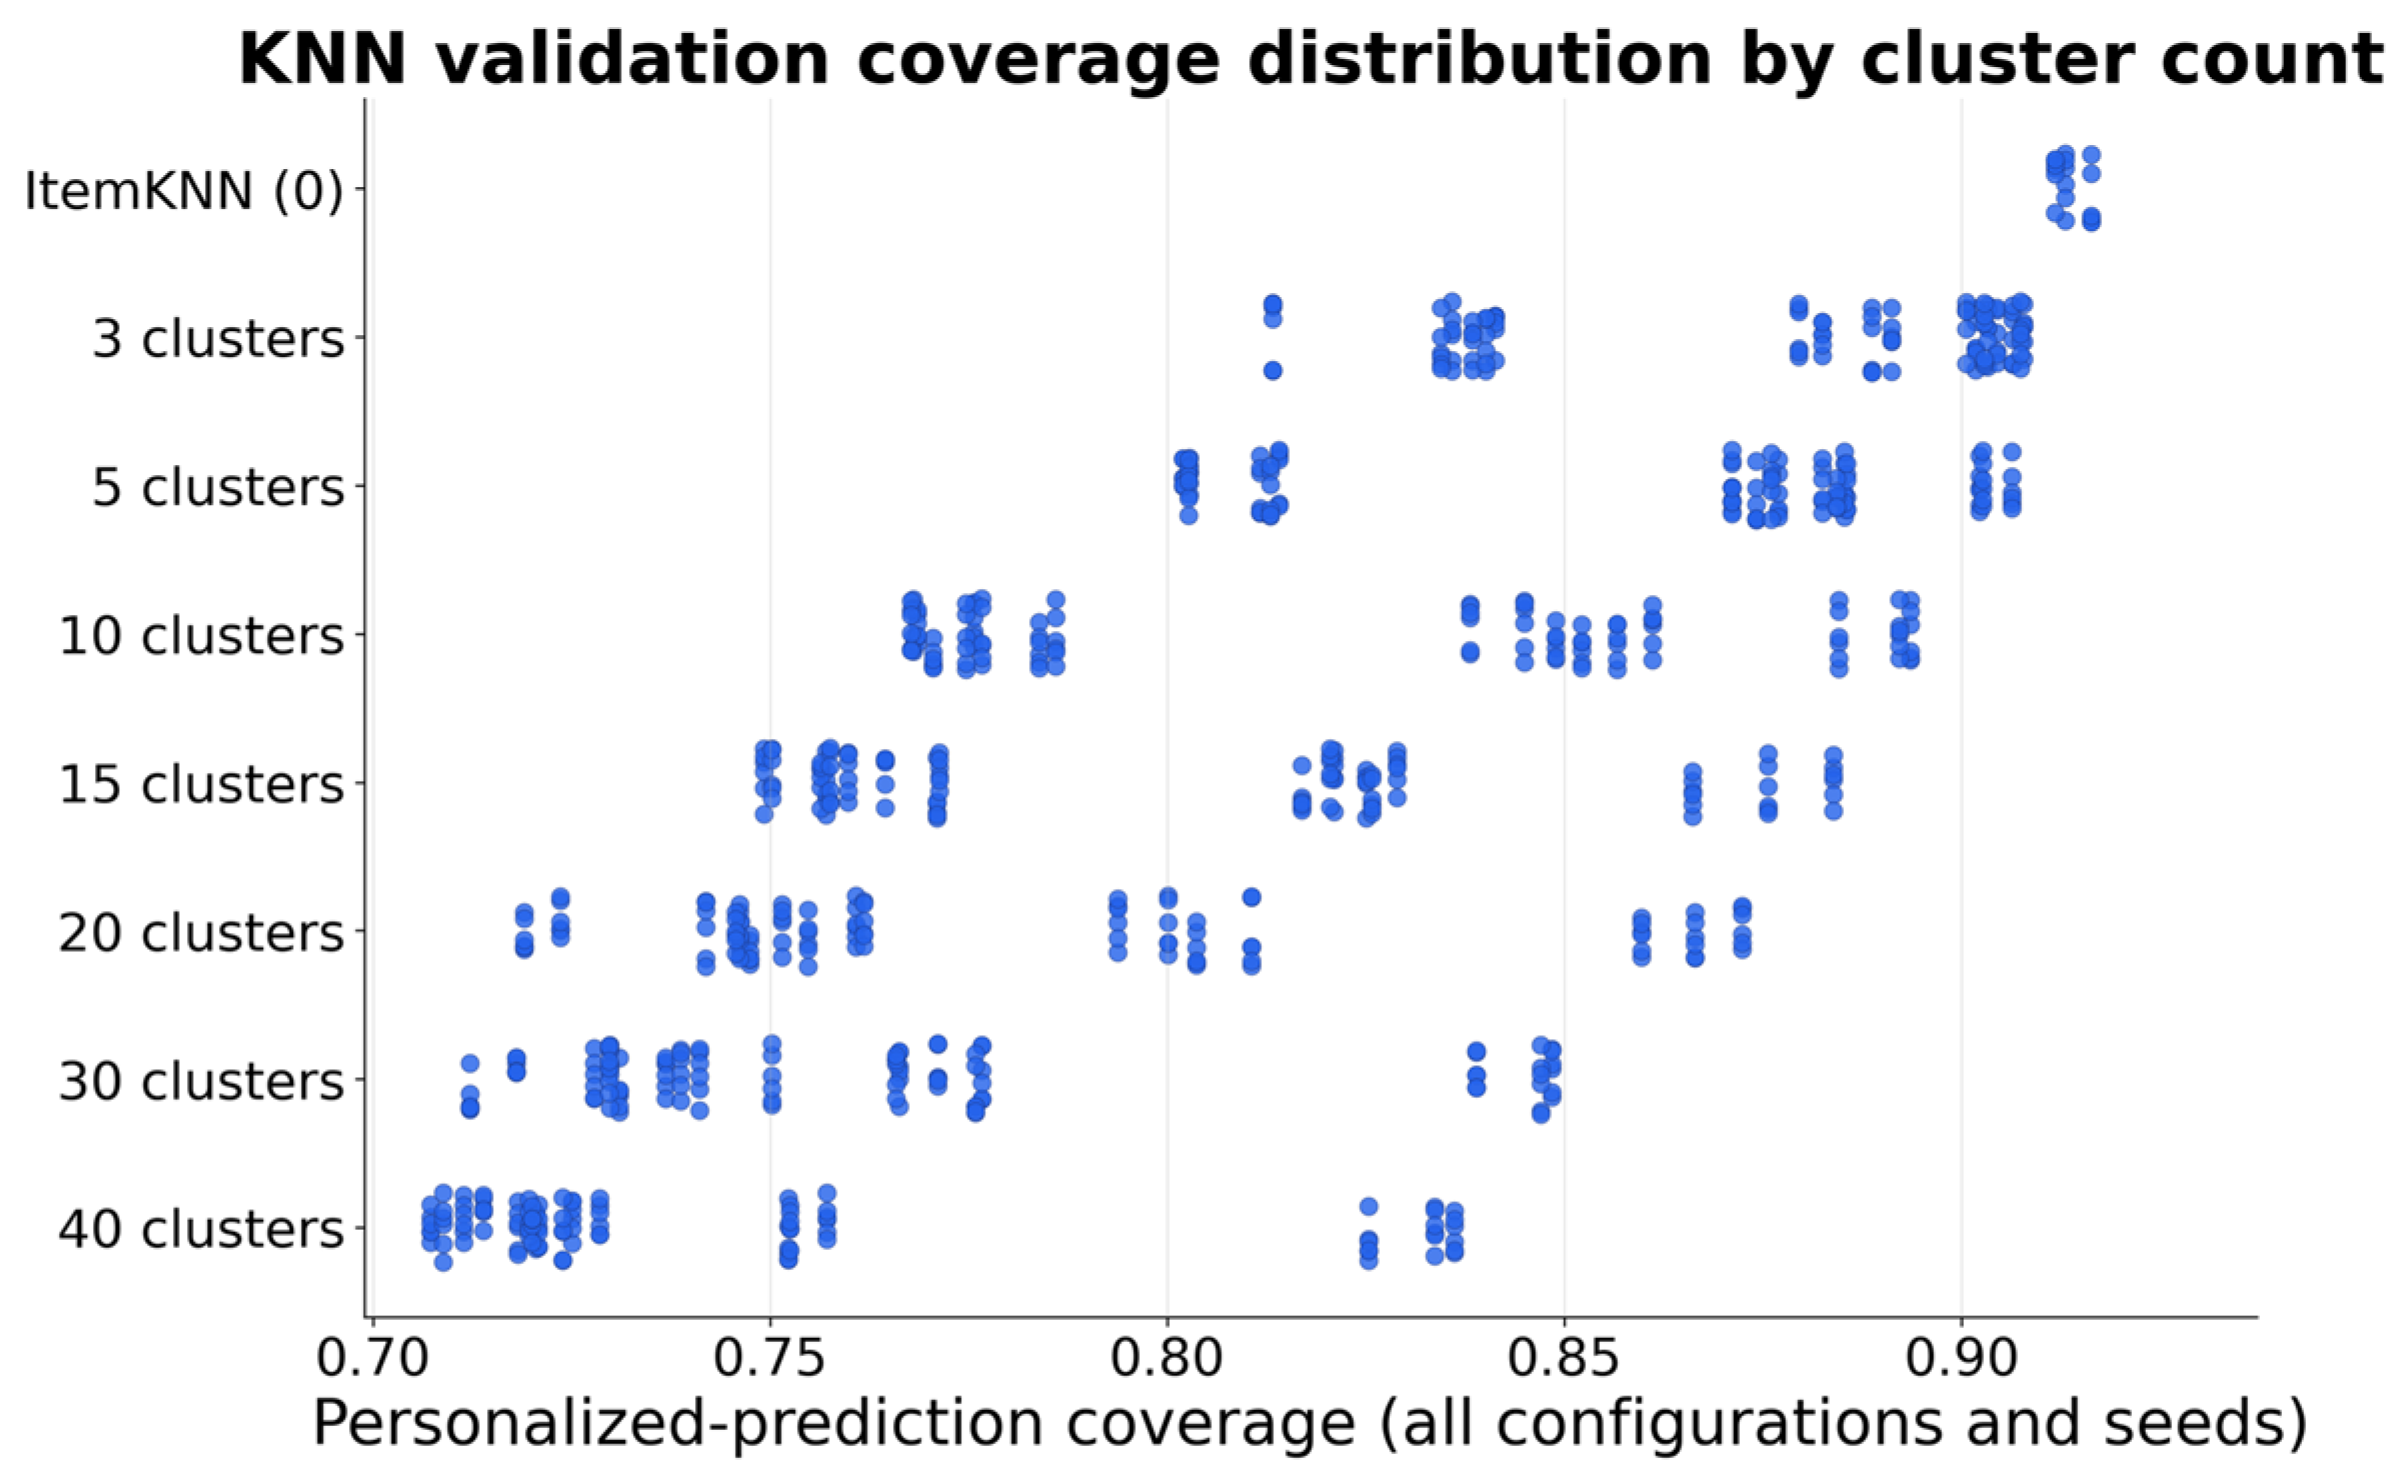
Figure A4.
Validation usable-neighbor distribution across KNN configurations and seeds, by user-cluster count.
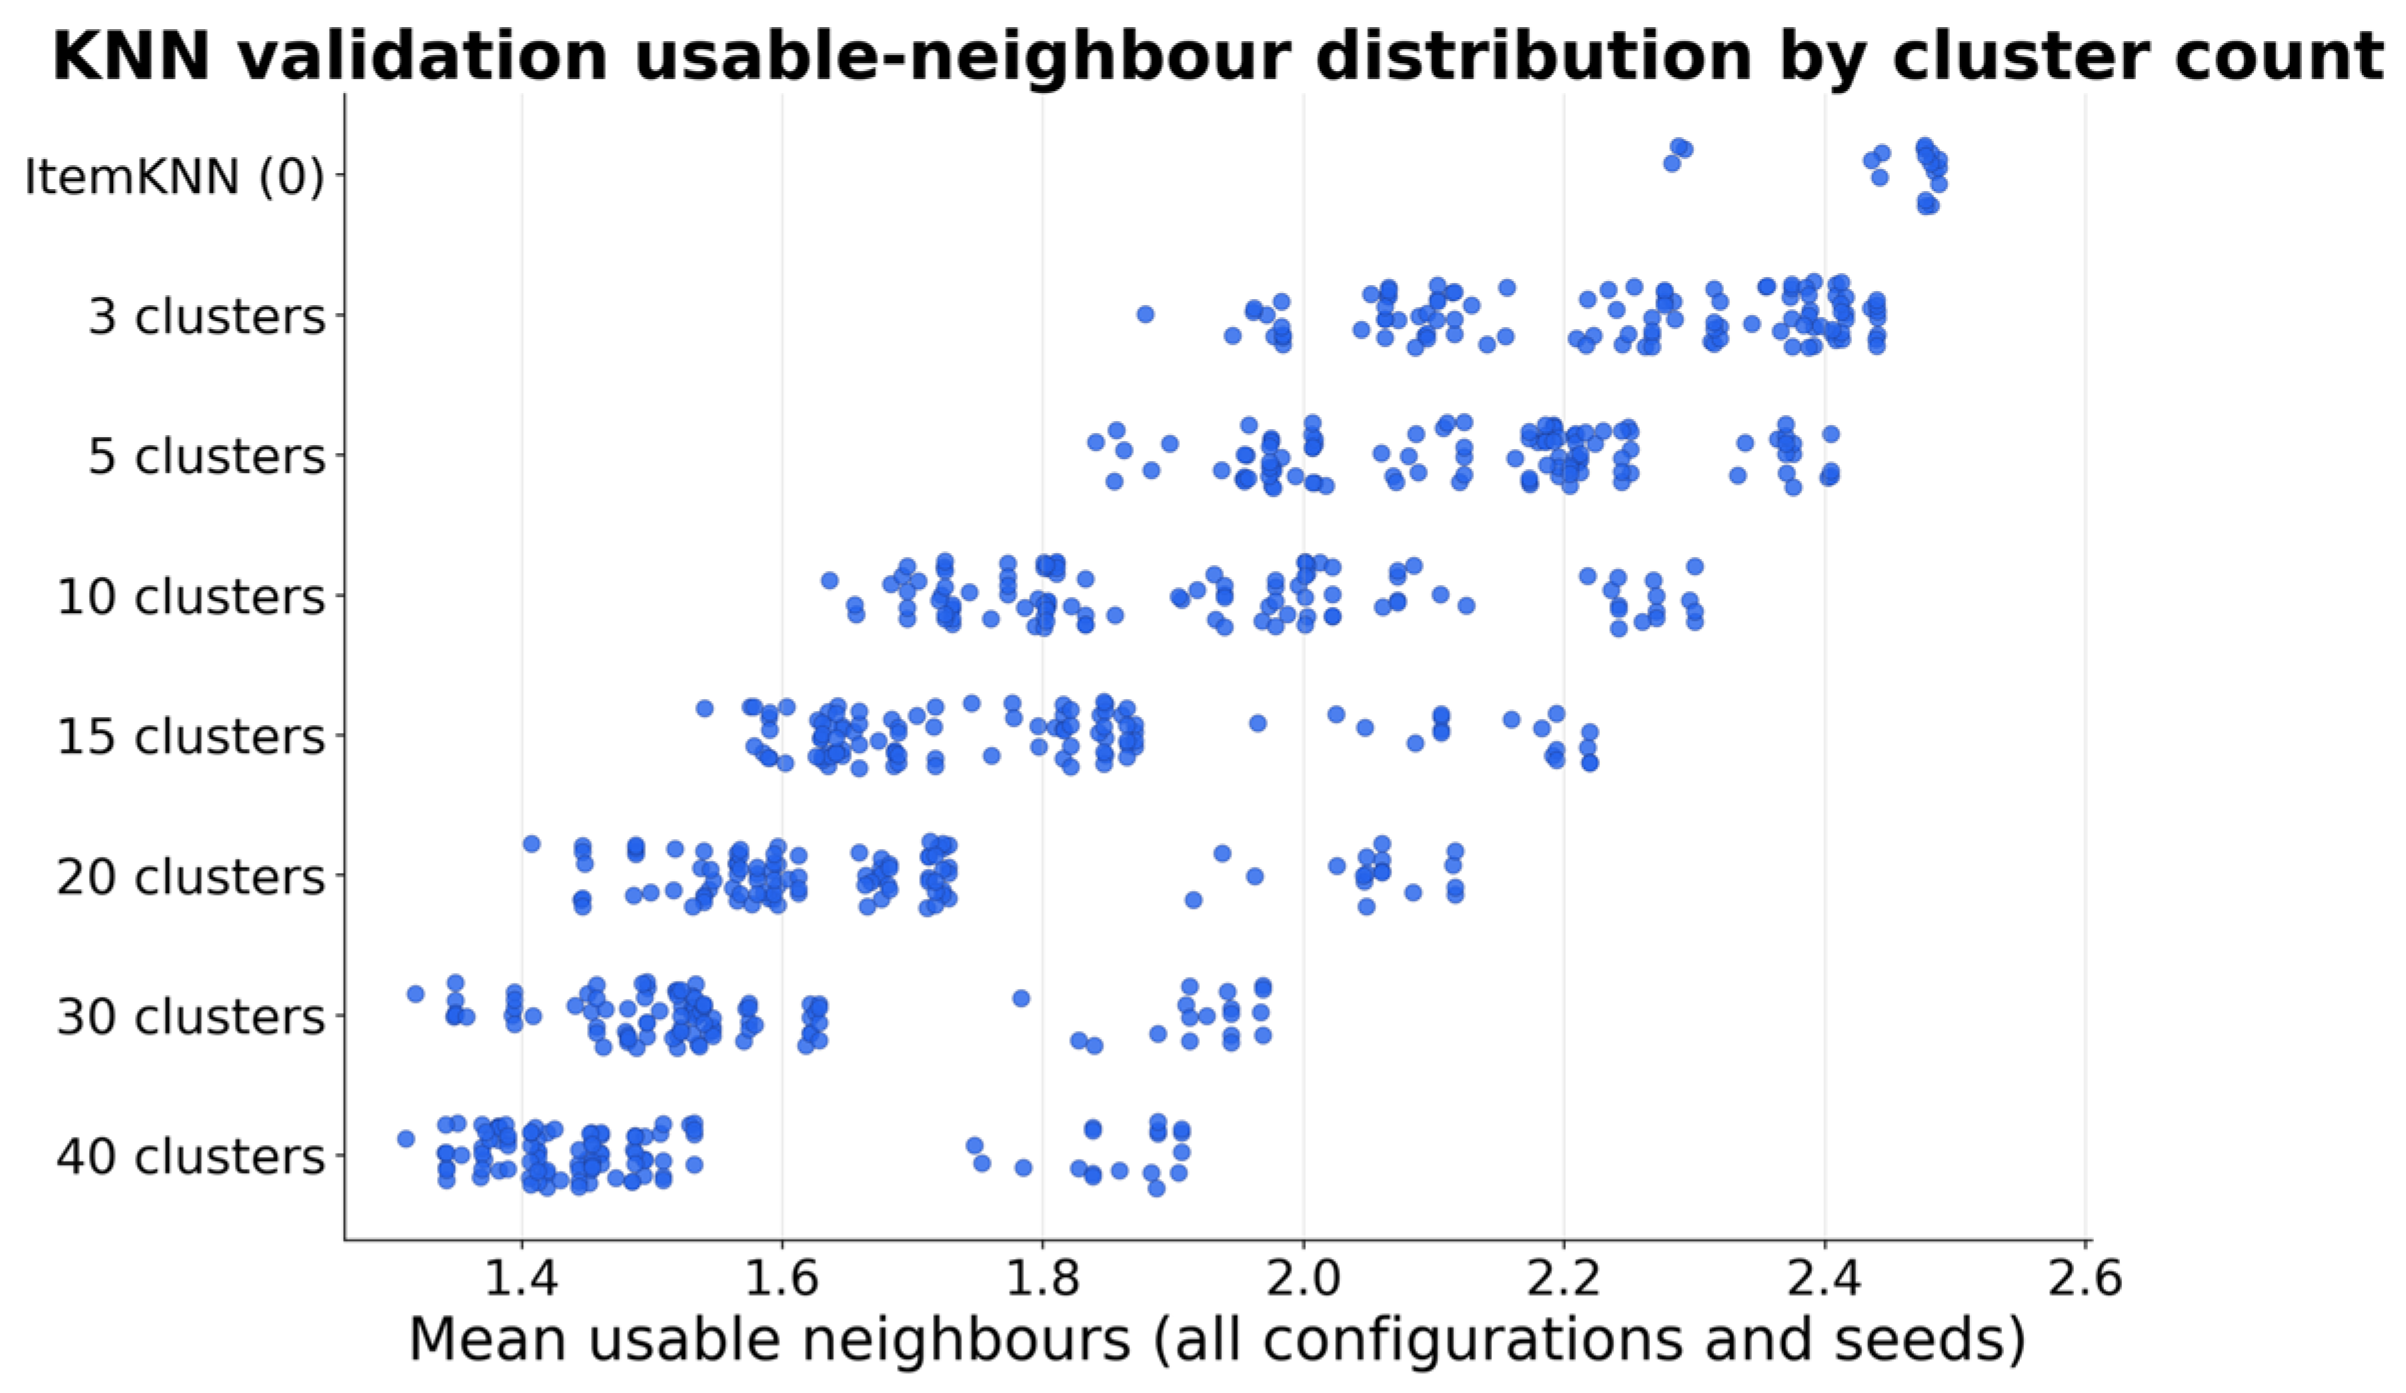
The pattern in Figure A4 indicates that usable-neighbor support follows the same distributional pattern as coverage. The median falls from 2.477 without clustering to 1.452 at 40 user clusters, showing the mechanism behind the coverage loss: fine user partitions leave fewer in-cluster co-raters to support each item-based prediction.
Figure A5.
User-cluster size CV distribution across KNN configurations and seeds.
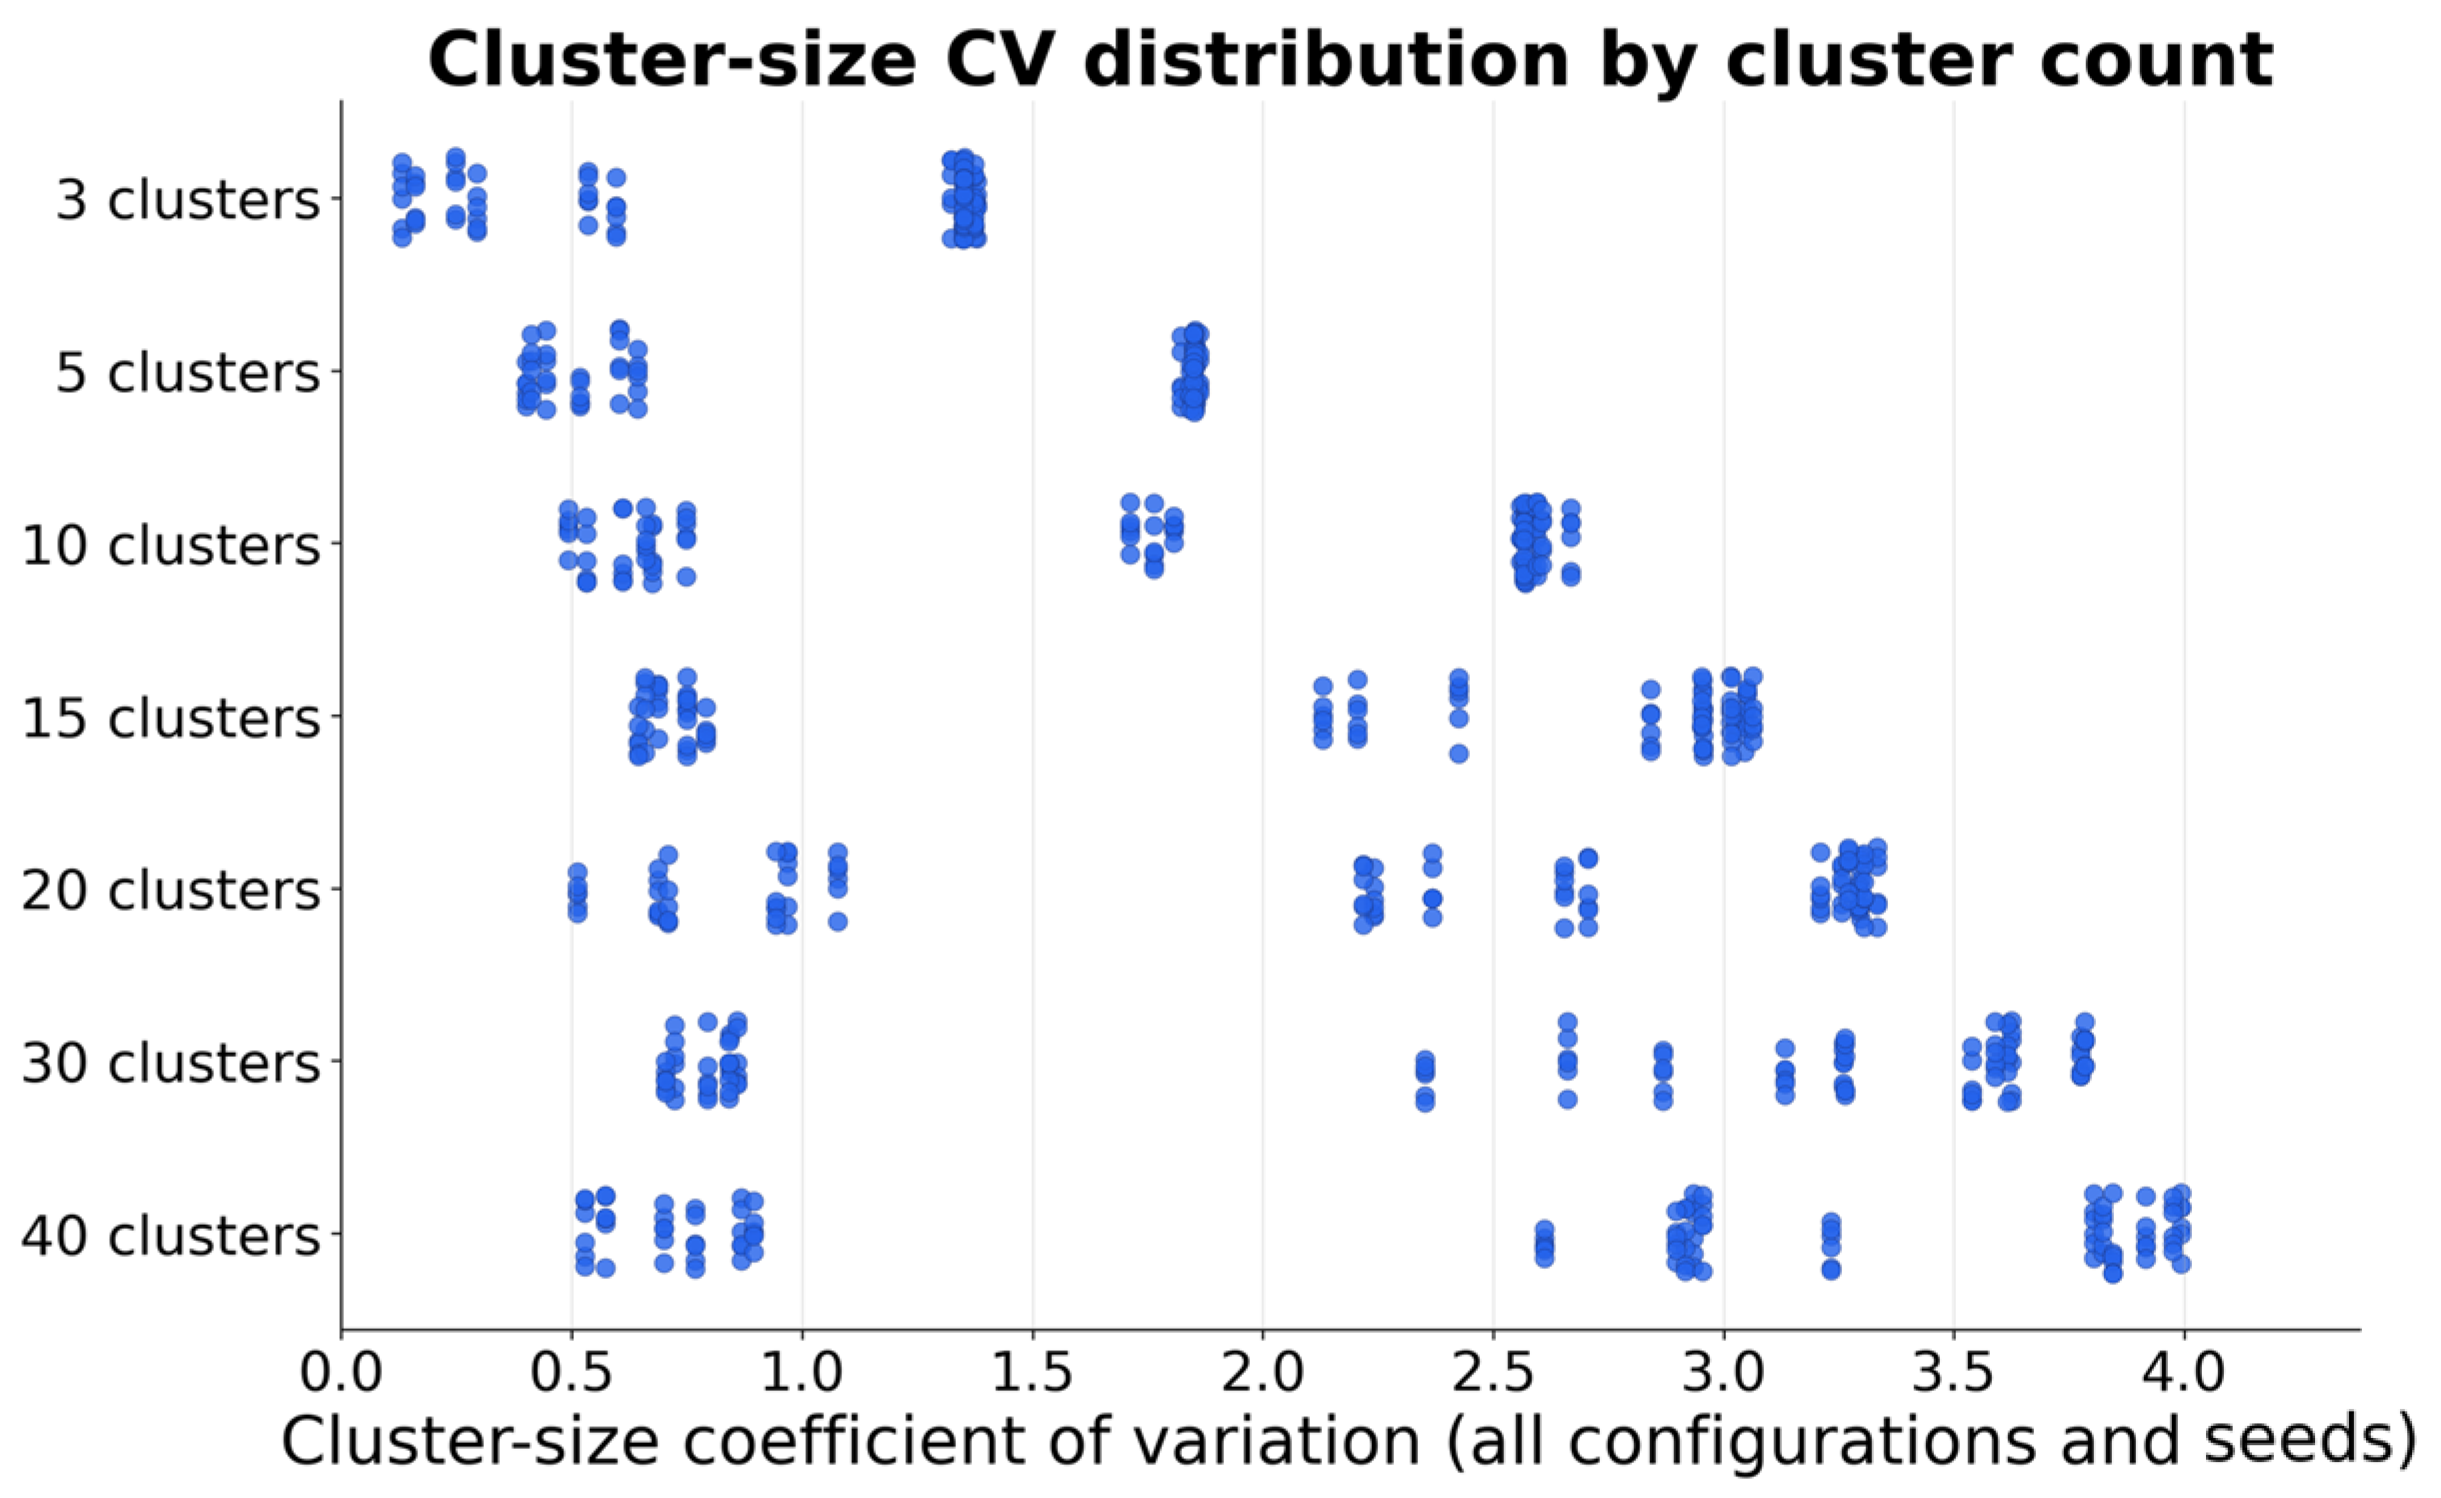
Figure A6.
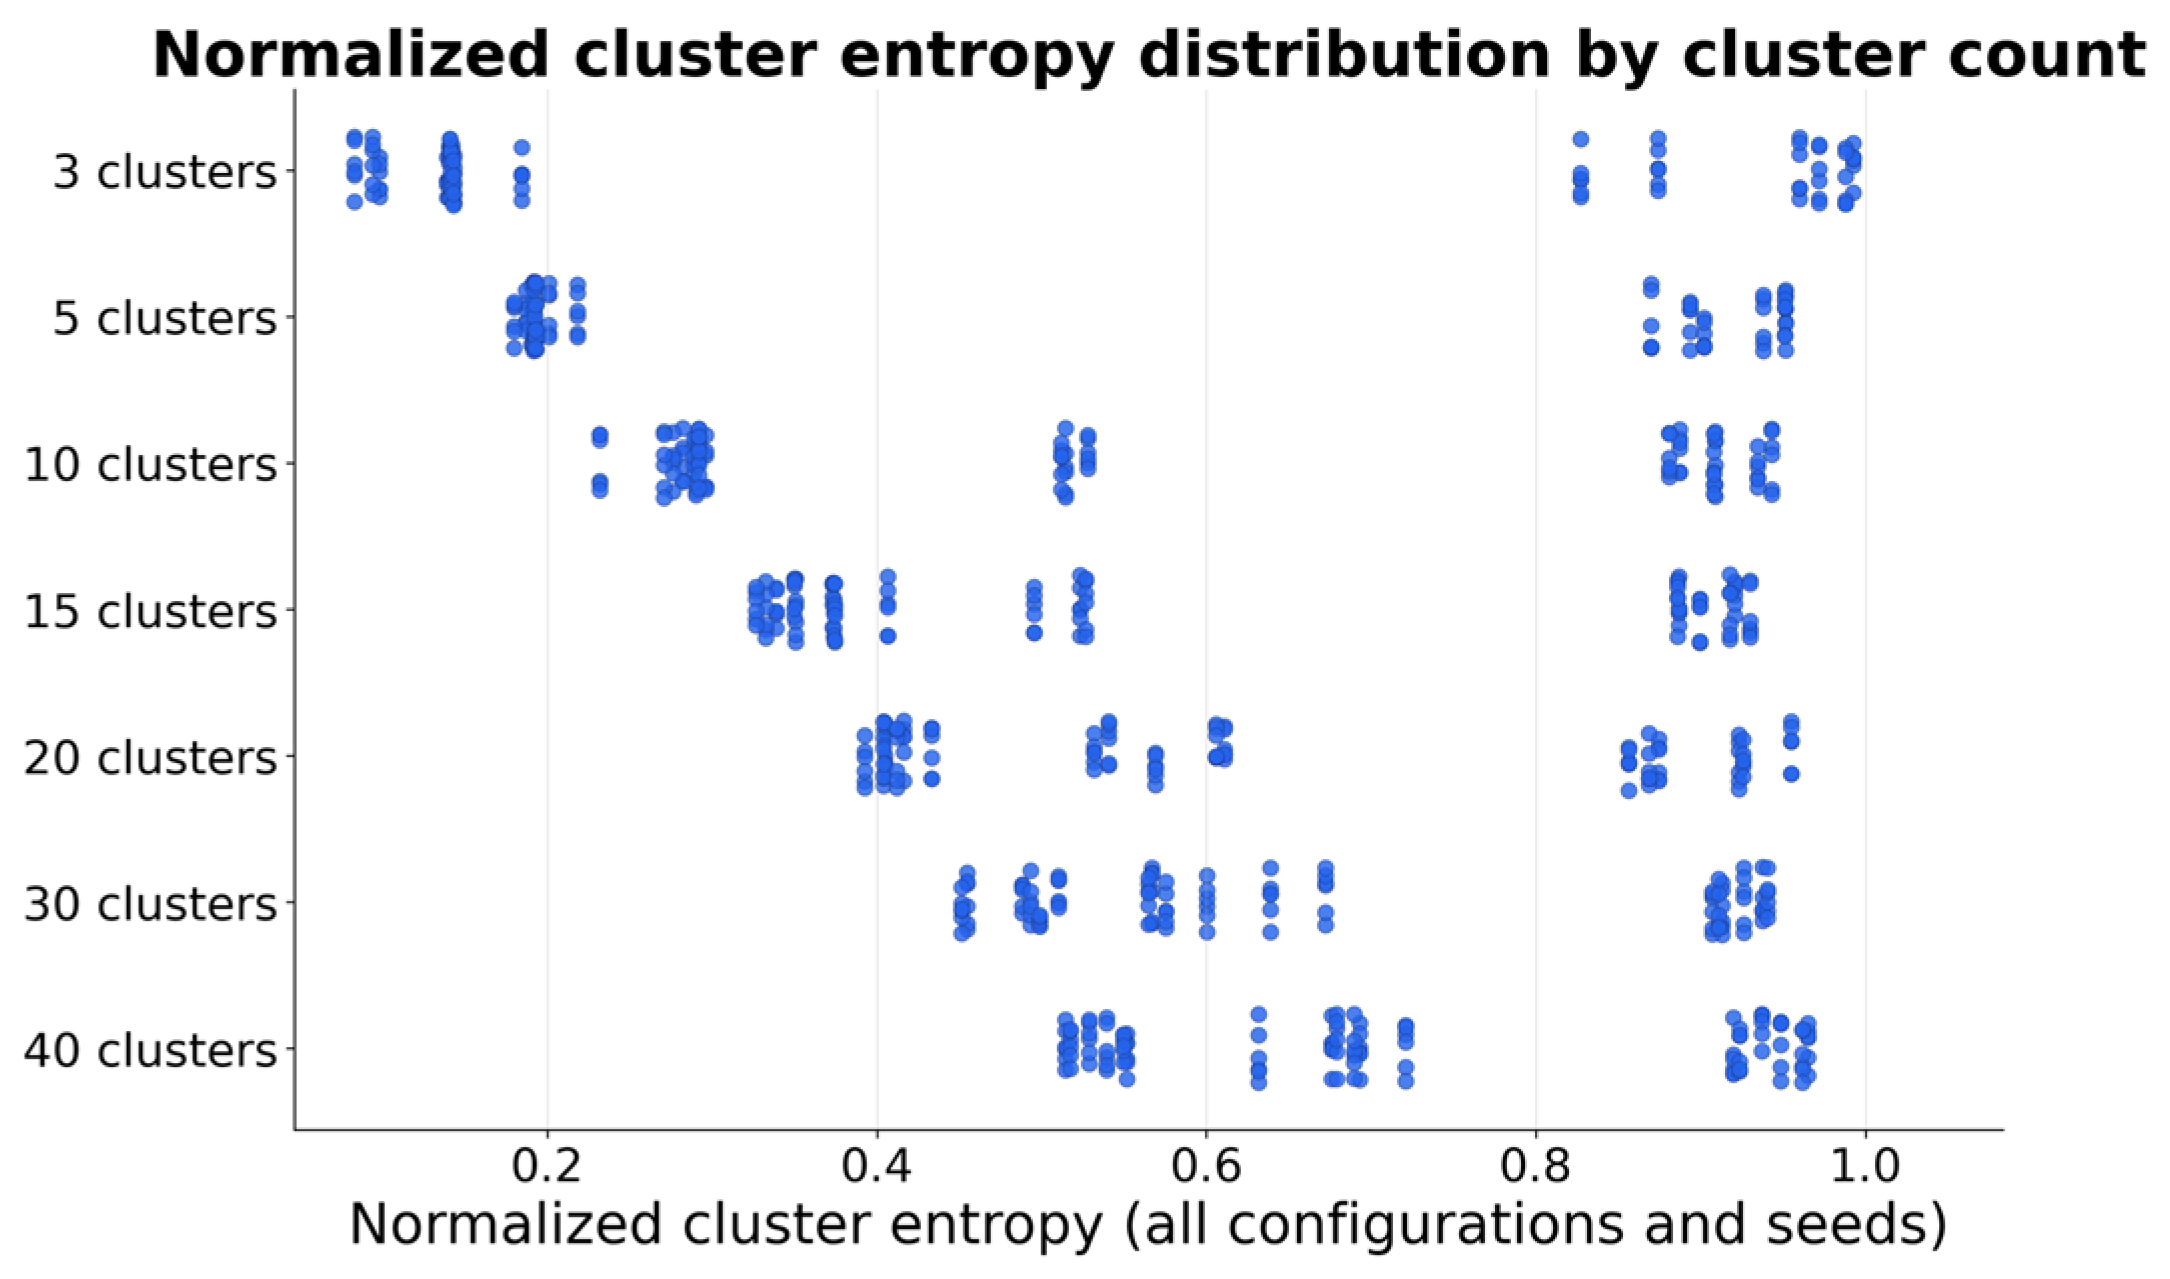
Normalized user-cluster entropy distribution across KNN configurations and seeds.
Evidence from Figure A5 indicates that every point represents the balance of one clustered configuration and seed. The distribution shifts upward and widens as the requested partition becomes finer: the median CV rises from 1.3501 at three clusters to 2.9255 at 40 clusters. Thus, some configurations form relatively balanced small partitions, but fine partitions frequently produce markedly unequal cluster sizes.
In Figure A6, the normalized entropy distribution complements the CV result. Its median rises from 0.1425 at three clusters to 0.6844 at 40 clusters, but its broad overlap between cluster counts shows that allocation balance depends materially on the preprocessing and clustering configuration. Together with Figure A3, Figure A4 and Figure A5, the distribution does not reveal a balance pattern that compensates for declining personalized support at high cluster counts.
Appendix B. Full-Catalog Precision and Recall at K and Illustrative Random References
Table A1 reports the complete ten-seed mean Precision@5, Precision@10, Precision@20, Recall@5, Recall@10, and Recall@20 values for the rank-capable recommenders. It reports both a mean-count uniform-random approximation and an eligible-user-level analytical expectation so that the effect of aggregation can be assessed directly.
Table A1.
Mean full-catalog Precision@K and Recall@K across ten guarded final seeds, with mean-count and eligible-user-level uniform-random references.
The mean-count random row is an analytical scale reference, not a Monte Carlo simulation or a fitted recommender. Let be the ten-seed mean number of unseen candidate courses per ranking-eligible user and the corresponding mean number of observed relevant held-out courses. For a uniformly random Top-K list, , so and . At K = 5, this gives approximately 0.01010 expected hits, P@5 = 0.00202022 and R@5 = 0.00931705; the same calculation gives P@10 = P@20 = 0.00202022, R@10 = 0.01863410 and R@20 = 0.03726820. The row provides scale for the sparse retrieval task and does not enter training or model selection.
The eligible-user-level reference applies the same analytical expectation before aggregation. For each ranking-eligible user u, let Cu be the actual unseen-candidate count and Ru the observed relevant held-out count. Then E[hitsu] = K·Ru/Cu, E[Precision@Ku] = Ru/Cu and E[Recall@Ku] = K/Cu. These expectations are macro-averaged within each seed and then averaged equally across Seeds 1–10, matching the recommender aggregation. The resulting values are P@5 = P@10 = P@20 = 0.00202404 and R@5 = 0.00931728, R@10 = 0.01863455 and R@20 = 0.03726910. They differ from the mean-count approximation by only about 0.19% for Precision@K and 0.0024% for Recall@K, so the simpler reference does not materially affect interpretation. Accordingly, NCF-none remains below the random scale, most metadata-bearing NCF variants remain close to or modestly above it, and both KNN variants remain materially above it; these comparisons are descriptive because NCF selection used RMSE + MAE rather than retrieval metrics.
Appendix C. Model-Selection and Computing Details
Appendix C.1. Validation-Selected Configurations
To preserve reproducibility while keeping the main narrative focused on the selection logic and managerial interpretation, the detailed validation-selected hyperparameters are reported here.
Table A2.
Validation-selected configurations under the primary RMSE + MAE rule.
Appendix C.2. Computing Environment
Experiments were executed on a Linux virtual machine with an Intel Xeon Gold processor (Intel Corporation, Santa Clara, CA, USA) and NVIDIA RTX A6000 GPUs (NVIDIA Corporation, Santa Clara, CA, USA), approximately 128 GB RAM, and two NVIDIA RTX A6000 GPUs (approximately 48 GB memory each). The environment used Python 3.10.12 and PyTorch 2.9.0+cu128. Validation scheduled CPU KNN and GPU NCF work concurrently; guarded final jobs were executed serially to improve within-environment runtime comparability. These timings are specific to the reported software and hardware environment and are not hardware-independent deployment benchmarks.
References
- Arora, N., Drèze, X., Ghose, A., Hess, J. D., Iyengar, R., Jing, B., Joshi, Y., Kumar, V., Lurie, N., Neslin, S., Sajeesh, S., Su, M., Syam, N., Thomas, J., & Zhang, Z. J. (2008). Putting one-to-one marketing to work: Personalization, customization, and choice. Marketing Letters, 19(3–4), 305–321. [Google Scholar] [CrossRef] [Scilit]
- Bergstra, J., & Bengio, Y. (2012). Random search for hyper-parameter optimization. Journal of Machine Learning Research, 13, 281–305. Available online: https://jmlr.org/papers/v13/bergstra12a.html (accessed on 1 August 2026).
- Cawley, G. C., & Talbot, N. L. C. (2010). On over-fitting in model selection and subsequent selection bias in performance evaluation. Journal of Machine Learning Research, 11, 2079–2107. Available online: https://jmlr.org/papers/v11/cawley10a.html (accessed on 9 September 2026).
- Cremonesi, P., Koren, Y., & Turrin, R. (2010). Performance of recommender algorithms on top-N recommendation tasks. In Proceedings of the 4th ACM conference on recommender systems (RecSys 2010), Barcelona, Spain, September 26–30 (pp. 39–46). Association for Computing Machinery. [Google Scholar] [CrossRef] [Scilit]
- da Silva, F. L., Slodkowski, B. K., da Silva, K. K. A., & Cazella, S. C. (2023). A systematic literature review on educational recommender systems for teaching and learning: Research trends, limitations and opportunities. Education and Information Technologies, 28(3), 3289–3328. [Google Scholar] [CrossRef] [Scilit]
- Davenport, T., Guha, A., Grewal, D., & Bressgott, T. (2020). How artificial intelligence will change the future of marketing. Journal of the Academy of Marketing Science, 48(1), 24–42. [Google Scholar] [CrossRef] [Scilit]
- De Bruyn, A., Viswanathan, V., Beh, Y. S., Brock, J. K.-U., & von Wangenheim, F. (2020). Artificial intelligence and marketing: Pitfalls and opportunities. Journal of Interactive Marketing, 51(1), 91–105. [Google Scholar] [CrossRef] [Scilit]
- Desrosiers, C., & Karypis, G. (2011). A comprehensive survey of neighborhood-based recommendation methods. In F. Ricci, L. Rokach, B. Shapira, & P. B. Kantor (Eds.), Recommender systems handbook (pp. 107–144). Springer. [Google Scholar] [CrossRef] [Scilit]
- Gorgoglione, M., Panniello, U., & Tuzhilin, A. (2019). Recommendation strategies in personalization applications. Information & Management, 56(6), 103143. [Google Scholar] [CrossRef] [Scilit]
- He, X., Liao, L., Zhang, H., Nie, L., Hu, X., & Chua, T.-S. (2017). Neural collaborative filtering. In Proceedings of the 26th international conference on World Wide Web, Perth, Australia, April 3–7 (pp. 173–182). International World Wide Web Conferences Steering Committee. [Google Scholar] [CrossRef] [Scilit]
- Huang, M.-H., & Rust, R. T. (2021). A strategic framework for artificial intelligence in marketing. Journal of the Academy of Marketing Science, 49(1), 30–50. [Google Scholar] [CrossRef] [Scilit]
- Ibrahim, O. A. S., Younis, E. M. G., Mohamed, E. A., & Ismail, W. N. (2025). Revisiting recommender systems: An investigative survey. Neural Computing and Applications, 37, 2145–2173. [Google Scholar] [CrossRef] [Scilit]
- Jannach, D., & Jugovac, M. (2019). Measuring the business value of recommender systems. ACM Transactions on Management Information Systems, 10(4), 16:1–16:23. [Google Scholar] [CrossRef] [Scilit]
- Komodromos, M. (2026). AI-driven personalization in marketing administration: Qualitative insights from European professionals. Administrative Sciences, 16(2), 87. [Google Scholar] [CrossRef] [Scilit]
- Lemmens, A., Roos, J. M. T., Gabel, S., Ascarza, E., Bruno, H. A., Gordon, B. R., Israeli, A., McDonnell Feit, E., Mela, C. F., & Netzer, O. (2026). Personalization and targeting: How to experiment, learn & optimize. International Journal of Research in Marketing, 43(2), 537–559. [Google Scholar] [CrossRef] [Scilit]
- Lops, P., Jannach, D., Musto, C., Bogers, T., & Koolen, M. (2019). Trends in content-based recommendation: Preface to the special issue on recommender systems based on rich item descriptions. User Modeling and User-Adapted Interaction, 29(2), 239–249. [Google Scholar] [CrossRef] [Scilit]
- Luo, X., Wang, S., & Hew, K. F. (2026). Development and implementation of a generative AI-based personalized recommender system to improve students’ self-regulated learning and academic performance. Computers & Education, 241, 105486. [Google Scholar] [CrossRef] [Scilit]
- Markou, V., Serdaris, P., Antoniadis, I., & Spinthiropoulos, K. (2025). Personalization, trust, and identity in AI-based marketing: An empirical study of consumer acceptance in Greece. Administrative Sciences, 15(11), 440. [Google Scholar] [CrossRef] [Scilit]
- Mrayhi, S., Khribi, M. K., & Jemni, M. (2026). RECMOOC4ALL: An AI-driven recommender system for personalized and accessible MOOC recommendations. Smart Learning Environments, 13, 18. [Google Scholar] [CrossRef] [Scilit]
- Paszke, A., Gross, S., Massa, F., Lerer, A., Bradbury, J., Chanan, G., Killeen, T., Lin, Z., Gimelshein, N., Antiga, L., Desmaison, A., Köpf, A., Yang, E., DeVito, Z., Raison, M., Tejani, A., Chilamkurthy, S., Steiner, B., Fang, L., … Chintala, S. (2019). PyTorch: An imperative style, high-performance deep learning library. In Proceedings of the advances in neural information processing systems 32 (NeurIPS 2019), Red Hook, NY, USA, December 8–14 (pp. 8024–8035). Association for Computing Machinery. Available online: https://proceedings.neurips.cc/paper/2019/hash/bdbca288fee7f92f2bfa9f7012727740-Abstract.html (accessed on 1 August 2026).
- Puntoni, S., Reczek, R. W., Giesler, M., & Botti, S. (2021). Consumers and artificial intelligence: An experiential perspective. Journal of Marketing, 85(1), 131–151. [Google Scholar] [CrossRef] [Scilit]
- Ricci, F., Rokach, L., & Shapira, B. (Eds.). (2022). Recommender systems handbook (3rd ed.). Springer. [Google Scholar] [CrossRef] [Scilit]
- Sahut, J.-M., & Laroche, M. (2025). Using artificial intelligence (AI) to enhance customer experience and to develop strategic marketing: An integrative synthesis. Computers in Human Behavior, 170, 108684. [Google Scholar] [CrossRef] [Scilit]
- Salminen, J., Mustak, M., Sufyan, M., & Jansen, B. J. (2023). How can algorithms help in segmenting users and customers? A systematic review and research agenda for algorithmic customer segmentation. Journal of Marketing Analytics, 11(4), 677–692. [Google Scholar] [CrossRef] [Scilit]
- Sculley, D. (2010). Web-scale k-means clustering. In Proceedings of the 19th international conference on World Wide Web (WWW 2010), Raleigh, NC, USA, April 26–30 (pp. 1177–1178). Association for Computing Machinery. [Google Scholar] [CrossRef] [Scilit]
- Stalidis, G., Karaveli, I., Diamantaras, K., Delianidi, M., Christantonis, K., Tektonidis, D., Katsalis, A., & Salampasis, M. (2023). Recommendation systems for e-shopping: Review of techniques for retail and sustainable marketing. Sustainability, 15(23), 16151. [Google Scholar] [CrossRef] [Scilit]
- Steck, H. (2013). Evaluation of recommendations: Rating-prediction and ranking. In Proceedings of the 7th ACM conference on recommender systems (RecSys 2013), Hong Kong, China, October 12–16 (pp. 213–220). Association for Computing Machinery. [Google Scholar] [CrossRef] [Scilit]
- Tarus, J. K., Niu, Z., & Mustafa, G. (2018). Knowledge-based recommendation: A review of ontology-based recommender systems for e-learning. Artificial Intelligence Review, 50(1), 21–48. [Google Scholar] [CrossRef] [Scilit]
- Teepapal, T. (2025). AI-driven personalization: Unraveling consumer perceptions in social media engagement. Computers in Human Behavior, 165, 108549. [Google Scholar] [CrossRef] [Scilit]
- Urdaneta-Ponte, M. C., Méndez-Zorrilla, A., & Oleagordia-Ruiz, I. (2021). Recommendation systems for education: Systematic review. Electronics, 10(14), 1611. [Google Scholar] [CrossRef] [Scilit]
- Verhoef, P. C., Broekhuizen, T., Bart, Y., Bhattacharya, A., Dong, J. Q., Fabian, N., & Haenlein, M. (2021). Digital transformation: A multidisciplinary reflection and research agenda. Journal of Business Research, 122, 889–901. [Google Scholar] [CrossRef] [Scilit]
- Wedel, M., & Kannan, P. K. (2016). Marketing analytics for data-rich environments. Journal of Marketing, 80(6), 97–121. [Google Scholar] [CrossRef] [Scilit]
- Weinberger, K. Q., Dasgupta, A., Attenberg, J., Langford, J., & Smola, A. J. (2009). Feature hashing for large scale multitask learning. In Proceedings of the 26th annual international conference on machine learning (ICML 2009), Montreal, QC, Canada, June 14–18 (pp. 1113–1120). Association for Computing Machinery. [Google Scholar] [CrossRef] [Scilit]
- Willemsen, M. C., Graus, M. P., & Knijnenburg, B. P. (2016). Understanding the role of latent feature diversification on choice difficulty and satisfaction. User Modeling and User-Adapted Interaction, 26(4), 347–389. [Google Scholar] [CrossRef] [Scilit]

Disclaimer/Publisher’s Note: The statements, opinions and data contained in all publications are solely those of the individual author(s) and contributor(s) and not of MDPI and/or the editor(s). MDPI and/or the editor(s) disclaim responsibility for any injury to people or property resulting from any ideas, methods, instructions or products referred to in the content. |
© 2026 by the authors. Licensee MDPI, Basel, Switzerland. This article is an open access article distributed under the terms and conditions of the Creative Commons Attribution (CC BY) license.