


Abstract
Public–private partnerships (PPPs) are implemented through individual contracts, but their performance is often judged with indicators observed at broader sectoral or national levels. This study develops a measurement alignment framework comprising intervention–measurement alignment, statistical visibility, attribution distance, outcome completeness, and comparison credibility and applies it to Croatian PPPs. The analysis combines the national PPP register with Eurostat data for 2000–2024. It uses a six-sector difference-in-differences benchmark, applies small-cluster inference and a 9999-draw Webb wild-cluster bootstrap, adds hours worked and national-accounts gross fixed capital formation, and evaluates timing, pandemic, contamination, spillover, intensity, and leave-one-out sensitivity. In the six-sector benchmark sample, the current-price GVA coefficient is 0.149 and statistically uncertain, whereas the real GVA coefficient is 0.256 and remains supported by the wild-cluster bootstrap (p = 0.009). In the 16-sector comparison sample, current-price and real GVA estimates remain positive but are estimated with wider uncertainty. Employment, hours worked, real productivity, and real investment show no robust broad effects, while event-study diagnostics reveal poorer pre-treatment comparability in the 16-sector comparison sample. The evidence supports a cautious positive output association, not a general causal growth claim, and demonstrates that PPP accountability requires indicators aligned with project mechanisms, geography, timing, and accounting visibility. The framework explicitly recognizes environmental performance as a required outcome domain, but the available sector-level data do not permit a direct estimate of PPP environmental impacts.
1. Introduction
Governments use public–private partnerships (PPPs) to finance and deliver infrastructure when public budgets, technical capacity or conventional procurement are insufficient. PPPs also remain prominent in efforts to mobilize finance for sustainable and resilient infrastructure (OECD, 2025; United Nations Conference on Trade and Development, 2025). A PPP can place financing, construction, maintenance and operation within one long-term contract. This arrangement may improve life-cycle incentives, but it does not improve performance automatically: the results depend on contract design, risk allocation, competition, fiscal affordability, institutional capacity and contract management (Wang & Ma, 2021; Herrera Dappe et al., 2022; Kumar et al., 2025; Mazher, 2025). The policy relevance of PPPs therefore creates a corresponding evaluation question: how should their performance be measured?
That question is difficult because the intervention and the available data are observed at different levels. A PPP is an individual contract for a specific asset or service, whereas researchers often evaluate it using national or broad sectoral indicators. For example, a school PPP may primarily change building availability, maintenance quality and energy efficiency at a local level. Its expenditure may be recorded in construction or supplier industries, and its benefits may be too small to move the national education gross value added (GVA). Consequently, an estimate based on sectoral GVA can be statistically correct but substantively distant from the mechanism through which the PPP operates. This study calls that problem measurement misalignment. This alignment problem is particularly important for environmental performance: energy savings, emissions, resource efficiency and local ecological effects may be central to a PPP’s public value while remaining invisible in conventional GVA or employment measures.
Croatia provides a useful case for examining this problem. The country has a dedicated PPP statute, a public register of PPP contracts and a small but heterogeneous portfolio covering transport, education, recreation, administrative premises and street lighting. The register identifies project purpose, timing and capital value, while Eurostat supplies harmonized annual sectoral data for 2000–2024. These sources permit a sector–year analysis, but they also expose its limits: only a few broad sectors host PPPs, projects differ markedly in scale and purpose, and a local project may have little statistical visibility in a national NACE section.
The empirical design addresses four connected questions: (1) Are the six-sector benchmark estimates numerically reproducible? (2) Do they remain credible when inference accounts for only six sector clusters? (3) How do the results change when the 16-sector comparison sample is used? (4) Do the conclusions survive broader outcomes and alternative assumptions about timing, pandemic shocks, later utility PPPs, construction spillovers, treatment intensity, and influential PPP-exposed sectors?
The paper answers these questions through a five-stage empirical analysis rather than a single preferred model. Stage 1 replicates the six-sector benchmark calculations. Stage 2 applies inference procedures designed for few sector clusters. Stage 3 tests sensitivity to the comparison-sector choice by using the 16-sector comparison sample. Stage 4 adds hours worked, real productivity, and national-accounts gross fixed capital formation (GFCF). Stage 5 evaluates alternative timing and sample periods, later utility exposure, construction spillovers, treatment intensity, and the influence of individual PPP-exposed sectors. The conceptual contribution is a measurement alignment framework that asks whether an indicator matches the contract’s function, geographical reach, and timing; whether the effect is visible in the selected accounting system; how many causal steps separate the contract from the observed outcome; whether the outcomes cover the relevant dimensions of public value; and whether the comparison sectors provide a credible counterfactual.
The main finding is deliberately cautious. In the six-sector benchmark sample, PPP exposure is associated with higher real GVA, and the real GVA estimate remains statistically supported after the wild-cluster bootstrap. The current-price GVA estimate has wide uncertainty. In the 16-sector comparison sample, both output estimates remain positive but lose statistical precision, and the pre-treatment trend tests reject the null of jointly zero lead coefficients. Employment, hours worked, real productivity per hour, and real GFCF show no robust broad-sector response. The data therefore indicate a possible positive real output pattern but do not establish a general causal claim that PPPs raised sectoral performance.
This interpretation connects the empirical analysis to public performance research. Indicators are useful only for the purpose they are expected to serve, and producing more data does not ensure that the data are relevant for management or accountability (Behn, 2003; Bouckaert & Halligan, 2008; Moynihan, 2008; Van Dooren et al., 2015). Accordingly, the paper does not ask only whether a PPP coefficient is positive. It asks what a national sector-level coefficient can legitimately reveal about project performance. Section 2 reviews the PPP and performance measurement background and develops the alignment framework; Section 3 and Section 4 translate that framework into expectations, data, and identification choices; Section 5 reports the estimates in the same five-stage sequence; and Section 6 and Section 7 discuss their meaning and limits.
2. Literature, Institutional Background, and the Measurement Problem
2.1. PPP Performance Literature: Contract Design and Risk Allocation
The literature does not treat a PPP as a uniform policy intervention. It is a family of long-term arrangements in which a public authority and a private partner allocate responsibilities for financing, construction or reconstruction, maintenance, management and service delivery. The Croatian Public–Private Partnership Act provides the national legal basis, while concessions, procurement and the relevant EU directives shape the wider institutional environment (Croatian Public–Private Partnership Act, 2012, 2014, 2018; Croatian Concessions Act, 2017, 2020; Croatian Public Procurement Act, 2016, 2022, 2026; European Parliament & Council of the European Union, 2014a, 2014b). Because the contractual bundle differs across projects, the label ‘PPP’ alone does not identify one common economic mechanism.
Risk allocation explains why these differences matter for performance. Construction risk affects incentives to deliver the asset on time and within specification; availability risk links payment to the asset’s capacity to provide the contracted service; and demand risk concerns uncertainty about use or revenue. These choices influence financing, maintenance, fiscal exposure and the statistical classification of the asset. Consistent with recent reviews, PPP outcomes should therefore be interpreted as conditional on governance, transparency, risk allocation and long-term contract management, rather than as an automatic consequence of private participation (Knežević & Mikulić, 2025; Mazher, 2025).
2.2. Croatian Institutional Architecture and the PPP Register
Croatia regulates PPPs through a dedicated statute. The national experience has also been reviewed systematically in recent literature (Mašović et al., 2024). Following the 2018 amendments, the Ministry of Economy became responsible for evaluating, approving and monitoring PPP projects and maintaining the contract register. The Ministry of Finance retains a fiscal-consent role concerning budget compatibility, fiscal risks and restrictions. For the present study, this architecture matters in two ways: it establishes the governance process through which projects are approved, and it provides a public register from which project purpose, timing and capital value can be identified (Ministry of Economy/Invest Croatia, n.d.-a, n.d.-b, n.d.-c).
The register makes contracts observable, but it does not directly measure their results. A listed project may affect another industry, a local territory or a service quality indicator that is absent from national sectoral accounts. Legal transparency and statistical visibility are therefore different: the first shows that a contract exists and how it is structured; the second determines whether its effects can be detected in the outcome selected for evaluation.
2.3. ESA 2010 and Statistical Visibility
The European System of Accounts 2010 (ESA 2010) provides the accounting bridge between a PPP contract and macroeconomic statistics (European Parliament & Council of the European Union, 2013; Eurostat, 2023). Depending materially on the allocation of construction and post-construction risks, a PPP asset may be recorded on or outside the government balance sheet (Endrejat, 2024). This classification determines where assets and transactions appear in the accounts, but it does not ensure that the project’s performance can be isolated in national data for a broad industry.
The Croatian portfolio illustrates the problem. A transport PPP may affect transportation and storage, but construction and tourism can also transmit part of the effect. A school or gymnasium PPP belongs functionally to education, although much of the construction expenditure may be recorded elsewhere. A street lighting PPP may reduce municipal energy and maintenance costs without noticeably changing national utility-sector output. The closer an outcome is to the project’s function, location and operating period, the clearer the interpretation of the resulting estimate.
2.4. A Measurement Alignment Framework for PPP Performance Evaluation
Public performance research shows that measures are not interchangeable: their usefulness depends on the purpose of evaluation and on how closely they represent the activity or public value of interest (Behn, 2003; Bouckaert & Halligan, 2008; Moynihan, 2008; Van Dooren et al., 2015). This issue is especially important for PPPs because one contract combines finance, construction, operation and public service obligations, while official statistics distribute the associated flows across industries, institutional sectors, years and geographical areas. Accordingly, the gap addressed here is not a simple absence of PPP research, but the limited integration of economic, fiscal, service, distributional and environmental outcomes within a common framework that also tests whether each indicator is observed at the appropriate functional, spatial and temporal level (Wang & Ma, 2021; Kumar et al., 2025).
Table 1 translates this literature into five diagnostic concepts. First, intervention–measurement alignment asks whether the outcome matches the PPP’s function, location and implementation period. Second, statistical visibility asks whether project-related output, employment, expenditure or assets enter the selected dataset and industry. Third, attribution distance describes how many intervening mechanisms separate the contract from the indicator: a contractual availability measure is close to the project, whereas national sectoral GVA is remote. Fourth, outcome completeness asks whether economic, fiscal, service quality, distributional and environmental dimensions are represented. Fifth, comparison credibility asks whether untreated sectors provide plausible estimates of what would have happened to treated sectors without PPP exposure.
Table 1.
Formal measurement alignment framework for PPP performance evaluation.
These concepts generate three expectations for the empirical design. An estimate is easier to interpret when alignment and statistical visibility are high and attribution distance is low. Aggregated data may provide long and consistent time series, but aggregation can hide local effects and increase exposure to spillovers and sector-specific shocks. Finally, adding comparison sectors increases the number of clusters but does not necessarily improve the counterfactual; the additional sectors must also have credible pre-treatment trajectories. The framework is therefore used as a structured diagnostic, not as a numerical index calculated for Croatia.
3. Transmission Channels and Identification Threats
3.1. Economic Transmission Channels
The sectoral analysis examines three possible transmission channels. Under the output channel, new or improved infrastructure can increase real activity in the sector providing the service. Under the investment channel, project implementation can increase measured capital formation. Under the productivity channel, life-cycle maintenance incentives and operational reorganization can raise output relative to labour input. Employment has no predetermined sign: greater capacity can create jobs, while capital deepening or outsourcing can reduce labour intensity.
The host sector will not necessarily record every channel. Construction demand can occur before the asset begins operating; financing and supplier activity can be recorded in other industries; and benefits such as safety, service availability or energy efficiency may not enter GVA at all. For this reason, the study treats a consistent pattern across output, investment, employment and productivity as more persuasive than one statistically favourable coefficient. An environmental channel is also possible—for example through lower energy use, emissions or resource consumption—but the present sector–year data do not contain harmonized project-level environmental indicators. The framework therefore treats environmental performance as an outcome that must be measured directly, rather than interpreting its absence from the model as evidence of no environmental effect.
3.2. Identification Threats
The study is observational: sectors were not randomly selected to receive PPPs. A sector may attract a PPP precisely because it has unusual investment needs, financing constraints, political priority or growth potential. Sector fixed effects remove permanent differences between sectors, and year fixed effects remove shocks shared by all sectors, but neither controls for a shock affecting one treated sector differently. Relevant examples include tourism dynamics in transport and recreation, Croatia’s 2013 EU accession, the uneven sectoral effects of the 2020–2021 pandemic and later street lighting PPPs in sectors initially used for comparison.
A second problem is statistical. The six-sector design contains only six sector clusters, three treated and three used for comparison, so standard large-sample cluster inference can be misleading. The study therefore uses small-cluster corrections and a wild-cluster bootstrap for the headline GVA estimates. These procedures improve the calculation of uncertainty; they cannot repair non-parallel trends, spillovers, incorrect treatment dates or an unsuitable comparison group. Those identification threats are examined separately.
3.3. Five-Stage Empirical Analysis
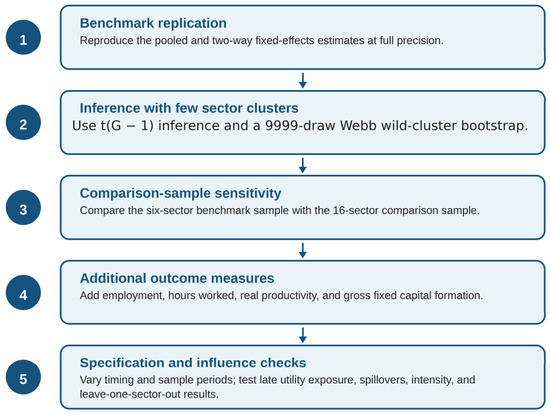
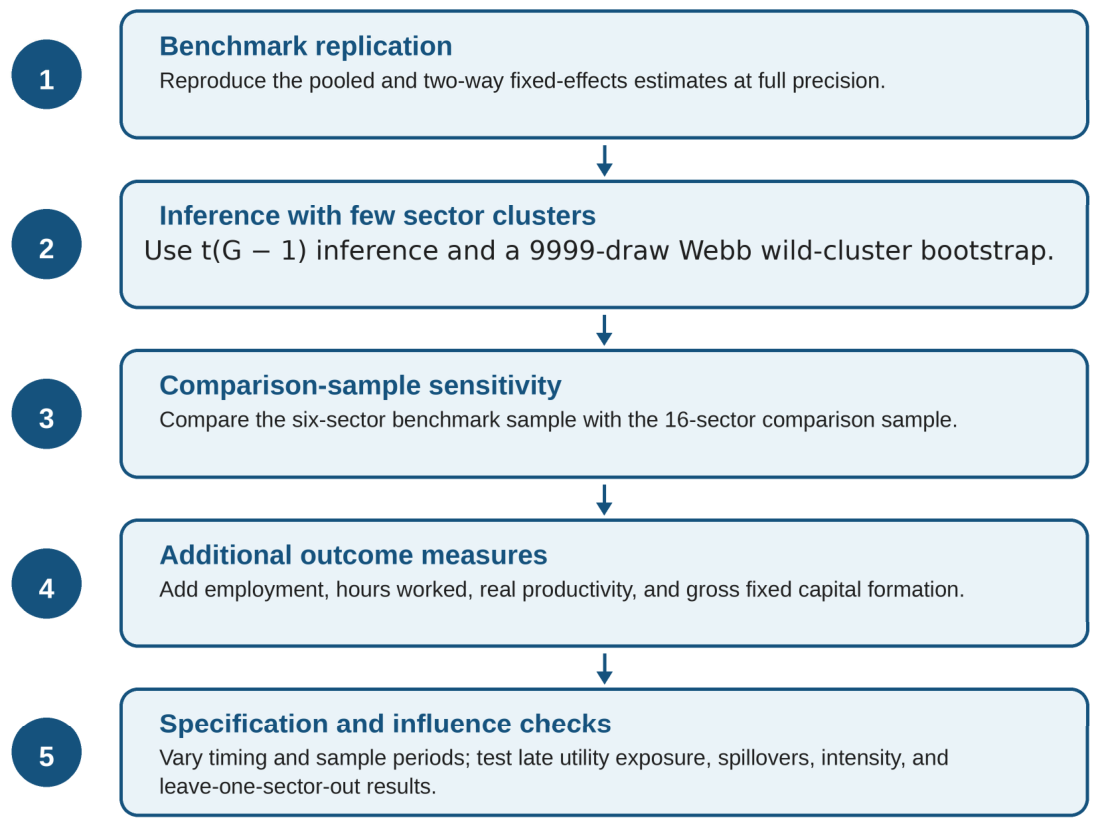
Figure 1 organizes the empirical analysis into five stages. The sequence is diagnostic rather than a ranking of models: later stages do not automatically supersede the six-sector benchmark sample. Instead, they examine whether the estimated patterns remain stable under alternative inferential, outcome, sample, timing, and influence assumptions. Stage 1 replicates the six-sector benchmark calculations. Stage 2 applies inference procedures designed for the small number of sector clusters. Stage 3 tests sensitivity to the comparison-sector choice by using the 16-sector comparison sample. Stage 4 extends the outcome set to employment, hours worked, real productivity, and gross fixed capital formation (GFCF). Stage 5 varies treatment timing and sample periods and examines later utility exposure, construction spillovers, treatment intensity, and the influence of individual PPP-exposed sectors.
Figure 1.
Five-stage empirical analysis used to evaluate the association between PPP exposure and sectoral outcomes. Stage 1 replicates benchmark estimates; Stage 2 applies inference for few sector clusters; Stage 3 tests sensitivity to the comparison sample; Stage 4 extends the set of outcome measures; and Stage 5 evaluates alternative specifications and the influence of individual PPP-exposed sectors. Downward arrows indicate the sequential progression from Stage 1 to Stage 5.
The empirical expectation is conditional rather than universal. If PPP-created capacity is visible in the host sector, real GVA should rise after exposure; if investment is recorded there, GFCF should also rise. Productivity may increase if output grows faster than labour input, whereas employment may increase or decrease. An estimated sector-level association is less credible if it appears only under one treatment date, one price measure, one set of comparison sectors, or one PPP-exposed sector.
4. Data, Treatment Definition, and Estimation
4.1. Data Sources and Reconstruction
The unit of observation is a Croatian NACE Rev. 2 sector in a calendar year. The analysis combines the Croatian PPP register with three Eurostat sources for 2000–2024. The dataset nama_10_a64 supplies GVA and its income components; nama_10_a64_e supplies employment, employee, self-employment and hours worked measures; and nama_10_a64_p5 supplies GFCF by industry and asset (Eurostat, n.d.-a). The SBS/EBS investment variable is used only for numerical verification of the six-sector benchmark because its observations are sparse, particularly for education and recreation (Eurostat, n.d.-b). Table 2 summarizes each source, its analytical role and its coverage. No comparable project-level series on energy consumption, greenhouse-gas emissions, resource efficiency or other environmental outcomes could be linked consistently to the PPP register. Environmental performance is therefore treated as a measurement gap, not as an estimated dependent variable.
Table 2.
Data sources, coverage, and analytical roles.
The full data construction begins with 21 broad NACE sections (A–U) observed over 25 years, producing 525 sector–year rows. Current-price GVA is measured in EUR millions. To obtain a real output measure on the same reference scale as the benchmark, each sector’s chain-linked volume series is re-referenced to 2020 using the ratio of its 2020 current-price GVA to its 2020 chain-linked value. This changes the reference scale, not the sector’s growth path. Real labour productivity is then calculated per person employed and per hour worked. Investment is measured using both current-price GFCF and Eurostat’s real GFCF volume index (2020 = 100).
Two analytical samples serve different purposes. The six-sector benchmark sample contains sectors D, E, F, H, P, and R, observed for 2000–2024 (150 sector–year observations). H, P, and R are PPP-exposed sectors; D, E, and F form the benchmark comparison group. The 16-sector comparison sample contains the same three PPP-exposed sectors plus 13 potential comparison sectors (A, B, C, G, I, J, K, L, M, N, Q, S, and T) for 400 observations. This larger sample is used as a sensitivity analysis, not as a preferred counterfactual, because the absence of a registered PPP does not establish comparable untreated trajectories. D and E are excluded because of later street lighting PPPs, F because construction may receive spillovers, O because it has a registered descriptive exposure, and U because its real GVA series is incomplete. A separate sensitivity specification adds F to the 16-sector comparison sample; its estimates are reported in the supplementary results described in Appendix A.
4.2. Treatment Construction
Treatment is coded at the sector–year level. Transportation and storage (H) is PPP-exposed from 2013, while education (P) and arts, entertainment and recreation (R) are exposed from 2009. These baseline exposure years are used in the two-way fixed effects and event-study models; they represent the dominant or operationally relevant sector-level exposure and are not interpreted as the signature date of every contract. Table 3 reports the main and alternative exposure years, registered PPP capital, and the capital-to-pre-treatment GVA intensity measure for each relevant sector.
Table 3.
Sector-level coding of PPP exposure, treatment timing, registered capital, and intensity.
Because PPP implementation can be dated by contract signature, construction, completion, or operation, the timing sensitivity analysis uses the first full calendar year after the earliest reported sectoral contract: 2008 for H, 2007 for P, and 2008 for R. Treatment intensity is defined as registered PPP capital divided by pre-treatment current-price GVA and is interacted with the post-exposure indicator. D/E and O are included in Table 3 only to document later utility exposure and public administration exposure that affect sample construction; they are not baseline PPP-exposed sectors in the estimation samples.
4.3. Estimation and Inference
The pooled model first compares all PPP-exposed sector–years with all unexposed sector–years. Because this comparison mixes PPP exposure with permanent differences between industries and economy-wide changes over time, the principal benchmark adds sector and year fixed effects:
yit = α + βDit + εit
yit = βDit + μi + λt + εit
Here, i denotes sector, t denotes year and Dit equals one after sector i becomes PPP-exposed. The coefficient β measures the average within-sector change after exposure relative to contemporaneous change in the comparison sectors, after removing time-invariant sector differences and shocks common to all sectors. When the outcome is in logarithms, exp(β) − 1 gives the corresponding proportional difference. This interpretation is associational unless the comparison sectors would have followed parallel trends in the absence of PPP exposure.
Uncertainty is calculated by clustering observations within sectors because repeated annual values for the same sector are not independent. With only G clusters, cluster-based p-values are evaluated against a t distribution with G − 1 degrees of freedom. For the balanced headline GVA models, the study also uses a 9999-draw Webb six-point wild-cluster bootstrap-t, which is designed to provide a more reliable inference check with very few clusters. The bootstrap changes how uncertainty is assessed; it does not solve bias caused by non-parallel trends or unobserved sector-specific shocks (MacKinnon et al., 2023; Hansen, 2025).
Event-study models show how the outcome evolves before and after PPP exposure. Year −1 is the reference period; observations at five or more years before treatment and eight or more years after treatment are grouped in the two tails. The pre-treatment coefficients are used to assess whether treated and comparison sectors were already moving differently before exposure. Pointwise 95% intervals use t(G − 1) critical values, and a joint F test evaluates whether the included pre-treatment coefficients are collectively zero. Because staggered adoption and treatment-effect heterogeneity can complicate conventional TWFE and event-study interpretation, these estimates are used as diagnostics rather than as a substitute for design-specific estimators (Goodman-Bacon, 2021; Roth et al., 2023; Sun & Abraham, 2021). These diagnostics are complemented by robustness tests that change treatment dates, remove 2020–2021, end the sample in 2019, censor D/E after 2016, add construction to the expanded pool, use treatment intensity and remove each treated sector in turn.
The analysis also calculates a descriptive average treatment effect on the treated (ATT) contrast. For each treatment cohort g and post-treatment year t, ATTD(g,t) compares the cohort’s change since year g − 1 with the contemporaneous change in benchmark comparison sectors D, E and F. Averaging every treated sector–year equally gives 0.095; first averaging within each cohort and then weighting cohorts by their number of treated sectors gives 0.090. These values support numerical verification, but they are not presented as formal Callaway–Sant’Anna estimates because only two treatment cohorts exist and the 2013 cohort contains a single sector; reliable model-based inference is therefore not available (Callaway & Sant’Anna, 2021).
5. Results
5.1. Replication of Benchmark Calculations
Table 4 is a replication check, not an impact-results table. It places the rounded values reported in the benchmark calculations beside independently reconstructed full-precision values for the pooled model and for the two-way fixed effects or descriptive statistic. For example, the current-price GVA coefficient rounds to 0.149 and the real GVA coefficient to 0.256; the descriptive sector-time and cohort-size-weighted values round to 0.095 and 0.090. The final column reports the absolute difference between the rounded and full-precision two-way fixed effects/descriptive value. All reported differences are below 0.001, confirming computational agreement. This agreement does not constitute evidence of an economic effect; substantive interpretation begins in Section 5.2.
Table 4.
Replication of benchmark estimates: rounded values and full-precision calculations.
5.2. Two-Way Fixed Effects Estimates by Sample and Outcome
Table 5 reports two-way fixed effects estimates for each outcome in the six-sector benchmark sample and the 16-sector comparison sample. The latter is included as a sensitivity analysis of the comparison-sector choice, not as a preferred causal specification. Within each sample, the table reports the coefficient β, the sector-clustered standard error in parentheses, the cluster-based p-value, and, for the balanced GVA models, the Webb wild-cluster p-value. In the six-sector benchmark, current-price GVA has β = 0.149 (SE = 0.139), cluster p = 0.334, and wild-cluster p = 0.365. The point estimate is positive but too imprecise to distinguish from zero. Real GVA has β = 0.256 (SE = 0.080), cluster p = 0.024, and wild-cluster p = 0.009. Because the outcome is logged, this corresponds to an estimated difference of approximately 29.2% [exp(0.256) − 1] after PPP exposure relative to the benchmark comparison sectors. The estimate remains associational because only three sectors are PPP-exposed and parallel trends cannot be guaranteed.
Table 5.
Two-way fixed effects estimates by outcome and analysis sample.
In the 16-sector comparison sample, the coefficients remain positive (0.264 for current-price GVA and 0.259 for real GVA), but the wild-cluster p-values rise to 0.115 and 0.101. Adding construction to this sample gives similar coefficients (0.270 and 0.263), with full inference reported in the supplementary results described in Appendix A. Thus, changing the set of comparison sectors does not reverse the estimated direction, but it weakens the statistical case and, as Section 5.3 shows, worsens pre-treatment comparability. The larger comparison sample therefore does not provide stronger causal evidence in this application.
The additional outcomes do not support a broad improvement across all dimensions of sectoral performance. In the 16-sector comparison sample, the coefficients for employment, hours worked, real GVA per person, real GVA per hour, and real GFCF are estimated with substantial uncertainty. For example, real GFCF has a positive coefficient of 0.266 but a cluster p-value of 0.144. This does not prove that the true effects are zero; it means that the available sector-level data cannot separate them reliably from zero. The evidence is therefore narrower than a general PPP-success claim: a positive output sign appears repeatedly, especially for real GVA, but it is not accompanied by robust labour, productivity, or host sector investment effects.
5.3. Event-Study Results and Pre-Treatment Trend Tests
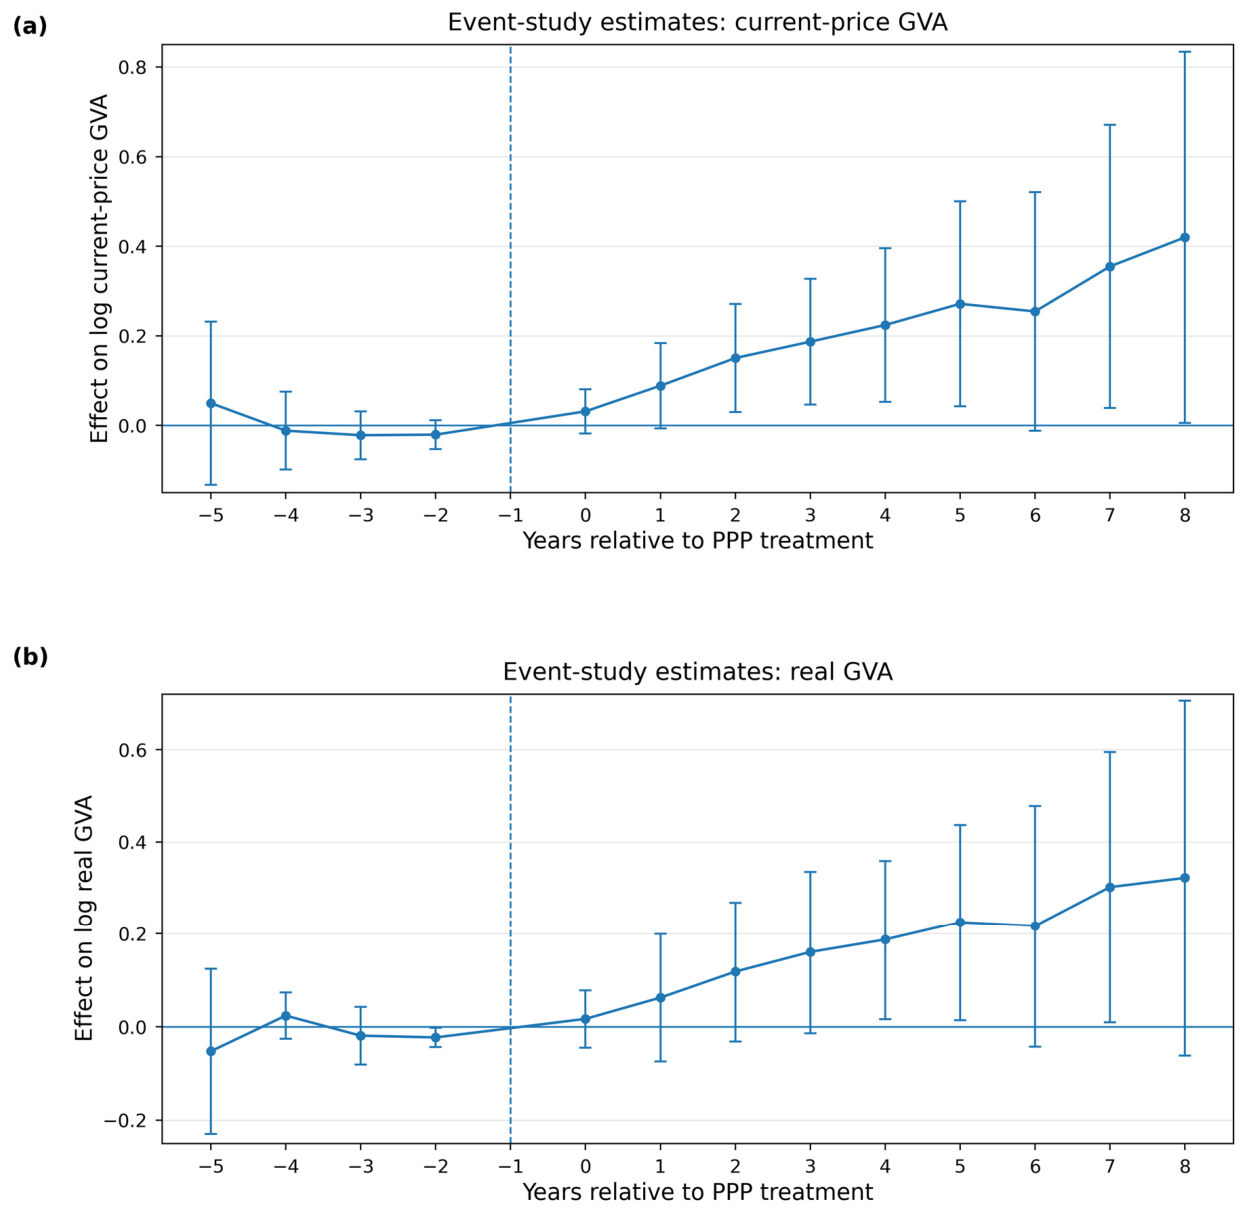
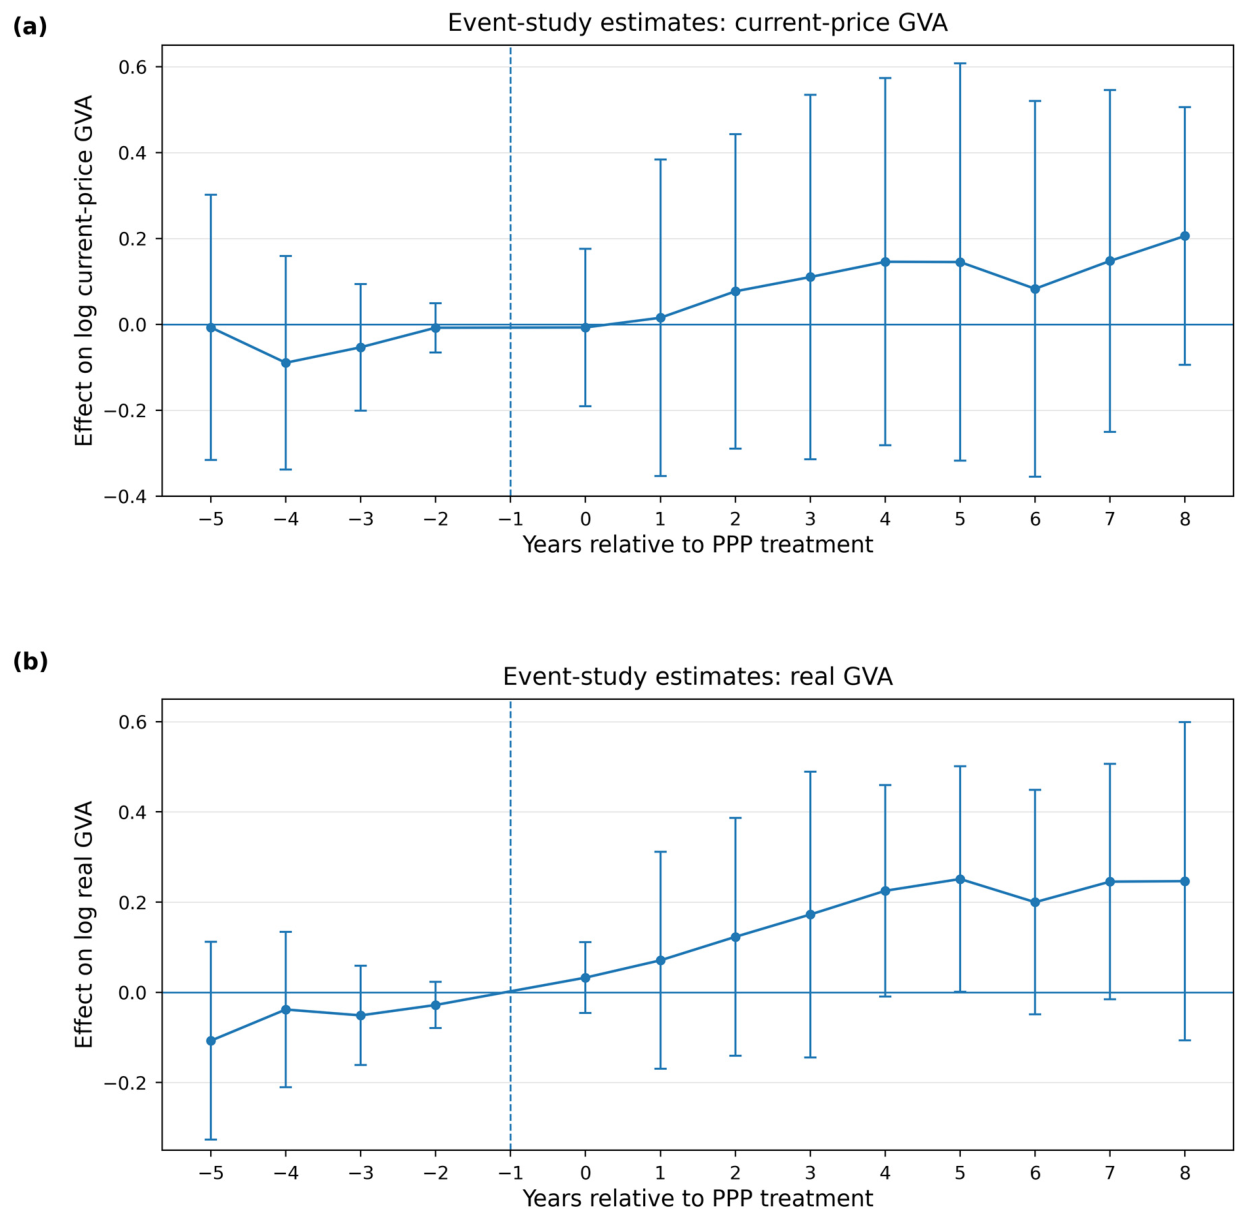
Table 6 reports joint F tests of the null hypothesis that all included pre-treatment event-time coefficients are equal to zero. In the six-sector benchmark sample, the null is not rejected for current-price GVA (p = 0.433) or real GVA (p = 0.196), and the individual lead estimates have wide intervals. This result is reassuring only in a limited sense: non-rejection is consistent with, but does not establish, parallel pre-treatment trends, particularly with three PPP-exposed sectors, low statistical power, and pointwise rather than simultaneous confidence intervals. The corresponding dynamic estimates and pointwise t(G − 1)-based confidence intervals are shown in Figure 2.
Table 6.
Joint tests of pre-treatment trends in the event-study models. The null hypothesis is that all included pre-treatment coefficients are jointly equal to zero.
Figure 2.
Event-study estimates for the six-sector benchmark: (a) current-price GVA and (b) real GVA. The reference year is k = −1; tails are binned at −5 and +8; markers are point estimates and vertical error bars are pointwise 95% confidence intervals based on t(G − 1) critical values. The estimation sample contains 150 sector–year observations in six sector clusters, including three PPP-exposed sectors. The solid horizontal line marks the zero-effect reference, and the dashed vertical line marks the omitted reference period, k = −1.
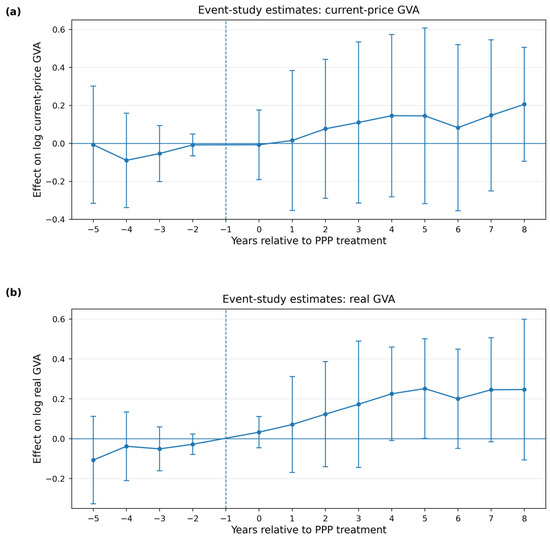
The 16-sector comparison sample produces a different diagnostic result. Table 6 reports p = 0.023 for current-price GVA and p < 0.001 for real GVA, so the null of jointly zero pre-treatment coefficients is rejected for both outcomes. Figure A1 shows the corresponding dynamic estimates and pointwise cluster-robust intervals. Although the larger sample increases the number of sector clusters, the pre-treatment trajectories are less suitable as counterfactuals for transportation, education, and recreation. The 16-sector comparison sample is therefore interpreted only as a sensitivity analysis and not as a stronger causal specification.
5.4. Sensitivity to Timing, Sample Periods, Late Utility Exposure, and Treatment Intensity
Table 7 groups sensitivity analyses that change the exposure date, remove pandemic years, restrict the sample to the pre-COVID period, or censor D/E after later street lighting exposure. These specifications test whether the positive GVA sign depends on one timing convention, one exceptional period, or continued use of sectors that later receive PPP-related exposure. Using the earliest-contract dates leaves both GVA estimates positive but statistically uncertain. Excluding 2020–2021 or ending the sample in 2019 produces similar signs. When D/E observations after 2016 are censored, the current-price coefficient is 0.116, and the real GVA coefficient is 0.204; the latter remains positive but has cluster p = 0.083 with six clusters. The checks preserve the direction of the result but do not remove its uncertainty.
Table 7.
Sensitivity of GVA estimates to alternative timing, sample periods, late utility exposure, and treatment intensity.
Table 7 also reports treatment intensity models in which registered PPP capital is divided by pre-treatment GVA and interacted with the post-exposure indicator. In the six-sector benchmark sample, the real GVA intensity coefficient is 1.983 and remains supported by the wild-cluster bootstrap (p = 0.028), while the current-price estimate does not. In the 16-sector comparison sample, the cluster p-values are close to 0.05, but the wild-cluster p-values are 0.190 and 0.164. The inference therefore depends on the comparison sample and the method used to quantify uncertainty; the favourable benchmark estimate should be viewed as supporting evidence rather than as a definitive dose–response relationship.
5.5. Influence of Individual PPP-Exposed Sectors
Table 8 assesses whether the GVA estimates in the 16-sector comparison sample are driven by one PPP-exposed sector. Transportation and storage (H), education (P), and arts, entertainment and recreation (R) are omitted one at a time, and the current-price and real GVA models are re-estimated. All six coefficients remain positive, although the estimates have wide uncertainty. The smallest coefficients occur after recreation is omitted, indicating that R contributes importantly to the average pattern but is not its sole source. The result is therefore not driven by one obvious outlier sector, while the small number of PPP-exposed sectors still prevents a strong causal conclusion.
Table 8.
Influence of individual PPP-exposed sectors on GVA estimates in the 16-sector comparison sample. Each specification omits the sector identified in the first column.
5.6. Summary of Empirical Evidence
6. Discussion
6.1. What the Evidence Says About PPPs
The analysis does not support a binary verdict that Croatian PPPs either succeeded or failed. The evidence is more specific. PPP-hosting sectors display a recurring positive association with output, particularly real output, but the strength of that association depends on the comparison design, and it is not accompanied by a consistent bundle of labour, productivity and investment effects. That pattern is compatible with several mechanisms: output may rise without large employment changes; investment may be recorded outside the host sector; project benefits may take the form of service quality rather than sectoral GVA; or the estimated output effect may partly reflect sector-specific trends that the available design cannot fully remove.
The distinction between current-price and real GVA remains important. The six-sector benchmark sample produces a more favourable result for real output than for nominal output. This is not a contradiction. Year fixed effects remove aggregate price movements but not sector-specific price dynamics. A result that changes with the price concept signals that the outcome definition is economically consequential and should be reported explicitly rather than hidden in a generic ‘value added’ label.
The investment result is equally informative. Replacing the sparse SBS investment series with national-accounts GFCF substantially improves coverage, yet the real GFCF coefficient remains imprecise. This weakens a simple mechanism in which PPP exposure should automatically appear as a large and persistent increase in host sector capital formation. It also illustrates the accounting problem: the physical asset may be built through construction or another supplier industry, while the host service sector receives the asset or service capacity without recording all of the investment flow directly.
6.2. A Methodological Lesson: More Controls Are Not Automatically Better Controls
One of the most important findings is the contrast between cluster count and pre-treatment comparability. The 16-sector comparison sample increases the number of sectors from six to sixteen and therefore reduces reliance on extremely small-cluster asymptotics. Yet the event-study diagnostics deteriorate sharply. This is a general lesson for small-country sectoral policy evaluation: enlarging the comparison set can improve the number of clusters while worsening the substantive comparability of treated and comparison-sector trajectories.
The implication is not that the six-sector benchmark sample should be declared causal. Its weaknesses remain substantial: only three sectors are PPP-exposed, treatment timing is coarse, sector-specific shocks are possible, and the confidence intervals are wide. The implication is instead that the evidence should be assessed through a staged diagnostic sequence. A transparent benchmark with better pre-treatment behaviour can coexist with a 16-sector comparison sample used to test sensitivity to the comparison-sector choice. Neither should be elevated to a definitive causal design simply because it performs better on one dimension.
6.3. Measurement Alignment and Public-Sector Performance Accountability
The substantive policy implication is a measurement alignment principle: PPPs should be evaluated with indicators whose functional mechanism, geographical reach, time horizon and accounting location correspond to the contract being assessed. National sectoral statistics are useful for identifying broad macro-sectoral patterns, but their high attribution distance makes them unsuitable as the sole evidence of project success. A school PPP may improve availability, maintenance quality, safety or energy efficiency without moving national education GVA. A street lighting project may reduce energy use and maintenance costs without producing a measurable utility-sector output effect. A large transport concession may be more statistically visible in sectoral data, but even there, tourism, construction and macroeconomic shocks complicate attribution. In practical application, the framework functions as a pre-estimation diagnostic: for each PPP and proposed outcome, evaluators should verify functional, spatial and temporal fit, accounting visibility, attribution distance, coverage of public value domains and counterfactual credibility before interpreting an estimated coefficient.
The Croatian register provides a strong institutional foundation for better evaluation because it makes contracts publicly observable. The next step is to connect that legal transparency to annual performance monitoring. Each PPP should ideally be accompanied by standardized information on capital expenditure, annual availability or demand-related payments, construction milestones, service quality KPIs, renegotiations, fiscal exposure, environmental performance and user outcomes. Such a system would allow researchers and public authorities to distinguish contract form from public value.
This conclusion is consistent with the broader PPP literature, which emphasizes that results depend on governance, risk allocation, fiscal discipline and contract management capacity rather than on the PPP label itself (Wang & Ma, 2021; Herrera Dappe et al., 2022; Kumar et al., 2025; Mazher, 2025). The present analysis adds a complementary point: even when governance institutions create a transparent register, aggregate statistics may remain misaligned with the outcomes that matter for accountability.
The framework also clarifies why performance information cannot be judged by availability alone. A register may improve transparency, and a harmonized national-account series may improve comparability, while the combination still fails to measure the public value purpose for which the information is used. Consistent with purpose-specific approaches to public performance measurement, project control, fiscal accountability, service improvement and policy learning require different indicators (Behn, 2003; Moynihan, 2008). Measurement alignment therefore links the technical selection of outcomes to the administrative purpose of evaluation.
6.4. Limitations and Threats to Validity
- Only three broad sectors receive the main treatment, which limits both statistical power and the credibility of asymptotic inference. The wild-cluster bootstrap improves one dimension of inference but does not create additional independent treated units.
- Treatment timing is necessarily coarse. The main dates are dominant or operationally relevant sector exposure years, while the alternative design uses the first full year after the earliest contract. A project-level panel distinguishing contract signature, financial close, construction start, completion and service commencement would be preferable.
- Sector assignment is an approximation. The operating sector of a public service is not necessarily the sector in which construction spending, financing or supplier effects are recorded. Construction is therefore treated as a possible spillover sector rather than an unquestioned control.
- Sector-specific shocks remain possible. EU accession, tourism dynamics, the pandemic and the European energy-price episode may affect treated sectors differently from comparison sectors. Year fixed effects remove only shocks common to all sectors.
- The 16-sector comparison sample fails joint pre-treatment trend tests for both current-price and real GVA. It is therefore useful as a sensitivity analysis but not as a superior causal counterfactual.
- The analysis observes economic aggregates, not direct public value. Fiscal risk, service quality, accessibility, user satisfaction, environmental outcomes and distributional effects are outside the available sector-level data. Accordingly, the study does not claim to estimate the environmental impact of Croatian PPPs. It demonstrates why such impacts require project-level or spatially matched environmental indicators and identifies their absence as a substantive limitation of current accountability data.
7. Conclusions
This study evaluates the association between PPP exposure and sectoral economic performance in Croatia through a transparent five-stage empirical analysis. It replicates the six-sector benchmark calculations, applies small-cluster inference, tests a 16-sector comparison sample, examines additional labour and investment outcomes, and evaluates alternative treatment timing, sample-period restrictions, later utility exposure, construction spillovers, treatment intensity, and the influence of individual PPP-exposed sectors.
The evidence is neither uniformly negative nor strong enough to support a general causal claim. In the six-sector benchmark sample, real GVA shows a positive coefficient that survives the Webb wild-cluster bootstrap, while current-price GVA does not. The positive output sign persists in broader and alternative specifications, but precision weakens and the 16-sector comparison sample fails pre-treatment diagnostics. Employment, hours worked, real productivity per hour, and national-accounts GFCF do not show robust broad effects. The most defensible conclusion is therefore that PPP exposure is associated with a possible positive output pattern, especially in real terms, but the available sector-level design cannot establish that PPPs automatically improve sectoral economic performance.
The deeper contribution is methodological and institutional. The proposed measurement alignment framework explains why sector-level data can be valuable for screening while remaining incomplete for project evaluation. Interpretability is strongest when outcomes match the contract’s mechanism, geographical reach and implementation period, are statistically visible in the selected accounting domain and have low attribution distance. PPPs should therefore be assessed through a layered evidence system that connects the public contract register to project-level fiscal data, operational milestones, service quality indicators and environmental outcomes, with regional and sectoral statistics used as complementary rather than definitive evidence. The Croatian case illustrates a broader principle of public-sector performance management: transparent contracts and abundant data are necessary, but accountability depends on whether the selected measures correspond to the public value actually being created. The framework is intended as a transferable diagnostic architecture rather than a substitute for project-specific causal analysis. Its value lies in revealing which economic and environmental claims can be supported by the available evidence and which require additional project-level measurement.
Author Contributions
Conceptualization, P.K., M.R. and P.D.; Methodology, P.K. and P.D.; Software, P.D.; Validation, P.K. and M.R.; Formal analysis, M.R. and P.D.; Investigation, P.K. and M.R.; Resources, M.R.; Data curation, M.R. and P.D.; Writing—original draft, P.K. and P.D.; Writing—review and editing, P.K., M.R. and P.D.; Visualization, M.R. All authors have read and agreed to the published version of the manuscript.
Funding
This research received no external funding.
Institutional Review Board Statement
Not applicable.
Informed Consent Statement
Not applicable.
Data Availability Statement
The raw data are publicly available from the Eurostat national accounts and employment databases and from the Croatian PPP register sources cited in the manuscript. The submission package contains the reconstructed analysis-ready panel, benchmark-replication tables, model outputs, event-study estimates, descriptive cohort-time contrasts, and reproducible analysis code.
Acknowledgments
During manuscript preparation, generative AI tools were used for language editing, document formatting, and code-assisted verification. The authors reviewed and validated all analytical procedures, numerical results, interpretations, and final text and take full responsibility for the content.
Conflicts of Interest
The authors declare no conflict of interest.
Appendix A. Reproducibility and Supplementary Analysis Package
The supplementary analysis package contains: (i) the 525-row analysis-ready sector–year panel; (ii) a benchmark-replication table; (iii) main TWFE results for the six-sector benchmark sample, the 16-sector comparison sample, and the 16-sector sample with construction added; (iv) timing, pandemic, later exposure, spillover, and treatment intensity checks; (v) leave-one-treated-sector-out estimates; (vi) event-study coefficients with t(G − 1)-based pointwise intervals and joint pre-treatment trend tests; (vii) descriptive cohort-time ATT(g,t) calculations and cohort-size-weighted aggregation; and (viii) fully reproducible Python analysis code. The supplied analysis code was validated under Python 3.13.5 with NumPy 2.3.5 and mpmath 1.3.0. Eurostat observation flags are retained in the analysis-ready database. The manuscript reports the five-stage empirical analysis and the most decision-relevant results; the full result files are intended for supplementary submission and replication review. Figure A1 reports the event-study estimates for current-price and real GVA in the 16-sector comparison sample.
Figure A1.
Event-study estimates for the 16-sector comparison sample: (a) current-price GVA and (b) real GVA. The reference year is k = −1; tails are binned at −5 and +8; markers are point estimates and vertical error bars are pointwise 95% confidence intervals based on t(G − 1) critical values. The estimation sample contains 400 sector–year observations in 16 sector clusters, including three PPP-exposed sectors. Joint pre-treatment tests are F = 3.918, p = 0.023 for current-price GVA and F = 21.149, p < 0.001 for real GVA. The solid horizontal line marks the zero-effect reference, and the dashed vertical line marks the omitted reference period, k = −1.
References
- Behn, R. D. (2003). Why measure performance? Different purposes require different measures. Public Administration Review, 63(5), 586–606. [Google Scholar] [CrossRef] [Scilit]
- Bouckaert, G., & Halligan, J. (2008). Managing performance: International comparisons. Routledge. [Google Scholar]
- Callaway, B., & Sant’Anna, P. H. C. (2021). Difference-in-differences with multiple time periods. Journal of Econometrics, 225(2), 200–230. [Google Scholar] [CrossRef] [Scilit]
- Croatian Concessions Act. (2017). Zakon o koncesijama. Narodne novine, Nos. 69/17. Available online: https://narodne-novine.nn.hr/clanci/sluzbeni/2017_07_69_1603.html (accessed on 15 June 2026).
- Croatian Concessions Act. (2020). Zakon o koncesijama. Narodne novine, Nos. 107/20. Available online: https://narodne-novine.nn.hr/clanci/sluzbeni/2020_10_107_2006.html (accessed on 15 June 2026).
- Croatian Public Procurement Act. (2016). Zakon o javnoj nabavi. Narodne novine, Nos. 120/16. Available online: https://narodne-novine.nn.hr/clanci/sluzbeni/full/2016_12_120_2607.html (accessed on 15 June 2026).
- Croatian Public Procurement Act. (2022). Zakon o javnoj nabavi. Narodne novine, Nos. 114/22. Available online: https://narodne-novine.nn.hr/clanci/sluzbeni/2022_10_114_1740.html (accessed on 15 June 2026).
- Croatian Public Procurement Act. (2026). Zakon o javnoj nabavi. Narodne novine, Nos. 48/26. Available online: https://narodne-novine.nn.hr/clanci/sluzbeni/2026_05_48_584.html (accessed on 15 June 2026).
- Croatian Public–Private Partnership Act. (2012). Zakon o javno-privatnom partnerstvu. Narodne novine, Nos. 78/12. Available online: https://narodne-novine.nn.hr/clanci/sluzbeni/2012_07_78_1833.html (accessed on 15 June 2026).
- Croatian Public–Private Partnership Act. (2014). Zakon o javno-privatnom partnerstvu. Narodne novine, Nos. 152/14. Available online: https://narodne-novine.nn.hr/clanci/sluzbeni/2014_12_152_2862.html (accessed on 15 June 2026).
- Croatian Public–Private Partnership Act. (2018). Zakon o javno-privatnom partnerstvu. Narodne novine, Nos. 114/18. Available online: https://narodne-novine.nn.hr/clanci/sluzbeni/2018_12_114_2214.html (accessed on 15 June 2026).
- Endrejat, V. (2024). Off-balance-sheet policies to the rescue: The role of statistical expertise for European public-private partnerships. Competition & Change, 28(3–4), 515–535. [Google Scholar] [CrossRef] [Scilit]
- European Parliament & Council of the European Union. (2013). Regulation (EU) No 549/2013 of the European Parliament and of the Council of 21 May 2013 on the European system of national and regional accounts in the European Union. Official Journal of the European Union, L 174, 1–727. Available online: https://eur-lex.europa.eu/eli/reg/2013/549/oj/eng (accessed on 15 June 2026).
- European Parliament & Council of the European Union. (2014a). Directive 2014/23/EU of the European Parliament and of the Council of 26 February 2014 on the award of concession contracts. Official Journal of the European Union, L 94, 1–64. [Google Scholar]
- European Parliament & Council of the European Union. (2014b). Directive 2014/24/EU of the European Parliament and of the Council of 26 February 2014 on public procurement and repealing Directive 2004/18/EC. Official Journal of the European Union, L 94, 65–242. [Google Scholar]
- Eurostat. (n.d.-a). National accounts by detailed industry and employment (nama_10_a64; nama_10_a64_e; nama_10_a64_p5). European Commission. Available online: https://ec.europa.eu/eurostat/databrowser/ (accessed on 1 July 2026).
- Eurostat. (n.d.-b). Structural business statistics/European business statistics. European Commission. Available online: https://ec.europa.eu/eurostat/web/structural-business-statistics (accessed on 1 July 2026).
- Eurostat. (2023). Manual on government deficit and debt: Implementation of ESA 2010. Publications Office of the European Union. [Google Scholar]
- Goodman-Bacon, A. (2021). Difference-in-differences with variation in treatment timing. Journal of Econometrics, 225(2), 254–277. [Google Scholar] [CrossRef] [Scilit]
- Hansen, B. E. (2025). Standard errors for difference-in-difference regression. Journal of Applied Econometrics, 40(3), 291–309. [Google Scholar] [CrossRef] [Scilit]
- Herrera Dappe, M., Melecky, M., & Turkgulu, B. (2022). Fiscal risks from early termination of public-private partnerships in infrastructure. Policy Research Working Paper 9972. World Bank. [Google Scholar]
- Knežević, L., & Mikulić, N. (2025). Javno privatno partnerstvo. Pravnik: Časopis za pravna i društvena pitanja, 59(111), 229–250. Available online: https://hrcak.srce.hr/346445 (accessed on 15 June 2026).
- Kumar, C. R., Kannan, B., Hemmachimane Keshavammaiah, P., & Parayitam, S. (2025). Public private partnership for sustainable infrastructure development: A systematic literature review. Quality & Quantity, 59(3), 2733–2751. [Google Scholar] [CrossRef] [Scilit]
- MacKinnon, J. G., Nielsen, M. Ø., & Webb, M. D. (2023). Cluster-robust inference: A guide to empirical practice. Journal of Econometrics, 232(2), 272–299. [Google Scholar] [CrossRef] [Scilit]
- Mašović, J., Draganić, L., & Bubaš, Z. (2024). Public-private partnerships in Croatia: A systematic literature review. International Journal of Contemporary Business and Entrepreneurship, 5(1), 19–35. [Google Scholar] [CrossRef] [Scilit]
- Mazher, K. M. (2025). Review of studies on risk allocation and sharing in public-private partnership projects for infrastructure delivery. Frontiers in Built Environment, 11, 1505891. [Google Scholar] [CrossRef] [Scilit]
- Ministry of Economy/Invest Croatia. (n.d.-a). Institutional and legal framework of public-private partnership in Croatia. Government of the Republic of Croatia. Available online: https://investcroatia.gov.hr/en/ppp/institutional-framework/ (accessed on 1 July 2026).
- Ministry of Economy/Invest Croatia. (n.d.-b). Registry of public-private partnership contracts. Government of the Republic of Croatia. Available online: https://investcroatia.gov.hr/en/ppp/registry/ (accessed on 1 July 2026).
- Ministry of Economy/Invest Croatia. (n.d.-c). The PPP cycle. Government of the Republic of Croatia. Available online: https://investcroatia.gov.hr/en/ppp/the-ppp-cycle/ (accessed on 1 July 2026).
- Moynihan, D. P. (2008). The dynamics of performance management: Constructing information and reform. Georgetown University Press. [Google Scholar]
- OECD. (2025). Global outlook on financing for sustainable development 2025: Towards a more resilient and inclusive architecture. OECD Publishing. [Google Scholar] [CrossRef] [Scilit]
- Roth, J., Sant’Anna, P. H. C., Bilinski, A., & Poe, J. (2023). What’s trending in difference-in-differences? A synthesis of the recent econometrics literature. Journal of Econometrics, 235(2), 2218–2244. [Google Scholar] [CrossRef] [Scilit]
- Sun, L., & Abraham, S. (2021). Estimating dynamic treatment effects in event studies with heterogeneous treatment effects. Journal of Econometrics, 225(2), 175–199. [Google Scholar] [CrossRef] [Scilit]
- United Nations Conference on Trade and Development. (2025). International investment in sustainable infrastructure: The role of public-private partnerships. UNCTAD/DIAE/2025/6. United Nations. [Google Scholar]
- Van Dooren, W., Bouckaert, G., & Halligan, J. (2015). Performance management in the public sector (2nd ed.). Routledge. [Google Scholar]
- Wang, N., & Ma, M. (2021). Public-private partnership as a tool for sustainable development—What literatures say? Sustainable Development, 29(1), 243–258. [Google Scholar] [CrossRef] [Scilit]

Disclaimer/Publisher’s Note: The statements, opinions and data contained in all publications are solely those of the individual author(s) and contributor(s) and not of MDPI and/or the editor(s). MDPI and/or the editor(s) disclaim responsibility for any injury to people or property resulting from any ideas, methods, instructions or products referred to in the content. |
© 2026 by the authors. Licensee MDPI, Basel, Switzerland. This article is an open access article distributed under the terms and conditions of the Creative Commons Attribution (CC BY) license.